 Chuanjie Wei
 Xiaohui Tang
 Kai Ge1,2
 Yuanlong Li
 Zengrui Rong
 Fei Yu
94% of researchers rate our articles as excellent or good
Learn more about the work of our research integrity team to safeguard the quality of each article we publish.
Find out more
ORIGINAL RESEARCH article
Front. Mar. Sci., 31 March 2025
Sec. Global Change and the Future Ocean
Volume 12 - 2025 | https://doi.org/10.3389/fmars.2025.1556069
This article is part of the Research TopicObservations and Reconstruction of the Indo-Pacific Dynamic Environment: Modern and Ancient ComparisonView all 3 articles
The Yellow Sea Cold Water Mass (YSCWM) is one of the most prominent hydrological features of the Yellow Sea. As a low-temperature, nutrient-rich subsurface water mass, the YSCWM fundamentally regulates biogeochemical cycles, functions of marine ecosystems, and fishery resources of the YS. In boreal summer, the YSCWM shows a robust triple-core structure, in which the western component, dubbed the “western YSCWM”, is revisited in this study. Through analyzing in-situ observational data collected by research cruises of the Institute of Oceanology, Chinese Academy of Sciences (IOCAS) and Lagrangian tracing experiments based on a high-resolution ocean model, we provide a thorough investigation for seasonal evolution and origins of the western YSCWM. In-situ observations during 2006-2007 and 2014-2015 suggest that the western YSCWM bears a tight connection to the colder coastal waters near the Shandong Peninsula and achieves the coldest temperature in summer. Analysis of model simulations confirms that the cooling of the western YSCWM in spring and summer is caused mainly by southward cold-water transport of the Shandong Coastal Current (SDCC) from the Shandong coasts and the northern Yellow Sea. We also reveal a contribution of the Subei Shoal water via the Subei Coastal Current (SCC) in summer, which plays a critical role in the quick vanishing of the western YSCMW in early autumn. These findings contribute to our understanding of the formation, seasonal evolution, and heat budgets of the YSCWM.
The Yellow Sea (YS) is a semi-closed marginal sea within the continental shelf, bounded by the Chinese coasts and the Korean Peninsula. Generally shallower than 100 m, the bottom topography of the YS is featured by a trough of 50-100 m in the middle, surrounded by shallow areas near the western, northern, and eastern boundaries (Figure 1a). A unique feature of the YS hydrology is the Yellow Sea Cold Water Mass (YSCWM), a bulk of subsurface cold-water dome (e.g., >30 m) occupying most deep-basin areas of the central YS (Uda, 1934; He et al., 1959; Guan, 1963; Hu et al., 1991). In boreal summer (“boreal” omitted hereafter), the YSCWM is particularly prominent with core temperatures ranging from 6°C to 10°C, at least 10°C colder than the surface mixed layer (Yu et al., 2006), making it one of the most notable seasonal cold water masses on mid-latitude continental shelves worldwide. The YSCWM significantly influence the biogeochemical and ecological dynamics of the Yellow Sea, supplying nutrients that feed phytoplankton growth and a diverse range of marine organisms (Xin et al., 2015; Guo et al., 2020). Critically, the cold and nutrient-rich features of the YSCWM are favorable for economically valuable benthic organisms, playing a key role in supporting the fishery resources of the YS (Zhang et al., 2016; Li J. et al., 2021; Xu et al., 2022). Meanwhile, the existence of YSCWM also gives rise to strong thermal stratification, which, combined with eutrophication-driven phytoplankton blooms, favors the occurrence of seasonal hypoxia and acidification events in the YSCWM (Guo et al., 2020; Wu et al., 2021), threatening the ecosystems of the YS. Owing to these profound impacts, the evolution and origins of the YSCWM have long been a significant scientific issue for oceanographers.
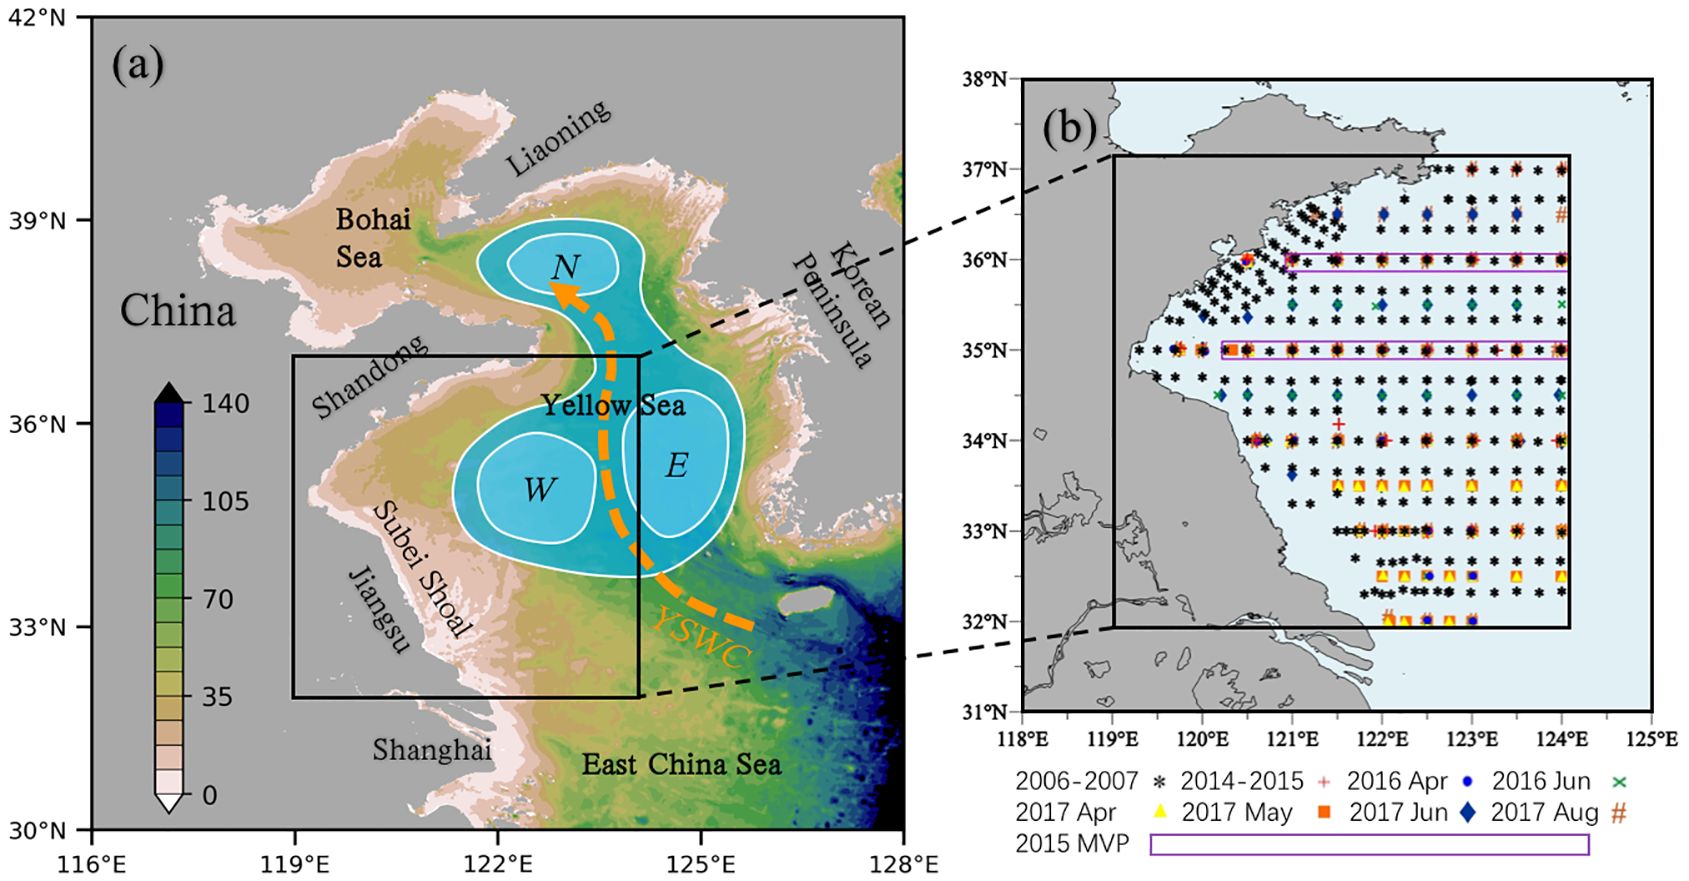
Figure 1. (a) Bathymetry (m) and a schematic description of the Yellow Sea Cold Water Mass (YSCWM; blue shading) and its northern (‘N’), eastern (‘E’), and western (‘W’) components. The dashed arrow denotes the Yellow Sea Warm Current (YSWC). (b) Locations of observational data analyzed in this study, based on 1484 CTD casts conducted in 2006-2007, 2014-2015, April 2016, June 2016, April 2017, May 2017, June 2017, and August 2017 and MVP measurements at 35°N and 36°N conducted in 2015. There were repeated CTD measurements of four seasons during both 2006-2007 and 2014-2015. In both panels, the black rectangle remarks the observation domain approximately within 119°-124°E, 32°-37°N.
The evolution of the YSCWM is phase-locked to the seasonality. Early studies described the YSCWM in summer as the local remnant of the deep mixed layer in the previous winter (e.g., He et al., 1959). With the increasing solar radiation and the weakening winter monsoon, the seasonal thermocline begins to form in spring, while the cold YSCWM beneath the thermocline persists to summer (He et al., 1959; Yu et al., 2006; Zhang et al., 2008). However, this well-established, one-dimensional mechanistic understanding cannot explain the observed strengthening of the southern YSCWM (a cooling tendency) from spring to summer regardless of the surface heating (Zhang et al., 2008; Moon et al., 2009). In summer, there are three separated cold maxima (or cold cores) formed within the YSCWM, located in the northern, southeastern, and southwestern sectors of the YS (Figure 1a). The southeastern and southwestern cores are separated by the warm water brought by the Yellow Sea Warm Current (YSWC) - a northward current peaking in winter and carrying the warm water from the Kuroshio (Teague and Jacobs, 2000; Yu et al., 2006; Zhang et al., 2008; Yu et al., 2022). Notably, large Salmonidae farming has been carried out successfully in the southwestern core of the YSCWM in recent years (Dong, 2019), underscoring its importance in sustainable aquaculture and the preservation of marine ecosystems. Although subject to strong variations on interannual and longer timescales (Hu and Wang, 2004; Wei et al., 2010; Park et al., 2011; Hao et al., 2012; Liu et al., 2021; Wang et al., 2023; Zhai et al., 2025), the triple-core structure described above is likely a robust feature of the summer YSCWM (Liu C. et al., 2024).
Model simulations indicate vital communications between the southern and northern portions of YSCWM through both wind- and tide-driven currents (Wang et al., 2014). Tidal mixing also plays an important role in the formation of the sharp thermocline and the steep front in the YS that shape the cold-water dome (Zhao, 1985; Lee and Beardsley, 1999; Xia et al., 2006; Moon et al., 2009). The unique temperature structure is accompanied by a cyclonic geostrophic circulation surrounding the YSCWM and upwelling near the front (Beardsley et al., 1992; Su and Huang, 1995; Xia et al., 2006; Moon et al., 2009; Hu et al., 2024). In autumn, the YSCWM decays under surface cooling and enhanced mixing (Zhang et al., 2008; Li et al., 2016). From autumn to winter, the thermocline weakens, deepens, and eventually vanishes, leading to a vertically uniform thermal structure (Zhang et al., 2008; Diao et al., 2022; Liu X. et al., 2024). In winter, the intrusion of YSWC gives rise to a tongue of saline, warm water in the central YS basin (Lie and Cho, 2016; Yu et al., 2010, 2022). Therefore, the seasonal evolution and structure of the YSCWM are regulated by multiple processes.
Despite extensive research efforts, the origins of the YSCWM remain largely uncertain, particularly for its southwestern core. In this study, we describe this component of the YSCWM as the “western YSCWM”, relative to the northern and eastern components. Zhang et al. (2008) proposed that the western YSCWM was formed locally southeast of Shandong during the previous winter. Mooring observations indicate that the strong near-surface stratification and bottom temperatures of <10°C can both persist until August (Li et al., 2016). While other studies put forward that the western YSCWM is linked to the southward cold-water transport of the Shandong Coastal Current (SDCC) – a shallow current flowing from the northern YS along the coasts of Shandong Peninsula, and the subsurface cold water near Qingdao coast in spring (Zhang et al., 2002; Wei et al., 2013; Jin et al., 2017). To clarify the origin of the western YSCWM, contributions of various possible sources, such as the northern YS, the residual water of the YSWC (Yu et al., 2022), and others, are to be examined.
This study intends to explore the seasonal evolution and origins of the western YSCWM. This is pursued through analyzing in-situ observational data collected by research cruises of the Institute of Oceanology, Chinese Academy of Sciences (IOCAS) during 2006-2007 and 2014-2017 and Lagrangian particle tracing experiments based on a high-resolution regional ocean model. In the following sections of the paper, we first describe the observational data from the IOCAS research cruises and the ocean model simulation utilized in this study. Then, we revisit the characteristics and seasonal evolution of the western YSCWM using in-situ observations of 2006-2007 and 2014-2017, and explore the origins of the western YSCWM based on model simulation and Lagrangian tracing experiments. Finally, we provide a brief discussion and conclusion.
The IOCAS organized 19 research cruises in the southern YS of 119°-124°E, 32°-37°N during the 2006-2007 and 2014-2017 periods to systematically investigate hydrographic properties and oceanic processes of this region (Diao et al., 2022; Yu et al., 2022). During these surveys, data were collected using Sea-Bird model-911 (SBE911) conductivity-temperature-depth instruments (CTDs) and a moving vessel profiler (MVP, model-200). These were 14 CTD surveys in August 2006, January 2007, April 2007, October 2007, May 2014, October 2014, August 2015, December 2015, April 2016, June 2016, April 2017, May 2017, June 2017, and August 2017, consisting of 261, 261, 261, 261, 36, 36, 36, 36, 29, 46, 53, 54, 69, 45 CTD stations, respectively (Figure 1b). There were also 5 MVP surveys at 35°N and 36°N in 2015. Each of the cruises is finished within a calendar month. Note that locations of CTD casts are the same during the four cruises of 2006-2007 to avoid spatial aliasing, so as for the 2014-2015 CTD cruises.
Accuracies of the collected data range from ±0.001 °C to ±0.005 °C for temperature and ± 0.0003 S m-1 to ±0.001 S m-1 for conductivity. Measurements through strong thermal gradient, such as that associated with the YSCWM, may result in thermal inertia in CTD sensors and cause erroneous records of conductivity and salinity. During our measurement using SBE 911, the typical lag of conductivity relative to temperature is 0.073 seconds. The deck unit (SBE 11-plus) has been programmed to advance conductivity relative to pressure +1.75 scans (0.073 seconds at 24 Hz) to adjust the potential data spikes induced by the lag. Rigorous quality control procedures and advanced filtering techniques were applied to the raw data, including data synchronization to align measurements, noise removal to eliminate artifacts, and outlier detection to ensure consistency (Zhang et al., 2024). The final data used for our analysis are of vertical intervals of 1 m, fine enough for resolving the vertical structure of the YSCWM. Temperature and salinity fields were constructed as horizontal maps and zonal and meridional sections, enabling visualization of properties in the southern YS.
The ocean model used in this study is the Regional Ocean Modelling System (ROMS). ROMS is a hydrostatic, primitive equation model that implements a free surface, horizontal curvilinear coordinate, and a terrain-following (sigma-type) vertical coordinate system (Haidvogel et al., 2000). We use a configuration of ROMS for the East China Sea (ECS) continental shelves (Guo et al., 2019; Chi and Rong, 2023). The model grid covers the Bohai Sea, the YS, the ECS, and part of the continental shelf break opening to the Pacific. The mesh contains 362 × 242 × 20 grids with horizontal resolution transitions from 1.5 km in the inner shelf to 10 km in the open ocean. The coastline data of the Bohai Sea was depicted based on the Global Self-consistent Hierarchical High-resolution Geography Database. Additionally, high-resolution satellite imagery was utilized for the coastline around the Changjiang River estuary. ROMS was forced by surface atmospheric forcing, riverine inputs, and open boundary equilibrium tides. Surface meteorological forcing daily data was obtained from the Coupled Forecast System Model Version 2 (CFSv2) developed by the National Centers for Environmental Prediction, including air temperature, pressure, longwave and shortwave radiation, cloud cover, zonal and meridional wind velocity, relative humidity, and precipitation. CFSv2 provides high-resolution and comprehensive data that help capturing the realistic fine-scale features of ocean dynamics (Saha et al., 2014) and have been successful in driving various ocean models to investigate the circulation and heatwave mechanism in the YS (Gao et al., 2020; He et al., 2022). The open ocean boundary condition for the barotropic component consists of the Chapman/Flather boundary condition for sea surface elevation and depth-averaged flow (Flather, 1976; Chapman, 1985). The open boundary condition for the baroclinic component is the Orlanski-type radiation condition (Orlanski, 1976). In addition, daily assimilation data including temperature, salinity, and velocity were obtained from the Hybrid Coordinate Ocean Model to couple with the tidal forcing along the open boundary. Ten major rivers along the coastline were included in the model including the Changjiang River, the Yellow River, the Qiantang River, the Huai River, and several others. Daily flux data of the Changjiang river applied to the model were measured at Datong station while the monthly-averaged flux data released by the Ministry of Water Resources of China were also collected for the other rivers. Further details of the model configuration can be found in Guo et al. (2019). To explore the origins of the western YSCWM, model output of three-dimensional ocean velocities of 2017 and 2018 are used to conduct the Lagrangian particle tracing, which is described in Section 4.
In 2006 summer, the western YSCWM, with bottom temperatures of ~8-9°C at ~30-60 m, existed between 121°-123°E, 34°-36°N region, close to the Shandong coasts (Figure 2a). This bottom-trapped cold water was surrounded by warm coastal waters of >21°C on the west and capped by a warm surface mixed layer of ~23°C (Supplementary Figure S1). The western YSCWM was separated from the eastern component by warm water of >11°C between 123°-124°E which is the remnant of the YSWC (Yu et al., 2006; Zhang et al., 2008; Teague and Jacobs, 2000; Yu et al., 2022). In the following winter (January 2007; Figure 2b), the region of YSCWM was occupied mainly by waters of >12°C that intruded north-westward via the strengthened YSWC. This portion of YSWC water was surrounded by much colder coastal waters (<9°C) that were exposed to surface cooling. By April 2007, the western YSCWM region was further cooled as the YSWC water retreated (Figure 2c), and the cold water mainly existed near the shallow areas near the Shandong coasts. By October 2007, as the western YSCWM shrank, the cold water west of 122°E had been nearly erased by summertime heating and mixing and replaced by warm waters >18°C (Figure 2d). These warm waters are, again, connected with the high temperatures of coastal waters.
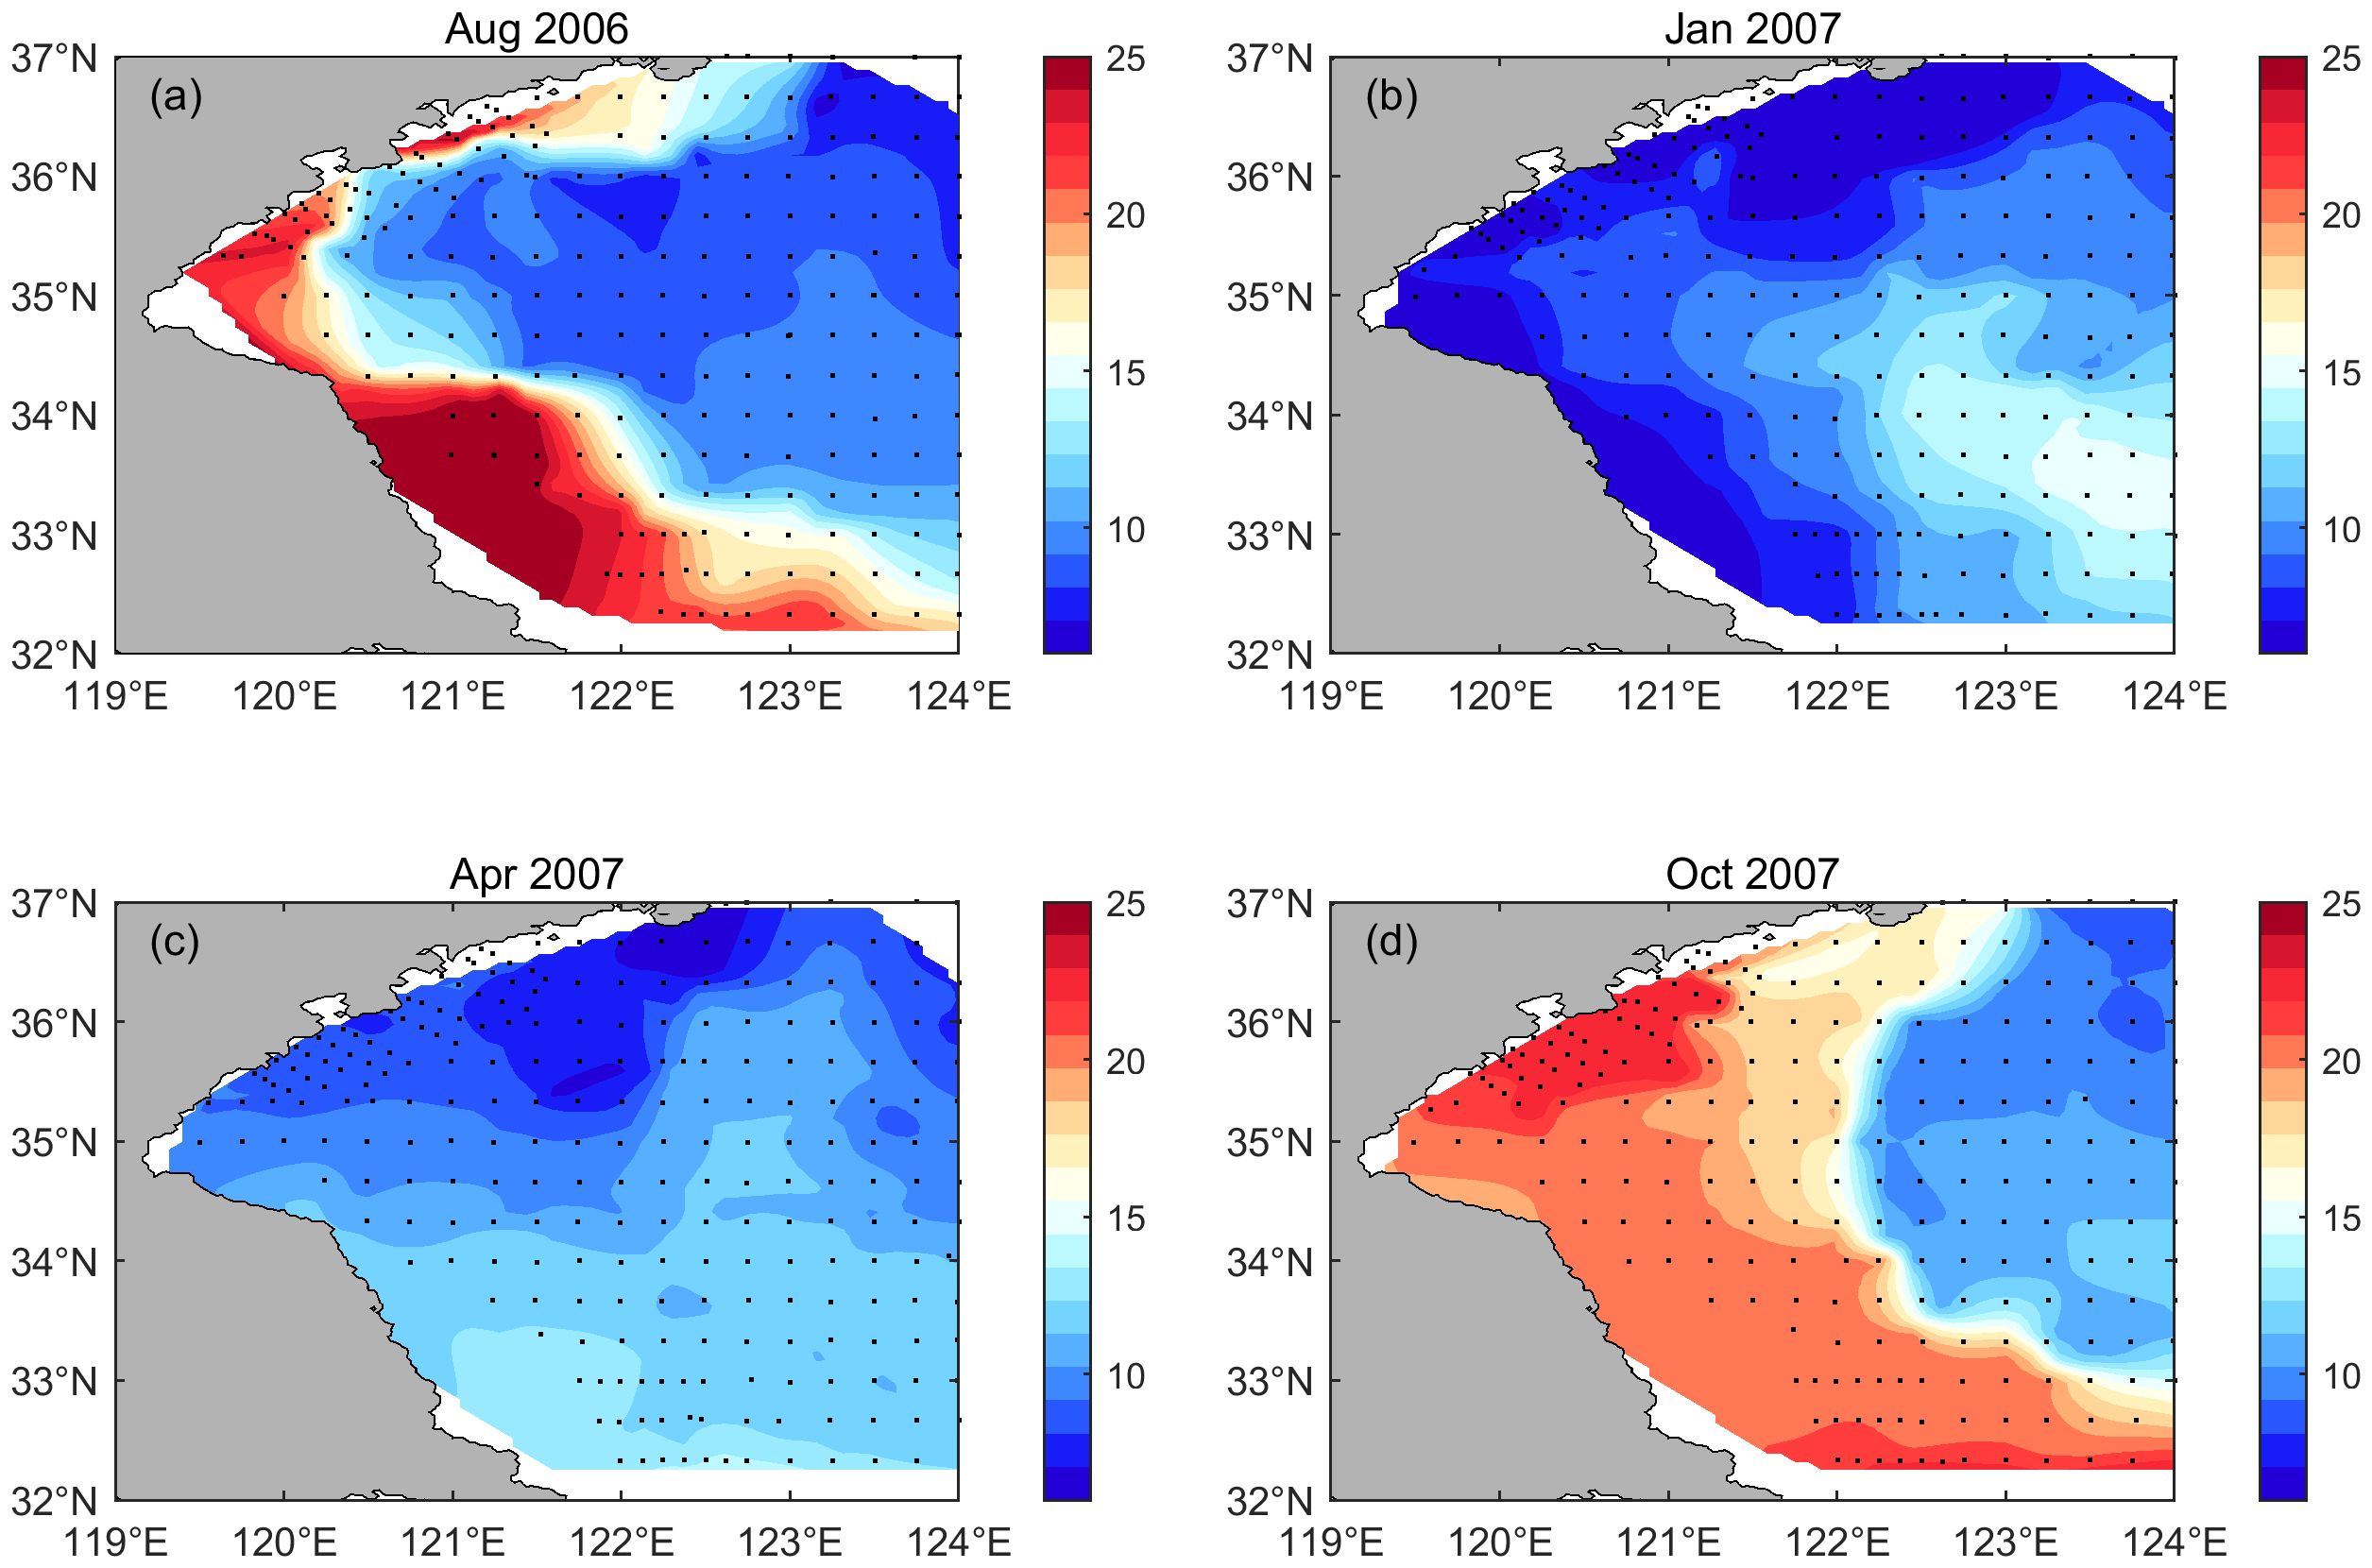
Figure 2. Near-bottom temperature (°C) of the western YS in (a) August 2006, (b) January 2007, (c) April 2007, and (d) October 2007, based on in-situ measurements of research cruises. Black dots denote the locations of CTD casts.
Interestingly, among the four observations, the YSCWM was overall the coldest in the 2006 summer (Figure 2a), regardless of the warmest surface waters above (Supplementary Figure S1). If this contrast was not mainly induced by interannual variability between 2006 and 2007, these observed features likely reflect a unique seasonal evolution of the western YSCWM. The western YSCWM seen in summer is not totally the remnant of the cold water in the previous winter. Alternatively, this water is also linked to shallow waters near the Shandong coasts and possibly also those on the Subei Shoal in winter and spring. The cold-water input from the coastal areas, possibly in spring, may play a critical role in shaping the low temperatures of the western YSCWM in summer, while the warm water advection from coastal areas in summer and autumn is a candidate mechanism in diminishing the western YSCWM in autumn.
Salinity data from CTD measurements provide insights from another point of view (Supplementary Figure S2). In all seasons, the western YSCWM was much fresher than the YSWC (or its remnant water) on its east and saltier than the coastal waters. This robust salinity distribution indicates that the coastal areas are the primary freshwater source for the YSCWM. In addition, mixing with the fresher surface water (Supplementary Figure S3), induced by tides and wind-driven turbulence (Zhao, 1985; Lee and Beardsley, 1999; Moon et al., 2009; Wang et al., 2014), can also reduce the salinity of the western YSCWM. Different from the temperature distribution, low salinities occur mainly on the Subei Shoal (See also Figure 1a). The potential contribution from the Subei Shoal water is favorable for the maintenance of lower salinities of the western YSCWM than the eastern YSCWM.
Next, we look at zonal sections of temperature and salinity at 35°N, crossing the core of the western YSCWM (Figure 3). Observations at 35°N confirm that the western YSCWM in summer, situated below 20 m and between 121°-123°E, is < 9°, colder than any other season. In summer, the western YSCWM is capped by a warm and fresh surface mixed layer with a thickness of ~15 m and a sharp pycnocline between 15-20 m stratified by both temperature and salinity gradients. The temperature difference between the surface and bottom water can reach up to 15°C (Figure 3a). In other seasons, the western YS is characterized by uniform vertical profiles of temperature and salinity. However, local waters cannot match the low temperatures of the summertime western YSCWM. This, again, indicates a nonlocal contribution to the western YSCWM in summer. The meridional section at 123°E highlights the potential connection of the western YSCWM to the northern YS (Figure 4). Here, one can see a cold-water tongue extending from the north to the western YSCWM region of 34°-36°N in all seasons, with its temperature rising as proceeding southward. This cold-water tongue encounters warmer and saltier waters that contain the signatures of the YSWC.
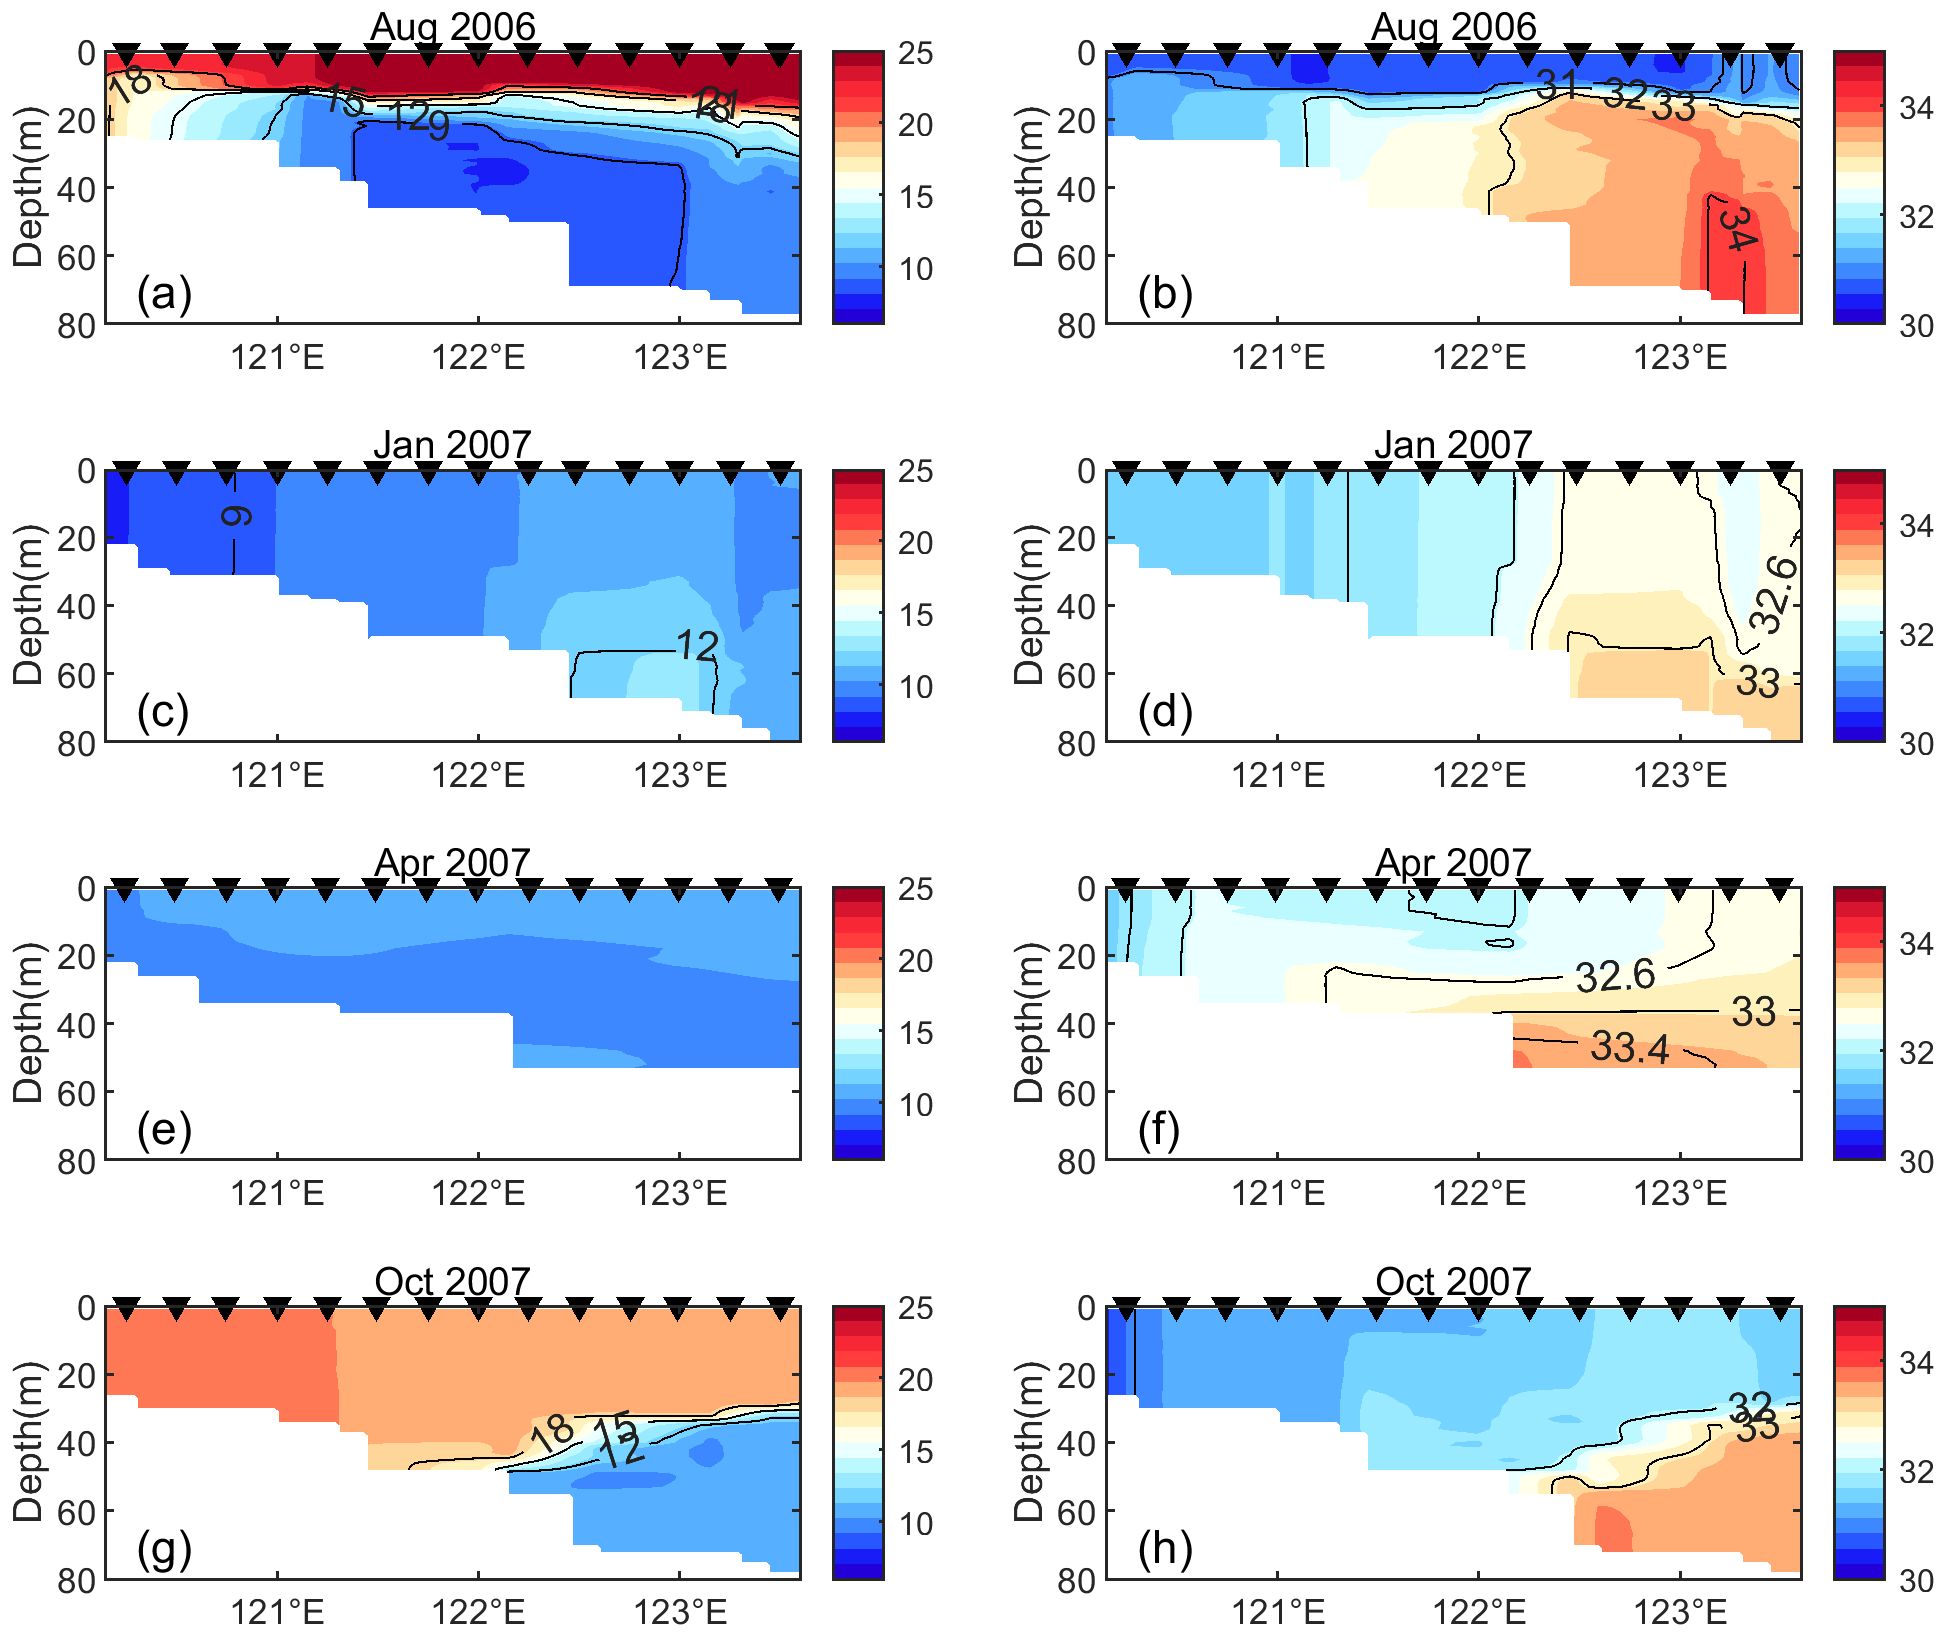
Figure 3. Zonal sections of temperature (left panels; in °C) and salinity (right panels; in psu) at 35°N in the western YS, based on in-situ observations in August 2006 (a, b), January 2007 (c, d), April 2007 (e, f), and October 2007 (g, h). Black triangles on the top of each panel denote the locations of CTD casts.
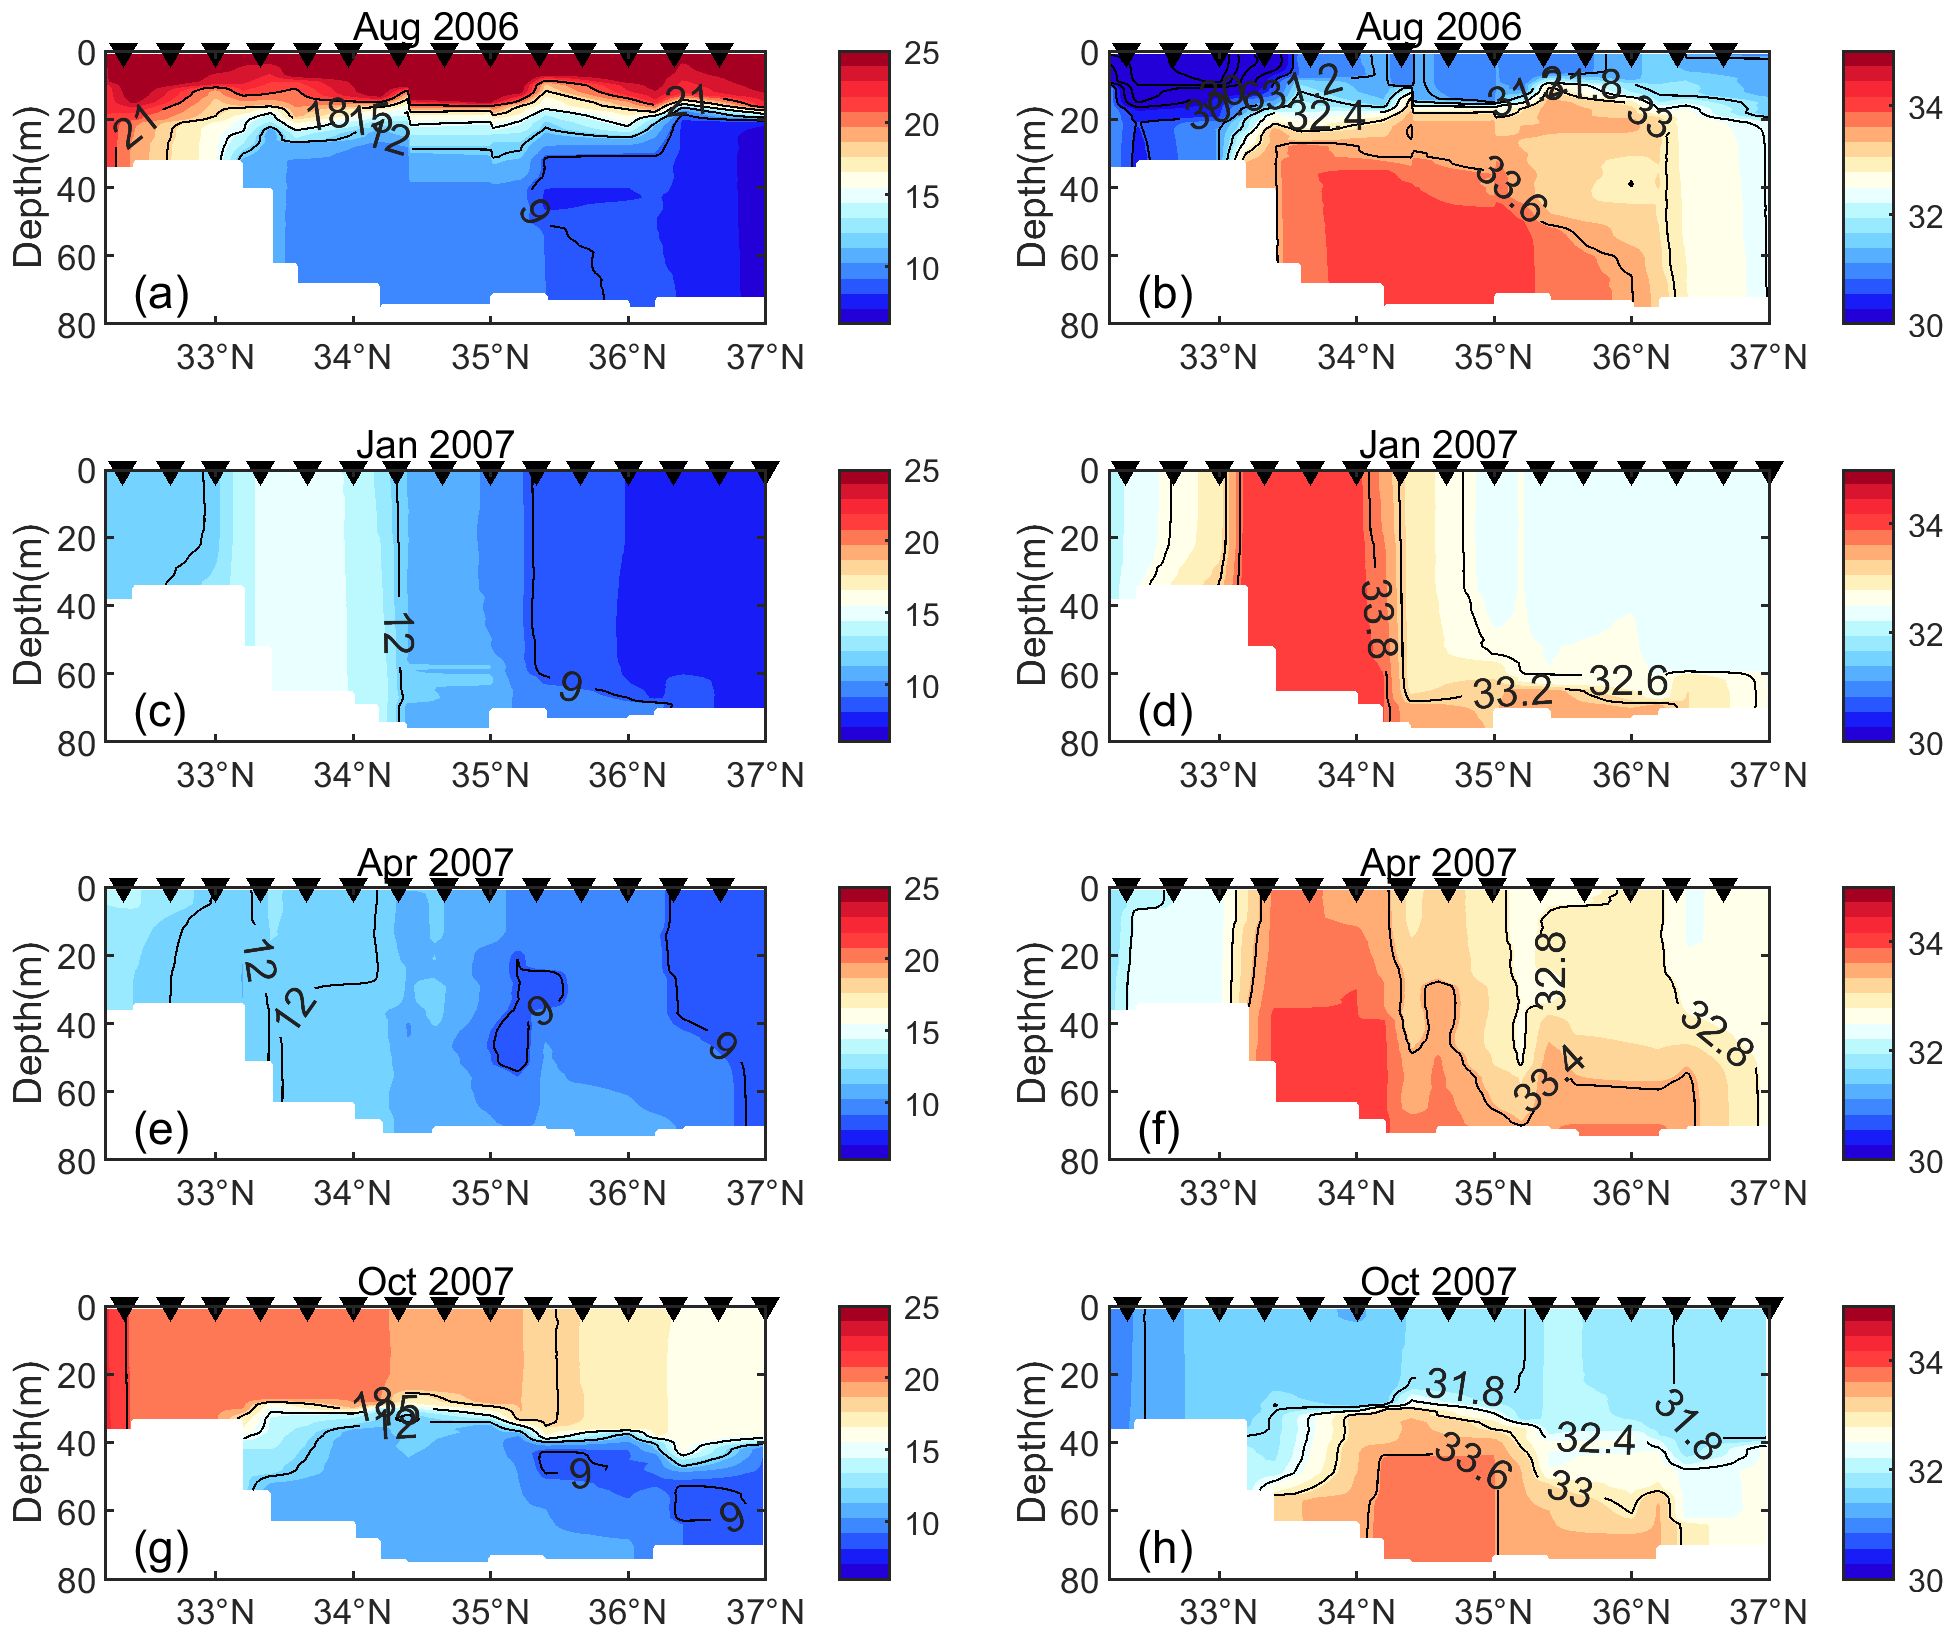
Figure 4. Meridional sections of temperature (left panels; in °C) and salinity (right panels; in psu) at 123°E in the western YS, based on in-situ observations in August 2006 (a, b), January 2007 (c, d), April 2007 (e, f), and October 2007 (g, h). Black triangles on the top of each panel denote the locations of CTD casts.
Features observed during 2006-2007 are inevitably subject to interannual variability and do not necessarily reflect seasonal evolution. Therefore, we need to check features in other years to enhance the robustness of our understanding. To do so, we examine the observations in 2014-2015 (Supplementary Figures S4, S5). During this period, a strong El Niño event occurred in the tropical Pacific in 2015, preceded by a weak one in 2014, and decayed in 2016 (Chen et al., 2017). According to previous studies, El Niño events exert indirect and delayed influence on the YSCWM, modulating its intensity via the altered winter monsoon (Park et al., 2011; Guo et al., 2021). Although subjected to the influence of the El Niño condition, the observations in 2014-2016 broadly agreed with those in 2006-2007 in characteristics of the western YSCWM. Interestingly, the western YSCWM in May 2014 shows a bottom-trapped cold core of < 9°C below 20 m in the coastal region of 121°-122.5°E (Supplementary Figure S4a), at least 2°C colder than the relatively uniform bottom water in April 2007 (Figure 3e). This cold core in May 2014 was also much colder than in winter, as indicated by observations in January 2007 (Figure 3e) and December 2015 (Supplementary Figure S4). This implies a cooling effect at work from April to May by nonlocal processes. Figure 4e and Supplementary Figure S4a suggest that the cold-water transport from the north is a candidate process providing this cooling effect. Here, we should be cautious of the potential impact of interannual variability. In 2016, after the 2015-2016 super El Niño, the western YSCWM was colder in April than in June (Supplementary Figure S6). This may arise from anomalous surface heating or advection by perturbed ocean currents dictated by ENSO conditions, which is beyond the scope of the present study.
The continuous observations from April to August of 2017 provide valuable insights for the formation of the summer western YSCWM (Figure 5). From April to June, the western YSCWM had not fully emerged at 35°N – near the center of the western YSCWM. The subsurface cold water between 121°-123°E existed primarily as a westward extension of the YSCWM main body in the east. There was a tendency of warming and salinity increase in this water. For example, the near bottom temperature at 121° increased from ~10°C in April to ~12°C in June (Figures 5a-c); the salinity at 121.5° rose from ~32.4 psu in April to ~32.6 psu in June (Figure 5e-g). Interestingly, this tendency is reversed in summer, from June and August. There is an abrupt cooling between 122°-123°E, from 9-11°C in June to 8-9°C in August (Figure 5d). This cooling gave rise to a cold core isolated from the YSCWM main body that characterizes the emergence of the western YSCWM. A sharp thermocline is formed, separating the cold core with the ~ 15°C warmer surface water. Meanwhile, there was a discernible freshening of this water in summer (Figure 5h). This freshening could arise from the mixing with the low-salinity surface mixed layer and otherwise from fresh-water advection from other regions. Nevertheless, the cooling effect must result from cold water advection, given that the surface mixed layer is exposed to strong heating in summer. Observations were also conducted at 36°N, near the Shandong coasts and at the northern boundary of the western YSCWM, in these months of 2017 (Supplementary Figure S7). Different from the changes seen at 35°N, the near-bottom cold water of < 9°C existed in April, persisted to June, and was diminished by August by surface heating. These features suggest that the cold water seen at 35°N could be supplied by southward advection from the Shandong coastal regions, particularly in Spring.

Figure 5. Zonal sections of temperature (left panels; in °C) and salinity (right panels; in psu) at 35°N in the western YS, based on in-situ observations in April (a, e), May (b, f), June (c, g), and August (d, h) of 2017. Black triangles on the top of each panel denote the locations of CTD casts.
The MVP measurements at 35°N and 36°N in 2015 spring reveal more detailed features than CTD casts (Figure 6). Different from changes seen in 2017, one can see similar temperature distribution at the two latitudes. A subsurface cold core occurred at 122°E and persisted from April through June, with its temperature rising with time. According to the high-resolution MVP measurements, these subsurface cold signals, as the manifestation of the western YSCWM, were well separated from the eastern YSCWM existing east of 123.5°E. In addition, temperatures at 36°N were consistently lower than those at 35°N, again supporting a cold-water supply from the north to the YSCWM in spring and summer. Despite potential influences from interannual variability and synoptic events, the all-season observations during the 2006-2007 and 2014-2017 periods presented above reach a consensus in suggesting the following features: the western YSCWM begins to form in spring and is connected to the colder waters near the Shandong coasts; it fully emerges and reaches the coldest temperature in summer and is well separated from other components of the YSCWM; the cooling of the western YSCWM in spring and summer is exerted by nonlocal processes such as cold-water advection. Observations also indicate possible origins of the western YSCWM from the north or the south, which contributes to shaping or maintaining the cold and relatively low-salinity features of the western YSCWM. Given the importance of the western YSCWM in supporting the local biogeochemical cycles and benthic biological communities, it is useful to clarify the origins of this water and associated material transports. In the following subsection, this is pursued through Lagrangian particle tracing experiments based on three-dimensional currents generated by ROMS simulation.
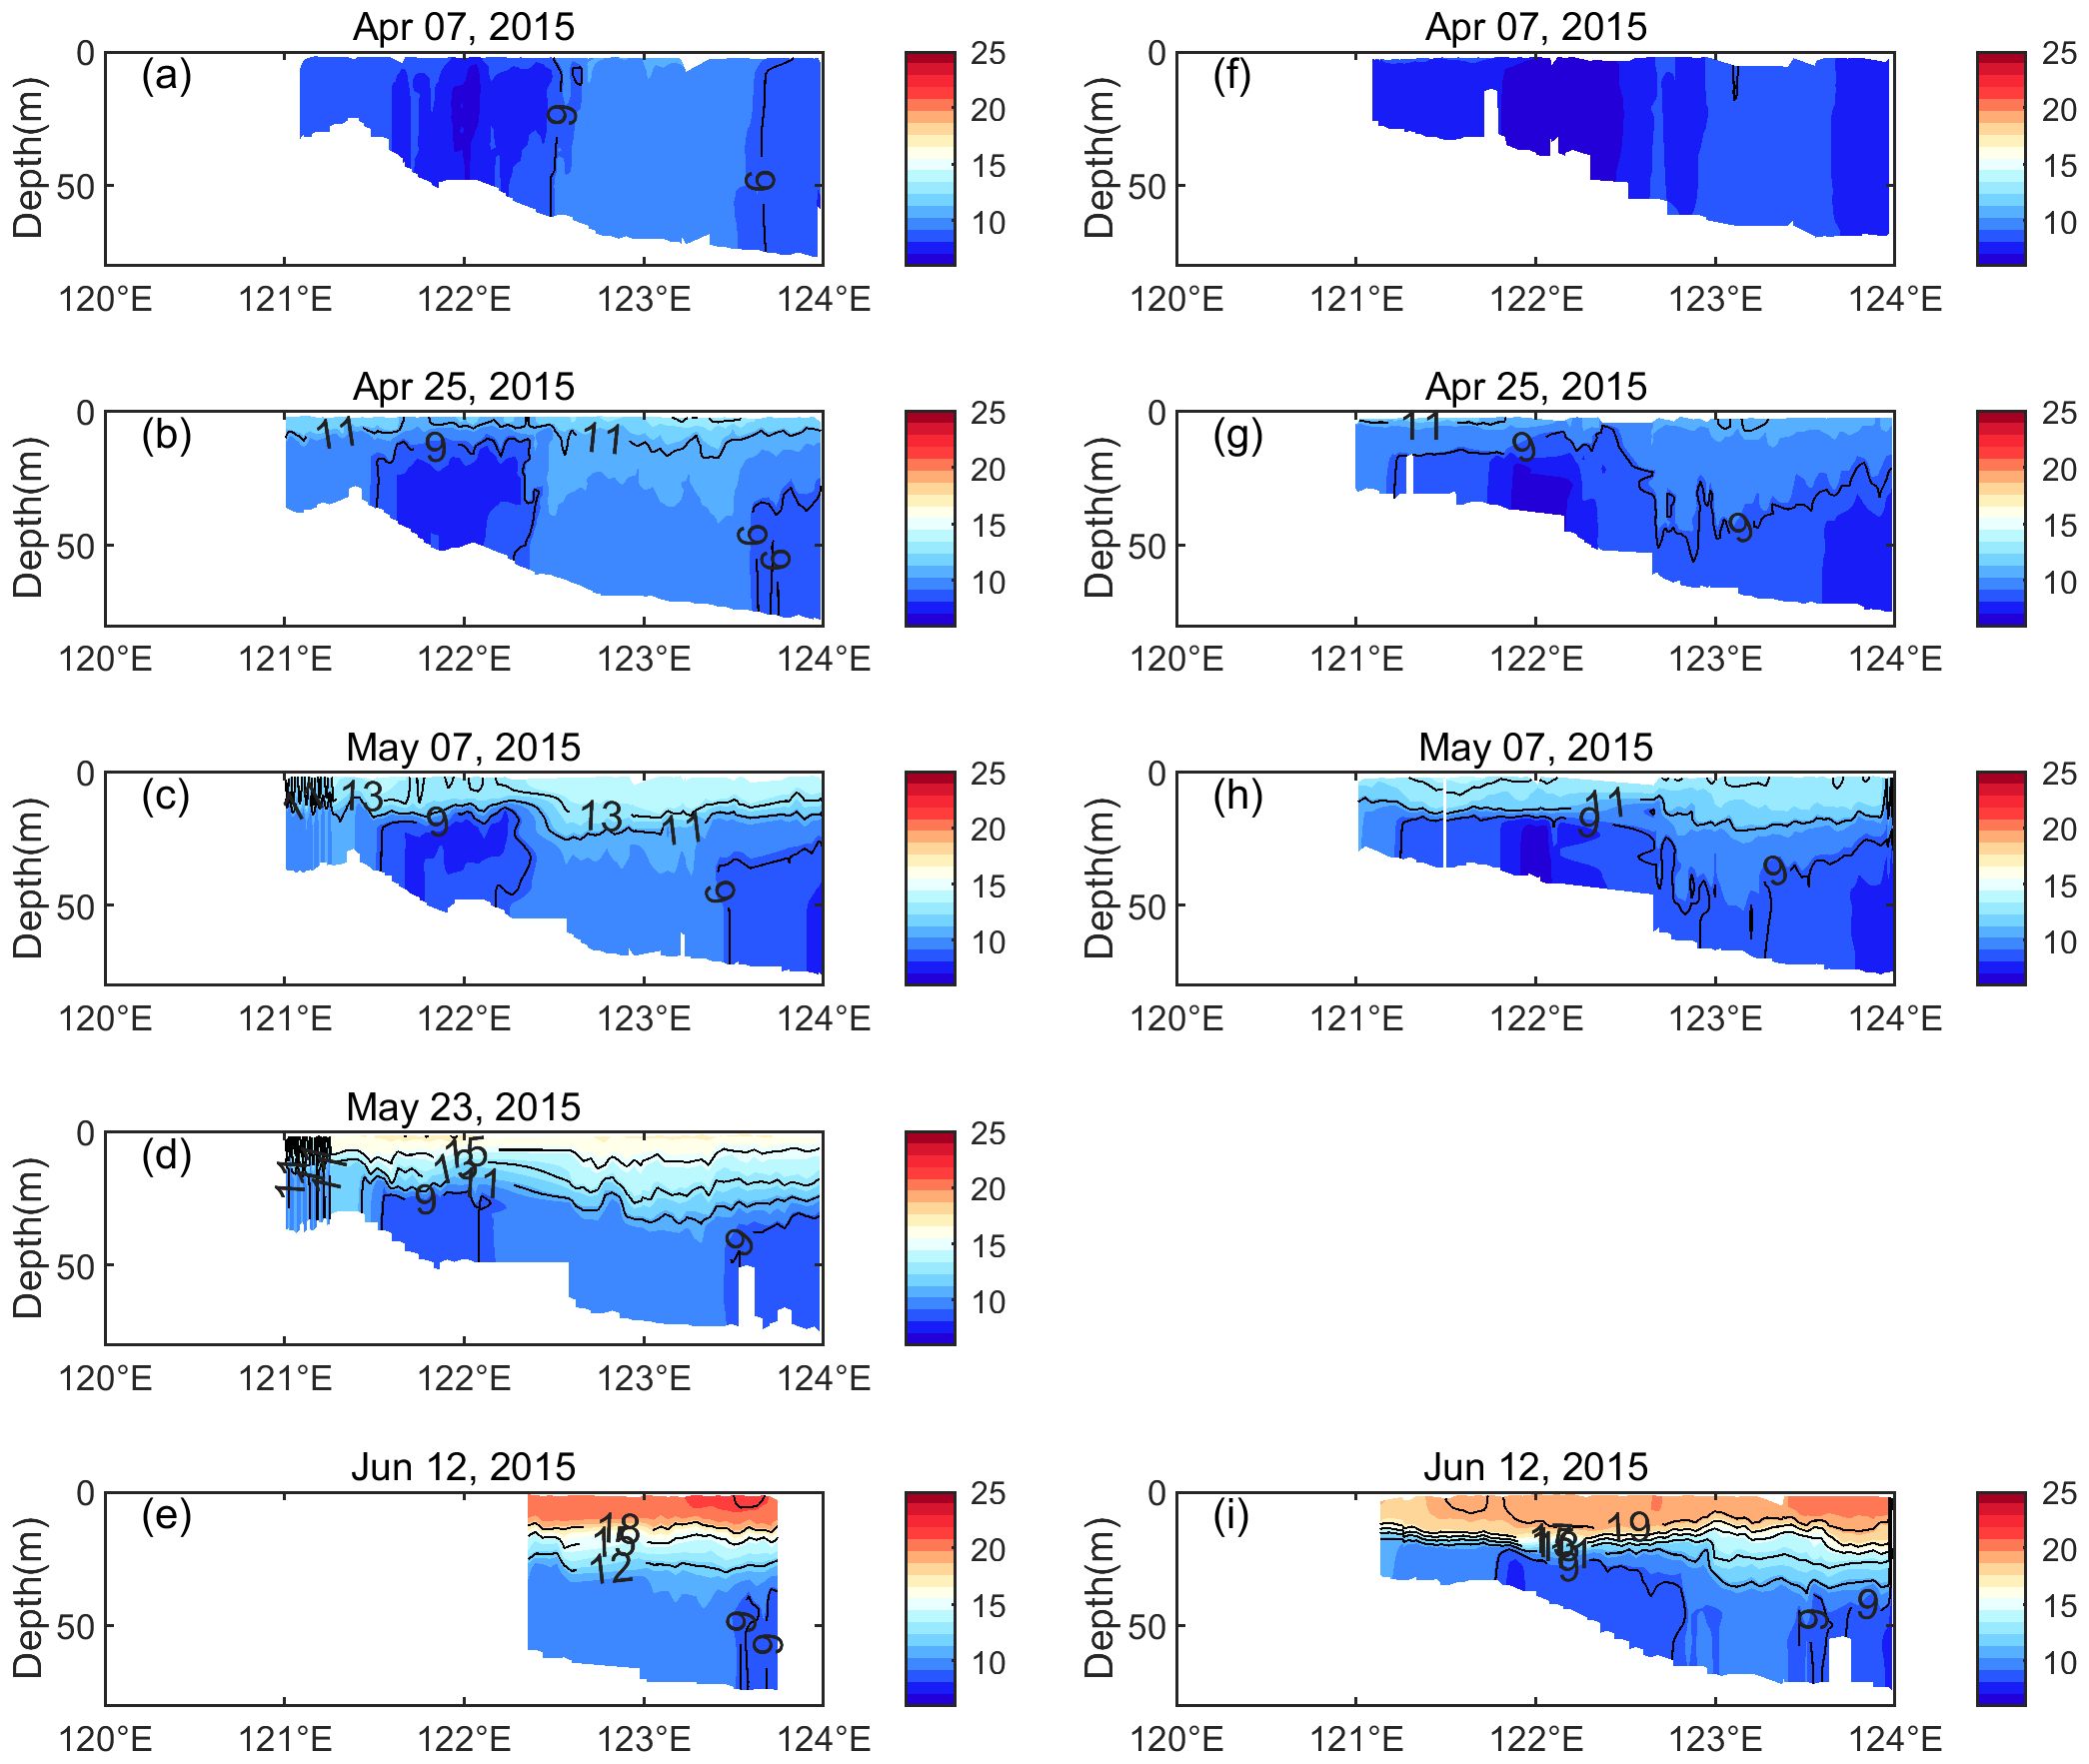
Figure 6. Zonal sections of temperature (°C) at 35°N (a-e) and 36°N (f-i) in the western YS, based on MVP measurements on April 7 (a, f), April 25 (b, g), May 7 (c, h), May 23 (d), and June 12 (e, i) of 2015.
The near-bottom circulation in 2018 simulated by ROMS (Figure 7) is largely consistent with the understanding established by existing observational studies (e.g., Tang et al., 2000; Teague and Jacobs, 2000; Tang et al., 2004). In winter and spring, the SDCC flows along the Shandong coasts, following a clockwise route, transporting the cold water from the northern YS and even the Bohai Sea to the southwestern YS, potentially serving as a source for the development of the western YSCWM. In winter, the cold water of SDCC can be transported further southward via the Yellow Sea Coastal Current (YSCC) across the YS to the ECS. In spring and summer, the Subei Coastal Current (SCC) exists as a shallow northward flow on the Subei Shoal, providing a route for the coastal water of the Subei Shoal to the vicinity of the western YSCWM. This route serves as another potential source for the western YSCWM in spring and summer. This route disappears in autumn owing to the decay of the summer monsoon. To summarize, the seasonal circulation simulated by the ROMS indicates vital communications of the western YSCWM with the coastal waters in the north and south in spring and summer.
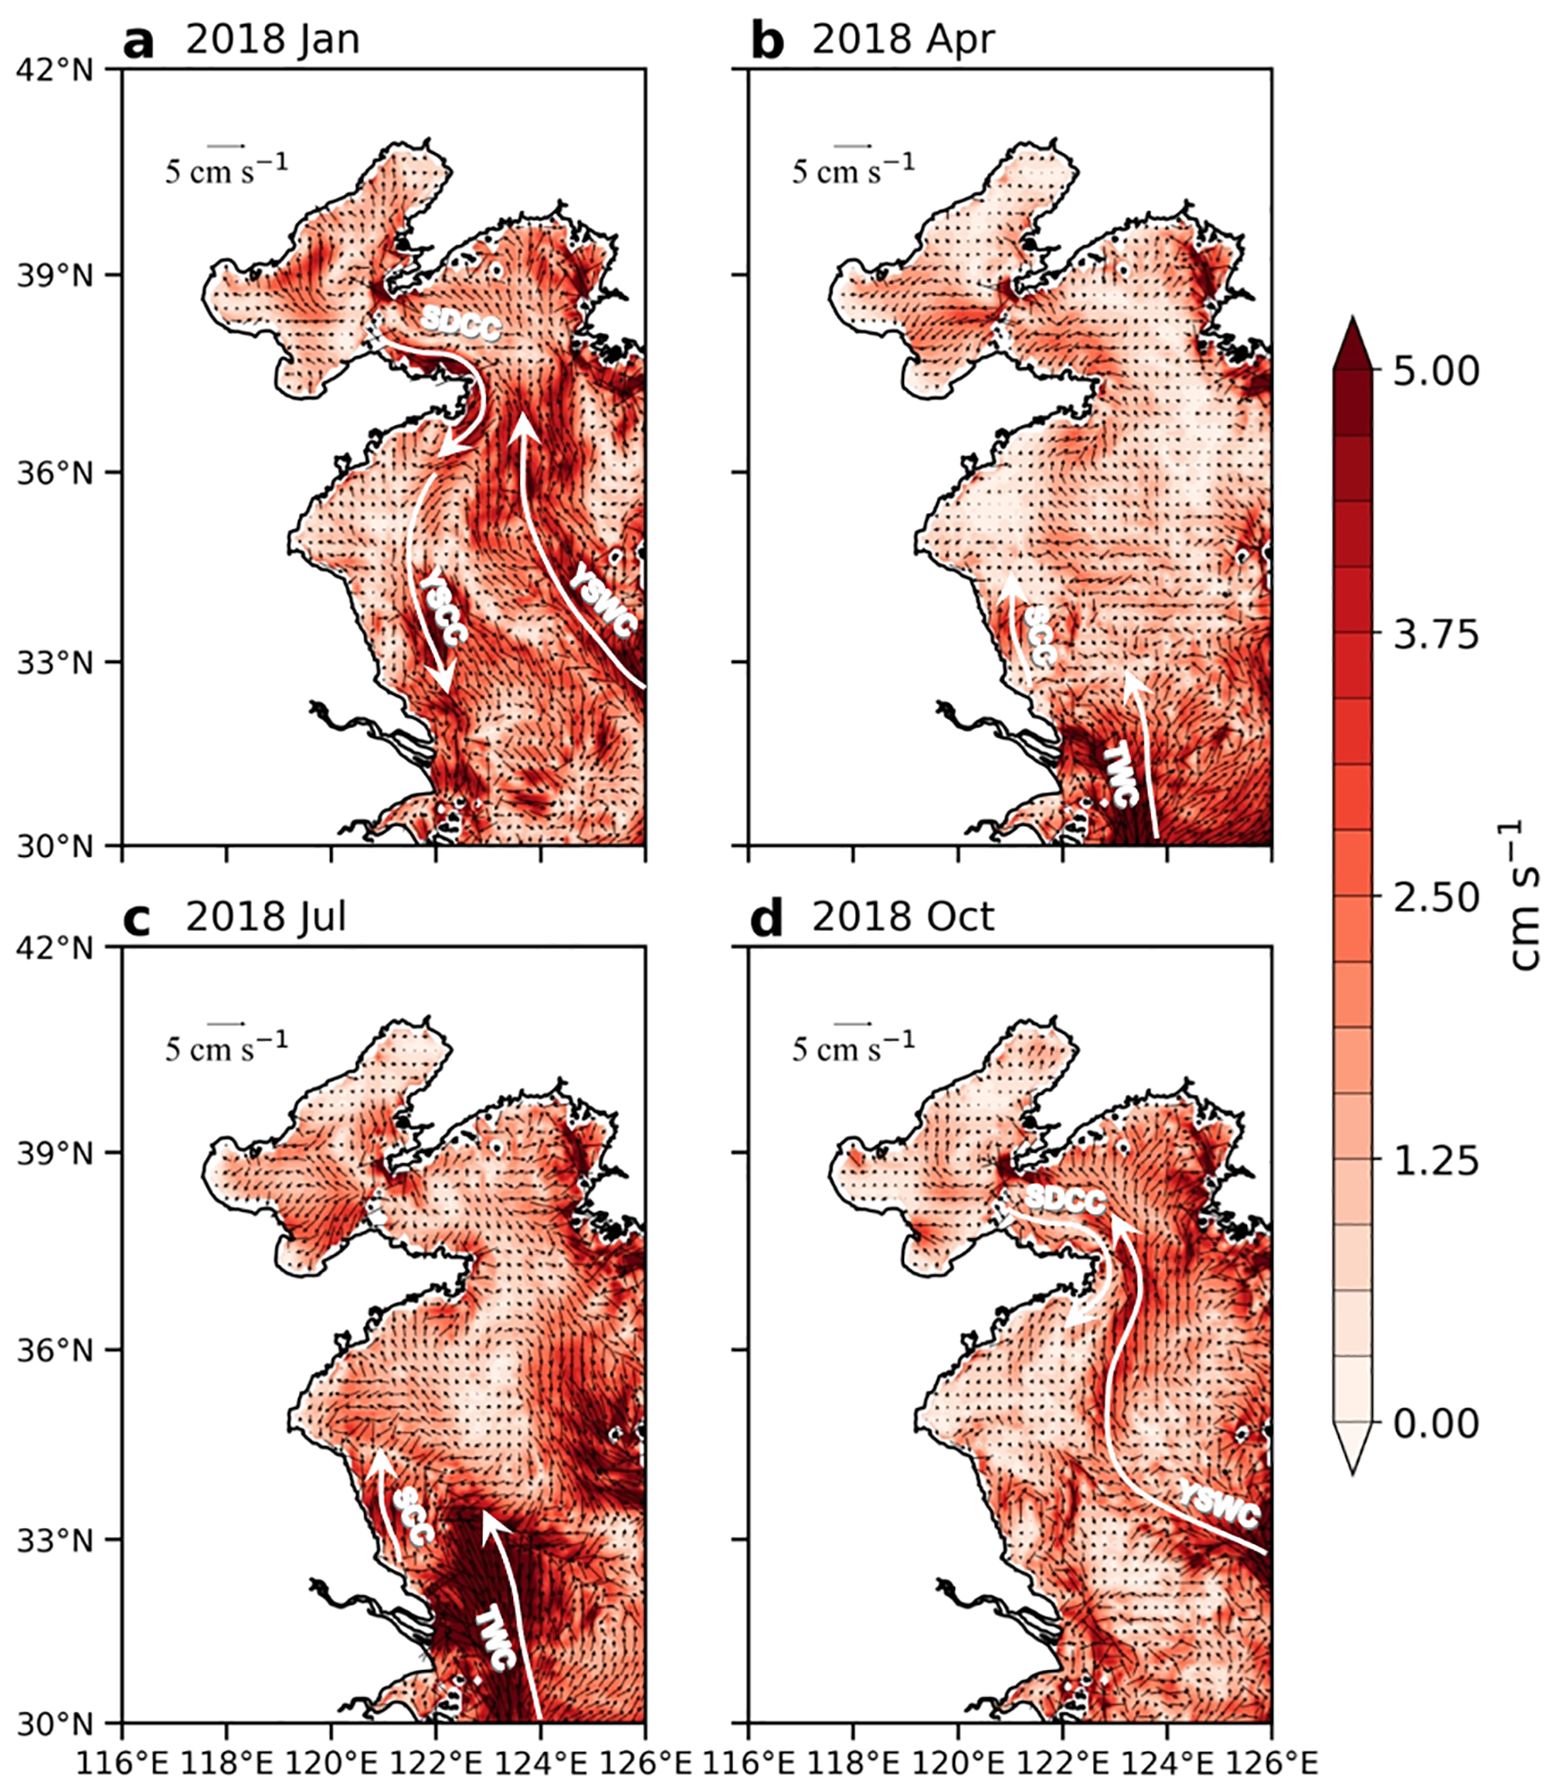
Figure 7. Monthly mean bottom currents in the YS of (a) January, (b) April, (c) July, and (d) October of 2018, derived from ROMS simulation. At each grid point of the model, the current of the deepest layer is adopted as the bottom current. Color shading denotes the magnitude of currents. Major currents are remarked, including the Yellow Sea Warm Current (YSWC), the Yellow Sea Coastal Current (YSCC), the Shandong Coastal Current (SDCC), the Subei Coastal Current (SCC), and the Taiwan Warm Current (TWC).
To clarify the source of the western YSCWM, we perform reversed particle tracking using hourly three-dimensional currents of the ROMS simulation of 2017-2018. The backward Lagrangian tracking is conducted using the OpenDrift software, an open-source Python-based framework that contains specialized modules to simulate various substances and objects such as oil drift, search and rescue, and plankton (Dagestad et al., 2018). The simulation ensures drifters return to their previous position upon hitting the land boundary, which effectively simulates offshore transport and avoids onshore deposition. The parameters corresponding to other dynamical processes like mixing are set to the default values, and their details are available from the base module enclosed in the program package. Several Lagrangian experiments were set to simulate the backward transport of drifters in different cases. Particles are seeded within the western YSCWM region of >20 m, 121°-123°E, 34.5°-36°N (Figure 8). There were in all 22801 particles deployed with ~0.01° spacing. Four-hour, three-dimensional velocities of ROMS simulation were utilized to estimate the trajectory of each particle at a backward time step of 1 hour. Then the Lagrangian particles were deployed on the 15th of every month of 2018 and tracked backward for one year.
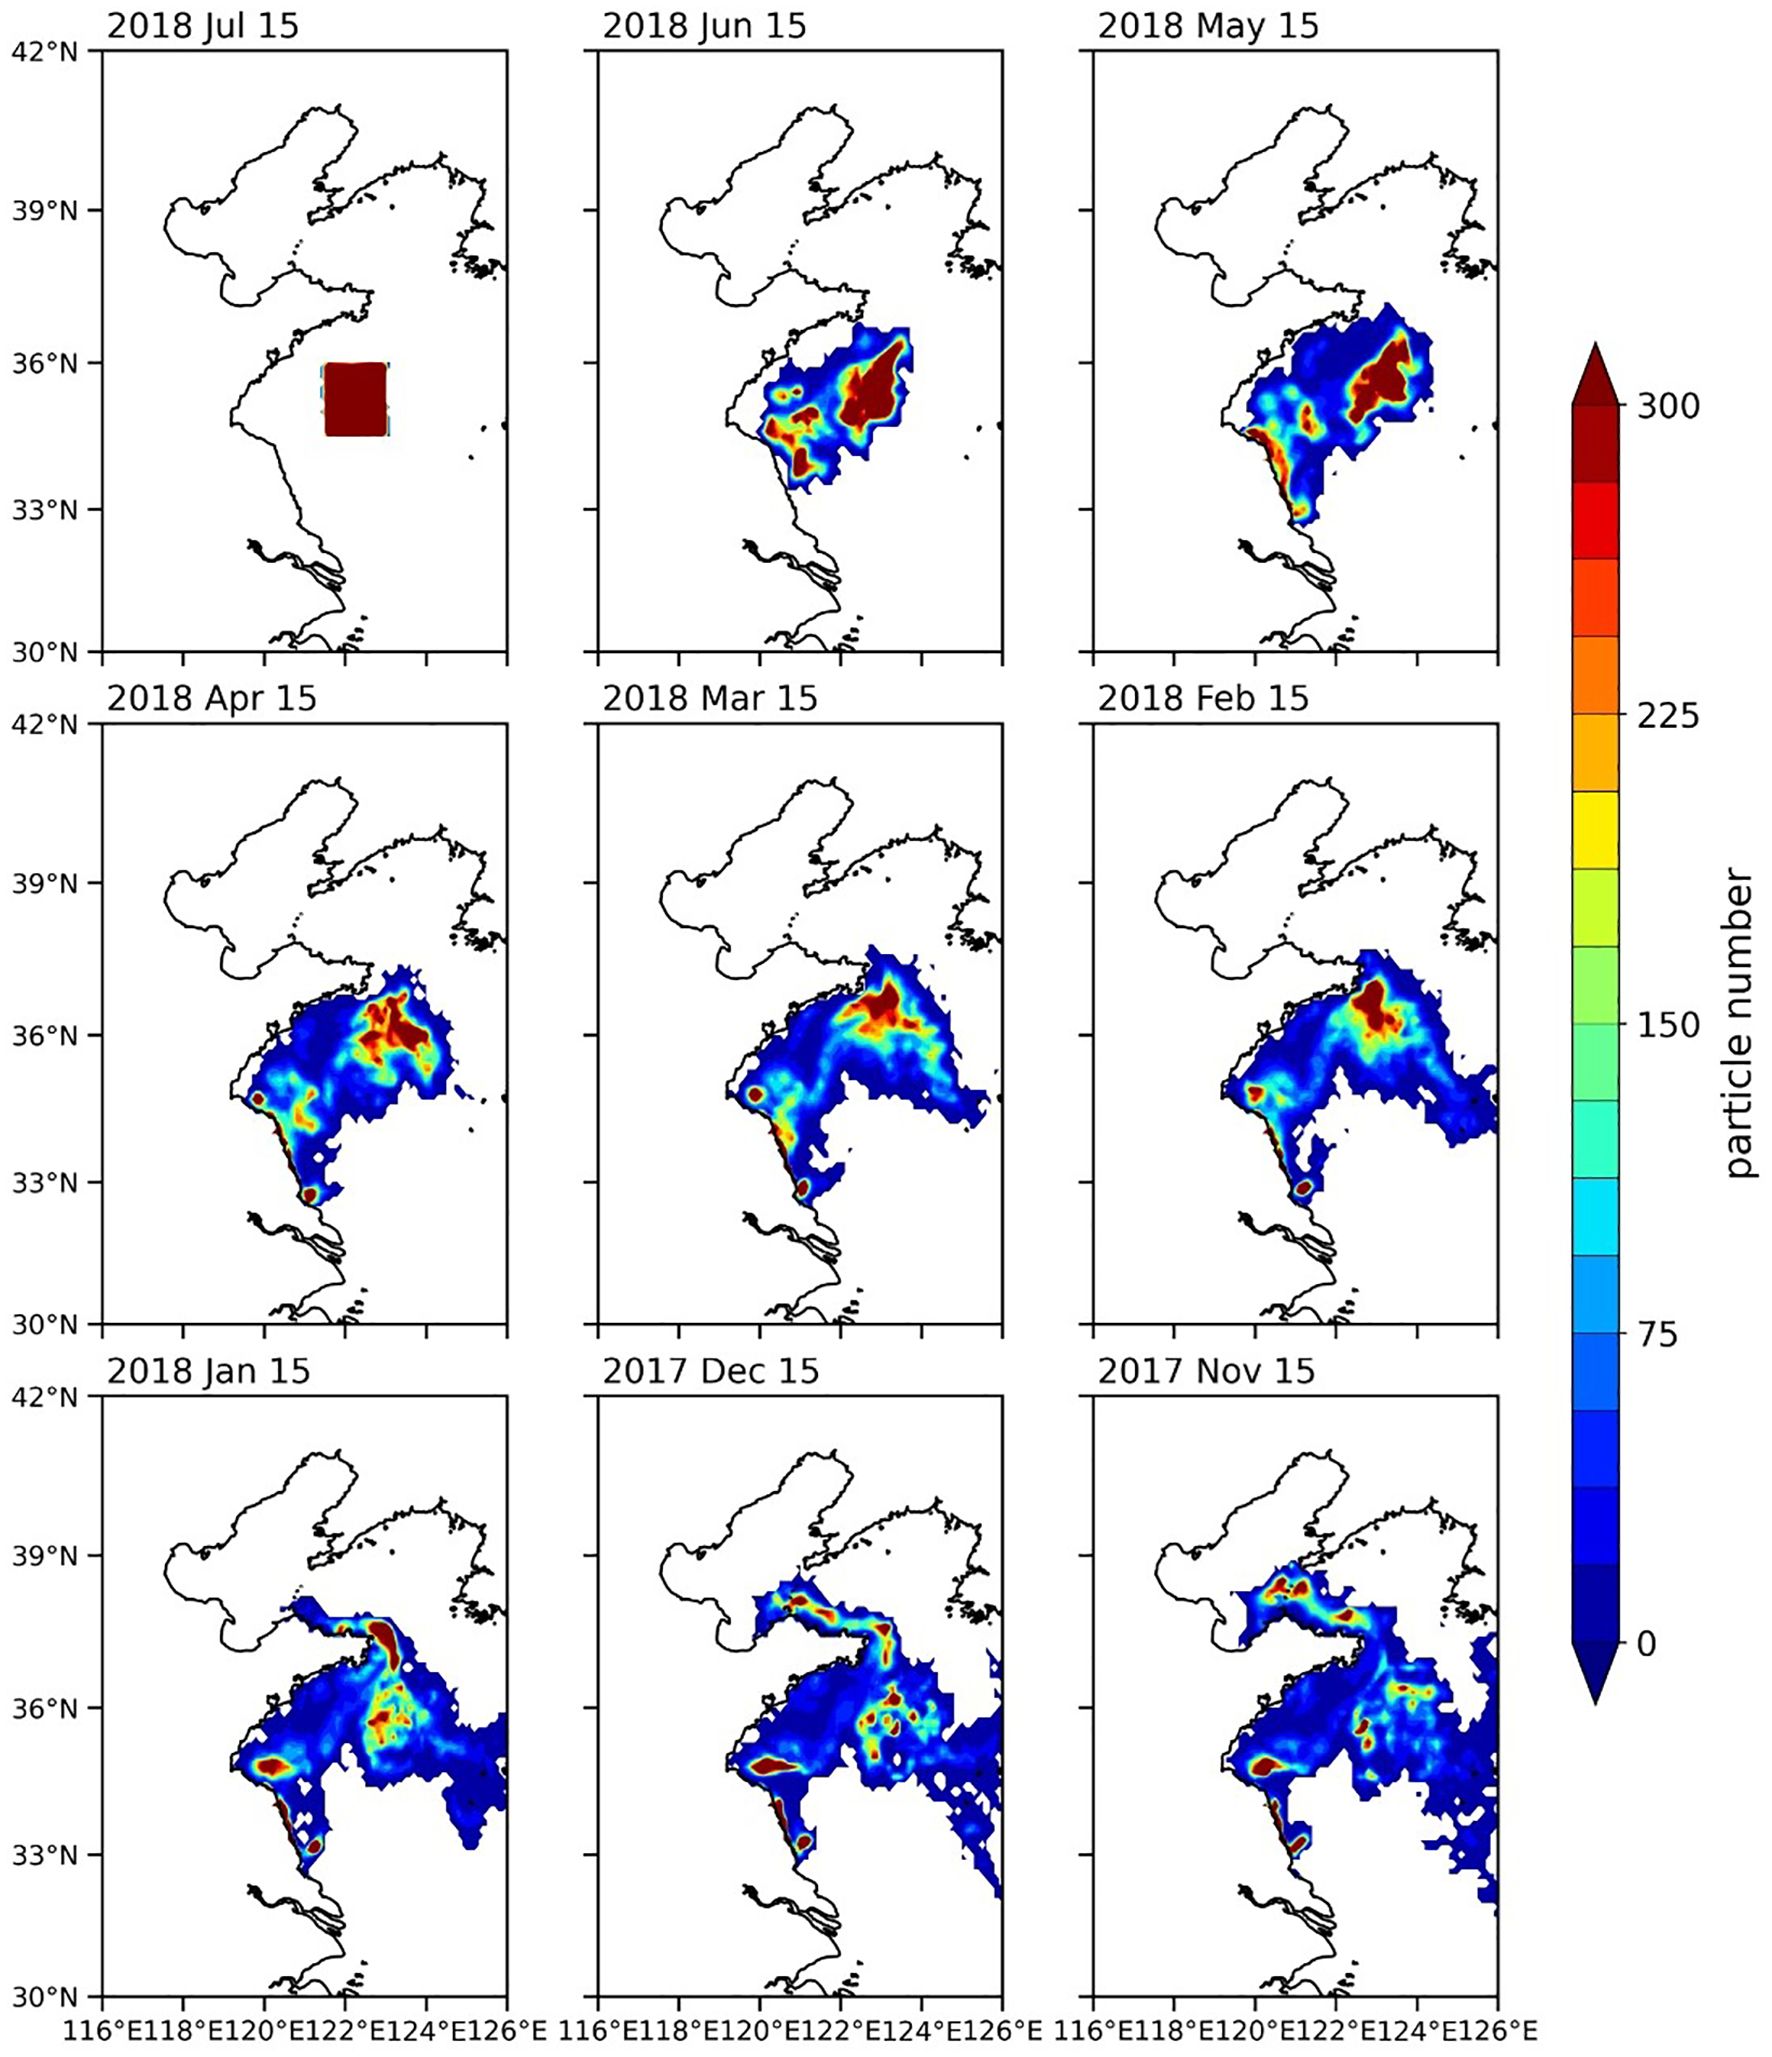
Figure 8. Results of backward particle tracing for the western YSCWM. Particles were released on July 15 and tracked backward for one year. The particle distributions on June 15, May 15, April 15, March 15, February 15, January 15 of 2018, and December 15 and November 15 of 2017 are shown.
Figure 8 shows the distribution of particles that were released on July 15th 2018 during November 2017-July 2018. The distribution on June 15th clearly suggests two separated water partitions of the western YSCWM, one from the southwest and one from the northeast. The southwest origin can be eventually tracked back to the Subei Shoal in spring (March-May) and winter, while the northeast origin is from the northern YS and even the Bohai Sea. The evolution of the particle distribution is consistent with the seasonal circulation shown in Figure 7. The SDCC and the SCC serve as the primary routes for the northeastern and southwestern origins of the western YSCWM, respectively. Note that a small portion of the northeastern origin can be tracked to the YSWC. This is in line with existing knowledge that there is a remnant of warm and salty YSWC water in the YSCWM when the YSWC vanishes in summer (Yu et al., 2022). Yet, the relatively cold and low-salinity features of the western YSCWM are clearly shaped by the advections from the northern YS and Subei Shoal. Particularly, the fresh and nutrient-rich water intrusion from Subei Shoal in spring and summer plays a vital role in shaping the characteristics of the western YSCWM.
The tracing experiments are also conducted for other months. Although particles released in other months show generally similar patterns to Figure 8, all partitioned into the southwest and northeast origins, there is a large quantitative difference. For example, the origin of the western YSCWM in August is of a larger partition from the Subei Shoal and a smaller partition from the northern YS (Supplementary Figure S8). The intrusion of the Subei Shoal water into the western YSCWM is strong in June and July, transporting relatively warmed coastal water into the YSCWM. The releases in autumn months generally achieve a similar pattern to Supplementary Figure S8 (figures not shown), also suggesting a strong contribution from the Subei Shoal. Note that the western YSCWM tends to reach a peak strength in summer and quickly vanishes in autumn. The warm and low-salinity water intrusion from the Subei Shoal, primarily via the SCC driven by strong tidal mixing, is likely a key process for the demise of the western YSCWM in autumn. By contrast, the releases in early summer and spring generally show a reversed pattern, with a larger partition of the northeast origin (e.g., Supplementary Figure S9). The cold-water supply from the northern Shandong coasts and the northern YS is critical for shaping the peak strength of the western YSCWM in summer.
Overall, the tracing experiments based on ROMS simulation analyzed in the subsection confirm our hypothesis based on in-situ observations. The evolution of western YSCWM in spring, summer, and autumn is regulated by communications in the north and south through the seasonal circulation, in addition to local heat and freshwater fluxes. The southward cold-water transport from the Shandong coast and the northern YS plays a key role in the emergence of the western YSCWM core and its strengthening in early summer. Meanwhile, the northward intrusion of the Subei Shoal water also contributes to shaping the characteristics of the western YSCWM in summer and plays a key role in its quick demise in autumn. Here, we should note that in addition to major wind-driven seasonal currents, mixing, and tidal currents are also involved in shaping the seasonal evolution of the western YSCWM. The effect of mixing and tides are also accounted for in ROMS simulation and particle tracing experiments.
Our study has broad implications for the nutrient cycle and phytoplankton dynamics in the YS. Although with lower phytoplankton abundance than eutrophic coastal waters (Lu et al., 2021; Fu et al., 2024), the YSCWM participates in the occurrence of phytoplankton blooms through the nutrient cycle and thermodynamics. Yet, this effect is subjected to complex seasonal evolution, dictated by the seasonality of the YSCWM visited here. Formation of the YSCWM in summer strengthens the stratification, suppressing vertical exchanges. This causes accumulation of inorganic nutrients (such as nitrogen, phosphate and silicate) in the bottom waters from the settling and microbial decomposition of phytoplankton, reaching the peak level in autumn (accounting for >30% of the total nutrient of the entire southern YS; Guo et al., 2020). These nutrients are released to the euphotic zone in winter through the buoyancy and wind-driven mixing – a crucial precondition for phytoplankton growth in the following early spring. From April to May, as the YSCWM begins to form, the enhanced stratification traps the heat near the surface and causes rapid surface warming, leading to the outbreak of spring phytoplankton blooms (Guo et al., 2020). On the other hand, the YSCMW-induced stratification can also suppress upward nutrient supply and inhibit the blooms (Lu et al., 2021). In contrast, in the frontal zones surrounding the YSCWM, upwelling and mixing bring nutrients from the YSCWM to the euphotic zone and feed phytoplankton bloom outbreaks (Wei et al., 2020; Chen et al., 2025). Surface phytoplankton eventually settles into the bottom, and the subsequent decomposition releases nutrients and meanwhile consumes dissolved oxygen, leading to hypoxia and acidification conditions in the YSCWM (Guo et al., 2020; Wang et al., 2023). Through the complex dynamical and biogeochemical processes described above, the YSCWM regulates nutrient cycle and its seasonality, exerting multifaceted impacts on phytoplankton.
The YSCMW is also involved in horizontal nutrient transports of the YS (Wei et al., 2020; Song et al., 2022). The origins of the western YSCWM clarified in this study suggest possible terrestrial nutrient sources via the SDCC and SCC (Figure 8). Over the past two decades, the western YSCWM and surrounding coastal waters have experienced increased phytoplankton blooms of diverse algae species (Kong et al., 2018; Song et al., 2022; Feng et al., 2023). Ocean currents play a vital role in the spread and proliferation of blooming algae. For instance, during the recurring outbursts of the prominent “green tide” caused by Ulva prolifera (Sun et al., 2008), the SCC transports the macroalgae northward to the Shandong coast, along with the nutrient supply of upwelling in frontal zones, facilitating the expansion of Ulva prolifera over large areas (Wei et al., 2020; Li D. et al., 2021; Chen et al., 2025). The role of the YSCMW in the long-term change of algal blooms under trends of greenhouse warming and eutrophication warrants further investigation.
As a seasonally appearing, bottom-trapped cold water on continental shelf, the YSCWM is analogous to the well-known Mid-Atlantic Bight Cold Pool (MABCP) (Houghton et al., 1982; Coakley et al., 2016; Chen et al., 2018). Both similarities and differences exist between the two waters, in characteristics, seasonal evolution, and formation mechanism. Located along the northeastern coast of US, the MABCP is characterized by properties of <10°C and <34 psu in summer, isolated from the surface warm water of >20°C by a seasonal thermocline and separated from the warmer and saltier slope water by a front to the east (Chen et al., 2018). Like the YSCWM, the MABCP begins to form in spring and fades in autumn due to wind-driven mixing (Coakley et al., 2016). Compared to the YSCMW in the semi-closed YS basin, the large-scale circulation plays a more important role in the formation and maintenance of the MABCP. Transport from the upstream in the north has been identified as a critical driver in its seasonal evolution (Chen et al., 2018), while inflow of Arctic waters also contribute to the source of the MABCP (Chen et al., 2018; Friedland et al., 2022). In contrast to the YSCWM, the MABCP reaches the maximum strength in May or June, decays in summer, disappears in around mid-September (Lentz, 2017; Chen et al., 2018).
Both waters play crucial roles in sustaining local ecosystems and show vulnerability to climate change. Variability of the MABCP significantly influences the recruitment and settlement of several cold-temperatures fish species (Miller et al., 2016), while the warming of the YSCMW has been linked to reduced catches of cold-water fishes in the YS (Ma et al., 2019). Over the past several decades, the MABCP has shown an overall trend of warming and shrinking, which is particularly prominent since 2008 (Friedland et al., 2022). Similarly, a warming trend has also been detected in the core region of the YSCMW (Guo et al., 2021; Zhai et al., 2025). These changes are likely to have profound implications for local fisheries and biodiversity - a subject of our ongoing research.
In this study, we adopt an off-line particle tracing strategy using 4-hour velocity fields generated by a ROMS simulation. Admittedly, the results of ROMS simulation and Lagrangian particle tracing are subjected to uncertainties rooted in the methodology. An online tracing can more realistically reflect the flow pathways of water masses. Our results suggest robust contributions of the northern YS and Subei Shoal to the YSCWM, which still demand the confirmation with online tracing experiments. In addition, the ROMS simulation used here adopts CFSv2 as the surface atmospheric forcing fields, which have been validated in the YS by existing studies (Gao et al., 2020; He et al., 2022). Simulations with other models and forcing fields can consolidate the findings and understanding achieved in this study.
The western YSCWM is a unique feature of the southwestern YS and plays a vital role in regulating the biogeochemical cycles and functions of ecosystems. The low-temperature and nutrient-rich features of the western YSCWM support the sustainable aquaculture, benthic biological communities, and fishery resources of the southwestern YS. However, compared to the northern and eastern components of the YSCWM, our understanding of the western YSCWM remains fragmental. Particularly, a consensus on its origin is still lacking among existing studies. This study provides a thorough investigation of seasonal evolution and origins of the western YSCWM through analyzing in-situ observational data collected by research cruises of the IOCAS and Lagrangian particle tracing experiments. The findings are summarized as follows.
1. In-situ observations during 2006-2007 and 2014-2017 suggest that the western YSCWM begins to form in spring and bears a tight connection to the colder coastal waters near the Shandong Peninsula. The western YSCWM fully emerges in summer and achieves the coldest subsurface temperature than other seasons.
2. The cooling of the western YSCWM in spring and summer cannot be explained by local processes such as the remaining winter water. Alternatively, cold-water advection from other areas is crucial in shaping or maintaining the cold and low-salinity features of the western YSCWM.
3. Lagrangian tracing experiments based on ROMS simulation confirm that the seasonal evolution of western YSCWM is primarily controlled by the seasonal near-bottom circulation of the YS. Particularly, the southward cold-water transport from the Shandong coast and the northern YS plays a key role in the emergence of the western YSCWM and in strengthening its cold temperature in early summer.
4. For the first time, we reveal a contribution of the Subei Shoal water to the western YSCMW via the SCC in spring and summer. Critically, the northward warm water transport from the Subei Shoal compels the quick vanish of the western YSCMW from late summer to early autumn.
These findings are helpful in improving our knowledge of the YSCWM in its formation, seasonal evolution, and budgets of heat and materials. In situ observations indicate that the YSCWM has shown complex property changes under global warming. During the past decades, the western YSCWM showed an overall warming trend, while the eastern YSCWM showed a likely cooling trend (Li et al., 2017; Park et al., 2015). Changes in the YSCMW have profound impacts on the environment and marine biosystems of the YS. Particularly, the slower warming rates in the YSCWM than those of the surface water enhance the thermal stratification and suppress the vertical exchanges of nutrients and oxygen, along with the increased outbreaks of phytoplankton bloom, leading to increasing hypoxia and acidification events in coastal waters and threatening the benthic communities (Guo et al., 2020; Doney et al., 2020). However, the observations of the YSCWM are still quite sparse and subjected to sampling issues in spatial coverage and temporal continuity. This leads to substantial uncertainties in the detection and understanding of the long-term change of the YSCWM and its impacts on marine ecosystems. To better support the prediction and sustainable development of surrounding countries, enhanced ocean subsurface observations in the YS are required.
The data supporting the conclusions of this article will be made available by the authors, without undue reservation.
CW: Conceptualization, Data curation, Formal analysis, Funding acquisition, Investigation, Methodology, Project administration, Resources, Software, Validation, Visualization, Writing – original draft, Writing – review & editing. XT: Conceptualization, Formal analysis, Methodology, Validation, Writing – original draft, Writing – review & editing. KG: Formal analysis, Methodology, Software, Visualization, Writing – review & editing. AX: Formal analysis, Methodology, Software, Visualization, Writing – review & editing. YL: Formal analysis, Funding acquisition, Validation, Visualization, Writing – original draft, Writing – review & editing. YJ: Formal analysis, Methodology, Software, Writing – review & editing. ZR: Formal analysis, Methodology, Software, Writing – review & editing. FY: Conceptualization, Data curation, Funding acquisition, Investigation, Methodology, Project administration, Resources, Supervision, Validation, Writing – review & editing.
The author(s) declare that financial support was received for the research and/or publication of this article. This study is supported by the National Natural Science Foundation of China (41206020), the Laoshan Laboratory (LSKJ202202601), the Strategic Priority Research Program of the Chinese Academy of Sciences (XDA11020301), the Youth Innovation Promotion Association of CAS (2019211), and the National Research and Development Plan (2022YFC3104100).
We thank two reviewers for providing comments. We would thank all the personnel of R/V Science No. 3 for their contribution to the data acquisition. We acknowledge the support of the Ocean Science Data Center, IOCAS.
The authors declare that the research was conducted in the absence of any commercial or financial relationships that could be construed as a potential conflict of interest.
The author(s) declare that no Generative AI was used in the creation of this manuscript.
All claims expressed in this article are solely those of the authors and do not necessarily represent those of their affiliated organizations, or those of the publisher, the editors and the reviewers. Any product that may be evaluated in this article, or claim that may be made by its manufacturer, is not guaranteed or endorsed by the publisher.
The Supplementary Material for this article can be found online at: https://www.frontiersin.org/articles/10.3389/fmars.2025.1556069/full#supplementary-material
Beardsley R. C., Limeburner R., Kim K., Candela J. (1992). Lagrangian flow observations in the East China, Yellow and Japan Seas. La Mer 30, 297–314.
Chapman D. (1985). Numerical treatment of cross-shelf open boundaries in a barotropic coastal ocean model. J. Phys. Oceanogr. 15, 1060–1075. doi: 10.1175/1520-0485(1985)015<1060:NTOCSO>2.0.CO;2
Chen Z., Curchitser E., Chant R., Kang D. (2018). Seasonal variability of the cold pool over the Mid-Atlantic Bight continental shelf. J. Geophysical Research: Oceans 123, 8203–8226. doi: 10.1029/2018JC014148
Chen L., Li T., Wang B., Wang. L. (2017). Formation mechanism for 2015/16 super el niño. Sci. Rep. 7, 2975. doi: 10.1038/s41598-017-02926-3
Chen X., Mi T., Yu Z., Yang F., Wang K., Zhang S., et al. (2025). Upwelling of cold water in the South Yellow Sea alleviates phosphorus and silicon limitations. Limnol. Oceanogr. 9999, 1–14. doi: 10.1002/lno.12784
Chi Y., Rong Z. (2023). Effects of breaking and non-breaking surface wave mixing on the Changjiang River plume dynamics in summer. J. Geophysical Research: Oceans 128, e2022JC019501. doi: 10.1029/2022jc019501
Coakley S. J., Miles T., Kohut J., Roarty H. (2016). “Interannual variability and trends in the Middle Atlantic Bight cold pool,” in OCEANS 2016 MTS/IEEE Monterey, Monterey (New York, NY, United States: IEEE). 1–6. doi: 10.1109/OCEANS.2016.7761184
Dagestad K.-F., Röhrs J., Breivik Ø., Ådlandsvik B. (2018). OpenDrift v1.0: a generic framework for trajectory modelling. Geoscientific Model. Dev. 11, 1405–1420. doi: 10.5194/gmd-11-1405-2018
Diao X., Si G., Wei C., Yu F. (2022). Structure and formation of the South Yellow Sea water mass in the spring of 2007. J. Oceanol. Limnol. 40, 55–65. doi: 10.1007/s00343-021-0206-y
Doney S. C., Busch D. S., Cooley S. R., Kroeker K. J. (2020). The impacts of ocean acidification on marine ecosystems and reliant human communities. Annu. Rev. Environ. Resour. 45, 83–112. doi: 10.1146/annurev-environ-012320-083019
Dong S. (2019). Researching progresses prospects in large Salmonidae farming in Cold Water Mass of Yellow Sea. Periodical Ocean Univ. China 49, 1–6. doi: 10.16441/j.cnki.hdxb.20180303
Feng Y., Xiong Y., Hall-Spencer J. M., Liu K., Beardall J., Gao K., et al. (2023). Shift in algal blooms from micro- to macroalgae around China with increasing eutrophication and climate change. Global Change Biol. 30 (1), e17018. doi: 10.1111/gcb.17018
Flather R. A. (1976). A tidal model of northwest European continental shelf. Memoires Societe Royale Des. Sci. Liege 10, 141–164.
Friedland K., Miles T., Goode A., Powell E., Brady D. (2022). The Middle Atlantic Bight Cold Pool is warming and shrinking: Indices from in situ autumn seafloor temperatures. Fisheries Oceanogr. 31, 217–223. doi: 10.1111/fog.12573
Fu X., Shi W., Liu Z., Wang X., Zhang G., Sun J. (2024). Impact of environmental variables on the distribution of phytoplankton communities in the Southern Yellow Sea. Environ. Res. 243, 117862. doi: 10.1016/j.envres.2023.117862
Gao G., Marin M., Feng M., Yin B., Yang D., Feng X., et al. (2020). Drivers of marine heatwaves in the East China Sea and the South Yellow Sea in three consecutive summers during 2016– 2018. J. Geophysical Research: Oceans 125, e2020JC016518. doi: 10.1029/2020JC016518
Guan B. X. (1963). A preliminary study of the temperature variations and the characteristics of the circulation of the cold water mass of the Yellow Sea. Oceanologia Limnologia Sin. 5, 255–284.
Guo Y., Mo D., Hou Y. (2021). Interannual to interdecadal variability of the southern yellow sea cold water mass and establishment of “Forcing mechanism bridge. J. Mar. Sci. Eng. 9, 1316. doi: 10.3390/jmse9121316
Guo Y., Rong Z., Li B., Zhao X., Li P., Li X. (2019). Physical processes causing the formation of hypoxia off the Changjiang estuary after Typhoon Chan-hom 2015. J. Oceanol. Limnol. 37, 1–17. doi: 10.1007/s00343-019-7336-5
Guo J., Yuan H., Song J., Li X., Duan L. (2020). Hypoxia, acidification and nutrient accumulation in the Yellow Sea Cold Water of the South Yellow Sea. Sci. Total Environ. 745, 141050. doi: 10.1016/j.scitotenv.2020.141050
Haidvogel D. B., Arango H. G., Hedstrom K., Beckmann A., Malanotte-Rizzoli P., Shchepetkin A. F. (2000). Model evaluation experiments in the North Atlantic Basin: simulations in nonlinear terrain-following coordinates. Dynamics Atmospheres Oceans 32, 239–281. doi: 10.1016/s0377-0265(00)00049-x
Hao J., Chen Y., Wang F. (2012). Long-term variability of the sharp thermocline in the Yellow and East China Seas. Chin. J. Oceanol. Limnol. 30, 1016–1025. doi: 10.1007/s00343-012-1251-3
He C. B., Wang Y. X., Lei Z. Y., Xu S. (1959). A preliminary study of the formation and its properties of the Yellow Sea Cold Water Mass. Oceanologia Limnologia Sin. 2, 11–15.
He Z., Zhu S., Sheng J. (2022). Numerical study of circulation and seasonal variability in the southwestern yellow sea. J. Mar. Sci. Eng. 10, 912. doi: 10.3390/jmse10070912
Houghton R. W., Schlitz R., Beardsley R. C., Butman B., Chamberlin J. L. (1982). The Middle Atlantic Bight cold pool: Evolution of the temperature structure during summer 1979. J. Phys. Oceanogr. 12, 1019–1029. doi: 10.1175/1520-0485(1982)012<1019:TMABCP>2.0.CO;2
Hu D., Cui M., Li Y., Qu T. (1991). On the Yellow Sea Cold Water Mass related circulation. Yellow Sea Res. 4, 79–88.
Hu D., Wang Q. (2004). Interannual variability of the southern Yellow Sea Cold Water Mass. Chin. J. Oceanol. Limnol. 22, 231–236. doi: 10.1007/bf02842553
Hu Y., Yu F., Si G., Sun F., Liu X., Diao X., et al. (2024). The seasonal evolution of the Yellow Sea Cold Water Mass Circulation: Roles of fronts, thermoclines, and tidal rectification. Ocean Model. 190, 102375. doi: 10.1016/j.ocemod.2024.102375
Jin S., Sun J., Wei Z. (2017). Effects of the seasonal variability of the Bohai Sea Coastal Current on the Qingdao Cold Water Mass. Advance Mar. Sci. 35, 317–328.
Kong F., Jiang P., Wei C., Zhang Q., Li J., Liu Y., et al. (2018). Co-occurence of green tide, golden tide and red tides along the 35°N transect in the Yellow Sea during Spring and Summer in 2017. Oceanologia Limnologia Sin. 49, 1021–1030.
Lee S.-H., Beardsley R. C. (1999). Influence of stratification on residual tidal currents in the Yellow Sea. J. Geophysical Research: Oceans 104, 15679–15701. doi: 10.1029/1999jc900108
Lentz S. J. (2017). Seasonal warming of the middle atlantic bight cold pool. J. Geophysical Research: Oceans 122, 941–954. doi: 10.1002/2016JC012201
Li D., Gao Z., Song D. (2021). Analysis of environmental factors affecting the large-scale long-term sequence of green tide outbreaks in the Yellow Sea. Estuarine Coast. Shelf Sci. 260, 107504. doi: 10.1016/j.ecss.2021.107504
Li J., Jiang F., Wu R., Zhang C., Tian Y., Sun P., et al. (2021). Tidally induced temporal variations in growth of young-of-the-year Pacific cod in the Yellow Sea. J. Geophysical Research: Oceans 126, e2020JC016696. doi: 10.1029/2020jc016696
Li J., Li G., Xu J., Dong P., Qiao L., Liu S., et al. (2016). Seasonal evolution of the Yellow Sea Cold Water Mass and its interactions with ambient hydrodynamic system. J. Geophysical Research: Oceans 121, 6779–6792. doi: 10.1002/2016jc012186
Li A., Yu F., Si G., Wei C. (2017). Long-term temperature variation of the Southern Yellow Sea Cold Water Mass from 1976 to 2006. Chin. J. Oceanol. Limnol. 35, 1032–1044. doi: 10.1007/s00343-017-6037-1
Lie H.-J., Cho C.-H. (2016). Seasonal circulation patterns of the Yellow and East China Seas derived from satellite-tracked drifter trajectories and hydrographic observations. Prog. Oceanogr. 146, 121–141. doi: 10.1016/j.pocean.2016.06.004
Liu C., Chen X., Wang C., Liu Z., Jia S., Wang X. (2024). Review on seasonal and interannual variation characteristics of low temperature center in the Yellow Sea cold water mass. Mar. Environ. Sci. 43, 475–488.
Liu Z., Gan J., Hu J., Wu H., Cai Z., Deng Y. (2021). Progress on circulation dynamics in the East China Sea and southern Yellow Sea: Origination, pathways, and destinations of shelf currents. Prog. Oceanogr. 193, 102553. doi: 10.1016/j.pocean.2021.102553
Liu X., Yu F., Chen Z., Si G., Nan F., Wang J., et al. (2024). The critical role of thermal stratification associated with the Yellow Sea Cold Water Mass in modulating winter sea surface temperature. J. Geophysical Research: Oceans 129, e2023JC020373. doi: 10.1029/2023jc020373
Lu X., Liu C., Niu Y., Yu S. (2021). Long-term and regional variability of phytoplankton biomass and its physical oceanographic parameters in the Yellow Sea, China. Estuarine Coast. Shelf Sci. 260, 107497. doi: 10.1016/j.ecss.2021.107497
Ma S., Liu Y., Li J., Fu C., Ye Z., Sun P. (2019). Climate-induced long-term variations in ecosystem structure and atmosphere-ocean-ecosystem processes in the Yellow Sea and East China Sea. Prog. Oceanogr. 175, 183–197. doi: 10.1016/j.pocean.2019.04.008
Miller T. J., Hare J. A., Alade L. A. (2016). A state-space approach to incorporating environmental effects on recruitment in an age-structured assessment model with an application to southern New England yellowtail flounder. Can. J. Fisheries Aquat. Sci. 73, 1–10. doi: 10.1139/cjfas-2015-0339
Moon J.-H., Hirose N., Yoon J.-H. (2009). Comparison of wind and tidal contributions to seasonal circulation of the Yellow Sea. J. Geophysical Res. 114, C08016. doi: 10.1029/2009jc005314
Orlanski I. (1976). A simple boundary condition for unbounded hyperbolic flows. J. Comput. Phys. 21, 251–269. doi: 10.1016/0021-9991(76)90023-1
Park S., Chu P. C., Lee J.-H. (2011). Interannual-to-interdecadal variability of the Yellow Sea Cold Water Mass in 1967–2008: Characteristics and seasonal forcings. J. Mar. Syst. 87, 177–193. doi: 10.1016/j.jmarsys.2011.03.012
Park K.-A., Lee E.-Y., Chang E., Hong S. (2015). Spatial and temporal variability of sea surface temperature and warming trends in the Yellow Sea. J. Mar. Syst. 143, 24–38. doi: 10.1016/j.jmarsys.2014.10.013
Saha S., Moorthi S., Wu X., Wang J., Nadiga S., Tripp P., et al. (2014). The NCEP climate forecast system version 2. J. Climate 27, 2185–2208. doi: 10.1175/JCLI-D-12-00823.1
Song M., Yan T., Kong F., Wang Y., Zhou M. (2022). Increased diversity and environmental threat of harmful algal blooms in the Southern Yellow Sea, China. J. Oceanol. Limnol. 40, 2107–2119. doi: 10.1007/s00343-021-1209-4
Su J. L., Huang D. J. (1995). On the current field associated with the Yellow Sea Cold Water Mass. Oceanologia Limnologia Sin. 26, 1–7.
Sun S., Wang F., Li C. L., Qin S., Zhou M. J., Ding L. P., et al. (2008). Emerging challenges: Massive green algae blooms in the Yellow Sea. Nat. Precedings 2266, 1e5. doi: 10.1038/npre.2008.2266.1
Tang X., Wang F., Chen Y., Bai H., Hu D. (2004). Current observations in the southern Yellow Sea in summer. Chin. J. Oceanol. Limnol. 22, 217–223. doi: 10.1007/bf02842551
Tang Y., Zou E., Lie H.-J., Lie J.-H. (2000). Some features of circulation in the southern Huanghai Sea. Acta Oceanologica Sin. 22, 1–16.
Teague W. J., Jacobs G. A. (2000). Current observations on the development of the Yellow Sea Warm Current. J. Geophysical Research: Oceans 105, 3401–3411. doi: 10.1029/1999jc900301
Uda M. (1934). Hydrographical researches on the normal monthly conditions in the Japan Sea, the Yellow Sea, and the Okhotsk Sea. J. Imperial Fishery Exp. Station 5, 191–236.
Wang B., Hirose N., Kang B., Takayama K. (2014). Seasonal migration of the yellow sea bottom cold water. J. Geophysical Research: Oceans 119, 4430–4443. doi: 10.1002/2014jc009873
Wang F., Li X., Tang X., Sun X., Zhang J., Yang D., et al. (2023). The seas around China in a warming climate. Nat. Rev. Earth Environ. 4, 535–551. doi: 10.1038/s43017-023-00453-6
Wei H., Shi J., Lu Y., Peng Y. (2010). Interannual and long-term hydrographic changes in the Yellow Sea during 1977–1998. Deep Sea Res. Part II: Topical Stud. Oceanogr. 57, 1025–1034. doi: 10.1016/j.dsr2.2010.02.004
Wei Q., Wang B., Fu M., Sun J., Yao Q., Xin M., et al. (2020). Spatiotemporal variability of physical-biogeochemical processes and intrinsic correlations in the semi-enclosed South Yellow Sea. Acta Oceanologica Sin. 39, 11–26. doi: 10.1007/s13131-020-1656-3
Wei Q., Yu Z., Ge R., Wang H., Wang B. (2013). Chemicohydrographic analysis of the role of the Yellow Sea western coastal cold water in forming the southern Yellow Sea western bottom cold water and its seasonal succession. Oceanologia Limnologia Sin. 44, 890–905.
Wu L., Wei Q., Ran X., Sun J., Wang B. (2021). Dissolved oxygen distributions, hypoxic and acidification characteristics, and their controlling factors in the southern Yellow Sea and off the Changjiang Estuary. China Environ. Sci. 41, 1311–1324.
Xia C., Qiao F., Yang Y., Ma J., Yuan Y. (2006). Three-dimensional structure of the summertime circulation in the Yellow Sea from a wave-tide-circulation coupled model. J. Geophysical Res. 111, C11S03. doi: 10.1029/2005jc003218
Xin M., Ma D., Wang B. (2015). Chemicohydrographic characteristics of the yellow sea cold water mass. Acta Oceanologica Sin. 34, 5–11. doi: 10.1007/s13131-015-0681-0
Xu Y., Ma L., Sui J., Li X., Wang H., Zhang B. (2022). Potential effects of climate change on the habitat suitability of macrobenthos in the Yellow Sea and East China Sea. Mar. pollut. Bull. 174, 113238. doi: 10.1016/j.marpolbul.2021.113238
Yu F., Ren Q., Diao X. Y., Wei C. J., Hu Y. B. (2022). The sandwich structure of the southern yellow sea cold water mass and yellow sea warm current. Front. Mar. Sci. 8. doi: 10.3389/fmars.2021.767850
Yu F., Zhang Z., Diao X., Guo J. (2010). Observational evidence of the Yellow Sea warm current. Chin. J. Oceanol. Limnol. 28, 677–683. doi: 10.1007/s00343-010-0006-2
Yu F., Zhang Z. X., Diao X. Y., Guo J. S., Tang Y. X. (2006). Analysis of evolution of the Huanghai Sea Cold Water Mass and its relationship with adjacent water masses. Acta Oceanologia Sin. 28, 26–34.
Zhai F., Yu B., Dong Y., Gu Y., Liu Z., Li P. (2025). Three-dimensional structure of interannual-to-decadal variations in water temperature in the Yellow Sea during 1998–2021. Climate Dynamics 63, 61. doi: 10.1007/s00382-024-07537-z
Zhang B., Cheng L., Tan Z., Gouretski V., Li F., Pan Y., et al. (2024). CODC-v1: a quality-controlled and bias-corrected ocean temperature profile database from 1940–2023. Sci. Data 11, 666. doi: 10.1038/s41597-024-03494-8
Zhang Q. L., Liu X. Q., Cheng M. H., Yu X. S. (2002). Characteristics and formation causes of Qingdao Cold Water Mass. Chin. J. Oceanol. Limnol. 20, 303–308. doi: 10.1007/bf02847919
Zhang S. W., Wang Q. Y., Lü Y., Cui H., Yuan Y. L. (2008). Observation of the seasonal evolution of the Yellow Sea Cold Water Mass in 1996–1998. Continental Shelf Res. 28, 442–457. doi: 10.1016/j.csr.2007.10.002
Zhang J., Zhang S., Zhang S., Du Y., Xu F. (2016). What has happened to the benthic mollusks of the Yellow Sea in the near half century? Comparison on molluscan biodiversity between 1959 and 2007. Continental Shelf Res. 113, 21–29. doi: 10.1016/j.csr.2015.12.004
Keywords: Yellow Sea Cold Water Mass, seasonal circulation, water mass, ROMS, Yellow Sea
Citation: Wei C, Tang X, Ge K, Xu A, Li Y, Jiang Y, Rong Z and Yu F (2025) Observed seasonal evolution and origins of the western Yellow Sea Cold Water Mass. Front. Mar. Sci. 12:1556069. doi: 10.3389/fmars.2025.1556069
Received: 06 January 2025; Accepted: 12 March 2025;
Published: 31 March 2025.
Edited by:
Borja Aguiar-González, University of Las Palmas de Gran Canaria, SpainReviewed by:
Travis N. Miles, The State University of New Jersey, United StatesCopyright © 2025 Wei, Tang, Ge, Xu, Li, Jiang, Rong and Yu. This is an open-access article distributed under the terms of the Creative Commons Attribution License (CC BY). The use, distribution or reproduction in other forums is permitted, provided the original author(s) and the copyright owner(s) are credited and that the original publication in this journal is cited, in accordance with accepted academic practice. No use, distribution or reproduction is permitted which does not comply with these terms.
*Correspondence: Fei Yu, eXVmQHFkaW8uYWMuY24=; Xiaohui Tang, dGFuZ3hpYW9odWlAcWRpby5hYy5jbg==
Disclaimer: All claims expressed in this article are solely those of the authors and do not necessarily represent those of their affiliated organizations, or those of the publisher, the editors and the reviewers. Any product that may be evaluated in this article or claim that may be made by its manufacturer is not guaranteed or endorsed by the publisher.
Research integrity at Frontiers
Learn more about the work of our research integrity team to safeguard the quality of each article we publish.