 Mingxian Guo1,2
 Peng Xiu
 Kuanbo Zhou
94% of researchers rate our articles as excellent or good
Learn more about the work of our research integrity team to safeguard the quality of each article we publish.
Find out more
ORIGINAL RESEARCH article
Front. Mar. Sci., 03 April 2025
Sec. Marine Biogeochemistry
Volume 12 - 2025 | https://doi.org/10.3389/fmars.2025.1554932
The 234Th–238U pair technique is widely used in estimating particulate organic carbon (POC) flux, typically with a steady-state (SS) assumption. There is often a temporal bias between the SS-derived and actual POC fluxes caused by neglecting the temporal change in 234Th. However, this temporal bias has not been fully investigated due to the lack of continuous sampling of 234Th profiles and sediment traps. Here, we develop a radioactive trace model of 234Th built on a physical–biogeochemical model to simulate the scavenging of 234Th in the water column by POC sinking processes at the South East Asia time series (SEATS) site. The seasonal patterns of the 234Th profiles simulated by the model generally compared well with in situ observations. Analysis based on the model simulation suggests that the temporal bias can be depicted and reproduced in a simplified 234Th continuity equation. By obtaining an analytical solution for the SS-derived POC flux from the simplified 234Th equation, we found that the temporal bias results from the phase difference in time between the SS-derived and direct sinking POC fluxes. To provide a method that does not need repeated samplings to reduce this temporal bias for in situ observations, a modification term was constructed for the SS-derived POC flux from the analytical solution. Applying this term to the data obtained at the Bermuda Atlantic time series and SEATS reduced the bias by up to 67% and 34%, respectively. This study provides a feasible way to improve 234Th-derived POC flux under the SS assumption.
The ocean’s biological pumps are a primary pathway for sequestering atmospheric carbon dioxide (CO2) through the gravitational sinking of particulate organic carbon (POC), significantly mitigating global warming (DeVries et al., 2017; Terhaar et al., 2021; Boyd et al., 2019; DeVries et al., 2019; Friedlingstein et al., 2020). However, there is a challenge in quantifying the magnitude of POC export flux, as discrepancies in magnitudes exist among different assessments (DeVries et al., 2019; Gruber et al., 2019; Hauck et al., 2020; Iida et al., 2021; Ceballos-Romero et al., 2022).
Currently, POC flux is widely estimated using sediment traps, which directly collect sinking particles from the water column to quantify flux (Buesseler et al., 2007; Lamborg et al., 2008; Owens et al., 2013; Bourne et al., 2019; Baker et al., 2020; Estapa et al., 2020).
Radioactive pairs (mainly the 234Th–238U pair) are also used for POC flux estimation (Buesseler et al., 1992; Stewart et al., 2011; Ceballos-Romero et al., 2016; Umhau et al., 2019; Alkalay et al., 2020; Zhou et al., 2020). The 234Th (half-life of 24.1 days) produced from the radioactive decay of 238U (half-life of 4.47×10⁹ years) is expected to be in secular equilibrium with 238U in seawater. While the particle-adsorptive 234Th is scavenged by the downward flux of particles and redistributed by the transport of physical processes, the equilibrium is broken in the upper layer of the water column. With the steady-state assumption (SS) that the change in 234Th over time and physical transport is negligible, the downward 234Th flux at a depth of interest is equal to the deficit of 234Th–238U integrated over depth multiplied by a thorium decay constant λ (0.02876 d−1; e.g., Buesseler et al., 1992; Ceballos-Romero et al., 2018). Once the 234Th profile is obtained from the field measurements, the 234Th flux can be estimated using the SS model, and the POC flux is thus obtained by multiplying the 234Th flux by the POC:234Th ratio.
The 234Th–238U pair is used frequently because of its advantage in obtaining spatially and temporally resolved POC flux profiles (Buesseler et al., 1992; Umhau et al., 2019). However, inconsistencies have often been observed between SS-derived and sediment trap-estimated POC fluxes (e.g., Stewart et al., 2011; Le Moigne et al., 2013). Such discrepancies have been attributed to variable factors, such as the influence of physical processes (Buesseler et al., 2008; Resplandy et al., 2012; Stukel et al., 2017), uncertainties in trapping efficiency (Buesseler et al., 2007; Baker et al., 2020), and the POC:234Th ratio in the radioactive pair technique (Buesseler et al., 2006; Umhau et al., 2019). In addition, neglecting the temporal change in 234Th under the SS assumption may introduce biases compared with the actual sinking fluxes (Buesseler et al., 1992; Savoye et al., 2006; Buesseler et al., 2008; Ceballos-Romero et al., 2016, 2018). Previous studies showed that SS-derived POC fluxes might be underestimated during the pre-bloom period and overestimated during the post-bloom period (Buesseler et al., 1992; Ceballos-Romero et al., 2018). To reduce the temporal bias, the non-steady state (NSS) method for the radioactive pair technique has been used, which resolves the changes in 234Th over time by repeated sampling of the same water mass (Savoye et al., 2006; Resplandy et al., 2012; Ceballos-Romero et al., 2018). However, the NSS model often has large uncertainties, as resampling the same water mass is not always applied (Savoye et al., 2006; Resplandy et al., 2012; Ceballos-Romero et al., 2018).
The temporal bias of the SS-derived POC flux has not been fully investigated due to the lack of continuous sampling of 234Th profiles and sediment traps. This study presents a model of radioactive isotopes 238U and 234Th that are included in a physical–biogeochemical model (ROMS-CoSiNE-234Th; described in Section 2) to simulate the scavenging of 234Th by sinking POC at the South East Asia Time-Series (SEATS; 116°E, 18°N) site. Using the model simulation, we diagnosed the continuity equation of 234Th to investigate the source of temporal bias between the SS-derived and direct sinking POC fluxes. The diagnosis analysis suggests that the temporal bias between the SS-derived and direct sinking POC flux can be depicted and reproduced in the simplified 234Th equation. We solved the simplified 234Th equation and obtained an analytical solution for the SS-derived POC flux. To provide a method that does not need repeated samplings to reduce this temporal bias for in situ observations, a modification term was then constructed for the SS-derived POC flux from the analytical solution and applied to field observations at the SEATS and the Bermuda Atlantic time series study (BATS; 31°50′N, 64°10′W) site by using satellite data.
A physical–biogeochemical model (ROMS-CoSiNE-234Th) that includes a 234Th module was constructed to compute the evolution of vertical 234Th profiles. The physical model was based on the Regional Ocean Modeling System (ROMS) and set up at SEATS with a vertical grid of 200 layers covering the depth from the surface to 2000 m. The Mellor and Yamada Level 2.5 (MY-2.5) turbulence closure scheme (Mellor and Yamada, 1982) was used for vertical mixing. Atmospheric forcing was applied using bulk formulas with six-hourly data of net surface shortwave radiation, net surface longwave radiation, 10 m height wind, 2 m height air temperature, mean sea level pressure, and specific humidity from the National Centers for Environmental Prediction (NCEP) Reanalysis II. The biogeochemical model was based on a modified version of the carbon, silicate, and nitrogen ecosystem (CoSiNE; Chai et al., 2002) model that includes two functional groups of phytoplankton [small phytoplankton (P1), diatoms (P2)], two chlorophyll groups [chlorophyll of P1 (Chl1) and P2 (Chl2)], two zooplankton groups [microzooplankton (Z1) and mesozooplankton (Z2)], small and large organic nitrogen detritus (PONS and PONL), biogenic silica (bSi), nitrate (NO3), ammonium (NH4), phosphate (PO4), silicate (Si(OH)4), dissolved oxygen (DO), dissolved inorganic carbon (DIC), and total alkalinity (TALK). The POC concentration in the CoSiNE model was quantified as the concentration of detritus and phytoplankton. Particles with slow and fast sinking rates in the observations (Villa-Alfageme et al., 2016; Tréguer et al., 2018; Boyd et al., 2019) were simulated as the groups of P1, P2, and PONS (sinking velocity<2 m/d) and the groups of PONL and bSi (sinking velocity >10 m/d), respectively (Supplementary Table S1). The CoSiNE model considers the processes of nutrient uptake, mortality, and grazing for phytoplankton, and fecal pellet production, predation, remineralization, aggregation, and sinking for detritus. The detailed equations for the CoSiNE model used in this study are listed in Ma et al. (2019). Initial conditions for nutrients and physical fields were derived from the World Ocean Atlas 2013 (WOA13), and the model was spun up with climatological monthly forcing of atmospheric conditions from the NCEP for 5 years. The adjusted biogeochemical and 234Th fields at the end of this spin-up were used as initial conditions for the realistic simulation, which was then integrated from 2004 to 2014, driven by real-time six-hourly NCEP atmospheric forcing.
As shown in the schematic diagram of the model (Figure 1), the 234Th module includes tracers of dissolved 234Th (234Thw) and particulate 234Th (234Thp; unit: dpm m−3) adsorbed onto P1, P2, Z1, Z2, PONS, PONL, and bSi (denoted 234ThP1, 234ThP2, 234ThZ1, 234ThZ2, 234ThPONL, 234ThPONS, and 234ThbSi). The continuity equation describing the total 234Th behaviors in the model includes the change in 234Th (total 234Th in the water) over time (Rate), the radioactive production decay of 234Th (Production-Decay), the direct 234Th flux due to sinking particles (sinking), and the 234Th change due to physical processes (PHY):
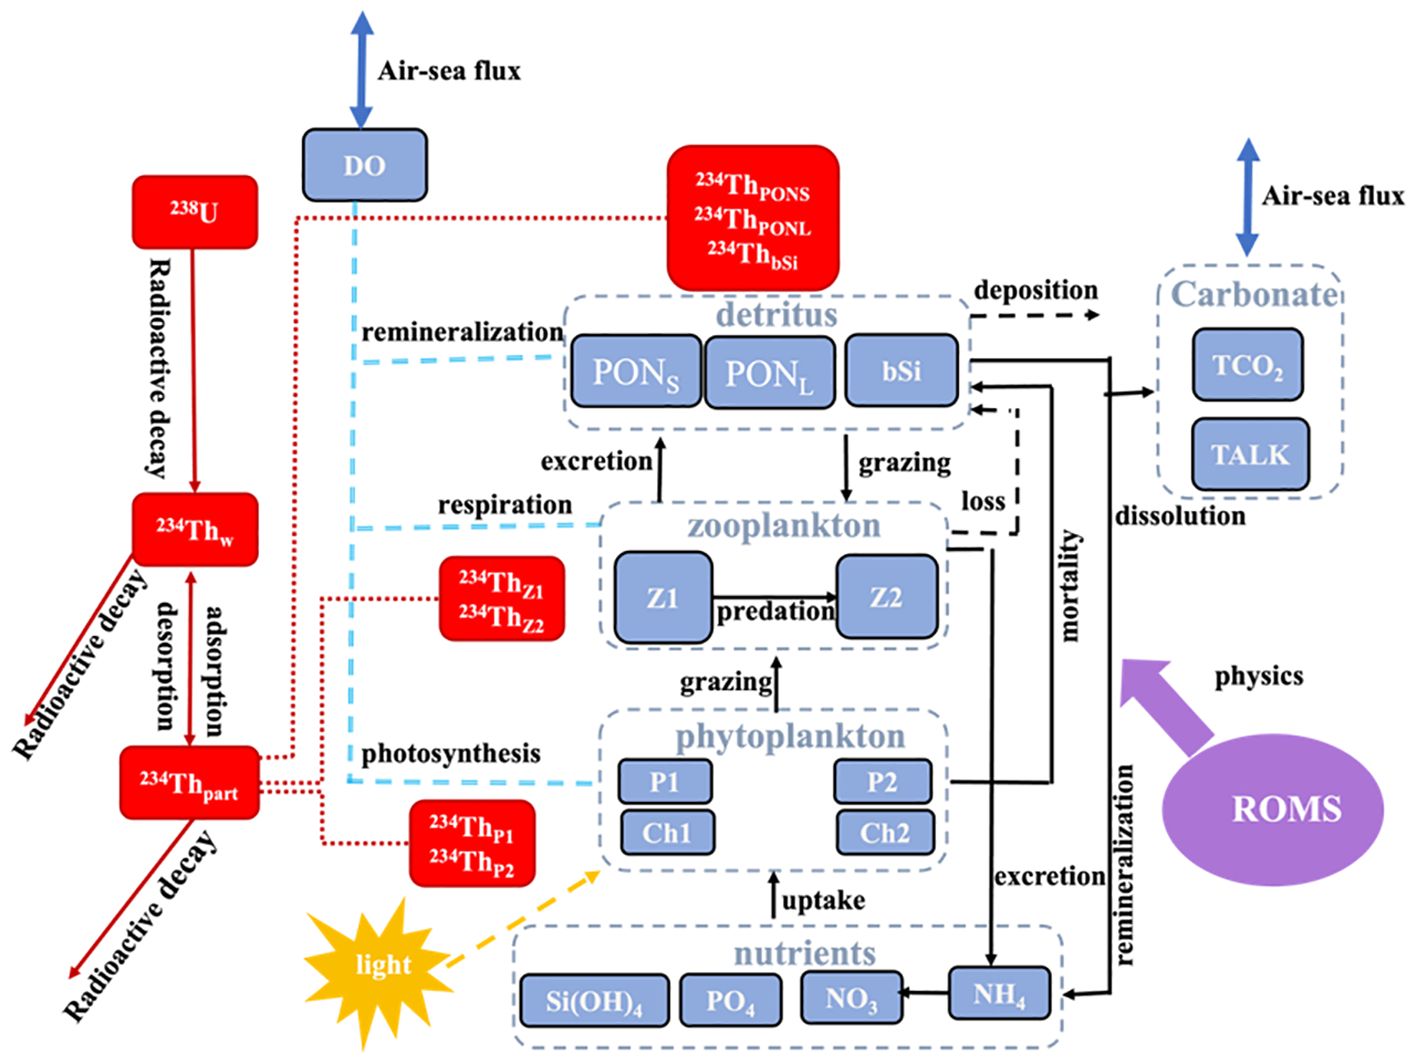
Figure 1. Schematic diagram of the CoSiNE-234Th model.
where λ and Wp are the decay constant (0.02876 d−1) and particle sinking rate (m d−1), respectively. In a one-dimensional framework, vertical diffusion (Vdiff) is the dominant term for the PHY term. Total 234Th is produced by the decay of 238U. Here, total 234Th represents the sum of 234Thw and 234Thp. The distributions of 234Thp are determined by the balance of adsorption and desorption processes (Dunne et al., 1997). Detailed equations and parameters for all 234Th processes are listed in Supplementary Data Sheet 1 - Text S1.
Since the time series of the 234Th profiles at SEATS were reproduced by the realistic simulation of the ROMS-CoSiNE-234Th model, the 234Th flux at 100 m that generally represents those directly measured by sediment traps (hereafter noted as Sinking) was calculated using the model outputs at 100 m (Equation 2):
where Wp is the particle sinking velocity (Supplementary Table S1). Following the approach in Buesseler et al. (1992), the SS-derived 234Th flux at 100 m (hereafter noted as SS) was calculated using the 238U-234Th deficit from the model outputs of the 234Th profiles (Equation 3):
Similar to the calculation of SS-derived 234Th flux, the NSS-derived 234Th flux (hereafter noted as NSS) accounts for the rate of 234Th and was obtained by Savoye et al. (2006) (Equation 4):
where 234Th1 and 234Th2 are the total 234Th concentrations at two different times from the model outputs, and Δt is their time interval. In this study, the temporal patterns of NSS with Δt=10 days [NSS (10d)] and Δt=60 days [NSS (60d)] were calculated. To avoid introducing the uncertainty of the POC: 234Th ratio to the temporal bias between the SS-derived and direct sinking POC fluxes simulated at SEATS, the direct sinking, SS-derived and NSS-derived 234Th fluxes calculated from the model outputs were converted to the POC flux by multiplying the same POC:234Th ratio of 4.9×10⁻³ mmol C/dpm. This POC:234Th ratio was estimated as the average over POC:234Th ratio at 100 m collected from 11 cruises between 2004 and 2014 at SEATS (Zhou et al., 2020).
In the ROMS-CoSiNE-234Th model, the total 234Th behaviors are described by the continuity equation of 234Th (Equation 1). To derive the analytical solutions for the 234Th-derived POC flux, we used a simplified continuity 234Th equation by ignoring the advection and diffusion terms in Equation 1 (e.g., Ceballos-Romero et al., 2018; de Soto et al., 2018):
By integrating each term of Equation 5 from the surface to a depth of Z, we obtained:
Let , , and P= ; then, Equation 6 is simplified as a differential equation with each term relevant to variable t:
The function of the particle direct sinking flux can be represented with a Fourier series:
where a0, ai, and bi are amplitudes, and ω is the angular frequency. Here, U is regarded as a constant. The analytical solution for TH is given by solving Equation 7:
where the constant c can be determined once an initial condition for TH is given. Hence, the analytical solution for the SS- and NSS-derived 234Th flux is given by:
where . SS(t) and NSS(t) represent the analytical solutions for the SS and NSS-derived 234Th fluxes. TH1 and TH2 are integrals of 234Th1 and 234Th2 over depth.
In situ data at SEATS collected from 11 cruises between 2004 and 2014 were used to validate the model simulation, including the temperature, salinity, chlorophyll, particulate 234Th, and total 234Th collected by 12-L Niskin bottles at multiple depths (Supplementary Table S2; Zhou et al., 2020). During this period, two sediment trap-estimated POC fluxes at 100 m at SEATS were obtained from Ho et al. (2010) and Wei et al. (2011). The sediment trap-estimated POC fluxes were used to evaluate the corrected results of the SS-derived POC flux at SEATS.
Satellite-derived POC flux as described in Supplementary Data Sheet 1 - Text S2 and micro-sized phytoplankton chlorophyll concentration [CHL(Micro)] obtained from the Copernicus Marine Environment Monitoring Service (CMEMS) were used to estimate the duration of the phytoplankton blooms at both SEATS and BATS.
To verify the developed correction method at BATS, the time series of POC flux estimated using sediment traps at 150 m was obtained from the BATS website. The SS-derived POC fluxes at 150 m near BATS (distance to BATS ≤ 150 km) were obtained from Buesseler et al. (2008) and Stewart et al. (2011). With this dataset, we tried to reduce the bias of SS-derived POC flux compared with the sediment trap-estimated POC flux.
To evaluate the ROMS-CoSiNE-234Th model’s ability to represent seasonal 234Th dynamics at SEATS, we compared realistic simulations (2004–2014) with in situ data from 11 cruises conducted between 2004 and 2014 (Supplementary Table S2; Zhou et al., 2020). These cruises, spanning a decade, represent the most extensive dataset available for SEATS to our knowledge. Comparisons were made over winter (December to February) and summer (June to August) seasons, focusing on temperature, salinity, chlorophyll, and 234Th profiles (Figure 2). In winter, in situ measurements showed small changes in the mixed layer, with temperature ranging from 23.2°C to 24.9°C, salinity from 33.7 to 33.9 PSU, chlorophyll from 0.21 to 0.46 mg/m³, and particulate 234Th from 280 to 450 dpm/m³. The model reproduced these homogeneous distributions well, yielding climatological averages of 25.1°C for temperature, 33.9 PSU for salinity, 0.25 mg/m³ for chlorophyll, and 505 dpm/m³ for particulate 234Th. Total 234Th from in situ data ranged from 1,500 to 2,400 dpm/m³, while the model overestimated this slightly, lacking a minimum observed at ~50 m depth, suggesting an underestimation of particle sinking in the setup. In summer, observations indicated a temperature decrease and salinity increase below a shallow mixed layer, with subsurface maxima in chlorophyll and particulate 234Th. The model reasonably captured these vertical distribution patterns and the large 234Th-238U deficits beneath the mixed layer depth (MLD), consistent with particle sinking effects (Zhou et al., 2020; Figure 2j). While the model’s performance supports its use for simulating 234Th dynamics, validation of the POC flux correction was limited to two concurrent sediment trap measurements at 100 m (Ho et al., 2010; Wei et al., 2011), reflecting the scarcity of such paired observations at SEATS.
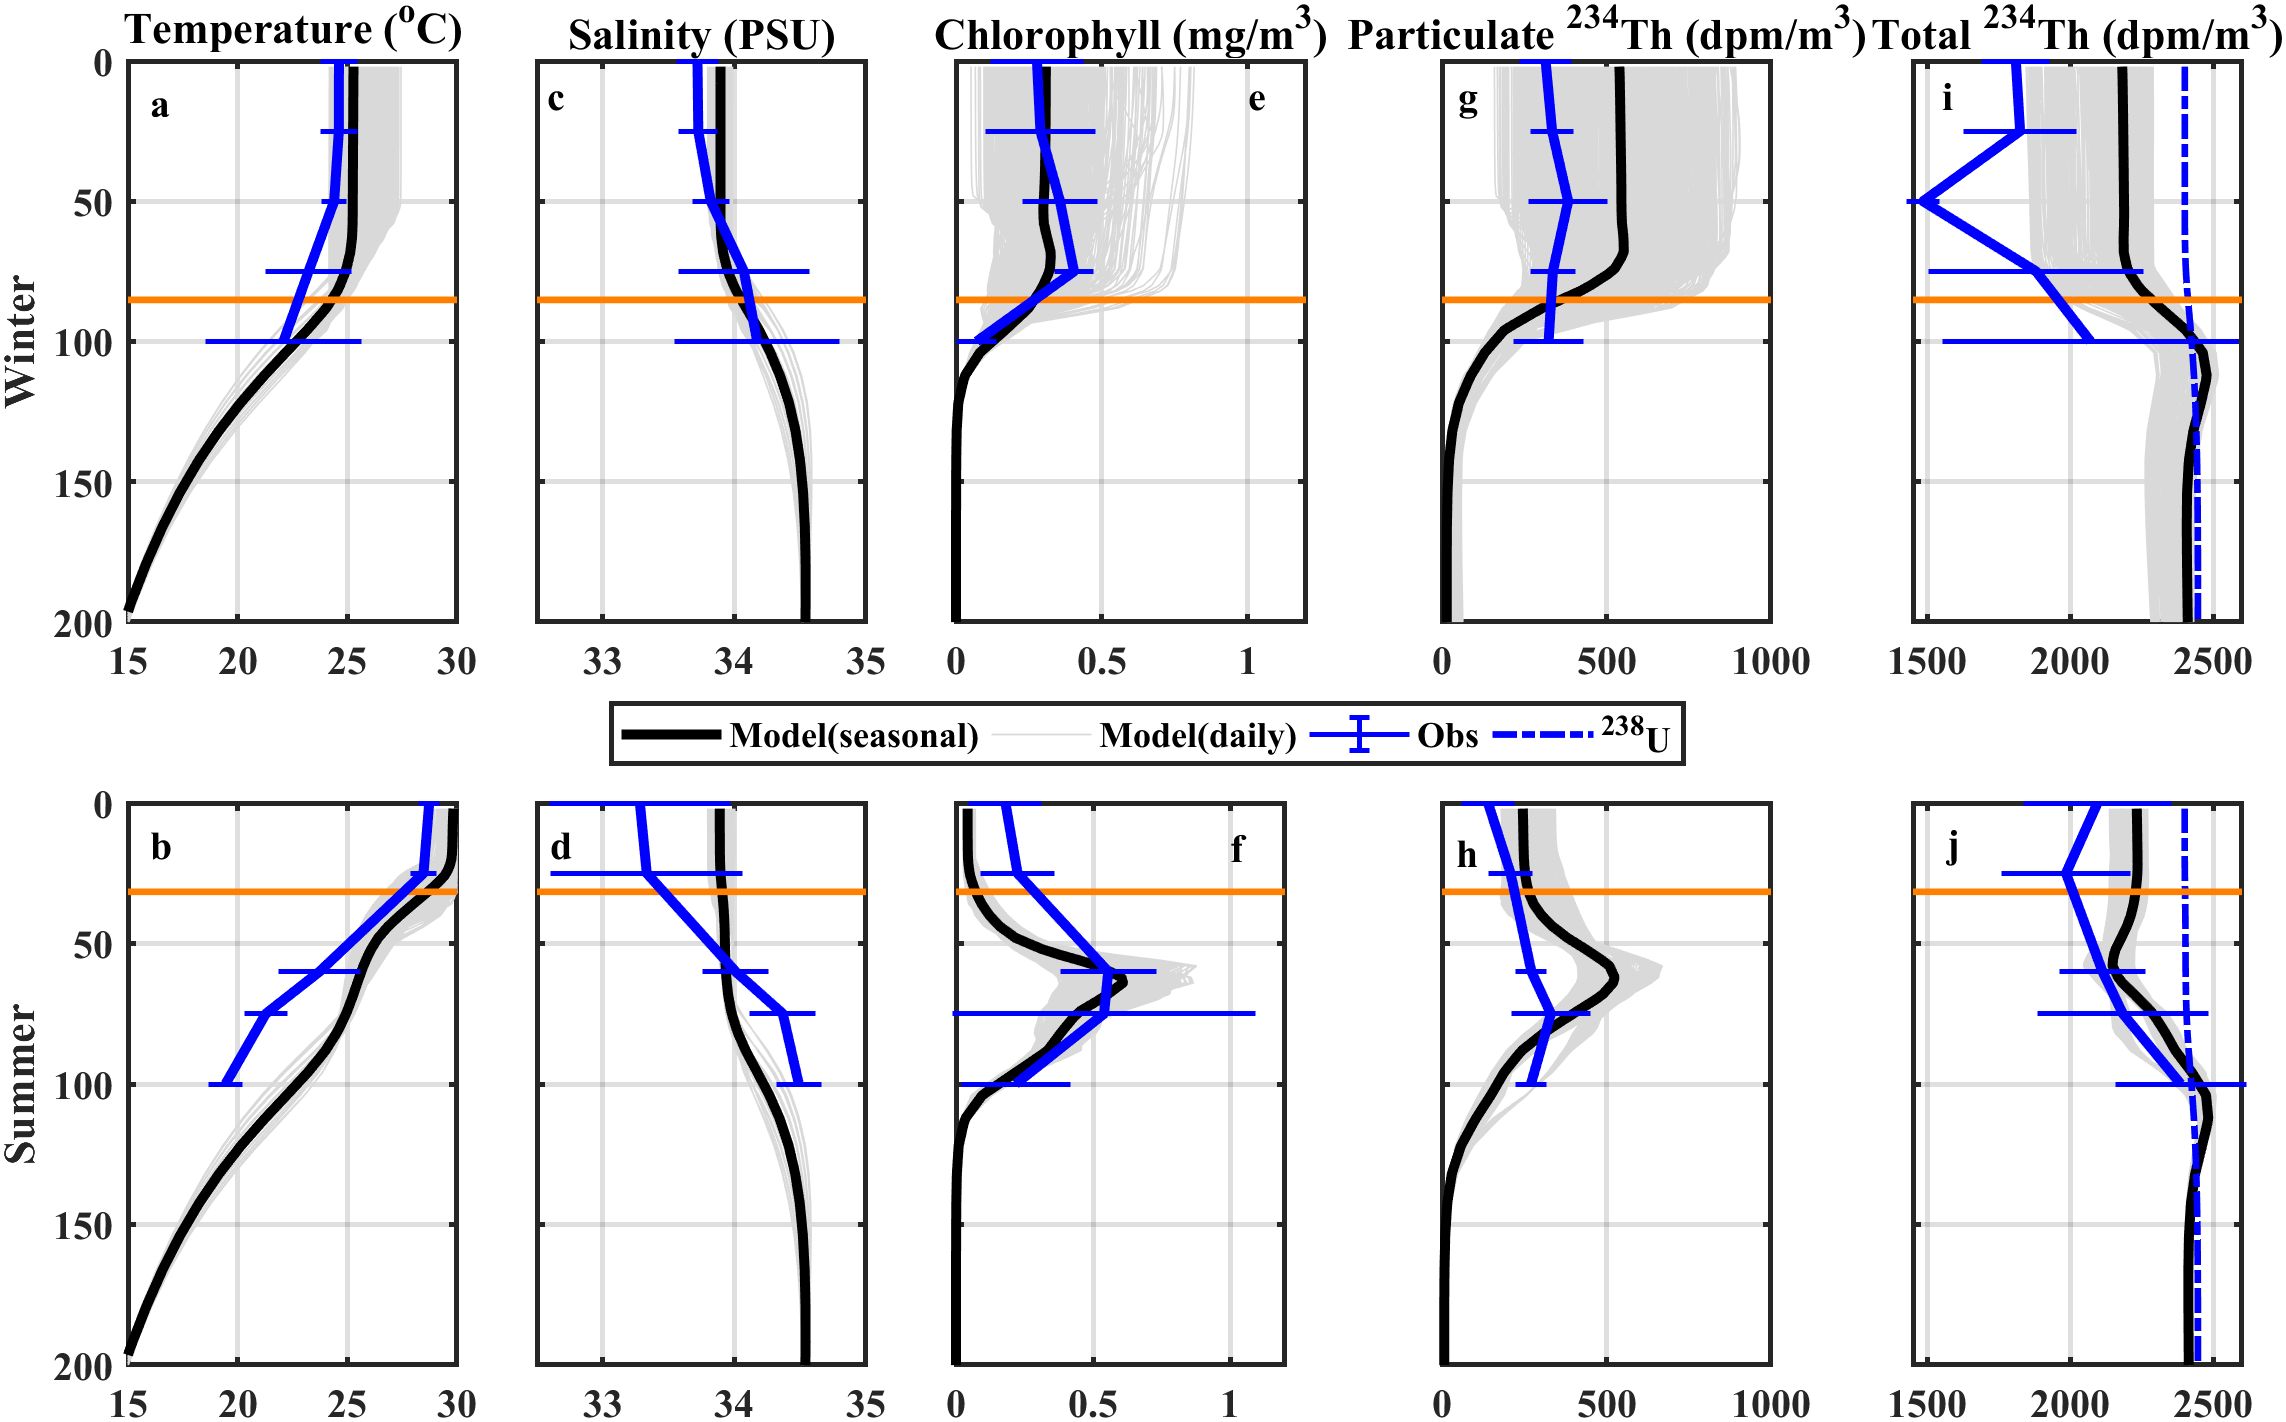
Figure 2. In situ and model-simulated vertical profiles of (a, b) temperature, (c, d) salinity, (e, f) chlorophyll, (g, h) particulate 234Th, and (i, j) total 234Th in (a, c, e, g, i) winter and (b, d, f, h, j) summer at the SEATS site. Black and gray solid lines represent the seasonal mean and daily vertical profiles of the model outputs, respectively. Blue solid lines are the in situ profiles with standard deviations. The horizontal lines indicate the mixed layer depth.
The seasonal cycle of POC flux was calculated from the 10-year realistic simulation at SEATS (Figure 3a). The POC sinking flux increased from late autumn to winter and was generally in phase with the primary production of P2 [PP (P2)] and surface chlorophyll of P2 [CHL (P2)] (Figure 3b), which was associated with the winter phytoplankton peak induced by the northeast monsoon (Palacz et al., 2011; Zhou et al., 2020). Linear regression analysis revealed that the POC flux was strongly correlated with the sum of PONL (r=0.96, p<0.01), PP (P2) (r=0.79, p<0.01), and CHL (P2) (r=0.8, p<0.01), whereas it was weakly correlated with small phytoplankton chlorophyll and total phytoplankton chlorophyll. The weak correlation between total chlorophyll and POC flux could be attributed to the variability in carbon export efficiency induced by different phytoplankton compositions (Henson et al., 2015).
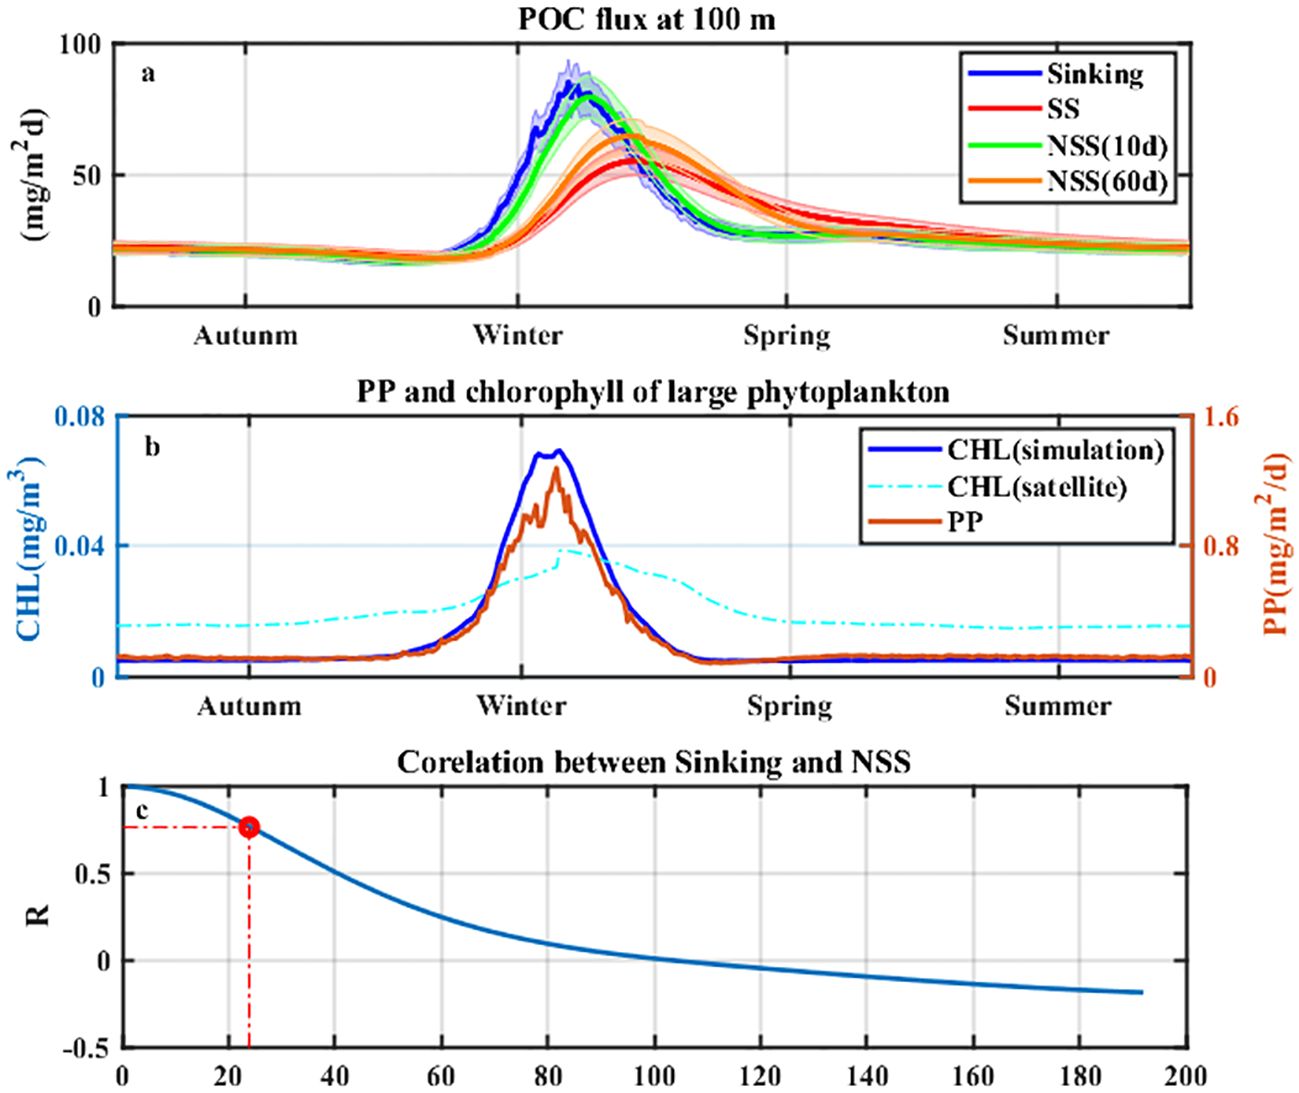
Figure 3. (a) Seasonal POC export flux at 100 m for (blue) Sinking, (red) SS, (green) NSS (10 days), and (orange) NSS (60 days) from simulations at SEATS. The shaded area is the 10% error for each curve. (b) Seasonal distributions of (blue) surface chlorophyll for large phytoplankton, (orange) 0–100 m integrated primary production for large phytoplankton from model outputs, and (cyan) satellite-derived surface chlorophyll of micro-sized phytoplankton. (c) Correlation coefficients of the Sinking and NSS-derived POC flux at 100 m as a function of the time interval (Δt) for estimating the NSS-derived flux. The vertical dotted line represents the half-life of 234Th.
The model showed a seasonal difference between SS and Sinking, while NSS (10 d) generally followed the change in Sinking (Figure 3a), which was consistent with the results of Ceballos-Romero et al. (2018). Considering the annual time series, there was up to 80% of the time when the NSS (10 d) could predict the Sinking within a 10% uncertainty, while it was only 37.8% for SS. However, the accuracy of NSS is determined by the sampling interval (Δt) (Savoye et al., 2006; Ceballos-Romero et al., 2018). As an example, the peak of NSS (60 d) was temporally mismatched with that of Sinking at SEATS. Given a large Δt, the result of NSS can approach that of SS as e−λΔt approaches 0 (Savoye et al., 2006; Resplandy et al., 2012). The correlation coefficient (R) between NSS and Sinking decreased as Δt increased, particularly with a dramatic decline after Δt> the half-life of 234Th (24.1 d) (Figure 3c).
We diagnosed each term of Equation 1 to quantify the dynamics controlling 234Th activity in the water column. The change rate of 234Th over time (Rate) was negative within the mixed layer due to the negative contribution of vertical diffusion (Vdiff) when winter mixing developed (Figures 4a, b). The temporal patterns of the particle sinking term (Sinking) and the Production-Decay term were similar (Figures 4c, d), suggesting a positive contribution of particle sinking to the 234Th change above 100 m (Buesseler et al., 1992; Savoye et al., 2006) and a negative contribution by remineralization near 100 m (Zhou et al., 2020; Xiu and Chai, 2020). The combined Production-Decay and Sinking terms contributed positively to the Rate term after the Sinking term reached its maximum, which was responsible for the time lag between the peaks of the SS-derived flux and the sinking flux.
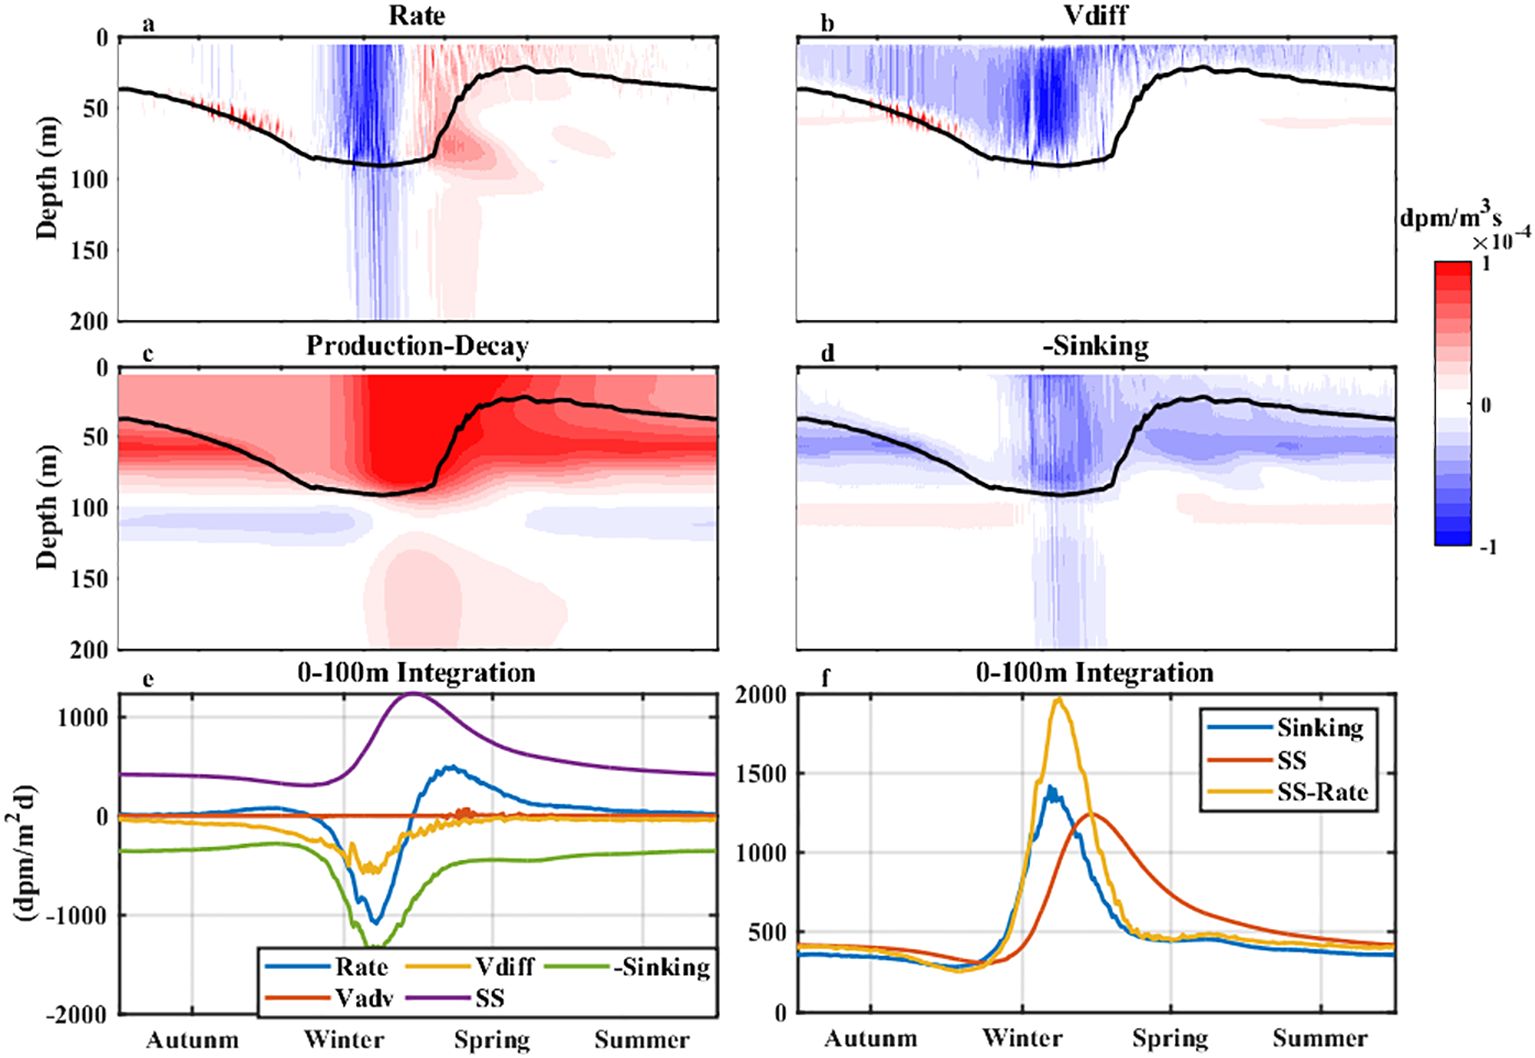
Figure 4. The seasonal cycle of each term in Equation 1 from simulations at SEATS. Vertical distributions of (a) the change rate over time (Rate), (b) vertical diffusion term (Vdiff), (c) radioactive production-decay of 234Th (Production-Decay), and (d) the particle sinking term (Sinking). The black lines in parts (a–d) are the mixed layer depths. (e) 0–100 m integrations of (blue) the Rate, (orange) Vdiff, (purple) radioactive production-decay (SS), and (green) the Sinking terms. (f) 0–100 m integrations of (blue) the Sinking term, (red) the radioactive production-decay term (SS), and (orange) the term of (SS-Rate).
The upper 100 m integration of the Rate term was negative during the pre-bloom period, which was attributable to Vdiff and particle sinking, while the Rate term became positive during the post-bloom period, largely due to the Production-Decay term (Figure 4e). Combining SS with Rate is a feasible way to reduce the time lag between SS and Sinking (Figure 4f).
The evolution of 234Th shows the influence of the winter phytoplankton peak on the 234Th distribution (Supplementary Figure S1). During the period of phytoplankton development, the dissolved 234Th (234Thw) was adsorbed onto the particles (234Thp) and reached its minimum when the particle sinking was largest (Supplementary Figures S1a, b, d). At this time, the total 234Th was not at its minimum, as most 234Thp was not removed (Supplementary Figures S1c, d). After the phytoplankton peak, the concentration of 234Thw was compensated by the decay of 238U (Supplementary Figures S1a, d). 234Thp accumulated at the base of the mixed layer after particle sinking reached its peak and was retained at the subsurface when the mixed layer became shallow (Supplementary Figure S1b).
The diagnosis analysis in Section 3.2 suggests that the combination of the Rate, Production-Decay, and Sinking terms, which is equivalent to the simplified continuity equation of 234Th, can reproduce the temporal bias between the SS-derived and direct sinking POC fluxes. It is thus applicable to derive the SS(t) and NSS(t) using the simplified equation of total 234Th (Equation 5).
We tested the SS(t) and NSS(t) using the model outputs at SEATS. The temporal pattern of Sinking curve was best fitted (r=0.98, p<0.01) using a Fourier series that comprised eight trigonometric functions. The SS(t) and NSS(t) were obtained from Equations 9 and 10 (Figures 5a–c; Supplementary Data Sheet 1 - Text S3). Both the SS(t) and NSS(t) were close to the realistic simulations [r>0.98, p<0.01, root-mean square error (RMSE)<5.8 mg/m2d], demonstrating the feasibility of the analytical solution in producing the temporal patterns of SS and NSS.
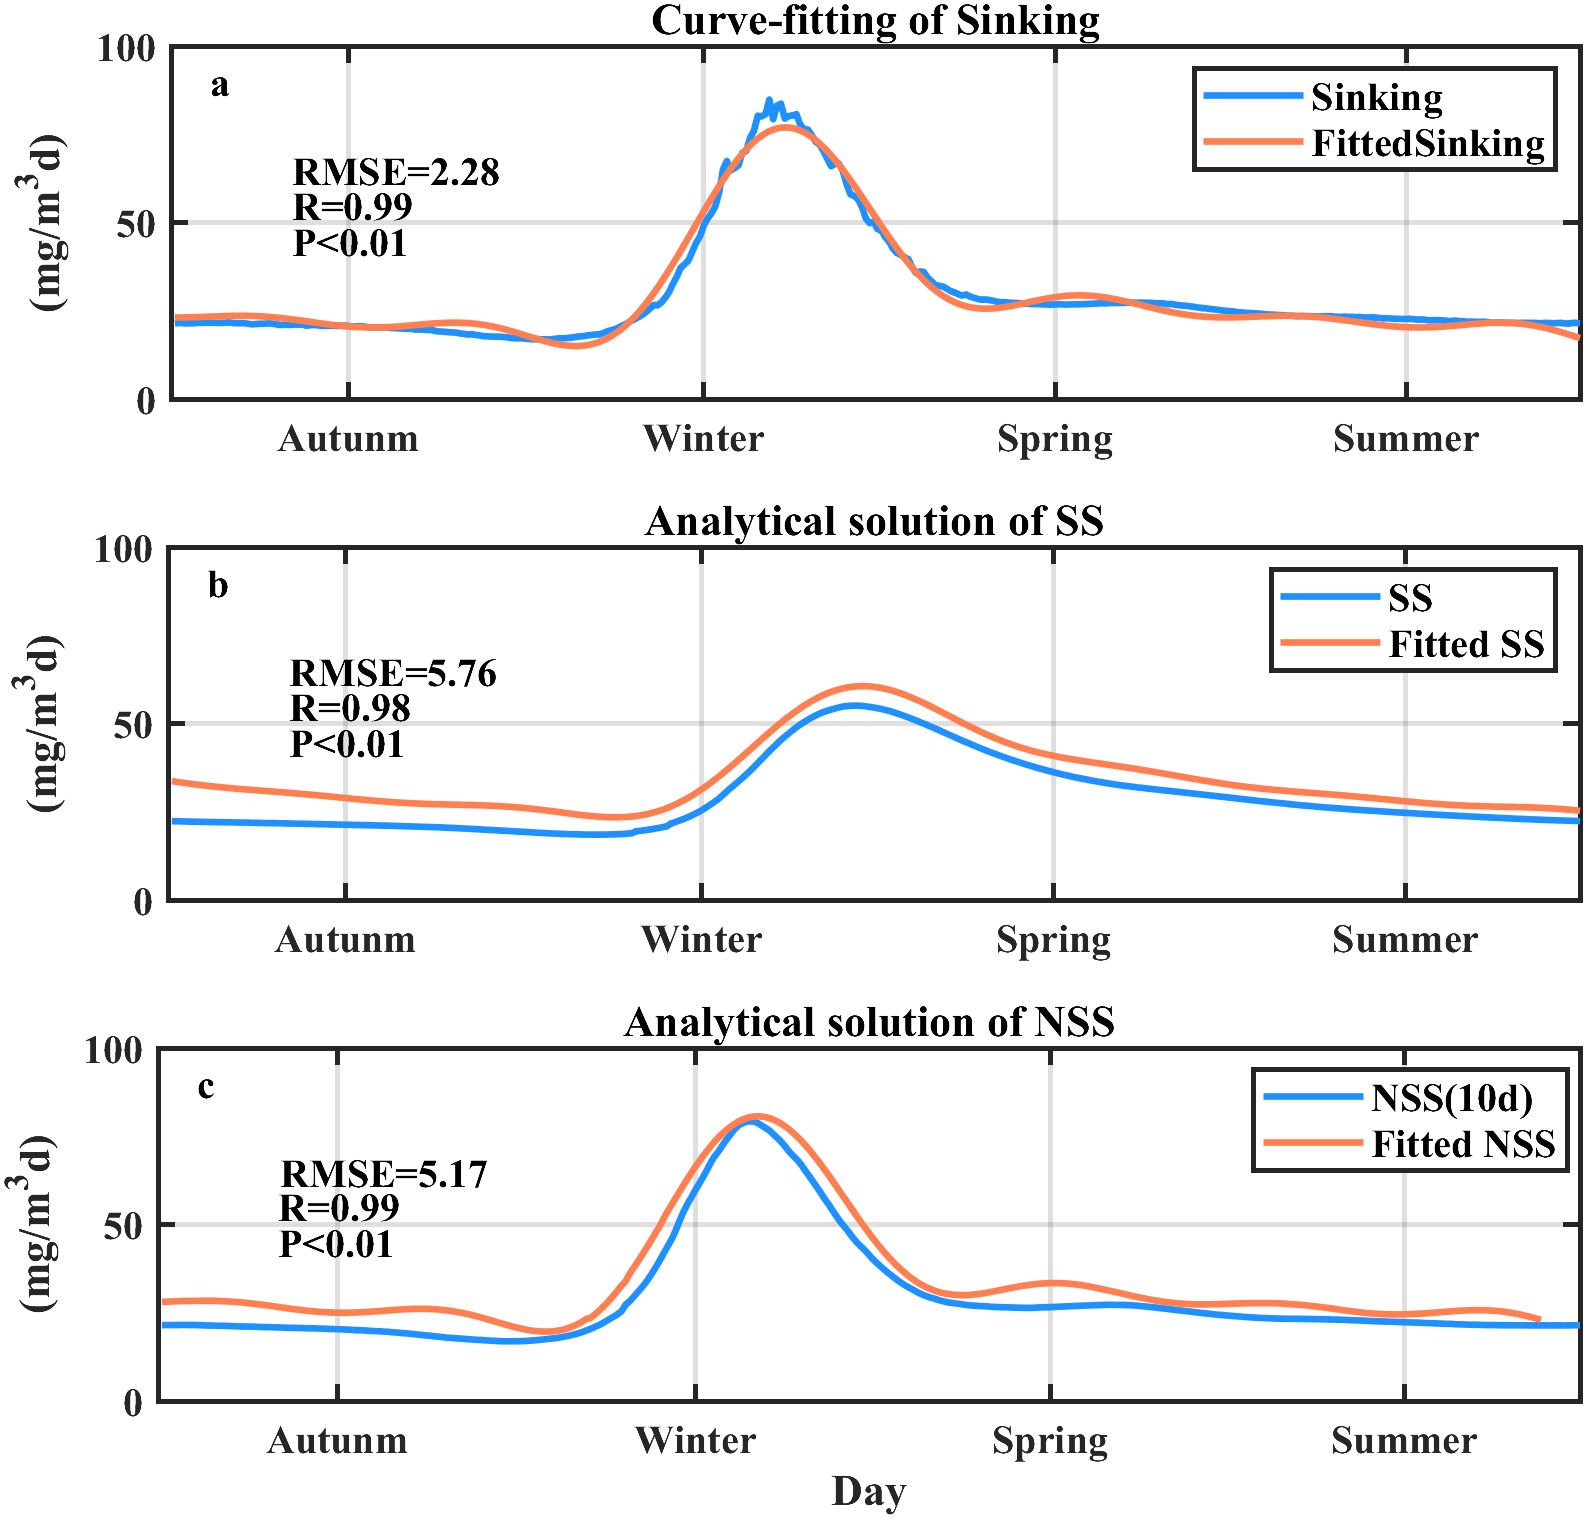
Figure 5. Analytical solution of the seasonal POC flux at the SEATS site. (a) Comparison of the curve-fitted Sinking using the Fourier series function with the modeled sinking term. (b) Comparison of the analytical solution of SS from the fitted sinking curve (Fitted SS) with the SS calculated directly from the model results. (c) Comparison of the analytical solution of NSS from the fitted sinking curve (Fitted NSS) with the NSS calculated directly from the model results. The root-mean square error (RMSE; unit: mg/m2d) and the correlation coefficient R are shown in parts (a–c).
For applications of the analytical solutions [SS(t) and NSS(t)] in the real ocean, we can simplify the Fourier series of the particle sinking flux by considering periodic export events. For a regular phytoplankton bloom that has obvious periodic variations, P increases gradually and then decreases after it reaches a peak, which can be assumed to follow a cosine perturbation during this period:
where a1 is the amplitude of the variation of POC flux, and ω is determined by the duration (T) of the POC export flux that is connected with the phytoplankton bloom in the euphotic zone as . The assumption that the seasonal variation of POC flux follows a pattern of cosine functions is reasonable for most oceans except for coastal regions, tropical oceans, and high-latitude areas (Supplementary Data Sheet 1 - Text S4). By combining Equations 8, 9, and 11, SS can be obtained as:
where c is a constant determined by the initial condition of 234Th, , and . The second term on the right-hand side of Equation 12 represents the decay of the initial 234Th, which varies slightly during the bloom period compared with its initial state. The variation in SS is mainly controlled by the third term, which specifies the influence of particle sinking on the 234Th flux.
The duration of phytoplankton blooms varies from subtropical to subpolar gyres (160–180 days and 120–125 days in the subtropical and subpolar gyres, respectively; Sapiano et al., 2012). a0 and a1 generally change due to the variation in primary production in global oceans (Le Moigne et al., 2013). Using observational data collected by Le Moigne et al. (2013), we constructed the idealized patterns of SS and Sinking during phytoplankton blooms for subtropical gyres (case 1 in Figure 6a: T=180 days, a0 = 28.5 mg C/m2d and a1 = 22.5 mg C/m2d) and subpolar gyres (case 2 in Figure 6b: T=120 days, a0 = 73.95 mg C/m2d and a1 = 48.25 mg C/m2d). Detailed mathematical formulas for cases 1 and 2 are shown in Supplementary Data Sheet 1 - Text S5. The amplitude of the seasonal cycle in SS was a1A, attenuated by a factor of A compared with the amplitude in Sinking (a1) of Equation 11. The time lag between SS and Sinking was quantified as , with ΔTlag=25.3 days for case 1 and ΔTlag=20.4 days for case 2. The time lag calculation suggested that a longer duration of phytoplankton blooms yielded a larger time lag, consistent with the simulations in Ceballos-Romero et al. (2018).
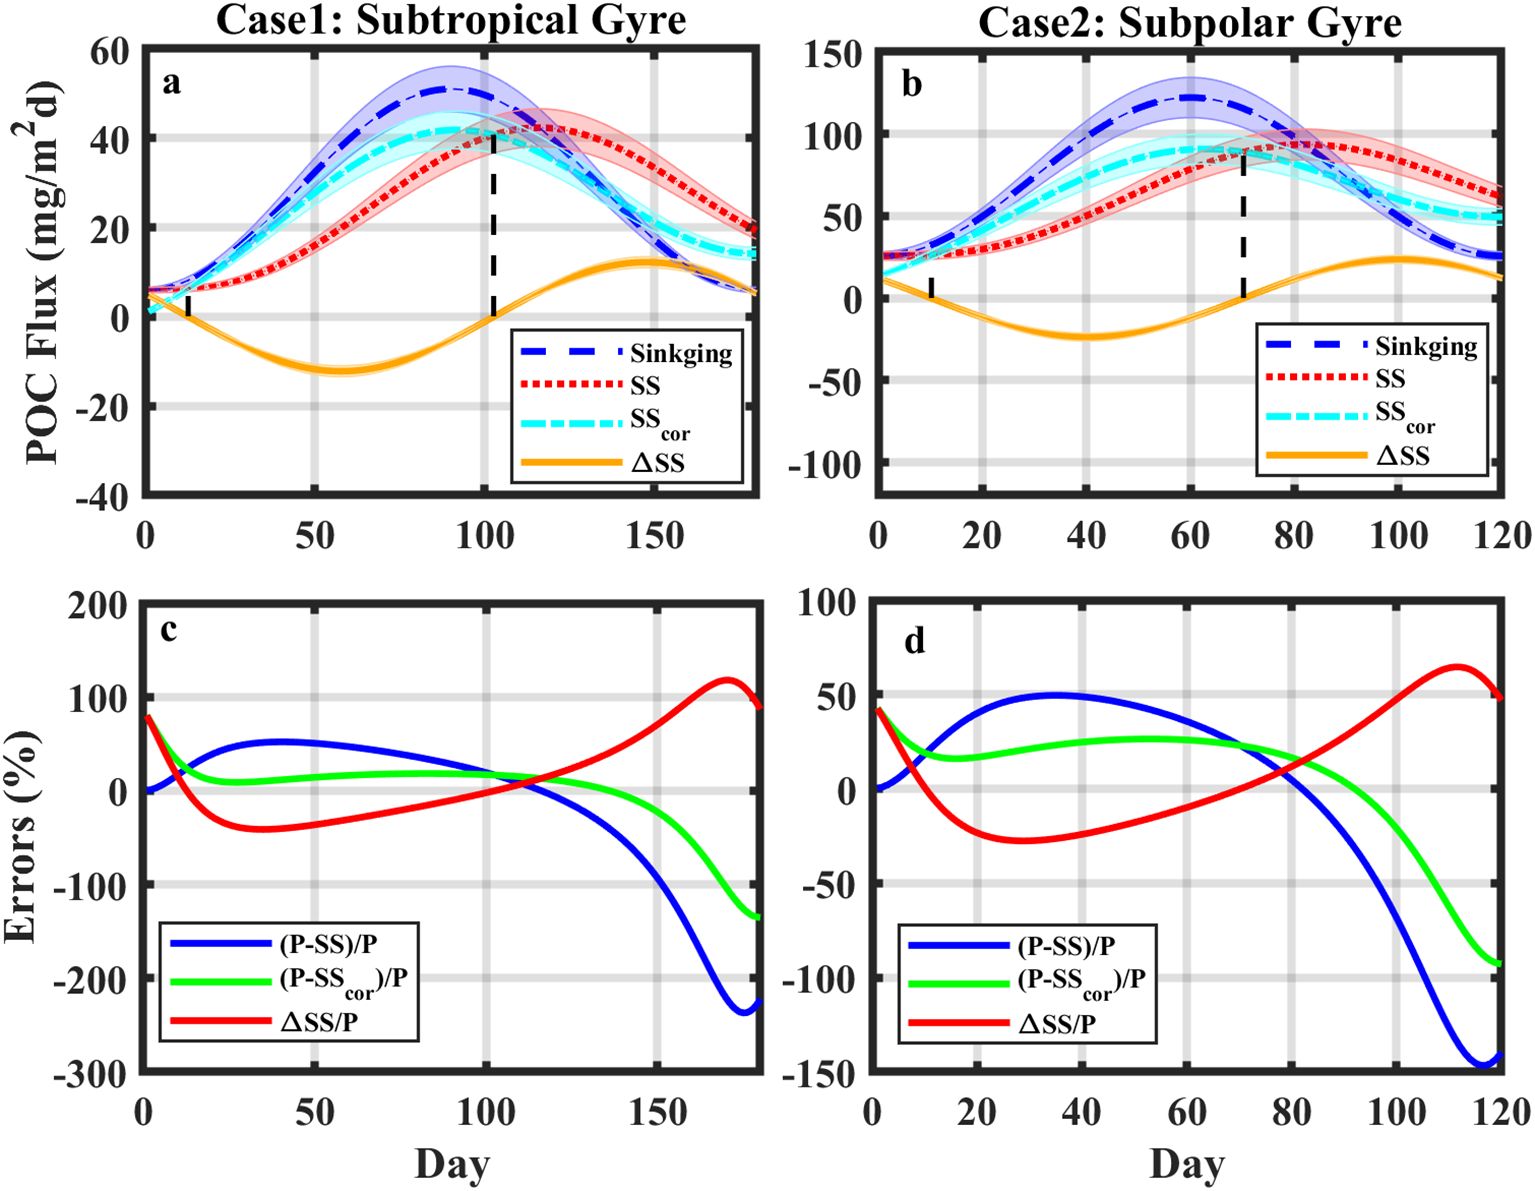
Figure 6. (a, b) Temporal variations in POC export flux derived from (blue) Sinking and (red) SS, (cyan) modified SS (SScor), and (orange) △SS between SS and SScor for cases 1 and 2. The shaded error bars show the 10% uncertainty for each curve. (c, d) The relative errors of (blue) SS, (green) SScor, and (red) △SS to Sinking for cases 1 and 2, respectively.
The analysis of the phytoplankton blooms in cases 1 and 2 suggests that the bias between Sinking and the SS-derived flux was largely attributed to their phase difference over time. If we assume that there is a modified SS (SScor), which is in phase with Sinking (Equation 11), its bias with Sinking would be reduced (Equation 13).
Then, the difference between SS and SScor is given by:
At time t1= . and t2= , ΔSS was zero (t1 = 12.6 and t2 = 102.6 in case 1; t1 = 10 and t2 = 70 in case 2; Figure 6). From the initial to t1 and from t2 to the time that SS reached its peak, the relative error of SS was smaller than that of SScor. Except for these two periods, the relative errors were reduced for SScor compared to SS (Figures 6c, d). The reduction in relative errors (ΔSS/P) was smaller in the pre-bloom period than in the post-bloom period (on average 25% vs. 64% in case 1 and 17.4% vs. 42.8% in case 2). We hereby suggest a modification for SS in each sampling by subtracting ΔSS (hereafter noted as the modification term).
According to Equation 14, a modification term can be estimated for each in situ sampling given that the export duration (T) and the amplitude of the seasonal POC flux (a1) are obtainable. To obtain applicable timing information for the export, we utilized satellite data. Time series of satellite-derived total chlorophyll concentrations have mostly been used to estimate phytoplankton blooms (Stange et al., 2017; Ceballos-Romero et al., 2018), while a time lag between the peak in total chlorophyll and POC export has also been reported (Henson et al., 2015; Stange et al., 2017; Ceballos-Romero et al., 2018). The time lag between phytoplankton blooms and POC export was attributed to multiple factors (Henson et al., 2015, 2019). One reason for the time lag was that POC sinking was more related to large phytoplankton, which was not in phase with total phytoplankton (Villa-Alfageme et al., 2016; Giering et al., 2020). We used different satellite data to estimate the timing information of export, including satellite-derived chlorophyll for micro-sized phytoplankton and satellite-derived export fluxes from Henson et al. (2011) and Laws et al. (2011) (Supplementary Data Sheet- Text S2). We derived the amplitude of the POC export flux (a1) from the historical range of the maximum and minimum POC fluxes from local sediment traps.
The method was first tested based on realistic simulation results at SEATS. The duration of the phytoplankton bloom estimated from the satellite-derived micro-sized phytoplankton chlorophyll was ~150 days (Supplementary Figure S2a; Palacz et al., 2011; Zhou et al., 2020). The time series of SScor was generally in phase with Sinking (Supplementary Figure S2a) and was better fitted to Sinking than SS (Supplementary Figure S2b). At times t1 = 11.5 days and t2 = 86.5 days, ΔSS≈0. Consistent with cases 1 and 2, the relative errors of SScor were higher than those of the SS from the initial time to t1 and were reduced during the pre- and post-bloom periods, with average reductions of 29% and 48.7%, respectively (Supplementary Figure S2b).
We applied the method to a different location (BATS) for verification, as BATS has a long-term record of sediment trap deployment and a 234Th dataset (Le Moigne et al., 2013; Puigcorbé et al., 2020). The SS-derived POC fluxes from Buesseler et al. (2008) and Stewart et al. (2011), were corrected in different cruises and compared with trap-derived fluxes at 150 m (Table 1). Time differences between cruise and trap collection dates range from 1 to 22 days for 5 points where direct trap data were available nearby and require linear interpolation (23 February to 16 August 2004) for 4 points lacking concurrent data (see Supplementary Table S3 and Supplementary Data Sheet 1 - Text S6 in Supplementary Material for details). The POC flux from the sediment trap was generally in phase with satellite-derived micro-sized phytoplankton chlorophyll during 2003–2007 (Figure 7), suggesting a well-established yearly cycle of phytoplankton blooms (Martin and Pondaven, 2006) and carbon export (Brix et al., 2006). For the data at BATS (Table 1; Buesseler et al., 2008; Stewart et al., 2011), those samples during the post-bloom period were mainly overestimated due to the temporal bias between the sediment trap and SS (Savoye et al., 2006; Ceballos-Romero et al., 2018). Estimating the term shows that is ~1,993 dpm/m2d (Supplementary Table S4), suggesting a potentially large temporal bias for the SS-derived POC flux. Applying the modification term to the SS-derived POC flux during the post-bloom periods can reduce the relative errors except for one data point sampled on 2 August 2004 (Figure 7; Table 1). For 25 and 28 June 2004, where trap fluxes were interpolated over the 174-day span, improvements should be interpreted cautiously, as the interpolation may not capture short-term POC flux variations. There were two data points available in the pre-bloom period (sampled on 8 November 2006 and 29 January 2007), and the relative error of one data point was reduced, while the other one was not. Unlike an underestimation predicted by the SS bias, the failed bias had already been overestimated, which was probably due to an increase in thorium scavenging by the increase in inorganic particles from the sea surface (Kim et al., 1999; Tian et al., 2008) or influence from episodic events—such as eddy-driven particle pulses (Buesseler et al., 2008). Using the satellite-derived micro-sized phytoplankton and satellite-derived export flux for timing estimation produced similar results, both were capable of reducing SS bias. The reduction ranged from 8.21% to 67.17%, with an average of 40.43% (Table 1).
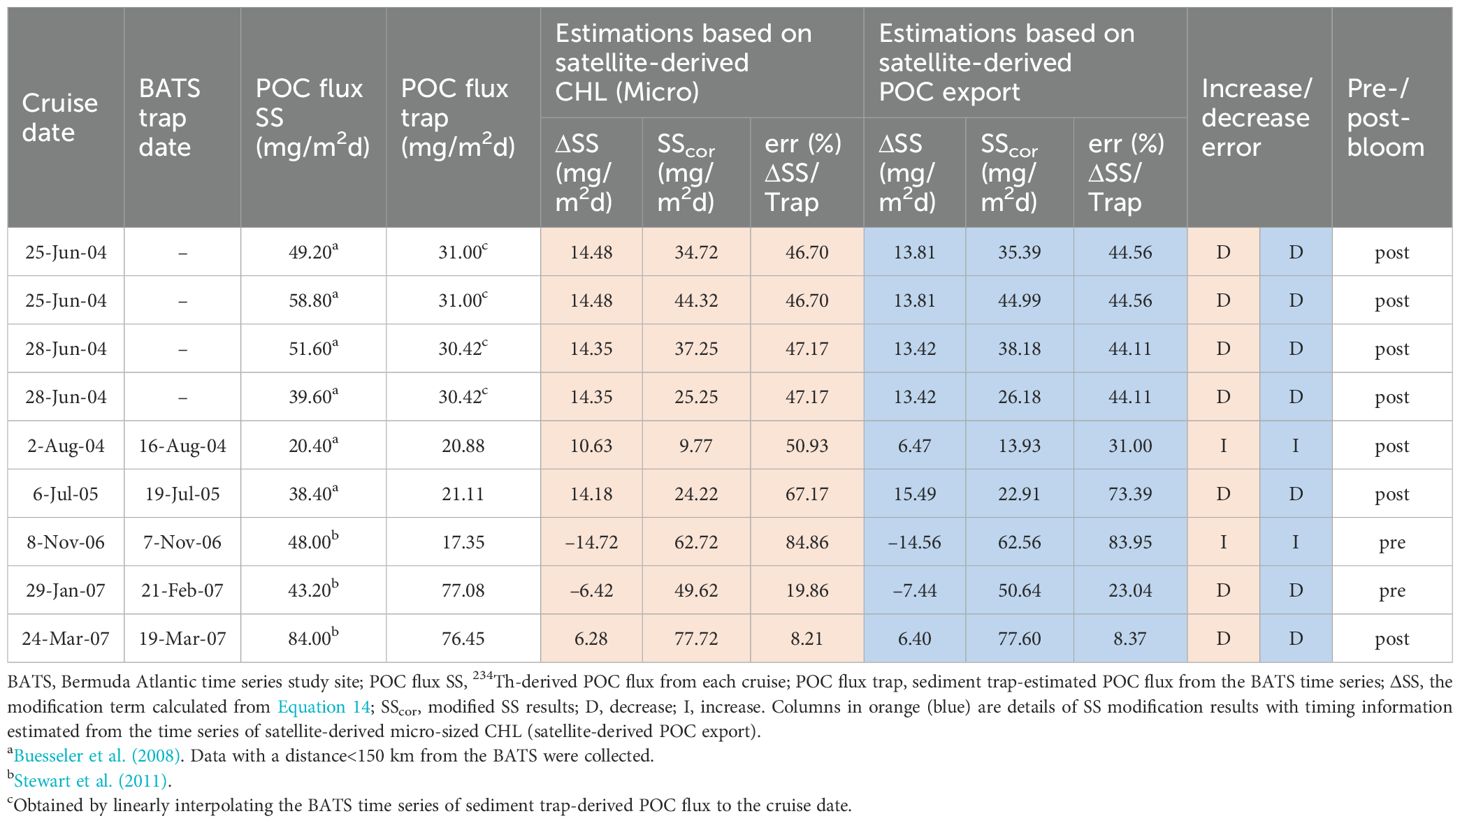
Table 1. The 234Th-derived POC flux and comparison to the sediment trap-estimated POC flux at BATS.
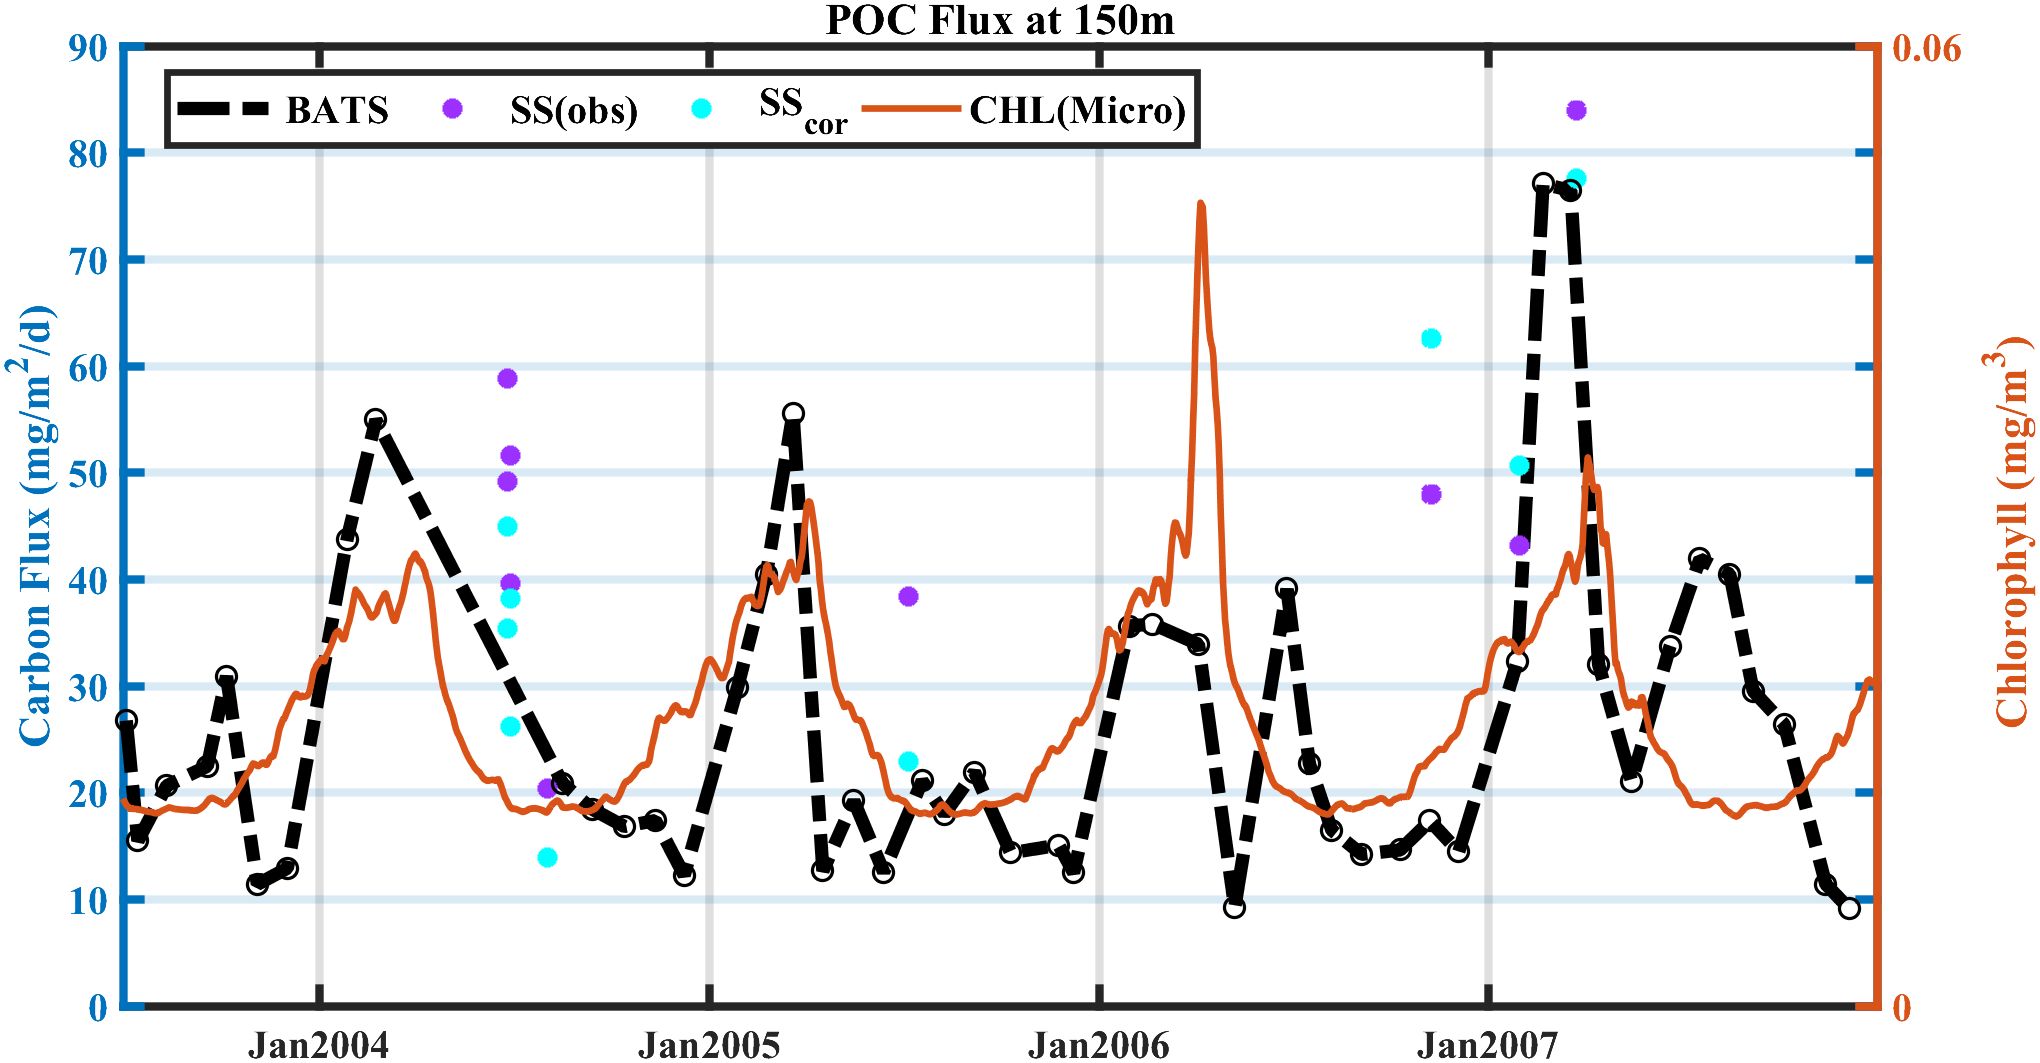
Figure 7. POC export flux derived from (purple) SS and (cyan) SScor for data sampled using the 234Th technique at BATS during 2003–2007. Black and orange lines are POC flux from sediment traps collected at BATS and satellite-derived chlorophyll concentration of micro-sized phytoplankton during September 2003–December 2007, respectively.
This modification term was also applied at SEATS with two simultaneous 234Th and trap data. For the data collected on 8 January 2007, the correction had minimal impact, as the SS-derived flux already closely matched the sediment trap data (Supplementary Table S5). For the data from 12 September 2009, although the modified SS still underestimated the flux, the method reduced the relative bias in the SS-derived POC flux by 34.19%, with an average improvement across the 2 points of 25.20% (Supplementary Table S5).
The scarcity of continuous 234Th profiles and sediment trap data has limited investigation into seasonal discrepancies between SS-derived and direct sinking POC fluxes. To address this, we developed the ROMS-CoSiNE-234Th model to simulate 234Th profiles and POC flux dynamics at SEATS. The simulations reveal that only 37.8% of SS-derived POC fluxes align with direct sinking fluxes within a 10% margin due to inherent temporal biases. Our model outputs, analyzed with the simplified 234Th continuity equation, suggest that this bias stems from phase differences between SS-derived and direct fluxes. Solving the simplified 234Th continuity equation analytically, we propose a correction method that mitigates bias without requiring repeated sampling. This approach, based on a cosine perturbation reflective of phytoplankton bloom cycles, is well-suited to regions with stable bloom patterns, such as subtropical gyres. However, it requires caution in areas with complex particle flux dynamics, like coastal, frontal, or high-latitude regions (Supplementary Data Sheet 1 - Text S4).
Our correction method effectively reduces systematic seasonal biases in SS-derived POC fluxes in mid- to low-latitude regions like SEATS and BATS, where POC export follows a regular, periodic pattern approximated by a cosine function. This assumption is supported by our analysis of satellite-derived POC flux data from 2003 to 2020 (Supplementary Data Sheet 1 - Text S4), which shows a mean relative difference (MRD) of <20% between the cosine fit and observed fluxes in these regions (Supplementary Figures S5a–c). However, the method’s performance is constrained under several conditions. In high-latitude, coastal, or frontal zones, POC export deviates from the assumed regular seasonal cycle—for instance, due to abrupt spring blooms or ice-edge upwelling (Ardyna et al., 2020)—increasing the MRD in the cosine fit (Supplementary Figure S5) and undermining the method’s foundational assumption. Likewise, in regions with strong currents, such as the equatorial Pacific and Southern Oceans, lateral advection can become a dominant term in the 234Th continuity equation, overshadowing the vertical sinking and decay processes central to our method. Moreover, mesoscale and submesoscale processes introduce significant spatial and temporal variability in POC flux (Buesseler et al., 2008; Stukel et al., 2017; Buesseler et al., 2020). For example, observations near the Hawaii Ocean Time-Series (HOTS) site revealed spatial variability exceeding seasonal variability (Benitez-Nelson et al., 2001), and Resplandy et al. (2012) found that small-scale spatial variability in 234Th activity (270–550 dpm m−³ over ~100 km) can lead to errors in SS-derived fluxes, particularly when physical transport by eddies introduces variability that may exceed seasonal biases in dynamically active regions. Furthermore, measurement errors in the POC:234Th ratio, which varies widely due to factors like particle size, composition, or aggregation–disaggregation processes (Le Moigne et al., 2013; Puigcorbé et al., 2020), can dominate over the seasonal biases our method corrects. For instance, differences in sampling techniques can yield POC:234Th ratios varying by a factor of 2–4 (Buesseler et al., 2006), potentially masking the systematic errors we address. Although our model does not require a constant POC:234Th ratio—applying a variable, accurate ratio to both direct sinking and SS-derived fluxes—such measurement inaccuracies often render the seasonal correction less meaningful when they overshadow the targeted biases. As noted by Resplandy et al. (2012) and Ceballos-Romero et al. (2018), uncertainties from small-scale dynamics cannot be easily separated from SS or NSS biases, further complicating flux estimates in these scenarios. Consequently, while our method excels in stable, periodic mid- to low-latitude environments, its utility is limited where irregular export patterns, dominant physical transport, or substantial POC:234Th measurement errors prevail. Future enhancements could include three-dimensional modeling to account for lateral advection and improved POC:234Th ratio measurement techniques to reduce uncertainties in variable conditions.
The correction relies on estimates of seasonal POC flux amplitude and bloom duration, obtainable from satellite chlorophyll or in situ data, and proves most effective post-bloom, where it reduces errors more significantly than in pre-bloom periods. In summary, this study demonstrates that the ROMS-CoSiNE-234Th model accurately simulates 234Th dynamics at SEATS, identifying phase differences as the primary source of temporal bias in SS-derived POC fluxes. Our analytical correction method successfully reduces this bias by up to 67% at BATS and 34% at SEATS, offering a practical tool for regions with regular bloom cycles without the need for extensive sampling. These findings enhance our understanding of biases in 234Th-based POC flux estimates, a key component of the ocean’s biological carbon pump. By improving flux accuracy in stable mid- to low-latitude environments, this work contributes to refining global carbon cycle models and supports climate change research through better quantification of carbon sequestration, although its application requires careful consideration of regional dynamics and measurement precision.
The datasets presented in this study can be found in online repositories. The names of the repository/repositories and accession number(s) can be found in the article/Supplementary Material.
MG: Formal Analysis, Methodology, Writing – original draft, Writing – review & editing. PX: Funding acquisition, Methodology, Project administration, Writing – original draft, Writing – review & editing. KZ: Data curation, Investigation, Writing – review & editing.
The author(s) declare that financial support was received for the research and/or publication of this article. This study is supported by the National Natural Science Foundation of China (92258302), the National Key Research and Development Program of China (2022YFE0136600 and 2022YFC3105303), and the National Natural Science Foundation of China (42430401 and 42376154).
The numerical simulation is supported by the High Performance Computing Division of the South China Sea Institute of Oceanology.
The authors declare that the research was conducted in the absence of any commercial or financial relationships that could be construed as a potential conflict of interest.
The author(s) declare that no Generative AI was used in the creation of this manuscript.
All claims expressed in this article are solely those of the authors and do not necessarily represent those of their affiliated organizations, or those of the publisher, the editors and the reviewers. Any product that may be evaluated in this article, or claim that may be made by its manufacturer, is not guaranteed or endorsed by the publisher.
The Supplementary Material for this article can be found online at: https://www.frontiersin.org/articles/10.3389/fmars.2025.1554932/full#supplementary-material
Alkalay R., Zlatkin O., Katz T., Herut B., Halicz L., Berman-Frank I., et al. (2020). Carbon export and drivers in the southeastern Levantine Basin. Deep Sea Res. II 171, 104713. doi: 10.1016/j.dsr2.2019.104713
Ardyna M., Mundy C., Mills M. M., Oziel L., Grondin P. L., Lacour L., et al. (2020). Environmental drivers of under-ice phytoplankton bloom dynamics in the Arctic Ocean. Elementa Sci. Anthropocene 8, 30. doi: 10.1525/elementa.430
Baker C. A., Estapa M. L., Iversen M., Lampitt R., Buesseler K. (2020). Are all sediment traps created equal? An intercomparison study of carbon export methodologies at the PAP-SO site. Progr. Oceanogr. 184, 102317. doi: 10.1016/j.pocean.2020.102317
Benitez-Nelson C., Buesseler K. O., Karl D. M., Andrews J. (2001). A time-series study of particulate matter export in the North Pacific Subtropical Gyre based on 234Th: 238U disequilibrium. Deep Sea Res. I 48, 2595–2611. doi: 10.1016/S0967-0637(01)00032-2
Bourne H. L., Bishop J. K. B., Wood T. J., Loew T. J., Liu Y. (2019). Carbon Flux Explorer optical assessment of C, N and P fluxes. Biogeosciences 16, 1249–1264. doi: 10.5194/bg-16-1249-2019
Boyd P. W., Claustre H., Lévy M., Siegel D. A., Weber T. (2019). Multi-faceted particles pumps drive carbon sequestration in the ocean. Nature 568, 327–335. doi: 10.1038/s41586-019-1098-2
Brix H., Gruber N., Karl D. M., Bates N. R. (2006). On the relationships between primary, net community, and export production in subtropical gyres. Deep Sea Res. II 53, 698–717. doi: 10.1016/j.dsr2.2006.01.024
Buesseler K. O., Antia A. N., Chen M., Fowler S. W., Gardner W. D., Gustafsson O., et al. (2007). An assessment of the use of sediment traps for estimating upper ocean particle fluxes. J. Mar. Res. 65, 345–426. doi: 10.1357/002224007781567621
Buesseler K. O., Bacon M. P., Kirk Cochran J., Livingston H. D., Cochran J. K., Livingston H. D. (1992). Carbon and nitrogen export during the JGOFS North Atlantic bloom experiment estimated from 234Th:238U disequilibria. Deep Sea Res. A 39, 1115–1137. doi: 10.1016/0198-0149(92)90060-7
Buesseler K. O., Benitez-Nelson C. R., Moran S. B., Burd A., Charette M., Cochran J. K., et al. (2006). An assessment of particulate organic carbon to thorium-234 ratios in the ocean and their impact on the application of 234Th as a POC flux proxy. Mar. Chem. 100, 213–233. doi: 10.1016/j.marchem.2005.10.013
Buesseler K. O., Benitez-Nelson C. R., Roca-Martí M., Wyatt A. M., Resplandy L., Clevenger S. J., et al. (2020). High-resolution spatial and temporal measurements of particulate organic carbon flux using thorium-234 in the northeast Pacific Ocean during the EXport Processes in the Ocean from RemoTe Sensing field campaign. Elementa-Sci. Anthrop. 8, 30. doi: 10.1525/elementa.2020.030
Buesseler K. O., Lamborg C., Cai P., Escoube R., Johnson R., Pike S., et al. (2008). Particle fluxes associated with mesoscale eddies in the Sargasso Sea. Deep Sea Res. II 55, 1426–1444. doi: 10.1016/j.dsr2.2008.02.007
Ceballos-Romero E., Buesseler K. O., Villa-Alfageme M. (2022). Revisiting five decades of 234Th data: a comprehensive global oceanic compilation. Earth Syst. Sci. 14, 2639–2679. doi: 10.5194/essd-2021-259
Ceballos-Romero E., de Soto F., Le Moigne F. A. C., García-Tenorio R., Villa-Alfageme M. (2018). 234Th-derived particle fluxes and seasonal variability: When is the SS assumption reliable? Insights from a novel approach for carbon flux simulation. Geophys. Res. Lett. 45, 13414–13426.
Ceballos-Romero E., Le Moigne F. A. C., Henson S., Marsay C. M. M., Sanders R. J. J., Garcia-Tenorio R., et al. (2016). Influence of bloom dynamics on particle export efficiency in the North Atlantic: A comparative study of radioanalytical techniques and sediment traps. Mar. Chem. 186, 198–210. doi: 10.1016/j.marchem.2016.10.001
Chai F., Dugdale R. C., Peng T. H., Wilkerson F. P., Barber R. T. (2002). One-dimensional ecosystem model of the equatorial Pacific upwelling system. Part I: model development and silicon and nitrogen cycle. Deep Sea Res. II 49, 2713–2745. doi: 10.1016/S0967-0645(02)00055-3
de Soto F., Ceballos-Romero E., Villa-Alfageme M. (2018). A microscopic simulation of particle flux in ocean waters: Application to radioactive pair disequilibrium. Geochim. Cosmochim. Ac. 239, 136–158. doi: 10.1016/J.GCA.2018.07.031
DeVries T., Holzer M., Primeau F. (2017). Recent increase in oceanic carbon uptake driven by weaker upper-ocean overturning. Nature 542, 215–218. doi: 10.1038/nature21068
DeVries T., Le Quéré C., Andrews O., Berthet S., Hauck J., Ilyina T., et al. (2019). Decadal trends in the ocean carbon sink. Proc. Natl. Acad. Sci. 116, 11646–11651. doi: 10.1073/pnas.1900371116
Dunne J. P., Murray J. W., Young J., Balistrieri L. S., Bishop J. (1997). 234Th and particle cycling in the central equatorial Pacific. Deep-Sea Res. II 44, 2049–2083. doi: 10.1016/S0967-0645(97)00063-5
Estapa M., Valdes J., Tradd K., Sugar J., Omand M., Buesseler K. (2020). The neutrally buoyant sediment trap: two decades of progress. J. Atmos. Ocean. Tech. 37, 957–973. doi: 10.1175/JTECH-D-19-0118.1
Friedlingstein P., O’Sullivan M., Jones M. W., Andrew R. M., Hauck J., Olsen A., et al. (2020). Global carbon budget 2020. Earth Syst. Sci. Data 12, 3269–3340. doi: 10.5194/essd-12-3269-2020
Giering S. L., Cavan E. L., Basedow S. L., Briggs N., Burd A. B., Darroch L. J., et al. (2020). Sinking organic particles in the ocean—flux estimates from in situ optical devices. Front. Mar. Sci. 6, 834. doi: 10.3389/fmars.2019.00834
Gruber N., Clement D., Carter B. R., Feely R. A., van Heuven S., Hoppema M., et al. (2019). The oceanic sink for anthropogenic CO2 from 1994 to 2007. Science 363, 1193–1199. doi: 10.1126/science.aau5153
Hauck J., Zeising M., Le Quéré C., Gruber N., Bakker D. C. E., Bopp L., et al. (2020). Consistency and challenges in the ocean carbon sink estimate for the global carbon budget. Front. Mar. Sci. 7, 1–33. doi: 10.3389/fmars.2020.571720
Henson S., Le Moigne F., Giering S. (2019). Drivers of carbon export efficiency in the global ocean. Global Biogeochem. Cy. 33, 891–903. doi: 10.1029/2018GB006158
Henson S. A., Sanders R., Madsen E., Morris P. J., Le Moigne F., Quartly G. D. (2011). A reduced estimate of the strength of the ocean’s biological carbon pump. Geophys. Res. Lett. 38, L04606. doi: 10.1029/2011GL046735
Henson S. A., Yool A., Sanders R. (2015). Variability in efficiency of particulate organic carbon export: A model study. Global Biogeochem. Cy. 29, 33–45. doi: 10.1002/2014GB004965
Ho T.-Y., Chou W.-C., Wei C.-L., Lin F.-J., Wong G. T. F., Line H.-L. (2010). Trace metal cycling in the surface water of the South China Sea: Vertical fluxes, composition, and sources. Limnol. Oceanogr. 55, 1807–1820. doi: 10.4319/lo.2010.55.5.1807
Iida Y., Takatani Y., Kojima A., Ishii M. (2021). Global trends of ocean CO2 sink and ocean acidification: an observation-based reconstruction of surface ocean inorganic carbon variables. J. Oceanogr. 77, 323–358. doi: 10.1007/s10872-020-00571-5
Kim G., Hussain N., Church T. M., Yang H. S. (1999). A practical and accurate method for the simultaneous determination of 234Th, 210Po, and 210Pb in seawater. Talanta 49, 851–858. doi: 10.1016/S0039-9140(99)00095-8
Lamborg C. H., Buesseler K. O., Valdes J., Bertrand C. H., Bidigare R., Manganini S., et al. (2008). The flux of bio- and lithogenic material associated with sinking particles in the mesopelagic “twilight zone” of the northwest and North Central Pacific Ocean. Deep Sea Res. II 55, 1540–1563. doi: 10.1016/j.dsr2.2008.04.011
Laws E. A., D’Sa E., Naik P. (2011). Simple equations to estimate ratios of new or export production to total production from satellite-derived estimates of sea surface temperature and primary production. Limnol. Oceanogr. Meth. 9, 593–601. doi: 10.4319/lom.2011.9.593
Le Moigne F. A. C., Henson S. A., Sanders R. J., Madsen E. (2013). Global database of surface ocean particulate organic carbon export fluxes diagnosed from the 234Th technique. Earth Syst. Sci. Data 5, 295–304. doi: 10.5194/essd-5-295-2013
Ma W., Xiu P., Chai F., Li H. (2019). Seasonal variability of the carbon export in the central South China Sea. Ocean Dynam. 69, 955–966. doi: 10.1007/s10236-019-01286-y
Martin A. P., Pondaven P. (2006). New primary production and nitrification in the western subtropical North Atlantic: A modeling study. Global Biogeochem. Cy. 20, GB4014. doi: 10.1029/2005GB002608
Mellor G. L., Yamada T. (1982). Development of a turbulence closure model for geophysical fluid problems. Rev. Geophys. 20, 851–875.
Owens S. A., Buesseler K. O., Lamborg C. H., Valdes J., Lomas M. W., Johnson R. J., et al. (2013). A new time series of particle export from neutrally buoyant sediments traps at the Bermuda Atlantic Time-series Study site. Deep Sea Res. I 72, 34–47. doi: 10.1016/j.dsr.2012.10.011
Palacz A. P., Xue H., Armbrecht C., Zhang C., Chai F. (2011). Seasonal and inter-annual changes in the surface chlorophyll of the South China Sea. J. Geophys. Res. 116, C09015. doi: 10.1029/2011JC007064
Puigcorbé V., Masqué P., Le Moigne F. A. C. (2020). Global database of ratios of particulate organic carbon to thorium-234 in the ocean: improving estimates of the biological carbon pump. Earth Syst. Sci. Data 12, 1267–1285. doi: 10.5194/essd-12-1267-2020
Resplandy L., Martin A. P., Le Moigne F., Martin P., Aquilina A., Mémery L., et al. (2012). How does dynamical spatial variability impact 234Th-derived estimates of organic export? Deep Sea Res. I 68, 24–45.
Sapiano M. R. P., Brown C. W., Schollaert Uz S., Vargas M. (2012). Establishing a global climatology of marine phytoplankton phenological characteristics. J. Geophys. Res. 117, C08026. doi: 10.1029/2012JC007958
Savoye N., Benitez-Nelson C., Burd A. B., Cochran J. K., Charette M., Buesseler K. O., et al. (2006). 234Th sorption and export models in the water column: A review. Mar. Chem. 100, 234–249. doi: 10.1016/j.marchem.2005.10.014
Stange P., Bach L. T., Le Moigne F. A. C., Taucher J., Boxhammer T., Riebesell U. (2017). Quantifying the time lag between organic matter production and export in the surface ocean: Implications for estimates of export efficiency. Geophys. Res. Lett. 44, 268–276. doi: 10.1002/2016GL070875
Stewart G., Moran S. B., Lomas M. W., Kelly R. P. (2011). Direct comparison of 210Po, 234Th and POC particle-size distributions and export fluxes at the Bermuda Atlantic Time-series Study (BATS) site. J. Environ. Radioact. 102, 479–489. doi: 10.1016/j.jenvrad.2010.09.011
Stukel M. R., Aluwihare L. I., Barbeau K. A., Chekalyuk A. M., Goericke R., Miller A. J. (2017). Mesoscale ocean fronts enhance carbon export due to gravitational sinking and subduction. Proc. Natl. Acad. Sci. U.S.A. 114, 1252–1257. doi: 10.1073/pnas.1609435114
Terhaar J., Frölicher T. L., Joos F. (2021). Southern Ocean anthropogenic carbon sink constrained by sea surface salinity. Sci. Adv. 7, eabd5964.
Tian Z., Ollivier P., Véron A., Church T. M. (2008). Atmospheric Fe deposition modes at Bermuda and the adjacent Sargasso Sea. Geochem. Geophy. Geosy. 9, Q08007. doi: 10.1029/2007GC001868
Tréguer P., Bowler C., Moriceau B., Dutkiewicz S., Gehlen M., Aumont O., et al. (2018). Influence of diatom diversity on the ocean biological carbon pump. Nat. Geosci. 11, 27–37. doi: 10.1038/s41561-017-0028-x
Umhau B. P., Benitez-Nelson C. R., Close H. G., Hannides C. C. S., Motta L., Popp B. N., et al. (2019). Seasonal and spatial changes in carbon and nitrogen fluxes estimated using 234Th: 238U disequilibria in the North Pacific tropical and subtropical gyre. Mar. Chem. 217, 103705. doi: 10.1016/j.marchem.2019.103705
Villa-Alfageme M., de Soto F. C., Ceballos-Romero E., Giering S., Le Moigne F. A. C., Henson S., et al. (2016). Geographical, seasonal and depth variation in sinking particle speeds in the North Atlantic. Geophys. Res. Lett. 43, 8609–8616. doi: 10.1002/2016GL069233
Wei C.-L., Lin S.-Y., Sheu D. D.-D., Chou W.-C., Yi M.-C., Santschi P. H., et al. (2011). Particle-reactive radionuclides (234Th, 210Pb, 210PO) as tracers for the estimation of export production in the South China Sea. Biogeosciences 8, 3793–3808. doi: 10.5194/bg-8-3793-2011
Xiu P., Chai F. (2020). Eddies affect subsurface phytoplankton and oxygen distributions in the north pacific subtropical gyre. Geophys. Res. Lett. 47, e2020GL087037. doi: 10.1029/2020GL087037
Keywords: biological carbon pump, particulate organic carbon flux, the 234Th–238U pair technique, a radioactive trace model of 234Th, error correction
Citation: Guo M, Xiu P and Zhou K (2025) Studying the temporal bias of the steady-state approximation of 234Th-derived carbon export during phytoplankton blooms. Front. Mar. Sci. 12:1554932. doi: 10.3389/fmars.2025.1554932
Received: 03 January 2025; Accepted: 14 March 2025;
Published: 03 April 2025.
Edited by:
Jun Sun, China University of Geosciences, ChinaReviewed by:
Mingshun Jiang, Florida Atlantic University, United StatesCopyright © 2025 Guo, Xiu and Zhou. This is an open-access article distributed under the terms of the Creative Commons Attribution License (CC BY). The use, distribution or reproduction in other forums is permitted, provided the original author(s) and the copyright owner(s) are credited and that the original publication in this journal is cited, in accordance with accepted academic practice. No use, distribution or reproduction is permitted which does not comply with these terms.
*Correspondence: Peng Xiu, cHhpdUB4bXUuZWR1LmNu; Kuanbo Zhou, a2J6aG91QHhtdS5lZHUuY24=
Disclaimer: All claims expressed in this article are solely those of the authors and do not necessarily represent those of their affiliated organizations, or those of the publisher, the editors and the reviewers. Any product that may be evaluated in this article or claim that may be made by its manufacturer is not guaranteed or endorsed by the publisher.
Research integrity at Frontiers
Learn more about the work of our research integrity team to safeguard the quality of each article we publish.