 Chang-yan Xu
 Yi-qun Wang
 Di-lin Yao
 Si-yuan Qiu
 Hui Li
94% of researchers rate our articles as excellent or good
Learn more about the work of our research integrity team to safeguard the quality of each article we publish.
Find out more
ORIGINAL RESEARCH article
Front. Mar. Sci., 18 March 2025
Sec. Marine Affairs and Policy
Volume 12 - 2025 | https://doi.org/10.3389/fmars.2025.1552136
This article is part of the Research TopicChallenges and Opportunities for Decarbonizing the Maritime IndustryView all 8 articles
The marine green fuel supply chain is a crucial component in the development of green ports. Focusing on the issue of cooperative contracts between the port and green marine fuel supplier within the marine green fuel supply chain, first, a two-echelon marine green fuel supply chain optimization model consisting of a green marine fuel supplier and a port was constructed. Second, the changes in profits and decisions of a green marine fuel supplier and a port were compared under four scenarios: no contract, cost-sharing contract, revenue-sharing contract, and combined revenue-sharing + cost-sharing contract. Finally, the propositions were validated using numerical simulation methods. The research findings show that, in terms of revenue, the combined profits of a port and green marine fuel supplier under the combined revenue-sharing + cost-sharing contract exceeded those under the revenue-sharing contract alone. Regarding the sales price of marine green fuel and bunkering service quality, these factors peaked under the cost-sharing contract and were at their lowest under the revenue-sharing contract. An increase in the port’s investment proportion in marine green fuel bunkering service quality led to decreases in the bunkering volume, sales price, wholesale price, and bunkering service quality of marine green fuel under both the cost-sharing contract and the revenue-sharing + cost-sharing contract. Additionally, the higher proportion of revenue shared by the port with the green marine fuel supplier resulted in lower sales price, wholesale price, and bunkering service quality of green marine fuel under both the revenue-sharing contract and revenue-sharing + cost-sharing contract.
As vital hubs for international trade and logistics, ports play an irreplaceable role in the development of economic globalization (Liu et al., 2025). However, with the rapid growth of the global economy, environmental issues have become increasingly more prominent, particularly the sharp increase in carbon emissions, posing unprecedented challenges to the global climate (Xu et al., 2024a). To reduce carbon emissions in the shipping industry, the International Maritime Organization’s (IMO) “2023 IMO Strategy on Reducing GHG Emissions from Ships” mandates a reduction in CO2 emissions per unit of transport work by international shipping of at least 40% compared to 2008 levels by 2030 (Altosole et al., 2024). In response to this challenge, some countries have set targets for reducing carbon emissions and achieving sustainable development. For instance, the European Union aims to achieve carbon neutrality by 2050 and has included the shipping industry in its Emission Trading System, along with enacting new regulations such as Fuel EU Maritime and the European Green Deal (Paleari, 2022). In November 2019, China’s Ministry of Transport and nine other state departments jointly issued the “Guiding Opinions on the Construction of World-class Ports”, proposing to “improve standards and norms for LNG bunkering and shore power supply services at ports, as well as the corresponding supply service system” (Deng et al., 2022).
Against this backdrop, green ports have emerged as a significant direction for port development (Li et al., 2024). The construction of green ports not only includes reducing port carbon emissions but also providing a green fuel supply for shipping companies. Therefore, green fuel refueling for ships plays a crucial role in the construction of green ports (Xu et al., 2024b). Several countries and regions are actively planning projects related to green methanol and green ammonia, and exploring their applications in port construction. For example, some European countries are promoting the implementation of projects such as green hydrogen production for methanol to replace traditional fossil fuels. Some shipping companies such as Maersk are vigorously promoting the use of marine green fuels such as green methanol (Sun et al., 2024; Xu et al., 2024c), considering them key means to achieve the decarbonization goals of the shipping industry. Meanwhile, international ports and energy companies are strengthening cooperation to jointly promote the application and development of green fuels such as green methanol and green ammonia. For instance, the Shanghai International Port (Group) Co., Ltd. is collaborating with the State Power Investment Corporation of China to construct green methanol supply chain projects and explore the application of green hydrogen in port construction (Si, 2023). Singapore Port is partnering with multiple energy enterprises to promote the production and utilization of clean energy within the port area, while the Port of Rotterdam is cooperating with energy companies to build offshore wind power facilities.
The construction and operation of marine green fuel bunkering facilities also face numerous challenges in terms of funding, technology, and other aspects (Xiao et al., 2025a). The costs of marine green fuel bunkering facilities are very high, making it difficult for a single entity to bear all expenses. Currently, ports and green marine fuel suppliers are the main participants in the construction of marine green fuel bunkering facilities. Therefore, how to reasonably share the costs of marine green fuel bunkering facility projects and allocate revenues has become a pressing issue for both ports and green marine fuel suppliers (Figure 1).
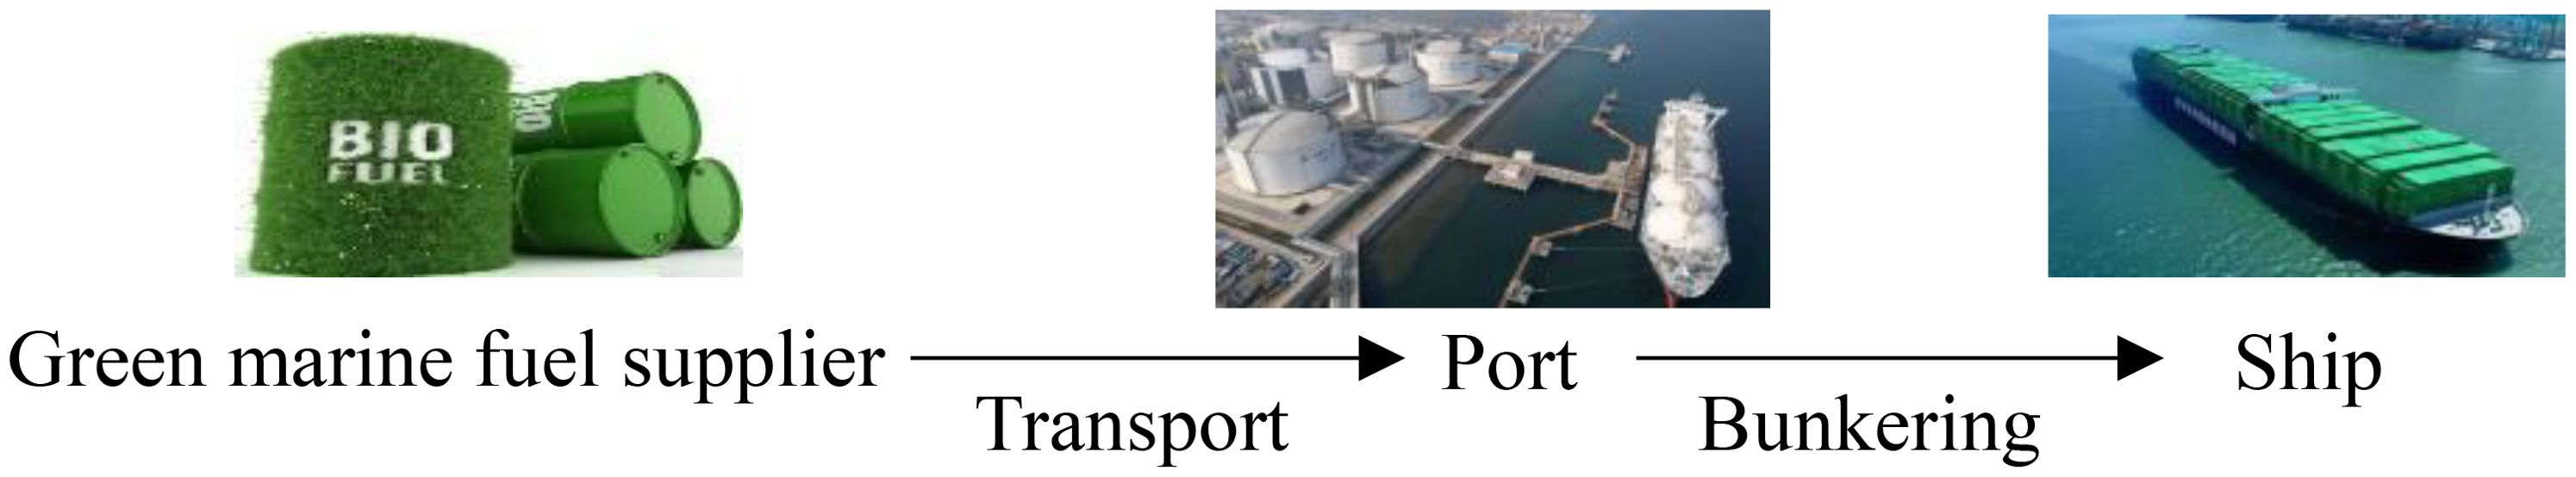
Figure 1. The marine green fuel supply chain.
The purpose of this study is to provide reasonable suggestions for ports and green marine fuel suppliers on the cost and revenue-sharing of marine green fuel bunkering facility projects. The subsequent content of this paper is arranged as follows: Section 1 presents a literature review. Section 2 constructs a coordination model for the marine green fuel supply chain considering four cooperation models between a port and green marine fuel supplier: no contract (N), cost-sharing contract (C), revenue-sharing contract (R), and revenue-sharing + cost-sharing contract (RC), and solves these four models. Section 3 compares the sales price of marine green fuel, bunkering service quality, and the profits of the port and green marine fuel supplier across the four models. Section 4 conducts data simulations for the above four models. Section 6 presents the conclusions of the paper.
The marine green fuel supply chain studied in this paper mainly involves green facility construction in green ports and strategic coordination among stakeholders. Lu and Huang (2021) constructed a tripartite evolutionary game model consisting of a government, a port company, and a shipping company to study the impact of government subsidy on shore power construction and shore power usage. Kolakowski et al. (2024) studied the location optimization problem of green fuel refueling facilities in ports and used Polish ports as a case study. Karagkouni and Boile (2024) reviewed 380 records of green practices explored by ports and port-related stakeholders worldwide, and the result shows that green infrastructure investment in ports should be matched with their own environmental needs and financial capabilities. Christodoulou et al. (2025) argued that the investment in green fuel refueling facilities at ports is enormous, which would have a certain impact on the sales price of green fuel for shipping companies. In terms of strategic coordination among stakeholders, Xiao et al. (2025b) and Ashrafi et al. (2020) argue that collaborating with stakeholders is essential for the green development of ports. Zhou et al. (2023) investigated the future development of green ports and their relationship with the environment and society, emphasizing that this relationship is crucial for attracting stakeholders to participate in green port construction. Ismail et al. (2024) showed that when green ports join the global supply chain, they should consider various opportunities and challenges, and argue that ports can reduce maritime greenhouse gas emissions by establishing green shipping corridors.
Ghosh and Shah (2015) constructed two cooperative models between manufacturer and retailer considering cost-sharing, one in which the retailer offers a cost-sharing contract and the other in which the manufacturer and retailer negotiate on a cost-sharing contract, comparing the differences in decisions made by manufacturer and retailer in these two models. Guo et al. (2022) proposed a mixed-integer linear programming model and investigated two cooperative scenarios and four types of cost-sharing contracts, finding that horizontal collaboration enables supply chain entities to make optimal decisions. Jun et al. (2023) explored two models, namely a cost-sharing contract and a revenue-sharing contract, and their impact on the profits of new energy vehicle supply chain entities after collaborative decision-making. The study found that a combination of cost-sharing and revenue-sharing contracts can more effectively stimulate the innovative vitality of new energy battery suppliers and improve their technological innovation level. Shen (2024) analyzed a cost-sharing optimization problem in a green supply chain network involving a manufacturer and a retailer, considering two types of cost-sharing contracts to reduce the retailer’s promotion cost. The study suggested that a cost-sharing contract can enhance the environmental friendliness of the product. Shen et al. (2024) studied the impact of a cost-sharing contract on uncertain factors in the dynamic network structure of a supply chain. The numerical experiment showed that in uncertain environments, a cost-sharing contract proposed by either the manufacturer or retailer contributes to improving the greenness of the product and the overall profit of the supply chain. Zou et al. (2024) constructed a stochastic differential game model of a green supply chain considering cost-sharing, focusing on green technological innovation collaboration in supply chains. The study revealed that in green product innovation when the market preference for greenness is relatively low, the formation of a cost-sharing contract is less influenced by the intensity of competition in the green market.
Ye et al. (2019) constructed an evaluation function and a game theory-based machine learning algorithm considering port resource sharing, studying the revenue-sharing decision-making mechanism of ports under different parameters. Xu et al. (2022d) built a game theory model to analyze the cooperation between two ports with capacity sharing, discussing three types of competitive game interactions: the benchmark model, passive sharing, and proactive sharing. By determining the optimal berth quantity and service price, the model is intended to maximize port revenue. Chen et al. (2023) proposed a model to facilitate multi-port cooperation by adjusting capacity and conducting market share transactions, considering compensation paid by the port for market share transactions and government subsidy sharing. Lu and Tan (2023) constructed a two-stage game model for a port supply chain consisting of a port service provider and a port enterprise, and both parties used a revenue-sharing contract as the coordination mechanism. The results showed that a revenue-sharing contract could achieve Pareto improvement, thereby increasing the revenue of the port supply chain. Wang and Zhu (2023) constructed a multi-stage Stackelberg model comprising a government, hub port, and shipping company with different power structures, designing an optimal government subsidy and the best contract for revenue-sharing between the hub port and shipping company. Wang et al. (2024) proposed a vertical structure model considering the interaction between the port, carrier, and shipper, where carriers maximize their profits by determining their freight rate and the revenue shared with the carrier. Luo and Chang (2024) studied the problem of empty container capacity planning and channel coordination in a dual-channel container transportation service chain, introducing an improved revenue-sharing contract between freight forwarder and carrier, and analyzing the Pareto improvement range of the contract parameters.
The above studies in the literature have conducted in-depth and extensive research in the fields of marine green fuel supply chains, cost-sharing contracts, and revenue-sharing contracts. However, these studies have not addressed the following questions. First, how do cost-sharing and revenue-sharing contracts affect the decisions and profits of a port and green marine fuel supplier? Second, what impacts do cost-sharing and revenue-sharing contracts have on the selling price of new marine fuel and the quality of the bunkering service? Therefore, this paper focuses on these two issues to promote the research and development of green ports in the field of marine green fuel supply chains.
We consider a two-echelon marine green fuel supply chain optimization model consisting of a green marine fuel supplier and a port. The port is responsible for services such as the bunkering of green fuel, while the green marine fuel supplier wholesales marine green fuel to the port, which then sells the marine green fuel to shipping companies. There are four cooperation modes between the port and green marine fuel supplier: N, C, R, and RC. The game sequence between the port and green marine fuel supplier is as follows:
Step 1: The port decides the quality of the marine green fuel bunkering service is quality θ. The higher θ is, the more attractive the port’s green fuel bunkering service is to shipping companies.
Step 2: The green marine fuel supplier determines the marine green fuel wholesale to be price w and transportation cost l.
Step 3: The port decides the selling price p of marine green fuel. The bunkering volume D of marine green fuel is influenced by both the selling price p and the bunkering service quality θ, i.e., , where a represents the market size, b is the sensitivity coefficient of the selling price p, and α is the sensitivity coefficient of the marine green fuel bunkering service quality θ. The order of game decision-making and solution is shown in Figure 2.
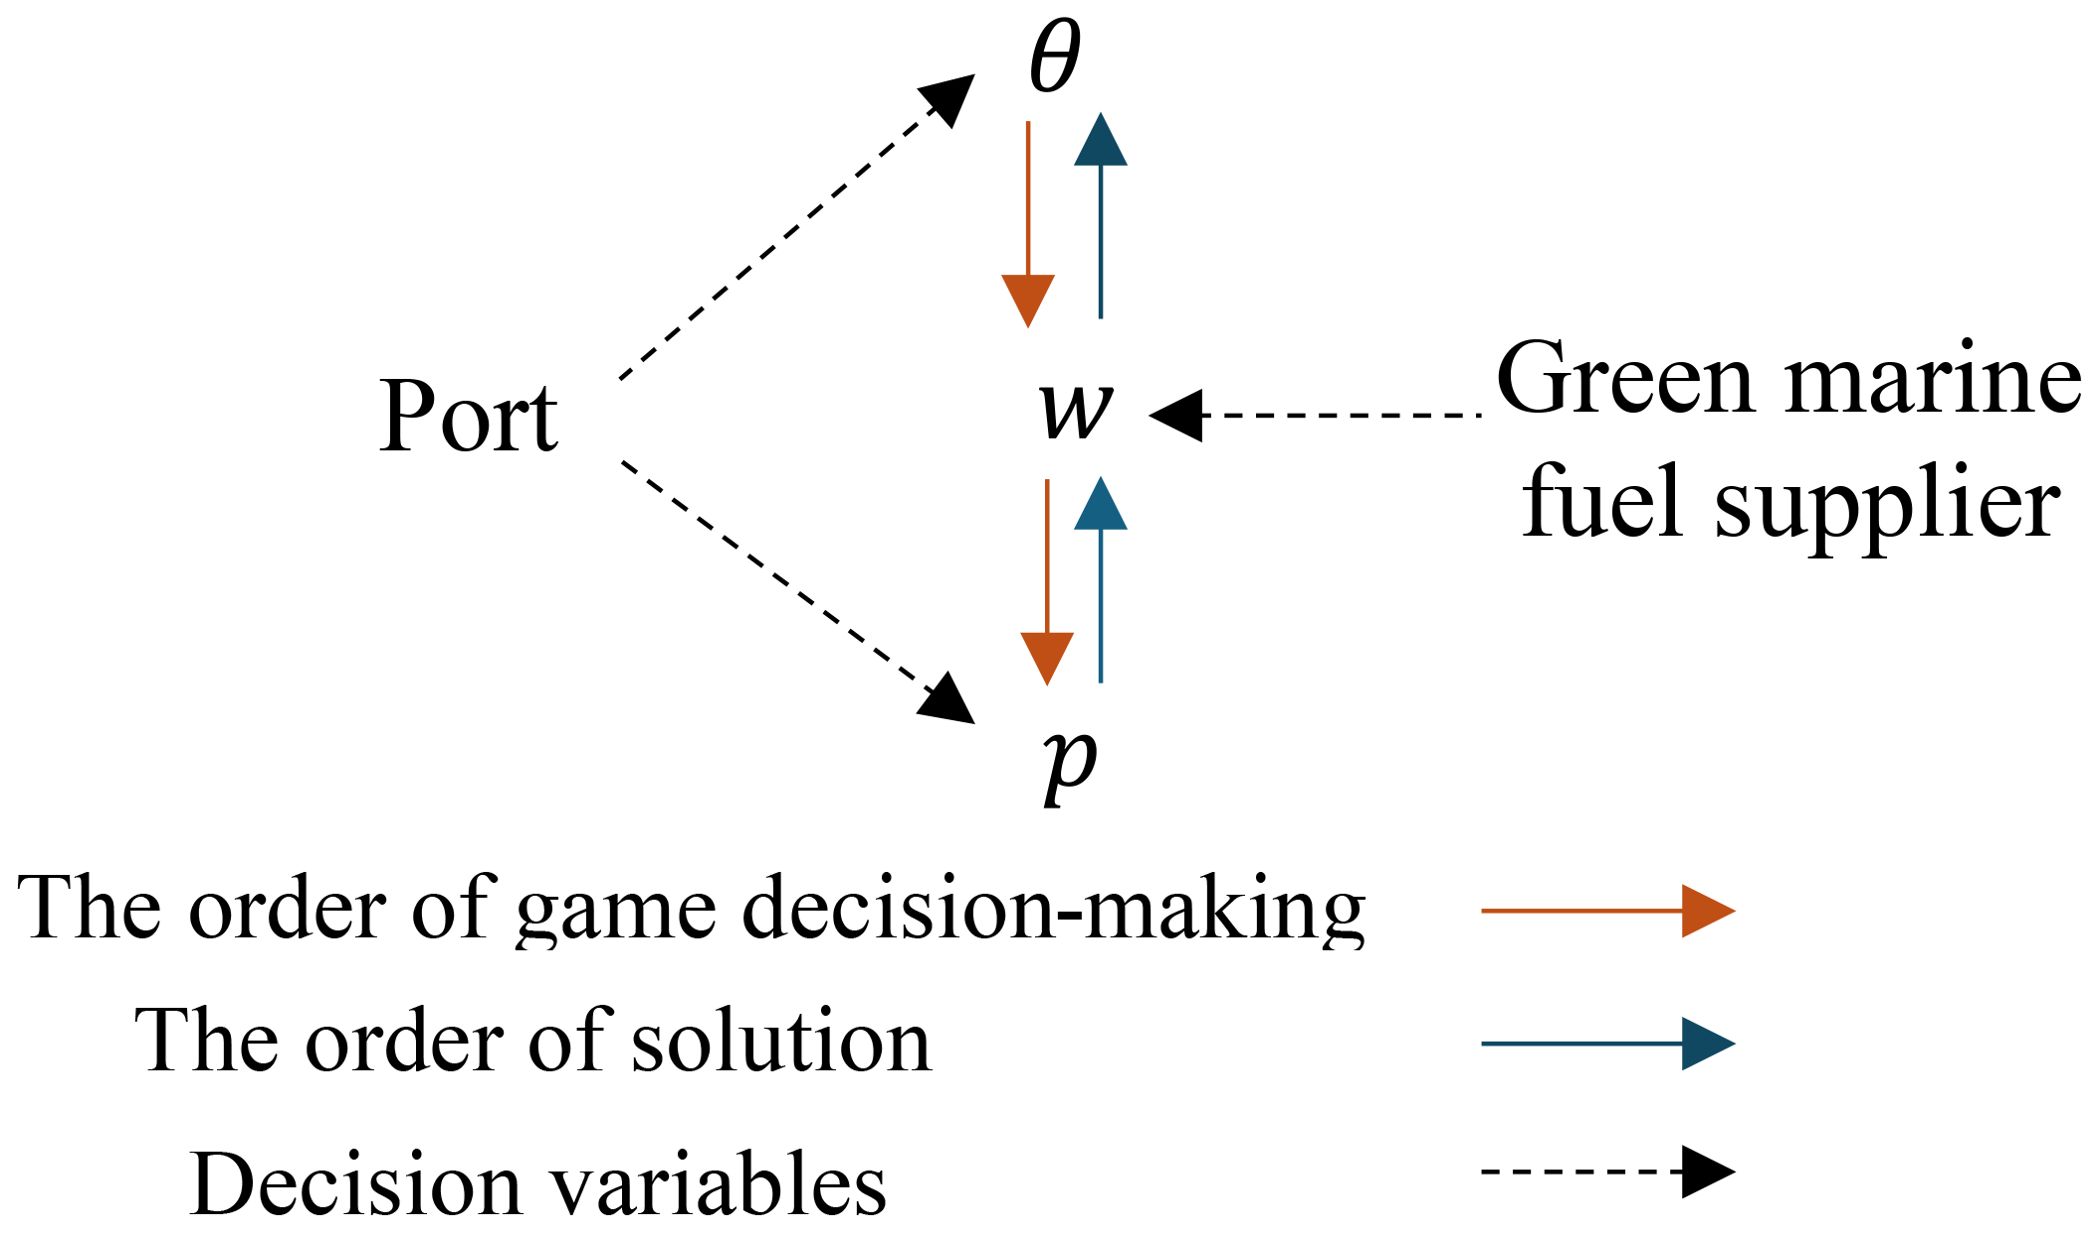
Figure 2. The order of game decision-making and the solution.
The assumptions of the paper are as follows:
1. Only one type of marine green fuel is considered.
2. The port and green marine fuel supplier are both rational individuals, who pursue maximum profits and abide by agreements.
3. We only consider the single period of the construction of marine green fuel bunkering service quality.
The parameters and variables and the corresponding descriptions are shown in Table 1.
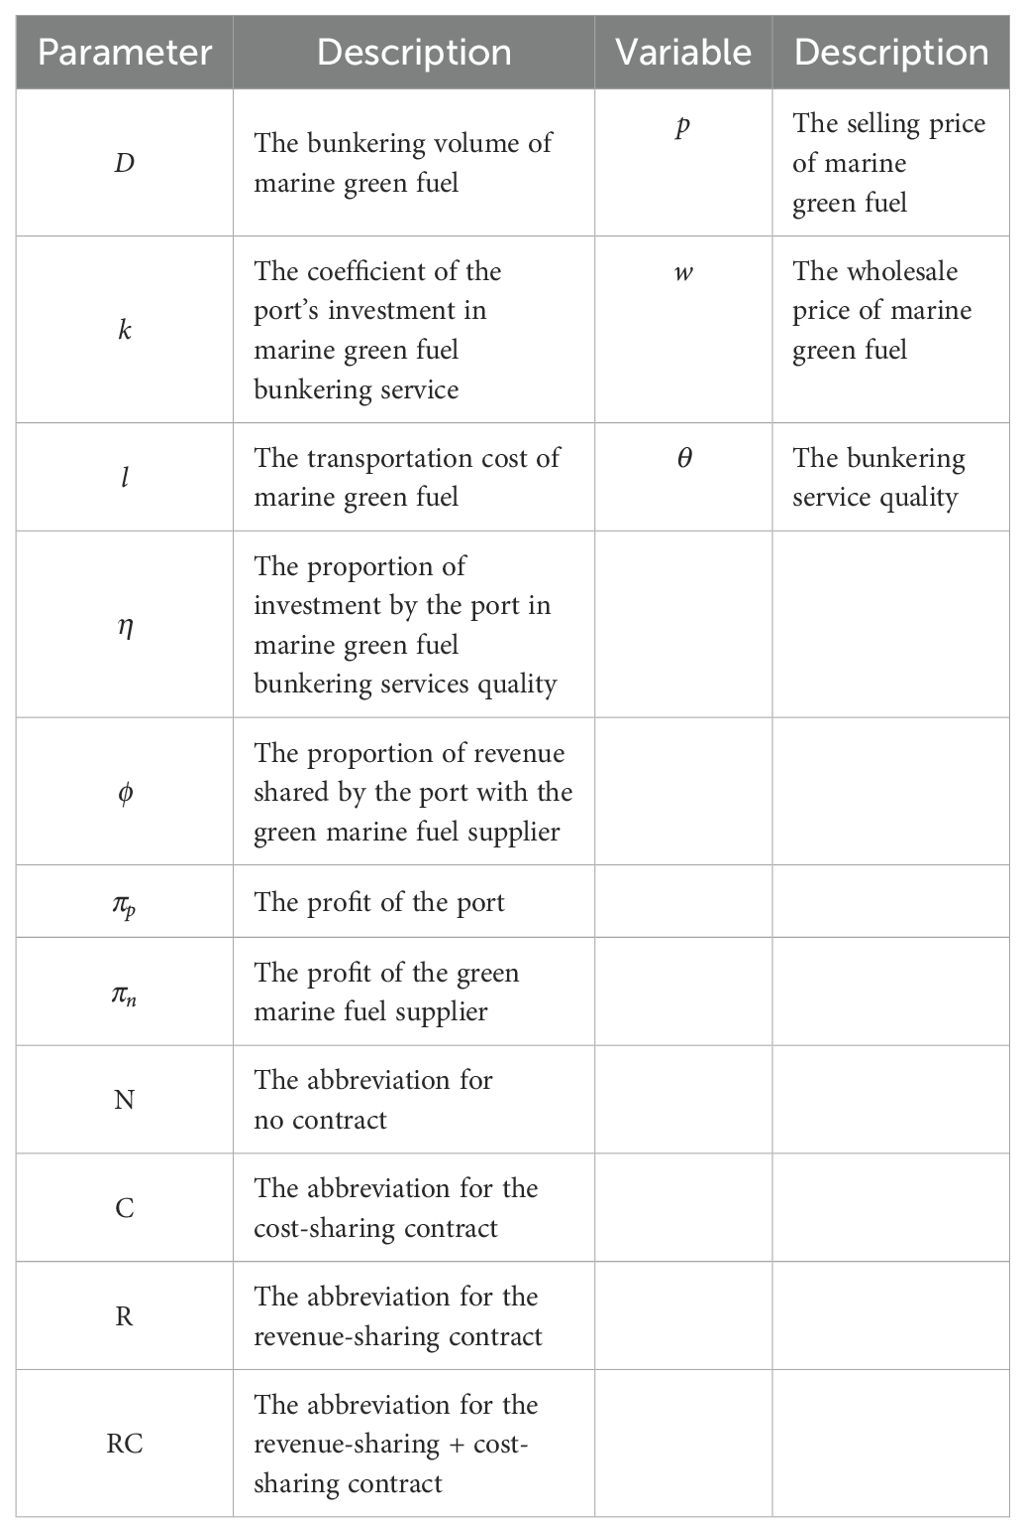
Table 1. Description of parameters and variables.
First, we analyzed the decisions of the port and green marine fuel supplier in the absence of a contract. When there is no contract between the port and green marine fuel supplier, the port’s profit is:
In Equation 1 where is the sales revenue, is the port’s investment in the marine green fuel bunkering service. By solving , we obtain:
The profit of the green marine fuel supplier is:
By solving , the optimal solution of Equation 3 can be obtained:
Equation 4 Representing the optimal value of w. Substituting into Equation 2 gives , so is:
By solving , the optimal solution of Equation 5 can be obtained:
Based on Equation 6, we can calculate , , , and .
This section explores the scenario where the port and green marine fuel supplier sign a cost-sharing contract. Under the implementation of the cost-sharing contract between the port and green marine fuel supplier, the port’s profit is as follows:
By solving Equation 7, the optimal selling price of green marine fuel can be obtained.
The profit of the green marine fuel supplier is:
By solving Equation 9, the optimal wholesale price of green marine fuel can be obtained.
Substituting Equation 10 into Equation 8, the expression for the port’s profit can be obtained as follows:
By solving , the optimal solution of Equation 11 can be obtained:
Based on Equation 12, we can calculate , , , and .
This section explores the scenario where the port enters into a revenue-sharing contract with the green marine fuel supplier. The port’s profit is as follows:
By solving Equation 13, the optimal selling price of green marine fuel can be obtained.
The profit of the green marine fuel supplier is as follows:
By solving Equation 15, the optimal wholesale price of green marine fuel can be obtained.
By substituting Equation 16 into Equation 14, the expression for the port’s profit can be obtained as follows:
By solving , the optimal solution of Equation 17 can be obtained:
Based on Equation 18, we can calculate , , , , .
This section explores the scenario where the port enters into a revenue-sharing + cost-sharing contract with the green marine fuel supplier. The port’s profit in this case is as follows:
By solving Equation 19, the optimal selling price of green marine fuel can be obtained.
The profit of the green marine fuel supplier is as follows:
By solving Equation 21, the optimal wholesale price of green marine fuel can be obtained.
By substituting Equation 22 into Equation 20, the expression for the port’s profit can be obtained as follows:
By solving , the optimal solution of Equation 23 can be obtained:
Based on Equation 24, we can calculate , , , , .
Based on the calculations of the above four models, we can obtain the values of p, w, θ, D, , and in the four different scenarios. The specific calculation results are shown in Table 2.
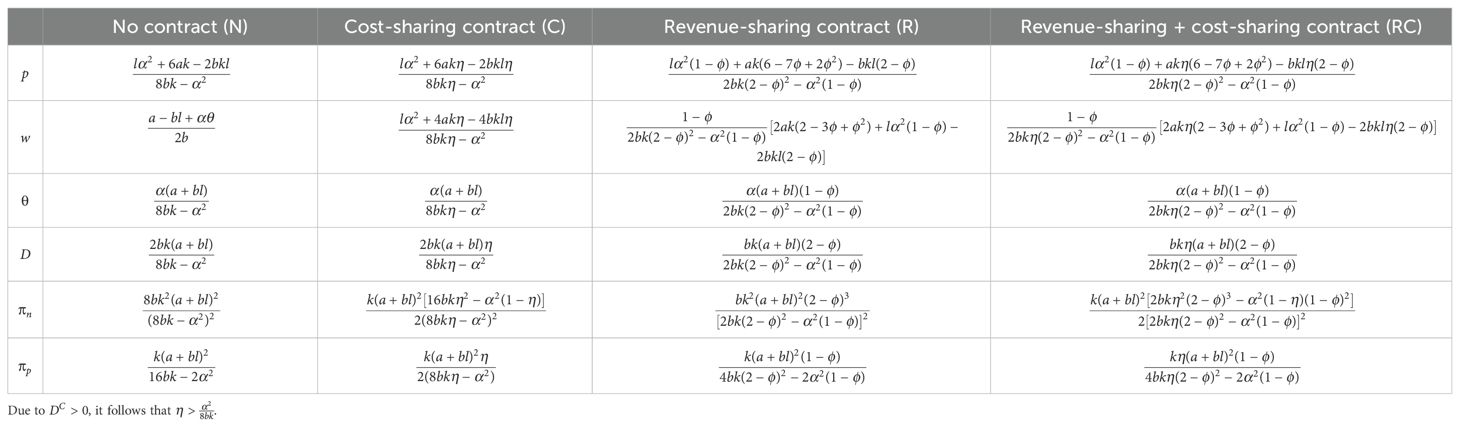
Table 2. Calculation results under four contracts.
Proposition 1: The selling price of green marine fuel is highest under the cost-sharing contract and lowest under the revenue-sharing contract.
Proof: According to Table 1, we have . When , achieves its minimum value, i.e., min . Therefore, . Similarly, it can be proven that . At the same time, we can calculate that
Due to , it is easy to prove that . Since , we can deduce that . Clearly, in Equation 25. When , attains its maximum value, and max . Therefore, . Similarly, it can be proven that .
Proposition 2: The service quality of marine green fuel bunkering is highest under the cost-sharing contract and lowest under the revenue-sharing contract. When , the service quality of marine green fuel bunkering without any contract is higher than that under the revenue-sharing + cost-sharing contract. , , ; otherwise, .
Proof: According to Table 1, since , it is evident that , thus . We can calculate that , so when , attains its maximum value, i.e., max . Therefore, . In summary, we can conclude that .
Because , so when , attains its maximum value, and max , so . Because , so when , obtains the minimum value, and min , so . In summary, we can conclude that .
Therefore, we can conclude that the service quality of marine green fuel bunkering is highest under the cost-sharing contract and lowest under the revenue-sharing contract.
Because , , therefore, if . This indicates that the service quality of marine green fuel bunkering without a contract is higher than that under the combined cost-sharing and revenue-sharing contract.
Proposition 3: If , ], then . If , then .
Proof: Because , where , according to , we know that , and therefore , so is the convex number of .
By solving , we obtain and . Furthermore, , implying that . Therefore, when is in the interval (0, ], . In the interval [, 1], .
Proposition 4: When , , otherwise .
Proof: According to Table 1, we can see
According to , we know that . So when , clearly , if , obtain the minimum value, and . Therefore . When , apparently in Equation 26 , if , obtains the maximum, and . Therefore .
Proposition 5: .
According to Table 1, we know that,
in Equation 27 Let
According to Equations 28, 29 We can find out , because , so and , apparently , so we can determine , namely for of the convex function. By solving , it can be concluded that , , and , so . Therefore, when , , i.e. .
We verified the computational and analytical results of the model through numerical examples. The data in reality is difficult to obtain, and our research is theoretical, so we formulated data through hypotheses, but it does not affect the validation of the model. Considering the four scenarios, i.e., N, C, R, and RC, we set the parameters as follows: the market size for green marine fuel a=80, b=3, the sensitivity coefficient for service quality of green marine fuel bunkering k=1, transportation cost l=2, and α=2. We assumed that the port’s investment proportion in service quality of green marine fuel bunkering was η=0.5, and the revenue-sharing proportion given by the port to the green marine fuel supplier was =0.6. The selling price p, wholesale price w, service quality θ, bunkering volume D, and the profits of the green marine fuel supplier and the port under the four cooperation models are presented in Table 3.
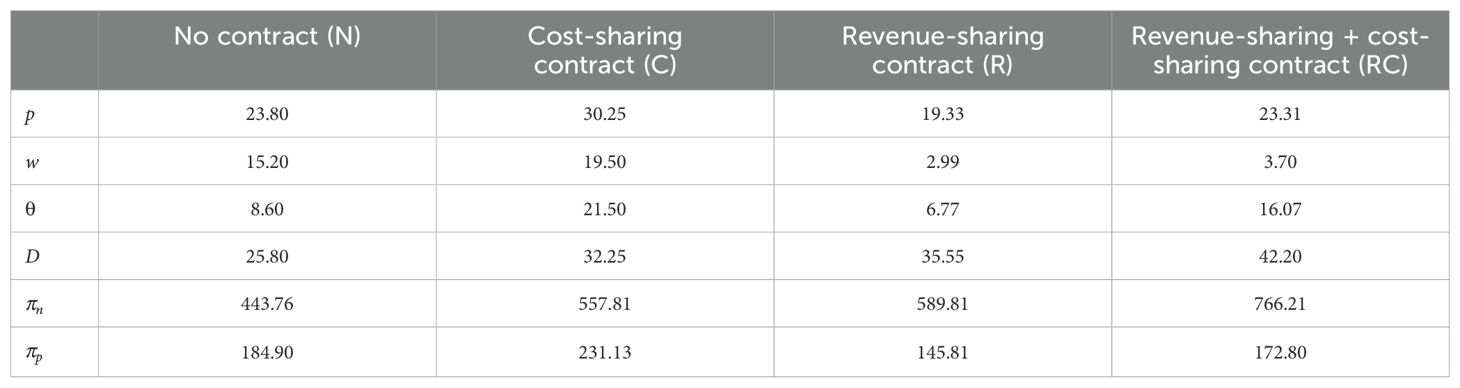
Table 3. Computational results for the four models.
According to Table 3, we can observe that =30.25, which is higher than and , and =19.33, which is higher than and , which verifies the correctness of Proposition 1. Additionally, =21.50, which is higher than and , while =6.77, which is lower than and . Given that =0.98 and =1.6, it is evident that . According to Proposition 2, should be higher than . From Table 2, we can see that =16.07 and =8.60, which verifies the correctness of Proposition 2.
Since =0.26, we have . According to Proposition 3, should be higher than . Given that =788.94 and =628.66, it is clear that , which verifies the correctness of Proposition 3.
Furthermore, since =0.70, according to Proposition 4, should be higher than . Given that =735.62, it is evident that , which verifies the correctness of Proposition 4. Finally, since =939.01, it is clear that , which verifies the correctness of Proposition 5.
The key factors influencing the decision-making of the port and green marine fuel supplier are the port’s investment proportion η in the service quality of marine green fuel bunkering and the revenue-sharing proportion ϕ that the port offers to the green marine fuel supplier. Therefore, we analyzed the impact of changes in η and ϕ on the marine green fuel sales price p, wholesale price w, bunkering service quality θ, bunkering volume D, and the profits of the green marine fuel supplier and the port .
According to Figure 3a, changes in η have no impact on and . As η increases, both and decrease consistently. We can calculate that, =-693.38<0 and =-877.49<0, so and are both negatively correlated with . Based on Figure 3b, variations in do not affect and . However, as ϕ increases, both and first rise and then decline, as evidenced by the second-order partial derivative =-966.87 and =-2311.92. Therefore, and are convex functions of ϕ. When ϕ equals 1, = = . If the port and green marine fuel supplier want to achieve the highest profits, they should choose the revenue-sharing + cost-sharing contract, and the proportion of investment by the port in marine green fuel bunkering services quality should be as low as possible, while the proportion of revenue shared by the port with the green marine fuel supplier should be jointly negotiated by both parties.
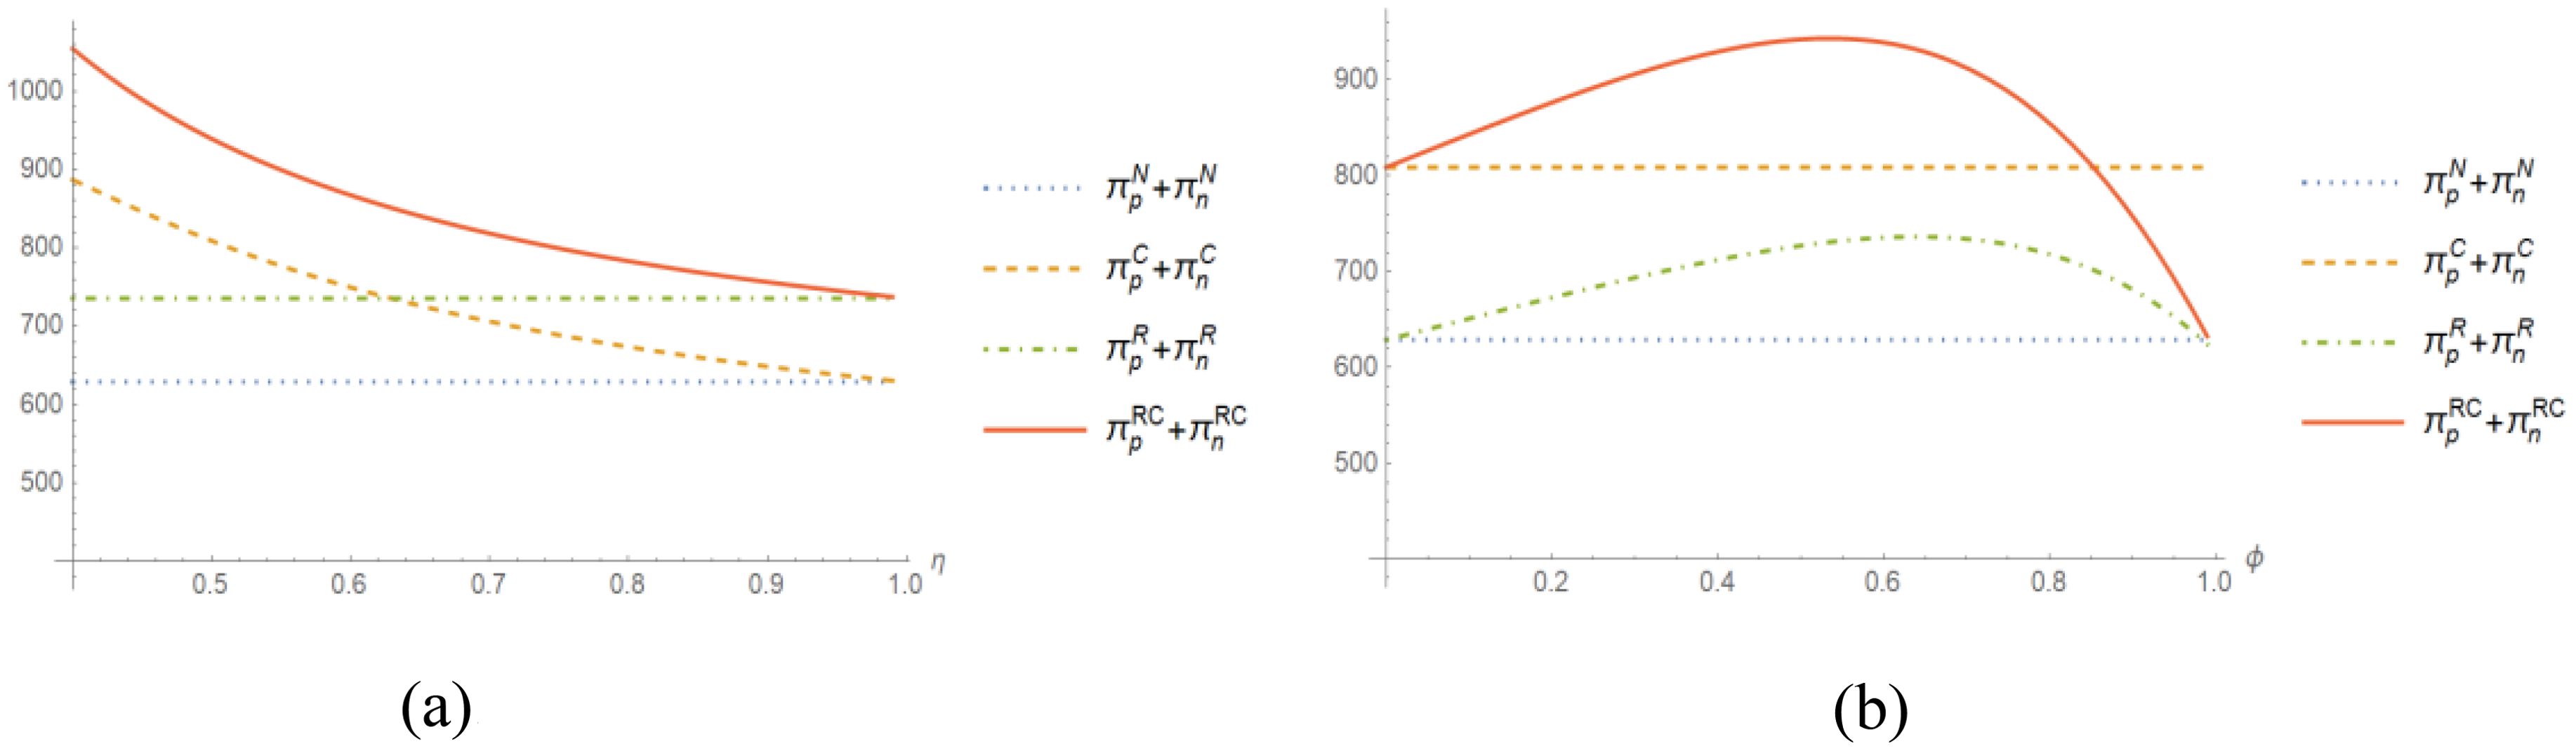
Figure 3. Impact of changes in η and ϕ on the profits of the port and green marine fuel supplier. (a) η; (b) ϕ.
According to Figure 4a, it can be observed that variations in η have no impact on and . As η increases, both and decrease, due to the partial derivative =-32.25 and =-31.54. Therefore, and are negatively correlated with η, and when η = 1, , . According to Figure 4b, as ϕ increases, decreases, due to the partial derivative =-19.40. Therefore, is negatively correlated with ϕ. However, exhibits a trend of first increasing and then decreasing, due to the second-order partial derivative =-31.93. By solving =0, we obtain =0.84 and =3.15. Since , when ϕ = 0.84, reaches its maximum value of 44.05. Additionally, when ϕ=1, . If the port and green marine fuel supplier want to increase the sales volume of marine green fuel, they should choose the revenue-sharing + cost-sharing contract, and at the same time reduce the proportion of investment by the port in marine green fuel bunkering services quality and increase the proportion of revenue shared by the port with the green marine fuel supplier.
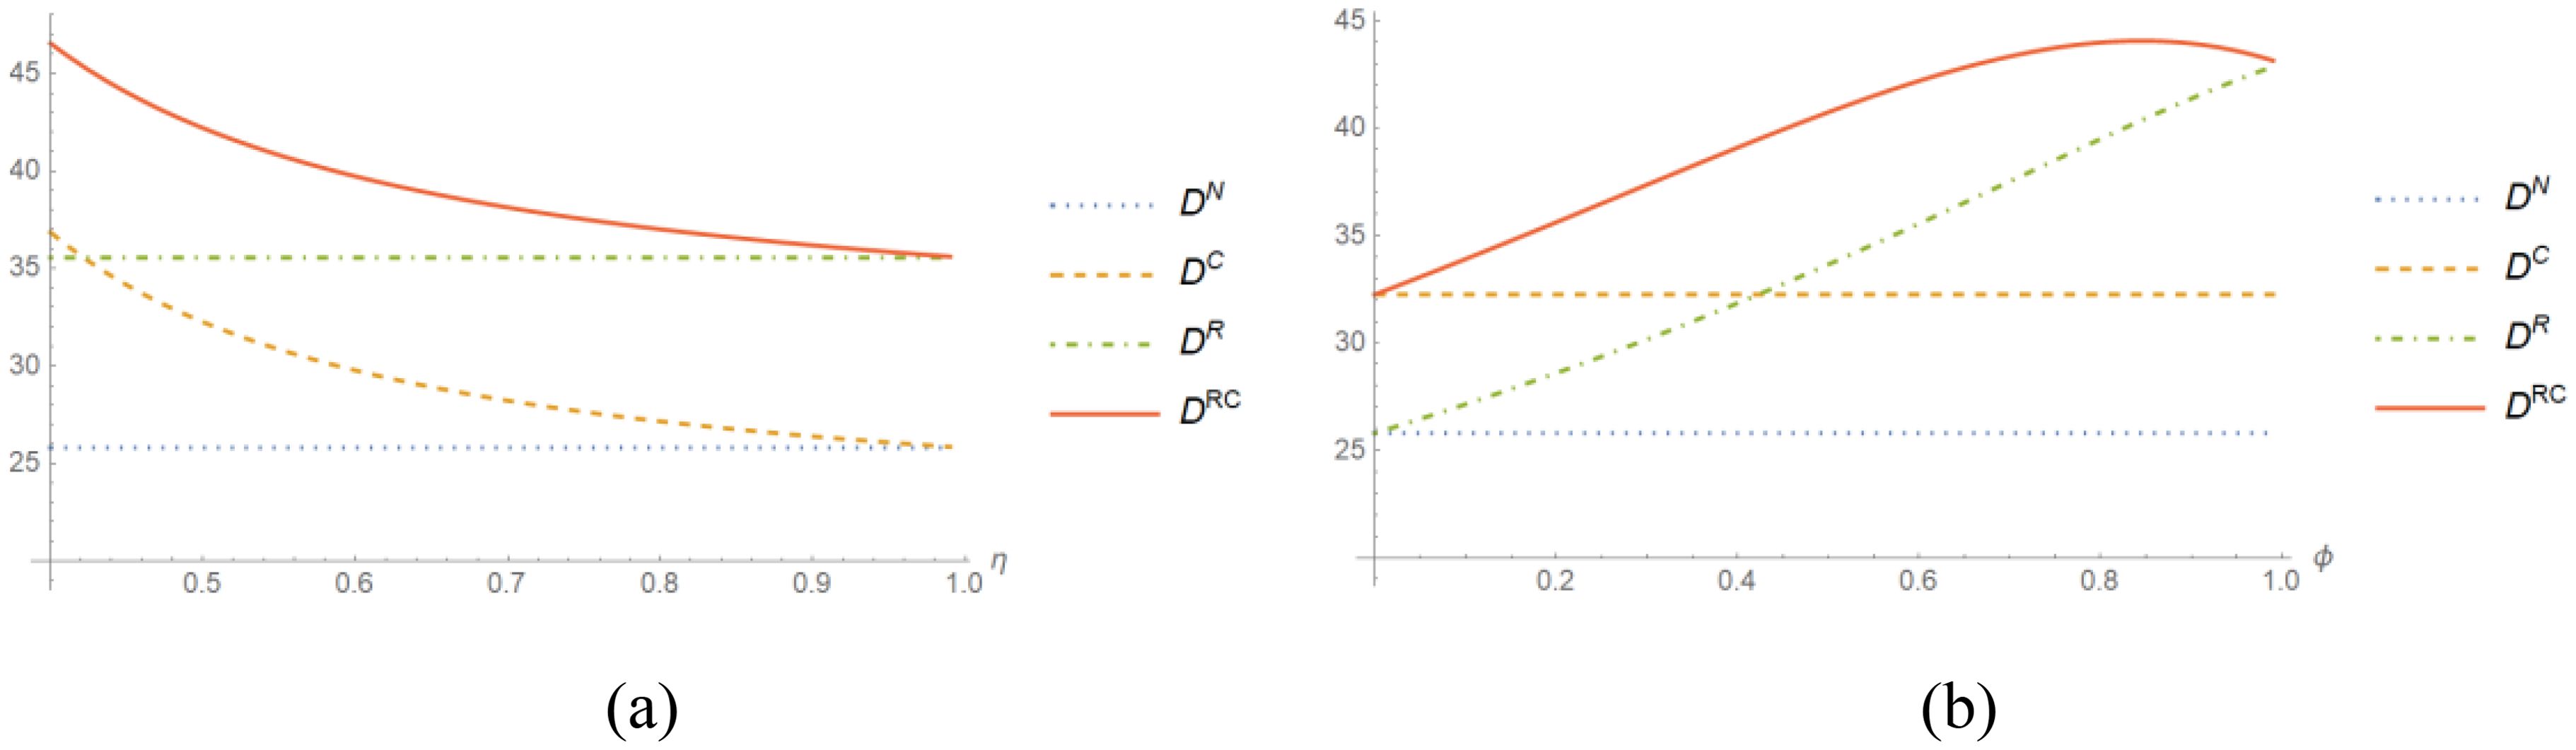
Figure 4. Impact of changes in η and ϕ on the bunkering volume D.. (a) η; (b) ϕ.
According to Figure 5a, changes in η have no effect on and . As η increases, both and decrease, due to the partial derivative =-32.25 and =-18.93. Therefore, and are negatively correlated with η, and when η= 1, , . According to Figure 5b, as ϕ increases, both and decrease, due to the partial derivative =-12.06, =-20.19. Therefore, both and are negatively correlated with ϕ, and when ϕ= 1, . The selling price of marine green fuel is negatively correlated with the proportion of investment by the port in marine green fuel bunkering services quality and the proportion of revenue shared by the port with the green marine fuel supplier under the revenue-sharing + cost-sharing contract.
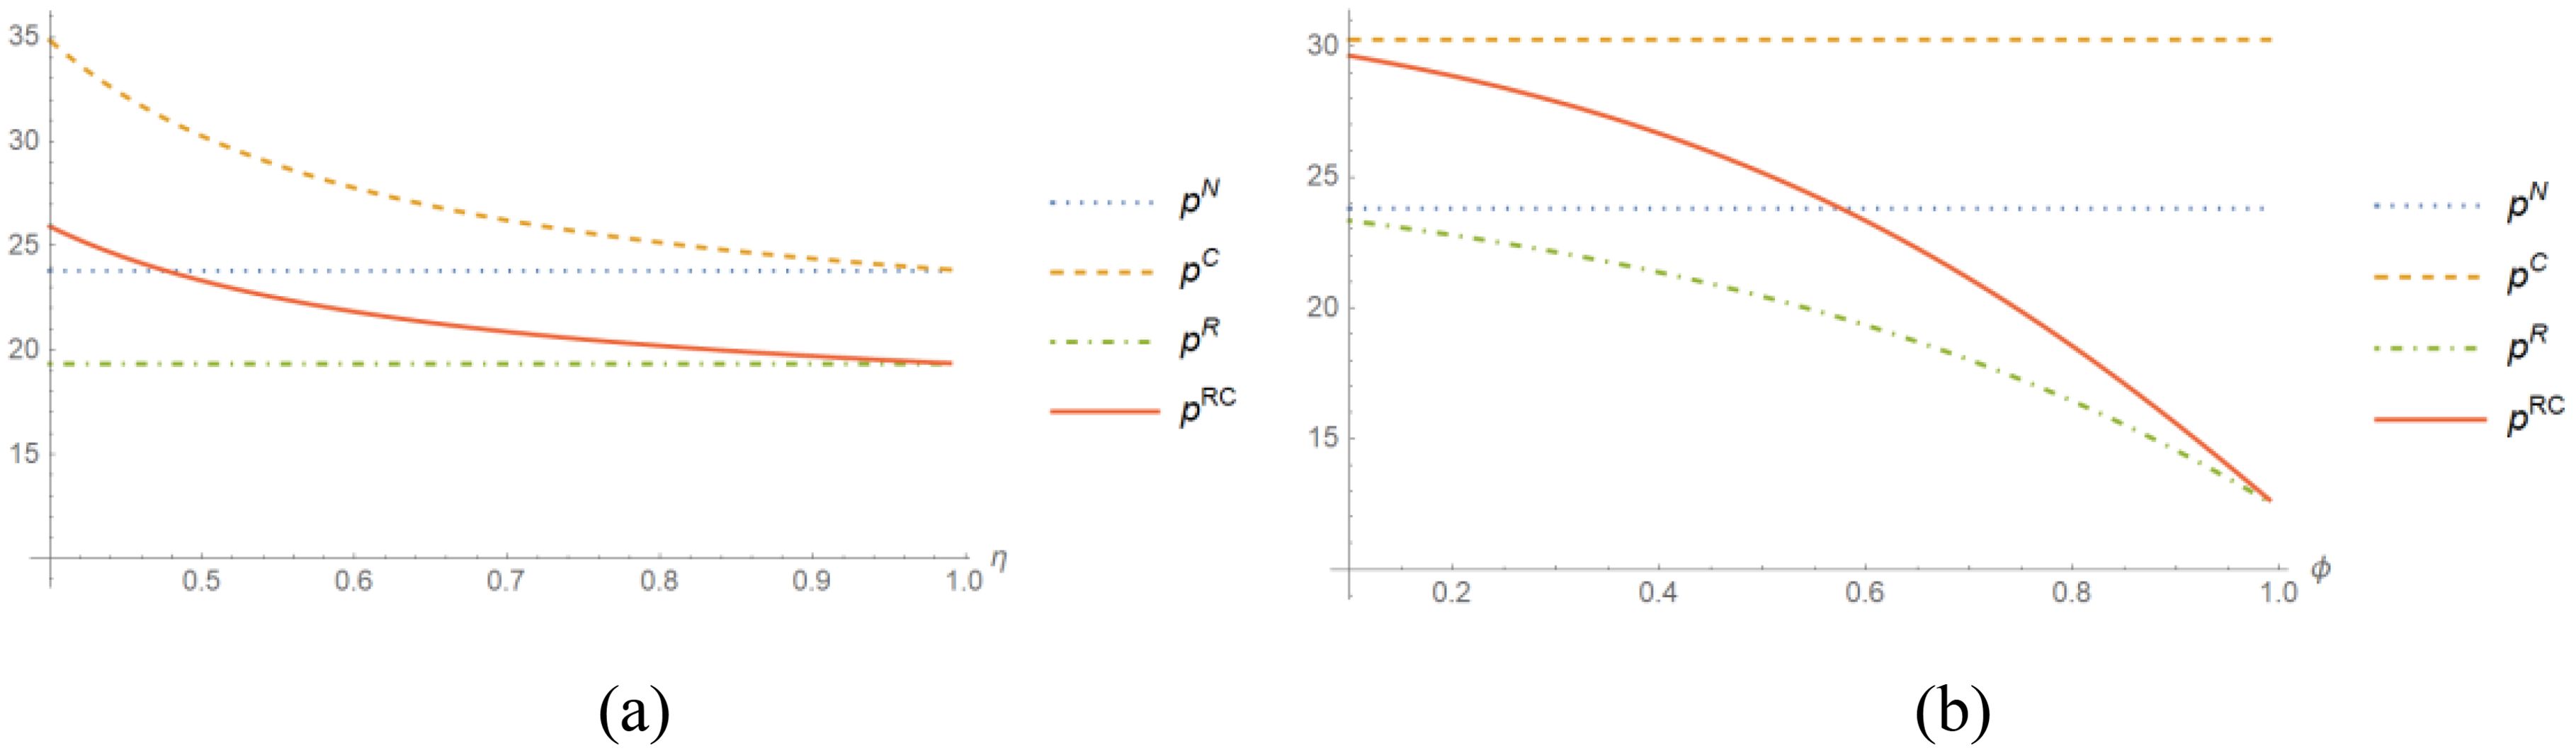
Figure 5. Impact of changes in η and ϕ on the sales price p.. (a) η; (b) ϕ.
According to Figure 6a, it can be observed that changes in η have no impact on and . As η increases, both and decrease, due to the partial derivative -21.50, =-3.37. Therefore, and are negatively correlated with η, and when η=1, , . According to Figure 6b, as ϕ increases, both and decrease, with the partial derivative -14.89, =-19.09. Thus, and are negatively correlated with ϕ, and when ϕ=1, . There is a correlation between the wholesale price of marine green fuel and the proportion of investment by the port in marine green fuel bunkering services quality, and the proportion of revenue shared by the port with the green marine fuel supplier under the revenue-sharing + cost-sharing contract is consistent with the sales price.
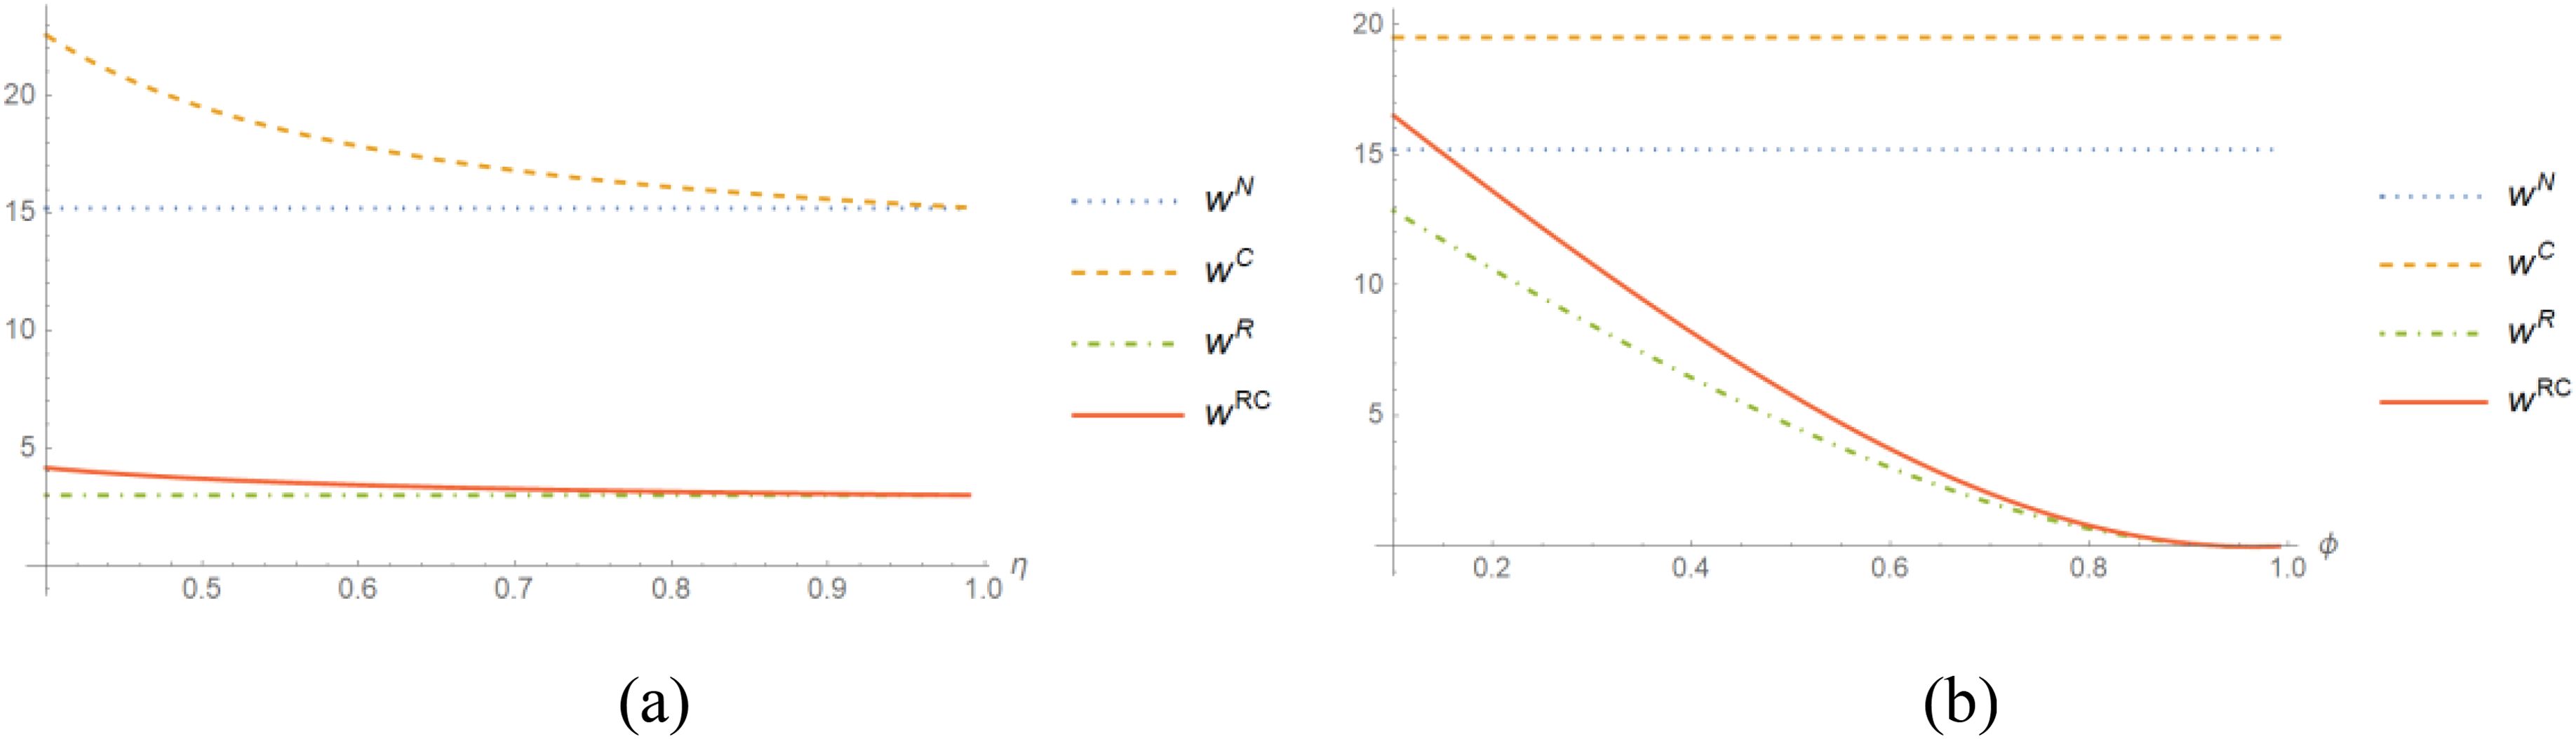
Figure 6. Impact of changes in η and on the wholesale price w.. (a) η; (b) ϕ.
According to Figure 7a, it can be observed that changes in have no effect on and . As increases, both and decrease, with the partial derivative =-64.50, -8.39. Therefore, and are negatively correlated with η, and when η = 1, and . According to Figure 7b, as ϕ increases, both and decrease, with the partial derivative -44.17, -23.66. Thus, and are negatively correlated with ϕ, and when ϕ = 1, . There is a correlation between service quality and the proportion of investment by the port in marine green fuel bunkering services quality, and the proportion of revenue shared by the port with the green marine fuel supplier under the revenue-sharing + cost-sharing contract is consistent with the sales price too.
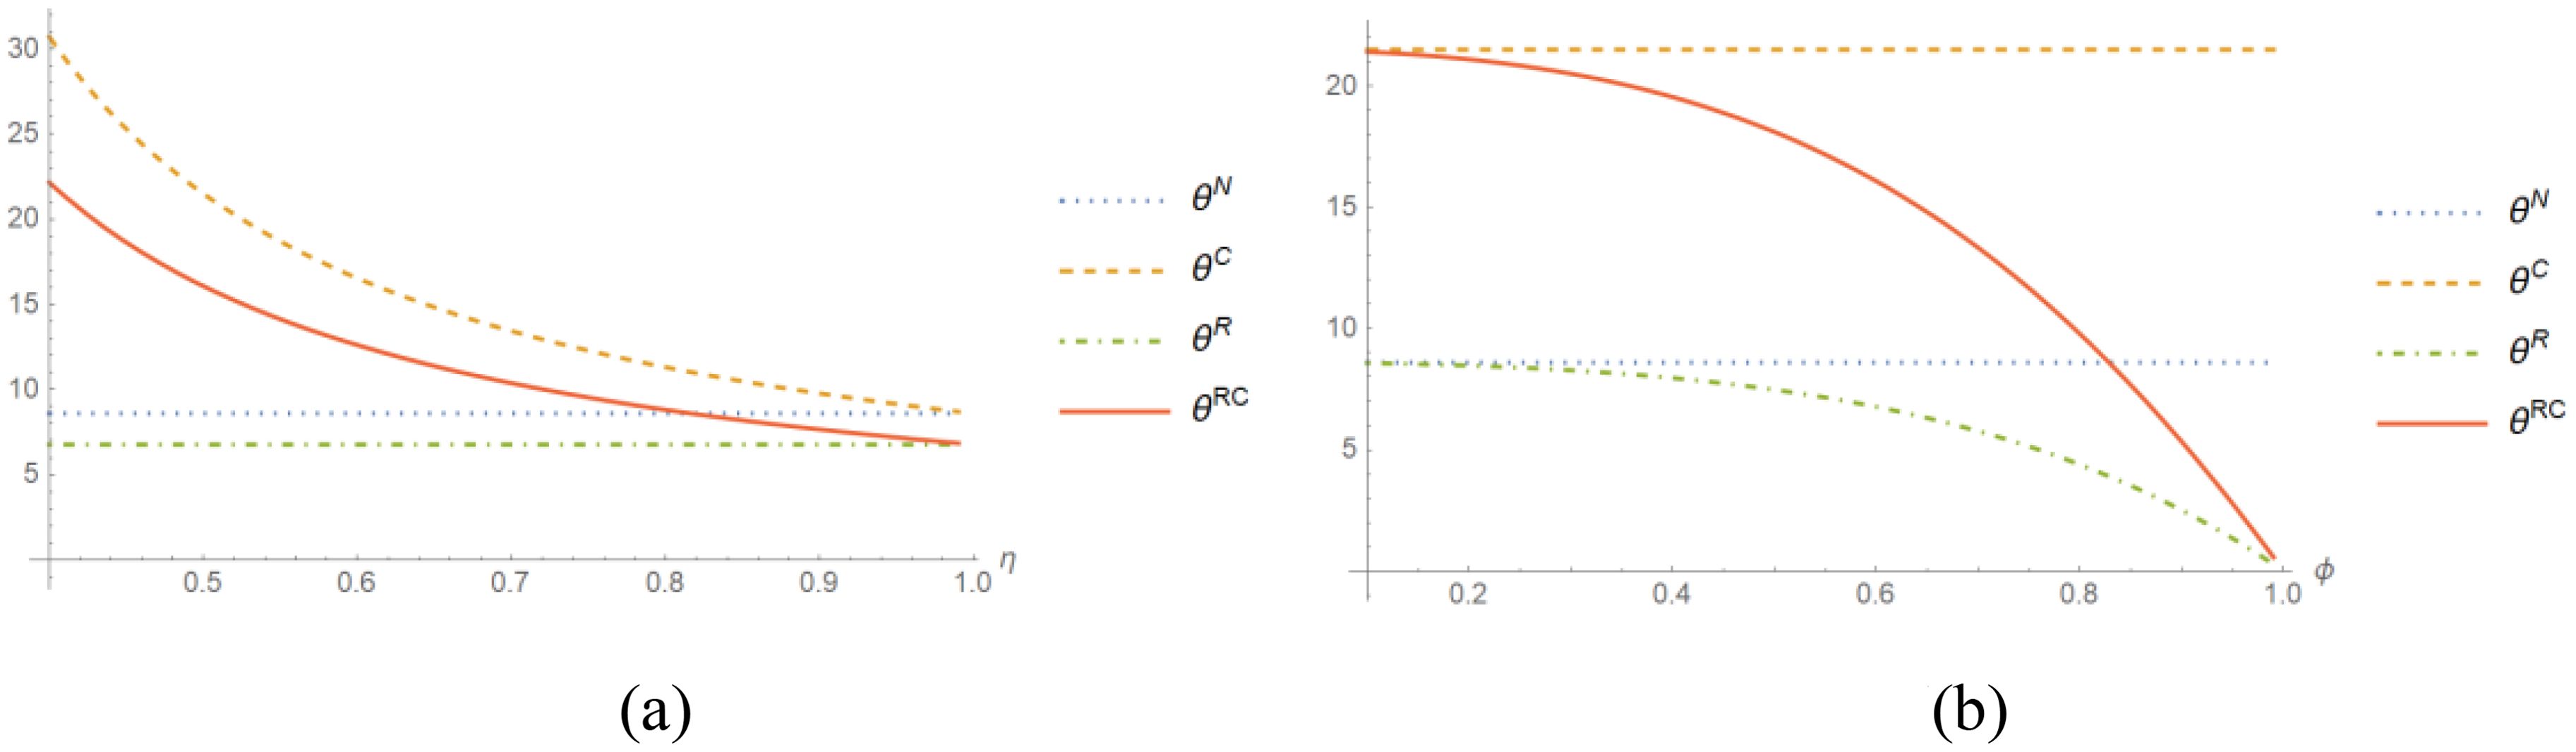
Figure 7. Impact of changes in η and ϕ on the service quality θ.. (a) η; (b) ϕ.
According to Figures 3–7, we can determine that if the proportion of investment in the service quality of marine green fuel bunkering undertaken by the port is too high, it will reduce the willingness of the port to invest, leading to a decrease in bunkering service quality, sales prices, and sales volume of marine green fuel, and causing a decrease in the overall profit of the marine green fuel supply chain. The increase in revenue shared by the port with the green marine fuel supplier will increase the green marine fuel supplier’s enthusiasm, thereby reducing the wholesale price and causing a decrease in the sales price, thereby increasing the bunkering volume of the green marine fuel. The key factors affecting the overall profit of the marine green fuel supply chain are the sales price and bunkering volume of the green marine fuel. When the sales price decreases and bunkering volume increases, it will have both positive and negative effects on the overall profit of the marine green fuel supply chain. Therefore, the overall profit of the marine green fuel supply chain will first increase and then decrease.
Green port construction has emerged as a focal issue in academic literature. This paper examines cooperation within the marine green fuel supply chain, consisting of a port and a green marine fuel supplier. The study compares the decisions and profits of the port and the green marine fuel supplier under four different contracts: no contract, cost-sharing contract, revenue-sharing contract, and revenue-sharing+ cost-sharing contract. The findings reveal that:
1. The combined profit of the port and the green marine fuel supplier is higher under the revenue-sharing+ cost-sharing contract than under the revenue-sharing contract alone. The sales price of marine green fuel and the quality of bunkering service are highest under the cost-sharing contract and lowest under the revenue-sharing contract.
2. As the port’s investment proportion in the quality of marine green fuel bunkering service increases, the bunkering volume, sales price, wholesale price, and quality of bunkering services under both the cost-sharing contract and revenue-sharing+ cost-sharing contract decrease.
3. As the proportion of revenue shared by the port with the green marine fuel supplier increases, the sales price, wholesale price, and quality of bunkering services of marine green fuel under both the revenue-sharing contract and revenue-sharing+ cost-sharing contract decrease.
The cost-sharing contract and revenue-sharing contract can both increase the overall profit of the marine green fuel supply chain, therefore the revenue-sharing + cost-sharing contract is the optimal choice for the port and the green marine fuel supplier. It should be noted that the port is a direct investor in the marine green fuel bunkering service, therefore, the cost-sharing contract is aimed at increasing the enthusiasm of the port. If the green marine fuel supplier can accept an increase in the proportion of investment by the port in marine green fuel bunkering service quality, it will increase the enthusiasm of the port, which will improve the bunkering service quality, sales price, and bunkering volume of the green marine fuel, and thus increase the overall profit of the marine green fuel supply chain. Therefore, the green marine fuel supplier needs to bear as high a cost proportion as possible. The role of revenue-sharing is to increase the enthusiasm of the green marine fuel supplier. An increase in green marine fuel enthusiasm will lower the wholesale price, resulting in a decrease in sales price and an increase in the bunkering volume of the green marine fuel. This phenomenon will lead to an overall increase and then decrease in the profit of the marine green fuel supply chain.
This paper also acknowledges certain limitations. First, the marine green fuel supply chain should ideally include a green marine fuel supplier, a port, and a shipping company. However, this paper did not consider the impact of a shipping company’s participation in the marine green fuel supply chain on the decisions of a green marine fuel supplier and a port. Second, some governments provide subsidies for the construction of marine green fuel bunkering facilities in ports, which could affect the profits and decisions of a port and a green marine fuel supplier. This aspect has not been considered in this thesis. Both of these limitations represent potential areas of future research.
The original contributions presented in the study are included in the article/supplementary material. Further inquiries can be directed to the corresponding author.
C-yX: Conceptualization, Funding acquisition, Methodology, Visualization, Writing – original draft. Y-qW: Formal Analysis, Validation, Writing – original draft. D-lY: Formal Analysis, Visualization, Writing – original draft. S-yQ: Validation, Writing – review & editing. HL: Project administration, Resources, Supervision, Validation, Writing – review & editing.
The author(s) declare that financial support was received for the research and/or publication of this article. We gratefully acknowledge the financial support from National Social Science Fund of China (no. 24BGL018).
The authors declare that the research was conducted in the absence of any commercial or financial relationships that could be construed as a potential conflict of interest.
The author(s) declare that no Generative AI was used in the creation of this manuscript.
All claims expressed in this article are solely those of the authors and do not necessarily represent those of their affiliated organizations, or those of the publisher, the editors and the reviewers. Any product that may be evaluated in this article, or claim that may be made by its manufacturer, is not guaranteed or endorsed by the publisher.
Altosole M., Balsamo F., Campora U., Fasano E., Scamardella F. (2024). Simulation analysis of a methanol fueled marine engine for the ship decarbonization assessment. Energies 17, 2498. doi: 10.3390/en17112498
Ashrafi M., Walker T. R., Magnan G. M., Adams M., Acciaro M. (2020). A review of corporate sustainability drivers in maritime ports: a multi-stakeholder perspective. Maritime Policy Manage. 47, 1027–1044. doi: 10.1080/03088839.2020.1736354
Chen K., Guo J. D., Xin X., Zhang T., Zhang W. (2023). Port sustainability through integration: A port capacity and profit-sharing joint optimization approach. Ocean Coast. Manage. 245, 106867. doi: 10.1016/j.ocecoaman.2023.106867
Christodoulou A., Dong T., Schönborn A., Ölçer A. I., Dalaklis D. (2025). Linking the employment of alternative marine fuels to a carbon price for shipping. Mar. Policy 171, 106452. doi: 10.1016/j.marpol.2024.106452
Deng G. D., Chen J. X., Liu Q. L. (2022). Influence mechanism and evolutionary game of environmental regulation on green port construction. Sustainability 14, 2930. doi: 10.3390/su14052930
Ghosh D., Shah J. (2015). Supply chain analysis under green sensitive consumer demand and cost sharing contract. Int. J. Production Economics 164, 319–329. doi: 10.1016/j.ijpe.2014.11.005
Guo Y. H., Yu J. Y., Allaoui H., Choudhary A. (2022). Lateral collaboration with cost-sharing in sustainable supply chain optimisation: A combinatorial framework. Transportation Res. Part E: Logistics Transportation Rev. 157, 102593. doi: 10.1016/j.tre.2021.102593
Ismail A. M., Ballini F., Ölçer A. I., Alamoush A. S. (2024). Integrating ports into green shipping corridors: Drivers, challenges, and pathways to implementation. Mar. pollut. Bull. 209, 117201. doi: 10.1016/j.marpolbul.2024.117201
Jun H., Jie W., Fei Z., Wang M. Z. (2023). Contract selection for collaborative innovation in the new energy vehicle supply chain under the dual credit policy: Cost sharing and benefit sharing. Int. J. Of Ind. Eng. Computations 15, 209–222. doi: 10.5267/j.ijiec.2023.10.003
Karagkouni K., Boile M. (2024). Classification of green practices implemented in ports: the application of green technologies, tools, and strategies. J. Mar. Sci. Eng. 12, 571. doi: 10.3390/jmse12040571
Kolakowski P., Gil M., Wrobel K. (2024). Stakeholders’ view on selecting a prospective location for marine alternative fuels bunkering station. Mar. Policy 164, 106164. doi: 10.1016/j.marpol.2024.106164
Li Z. K., Wang L. T., Wang G. L., Xin X., Chen K., Zhang T. (2024). Investment and subsidy strategy for low-carbon port operation with blockchain adoption. Ocean Coast. Manage. 248, 106966. doi: 10.1016/j.ocecoaman.2023.106966
Liu M. H., Xin X., Wang X. L., Zhang T., Chen K. (2025). Dual-channel slot sales strategy for container liner shipping companies with blockchain technology adoption. Transport Policy 162, 200–220. doi: 10.1016/j.tranpol.2024.12.006
Lu H., Huang L. (2021). Optimization of shore power deployment in green ports considering government subsidies. Sustainability 13, 1640. doi: 10.3390/su13041640
Lu Y. M., Tan Y. N. (2023). Coordination mechanism of revenue sharing contracts in port supply chains: A case study of China's Nantong Port. Sustainability 15, 11248. doi: 10.3390/su151411248
Luo T., Chang D. F. (2024). The coordination of a dual-channel container transportation service chain with an option contract. Advanced Eng. Inf. 60, 102406. doi: 10.1016/j.aei.2024.102406
Paleari S. (2022). The impact of the European green deal on EU environmental policy. J. Environ. Dev. 31, 196–220. doi: 10.1177/10704965221082222
Shen J. Y. (2024). A green supply chain with sales effort under a cost-sharing contract. Mathematics 12, 1435. doi: 10.3390/math12101435
Shen J. Y., Yan H. Y., Sheng L. X., Zhang B., Shi Y. J., Shen S. S. (2024). Pricing decision in an uncertain green product supply chain under cost sharing contract. Expert Syst. Appl. 250, 123899. doi: 10.1016/j.eswa.2024.123899
Si K. (2023). Cosco Shipping and SIPG joint green methanol project with SPIC and CCIC. Seatrade Maritime, London. September 22.
Sun L., Wang X., Hu Z., Liu W., Ning Z. (2024). Carbon reduction and cost control of container shipping in response to the European Union Emission Trading System. Environ. Sci. pollut. Res. 31, 21172–21188. doi: 10.1007/s11356-024-32434-7
Wang J., Zhu W. B. (2023). Analyzing the development of competition and cooperation among ocean carriers considering the impact of carbon tax policy. Transportation Res. Part E: Logistics Transportation Rev. 175, 103157. doi: 10.1016/j.tre.2023.103157
Wang M. R., Li Z. C., Fu X. W., Xiong Y. (2024). Revenue-sharing in the alliance of inland river and sea carriers: Formulation and a case study. Transportation Res. Part E: Logistics Transportation Rev. 183, 103419. doi: 10.1016/j.tre.2024.103419
Xiao G. N., Pan L., Lai F. B. (2025b). Application, opportunities, and challenges of digital technologies in the decarbonizing shipping industry: A bibliometric analysis. Front. Mar. Sci. 1. doi: 10.3389/fmars.2025.1523267
Xiao G. N., Tong H. L., Shu Y. Q., Ni A. N. (2025a). Spatial-temporal load prediction of electric bus charging station based on S2TAT. Int. J. Electrical Power Energy Syst. 164, 110446. doi: 10.1016/j.ijepes.2024.110446
Xu L., Shen C. X., Chen J. H. (2024c). The impact of the Maritime Silk Road Initiative on the carbon intensity of the participating countries. Maritime Economics Logistics. doi: 10.1057/s41278-024-00295-z
Xu L., Shen C. X., Chen J. H., Pan X. Y., Xiao G. N. (2024b). Efficiency evaluation and improvement pathway of sulfur-oxide emissions in European ports based on Context-dependent SBM-DEA model. Mar. pollut. Bull. 208, 117002. doi: 10.1016/j.marpolbul.2024.117002
Xu L., Wu J. Y., Zhao Q. F., Chen J. H., Liu J. T., Gao F. R., et al. (2024a). Spatial-temporal characteristics of port infrastructures on sulfur-oxide concentrations of coastal port in China. Ocean Coast. Manage. 258, 107399. doi: 10.1016/j.ocecoaman.2024.107399
Xu L., Xie F. J., Wang C. X. (2022d). Passive or proactive capacity sharing? A perspective of cooperation and competition between two regional ports Article. Maritime Policy Manage. 49, 492–509. doi: 10.1080/03088839.2021.1876938
Ye C. H., Dong X. P., Zhuang P. J. (2019). Evaluation function, game-theoretic machine learning algorithm, and the optimal solution for regional ports resources sharing. Neural Computing Appl. 31, 195–207. doi: 10.1007/s00521-018-3727-3
Zhou Y. S., Li X., Yuen K. F. (2023). Sustainable shipping: A critical review for a unified framework and future research agenda. Mar. Policy 148, 105478. doi: 10.1016/j.marpol.2023.105478
Keywords: green ports, marine green fuel, cost-sharing contract, revenue-sharing contract, Stackelberg game
Citation: Xu C-y, Wang Y-q, Yao D-l, Qiu S-y and Li H (2025) Research on the coordination of a marine green fuel supply chain considering a cost-sharing contract and a revenue-sharing contract. Front. Mar. Sci. 12:1552136. doi: 10.3389/fmars.2025.1552136
Received: 27 December 2024; Accepted: 12 February 2025;
Published: 18 March 2025.
Edited by:
Kang Chen, Dalian Maritime University, ChinaReviewed by:
Shaonan Shan, Shenyang University, ChinaCopyright © 2025 Xu, Wang, Yao, Qiu and Li. This is an open-access article distributed under the terms of the Creative Commons Attribution License (CC BY). The use, distribution or reproduction in other forums is permitted, provided the original author(s) and the copyright owner(s) are credited and that the original publication in this journal is cited, in accordance with accepted academic practice. No use, distribution or reproduction is permitted which does not comply with these terms.
*Correspondence: Hui Li, bGlodWlfMTAxMUAxNjMuY29t
Disclaimer: All claims expressed in this article are solely those of the authors and do not necessarily represent those of their affiliated organizations, or those of the publisher, the editors and the reviewers. Any product that may be evaluated in this article or claim that may be made by its manufacturer is not guaranteed or endorsed by the publisher.
Research integrity at Frontiers
Learn more about the work of our research integrity team to safeguard the quality of each article we publish.