 Yebao Wang
 Wenhao Liu1
 Chuntao Chen
 Peipei Du
94% of researchers rate our articles as excellent or good
Learn more about the work of our research integrity team to safeguard the quality of each article we publish.
Find out more
ORIGINAL RESEARCH article
Front. Mar. Sci., 03 March 2025
Sec. Marine Conservation and Sustainability
Volume 12 - 2025 | https://doi.org/10.3389/fmars.2025.1548763
Typhoons pose a significant threat to China’s coastal regions, resulting in substantial economic losses and casualties. Understanding the vulnerability of these areas to typhoon stress is crucial for effective disaster management and risk mitigation. This study assesses the vulnerability of China’s coastal provinces to typhoon disasters by integrating three key factors: exposure, sensitivity, and adaptability. The primary methodologies employed are the Analytic Hierarchy Process (AHP) and Geographic Information System (GIS) techniques. A comprehensive risk assessment framework is developed using 17 indicators, with AHP applied for indicator weighting and GIS used for spatial analysis and visualization of vulnerability patterns. The findings indicate considerable spatial variation in vulnerability, with southern provinces such as Guangdong, Guangxi, and Hainan exhibiting high vulnerability due to frequent typhoons, dense populations, and lower adaptive capacity. Southeastern regions, like Fujian and Zhejiang, show moderate to high vulnerability, while northern provinces such as Jiangsu, Hebei, and parts of Shandong and Liaoning experience lower vulnerability, attributed to reduced exposure and stronger disaster preparedness systems. These results underscore the importance of targeted disaster management strategies tailored to the specific vulnerabilities of each region.
Coastal zones are particularly vulnerable to marine disasters due to their unique geographic locations and high population density, which increases the associated risks and vulnerabilities (Wang et al., 2014). Among the most susceptible areas globally to the threat of typhoons, China’s coastal regions stand out. Each year, China’s coastal areas face significant risks from severe typhoons, resulting in substantial human casualties and economic losses. On average, seven to eight typhoons make landfall annually, causing devastating impacts (Fang et al., 2021). Between 2009 and 2019, 18 major typhoons affected approximately 126 million people in mainland China. These events resulted in over 20,000 fatalities, the collapse of around 230,000 homes, damage to more than 10 million hectares of crops, and direct economic losses amounting to $75 billion (Wan et al., 2023). Notable typhoons such as Typhoon Morakot (2009), Typhoon Haiyan (2013), and Typhoon Lekima (2019) exemplify the severity of these disasters. Typhoon Morakot, for instance, caused catastrophic flooding and landslides, leading to nearly 700 deaths, widespread displacement, and extensive damage to infrastructure, particularly in southern China. Typhoon Haiyan, one of the strongest typhoons ever recorded, caused substantial damage to coastal regions in the Philippines, and its residual effects were felt in China’s coastal areas, particularly Guangdong and Fujian. Typhoon Lekima, which struck in 2019, caused severe flooding, resulting in hundreds of casualties and billions in economic losses, further highlighting the vulnerability of coastal regions. These typhoons, among many others, illustrate the devastating impacts of typhoon-induced disasters, underscoring the critical need for better preparedness, risk management, and vulnerability assessments in China’s coastal areas.
In the context of climate change, the hazards associated with typhoons pose even greater uncertainty for the safety of coastal areas. First, studies suggest that ongoing global climate change is likely to influence tropical cyclone activity, particularly by altering typhoon tracks (Wu et al., 2005). These changes may lead to regions that were previously less affected by typhoons facing higher risks. Second, climate change is expected to modify temperature and precipitation patterns, affect oceanic and atmospheric circulation, accelerate sea level rise, and influence the frequency, intensity, timing, and distribution of hurricanes and tropical storms (Mendelsohn et al., 2012). These changes directly affect the formation, strength, and paths of typhoons, which in turn impact land cover and ecosystems. For instance, shifting typhoon tracks could expose coastal wetlands, forests, or agricultural areas to higher storm risks, thereby altering land use and ecosystem services. Therefore, in-depth research on typhoon hazards and their mechanisms is critical for assessing future risks in coastal regions.
China, as a major maritime country, has 11 coastal provinces (excluding Hong Kong, Macau, and Taiwan). According to the China Statistical Yearbook (2023), the combined population of these 11 provinces is 636.61 million, accounting for 45.16% of the national population. Their total Gross Domestic Product (GDP) reached 66.57 trillion Chinese yuan (CNY), representing 53.26% of the national GDP. Given the severe typhoon threats these regions face, risk analysis for coastal provinces is of paramount importance. Risk assessment is an essential tool for addressing complex disaster environments (Rangel-Buitrago et al., 2020). This process enables various sectors of society to better understand potential vulnerabilities and risk points, allowing them to implement appropriate preventive, mitigation, and adaptive measures to reduce disaster losses.
In recent years, substantial progress has been made in the assessment of typhoon disaster vulnerability (Li et al., 2022; Hoque et al., 2021; Kim, J. M. et al., 2020). Research in this field has primarily focused on developing multi-dimensional evaluation indicator systems, constructing vulnerability assessment models, and analyzing spatial distribution patterns. Scholars have increasingly leveraged remote sensing and Geographic Information Systems (GIS) technologies to integrate meteorological, socio-economic, and ecological data, enabling more refined and precise vulnerability assessments in typhoon-affected areas (Zhang et al., 2021; Van Westen, 2013). Additionally, spatial analysis methods, such as statistical approaches (Valjarević et al., 2022) and geostatistical techniques (Wang et al., 2020), have been employed to further enhance our understanding of these complex relationships. Collectively, these studies provide valuable scientific support for typhoon disaster risk management and decision-making.
The integration of the Analytical Hierarchy Process (AHP) with GIS has gained increasing recognition for its effectiveness in evaluating the intricate relationships between atmospheric conditions and land systems. AHP quantifies the relative importance of various factors influencing typhoon risk, while GIS facilitates the spatial visualization of these risks. In this study, we utilize AHP to assign weights to key indicators and employ GIS to analyze and map typhoon risk levels across different coastal provinces. By combining these two methods, we can assess how variations in typhoon intensity and frequency impact land systems and how these effects are spatially distributed. This approach allows for the identification of areas most susceptible to severe damage based on their geographic and environmental characteristics, offering a clearer understanding of the link between typhoon-induced hazards and land use.
The primary objective of this study is to establish a comprehensive typhoon risk assessment framework by integrating these methodologies. By determining indicator weights through AHP and calculating composite risk levels via GIS, we provide a quantitative assessment of typhoon risk across coastal provinces. This GIS-based risk assessment framework serves as a scientific foundation for governments, disaster management agencies, and researchers, enabling them to develop more effective strategies for typhoon disaster prevention and mitigation. Ultimately, this approach contributes to protecting lives and property while promoting sustainable development in coastal regions.
The coastal regions of China are among the most economically developed areas in the country, characterized by dense populations and abundant resources. Geographically, these regions are located between 118°07′ to 124°34′ east longitude and 18°10′ to 39°15′N north latitude. The mainland coastline stretches for over 18,000 kilometers, and when including the coastlines of the islands, the total length reaches approximately 32,000 kilometers. The mainland coastal region consists of 11 provincial-level administrative divisions (excluding Hong Kong, Macao, and Taiwan), which, from north to south, are: Liaoning Province, Hebei Province, Tianjin Municipality, Shandong Province, Jiangsu Province, Shanghai Municipality, Zhejiang Province, Fujian Province, Guangdong Province, Guangxi Zhuang Autonomous Region, and Hainan Province (Figure 1). The total area of these provinces is approximately 1.2883 million km².
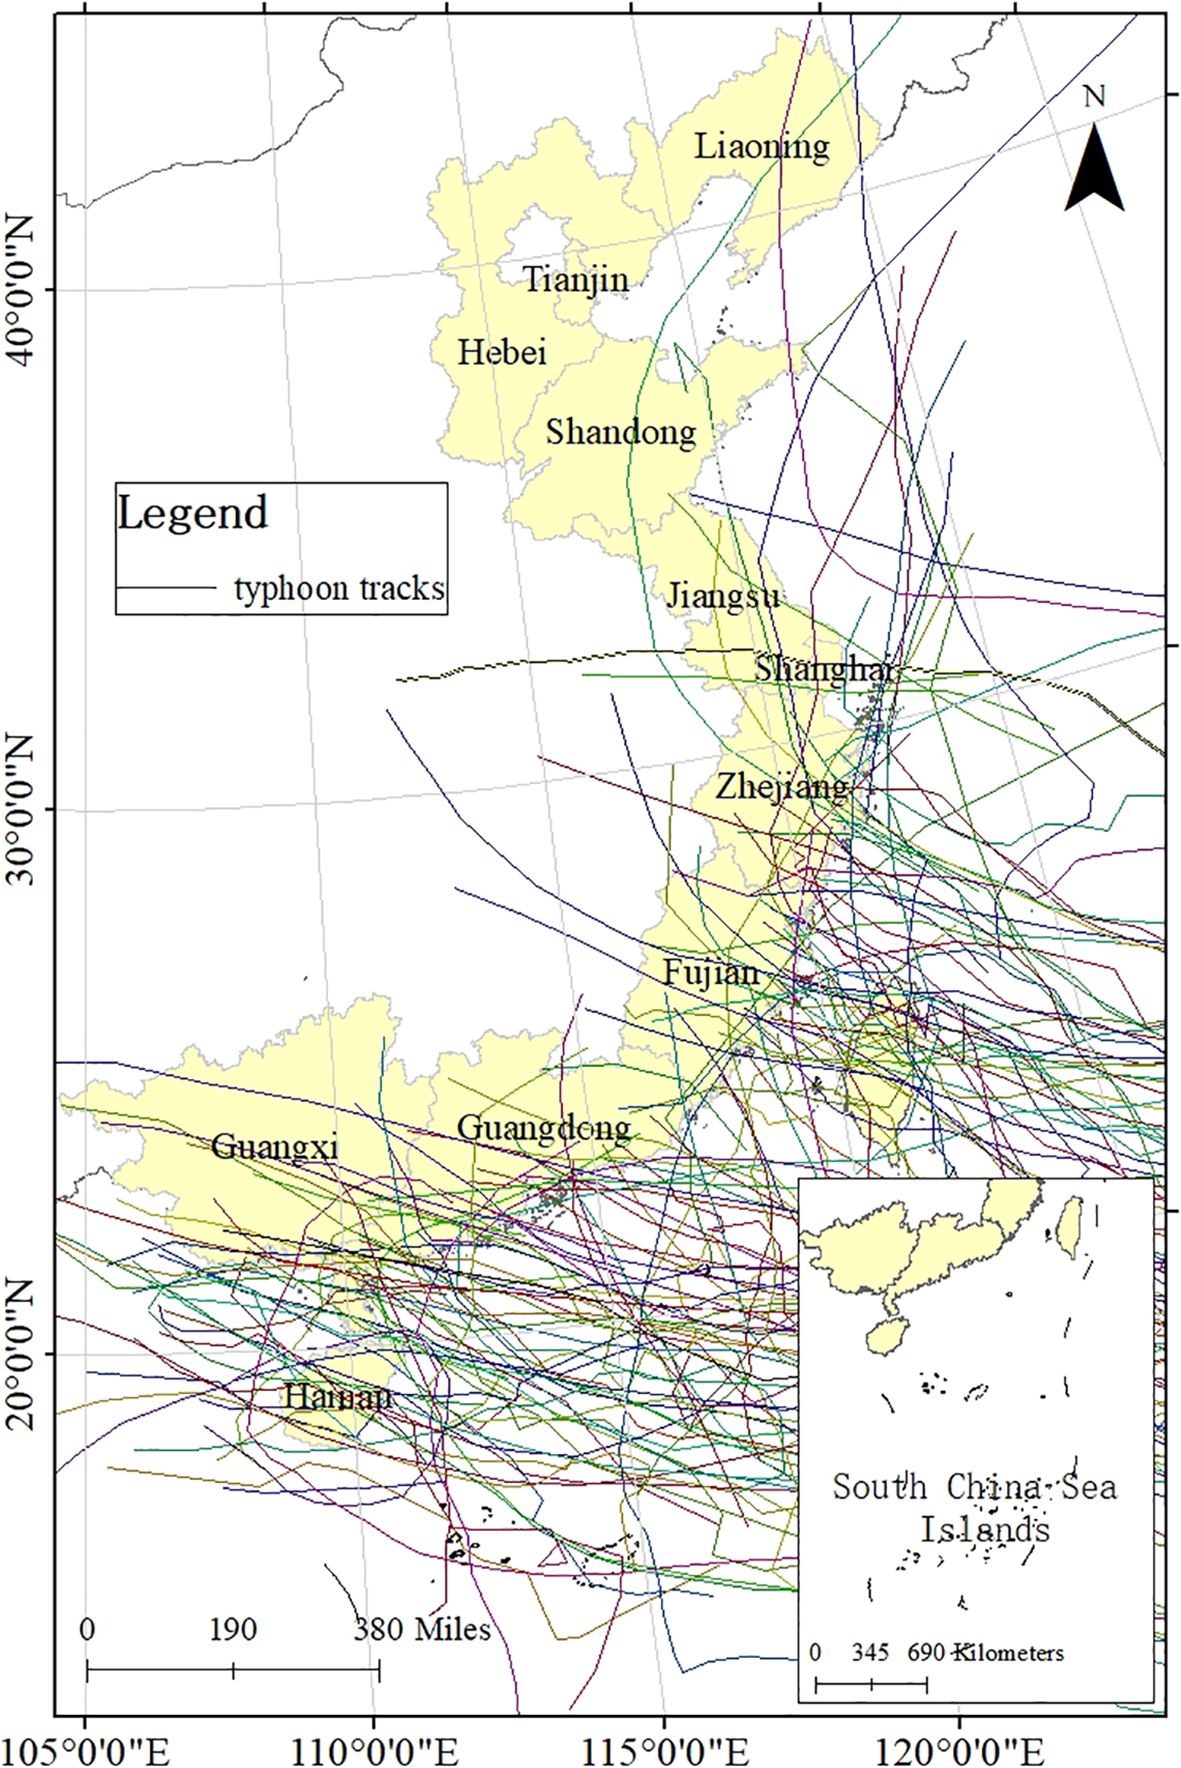
Figure 1. Typhoon tracks affecting China’s coastal regions since 1989 and the coastal provinces of China.
These coastal regions are not only highly dependent on marine resources for development but also play a crucial role in China’s economic growth, particularly through sectors such as the marine economy, port trade, fishing, and marine tourism.
From June to October each year, during the active period of tropical cyclones in the western Pacific, the frequency of typhoon occurrences is at its highest. Typhoons generally form in tropical or subtropical sea areas and typically move northwestward. When these typhoons reach the southeastern coast of China, they often make landfall or pass by the coastal provinces along the typical path of tropical cyclones.
The Vulnerability Scoping Diagram (VSD) vulnerability assessment framework is a structured approach used to identify, assess, and prioritize potential vulnerabilities within a system (Polsky et al., 2007). In this study, the VSD framework is employed as a systematic method to evaluate the vulnerabilities faced by coastal areas in the context of extreme weather events such as typhoons. This framework integrates knowledge from multiple disciplines, including disaster science, meteorology, and regional development, with the goal of assisting decision-makers in identifying, assessing, and managing the risks posed by typhoons. Ultimately, it aims to enhance disaster prevention and mitigation efforts in the region. The framework consists of three key components: exposure, sensitivity, and adaptability.
In this study, the VSD framework is adopted to assess the spatial vulnerability of China’s coastal provinces under the stress of typhoon disasters. Vulnerability is conceptualized in three dimensions: exposure, sensitivity, and adaptability, which are measured using 17 indicators, as presented in Table 1. These indicators are categorized based on their influence on vulnerability: positive indicators (+) and negative indicators (-). A higher value for a positive indicator corresponds to greater vulnerability, while a higher value for a negative indicator reflects lower vulnerability.
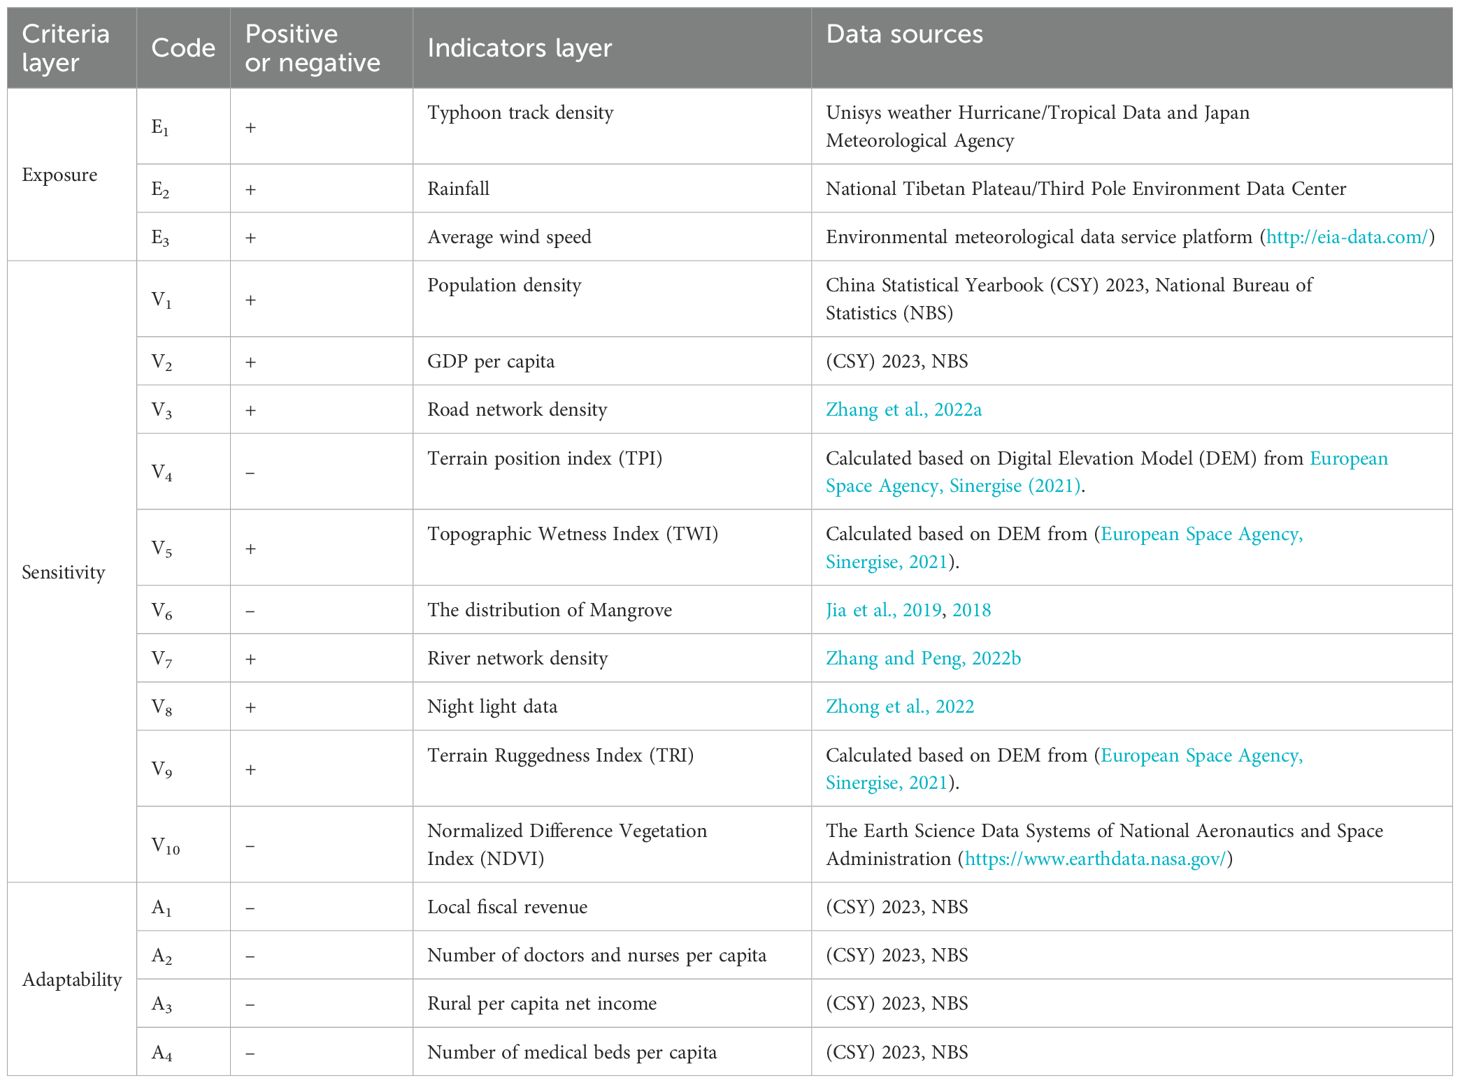
Table 1. Exposure, sensitivity, and adaptability indicators.
The publicly available typhoon track data was imported into GIS, and line density was calculated to determine the concentration of typhoon tracks. For other variables such as rainfall, average wind speed, road network density, mangrove distribution, river network density, night light data, and the Normalized Difference Vegetation Index (NDVI), these datasets are available as mature raster data products from previous studies, as indicated in Table 1. This research directly utilizes these products and resamples them into raster data structures with consistent resolution.
The National Bureau of Statistics of China publishes the China Statistical Yearbook annually, providing comprehensive and authoritative statistical data that reflect the latest developments in China’s economy, society, culture, and environment. The data in the yearbook is sourced from a variety of channels, including annual statistics from government statistical departments, industry associations, enterprise surveys, and other relevant social surveys. To ensure accuracy and comparability, the data is collected and processed using standardized statistical methods. For this study, data from the 2023 edition of the China Statistical Yearbook was consulted to obtain indicators such as population density, GDP per capita, local fiscal revenue, number of doctors and nurses per capita, rural per capita net income, and the number of medical beds per capita. These data were then imported into GIS and stored in a spatial raster database.
The Topographic Position Index (TPI) is an indicator used to analyze terrain features by comparing the elevation of a specific point to the average elevation of its surrounding area, thus evaluating the relative position of that point within the terrain (De Reu et al., 2013). The calculation formula for TPI is as follows:
Where, TPI is the topographic position index; E is the elevation at a given point; E¯ is the average elevation within the region; S is the slope at a given point; S¯ is the average slope within the region.
The Topographic Wetness Index (TWI) is a widely used topographic index in hydrological analysis, which measures the potential distribution of soil moisture by estimating water accumulation based on topographic influences (Sörensen et al., 2006). The calculation formula is as follows:
Where, TWI is the Topographic Wetness Index; is the effective flow accumulation area (m²); β is the effective slope.
Terrain ruggedness refers to the degree of elevation variation on the Earth’s surface, reflecting the roughness and complexity of the terrain. It quantifies topographic features through local variations in elevation. Terrain ruggedness is commonly represented by the Terrain Ruggedness Index (TRI) (Różycka et al., 2017), which is calculated using elevation change measurements. The formula for the Terrain Ruggedness Index is as follows:
represents the elevation of the target point, represents the elevation of a neighboring point, and n represents the number of points in the neighborhood.
The weights of the indicators listed in Table 1 were determined using Analytic Hierarchy Process (AHP). AHP is a multi-criteria decision analysis method widely used for addressing complex decision-making problems. AHP decomposes complex issues into multiple layers and criteria, determining the relative importance of each factor through expert judgment and mathematical calculations, thereby assisting decision-makers in making informed and rational decisions (Darko et al., 2019). Its key advantages include structured decision-making, multi-criteria analysis, and the quantification of expert opinions. The basic steps of AHP are as follows:
The complex problem is broken down into a multi-level structure, typically comprising the goal layer, criteria layer, and indicators layer. The goal layer represents regional vulnerability to typhoon threats. The criterion layer includes exposure, sensitivity, and adaptability, while the indicator layer consists of 17 specific indicators.
To establish the pairwise comparison matrix for AHP, expert evaluations were conducted to assess the relative importance of each factor in the indicator layer concerning the higher-level criteria. Each comparison was rated using Saaty’s 1–9 scale, where 1 represents equal importance and 9 denotes extreme importance (Table 2). These pairwise comparisons were then systematically organized into a judgment matrix A. To ensure methodological transparency, experts from relevant fields participated in the assessment. Consistency of the judgments was verified using the Consistency Ratio (CR). If inconsistencies were detected, adjustments were made by reviewing and refining the pairwise comparisons to enhance logical coherence.
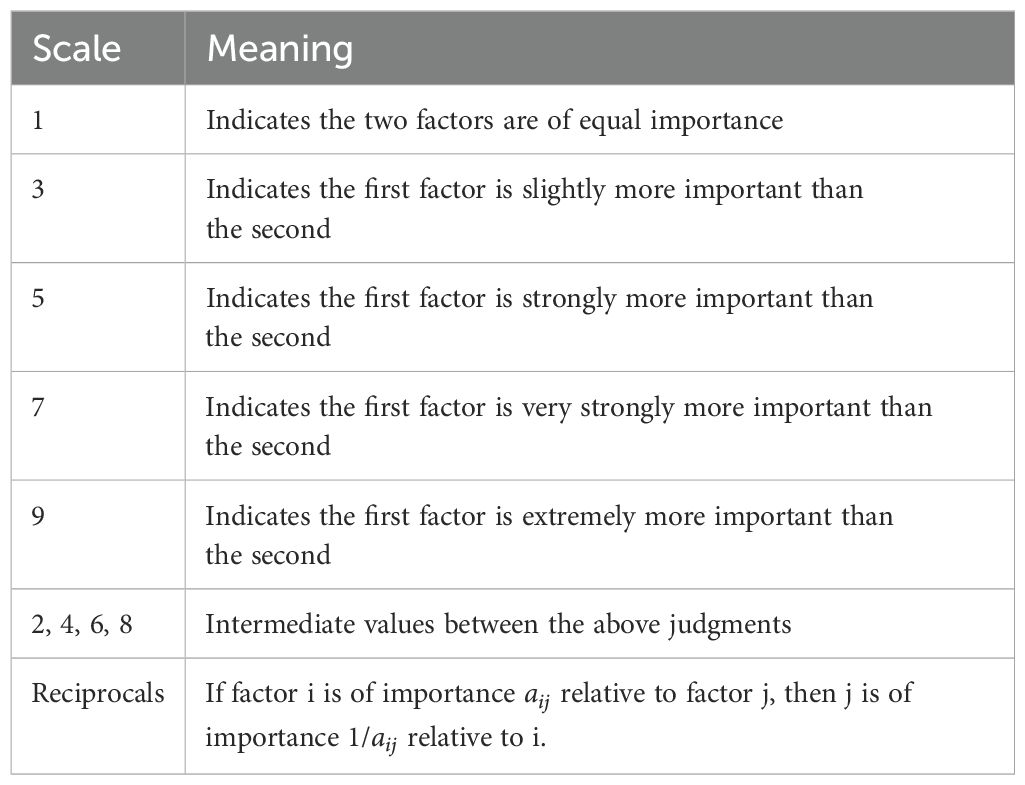
Table 2. The meaning of scale (Saaty, 1987).
The weights of each factor are determined by calculating the eigenvector of the judgment matrix. These weights represent the relative importance of each factor in the decision-making process. The judgment matrix A corresponds to the eigenvector W associated with the maximum eigenvalue . After normalization, the eigenvector represents the ranking weights of the factors at the current level in relation to the factors at the previous level. At this stage, a set of weight vectors is obtained for each element with respect to a certain element at the preceding level. The ultimate goal is to determine the ranking weights of each element, particularly for the alternatives at the lowest level, in relation to the target. This enables the selection process. The final overall ranking weights are synthesized by combining the weights under each criterion, from top to bottom.
The judgment matrix must undergo a consistency check to ensure that the decision-maker’s judgments are logically consistent. If the matrix passes the consistency check, the results can be accepted; if not, adjustments are needed. The consistency index is denoted as CI and is calculated as follows:
Where n is the order of the matrix A.
Calculating the consistency ratio CR based on the CI and RI values.
The values of RI are shown in Table 3:
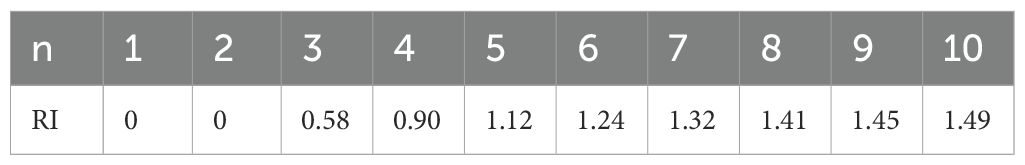
Table 3. The value of RI (Saaty, 1987).
The relative weights of each alternative are multiplied by the corresponding factor weights to calculate the total score for each alternative. The alternative with the highest total score is typically considered the optimal choice.
To mitigate this, experts were carefully selected based on their experience and expertise in typhoon-related hazards and regional vulnerabilities. To further enhance objectivity, they were provided with comprehensive guidelines on the AHP process, ensuring a standardized approach to pairwise comparisons. Additionally, open discussions were encouraged among the panel members, allowing them to refine their judgments collectively and minimize personal biases.
The prioritization of criteria was determined through iterative consultations and expert feedback. Experts ranked each criterion based on its relevance to typhoon risk assessment and its impact on disaster resilience. This ranking process was repeated multiple times, with necessary adjustments made to the pairwise comparisons to ensure the assigned weights accurately reflected the relative importance of each factor.
To maintain methodological rigor, the final judgment matrix was rigorously tested for consistency using the Consistency Ratio (CR). Following Saaty (1980) recommendation, the CR was kept below the acceptable threshold of 0.1 to ensure logical coherence. If the CR exceeded this threshold, the pairwise comparisons were re-evaluated and adjusted accordingly to improve consistency.
By systematically integrating expert knowledge, maintaining consistency checks, and refining judgments through iterative discussions, this approach effectively minimized subjective bias. It ensured that the criteria were prioritized based on their true significance to the study objectives, resulting in weight assignments that were both reliable and meaningful within the context of typhoon risk assessment.
The indicator data is discrete and exhibits significant spatial variation. To facilitate the subsequent spatial overlay analysis, the data is transformed into spatial raster format using GIS tools. Positive indicators are normalized using Equation 6, while negative indicators are normalized according to Equation 7.
Where denotes the normalized score of the indicators, X represents the original data value of each indicator, is the minimum value of each indicator, and is the maximum value of each indicator.
The vulnerability of coastal provinces to typhoons is calculated using Equation 8:
Where VI is the vulnerability index; n is the number of indices; is the normalized value of indicator i; and is the weight of indicator i.
There is no universally accepted standard for classifying vulnerability. In this study, vulnerability is categorized into five levels—very low, low, moderate, high, and very high—using the quantile method (Ichino, 2011). This approach effectively illustrates the spatial differentiation of vulnerability in coastal provinces under the impact of typhoons.
Figure 2 illustrates the indicator weights for different criteria derived through the AHP. The horizontal axis represents various indicators (denoted by their respective indicator codes), while the vertical axis shows their corresponding weights. It is clear that the weights of different indicators vary significantly, with typhoon track density (E1) and rainfall (E2) having notably higher weights compared to the others. This indicates that these indicators are of greater relative importance within the evaluation framework and have a more substantial influence on the vulnerability of coastal areas under typhoon stress. In contrast, other indicators, such as those related to sensitivity and adaptability, exhibit relatively lower weights and are more evenly distributed.
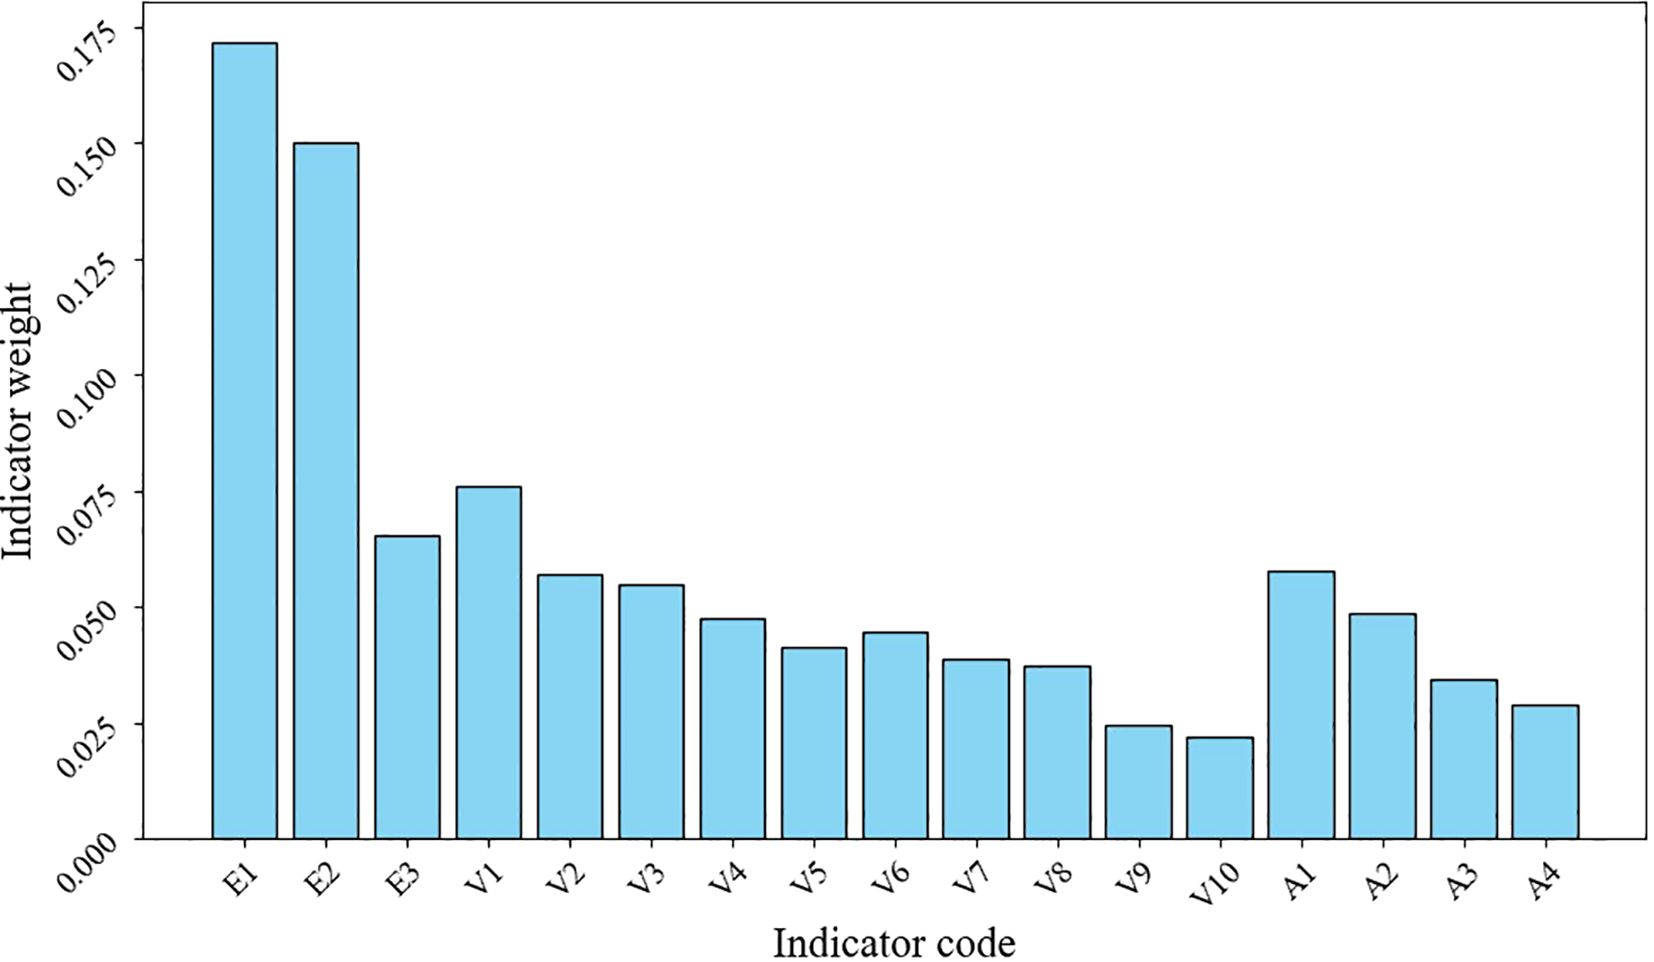
Figure 2. Indicator weight distribution based on the AHP method.
Figure 3 illustrates the spatial variation in exposure to typhoon stress across China’s coastal provinces. The map uses different colors to represent five levels of exposure: Very Low, Low, Moderate, High, and Very High. Areas with higher exposure are primarily concentrated in the southern coastal provinces, including Guangdong, Fujian, Hainan, and Guangxi. These regions are more vulnerable to typhoon disasters due to their proximity to typhoon landfall paths, dense populations, and high levels of economic activity. Moderate exposure is observed mainly in the eastern coastal provinces, such as Zhejiang, Shanghai, and Jiangsu. While these areas are still affected by typhoons, their stronger disaster preparedness and lower typhoon frequency result in reduced exposure compared to the southern provinces. Regions with lower exposure are mainly found in the northern coastal provinces, including Shandong, Hebei, Tianjin, and Liaoning. These areas experience fewer direct impacts from typhoons, leading to relatively low exposure levels.
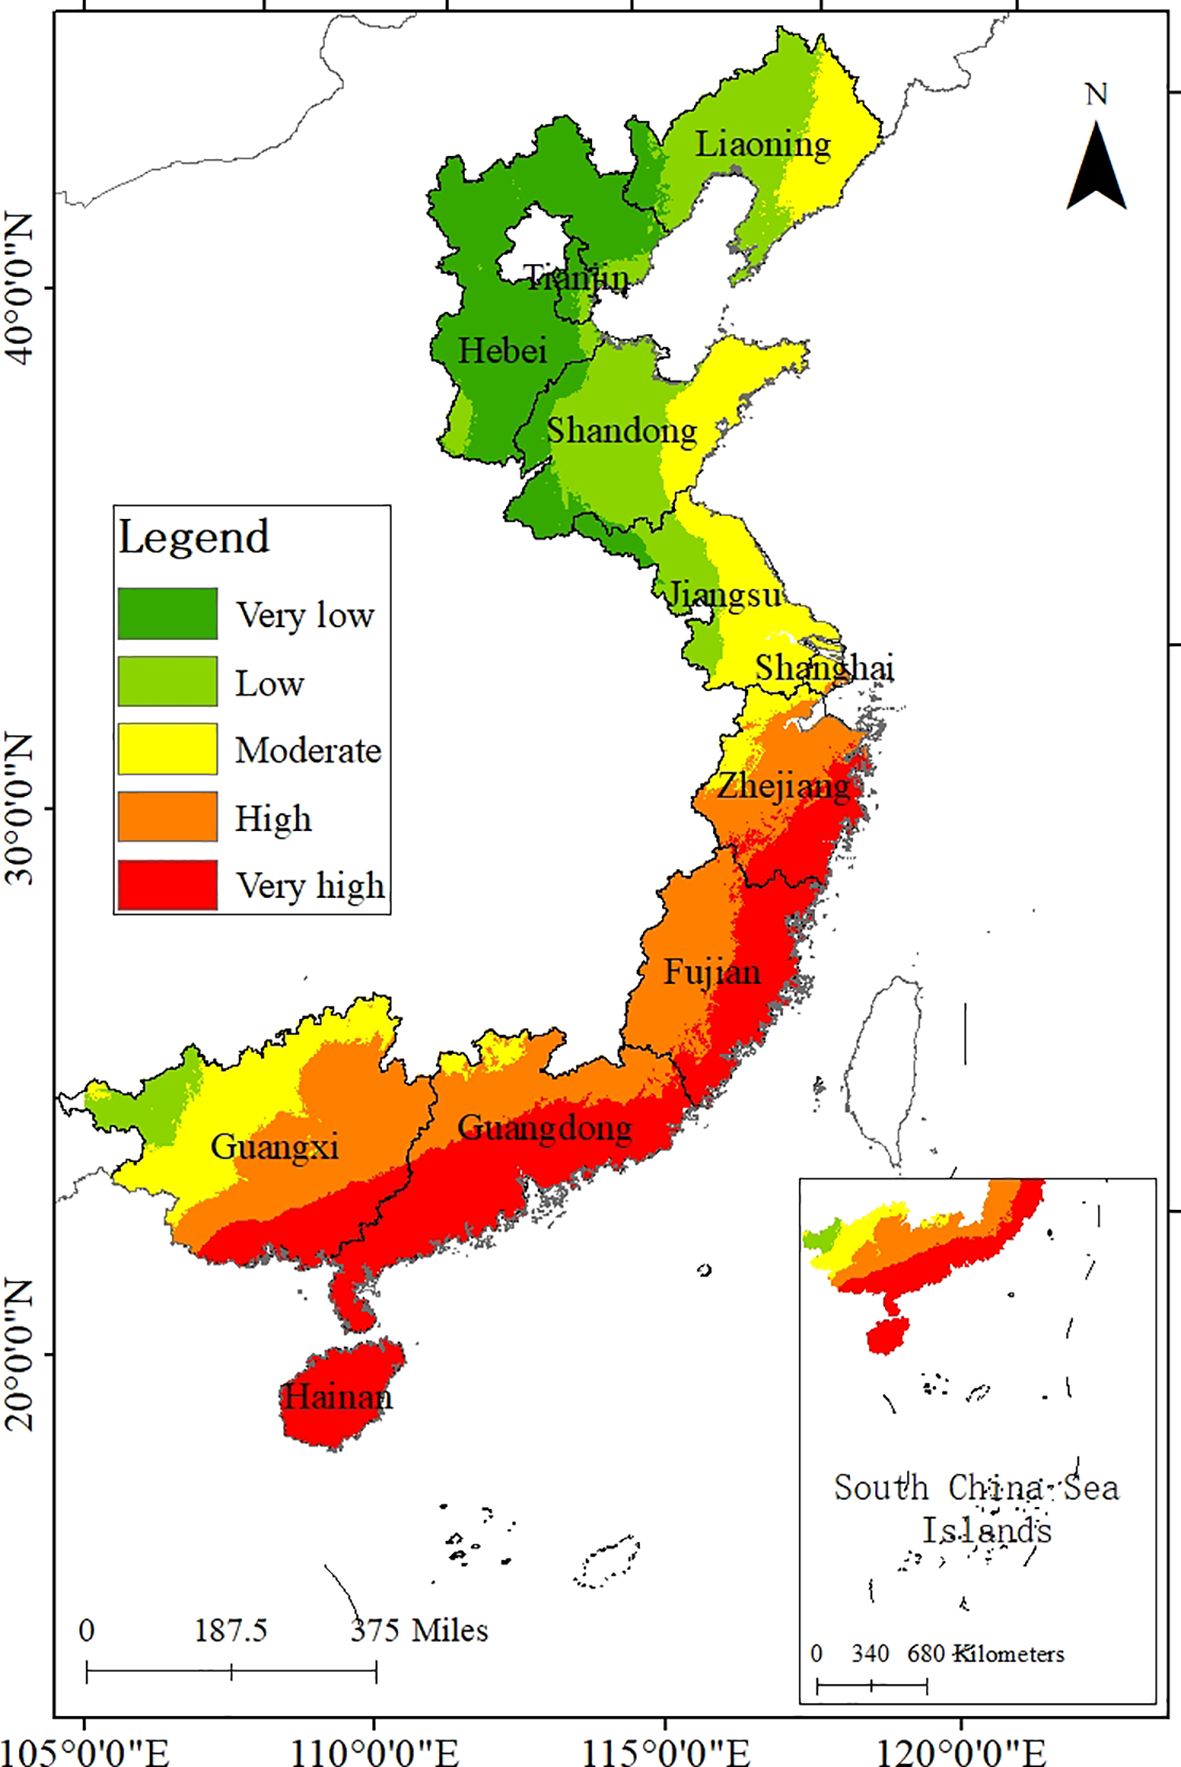
Figure 3. Spatial differentiation of exposure.
Figure 4 illustrates the spatial distribution of sensitivity to typhoon stress across China’s coastal provinces. Sensitivity was assessed by performing spatially weighted calculations on the sensitivity indicators (V1-V10). High sensitivity is primarily concentrated in the southeastern coastal regions, including Guangdong, Fujian, Zhejiang, and Shanghai. These areas exhibit greater sensitivity due to their high levels of economic development, dense populations, and the high concentration of critical infrastructure, which makes them more vulnerable to the impacts of typhoons. Moderate sensitivity is observed in parts of the eastern and southern coastal provinces, such as Jiangsu and Guangxi, where there is moderate economic activity and population density. These regions tend to be less vulnerable than high-sensitivity areas, likely due to stronger disaster preparedness, better infrastructure, or fewer contributing vulnerability factors. Low-sensitivity areas are mainly found in the northern coastal provinces, such as Shandong, Hebei, Tianjin, and Liaoning. These regions show lower sensitivity to typhoon stress, attributed to factors such as advanced socio-economic development, better infrastructure distribution, and more favorable climatic conditions, resulting in a generally lower response to typhoon impacts. The sensitivity levels were mapped based on these factors, with areas of high sensitivity marked in red and low sensitivity marked in green.
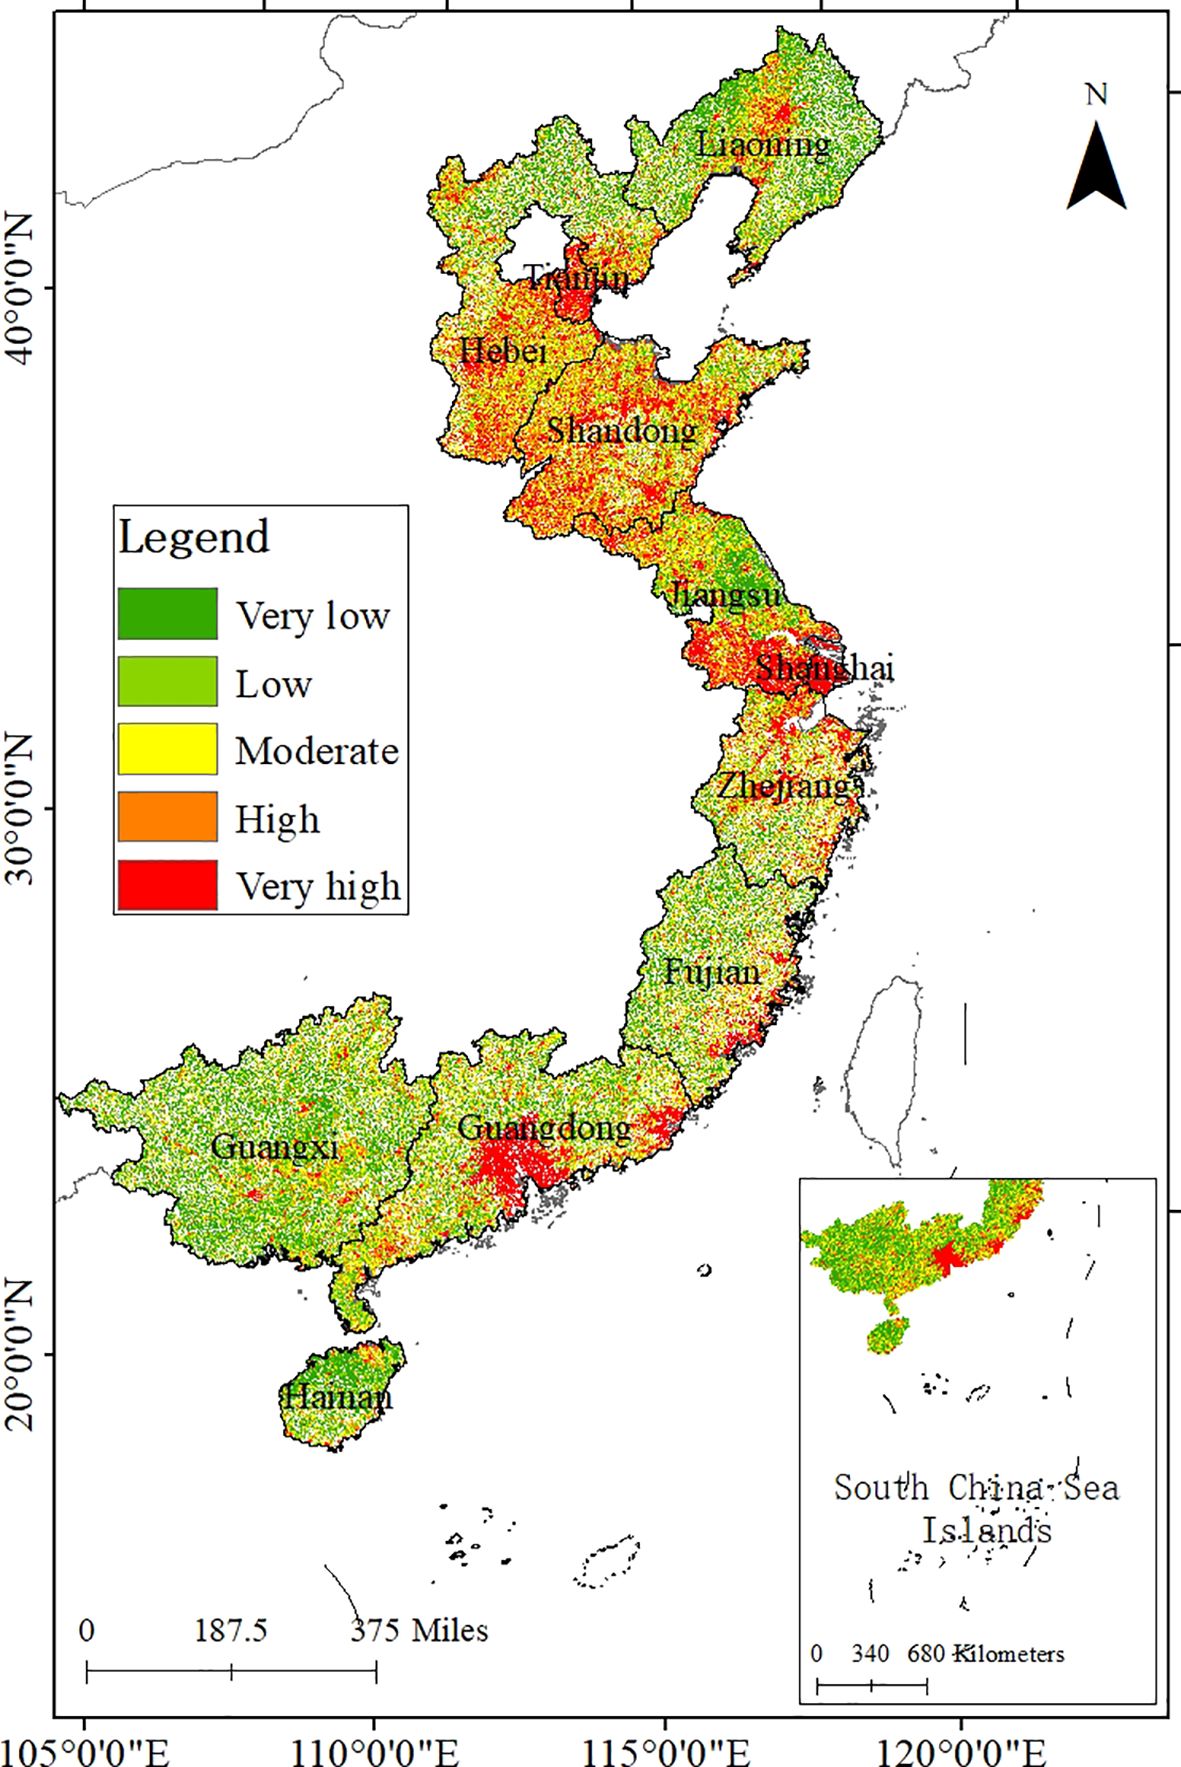
Figure 4. Spatial differentiation of sensitivity.
Figure 5 illustrates the spatial variation in adaptive capacity to typhoon stress across China’s coastal provinces. Adaptive capacity is a critical factor in mitigating the impact of typhoon disasters, as it reflects a region’s ability to prepare for, respond to, and recover from such events. Provinces like Shanghai and Jiangsu exhibit very high adaptive capacity, likely due to their advanced disaster management systems, robust economic conditions, and efficient infrastructure. These regions possess significant resources to minimize losses and ensure rapid recovery from typhoon impacts. Zhejiang and Shandong demonstrate relatively high or moderate adaptive capacity. While these provinces have strong socioeconomic development and preparedness, certain structural limitations or uneven resource distribution may hinder their overall resilience in the face of extreme weather events. Southern provinces such as Hainan, Guangxi, and parts of Guangdong exhibit low adaptive capacity, primarily due to economic or institutional challenges. Additionally, some northern provinces, including Liaoning and Hebei, have lower adaptive capacity, which may be attributed to a reduced focus on typhoon disaster preparedness, given their relatively lower exposure to such events.
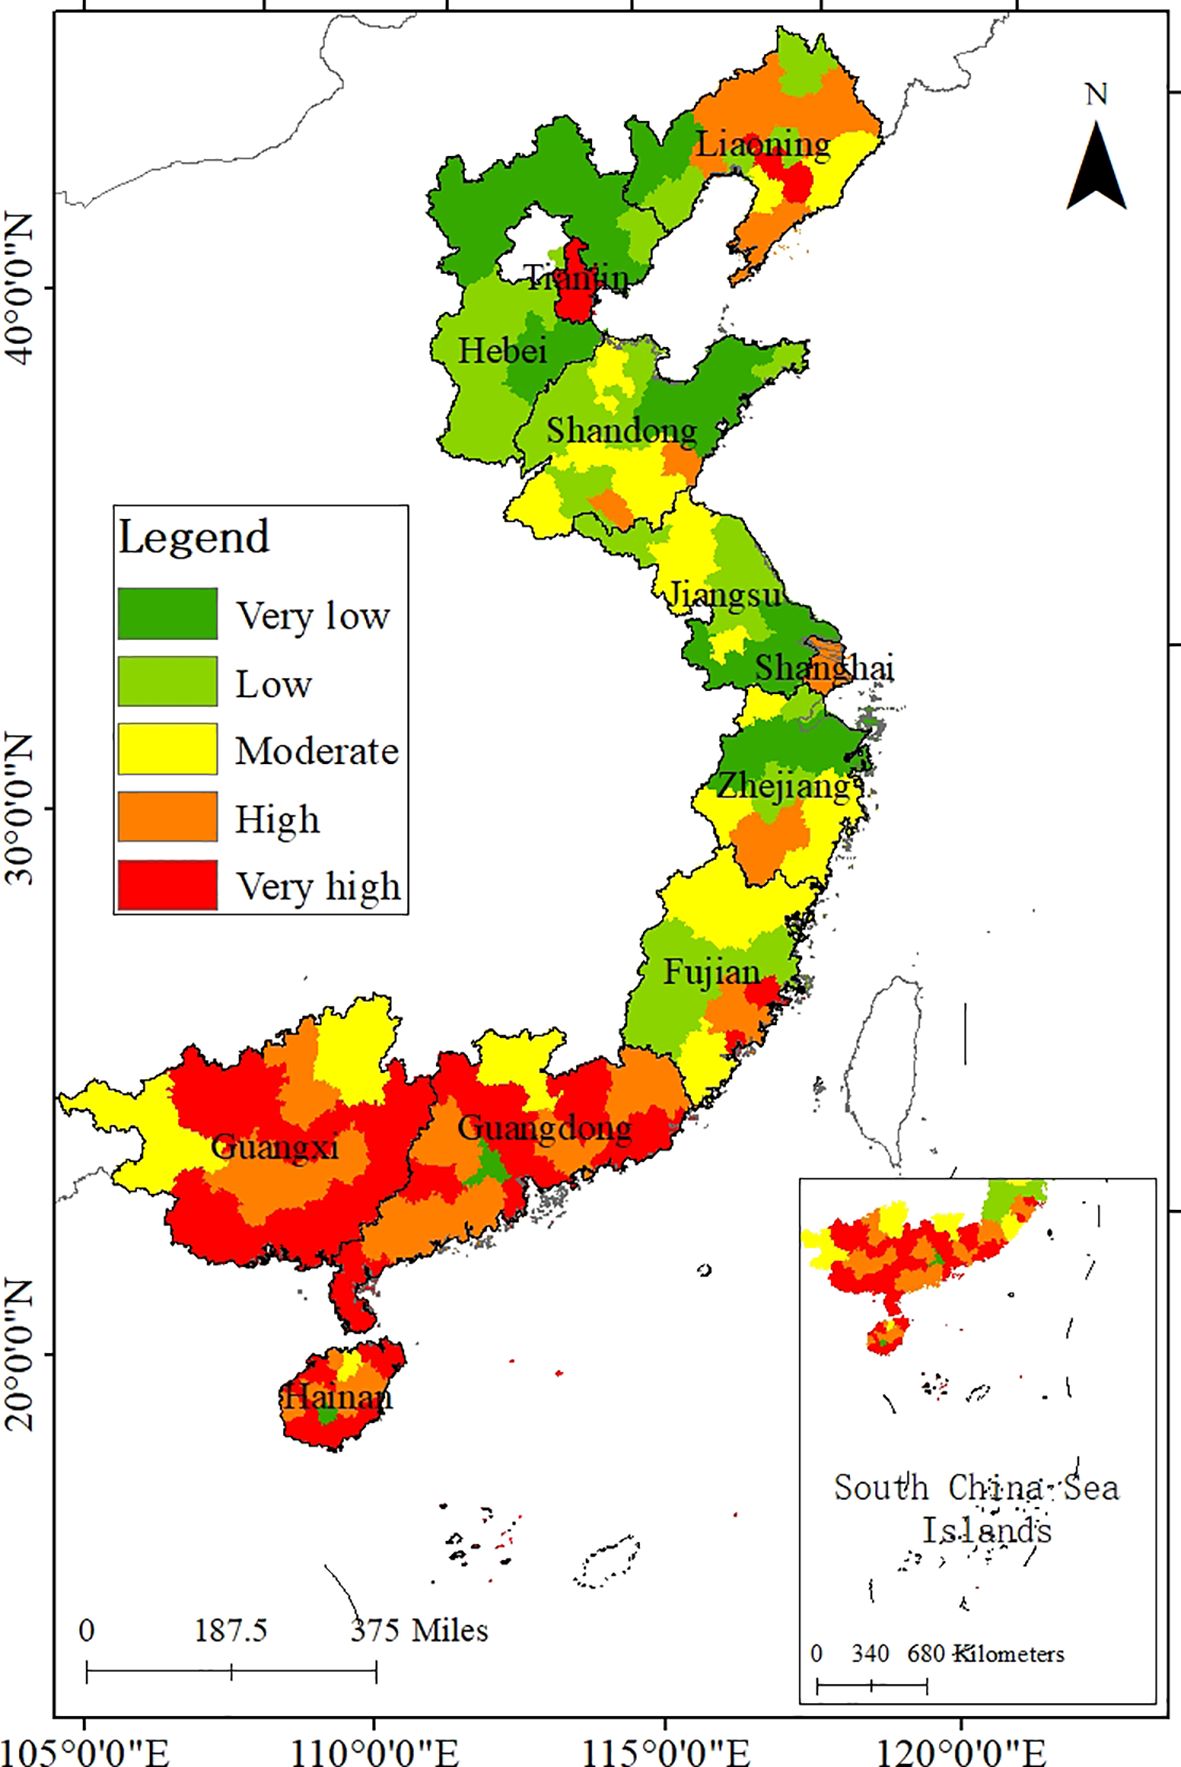
Figure 5. Spatial differentiation of adaptability.
Figure 6 illustrates the spatial variation in vulnerability to typhoon stress across China’s coastal provinces, representing the comprehensive results of this study. Vulnerability integrates exposure, sensitivity, and adaptive capacity into a unified framework, offering a holistic measure of each region’s predisposition to, and potential impact from, typhoon disasters. The southern coastal provinces, particularly Guangxi, Guangdong, and Hainan, exhibit very high vulnerability. The southeastern provinces, including Fujian and Zhejiang, show moderate to high vulnerability. Provinces such as Jiangsu, Shanghai, and parts of Shandong and Liaoning demonstrate lower vulnerability, primarily due to their relatively lower exposure to typhoon paths and more robust disaster preparedness systems. These regions’ advancements in infrastructure and socioeconomic development contribute significantly to their resilience. Additionally, within each province, vulnerability varies spatially. A notable trend is that vulnerability generally decreases from the coastline toward inland areas.

Figure 6. Spatial differentiation of vulnerability.
The indicator-based assessment method is a widely used approach for evaluating the vulnerability of coastal areas under typhoon stress and has produced promising results (Nguyen et al., 2019; Xu et al., 2015). Indicator analysis is a critical component of comprehensive risk assessments for typhoon disasters. However, these indicators vary over time and space, necessitating the development of a targeted vulnerability assessment framework tailored to the coastal regions of China. By integrating exposure, sensitivity, and adaptability indicators, this study offers a multifaceted view of the vulnerabilities faced by China’s coastal provinces, providing a nuanced understanding of how various factors contribute to the overall risk landscape.
Typhoon track density, rainfall, and average wind speed (Kim, J. S. et al., 2020) are key factors influencing the severity of disaster impacts. Higher typhoon density, greater rainfall, and stronger wind speed (intensity) are directly correlated with more severe damage. In assessing typhoon risk, population density, gross domestic product (GDP), and road network density are also crucial factors (Gao et al., 2014). Nighttime light data, which reflects regional economic development, serves as a supplementary factor to GDP data (Xu et al., 2015). Although roads themselves are vulnerable systems during typhoons (Zhu et al., 2022), higher road network density is often indicative of stronger mobility, facilitating more effective evacuation of people in danger.
Terrain plays a critical role in flood formation (Rav et al., 2019), and this study incorporates three terrain-related factors: Topographic Position Index (TPI), Topographic Wetness Index (TWI), and Terrain Ruggedness Index (TRI). The applicability of these indicators varies across different geographical regions. Areas with low elevation and gentle slopes typically exhibit a low TPI, while areas with high elevation and steep slopes have a high TPI. A lower TPI generally indicates greater susceptibility to flooding and waterlogging disasters caused by typhoons. However, in mountainous regions, the variation in TPI may be associated with soil erosion and the complexity of water flow paths, necessitating a context-specific analysis. A higher TWI value suggests a greater likelihood of soil saturation, particularly evident in humid regions where saturated soils can lead to more frequent flooding and waterlogging disasters. In contrast, the impact of TWI may be less significant in arid areas. Additionally, greater terrain ruggedness corresponds to more pronounced unevenness in the landscape, making low-lying areas more prone to internal flooding during heavy rainfall. The denser the river network, the greater the likelihood of being affected by flooding caused by typhoon-related rainfall (Zhang et al., 2017). Therefore, understanding how these terrain factors perform in different regions is crucial for assessing vulnerability to typhoon disasters.
Vegetation surfaces, such as rice paddies and coastal wetlands, have been shown to play a significant role in mitigating the impacts of typhoon disasters. As such, factors like mangrove coverage and the Normalized Difference Vegetation Index (NDVI) are considered in this study (Liu et al., 2019a, 2019). Additionally, casualties during a typhoon can result from the collapse of buildings, trees, and other structures. The availability of medical resources is crucial in determining a region’s vulnerability. Hospital density is an important factor (Wang et al., 2024); however, this study emphasizes the need to focus on per capita medical resources, such as the number of doctors and nurses per capita, as well as the number of medical beds per capita. Moreover, research has found that rural municipalities tend to have higher mortality rates than urban areas (Gray et al., 2022). As such, this study incorporates local fiscal revenue and rural per capita net income as indicators of disaster resilience in rural regions.
In this study, the combined use of Geographic Information Systems (GIS) and the Analytic Hierarchy Process (AHP) provides a robust framework for assessing the vulnerability of coastal provinces to typhoon disasters. A key strength of employing AHP is its ability to break down complex decision-making problems into a hierarchical structure (Terzi, 2019). This hierarchical approach allowed for a systematic evaluation of the relative importance of each factor influencing typhoon risk. Through expert judgment and pairwise comparisons, AHP provided a quantitative method for weighting these factors, which was essential for generating a balanced and comprehensive risk assessment. Indicators were assigned weights based on their relative significance in contributing to typhoon risk. The results indicated that sensitivity had the highest influence on overall risk, followed by exposure and adaptability.
The integration of GIS further enhanced this methodology by enabling spatial analysis and visualization of typhoon risks across coastal regions. GIS allowed for the mapping of vulnerability and risk factor distributions, providing clear visual representations that help identify high-risk areas (Feyissa et al., 2018). This spatial dimension is crucial for policymakers and disaster management authorities, as it enables more targeted and effective interventions (Tomaszewski, 2020). By synthesizing the weighted indicators within the GIS platform, this study produced a comprehensive risk assessment map. The integration of these indicators into a cohesive framework enables a holistic understanding of regional vulnerabilities and facilitates the development of tailored risk reduction strategies. The spatial representation of risk provides actionable insights for decision-makers, assisting in the prioritization of disaster preparedness and mitigation efforts.
Despite the strengths of this methodological approach, certain limitations exist. One challenge is the inherent subjectivity in the AHP process, as it relies heavily on expert judgment for the pairwise comparison of factors. While AHP offers a structured method to minimize biases, there remains a degree of subjectivity that could influence the final weightings. The reliability of the assessment, therefore, depends on the expertise and consensus among the experts involved (Saaty, 2008). Another limitation pertains to the quality of the GIS data used in the analysis. The accuracy and resolution of spatial data are crucial for precise risk mapping, as the effectiveness of GIS in identifying risk hotspots and providing actionable insights is directly tied to the quality of the data. To enhance the robustness of the framework, future studies could incorporate dynamic data sources, such as real-time satellite imagery or updated meteorological data, to revise and refine risk assessments as new information becomes available.
The research results highlight significant spatial differentiation in vulnerability and risk levels associated with typhoon disasters across China’s coastal provinces, as well as within regions of the same province. This spatial variation reflects the complex interplay of environmental, socio-economic, and infrastructural factors that determine the extent of typhoon impacts in different areas.
The analysis reveals notable differences in vulnerability across coastal provinces. Southern coastal provinces such as Guangxi, Guangdong, and Hainan exhibit the highest vulnerability. This outcome results from a combination of factors: high exposure to frequent and intense typhoons, increased sensitivity due to dense populations, fragile ecosystems, and relatively limited adaptive capacity. These areas, therefore, require immediate focus on disaster mitigation strategies and resilience-building measures.
In contrast, the southeastern provinces like Fujian and Zhejiang demonstrate moderate to high vulnerability. While these regions benefit from stronger adaptive capacities, their geographic location and frequent typhoon occurrences still necessitate enhanced mitigation strategies to reduce overall vulnerability.
Northern provinces, including Jiangsu, Hebei, and parts of Shandong and Liaoning, exhibit lower vulnerability levels. This can largely be attributed to their geographic position and distinct climate patterns along China’s coastline. Southern provinces, located near the South China Sea and Western Pacific, are more frequently impacted by tropical cyclones, which lose strength as they travel northward. Consequently, these northern provinces face comparatively lower typhoon-related risks, but still require disaster preparedness measures.
Significant spatial variation is also observed within individual provinces, with some regions more vulnerable than others. Coastal, heavily urbanized areas exhibit higher exposure and sensitivity to typhoon impacts. These regions tend to have large populations, dense infrastructure, and significant economic activities concentrated in vulnerable coastal zones, making them more susceptible to severe damage during typhoons. Conversely, inland areas within the same provinces are less affected due to their distance from the coast, with less severe impacts from typhoons.
This intra-province variation emphasizes the need for localized disaster management strategies. Each region within a province faces distinct risks, with coastal areas requiring tailored interventions to enhance infrastructure resilience, improve evacuation protocols, and strengthen early warning systems. Meanwhile, inland areas may require fewer disaster preparedness efforts but should still be included in regional risk management frameworks.
This analysis highlights that typhoon vulnerability is a complex issue influenced by the dynamic interplay of exposure, sensitivity, and adaptive capacity. The spatial differentiation observed in the vulnerability map underscores the necessity of region-specific risk reduction strategies tailored to local conditions.
In regions with very high vulnerability, such as Guangxi and Guangdong, priority should be given to strengthening coastal infrastructure, including seawalls, drainage systems, and emergency shelters, to mitigate the direct impacts of typhoons. Additionally, enhancing early warning systems and implementing community-based disaster response programs are critical for improving preparedness and minimizing casualties. Furthermore, stricter land-use planning and the enforcement of building codes should be emphasized to reduce structural damage in high-risk areas. For moderately vulnerable regions, such as Fujian and Zhejiang, the focus should be on bolstering adaptive capacity through investments in resilient urban planning and ecosystem-based strategies. Initiatives such as mangrove reforestation and wetland conservation can serve as natural buffers against storm surges and coastal erosion while contributing to long-term environmental sustainability. In lower vulnerability areas, such as Jiangsu and Hebei, maintaining existing resilience levels should remain a priority, alongside addressing localized weaknesses. Regular assessments of disaster preparedness and continuous improvements in emergency response frameworks are essential to ensuring long-term safety. Moreover, integrating typhoon risk considerations into broader climate adaptation policies will enable these regions to proactively manage potential future threats.
By implementing these region-specific recommendations, policymakers can develop targeted interventions that effectively reduce the overall risk and impact of typhoon disasters in China’s coastal provinces. Tailored disaster preparedness and mitigation strategies will play a crucial role in enhancing regional resilience, ultimately minimizing loss of life and property during future typhoon events.
The coastal provinces of China will continue to face significant typhoon-related risks in the future, as they have historically. According to the Climate Change 2023 Synthesis Report, economic losses from typhoons have followed a fluctuating upward trend between 1984 and 2023, rising from 1.26 billion CNY in 1984 to 13.83 billion CNY in 2022 (Figure 7). Notable peaks occurred in 1998, 2008, and 2020, likely due to severe losses from major typhoon events. Outside of these peak years, economic losses remained relatively stable, with only modest fluctuations. In contrast, the death toll from typhoons has shown a declining trend, although there were significant spikes in 1998, 2008, and 2020, likely linked to the heavy casualties caused by major typhoon events. In years outside these peaks, the death toll was relatively low, usually under 10 people. These trends indicate that while the overall typhoon risk in China remains stable, the severity of impacts fluctuates depending on the intensity of individual storms. Therefore, for the foreseeable future, it is crucial for the government to remain vigilant and continue implementing effective disaster prevention and mitigation measures to minimize the impact of typhoon disasters on both the economy and the population.
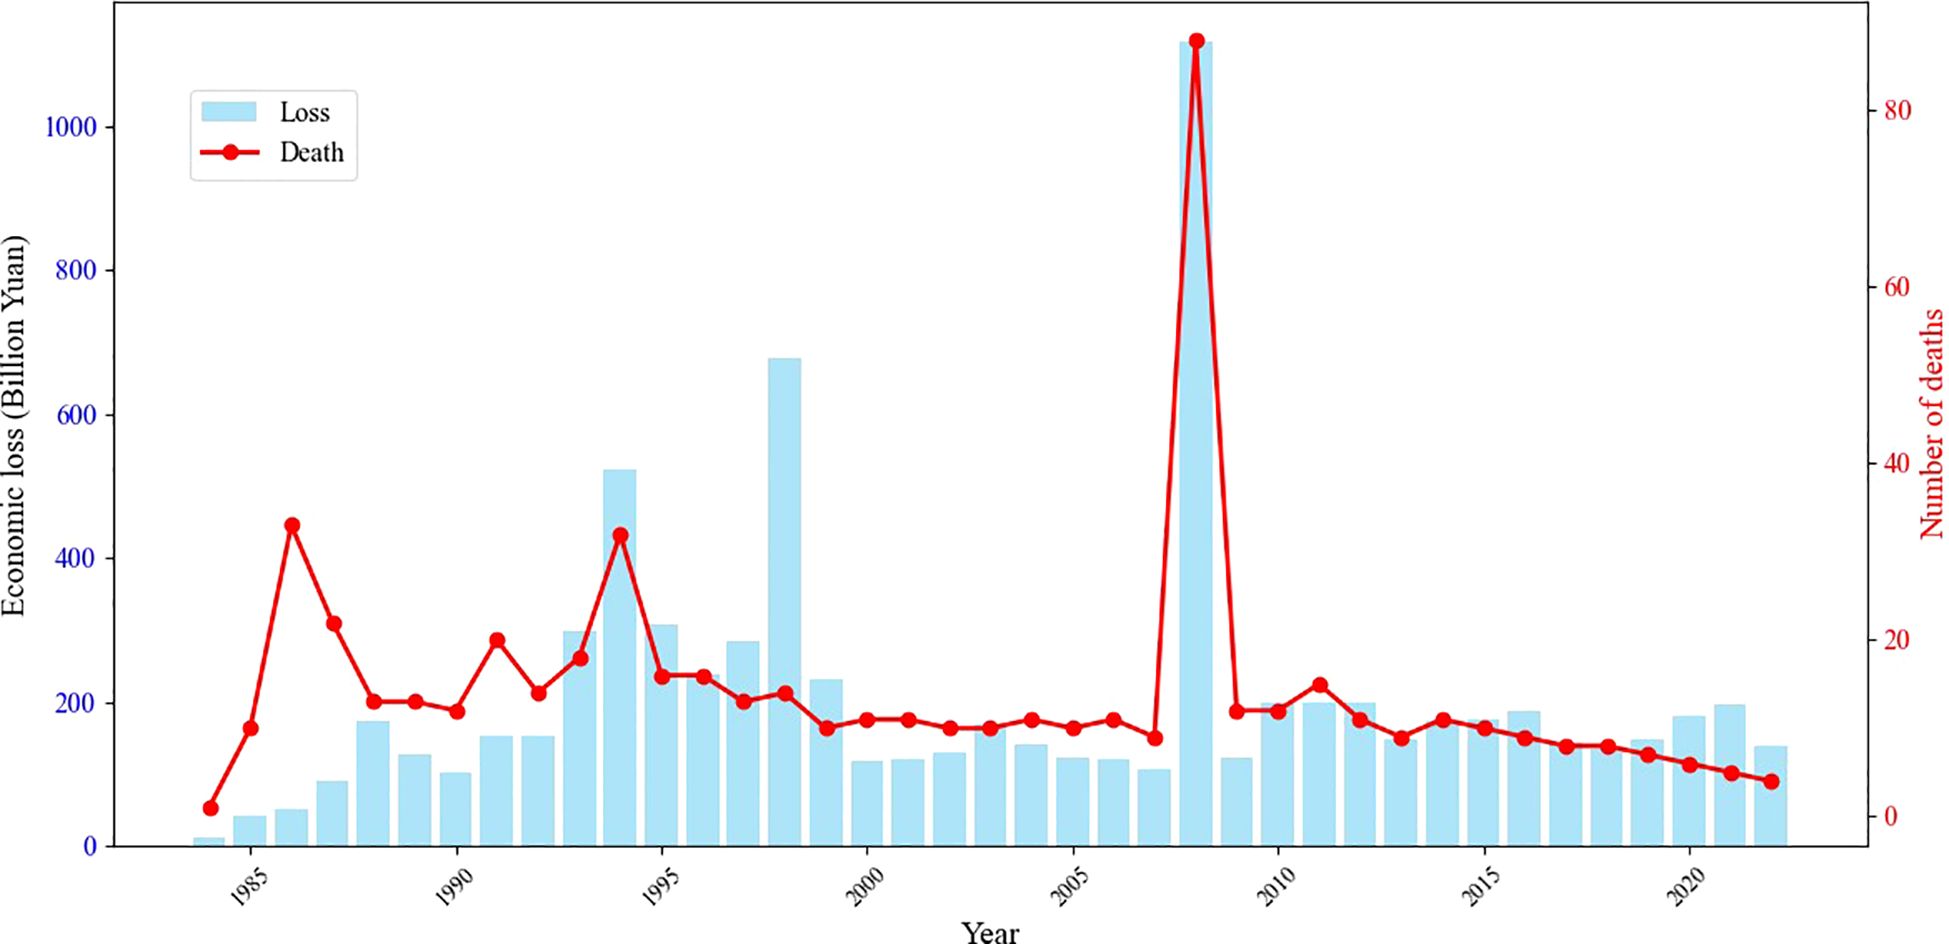
Figure 7. Economic losses and fatalities caused by typhoons in China from 1984 to 2023.
In conclusion, this study provides a comprehensive assessment of the vulnerability of China’s coastal provinces to typhoon disasters, integrating exposure, sensitivity, and adaptability into a unified risk framework. By employing GIS and AHP, the research reveals significant spatial variations in vulnerability across regions, identifying southern provinces such as Guangdong, Guangxi, and Hainan as highly vulnerable due to frequent typhoons, dense populations, and limited adaptive capacity. The study uncovers new insights into the dynamic interplay between environmental, socio-economic, and infrastructural factors contributing to regional differences in vulnerability. The significance of this research lies in its ability to offer a data-driven, spatially explicit risk assessment that can inform targeted disaster management strategies. Despite improvements in disaster preparedness, the fluctuating economic losses and fatalities associated with typhoons highlight the ongoing need for substantial investments in infrastructure resilience, improved early warning systems, and broader socio-economic development. Overall, this study provides valuable insights for policymakers, offering a scientific foundation for the development of regionally tailored risk reduction strategies that will enhance the resilience of coastal areas, mitigate future typhoon impacts, and contribute to sustainable development.
The raw data supporting the conclusions of this article will be made available by the authors, without undue reservation.
YW: Writing – original draft. WL: Software, Writing – review & editing. CC: Writing – review & editing. XL: Writing – review & editing. BL: Writing – review & editing. PD: Writing – review & editing. SS: Writing – review & editing.
The author(s) declare that financial support was received for the research, authorship, and/or publication of this article. This research was funded by the Key Laboratory of Space Ocean Remote Sensing and Application (LORA) Open Fund Project (202101002), the National Natural Science Foundation of China (grant numbers 41406204 and 41501417), and the Natural Science Foundation of Shandong Province (ZR2022QD020).
We sincerely appreciate the valuable comments provided by the editors and reviewers, which greatly contributed to the improvement of this work.
The authors declare that the research was conducted in the absence of any commercial or financial relationships that could be construed as a potential conflict of interest.
The author(s) declare that no Generative AI was used in the creation of this manuscript.
All claims expressed in this article are solely those of the authors and do not necessarily represent those of their affiliated organizations, or those of the publisher, the editors and the reviewers. Any product that may be evaluated in this article, or claim that may be made by its manufacturer, is not guaranteed or endorsed by the publisher.
IPCC. (2023). Summary for Policymakers. In: Climate Change 2023: Synthesis Report. Contribution of Working Groups I, II and III to the Sixth Assessment Report of the Intergovernmental Panel on Climate Change [Core Writing Team, H. Lee and J. Romero (eds.)]. IPCC, Geneva, Switzerland, pp. 1–34, doi: 10.59327/IPCC/AR6-9789291691647.001
Darko A., Chan A. P. C., Ameyaw E. E., Owusu E. K., Pärn E., Edwards D. J. (2019). Review of application of analytic hierarchy process (AHP) in construction. Int. J. construction Manage. 19, 436–452. doi: 10.1080/15623599.2018.1452098
De Reu J., Bourgeois J., Bats M., Zwertvaegher A., Gelorini V., De Smedt P., et al. (2013). Application of the topographic position index to heterogeneous landscapes. Geomorphology 186, 39–49. doi: 10.1016/j.geomorph.2012.12.015
European Space Agency, Sinergise (2021). Copernicus global digital elevation model (OpenTopography). doi: 10.5069/G9028PQB
Fang G., Pang W., Zhao L., Cui W., Zhu L., Cao S., et al. (2021). Extreme typhoon wind speed mapping for coastal region of China: Geographically weighted regression–based circular subregion algorithm. J. Struct. Eng. 147, 04021146. doi: 10.1061/(ASCE)ST.1943-541X.00031
Feyissa G., Zeleke G., Gebremariam E., Bewket W. (2018). GIS based quantification and mapping of climate change vulnerability hotspots in Addis Ababa. Geoenvironmental disasters 5, 1–17. doi: 10.1186/s40677-018-0106-4
Gao Y., Wang H., Liu G. M., Sun X. Y., Fei X. Y., Wang P. T., et al. (2014). Risk assessment of tropical storm surges for coastal regions of China. J. Geophysical Research: Atmospheres 119, 5364–5374. doi: 10.1002/2013JD021268
Gray J., Lloyd S., Healey S., Opdyke A. (2022). Urban and rural patterns of typhoon mortality in the Philippines. Prog. disaster Sci. 14, 100234. doi: 10.1016/j.pdisas.2022.100234
Hoque M. A. A., Pradhan B., Ahmed N., Ahmed B., Alamri A. M. (2021). Cyclone vulnerability assessment of the western coast of Bangladesh. Geomatics Natural Hazards Risk 12, 198–221. doi: 10.1080/19475705.2020.1867652
Ichino M. (2011). The quantile method for symbolic principal component analysis. Stat. Anal. Data Mining: ASA Data Sci. J. 4, 184–198. doi: 10.1002/sam.10111
Jia M., Wang Z., Wang C., Mao D., Zhang Y. (2019). A new vegetation index to detect periodically submerged mangrove forest using single-tide Sentinel-2 imagery. Remote Sens. 11, 2043. doi: 10.3390/rs11172043
Jia M., Wang Z., Zhang Y., Mao D., Wang C. (2018). Monitoring loss and recovery of mangrove forests during 42 years: The achievements of mangrove conservation in China. Int. J. Appl. Earth observation geoinformation 73, 535–545. doi: 10.1016/j.jag.2018.07.025
Kim J. S., Chen A., Lee J., Moon I. J., Moon Y. I. (2020). Statistical prediction of typhoon-induced rainfall over China using historical rainfall, tracks, and intensity of typhoon in the Western North Pacific. Remote Sens. 12, 4133. doi: 10.3390/rs12244133
Kim J. M., Son K., Yum S. G., Ahn S. (2020). Typhoon vulnerability analysis in South Korea utilizing damage record of typhoon Maemi. Adv. Civil Eng. 2020, 8885916. doi: 10.1155/2020/8885916
Li Y., Wu J., Tang R., Wu K., Nie J., Shi P., et al. (2022). Vulnerability to typhoons: A comparison of consequence and driving factors between Typhoon Hato, (2017) and Typhoon Mangkhut, (2018). Sci. total Environ. 838, 156476. doi: 10.1016/j.scitotenv.2022.156476
Liu X., Wang Y., Costanza R., Kubiszewski I., Xu N., Gao Z., et al. (2019a). Rice paddy fields’ hidden value for typhoon protection in coastal areas. Ecol. Indic. 107, 105610. doi: 10.1016/j.ecolind.2019.105610
Liu X., Wang Y., Costanza R., Kubiszewski I., Xu N., Yuan M., et al. (2019b). The value of China’s coastal wetlands and seawalls for storm protection. Ecosystem Serv. 36, 100905. doi: 10.1016/j.ecoser.2019.100905
Mendelsohn R., Emanuel K., Chonabayashi S., Bakkensen L. (2012). The impact of climate change on global tropical cyclone damage. Nat. Climate Change 2, 205–209. doi: 10.1038/nclimate1357
Nguyen K. A., Liou Y. A., Terry J. P. (2019). Vulnerability of Vietnam to typhoons: A spatial assessment based on hazards, exposure and adaptive capacity. Sci. Total Environ. 682, 31–46. doi: 10.1016/j.scitotenv.2019.04.069
Polsky C., Neff R., Yarnal B. (2007). Building comparable global change vulnerability assessments: The vulnerability scoping diagram. Global Environ. Change 17, 472–485. doi: 10.1016/j.gloenvcha.2007.01.005
Rangel-Buitrago N., Neal W. J., de Jonge V. N. (2020). Risk assessment as tool for coastal erosion management. Ocean Coast. Manage. 186, 105099. doi: 10.1016/j.ocecoaman.2020.105099
Rav M., Lowe A., Agarwal P. K. (2019). Flood risk analysis on terrains. ACM Trans. Spatial Algorithms Syst. (TSAS) 5, 1–31. doi: 10.1145/3295459
Różycka M., Migoń P., Michniewicz A. (2017). Topographic Wetness Index and Terrain Ruggedness Index in geomorphic characterisation of landslide terrains, on examples from the Sudetes, SW Poland. Z. für geomorphologie Supplementary Issues 61, 61–80. doi: 10.1127/zfg_suppl/2016/0328
Saaty T. L. (1980). The Analytic Hierarchy Process: Planning, Priority Setting, Resources Allocation (New York: Mcgraw-Hill).
Saaty R. W. (1987). The analytic hierarchy process—what it is and how it is used. Math. Model. 9, 161–176. doi: 10.1016/0270-0255(87)90473-8
Saaty T. L. (2008). Decision making with the analytic hierarchy process. Int. J. Serv. Sci. 1, 83–98. doi: 10.1504/IJSSCI.2008.017590
Sörensen R., Zinko U., Seibert J. (2006). On the calculation of the topographic wetness index: evaluation of different methods based on field observations. Hydrology Earth System Sci. 10, 101–112. doi: 10.5194/hess-10-101-2006
Terzi E. (2019). Analytic hierarchy process (ahp) to solve complex decision problems. Southeast Europe J. Soft Computing 8, 5–12. doi: 10.21533/scjournal.v8i1.168
Tomaszewski B. (2020). Geographic information systems (GIS) for disaster management (New York: Routledge).
Valjarević A., Popovici C., Štilić A., Radojković M. (2022). Cloudiness and water from cloud seeding in connection with plants distribution in the Republic of Moldova. Appl. Water Sci. 12, 262. doi: 10.1007/s13201-022-01784-3
Van Westen C. J. (2013). Remote sensing and GIS for natural hazards assessment and disaster risk management. Treatise geomorphology 3, 259–298. doi: 10.1016/B978-0-12-374739-6.00051-8
Wan C., Yan Y., Shen L., Liu J., Lai X., Qian W., et al. (2023). Damage analysis of retired typhoons in mainland China from 2009 to 2019. Natural Hazards 116, 3225–3242. doi: 10.1007/s11069-022-05804-y
Wang K. H., Chu T., Yang M. D., Chen M. C. (2020). Geostatistical based models for the spatial adjustment of radar rainfall data in typhoon events at a high-elevation river watershed. Remote Sens. 12, 1427. doi: 10.3390/rs12091427
Wang G., Liu Y., Wang H., Wang X. (2014). A comprehensive risk analysis of coastal zones in China. Estuarine Coast. Shelf Sci. 140, 22–31. doi: 10.1016/j.ecss.2013.12.019
Wang Z., Xia N., Zhao X., Ji X., Wang J. (2024). Comprehensive risk assessment of typhoon disasters in China's coastal areas based on multi-source geographic big data. Sci. Total Environ. 926, 171815. doi: 10.1016/j.scitotenv.2024.171815
Wu L., Wang B., Geng S. (2005). Growing typhoon influence on East Asia. Geophysical Res. Lett. 32, L18703. doi: 10.1029/2005GL022937
Xu X., Sun D., Guo T. (2015). A systemic analysis of typhoon risk across China. Natural Hazards 77, 461–477. doi: 10.1007/s11069-015-1586-0
Zhang Y., Fan G., He Y., Cao L. (2017). Risk assessment of typhoon disaster for the Yangtze River Delta of China. Geomatics Natural Hazards Risk 8, 1580–1591. doi: 10.1080/19475705.2017.1362040
Zhang D., Peng J. (2022b). A dataset of 1km Grid Drainage Density in China (Science Data Bank). doi: 10.57760/sciencedb.16001
Zhang D., Peng J., Shang M. (2022a). A dataset of 1km Grid Road network density in China (Science Data Bank). doi: 10.57760/sciencedb.16002
Zhang C., Yin K., Shi X., Yan X. (2021). Risk assessment for typhoon storm surges using geospatial techniques for the coastal areas of Guangdong, China. Ocean Coast. Manage. 213, 105880. doi: 10.1016/j.ocecoaman.2021.105880
Zhong X., Yan Q., Li G. (2022). Development of time series of nighttime light dataset of China, (2000–2020). J. Global Change Data Discovery 3, 416–424. doi: 10.3974/geodp.2022.03.12
Keywords: vulnerability assessment, GIS, analytic hierarchy process, exposure, sensitivity, adaptive capacity, typhoon disaster
Citation: Wang Y, Liu W, Chen C, Li X, Liu B, Du P and Sheng S (2025) GIS-based risk assessment of typhoon disasters in coastal provinces of China. Front. Mar. Sci. 12:1548763. doi: 10.3389/fmars.2025.1548763
Received: 20 December 2024; Accepted: 13 February 2025;
Published: 03 March 2025.
Edited by:
James Scott Maki, Marquette University, United StatesReviewed by:
Aleksandar Valjarević, University of Belgrade, SerbiaCopyright © 2025 Wang, Liu, Chen, Li, Liu, Du and Sheng. This is an open-access article distributed under the terms of the Creative Commons Attribution License (CC BY). The use, distribution or reproduction in other forums is permitted, provided the original author(s) and the copyright owner(s) are credited and that the original publication in this journal is cited, in accordance with accepted academic practice. No use, distribution or reproduction is permitted which does not comply with these terms.
*Correspondence: Chuntao Chen, a3Vyb3NoaW9jY3RAMTYzLmNvbQ==
Disclaimer: All claims expressed in this article are solely those of the authors and do not necessarily represent those of their affiliated organizations, or those of the publisher, the editors and the reviewers. Any product that may be evaluated in this article or claim that may be made by its manufacturer is not guaranteed or endorsed by the publisher.
Research integrity at Frontiers
Learn more about the work of our research integrity team to safeguard the quality of each article we publish.