 Xiaotong Qu
 Chengbo Wang
94% of researchers rate our articles as excellent or good
Learn more about the work of our research integrity team to safeguard the quality of each article we publish.
Find out more
ORIGINAL RESEARCH article
Front. Mar. Sci., 03 February 2025
Sec. Marine Affairs and Policy
Volume 12 - 2025 | https://doi.org/10.3389/fmars.2025.1547305
This article is part of the Research TopicEmerging Computational Intelligence Techniques to Address Challenges in Oceanic ComputingView all 5 articles
Ships often face various risks when sailing at sea, ranging from harsh natural environments to complex traffic conditions. To reduce the impact of these risks on ships and crews, this paper proposes a navigation risk assessment method that integrates computational intelligence (CI) techniques, such as fuzzy logic, with Bayesian networks (BNs) and utility theory. Firstly, a navigation risk assessment system is established using maritime data and expert knowledge, which evaluates risks from a spatial perspective by considering factors such as safeguard and accident conditions across different regions. Secondly, a fuzzy logic-based numerical and expert data transformation method is proposed to derive the prior probabilities of risk factors in BNs. The weighted fuzzy rule base is used to capture the dependencies among the risk factors. Finally, the probability distribution of navigation risk is determined by combining the prior probability and the dependencies, which are converted into risk index values through utility theory. Taking the grid-based navigation risk assessment of the South China Sea as an example, the effectiveness of this method is verified. The results of the study provide theoretical support for navigation risk assessment based on multi-source data and provide a reference for formulate maritime regulatory policies.
Maritime transport, as the primary mode of global trade, accounts for over 80% of global trade volume due to its advantages, such as large capacity, low cost, and high efficiency (Goerlandt and Montewka, 2015; Xie et al., 2021; European Maritime Safety Agency, 2024). With the expansion of fleet size and the increasing number of vessels, maritime security has become an increasingly pressing issue. According to a safety report released by Allianz, there were a total of 27,821 marine casualties and accidents over the past decade (Allianz Global Corporate & Specialty Company, 2024). These shipping accidents not only result in direct economic losses and casualties but may also cause significant environmental pollution and have long-lasting effects on the marine ecosystem. In recent years, the rapid development of smart ship technology has provided new solutions for the modernization of the shipping industry. Smart ships achieve autonomous navigation, real-time monitoring, and energy consumption management by integrating sensor technology, automation technology, data analysis, and artificial intelligence algorithms (Wang et al., 2023; Wang et al., 2024). These new technologies provide a more efficient means for marine environmental monitoring and scientific research. However, the complex and changeable navigation environment is still the key factor that affects the ship’s performance and safe navigation, and also the main cause of shipping accidents. Therefore, there is an urgent need to develop a scientific and effective navigation risk assessment method to assist decision-makers in allocating resources more effectively and improving maritime safety.
Industry experts have conducted extensive studies on ship navigation risks, covering qualitative, quantitative, and semi-quantitative assessment methods. Depending on the quality and availability of data, a variety of risk assessment methods suitable for different scenarios have been proposed. For instance, when data is limited or unavailable, qualitative methods are often used to assess risk (Li et al., 2021a), but the assessment results are highly subjective and difficult to quantify accurately. In contrast, when data is sufficient and valid, quantitative methods can accurately quantify and predict risks (Li et al., 2021b). However, quantitative methods often ignore factors that are unstructured or difficult to quantify, resulting in insufficient applicability of assessment results. When multiple data sources are involved, the semi-quantitative method is considered to be a reasonable option (Yu et al., 2021; Li et al., 2022). By combining qualitative and quantitative data, it can make up for the shortcomings of a single method to a certain extent and provide more comprehensive risk assessment results. Ship navigation environment modelling involves multi-dimensional, heterogeneous and complex data, including large-scale quantitative data such as wind, waves, and visibility, as well as small sample qualitative data related to operational safety and preventive measures. The heterogeneity and uncertainty of these data present significant challenges for traditional risk assessment methods.
To address these challenges, researchers have proposed various advanced Cl techniques, including fuzzy logic, evolutionary algorithms, and neural networks. These CI techniques are designed to emulate human information processing and reasoning mechanisms, enabling them to tackle problems that traditional mathematical modelling approaches cannot effectively solve. BNs are a critical tool for probabilistic reasoning and risk assessment, capable of effectively integrating multi-source data through probabilistic inference mechanisms to uncover the dependencies among risk factors. BNs are closely connected with CI techniques. For instance, integrating CI methods such as fuzzy logic and evolutionary algorithms with BNs can significantly enhance the accuracy of maritime risk assessment. However, ship navigation risk assessment faces several challenges: (1) The difficulty of integrating multi-source information, which leads to incomplete data acquisition and hampers the full capture of key risk influencing factors (RIFs); (2) The limitations of traditional methods in handling data uncertainty and ambiguity, which affect the accuracy and reliability of assessment results; (3) The inability of traditional BNs to capture nonlinear dependencies between risk factors, which limits their application in complex scenarios.
Based on the analyses presented above, this paper proposes a computational intelligence-based risk assessment method for ship navigation that integrates the advantages of BNs, fuzzy logic, and utility theory. This method aims to comprehensively and systematically evaluate the risks associated with ship navigation in the South China Sea. The paper makes the following three contributions:
(1) A ship navigation risk assessment system is proposed, focusing on ‘nature, traffic, safeguard, and accident’ factors across regions. Unlike traditional models, this approach evaluates risks spatially, offering a more region-specific and accessible assessment.
(2) A novel expert data transformation method is introduced. Building on the traditional similarity aggregation method, this approach considers expert weights and credibility, and introduces the weakest exemplar function to mitigate the uncertainty accumulation in the fuzzy computation process, thereby enhancing the reliability of expert data transformation.
(3) A weighted fuzzy rule base is used to capture the dependencies between risk factors in the BN model. This method not only overcomes the limitations of the Monte Carlo method in terms of accuracy and the heavy workload associated with expert scoring methods, but also broadens the applicability of BNs.
The rest of the paper is organized as follows: Section 2 reviews ship navigation risk assessment and the use of BN and CI methods. Section 3 outlines the methodology for the risk assessment model. A case study is presented in Section 4, and Section 5 concludes the paper.
In recent years, research on ship navigation safety assessment has become a focus, attracting widespread attention from scholars around the world. Ship navigation safety assessment is a complex systematic project involving multiple risk factors, including humans, ships, environment and management. The strong interdependencies between these factors complicate the risk assessment process. To assess maritime risks rationally and effectively, the IMO introduced the Formal Safety Assessment (FSA) method (Wang et al., 2019), designed to support decision-making for maritime stakeholders. Driven by the FSA method, traditional risk analysis methods such as quantitative assessment (e.g., Fault Tree Analysis, Incident Tree Analysis, etc.) and qualitative assessment (e.g., Human Factors Analysis and Classification System (HFACS), Root Cause Analysis) are widely used in ship navigation risk assessment. Chen et al. (2013) applied the HFACS method to systematically investigate and classify human factors in maritime accidents. Senol and Sahin (2016) proposed a real-time, continuous fuzzy fault tree analysis model to address complex and ambiguous maritime accidents. Zhang et al. (2019) used both HFACS and fault tree models to identify and classify collision risk factors for icebreakers in ice-covered waters. However, traditional methods have certain limitations in quantifying risks and revealing the causal relationships between risk factors.
To this end, scholars have proposed advanced methods such as BN to solve the above defects. As a powerful tool for probabilistic inference, BNs excel in uncertainty quantification and error diagnosis, and have been successfully applied safe navigation at sea. In the absence of extensive historical data, expert knowledge becomes a crucial source for constructing BN models. Experts define the network structure and conditional probability distributions by analysing the causal relationships between influencing factors. This expert-driven approach is particularly suited for small-scale problems or scenarios where domain-specific knowledge is abundant. For example, Li et al. (2024) utilized expert knowledge to develop a BN model for assessing the collision risk of maritime autonomous surface ships at sea. Fu et al. (2023) combined expert judgment, fuzzy sets, and BNs to propose an innovative risk management framework for maritime transport systems, enhancing the efficiency and competitiveness of inland navigation in the Yangtze River Estuary. With the advancement of big data technology, it has become feasible to automatically learn BN model structures and parameters from historical data. The data-driven BN modelling approach can uncover hidden dependencies in large, heterogeneous datasets, reducing the need for manual intervention. For instance, Fan et al. (2020) integrated human factors into the causal analysis of maritime accidents and applied a data-driven BN method to assess maritime accident risks. The results identified key human factors contributing to various types of accidents and provided targeted recommendations to mitigate related human errors. Jiang et al. (2020) introduced a BN structure learning method based on the improved K2 algorithm to analyse the causes of maritime accidents along major routes of the Maritime Silk Road. This method automatically uncovers causal relationships between variables from accident data and constructs a BN model that accurately reflects real-world conditions.
Recent studies have shown that CI also has potential in maritime risk assessment. CI is a branch of artificial intelligence that uses techniques such as fuzzy logic, neural networks, and evolutionary algorithms to solve complex, uncertain, and dynamic problems (Iqbal et al., 2020; Lazarowska, 2024). In terms of ship navigation safety, CI methods are particularly suitable for dealing with the inherent uncertainty and complexity associated with the marine environment. For example, fuzzy logic has been used to model the uncertainty of multi-ship collision risk (Shi et al., 2022). Evolutionary algorithms have been used to optimize ship routes and reduce the risk of accidents in complex navigation areas (Pan et al., 2021). These studies have shown that CI can effectively supplement traditional risk analysis methods and thus enhance the maritime safety decision-making process.
BN is an important probabilistic reasoning and risk assessment method that is intrinsically linked to CI. CI methods such as fuzzy logic and neural networks are integrated with BN to significantly improve the accuracy of maritime risk assessment. Fuzzy logic can be used to handle the uncertainty inherent in risk events, while neural networks are able to discover hidden patterns in large data sets. This synergy between BN and CI techniques makes risk analysis in the maritime sector more comprehensive and robust. For instance, Yu et al. (2021) integrated multi-source data using BNs, fuzzy logic, and evidential reasoning (ER) methods to assess the overall risk of ships in the coastal waters of the South China Sea. This hybrid approach is more effective in handling the complexities of maritime environments and the dynamic nature of risk factors. However, these assessments are typically conducted at the macro level, focusing on specific accident types or geographic areas. There is a growing need for a new method that can assess ship navigation risks at a finer resolution and allow for the comparison and analysis of risks across different grid sections of maritime regions.
Overall, CI provides a powerful set of tools to improve ship navigation safety through improved risk assessment models. Techniques such as fuzzy logic, neural networks, and evolutionary algorithms complement traditional risk assessment methods such as BNs and can better capture the complexity and uncertainty of the marine environment. Both expert-driven and data-driven BN modelling approaches offer distinct advantages and limitations, and should be flexibly selected or combined based on the specific characteristics of the problem at hand. Due to the unique nature of maritime data and the challenges associated with accessing expert knowledge, there is a relatively limited body of research on gridded maritime risk assessments at the micro level. This constitutes a significant research gap, and addressing it could provide valuable insights for decision-makers in emergency resource allocation. Furthermore, it could contribute to advancing both the theoretical foundations and practical applications of BNs.
To address the navigation safety issues, this paper proposes a novel risk assessment method, illustrated in Figure 1 as a flowchart. Firstly, a navigation risk evaluation system is established to identify risk influence factors. Second, a data-driven BN model is constructed as the core of the method. On the one hand, prior probabilities of the BN root nodes are derived through the transformation of multi-source data; on the other hand, conditional probability tables (CPTs) for the BN are generated using a weighted fuzzy rule-based approach. Finally, a utility function is designed to calculate clear and quantitative navigation risk values.
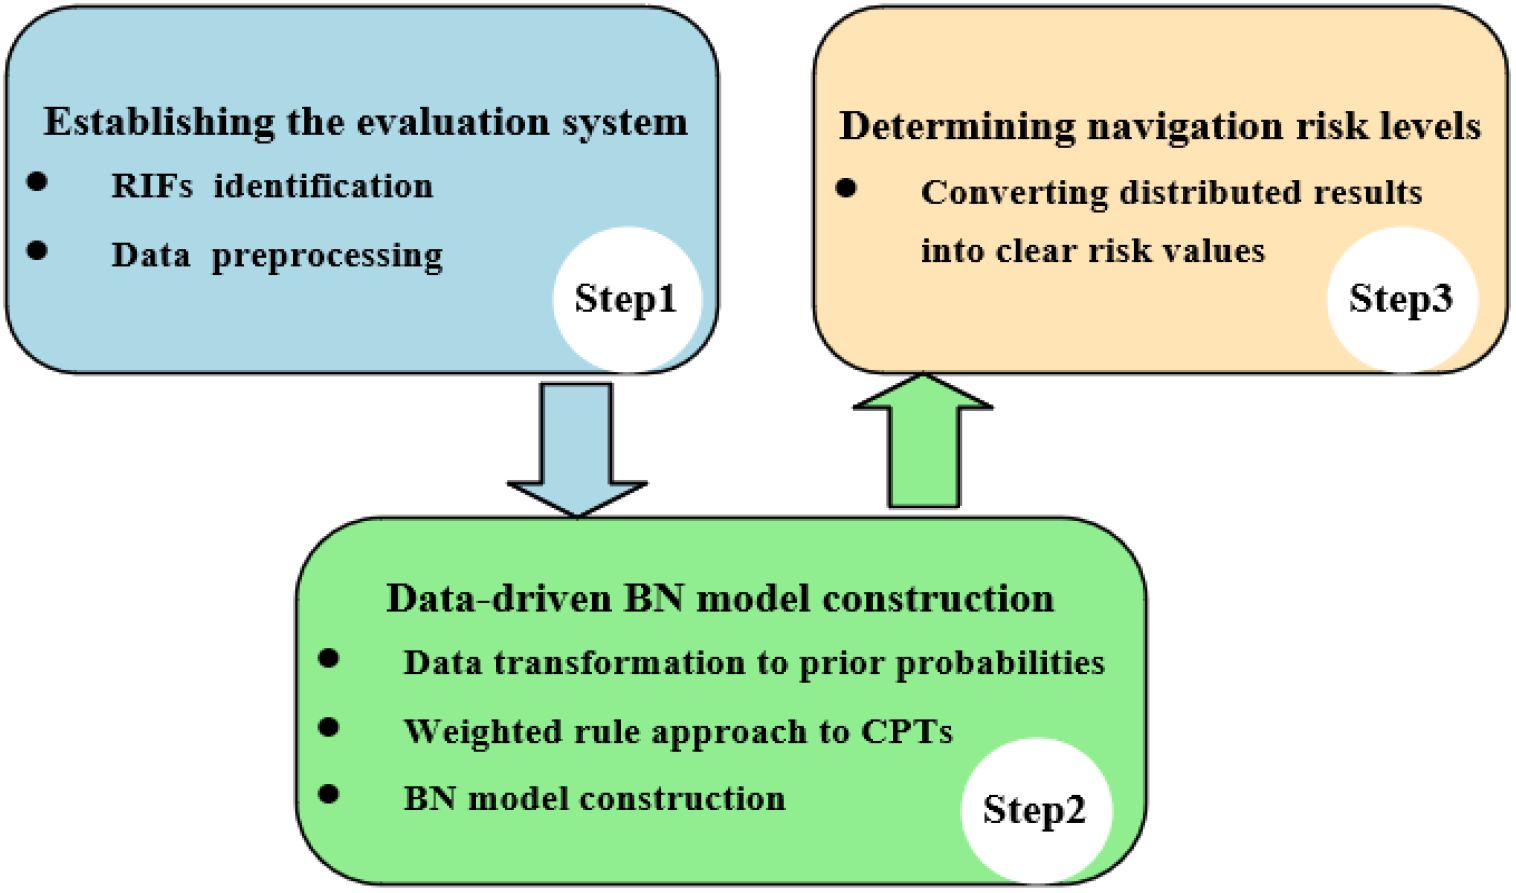
Figure 1. Proposed three-step assessment method.
The initial phase in implementing the proposed methodology involves the development of a comprehensive navigation risk assessment system. This system is designed to identify variables that may compromise the safety of ship navigation and to establish their hierarchical relationships. In this study, navigation risk is defined as the interplay between the likelihood of events that could lead to casualties, economic losses, environmental pollution, or disruptions in navigation, and the severity of their potential consequences (Yu et al., 2021). It is widely acknowledged that integrating a thorough literature review with expert insights is essential to ensure the robustness and validity of the evaluation framework. The process begins with the identification of potential variables influencing navigation safety through an exhaustive analysis of existing scholarly work on navigation risk (Wang et al., 2019; Pan et al., 2021; Li et al., 2022; Li et al., 2022). Subsequently, five industry experts are consulted to validate and ensure the reliability of the selected variables. These experts are chosen based on their extensive professional backgrounds and practical experience in maritime safety, shipping management, and related disciplines, thereby guaranteeing the representativeness and authority of their contributions. Detailed profiles of the selected experts are provided in Appendix A. Finally, leveraging both the literature analysis and expert feedback, a novel ship navigation risk assessment framework is established, as illustrated in Table 1.
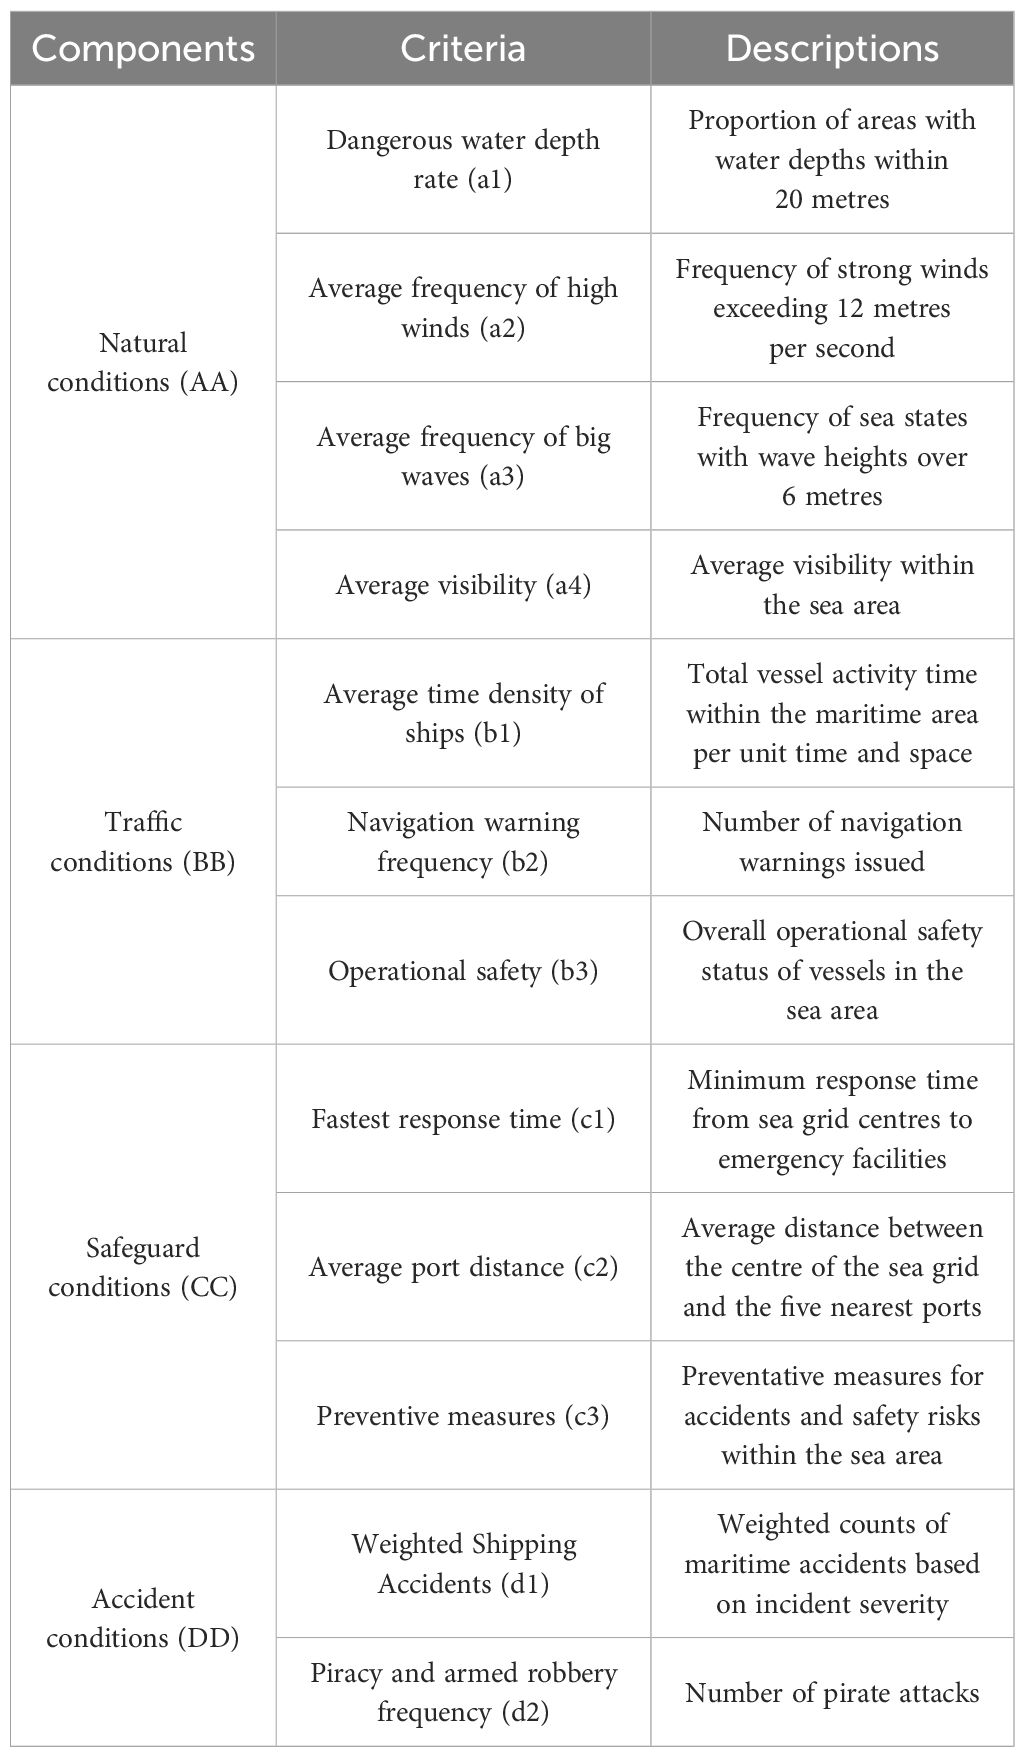
Table 1. Criteria and descriptions for the assessment of ship navigation risks.
Traditional ship navigation risk assessment models typically encompass four dimensions: natural conditions, traffic conditions, human factors, and management practices. In contrast, this study evaluates risks from a spatial perspective, introducing two new dimensions—safeguard conditions and accident conditions—that focus on the navigation environment and response capabilities in different regions. By integrating both quantitative indicators, such as wind and wave conditions, and qualitative indicators based on expert evaluations, like operational safety and preventive measures, this approach offers a more comprehensive risk assessment framework. The next section will detail the methodologies used to process these diverse types of indicator data.
For numerical indicators, this study proposes a method to convert individual data points into a priori probabilities associated with the root nodes. Without loss of generality, the indicator X is classified into M states () based on expert judgment, and the corresponding thresholds () are determined for these states. When an observed value x falls within the interval (), the affiliation of observation x in states and can be calculated in two ways.
If X is a profit indicator, that is, larger values are given priority, where
If X is a cost indicator, that is, smaller values are given priority, where
Generally speaking, it is difficult to directly obtain the threshold of indicator data. Therefore, most studies use the maximum value and the minimum value of the indicator in the database to replace the threshold (Fan et al., 2023). The specific calculation process is as follows.
The aforementioned method is well-suited for ideal scenarios where the dataset is small, and the data distribution is relatively uniform. However, when the data distribution is uneven, the quantile method offers significant advantages over the equal-interval method for calculating thresholds. The process for determining thresholds using the quantile method is outlined as follows.
where denotes the boundary value of the mth interval and denotes the value of the percentile p.
For the expert-based indicator, this study introduces a data transformation method to estimate the prior probabilities of the root node. The detailed procedure is outlined as follows.
Due to the uncertainty and incompleteness of the information, experts are unable to directly provide a precise probability value for the root node. However, qualitative language terms can be used to express the likelihood of the root node. In this paper, with reference to industry standards and practical experience, a five-level evaluation scale is adopted to represent expert judgment regarding the probability of the root node. Given its simplicity and efficiency, a triangular membership function is employed to address the uncertainty in expert judgments. Based on inductive reasoning and expert evaluations, membership and non-membership functions that describe the possibility of navigation safety risks are developed (see Table 2). Through the mapping relationship shown in Table 2, expert qualitative assessments can be converted into quantitative intuitionistic fuzzy numbers (IFNs).
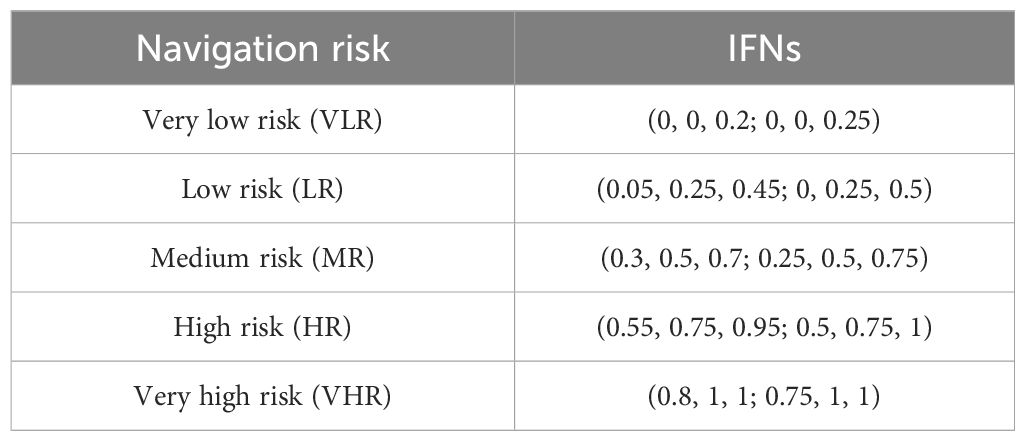
Table 2. IFNs corresponding to navigation risk.
Due to differences in educational background, work experience, etc., the judgement of different experts on the same indicator may be biased. Therefore, the reliability of expert judgement is crucial to the assessment results. In this paper, the influence of four standard factors, namely, title, sea service time, highest degree, and influencing factors, on the reliability of expert judgement is considered. Based on the personal information of the experts (see Appendix A) and the scoring criteria shown in Table 3, the score of each expert is calculated and normalised by Equation 5 to finally determine the weight of each expert.
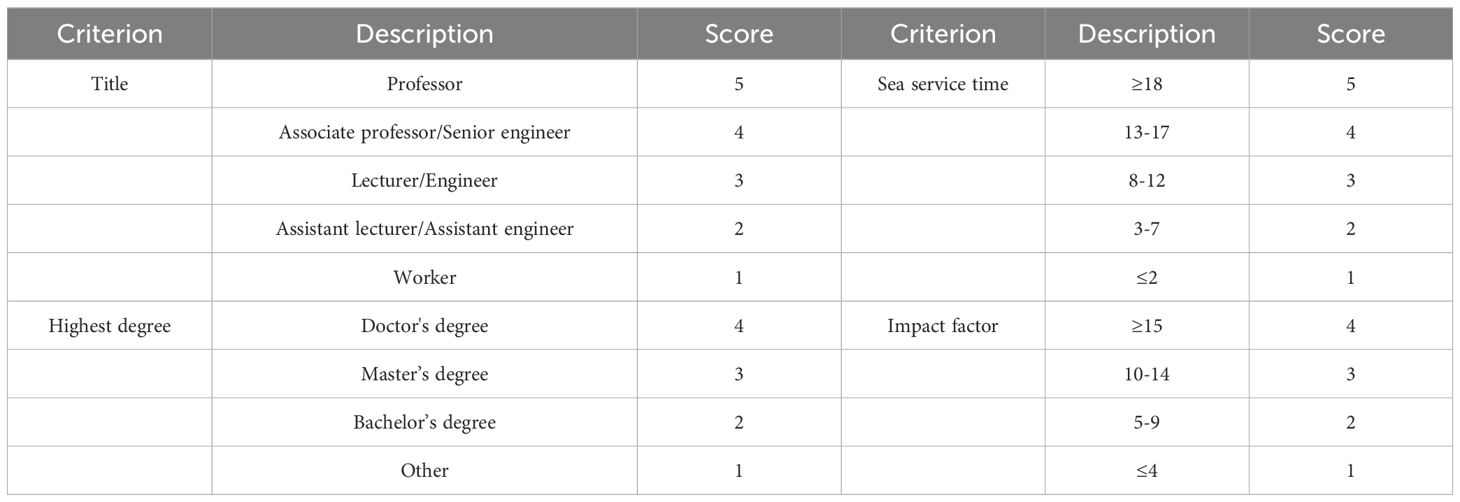
Table 3. Scoring criteria for expert profiles.
where denotes the composite score of the k-th expert.
In the intuitionistic fuzzy environment, the traditional similarity aggregation method (Turna, 2024) is improved and the opinions of different experts are aggregated by the operator in the following steps:
Evaluating Similarity: If the opinions of experts and are expressed in terms of and , respectively, then and represent the expected evaluated values of and , respectively, and can be defined as:
Similarly, can be defined as:
Then the similarity function between expert and expert can be defined by the following equation:
Evaluating weighted agreement: The weighted agreement of expert Qk can be defined by the following equation:
where ω(Qk) is the weight of the expert Qk.
Determination of relative agreement: The relative agreement of each expert can be calculated as follows:
Calculation of consistency coefficient: The consistency coefficient is calculated by combining the expert weights and relative consistency as follows:
Aggregate expert opinions: Considering the operator, combined with the consistency coefficient aggregation expert opinion, it is calculated as follows:
Defuzzification: The purpose of defuzzification is to obtain the probability of an event, which will be used as the prior probability of the root node in the evaluation model. Common defuzzification methods include the centroid method, weighted average method, centre method, and mean maximum membership method (Varghese and Kuriakose, 2012). Since the centroid method is simple and efficient, this method is selected in this paper to obtain the fuzzy probability score (FPS) of any IFN . The calculation formula is as follows:
In this step, a weighted rule approach is proposed to capture the dependencies of the root node with other nodes. The generic IF-THEN fuzzy rule base is shown below:
where denotes the kth rule, (IF part) denotes the nth cause variable, (THEN part) denotes the mth outcome variable, denotes the confidence level assigned to , and n and m represent the total number of cause and outcome variables, respectively.
To facilitate data collection, this paper sets the number of language levels to be consistent with the total number of outcome variables in the fuzzy rule base. Literature (Fan et al., 2023) uses an equivalent method to define the rules between nodes and converts them into CPT. The CPT established using the equivalence method cannot reflect the variability of different influencing factors and ignores the influence of expert judgement reliability. To this end, industry experts should define the rules between nodes based on their work experience and normalize them according to the expert weights determined in section 4.2. Taking ‘natural conditions’ as an example, the CPT established is shown in Table 4.
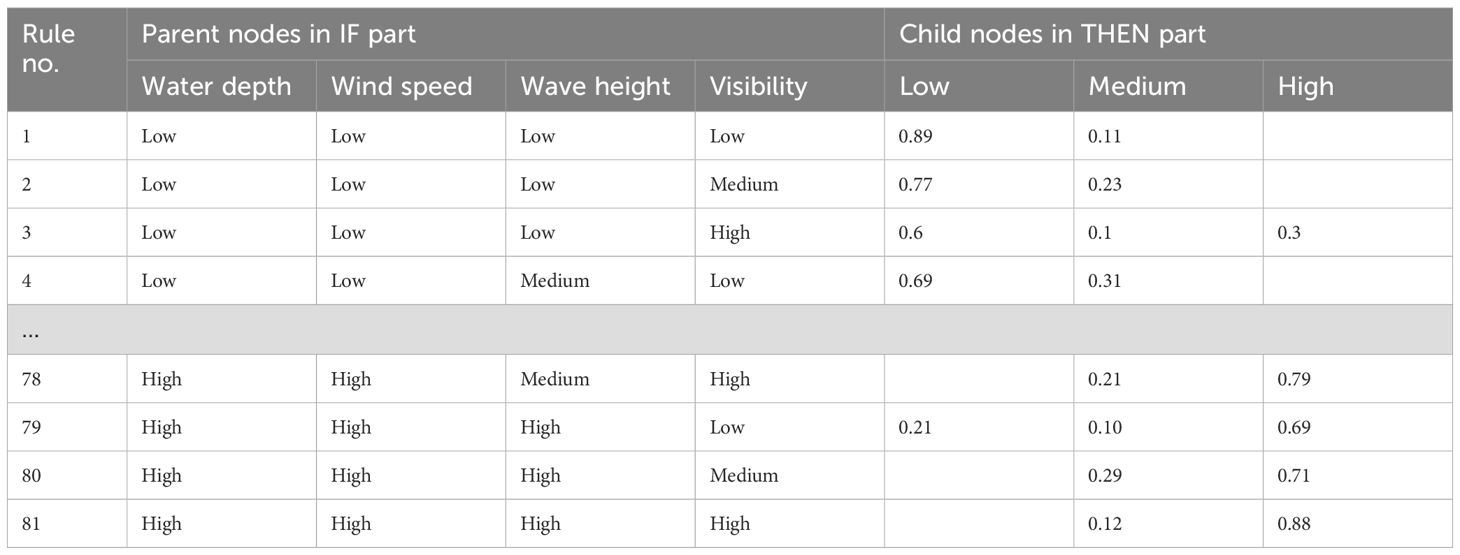
Table 4. CPT for Natural conditions node using weighted method.
The last step of implementing the method is to obtain a clear risk value. The assessment results obtained based on the BN model are distributed. For decision makers, the distributed assessment results cannot be directly used to rank the risk levels of the sea area. To solve this problem, we use the utility function to convert the distributed risk assessment results into specific risk values, thereby ranking the overall risk level of the sea area. The final navigation risk value can be calculated using the following formula:
where denotes the marginal probability of the three states and denotes the value of utility in the three states ().
The South China Sea is a region with busy trade and frequent accidents, so it has been selected as the study area for this paper. According to international conventions, coastal countries have the responsibility to provide search and rescue services. The South China Sea mainly includes China, the Philippines, Laos and other countries. To facilitate data collection and result analysis, the study defines the scope of the South China Sea area within a rectangular boundary. The coordinates of the top-left corner of the rectangle are 20°0′0″N, 110°0′0″E, and the coordinates of the bottom-right corner are 9°0′0″N, 120°0′0″E, as shown in Figure 2. Based on this, the region is further divided into a grid, with each grid square having a side length of one degree of longitude and one degree of latitude. The grid is numbered horizontally from left to right with letters A to J, and vertically from top to bottom with numbers 1 to 11. This grid-based approach allows for more precise spatial analysis of the South China Sea area.

Figure 2. Grid-based study area in the South China Sea.
This paper collects or summarizes data sets of 12 risk indicators from multiple channels such as international organizations and commercial companies. The data sets used are shown in Table 5. After preliminary screening and cleaning of the data sets, the initial values of various risk indicators in the South China Sea are finally obtained. Due to space limitations, this paper only presents the initial values of various risk indicators in the South China Sea A1 to A5 areas. The specific data are shown in Table 6. It can be seen that the effective integration of multi-source data is a huge challenge.
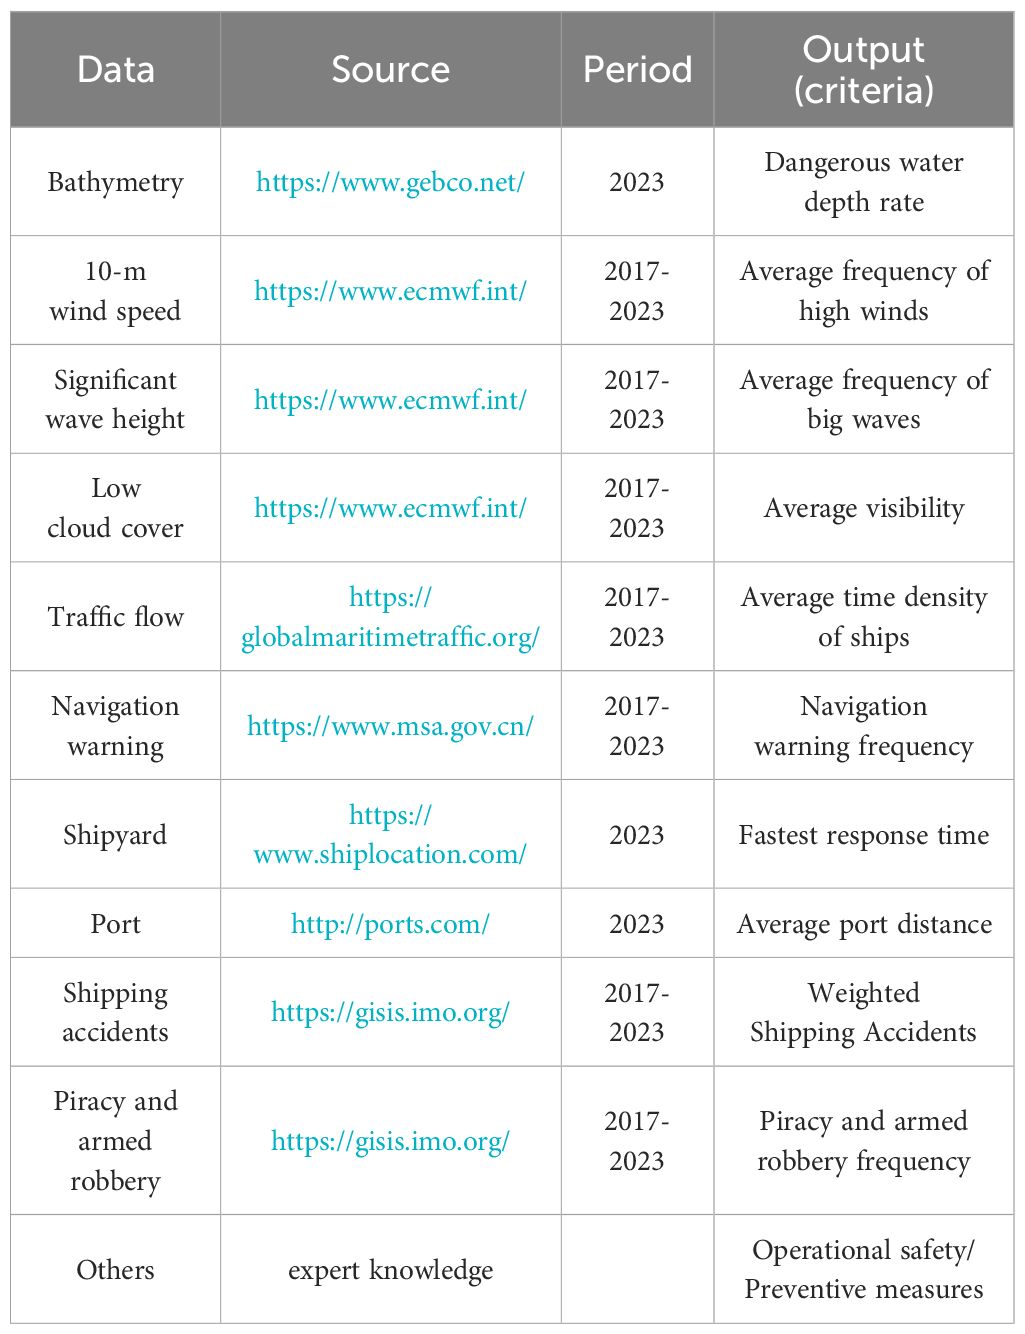
Table 5. Sources of the datasets.
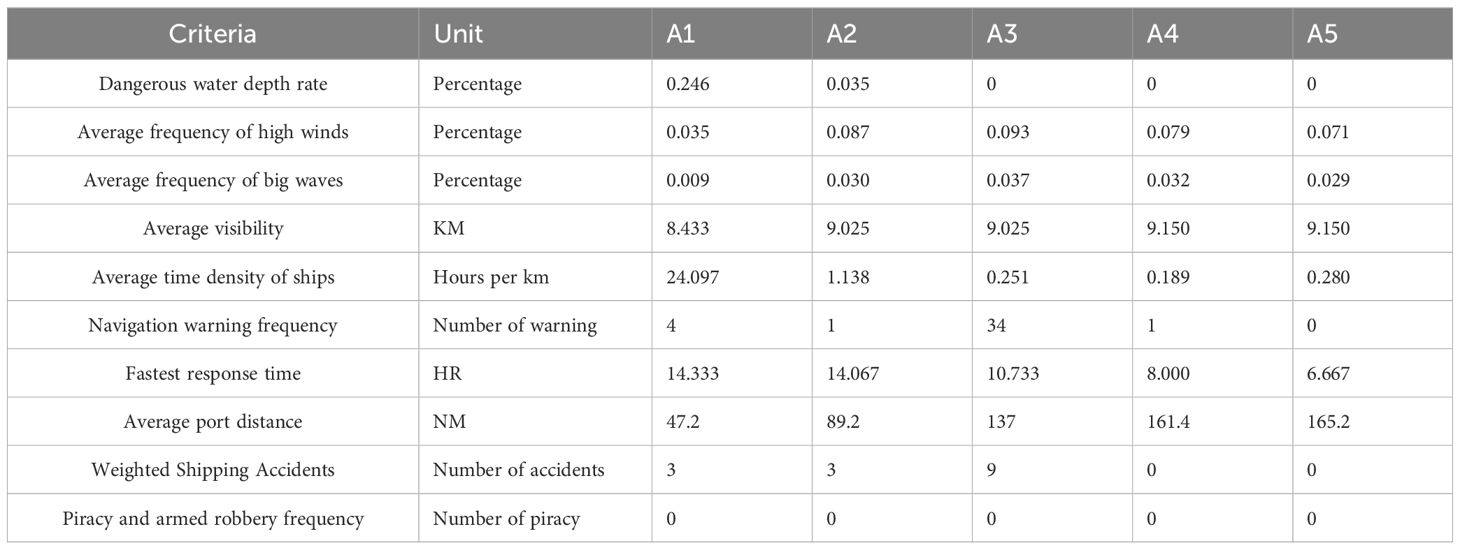
Table 6. Criteria values reflecting the characteristics of sea areas A1 to A5.
The South China Sea gridded navigation assessment process involves the use of a weighted rule-based BN model, as described in Section 3. As an example, the discretisation process of numerical indicator data is presented in the calculation of the ‘average time density of ships’ indicator. The calculation shows that the average value of selected areas in the South China Sea fluctuates between 0.051 and 24.097. According to Equations 1, 3, and 4, the equal interval method and quantile method are used to perform data transformation. The results are shown in Table 7.
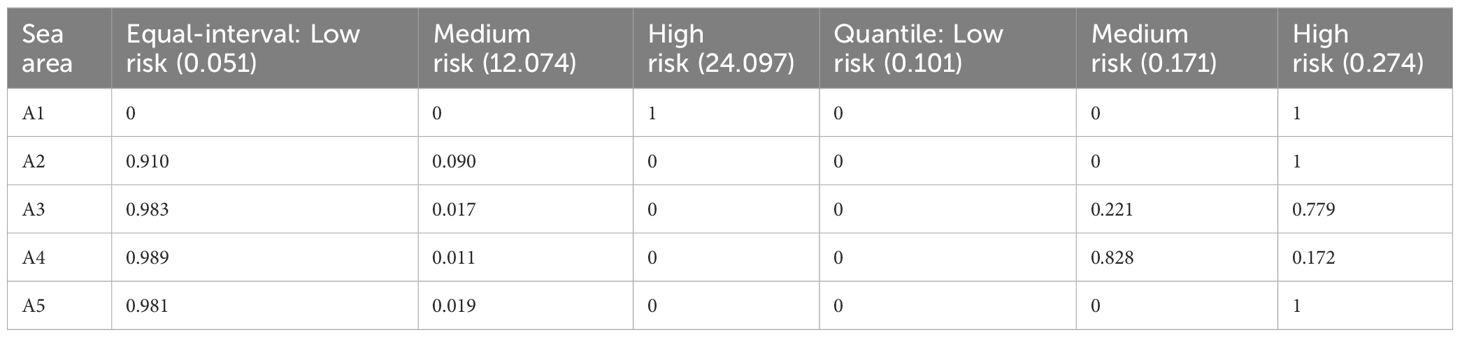
Table 7. Index conversion results using different approach.
As can be seen from the table, both the quantile method and the equal interval method are able to categorise the indicator data, but their classification results are significantly different. Obviously, the classification results obtained based on the quantile method are better, which is due to the fact that the quantile method can effectively deal with non-uniformly distributed data. This method effectively avoids the influence of extreme values on the classification results by dividing the data into equal parts. Therefore, it is more appropriate to choose the quantile method to determine the indicator thresholds in this study. Taking A1 sea area as an example, the results of the discretization of numerical indicators are shown in Table 8. Here, the input information is treated as the prior probability of the root node.
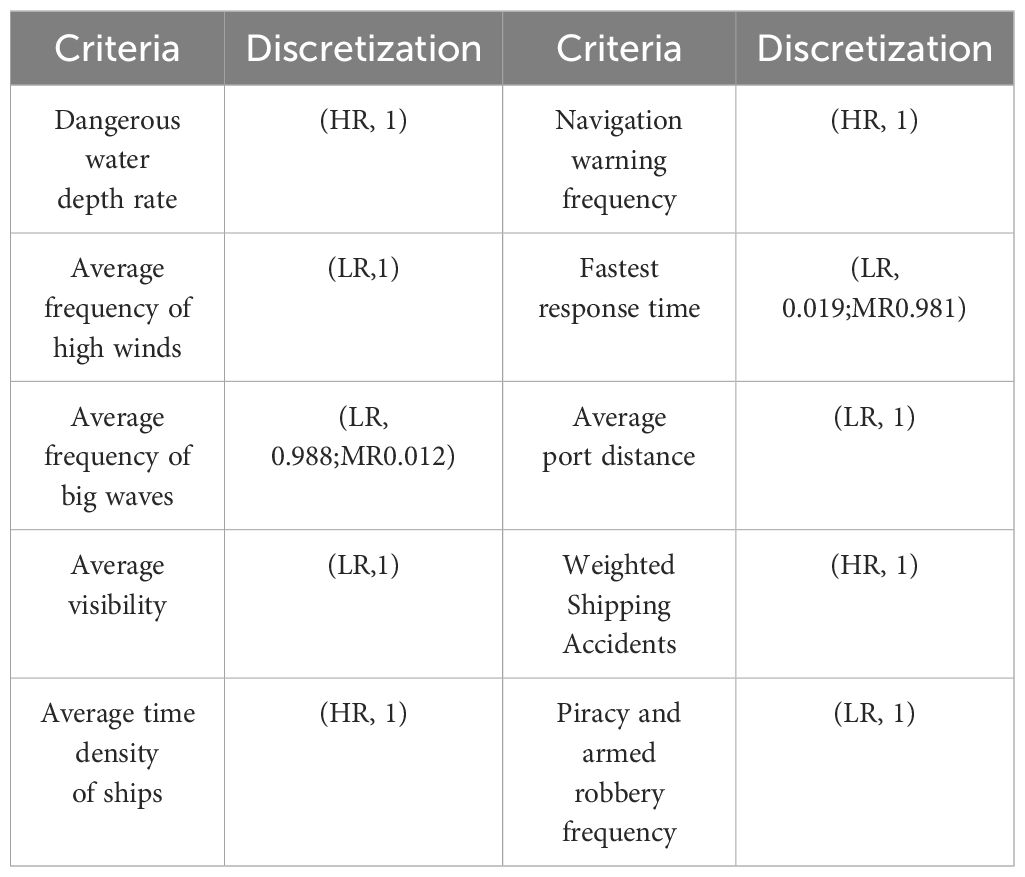
Table 8. Discretization of the numerical indicator for sea area A1.
Next, the discretisation process of expert-based indicator data is introduced. Taking the A1 sea area as an example, the evaluation information given by five experts on the risk indicator ‘operational safety’ is {VHR, VHR, HR, HR, MR}, and the aggregation calculation process of the root node ‘operational safety’ is shown in Appendix B. As can be seen from the table, the prior probability of this node is (LR0.185; HR0.815). Similarly, the prior probabilities of expert-based indicators in other sea areas can be obtained.
Then, combined with the evaluation system established in Section 3.1, the risk assessment model of ship navigation is constructed. The model contains a total of 17 nodes, including 12 root nodes, 4 intermediate nodes and 1 target node, as shown in Figure 3.
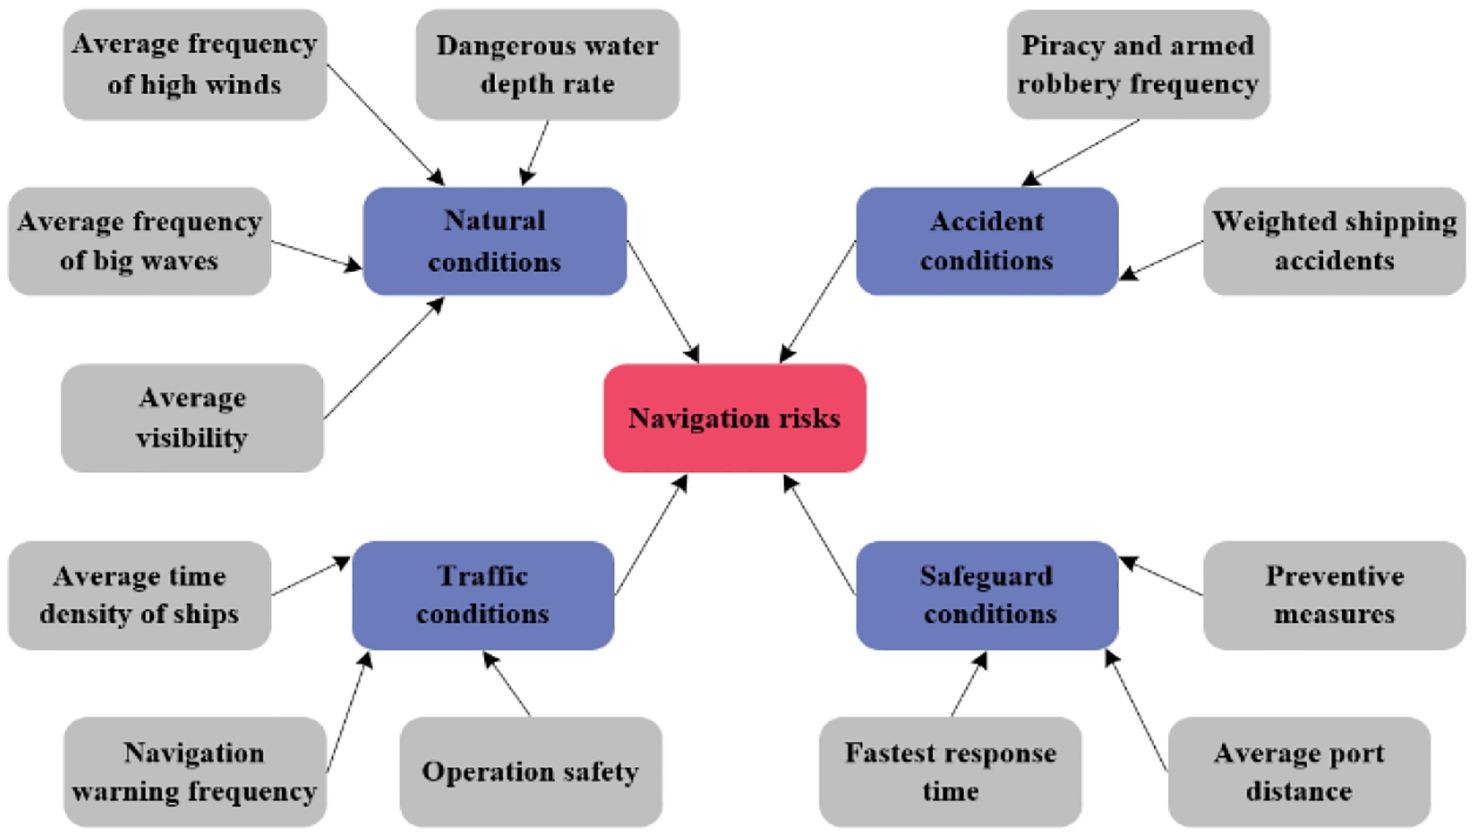
Figure 3. BN structure.
Finally, based on the a priori probabilities and dependencies of the nodes, the BN model with weighted rules is used to synthesise the input data and transform the results into belief degrees. Taking A1 sea area as an example, the result of navigation risk assessment is shown in Figure 4.
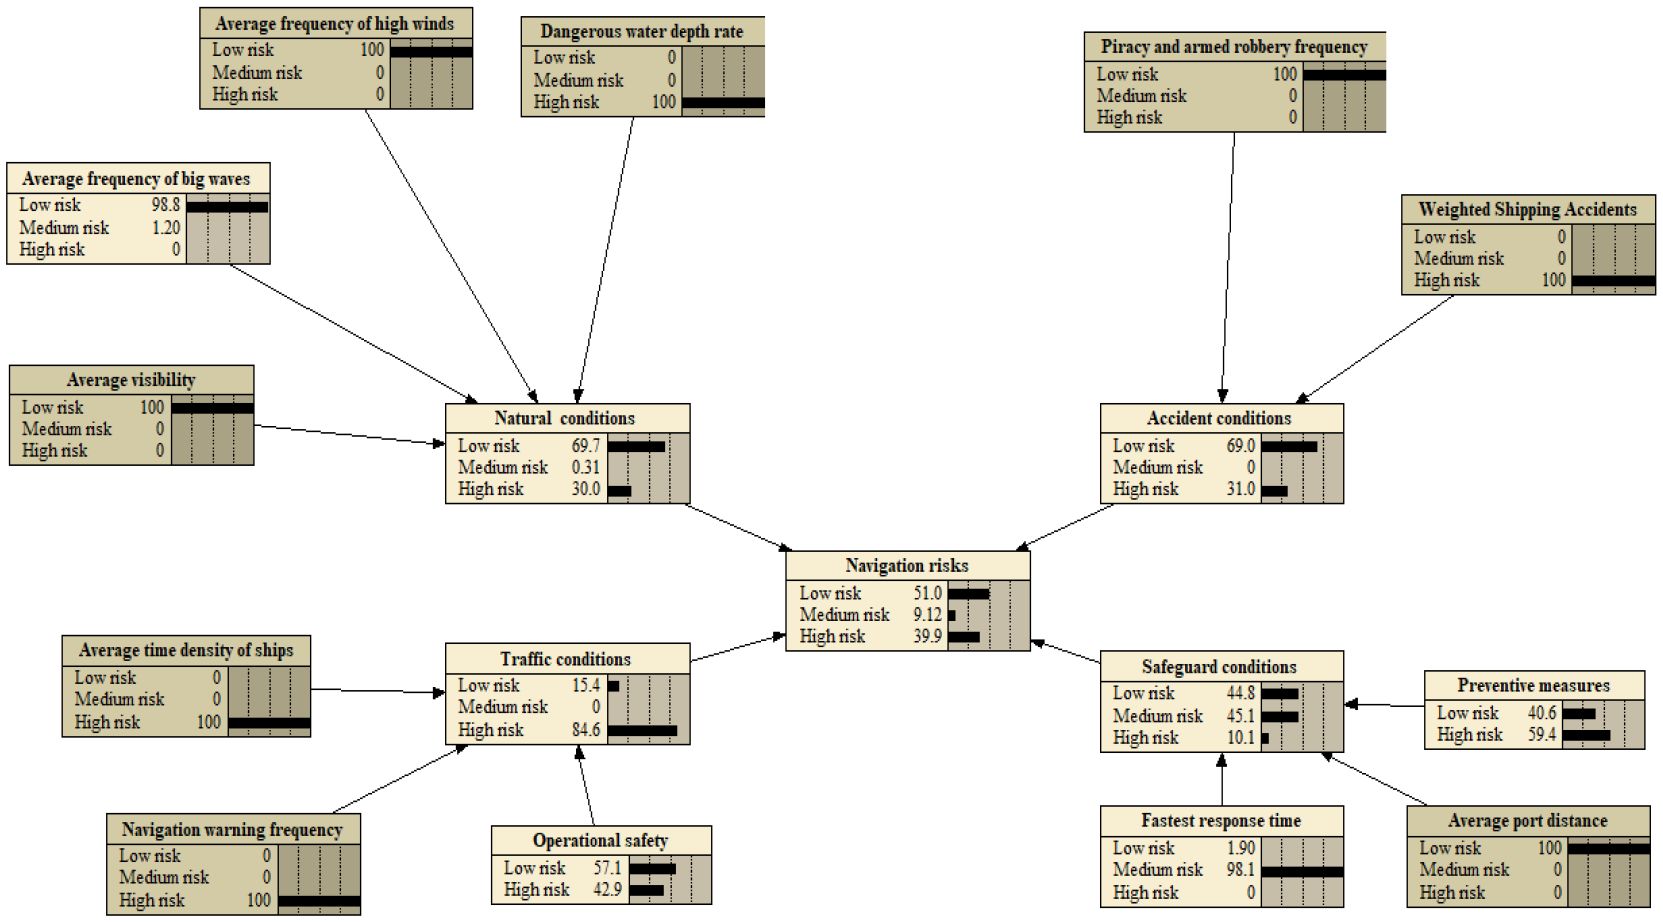
Figure 4. The BN model created for navigation risk assessment.
Figure 4 shows the results for navigation risk in sea area A1, where the low risk confidence level is 51%, and the medium and high risk confidence levels are 9.1% and 39.9%, respectively. At this point, relying solely on distributional probabilities is not sufficient to rank the level of navigation risk. Therefore, it is necessary to combine the utility function to simplify the decision-making process. The value of navigation risk can be calculated by Equation 15 and used to determine the risk level. Using the same method, the navigation risk of other South China Sea grids can also be assessed. Due to space limitation, this paper only shows the distribution of navigation risk from A1 to A5 sea area in the South China Sea, as represented in Figure 5.
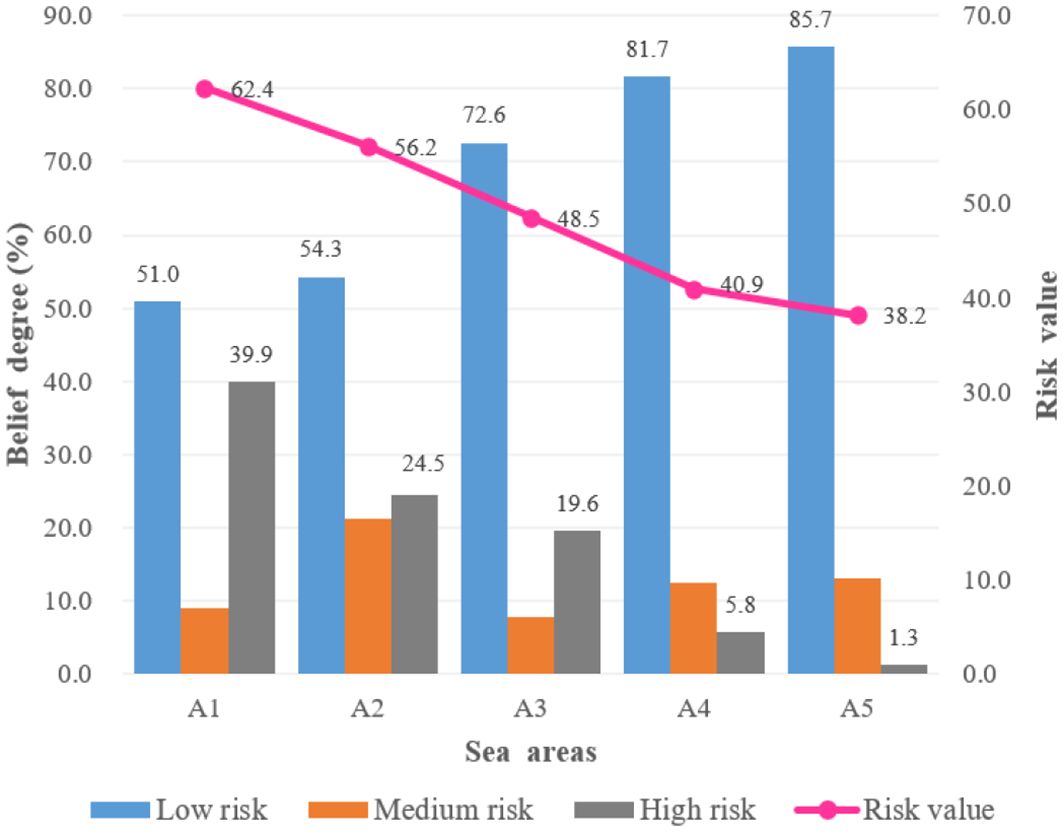
Figure 5. Navigation risk Distribution in A1-A5 areas.
Located at the north-western end of the selected area of the South China Sea, sea area A1 deserves attention with a high navigation risk score of 62.4 and a risk rating of medium risk. The two influencing factors of intensive ship traffic flow and high frequency of navigation warnings give it a high risk score for traffic conditions. In addition, poor natural conditions (especially water depth) and frequent shipping accidents make it a serious challenge for navigation safety in the A1 region, and these challenges highlight the need for a maritime regulatory mechanism. In contrast, the overall navigation risk score of A5 is 38.2, the lowest among the five areas. This advantage is due to the good natural conditions such as water depth, wind speed, wave height and visibility. The dense distribution of harbours and ship repair yards around A5, which is located near the South China Sea countries such as China, the Philippines and Laos, also effectively ensures the safety and operational efficiency of ships in the sea area. Finally, the overall risk distribution in the selected sea areas is characterised by a higher risk at and near the boundary, due to the high density of ships in the harbour area, which makes them prone to navigation risks such as collision avoidance and groundings. The risk of the central area of the selected sea area and its vicinity is the second highest, mainly because it is far away from the port and has harsh natural conditions, which challenges the timeliness and effectiveness of maritime rescue, which is often overlooked in previous studies. Therefore, it is particularly important to establish an emergency support mechanism in the open seas.
Verification plays a crucial role in the BN model, serving as the foundation for its accuracy. In this study, the accuracy of the model is verified using the three-axiom method (Fan et al., 2023). The three axioms are defined as follows: Axiom 1: A minor increase or decrease in the prior subjective probability of any parent node results in a corresponding rise or fall in the posterior probability of the child node; Axiom 2: When the subjective probability distribution of each parent node changes, its effect on the child node remains unchanged; Axiom 3: The cumulative effect of changes in the evidence probabilities is always greater than the effect derived from any subset of the evidence.
Based on the above three axioms, the model is verified to analyse the impact of different risk factors on the navigation risk value. We selected intermediate nodes related to the target node for verification, including natural conditions, traffic conditions, safeguard conditions and accident conditions. Assign a 5% probability to each intermediate node and observe the final navigation risk results. For example, if the probability of the intermediate node ‘natural conditions’ being in the ‘high’ state increases by 5%, the corresponding probability of the ‘low’ state will decrease by 5%. The final distribution of navigation risk probability is as follows: (low, 50.1%; medium, 9.1%; high, 40.8%). According to Equation 15, the navigation risk value is:
Next, calculations are performed for different risk combinations, and the results are shown in Table 9.
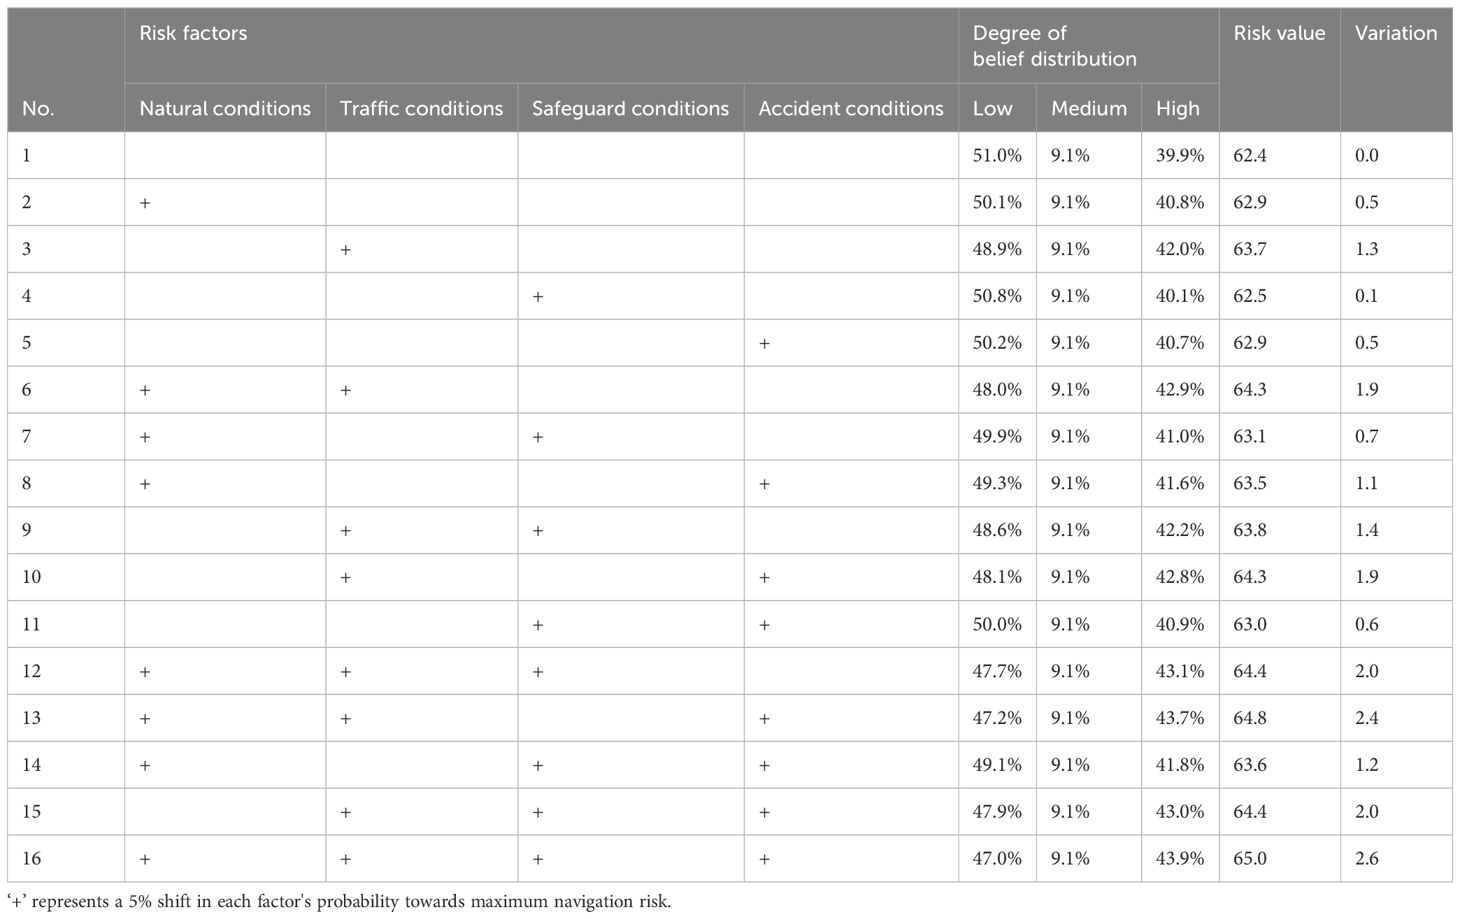
Table 9. BN model validation under different risk combinations.
Firstly, a subjective probability of 5% is assigned to the intermediate node ‘natural condition’, and the risk value increases to 62.9 (i.e., combination #2 in Table 9), satisfying Axiom 1. Secondly, 5% of the subjective probability is reallocated to the intermediate node ‘traffic conditions’, and the risk value is increased to 63.7 (i.e., combination #3 in Table 9). From the results of combinations 2 and 3, it can be seen that the change of the subjective probability distribution of the parent node has the same impact on the child nodes, which supports Axiom 2. Finally, the results from combinations 2, 6, 12, and 16 show that the degree of influence increases as the subset of evidence increases, a finding that confirms Axiom 3. Therefore, the construction of the BN-based risk assessment model is accurate.
In order to further verify the accuracy of the results of the constructed BN model, we adopt the advanced risk assessment method of ER. A more detailed derivation of this method can be found in (Zhao et al., 2020). First, a hierarchical structure based on the ER model is constructed to ensure that all risk factors and their dependencies are consistent with the BN model. Next, the nodes are assumed to have the same marginal probability and are given the same weight. Finally, natural conditions (AA=(69.7%,LR), (0.3%,MR) and (30.0%,HR)), traffic conditions (BB=(15.4%,LR), (0.0%,MR) and (84.6%,HR)), safeguard conditions (CC=(44.8%,LR), (45.1%,MR) and (10.1% HR)) and accident conditions (DD=(69.0%,LR), (0.0%,MR) and (31.0%,HR)) are entered into the ER model as the four pieces of evidence and calculate using the ER-based software programme IDS (Yang and Xu, 2002), the results of which are shown in Figure 6.
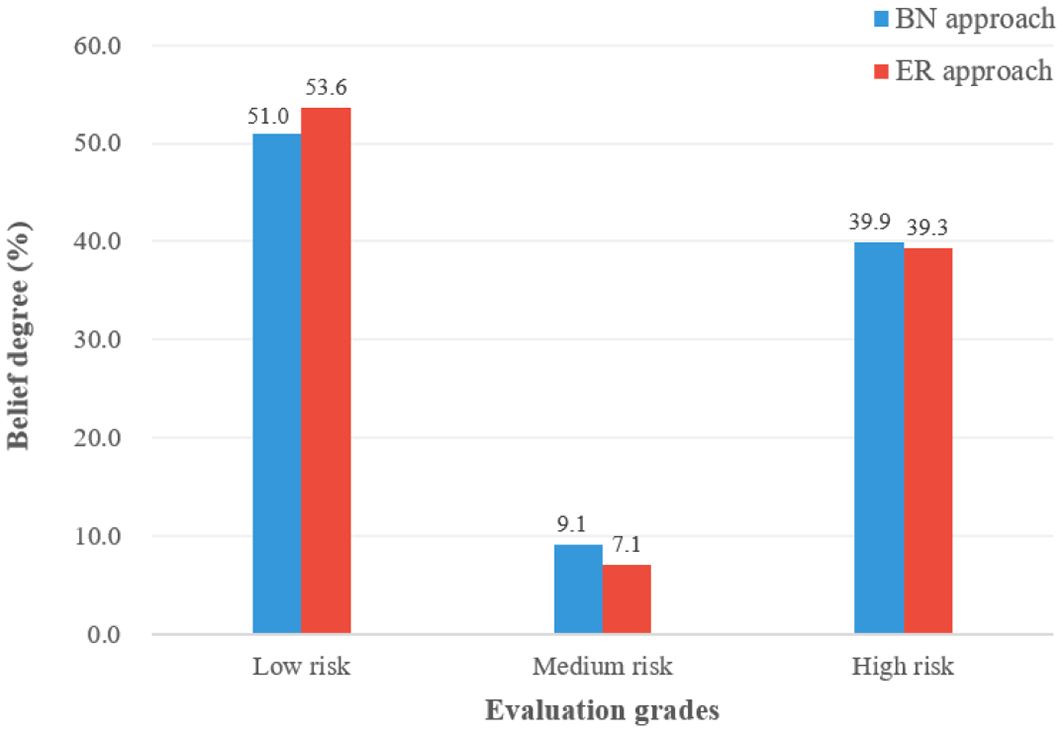
Figure 6. Aggregation results using different approach.
It can be seen from the results that although the belief degree of ‘medium risk’ state in navigation risk is slightly different, the results obtained by ER model are highly consistent with those obtained by BN model. This shows that the BN model and its results are accurate. Compared with ER model, BN model is simpler in operation and has stronger scalability. Therefore, BN-based navigation risk assessment is appropriate and necessary.
Sensitivity analysis is a commonly used method for assessing model uncertainty. In this study, we constructed a BN-based risk assessment model to identify RIFs that have a significant impact on ‘navigation risk’ in order to develop targeted risk mitigation measures. This paper uses the mutual information method to perform sensitivity analysis. The calculation method of the mutual information value is described in detail in the literature (Yu et al., 2021). The mutual information value is a statistical metric used to assess the extent of mutual dependence or information exchange between two nodes. A higher mutual information value indicates a stronger correlation between the nodes and a greater level of information sharing. For example, the sensitivity results for the A1 sea area are presented in Table 10.

Table 10. Sensitivity analysis results of the top six RIFs in A1 sea area.
The top six RIFs in terms of importance in the A1 area are safeguard conditions, natural conditions, accident conditions, traffic conditions, operational safety and fastest response time, with safeguard conditions achieving the highest value of 0.12 in the risk assessment model, making it the most important risk factor in the A1 area. Further, the lack of safeguard conditions scenario is simulated using the BN model developed in this paper. Incorporating evidence of changing safeguard conditions (0.0 per cent low risk, 0.0 per cent medium risk and 100.0 per cent high risk), the marginal probability of navigation risk changes to (42.0 per cent low risk, 0.1 per cent medium risk and 57.9 per cent high risk), and the value of risk increases from 62.9 to 71.2, with a change in risk rating from medium risk to high risk.
Since there may be differences in the sensitivity results of navigation risks in different gridded sea areas, we continue to calculate the mutual information values of navigation risks in other gridded sea areas, and the results are shown in Figure 7. Where blue colour indicates the most important RIFs in the sea area and orange colour indicates the top three RIFs in the sea area.
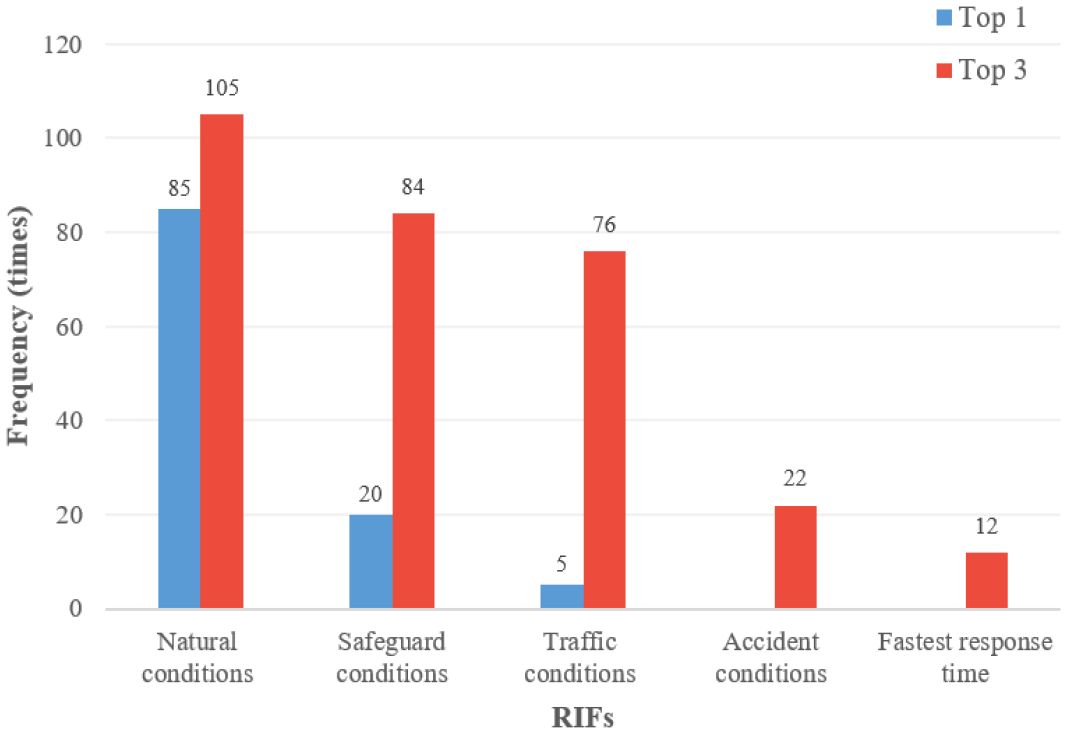
Figure 7. Sensitivity analysis results in the study area.
As can be seen from Figure 7, in the selected waters of the South China Sea, natural conditions is considered the most important factor affecting navigation safety, accounting for 77.3%, followed by safeguard conditions, accounting for 18.2%. In addition, in the selected waters of the South China Sea, 95.5% of the areas regard natural conditions as the top three important RIFs, safeguard conditions and traffic conditions account for 76.4% and 69.1% respectively.
Based on the above experimental results, we put forward some suggestions to improve the level of navigation safety in the South China Sea: (1) Due to the high risk of adverse natural conditions, abnormal natural conditions such as wind and waves should immediately trigger an alarm. Therefore, real-time observation of weather and sea conditions is extremely important and helps improve maritime traffic safety. (2) Sea areas far from ports have poorer security conditions, and the consequences of accidents are more serious. Therefore, it is recommended that countries along the South China Sea strengthen cooperation and jointly establish an efficient maritime supervision mechanism to reduce the risk of accidents at open seas.
Ship navigation risk assessment is a complex systematic project, characterised by data diversification, factor non-linearity, information uncertainty, etc. These characteristics bring great challenges to navigation safety assessment. To address these issues, this paper integrates BNs, fuzzy logic, and utility theory to develop an advanced method for assessing ship navigation safety. The South China Sea, a sea of busy trade and frequent accidents, is selected as a case study, and the following important findings are obtained:
(1) Among the selected grid areas in the South China Sea, the E4 area has the highest navigation risk, with a risk level of 71.0 and a high risk level, while the J7 area has the lowest navigation risk, with a risk level of 33.4 and a medium risk level.
(2) The overall risk distribution in selected areas of the South China Sea is not uniform. In general, the risk is higher at and near the boundary, second highest at and near the centre, and lower in other areas.
(3) ‘Natural conditions’ is considered the most important factor affecting navigation safety in most of the sea areas with a high percentage of 77.3%, followed by ‘Safeguard conditions’ with 18.2%.
(4) There are also differences in the key RIF of ship navigation risk in the gridded waters of the South China Sea. The common influencing factors are ‘Natural conditions’, ‘Safeguard conditions’, ‘Traffic conditions’, ‘Accident conditions’ and ‘Fastest response time’ in order.
In summary, while the proposed method offers a valuable tool for assessing ship navigation risks, several limitations should be considered, which also suggest directions for future research:
(1) The model’s accuracy depends on the quality and completeness of the data, and future work could focus on integrating real-time and more diverse data sources to improve reliability.
(2) As finer gridding increases computational complexity (Fan et al., 2023), future research could explore hybrid approaches by integrating BNs with CI techniques, such as deep learning, to optimize efficiency and scalability.
(3) The current model is based on the South China Sea, and future studies should validate the approach in other maritime regions and incorporate real-time environmental changes for more dynamic assessments.
The original contributions presented in the study are included in the article/supplementary material. Further inquiries can be directed to the corresponding author.
XQ: Conceptualization, Data curation, Formal analysis, Investigation, Methodology, Project administration, Resources, Software, Supervision, Validation, Visualization, Writing – original draft, Writing – review & editing. CW: Conceptualization, Funding acquisition, Methodology, Visualization, Writing – original draft, Writing – review & editing.
The author(s) declare financial support was received for the research, authorship, and/or publication of this article. The research is supported by the Fund of Hubei Key Laborator of Inland Shipping Technology (NO. NHIY2024001) and the National Natural Science Foundation of China (NO. 72204035).
The authors declare that the research was conducted in the absence of any commercial or financial relationships that could be construed as a potential conflict of interest.
The author(s) declare that no Generative AI was used in the creation of this manuscript.
All claims expressed in this article are solely those of the authors and do not necessarily represent those of their affiliated organizations, or those of the publisher, the editors and the reviewers. Any product that may be evaluated in this article, or claim that may be made by its manufacturer, is not guaranteed or endorsed by the publisher.
Allianz Global Corporate & Specialty Company (2024). AGCS Safety Shipping Review 2024. Available online at: https://commercial.allianz.com/content/dam/onemarketing/commercial/commercial/reports/Commercial-Safety-Shipping-Review-2024.pdf (Accessed December 1, 2024).
Chen S., Wall A., Davies P., Yang Z., Wang J., Chou Y. (2013). A Human and Organisational Factors (HOFs) analysis method for marine casualties using HFACS-Maritime Accidents (HFACS-MA). Saf. Sci. 60, 105–114. doi: 10.1016/j.ssci.2013.06.009
European Maritime Safety Agency (2024). Annual overview of marine casualties and incidents 2024. Available online at: https://www.emsa.europa.eu/component/flexicontent/download/7981/5352/23.html (Accessed December 1, 2024).
Fan H., Gong X., Lyu J. (2023). Resilience assessment of strait/canal: A rule-based Bayesian network framework. Transport. Res. Part D: Transport Environ. 124, 103960. doi: 10.1016/j.trd.2023.103960
Fan S., Blanco-Davis E., Yang Z., Zhang J., Yan X. (2020). Incorporation of human factors into maritime accident analysis using a data-driven Bayesian network. Reliabil. Eng. Sys. Saf. 203, 107070. doi: 10.1016/j.ress.2020.107070
Fu S., Gu S., Zhang Y., Zhang M., Weng J. (2023). Towards system-theoretic risk management for maritime transportation systems: A case study of the yangtze river estuary. Ocean Eng. 286, 115637. doi: 10.1016/j.oceaneng.2023.115637
Goerlandt F., Montewka J. (2015). Maritime transportation risk analysis: Review and analysis in light of some foundational issues. Reliabil. Eng. Sys. Saf. 138, 115–134. doi: 10.1016/j.ress.2015.01.025
Iqbal R., Doctor F., More B., Mahmud S., Yousuf U. (2020). Big data analytics: Computational intelligence techniques and application areas. Technol. Forecast. Soc. Change 153, 119253. doi: 10.1016/j.techfore.2018.03.024
Jiang M., Lu J., Yang Z., Li J. (2020). Risk analysis of maritime accidents along the main route of the Maritime Silk Road: a Bayesian network approach. Maritime Policy Manage. 47, 815–832. doi: 10.1080/03088839.2020.1730010
Lazarowska A. (2024). A comparative analysis of computational intelligence methods for autonomous navigation of smart ships. Electronics 13, 1370. doi: 10.3390/electronics13071370
Li M., Zhang R., Chen X., Liu K. (2022). Assessment of underwater navigation safety based on dynamic Bayesian network facing uncertain knowledge and various information. Front. Mar. Sci. 9. doi: 10.3389/fmars.2022.1069841
Li M., Zhang R., Liu K. (2021a). A new marine disaster assessment model combining Bayesian network with information diffusion. J. Mar. Sci. Eng. 9, 640. doi: 10.3390/jmse9060640
Li M., Zhang R., Liu K. (2021b). Risk assessment of marine environments along the south China sea and north Indian ocean on the basis of a weighted Bayesian network. J. Ocean Univ. China 20, 521–531. doi: 10.1007/s11802-021-4631-5
Li P., Wang Y., Yang Z. (2024). Risk assessment of maritime autonomous surface ships collisions using an FTA-FBN model. Ocean Eng. 309, 118444. doi: 10.1016/j.oceaneng.2024.118444
Li Z., Hu S., Zhu X., Gao G., Yao C., Han B. (2022). Using DBN and evidence-based reasoning to develop a risk performance model to interfere ship navigation process safety in Arctic waters. Process Saf. Environ. Prot. 162, 357–372. doi: 10.1016/j.psep.2022.03.089
Pan W., Xie X. L., He P., Bao T., Li M. (2021). An automatic route design algorithm for intelligent ships based on a novel environment modeling method. Ocean Eng. 237, 109603. doi: 10.1016/j.oceaneng.2021.109603
Senol Y., Sahin B. (2016). A novel real-time continuous fuzzy fault tree analysis (RC-FFTA) model for dynamic environment. Ocean Eng. 127, 70–81. doi: 10.1016/j.oceaneng.2016.09.035
Shi Z., Zhen R., Liu J. (2022). Fuzzy logic-based modeling method for regional multi-ship collision risk assessment considering impacts of ship crossing angle and navigational environment. Ocean Eng. 259, 111847. doi: 10.1016/j.oceaneng.2022.111847
Turna İ. (2024). A safety risk assessment for ship boarding parties from fuzzy Bayesian networks perspective. Maritime Policy Manage. 51, 1–14. doi: 10.1080/03088839.2022.2112780
Varghese A., Kuriakose S. (2012). Centroid of an intuitionistic fuzzy number. Notes Intuition. Fuzzy Sets 18, 19–24. Available online at: https://ifigenia.org/images/archive/1/1b/20120721115607!NIFS-18-1-19-24.pdf (Accessed December 1, 2024).
Wang C., Wang N., Gao H., Wang L., Zhao Y., Fang M. (2024). Knowledge transfer enabled reinforcement learning for efficient and safe autonomous ship collision avoidance. Int. J. Mach. Learn. Cyber. 15, 3715–3731. doi: 10.1007/s13042-024-02116-4
Wang C., Zhang X., Yang Z., Bashir M., Lee K. (2023). Collision avoidance for autonomous ship using deep reinforcement learning and prior-knowledge-based approximate representation. Front. Mar. Sci. 9. doi: 10.3389/fmars.2022.1084763
Wang Y., Zio E., Wei X., Zhang D., Wu B. (2019). A resilience perspective on water transport systems: the case of Eastern Star. Int. J. Disaster Risk Reduct. 33, 343–354. doi: 10.1016/j.ijdrr.2018.10.019
Xie X., Zhao R., Zhu Y. (2021). Conceptual design and parametric optimization of self-propelled semi-submersible repair ships: a novel equipment providing maintenance and repair support at sea. J. Mar. Sci. Technol. 26, 243–256. doi: 10.1007/s00773-020-00733-6
Yang J., Xu D. (2002). On the evidential reasoning algorithm for multiple attribute decision analysis under uncertainty. IEEE Trans. Sys. Man Cybernetics-Part A: Syst. Humans 32, 289–304. doi: 10.1109/TSMCA.2002.802746
Yu Q., Teixeira Â, Liu K., Rong H., Soares C. (2021). An integrated dynamic ship risk model based on Bayesian Networks and Evidential Reasoning. Reliabil. Eng. Sys. Saf. 216, 107993. doi: 10.1016/j.ress.2021.107993
Zhang M., Zhang D., Goerlandt F., Yan X., Kujala P. (2019). Use of HFACS and fault tree model for collision risk factors analysis of icebreaker assistance in ice-covered waters. Saf. Sci. 111, 128–143. doi: 10.1016/j.ssci.2018.07.002
Zhao R., Xie X., Yu W. (2020). Repair equipment allocation problem for a support-and-repair ship on a deep sea: A hybrid multi-criteria decision making and optimization approach. Expert Syst. Appl. 160, 113658. doi: 10.1016/j.eswa.2020.113658

Appendix A. Experts’individual profile and decision weight.
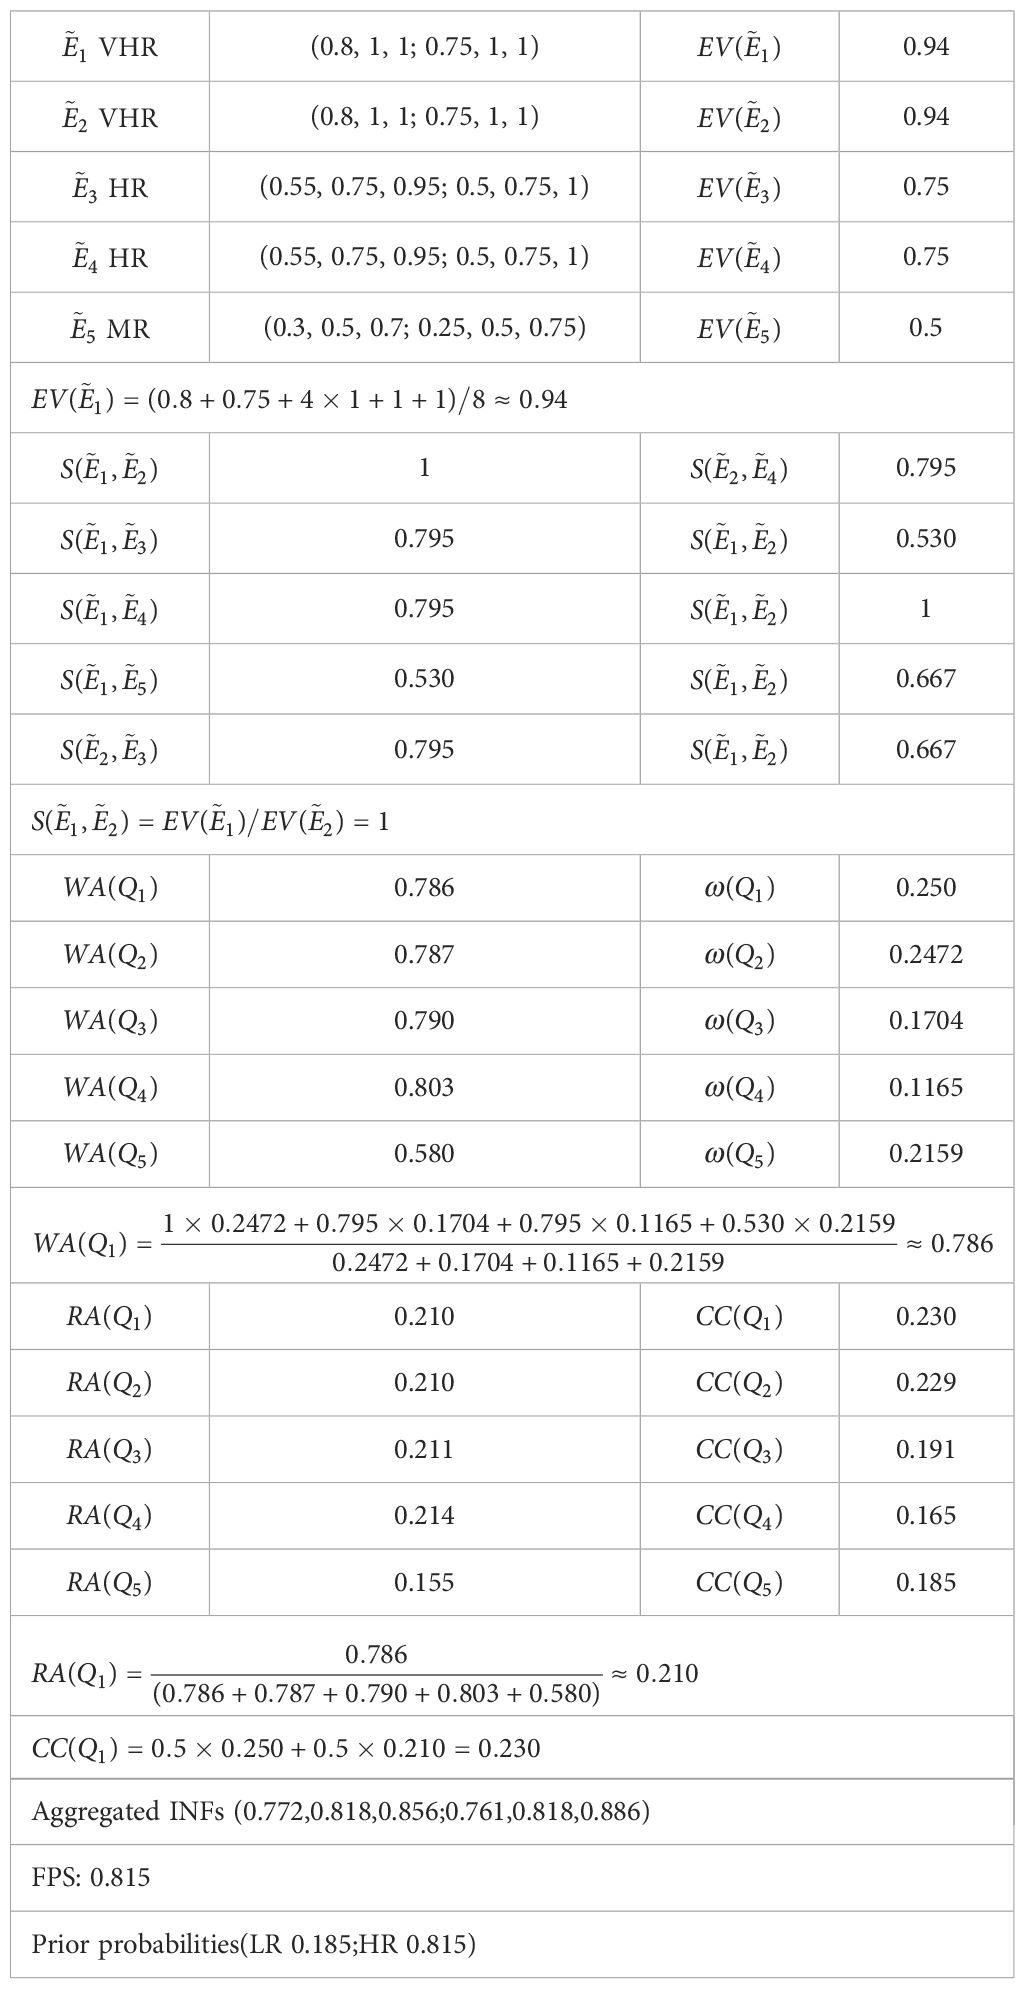
Appendix B. Aggregate calculation and probability conversion of root node ‘operational safety’.
Keywords: navigation safety, risk assessment, computational intelligence, multi-source data, Bayesian network
Citation: Qu X and Wang C (2025) A multi-source data-driven approach for navigation safety integrating computational intelligence and Bayesian networks. Front. Mar. Sci. 12:1547305. doi: 10.3389/fmars.2025.1547305
Received: 18 December 2024; Accepted: 02 January 2025;
Published: 03 February 2025.
Edited by:
Ruobin Gao, Nanyang Technological University, SingaporeReviewed by:
Yang Liu, Wuhan University of Technology, ChinaCopyright © 2025 Qu and Wang. This is an open-access article distributed under the terms of the Creative Commons Attribution License (CC BY). The use, distribution or reproduction in other forums is permitted, provided the original author(s) and the copyright owner(s) are credited and that the original publication in this journal is cited, in accordance with accepted academic practice. No use, distribution or reproduction is permitted which does not comply with these terms.
*Correspondence: Chengbo Wang, d2FuZ2NiMjNAdXN0Yy5lZHUuY24=
Disclaimer: All claims expressed in this article are solely those of the authors and do not necessarily represent those of their affiliated organizations, or those of the publisher, the editors and the reviewers. Any product that may be evaluated in this article or claim that may be made by its manufacturer is not guaranteed or endorsed by the publisher.
Research integrity at Frontiers
Learn more about the work of our research integrity team to safeguard the quality of each article we publish.