
94% of researchers rate our articles as excellent or good
Learn more about the work of our research integrity team to safeguard the quality of each article we publish.
Find out more
ORIGINAL RESEARCH article
Front. Mar. Sci., 01 April 2025
Sec. Marine Biology
Volume 12 - 2025 | https://doi.org/10.3389/fmars.2025.1546313
This article is part of the Research TopicCurrent Research on Fish Otoliths and their ApplicationsView all 10 articles
 Md. Sohel Parvez1,2,3
 Md. Imdadul Hoque4
 Md. Nurul Momen Siddique5
 Mohammad Mizanur Rahman6
 Edina Baranyai7Zsófi Sajtos7Boglárka Döncző8
 Haithem Aib1,2
 Md. Abdul Kader9Edina Simon10,11
 Herta Czédli12*
Fish scales absorb different elements into the calcified matrix from surrounding waters as well as from the foods consumed. Scales microchemistry is drawing rising attention for its applicability in a wide range of fields, including environmental and ecological studies. The article represents an elemental analysis of the scales of five commercially important coastal fishes: Tenualosa ilisha, Sillaginopsis panijus, Lates calcarifer, Otolithoides pama, and Rhinomugil corsula. The concentrations of different essential and trace elements were measured using inductively coupled plasma optical emission spectrometry (ICP-OES), and their distribution on scales was mapped using micro-X-ray fluorescence (μ-XRF). The detected elements were categorized into five groups based on their overall mean concentrations: the most, considerable, moderate, low, and least available. The concentration (mg kg−1) of Ca was the highest (107472.32-181002.76) followed by P (41572.43-79042.02) among the elements in the studied fish scales, independent of species. The hierarchy of the overall mean concentration of elements was Ca>P>S>Mg>Na>K>Sr>Zn>Fe>Al>Ba>Mn>Cu>Cr. Element concentrations varied across fish feeding habits and habitats. Carnivore fish were found to have higher concentrations of K, Sr, and lower Fe than that in planktivore fish. The concentrations of Cr, Fe, S, Sr, and Zn were higher in demersal fish’s scales, whereas pelagic fish were found to have higher levels of Al, Ba, Ca, Cu, K, Mg, Mn, Na, and P. Element: Ca ratios, especially Sr: Ca, Mn: Ca, and Ba: Ca ratios, have potential implications as habitat signatures. Typically, fish otoliths are used for environmental and ecological purposes that involve cutting and sacrificing the sample. Employing scales instead could be a non-lethal alternative, crucial for sustainable fisheries management, especially for rare, vulnerable, or migratory fish.
Fish absorb different elements from surrounding waters into the calcified matrix that makes up their body scales as they grow (Coello and Khan, 1996). The potential of fish scales to absorb metals is demonstrated by the fact that between 38% and 46% of their weight is composed of hydroxyapatite (HAP), which allows various fish scales to be used as biosorbents for the removal of potentially toxic elements (PTE) from wastewater (El-Sheikh and Sweileh, 2008; Liu et al., 2021; Dai et al., 2024). Accumulation of elements in a particular tissue is determined by absorption and excretion rates, along with accumulation processes inside the tissue, which are regulated by ambient water element concentration, environmental conditions, and the organism’s biology (Hüssy et al., 2024). As fish grow, calcified structures preserve the footprint of their surroundings, hence, the element profile of calcified structures has proved a useful technique to uncover various facets of fish life history (Avigliano, 2022; Filipović Marijić et al., 2022). The structure of the fish scale and its high likelihood of getting in touch with elements in the water bodies make it a promising candidate for use as a biomarker (Hidayati et al., 2013). The buildup of elements in the scales matches their respective concentrations in the surrounding water (Moreau et al., 1983). Thus, the chemical makeup of the scales could be utilized to represent the elemental profile of the aquatic body the fish were living in and to measure temporal trends in the catchment water’s environmental status (Cobelo-García et al., 2017).
Łuszczek-Trojnar (Łuszczek-Trojnar et al., 2022) showed fish scale concentrations were observed to correspond with both the duration and metal exposure doses, which could provide a compelling case for employing scales as an indicator of the aquatic environment. Moran (Morán et al., 2018) demonstrated the ages-old relics of river pollution revealed from fish scales, proving fish scales a suitable biomarker for studying aquatic environmental conditions. It is recognized that the elemental profile of fish scales serves as a trustworthy biogeochemical tag for figuring out their origin (Wang et al., 2016). The elemental makeup of scales was investigated by numerous researchers for a wide range of purposes, such as characterizing fish life history (Tray et al., 2022), migration monitoring (Pouilly et al., 2014), stock identification, and reconstructing past environmental changes in aquatic systems (Vašek et al., 2021), etc. It has been shown that the ratio of Sr-87 to Sr-86 found in the fish calcified structures is a trustworthy biogeochemical marker that represents the chemistry of their native habitat and the migration pattern (Pouilly et al., 2014). One of the major advantages of using scales as biomarkers is that elements remain in hard tissues like scales for longer periods than in water, allowing for a detailed profile and permanent record of metal exposure across a fish’s lifespan (Filipović Marijić et al., 2022).
Mostly fish otoliths (Pouilly et al., 2014; Moll et al., 2019; Martinho et al., 2020; Tripp et al., 2020; Filipović Marijić et al., 2022; Hüssy et al., 2024), and in some instances vertebrae (Feitosa et al., 2020), and bones (Clarke, 2005) are being utilized for such purposes which require cutting and sacrificing the sample fish. However, since fish scales are easy to sample non-lethally and accurately represent the level of environmental composition of elements, they appear to be a great biomarker enabling indirect observation of rare, vulnerable, or migratory fishes without sacrificing the fish (Łuszczek-Trojnar et al., 2022; Tray et al., 2022). In addition to providing non-lethal sampling, scale analysis would enable successive specimens from the same fish to evaluate accumulation in a period and scale study from archival collections to identify historical patterns. There is a dearth of studies on the elemental analysis of fish scales of commercially important coastal and marine fish species. Therefore, the current work attempted to explore the elemental makeup in connection to fish feeding habits and habitats in the scales of five commercially important coastal fish species, Tenualosa ilisha, Sillaginopsis panijus, Lates calcarifer, Otolithoides pama, and Rhinomugil corsula.
Five commercially important coastal fish, Tenualosa ilisha (Hilsha, locally called Ilish), Sillaginopsis panijus (Flathead sillago, locally called Tular Dandi), Lates calcarifer (Asian sea bass, locally called Vetki or Coral), Otolithoides pama (Pama Croaker, locally called Poa), and Rhinomugil corsula (Corsula, locally called Bata), were used in the study. These fish were chosen because they are a very popular and highly commercial diet species with high market value and consumer demand. The ecological parameters of the fish species studied are given in Table 1. The sampled fish were collected from the catch of commercial artisanal fishery in the coastal waters of Bangladesh in February 2023. The artisanal fishing activities in the coastal waters of Bangladesh cover some parts of coastal rivers, estuaries, and shallow seawaters in the Bay of Bengal (Mustafa et al., 2023). The collected fish specimens were brought to the research facility for analysis by preserving them at −20°C in a frozen state. The total length and weight of the sample fish were T. ilisha (40.76 ± 0.16 cm; 910.71 ± 14.04 g), S. panijus (38.55 ± 0.64 cm; 183.27 ± 11.23 g), L. calcarifer (46.62 ± 2.86 cm; 1217.69 ± 151.22 g), O. pama (33.46 ± 0.62 cm; 159.55 ± 12.41 g), and R. corsula (36.18 ± 0.88 cm; 161.49 ± 15.69 g). Scales were collected after the samples were thawed at room temperature and cleaned with water. A total of three hundred scales were collected using fine forceps above the lateral line and below the dorsal fin on both sides (fifteen from the left and fifteen from the right side). The scales were cleaned with distilled water again to remove dirt and mucus, and the mucous left on the scale was completely removed by further cleaning with a soft bristle brush. Then the scales were air dried at room temperature before analysis.
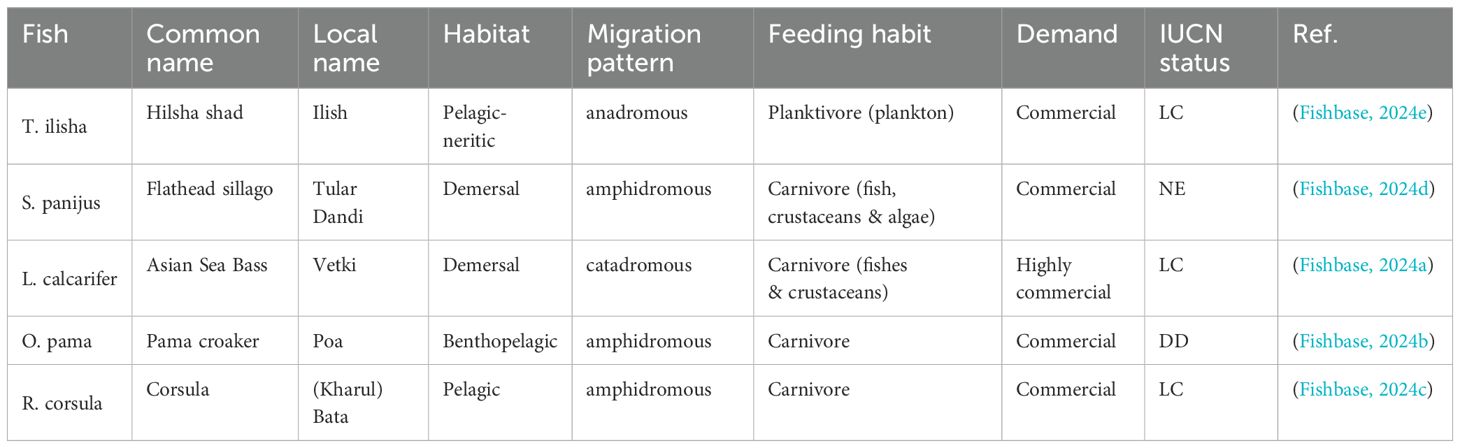
Table 1. The ecological parameters of the fish species studied; (LC, least concern; NE, not evaluated; DD, Data deficient).
The elemental concentration of the samples was determined by inductively coupled plasma optical emission spectrometry (ICP-OES, 5110 Vertical Dual View, Agilent Technologies). Autosampler (Agilent SPS4), Meinhard® type nebulizer, and double-pass spray chamber were employed, and a five-point calibration procedure was applied (ICP VI, Merck). ICP-OES is an effective technique for measuring trace element levels in various samples, including environmental monitoring studies (Douvris et al., 2023). Approximately 0.2 grams of the samples were digested in atmospheric wet digestion by the mixture of 5.0 ml 65% (m/m) HNO3 and 1.0 ml 30% (m/m) H2O2. Digested samples were transferred without loss into volume-calibrated plastic centrifuge tubes and diluted up to 15.00 mL with ultrapure water. Solutions were kept at room temperature before further analysis. Standard solutions of the macroelements have been prepared from the mono-element spectroscopic standard of 1000 mg l-1 (Scharlau), whereas of the microelements from the multi-element spectroscopic standard solution of 1000 mg l-1 (ICP IV, Merck). A point calibration approach was applied, with standard solutions diluted with 0.1 M HNO3 generated using ultrapure water.
Dried and cleaned scales were also analyzed by a micro-X-ray Fluorescence (XRF) device (Bruker M4 TORNADO, Billerica, MA, US). Different forms of XRF are gaining popularity as a prevalent method for elemental analysis of various specimens in a variety of sectors, both quantitatively and qualitatively. Besides other fields, this technique is also being used for analyzing hazardous materials in fish. The study was conducted with an Rh X-ray tube at 50 kV accelerating voltage and 400 µA current. On each scale, approximately 1.2 mm x 1 mm area was selected. With the built-in polycapillary lens, a spot size was focused at 20 µm. The measurement was performed in air with a velocity of 100 ms per pixel and a 100 µm step size. There were two energy-dispersive detectors that captured distinctive X-ray lines with a 30 mm2 active area. Characteristic X-ray lines were recorded by two energy-dispersive detectors with a 30 mm2 active area. The evaluation of the measurement result was performed by the M-Quant built-in software of the M4 TORNADO. The fundamental parameter technique was used for the quantification.
Data were analyzed using SPSS (Statistical Package for the Social Sciences, 26.0) and PAST (PAleontological Statistics, 4.17). Normality (Shapiro-Wilk test) and homogeneity (Levene’s test) assumptions were confirmed before running any statistical analysis. One-way analysis of variance (ANOVA) was performed to evaluate the statistically significant differences (CI = 95%, p<0.05) in the case of normal data and Kruskal-Wallis for non-normal data, followed by a post hoc Duncan’s test. Values less than the limit of detection (<LoD) were considered as zero “0” during statistical analysis.
Network plot and multivariate classical clustering or hierarchical clustering analyses were performed using PAST (PAleontological Statistics, 4.17) software (Hammer, 2024) to represent the relationships of similarity based on the concentration of elements. Networks (graphs) were prepared with nodes (rows in the spreadsheet) connected by edges (Hammer, 2024). The Bray-Curtis similarity index was used as user-defined similarity in circular algorithm. The similarity cutoff was set as 40%. Multivariate classical clustering or hierarchical clustering (dendrogram) analysis was done using a paired group (UPGMA) algorithm and Euclidean similarity index.
In the current study, we have investigated the elements Aluminum (Al), Barium (Ba), Calcium (Ca), Chromium (Cr), Copper (Cu), Iron (Fe), Potassium (K), Magnesium (Mg), Manganese (Mn), Sodium (Na), Phosphorus (P), Sulfur (S), Strontium (Sr), and Zinc (Zn) in the scale of five commercially important marine fishes, T. ilisha, S. panijus, L. calcarifer, O. pama, and R. corsula. The concentration (mg kg-1) of elements found in fish scales is presented in Table 2. The concentration of Al ranged from 17.44 to 103.04 mg kg-1, Ba 11.49 to 150.88 mg kg-1, Ca 107472.32 to 181002.76 mg kg-1, Cr <LoD to 1.99 mg kg-1, Cu 1.25 to 10.55 mg kg-1, Fe 6.01 to 126.70 mg kg-1, K 264.31 to 960.95 mg kg-1, Mg 1437.14 to 2521.87 mg kg-1, Mn 2.34 to 36.99 mg kg-1, Na 1357.07 to 2944.06 mg kg-1, P 41572.43 to 79042.02 mg kg-1, S 1518.43 to 2874.10 mg kg-1, Sr 132.68 to 345.93 mg kg-1, and Zn 28.05 to 81.33 mg kg-1. We have obtained from the one-way ANOVA that there are statistically significant (CI= 95%, p<0.05) differences in the levels of Al, Fe, Mn, Na, Sr, and Zn in the scales (Table 2).

Table 2. Concentration (mean ± standard deviation; mg kg-1) of the elements in the studied fish scales detected by ICP-OES.
Among the elements in all species overall, Ca has the highest mean concentration (130995.57 ± 26249.61 mg kg-1), followed by P (54371.56 ± 13616.13 mg kg-1), S (2504.55 ± 464.70 mg kg-1), Mg (2105.37 ± 336.32 mg kg-1), Na (2066.56 ± 532.57 mg kg-1), K (456.43 ± 238.38 mg kg-1), Sr (247.06 ± 81.23 mg kg-1), Zn (53.98 ± 18.37 mg kg-1), Fe (49.88 ± 41.78 mg kg-1), Al (49.71 ± 29.66 mg kg-1), Ba (42.47 ± 56.52 mg kg-1), Mn (21.34 ± 13.98 mg kg-1), Cu (3.65 ± 3.54 mg kg-1) and Cr (1.25 ± 0.70 mg kg-1) orderly.
The hierarchy of the overall mean concentration of elements was Ca>P>S>Mg>Na>K>Sr>Zn>Fe>Al>Ba>Mn>Cu>Cr. The hierarchy of mean concentrations (mg kg-1) of the detected elements in the five species is presented in Table 3. The elements found were categorized as mostly available, considerably available, moderately available, low available, and least available based on their overall mean concentrations (Table 3). These groups of elements are also clearly separated in the network plot presented in Figure 1A and in classical cluster analysis (dendrogram) Figure 1B.
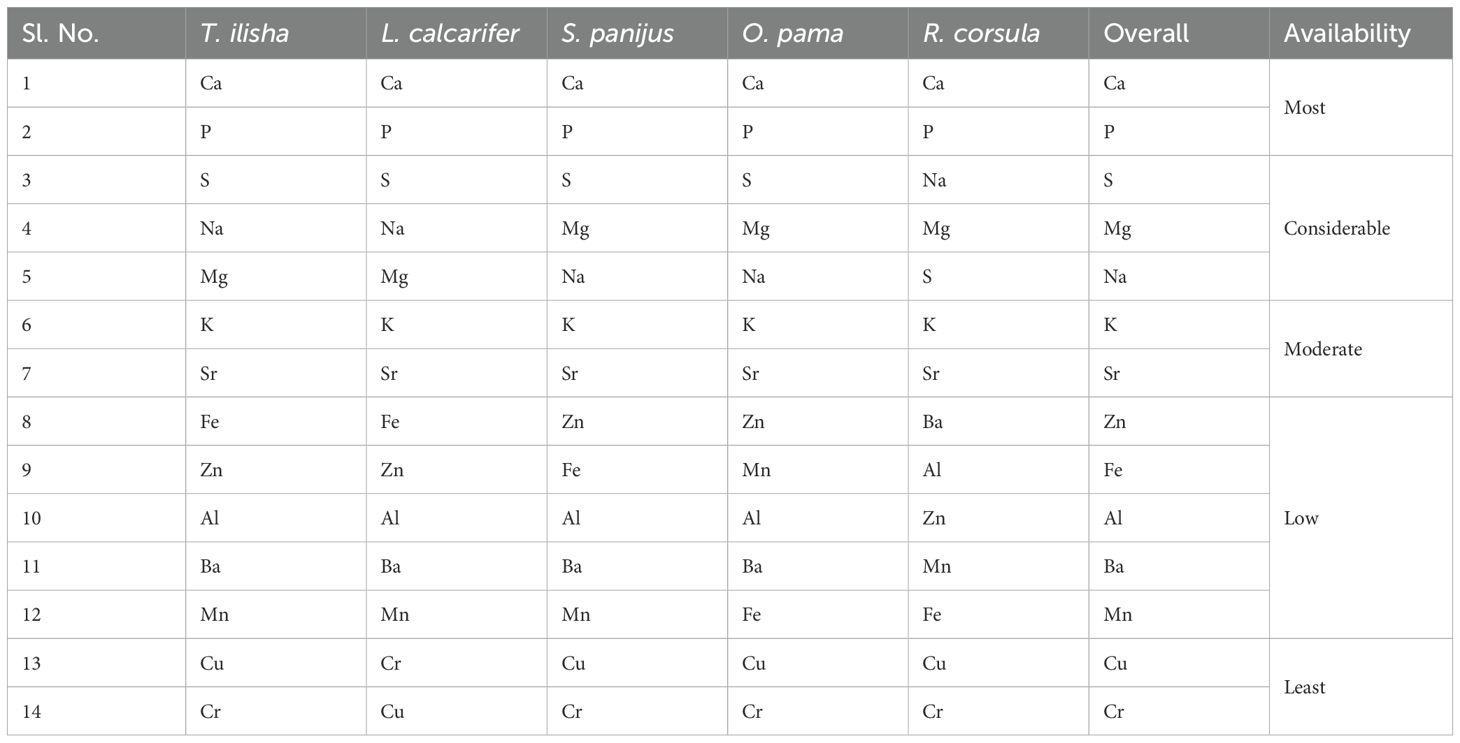
Table 3. The hierarchy (largest to smallest order from the top) of mean concentrations (mg kg-1) of elements detected by ICP-OES.
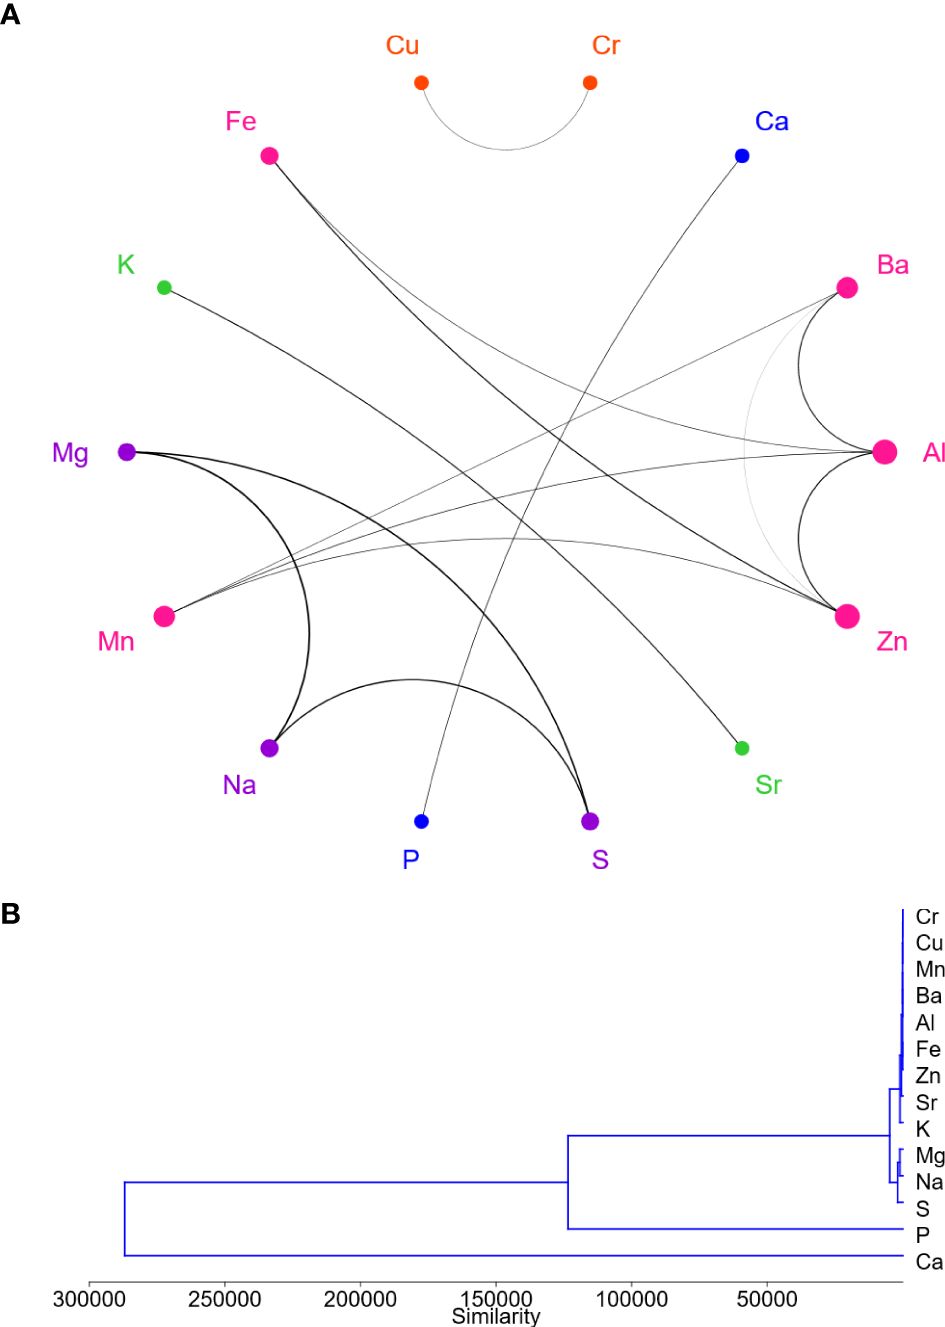
Figure 1. (A) Network plot of elements, and (B) Dendrogram.
Based on their concentration and availability the elements detected could be categorized into five groups, most, considerable, moderate, low, and least available. The first group comprises Ca and P which are the most available in the studied fish scales independent of species. Ca is the first and P is the second most available element based on concentration in all species studied (Table 3). Brraich and Jangu (2013) also observed Ca (38.26%) as the highest followed by P (31.32%) among the elements detected in the scale of Labeo rohita which is consistent with the present study. In general, scales include a lot of calcium phosphate molecules (Chuaychan et al., 2016). The second group consists of S, Mg, and Na which are considerably available elements ranging from third to fifth position in the concentration hierarchy of fishes. Thus Ca, P, S, Mg, and Na could be considered as macroconstituents or macro elements. K and Sr form the third group which is moderately available where K is in the sixth and Sr is in the seventh rank in the concentration hierarchy irrespective of species. The fourth group comprises the greatest number of elements Zn, Fe, Al, Ba, and Mn the availability of which is low that is from the eighth to twelfth position in the hierarchy based on concentration. Hence, K, Sr, Zn, Fe, Al, Ba, and Mn may be regarded as micro components or microelements. Cu and Cr form the last group that is least available and thus are in either the thirteenth or fourteenth rank in the concentration hierarchy, hence these could be termed trace elements. These groups of elements are represented in the network plot (Figure 1A) and classical cluster analysis, dendrogram (Figure 1B).
The dietary disparities as well as the individual’s nutritional background and environmental history may account for some of the variations in the scale components (Kalvoda et al., 2009). Different feeding patterns across fish species may cause them to acquire different components in their bodies (Pourang, 1995; Ling et al., 2013). The fish species analyzed in the current study have two different feeding behaviors, with T. ilisha having planktivorous while the other species possess carnivorous feeding habits. The higher concentrations of K and Sr were found in carnivores and Fe in planktivore fishes in the study. For instance, T. ilisha has the lowest concentrations of K (265.67 ± 1.93 mg kg-1) and Sr (136.12 ± 4.86 mg kg-1) while the highest concentrations of Fe (113.22 ± 19.06 mg kg-1) among the fourteen elements detected (Figure 2A; Table 2). In other words, carnivore, fishes have the highest concentrations of the other thirteen elements detected. This indicates a comparatively lower metal accumulation tendency in the scales of planktivorous fish than that of its carnivorous counterparts and vice versa. These results are in accordance with the findings of Ling et al. (2013) where they reported that planktivorous fish are usually less likely to accumulate metals in their body. Jabeen et al. (2011) reported metal accumulation in fish organs to vary between carnivorous and herbivorous species, with carnivorous fish having significantly (p<0.05) higher levels of Al, As, Cr, Ni, and Zn than herbivorous species. Carnivorous fishes that actively prey on other fish, crustaceans, and zooplankton are more likely to accumulate larger amounts of elements, notably PTEs, through the biomagnification process. Consuming carnivorous fish species has raised the odds of biomagnification in humans, signifying danger to public health; strangely, carnivorous fish species have higher demand among consumers in general (Silva et al., 2014).
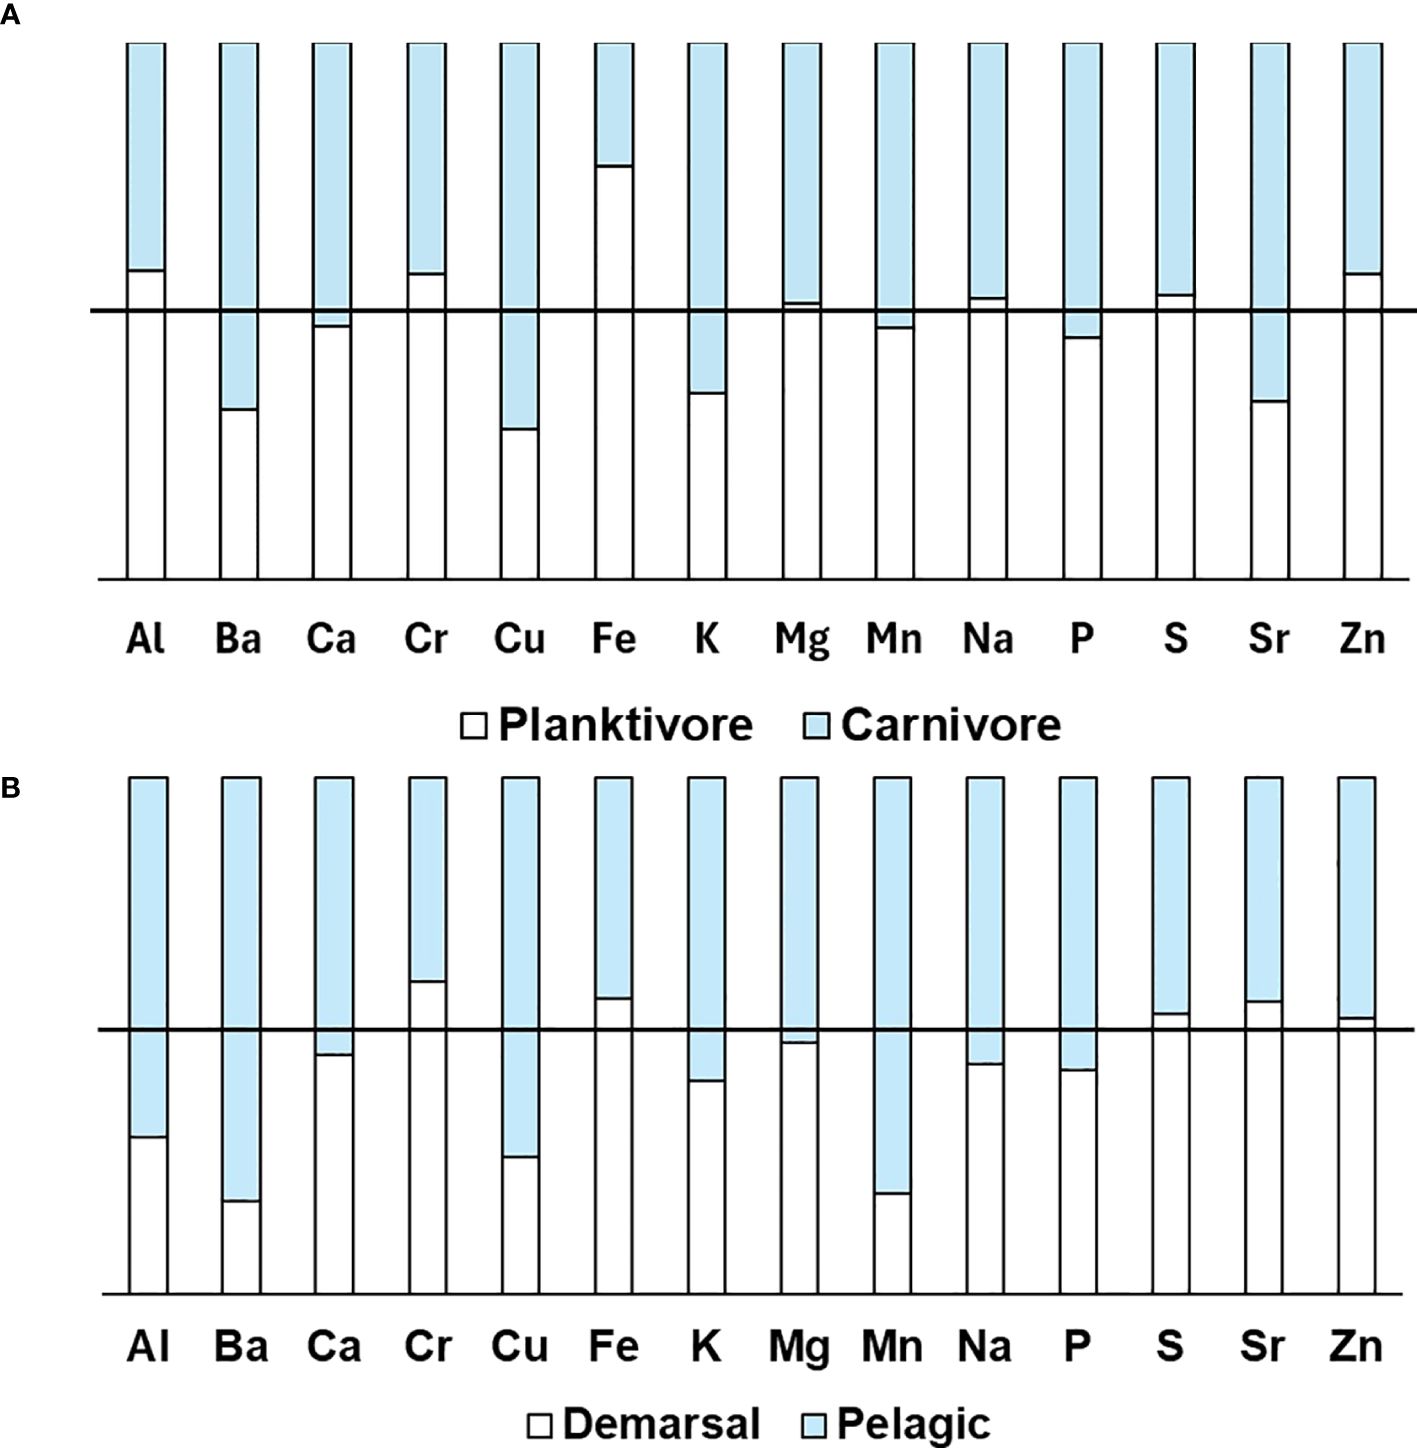
Figure 2. (A) Scale element concentration across feeding habits, (B) across habitats of fishes. The 100% stacked bar represents the percentages of the average value of the mean concentrations of fish species type (Planktivore and Carnivore; Demersal and Pelagic) contributing to the total of each element. The whole bar represents 100% and the solid black line dissecting at the middle of the plot denotes 50% of the bar showing the comparison between the types (Planktivore and Carnivore; Demersal and Pelagic).
Among the five species studied in the current study, S. panijus and L. calcarifer are demersal fish. In contrast, fish of other species live in different zones of pelagic waters and hence can be considered pelagic fishes. In the current study, the concentrations of Cr, Fe, S, Sr, and Zn were higher in demersal fishes’ scales (Figure 2B; Table 2). Whereas the scales of pelagic fishes were found to have higher levels of Al, Ba, Ca, Cu, K, Mg, Mn, Na, and P (Figure 2B; Table 2). Due to their proximity to sediment, demersal fishes are thought to be more likely than pelagic fishes, which live in free waters, to accumulate metals at relatively greater levels in their bodies (Garnero et al., 2018). Demersal fish, S. panijus was found to have the highest concentration of Zn (78.81 ± 3.57 mg kg-1) together with Cr (1.62 ± 0.22 mg kg-1), and S (2757.97 ± 107.91 mg kg-1), in contrast, the lowest concentration of Ba (11.95 ± 0.65), Ca (111767.76 ± 6074.68 mg kg-1), Na (1502.93 ± 206.28 mg kg-1), and P (42984.55 ± 1997.04 mg kg-1) in the scales. Gull et al. (2024) reported lower levels of Zn in the demersal fish compared to the pelagic counterpart which is inconsistent with the current result. Another demersal species, L. calcarifer has the lowest concentration of Cu (1.33 ± 0.12 mg kg-1) along with Al (17.62 ± 0.26 mg kg-1), Mg (1693.14 ± 362.05 mg kg-1), and Mn (3.22 ± 1.25 mg kg-1) in the current work. However, Fe (541.60 to 649.60 mg kg-1) and Cu (3.09 to 3.62 mg kg-1) were reported to be higher in the demersal species, and Zn (79.30 to 84.30 mg kg-1) in the pelagic species by a previous study which is inconsistent with the present findings (Rejomon et al., 2010). Islam et al. (2024) investigated the content of several elements in the scales of L. calcarifer and T. ilisha, which differs from the content found in the current study.
On the other hand, Pelagic fish, O. pama has the highest concentration of K (893.48 ± 95.42 mg kg-1), Mn (36.37 ± 0.87 mg kg-1), and the lowest concentration of Fe (7.33 ± 1.87 mg kg-1). R. corsula another pelagic species has the highest concentration of Al (96.34 ± 9.48 mg kg-1), Ba (149.46 ± 2.02 mg kg-1), Ca (178170.05 ± 4006.06 mg kg-1), Cu (10.28 ± 0.39 mg kg-1), Mg (2387.86 ± 104.12 mg kg-1), Na (2873.49 ± 99.80 mg kg-1), P (78489.85 ± 780.88 mg kg-1), and Sr (339.03 ± 9.76 mg kg-1), while the lowest concentration of Cr (<LoD), S (1648.20 ± 183.52 mg kg-1), and Zn (36.96 ± 12.61 mg kg-1).
However, these fluctuations could be because of the differences in the methodology (different sampling and instruments used) of the analysis and the location. Compared to the current studyPender and Griffin (1996) found higher levels of Al, Ba, Mn, Sr, and Zn, almost similar to Fe, and lower levels of Ca, Mg, and Na in the scale of L. calcarifer collected from a North Australian River system where the ranges of concentrations of dissolved elements in water were, Zn (0.6-5 ng g-1), Mn (0.3-23 ng g-1), Ba (<5-42 ng g-1), Mg (0.3-2030 µg g-1), Ca (0.7-750 µg g-1), Sr (0.004-13 µg g-1). These variations could be caused by the differences in pollution levels and locations. The species, their trophic level in the food chain, their dietary patterns, and the system’s physico-chemical properties all affect how much metal is to be absorbed in a fish organ (Garnero et al., 2018). At the species level, the mineral concentration of teleost scales can vary ranging from 16 to 59% (Seshaya et al., 1963). Chemical properties of water are key factors in the scale’s elemental makeup (Wells, 2000). The hydrochemistry of the body of water that the fish dwells in has a close connection with the elemental makeup of the scale (Brraich and Jangu, 2013). Therefore, the changes in water chemistry due to geographical variation or other factors like temperature fluctuations can impact the makeup of scales and other calcified structures (Kerr and Campana, 2014). Fish scale mineralization proceeds continually during the course of the organism’s lifespan (Ikoma et al., 2003). Hence, the locations where a fish lives, flow seasons, and fish species can all affect the levels of metals that accumulate in fish scales (Shakir et al., 2020).
The elements determined in the scales include essential elements as well as some PTE like Cu, Cr, Zn, and Fe. On one hand, there may be negative effects on the fish itself if the absorption of an essential element accumulated in excess or PTE surpasses a certain threshold (Çelik and Oehlenschläger, 2007). For example, notable structural irregularities in the scales of Capoeta capoeta were attributed to heavy metals (Kılıç and Şişman, 2024). On the other hand, the accumulation of hazardous metals in fish can increase the dangers to the health of consumers, making food safety a serious global problem. However, they had the lowest concentration (Tables 2, 3) among the detected elements in the scales. The reference values in the fish and fish products (edible) are Cu (5 mg kg-1) Cr (1 mg kg-1), and Zn (50 mg kg-1) according to the regulations of Bangladesh (MOFL, 2014). The mean concentration of Cu in the scales of R. corsula and the levels of Zn in all species analyzed in the current study were above Bangladesh’s reference values designated for edible parts. However, the current study was carried out by analyzing elements in fish scales, while the analyses in the edible parts and the environmental matrices were out of the scope of the present study. Thus, the values obtained in the current study were from fish scales that are not usually consumed by humans or are inedible, whereas the muscle tissue or other edible parts have direct implications for the consumption of these PTE. Jovičić et al. (2023) observed different PTE in the scales of five fish species with varying concentrations. Rahman et al. (2018) also found elevated levels of PTE, Cu (19.035 ± 0.05 µg g-1), and Zn (110.313 ± 0.27 µg g-1) in the scales of L. calcarifer than that in the current investigation which could be because of comparatively higher pollution than in the present study area. As they develop, fish take in various components from their environment besides the diet consumed, and incorporate them into the calcified matrix including scales (Coello and Khan, 1996). Aquatic ecosystems are exposed to PTE originating from both natural and man-made sources. The PTE could have originated from anthropogenic activities like industrial and sewerage effluents entering into the coastal waters through river discharges. Increased anthropogenic activities resulted in pollution through the release of different hazardous materials, raising a global environmental concern (Parvez et al., 2024a, 2024b). Among the anthropogenic causes, different nonpoint pollution sources, specifically runoff from nearby agricultural lands, could be the most possible. Because there are vast areas of agricultural and aquaculture ventures utilizing various fertilizers and pesticides in the catchment area of the rivers discharging in the Bay of Bengal. It is crucial to regularly monitor these hazardous elements in the environmental matrices and organisms to evaluate the risks to the ecosystem and human health.
The scales of the studied fish species were shown along with element distribution maps obtained by micro-XRF in Figures 3–7. The analysis by XRF has several benefits, such as the ability to identify multiple elements at once, its non-destructiveness, the simplicity of sample preparation, the absence of harmful chemicals and waste products, and the avoidance of losses associated with chemical procedures during dry ashing and acid extractions (Oladebeye, 2017; Carvalho et al., 2020). Furthermore, by scanning a target area of concern spot by spot and detecting the emitted radiation utilizing a silicon drift detector, micro-XRF spectrometer systems map the elemental distribution of materials (Bruker, 2019). It is a scanning-based imaging spectrometer in which a micro-focused X-ray beam is utilized to irradiate a sample’s target area of concern spot by spot (Leite et al., 2022).
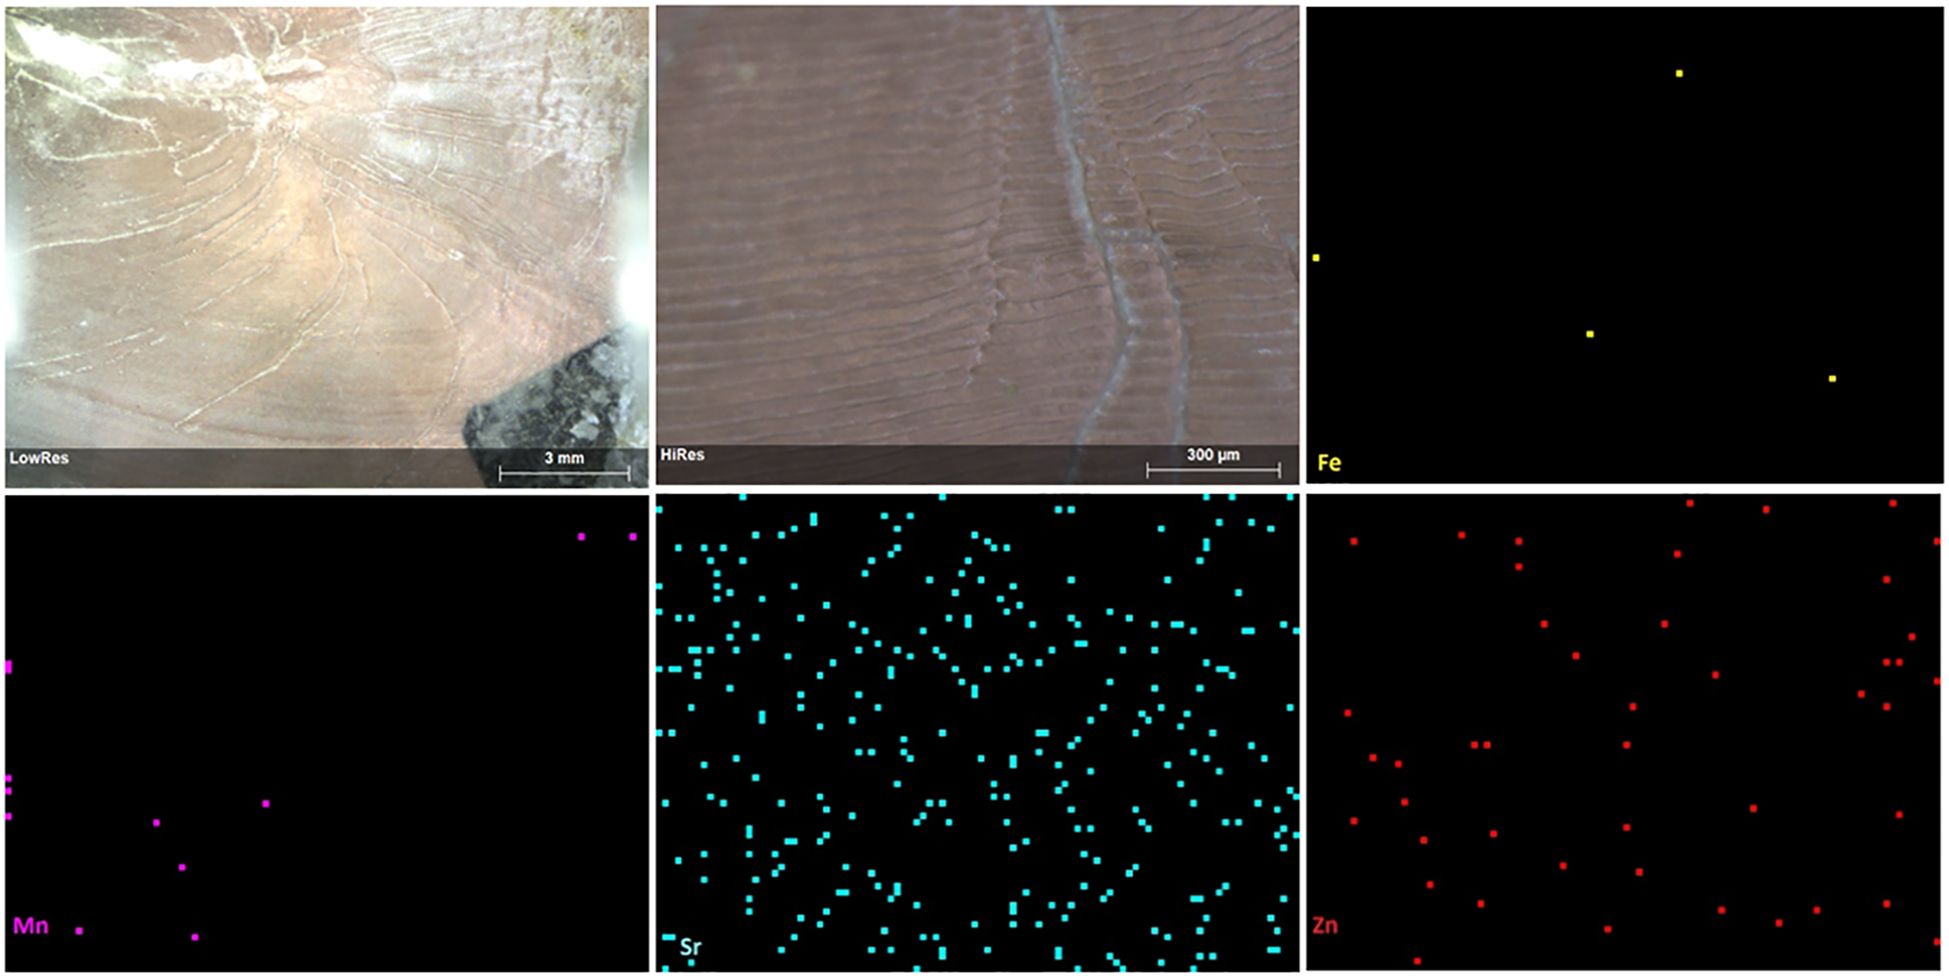
Figure 3. The scale of T. ilisha; Top left to right: scale in normal view, in high resolution, distribution map of Fe; Below left to right: distribution map of Mn, distribution map of Sr, distribution map of Zn.
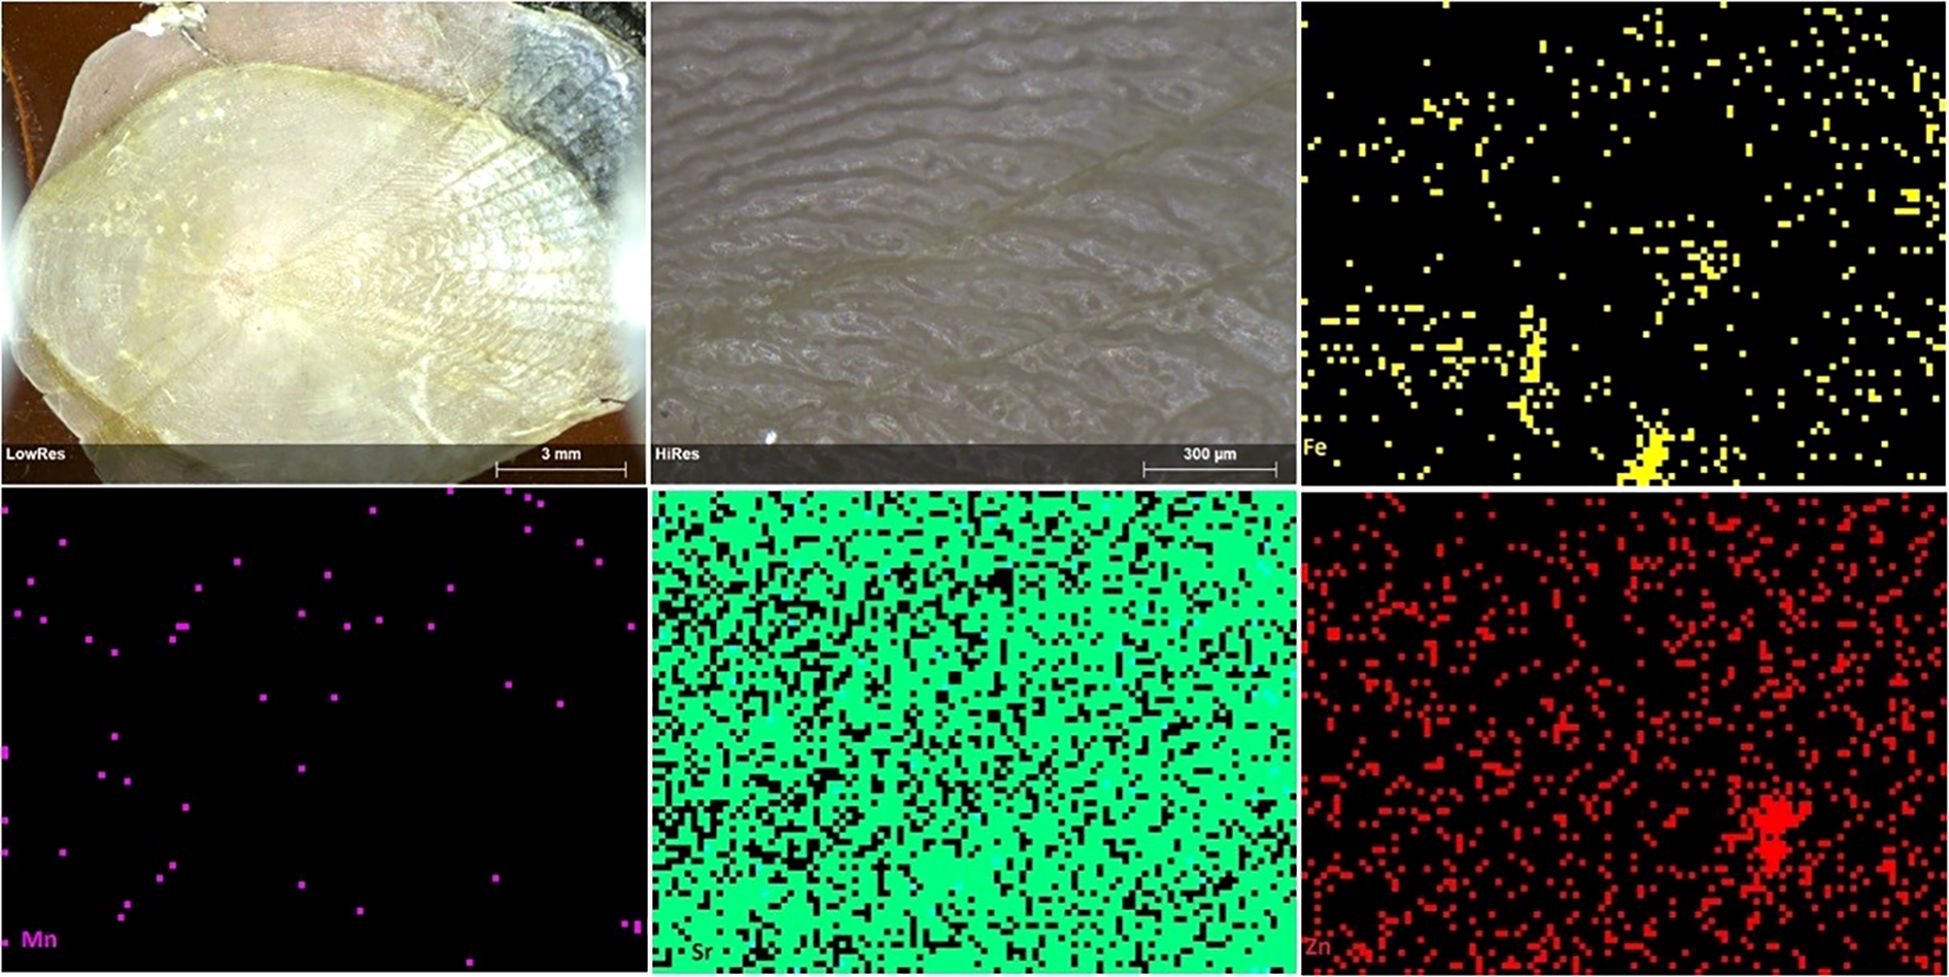
Figure 4. The scale of S. panijus; Top left to right: scale in normal view, in high resolution, distribution map of Fe; Below left to right: distribution map of Mn, distribution map of Sr, distribution map of Zn.
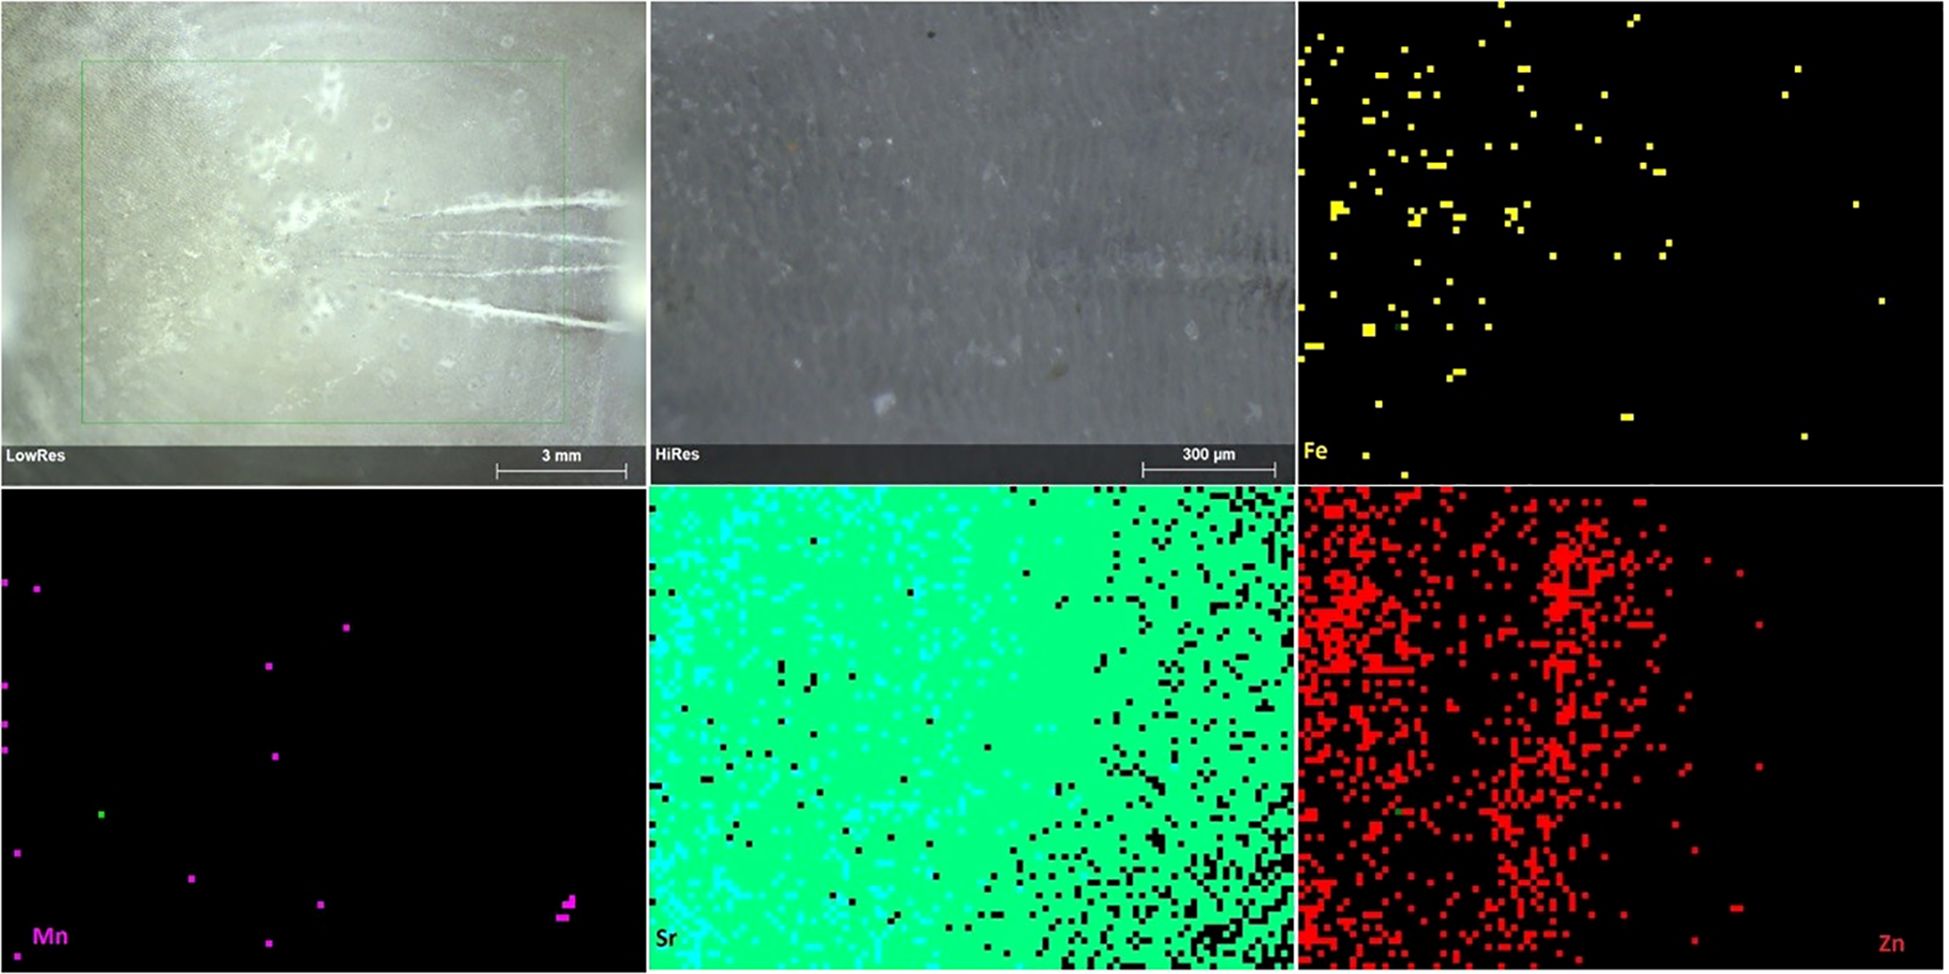
Figure 5. The scale of L. calcarifer; Top left to right: scale in normal view, in high resolution, distribution map of Fe; Below left to right: distribution map of Mn, distribution map of Sr, distribution map of Zn.
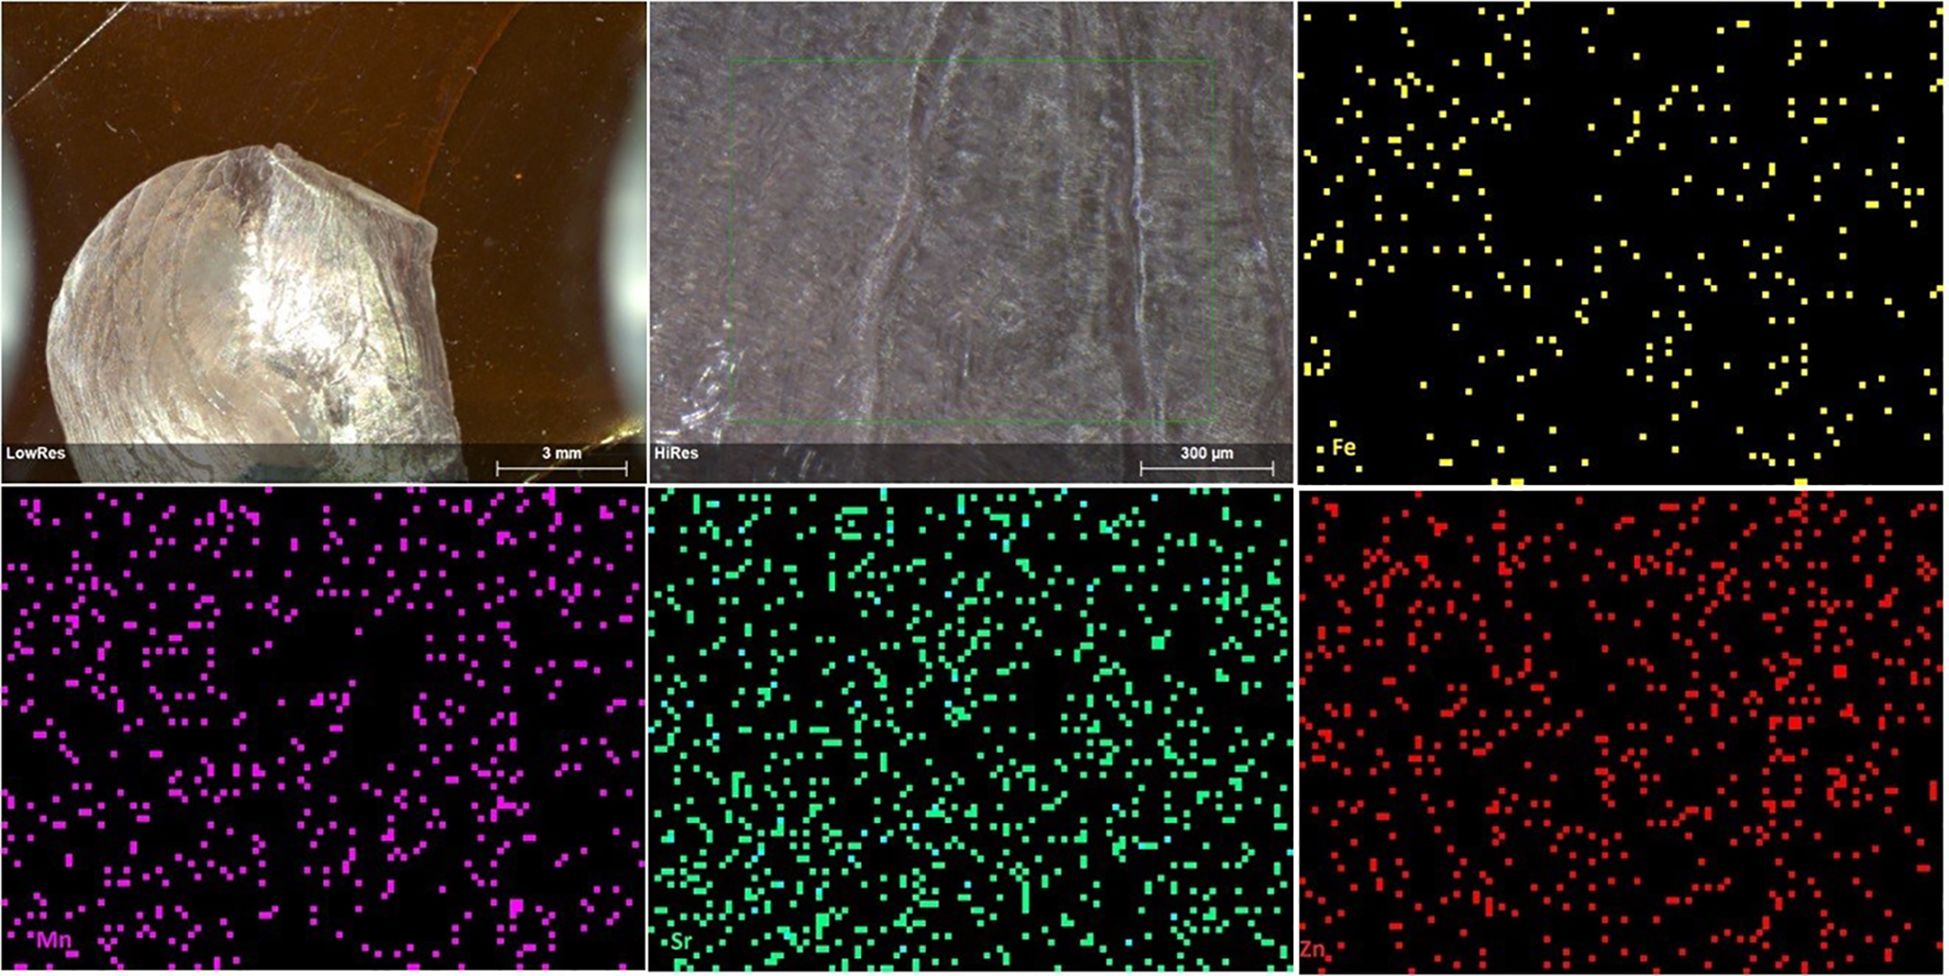
Figure 6. The scale of O. pama; Top left to right: scale in normal view, in high resolution, distribution map of Fe; Below left to right: distribution map of Mn, distribution map of Sr, distribution map of Zn.
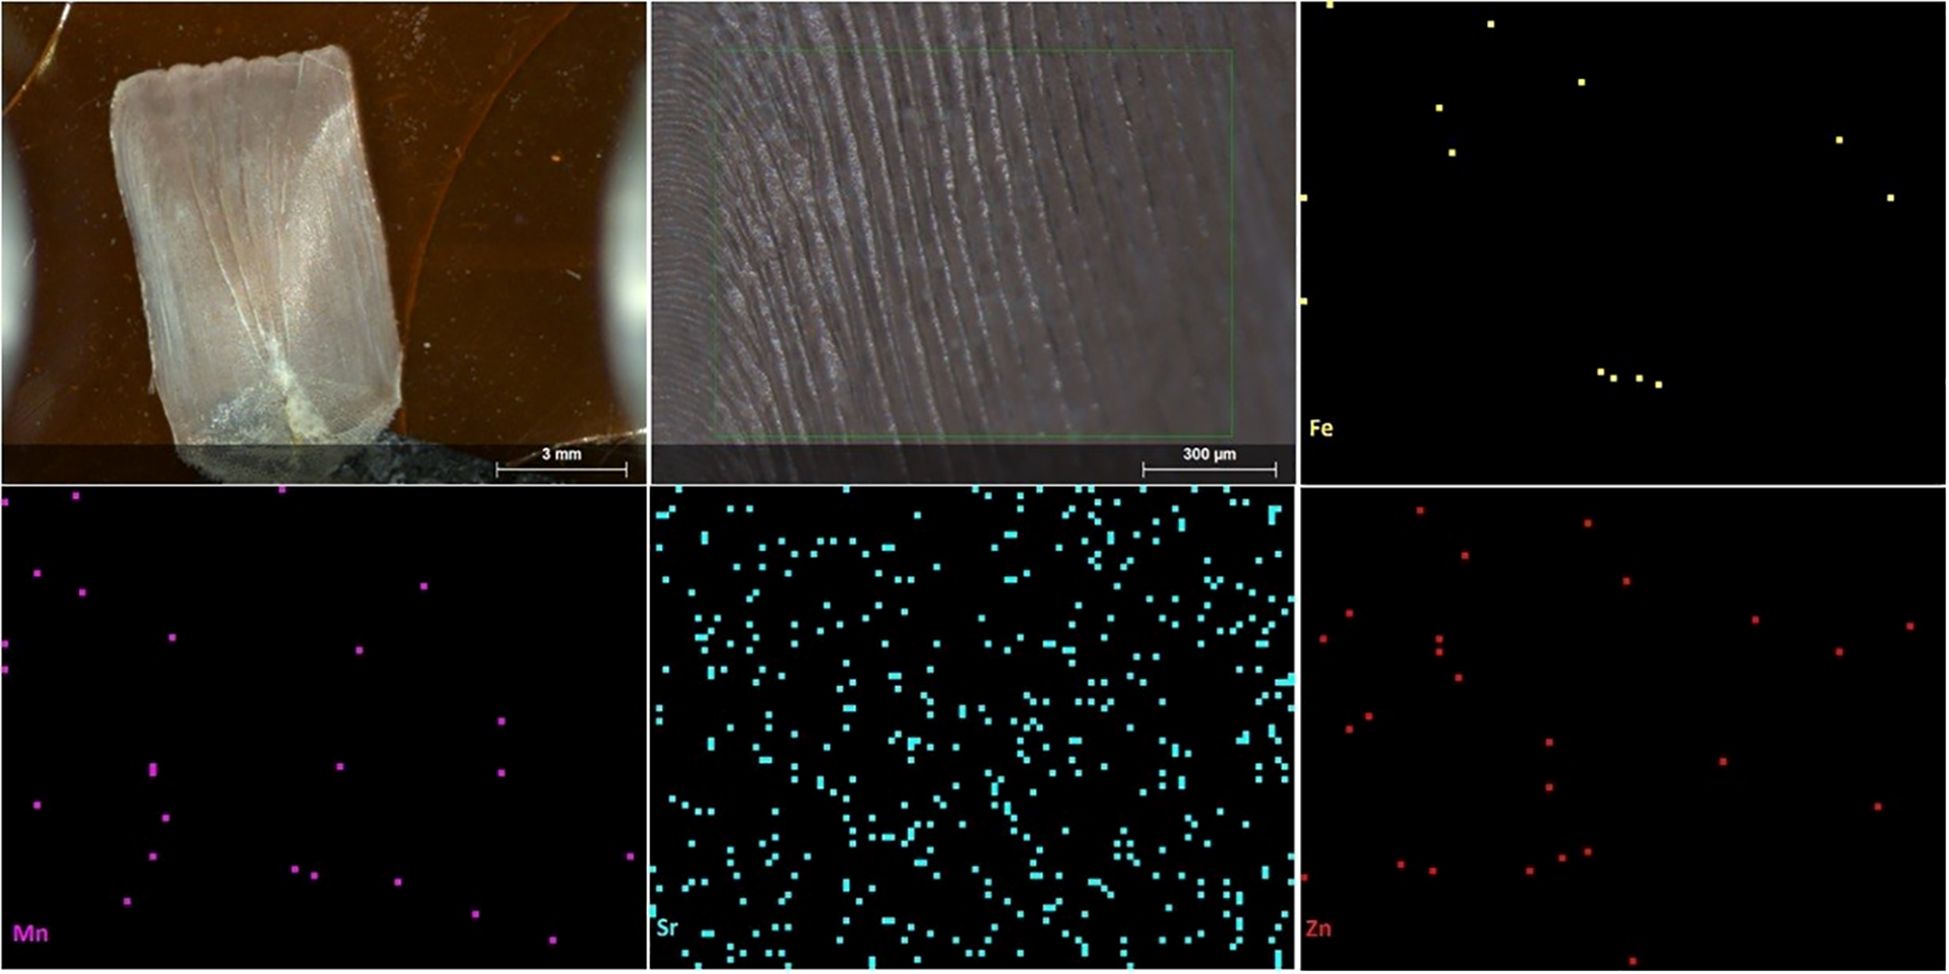
Figure 7. The scale of R. corsula; Top left to right: scale in normal view, in high resolution, distribution map of Fe; Below left to right: distribution map of Mn, distribution map of Sr, distribution map of Zn.
Habitat tracking is crucial for the sustainable management and conservation of a fishery, especially in the case of migratory species. The element makeup of hard parts offers insight into how an organism occupies its environment over the course of its existence. Comparing the ratios in fish scales with other environmental data, including local geology, water chemistry, and species-specific traits, can provide a comprehensive picture of the aquatic environments where the fish live. It is recognized that the elemental makeup of fish scales can be considered an excellent biogeochemical marker for fish habitat tracking (Wang et al., 2016). Given that Ca is the most prevalent element on the scale, we computed element: Ca ratios (Table 4) and used these proportions as possible implications of habitat signature (Wang et al., 2016; Feitosa et al., 2020). The relationship between Ca and P is crucial for several physiological functions in organisms, especially for the health and mineralization of the skeletal system, where both elements are necessary for the development and upkeep of bones, scales, and teeth (Mbachiantim et al., 2021). These two elements are the main constituents of hydroxylapatite in scale (Wang et al., 2016). The ratio of P: Ca found in the current study is presented in Table 4. R. corsula was found to have the highest and T. ilisha had the lowest P: Ca ratios in the present study. The ratio of P to Ca in fish scales is important for several reasons related to the structure and health of the scales and the overall well-being of fish, and any shift in this ratio can cause several issues, especially those pertaining to the metabolism of minerals and the skeleton, including scales. Integrating P:Ca ratio data in fish scales along with other biomarkers, water quality evaluations, and pollutant assessments could help find insight into the fish habitat and nutritional habits, providing insights into the impact of environmental pollution on aquatic systems in fish scales.
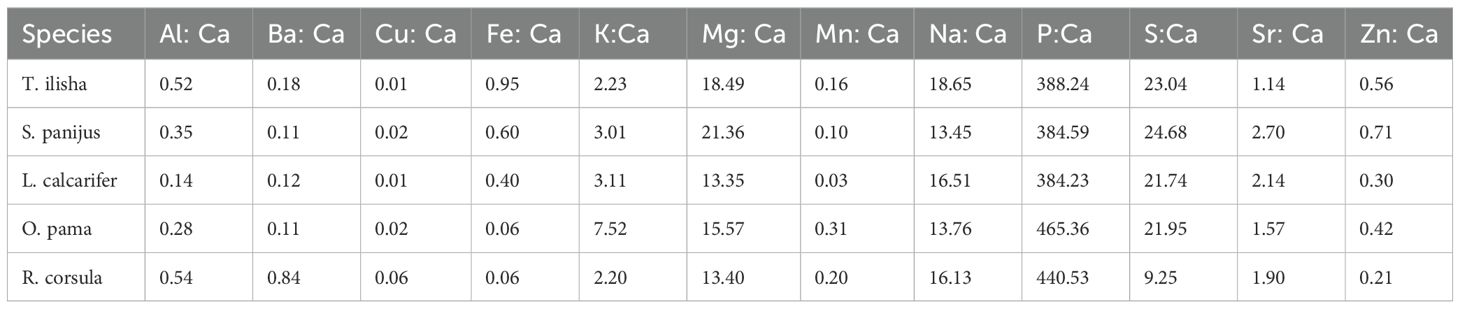
Table 4. Elements/Ca ratios in the scales of fish species studied (Note: Values should be divided by 103 to obtain actual values).
Different elements, including Sr, Ba, Mn, and Mg, are thought to be good indicators of habitat occupancy since their hard part levels correspond to ambient levels (McMillan et al., 2017; Moll et al., 2019). Particularly, Sr and Ba are correlated with salinity, where the first is more abundant in marine and the second in freshwater (McMillan et al., 2017; Tripp et al., 2020). Hence, the ratios of Sr: Ca and Ba: Ca in fish hard parts are positively related to salinity changes (Martinho et al., 2020). Various anthropogenic activities can release Sr into the ecosystem, which might contaminate the aquatic ecosystem. Sr, particularly 90Sr, a long-lived radionuclide, can accumulate in bones and could be detrimental to animals (Mironyuk et al., 2022). O. pama was found to have the highest Mn: Ca and the lowest Ba: Ca ratios in the current study. The ratios of Ba: Ca, Cd: Ca, and Sr: Ca were found to be positively associated with environmental levels and to represent changes in ambient element concentrations (Wells, 2000). Fish scales with high Sr: Ca and Mn: Ca ratios or low Ba: Ca ratios may be a signature of seawater because seawater has concentrations of Ca, Mg, and Sr that are higher by a minimum of one level of magnitude than those of freshwater, and compared to freshwater, the levels of Ba in seawater is about two orders of magnitude lower (Wang et al., 2016). Adey et al. (2009) noted a decrease in Ba levels in salmon scales linked with the transition from freshwater to marine water. When exposed to seawater scales absorb Sr, since Sr can replace Ca and compared to freshwater, seawater has a larger proportion of it enabling the detection of habitation patterns in rivers and seas (Courtemanche et al., 2006). Salmo salar showed a rise in Sr levels during the freshwater-to-marine movement, as well as high Sr concentrations in the marine section (Tray et al., 2022). Coutant and Chen (Coutant and Chen, 1993) also observed lower levels of Sr in the scale of freshwater Morone saxatilis and higher Sr levels in estuarine M. saxatilis. O. pama is an amphidromous (Table 1) fish referring to having a migration pattern from river to the sea and vice versa. Therefore, the samples of O. pama studied in the work have an affinity with seawater. It was observed that scales of Salvelinus fontinalis exhibited greater Sr: Ca ratios when exposed to seawater, and scales of wild anadromous fish had regularly higher ratios of Sr: Ca than freshwater-inhabitant types (Courtemanche et al., 2006). S. panijus had the highest Sr: Ca and Zn: Ca ratios as well as having amphidromous migration patterns also indicating the samples of S. panijus have an affiliation with seawater, like O. pama. Because the amounts of P and Zn in marine and river water are similar thus, we can emphasize the Sr: Ca alone. T. ilisha was found to have the highest Fe: Ca, K: Ca, Mg: Ca, Na: Ca, P: Ca, S: Ca, and the lowest Sr: Ca ratios in the study while L. calcarifer had the lowest Al: Ca, Cu: Ca, and Mn: Ca ratios. The lowest Sr: Ca ratio in T. ilisha and Mn: Ca in L. calcarifer indicate their kinship to freshwater. Both the species are migratory fishes, while T. ilisha being an anadromous and L. calcarifer a catadromous (Table 1) both have a habit of dwelling in the fresh waters at a certain stage of their life span through migration.
Element concentrations were found to vary in relation to fish feeding habits and habitats. Ca and P were the most available elements in the scales. Whereas Cu and Cr had the lowest concentrations. Element concentrations varied across fish feeding habits and habitats. Element: Ca ratios, especially Sr: Ca, Mn: Ca, and Ba: Ca ratios might be potential habitat biomarkers. The results of the current study could serve as background information for future research in the field. Nevertheless, additional investigation is necessary to comprehend the influence and interplay of various elements on the inclusion of elements in scales. Further research could focus on specific laboratory and observational studies to gain a deeper understanding of element profiles and their connections to migratory, dietary, and habitat characteristics. It would be increasingly important to conduct this research across life stages and growth and maturation cycles, even though it might be challenging. Finally, the development of a library of elemental fingerprints for significant species through subsequent research could be useful for long-term management, especially for migratory fishes.
The original contributions presented in the study are included in the article/supplementary material. Further inquiries can be directed to the corresponding author.
MP: Conceptualization, Data curation, Formal Analysis, Investigation, Methodology, Resources, Visualization, Writing – original draft, Writing – review & editing. MH: Data curation, Formal Analysis, Investigation, Visualization, Writing – original draft. MS: Data curation, Investigation, Resources, Writing – original draft. MR: Data curation, Formal Analysis, Writing – review & editing. EB: Formal Analysis, Investigation, Writing – original draft. ZS: Data curation, Formal Analysis, Writing – original draft. BD: Formal Analysis, Visualization, Writing – original draft. HA: Data curation, Writing – original draft. MK: Data curation, Writing – original draft. ES: Supervision, Writing – review & editing. HC: Conceptualization, Methodology, Resources, Supervision, Writing – review & editing.
The author(s) declare that no financial support was received for the research and/or publication of this article.
The authors acknowledge the Stipendium Hungaricum Programme, Tempus Public Foundation for the Stipendium Hungaricum Scholarship. We also thank Mr. Mohammad Eusuf Hasan (Marine Fisheries Survey Management Unit - Chattogram; Fisheries Training Institute -Chandpur; Department. of Fisheries, Bangladesh) and Mr. Raihan Montasir (Engineering Management Program, University of Debrecen) for their support. The micro-XRF measurements at the HUN-REN Institute for Nuclear Research were supported by the GINOP-2.3.3-15-2016-00029 ‘HSLab’ project.
The authors declare that the research was conducted in the absence of any commercial or financial relationships that could be construed as a potential conflict of interest.
The author(s) declare that no Generative AI was used in the creation of this manuscript.
All claims expressed in this article are solely those of the authors and do not necessarily represent those of their affiliated organizations, or those of the publisher, the editors and the reviewers. Any product that may be evaluated in this article, or claim that may be made by its manufacturer, is not guaranteed or endorsed by the publisher.
Adey E. A., Black K. D., Sawyer T., Shimmield T. M., Trueman C. N. (2009). Scale microchemistry as a tool to investigate the origin of wild and farmed Salmo salar. Mar. Ecol. Prog. Ser. 390, 225–235. doi: 10.3354/meps08161
Avigliano E. (2022). Environmental life history of neotropical fish through the chemistry of calcified structures. Biol. Life Sci. Forum 13, 56. doi: 10.3390/blsf2022013056
Brraich O. S., Jangu S. (2013). Fish scales as pollution indicator in harike wetland. Int. J. Fish. Aquac. Sci. 3, 173–182.
Bruker (2019). M4 TORNADO High performance Micro-XRF spectrometer (Berlin, Germany). Available at: www.bruker.com/m4tornado (Accessed December 3, 2024).
Carvalho P. M. S., Pessanha S., MaChado J., Silva A. L., Veloso J., Casal D., et al. (2020). Energy dispersive X-ray fluorescence quantitative analysis of biological samples with the external standard method. Spectrochim. Acta Part B At. Spectrosc. 174, 105991. doi: 10.1016/j.sab.2020.105991
Çelik U., Oehlenschläger J. (2007). High contents of cadmium, lead, zinc and copper in popular fishery products sold in Turkish supermarkets. Food Control 18 (3), 258–261. doi: 10.1016/j.foodcont.2005.10.004
Chuaychan S., Benjakul S., Nuthong P. (2016). Element distribution and morphology of spotted golden goatfish fish scales as affected by demineralisation. Food Chem. 197, 814–820. doi: 10.1016/j.foodchem.2015.11.044
Clarke A. D. (2005). Elemental signatures in bone to determine life history characteristics in fish (Ottawa, Canada: University of Northern British Columbia). doi: 10.24124/2005/bpgub343
Cobelo-García A., Morán P., Almécija C., Caballero P. (2017). Historical record of trace elements, (1983–2007) in scales from Atlantic salmon (Salmo salar): Study of past metal contamination from a copper mine (Ulla River, NW Iberian Peninsula). Chemosphere 188, 18–24. doi: 10.1016/j.chemosphere.2017.08.094
Coello W. F., Khan M. A. Q. (1996). Protection against heavy metal toxicity by mucus and scales in fish. Arch. Environ. Contam. Toxicol. 30, 319–326. doi: 10.1007/BF00212289
Courtemanche D. A., Whoriskey F. G. Jr., Bujold V., Curry R. A. (2006). Assessing anadromy of brook char (Salvelinus fontinalis) using scale microchemistry. Can. J. Fish. Aquat. Sci. 63, 995–1006. doi: 10.1139/f06-009
Coutant C. C., Chen C. H. (1993). Strontium microstructure in scales of freshwater and estuarine striped bass (Morone saxatilis) detected by laser ablation mass spectrometry. Can. J. Fish. Aquat. Sci. 50, 1318–1323. doi: 10.1139/f93-149
Dai H., Cao Y., Fu Y., Tang M., Feng X., Ma L., et al. (2024). Sustainable and one − pot fabrication of peptide chelated calcium from fish scale hydrolysates. Collagen Leather 6, 7. doi: 10.1186/s42825-024-00150-0
Douvris C., Vaughan T., Bussan D., Bartzas G., Thomas R. (2023). How ICP-OES changed the face of trace element analysis: Review of the global application landscape. Sci. Total Environ. 905, 167242. doi: 10.1016/j.scitotenv.2023.167242
El-Sheikh A. H., Sweileh J. A. (2008). Sorption of trace metals on human hair and application for cadmium and lead pre-concentration with flame atomic absorption determination. Jordan J. Chem. 3, 87–97. doi: 10.1007/s00216-002-1686-z
Feitosa L. M., Dressler V., Lessa R. P. (2020). Habitat use patterns and identification of essential habitat for an endangered coastal shark with vertebrae microchemistry: the case study of Carcharhinus porosus. Front. Mar. Sci. 7. doi: 10.3389/fmars.2020.00125
Filipović Marijić V., Mijošek T., Dragun Z., Retzmann A., Zitek A., Prohaska T., et al. (2022). Application of calcified structures in fish as indicators of metal exposure in freshwater ecosystems. Environments 9, 14. doi: 10.3390/environments9020014
Fishbase (2024a). Lates calcarifer, Barramundi: fisheries, aquaculture, gamefish, aquarium. Available online at: https://www.fishbase.se/summary/Lates-calcarifer.html (Accessed October 18, 2024).
Fishbase (2024b). Otolithoides pama, Pama croaker: fisheries. Available online at: https://www.fishbase.se/summary/12056 (Accessed October 18, 2024).
Fishbase (2024c). Rhinomugil corsula, Corsula: fisheries, aquaculture. Available online at: https://www.fishbase.se/summary/Rhinomugil-corsula (Accessed October 18, 2024).
Fishbase (2024d). Sillaginopsis panijus, Flathead sillago: fisheries. Available online at: https://www.fishbase.se/summary/402 (Accessed October 18, 2024).
Fishbase (2024e). Tenualosa ilisha, Hilsa shad: fisheries, aquaculture. Available online at: https://www.fishbase.se/summary/1596 (Accessed October 18, 2024).
Garnero P. L., Monferran M. V., González G. A., Griboff J., de los Ángeles B. M. (2018). Assessment of exposure to metals, As and Se in water and sediment of a freshwater reservoir and their bioaccumulation in fish species of different feeding and habitat preferences. Ecotoxicol. Environ. Saf. 163, 492–501. doi: 10.1016/j.ecoenv.2018.07.023
Gull A., Zafar F. H. S., Panhwar S. K., Bat L., Zahid M. (2024). Seasonal determination of proximate composition and essential elements in commercial fishes from Pakistan and human health risk assessment. Foods Raw Mater. 12 (2), 361–372. doi: 10.21603/2308-4057-2024-2-614
Hammer Ø. (2024). PAST PAleontological STatistics Reference Manual-Version 4.17 (Norway: Natural History Museum, University of Oslo).
Hidayati D., Sulaiman N., Othman S., Ismail B. S. (2013). Fish scale deformation analysis using Scanning Electron Microscope: New potential biomarker in aquatic environmental monitoring of aluminum and iron contamination. AIP Conf. Proc. 1571, 563–568. doi: 10.1063/1.4858714
Hüssy K., Haase S., Mion M., Hilvarsson A., Radtke K., Thomsen T. B., et al. (2024). Into the wild: coupling otolith and archival tag records to test assumptions underpinning otolith chemistry applications in wild fish. Front. Mar. Sci. 11. doi: 10.3389/fmars.2024.1365023
Ikoma T., Kobayashi H., Tanaka J., Walsh D., Mann S. (2003). Microstructure, mechanical, and biomimetic properties of fish scales from Pagrus major. J. Struct. Biol. 142, 327–333. doi: 10.1016/S1047-8477(03)00053-4
Islam M. H., Ara M. H., Naime J., Khan M. A. R. (2024). Nutritional evaluation of fish scale of selected saline and fresh water fish species. Food Humanit. 2, 100225. doi: 10.1016/j.foohum.2023.100225
Jabeen G., Javed M., Azmat H. (2011). Assessment of heavy metals in the fish collected from the river Ravi, Pakistan. Pak. Vet. J. 32, 107–111.
Jovičić K., Janković S., Nikolić D. M., Đikanović V., Skorić S., Krpo-Ćetković J., et al. (2023). Prospects of fish scale and fin samples usage for nonlethal monitoring of metal contamination: a study on five fish species from the Danube River. Knowl. Manage. Aquat. Ecosyst. 424, 4. doi: 10.1051/kmae/2022027
Kalvoda J., Novák M., Bábek O., Brzobohatý R., Holá M., Holoubek I., et al. (2009). Compositional changes in fish scale hydroxylapatite during early diagenesis; An example from an abandoned meander. Biogeochemistry 94, 197–215. doi: 10.1007/s10533-009-9319-7
Kerr L. A., Campana S. E. (2014). “Chemical composition of fish hard parts as a natural marker of fish stocks,” in Stock Identification Methods (Elsevier), 205–234. doi: 10.1016/B978-0-12-397003-9.00011-4
Kılıç Y., Şişman T. (2024). Structural alterations in scales of Capoeta capoeta (Güldenstädt 1773) from heavy metal-contaminated river water. Environ. Monit. Assess. 196, 790. doi: 10.1007/s10661-024-12807-8
Leite F. D., Carvalho P. M. S., Oliveira R. G., Lopes M. C., Domingues I., Correia P. M. M., et al. (2022). Analysis of Zebrafish contamination with heavy metals using a FF-XRF imaging system based on a MPGD. Spectrochim. Acta Part B At. Spectrosc. 198, 106545. doi: 10.1016/j.sab.2022.106545
Ling M., Wu C., Yang K., Hsu H. (2013). Differential accumulation of trace elements in ventral and dorsal muscle tissues in tilapia and milkfish with different feeding habits from the same cultured fishery pond. Ecotoxicol. Environ. Saf. 89, 222–230. doi: 10.1016/j.ecoenv.2012.12.002
Liu Y., Liu M., Ji S., Zhang L., Cao W., Wang H., et al. (2021). Preparation and application of hydroxyapatite extracted from fish scale waste using deep eutectic solvents. Ceram. Int. 47, 9366–9372. doi: 10.1016/j.ceramint.2020.12.067
Łuszczek-Trojnar E., Ryndak D., Drąg-Kozak E. (2022). Cadmium accumulation in the scales of pRussian carp (carassius gibelio bloch 1782) following exposure to cadmium in water. J. Elem. 27, 995–1006. doi: 10.5601/jelem.2022.27.4.2335
Martinho F., Pina B., Nunes M., Vasconcelos R. P., Fonseca V. F., Crespo D., et al. (2020). Water and otolith chemistry: implications for discerning estuarine nursery habitat use of a juvenile flatfish. Front. Mar. Sci. 7. doi: 10.3389/fmars.2020.00347
Mbachiantim J. T., Johnson N. C., Ogbamgba V. M. (2021). Calcium (Ca) to phosphorus (P) ratio: key to positive ecosystem in animal production. European Journal of Science, Innovation and Technology. 1 (6), 88–92. Available online at: https://ejsit-journal.com/index.php/ejsit/article/view/52.
McMillan M. N., Izzo C., Wade B., Gillanders B. M. (2017). Elements and elasmobranchs: hypotheses, assumptions and limitations of elemental analysis. J. Fish Biol. 90, 559–594. doi: 10.1111/jfb.13189
Mironyuk I., Kaglyan A., Vasylyeva H., Mykytyn I., Gudkov D., Turovska L. (2022). Investigation of the chemical and radiation stability of titanium dioxide with surface arsenate groups during 90Sr adsorption. J. Environ. Radioact. 251–252, 106974. doi: 10.1016/j.jenvrad.2022.106974
MOFL, Ministry of fisheries and Livestock (2014). Fish and Fish Products (Inspection and Quality Control), Ordinance, 1983. SRO no. 233 Ayen further correction (in Bangla). Bangladesh Gazette: Bangladesh Government Press. 18627-8.
Moll D., Kotterba P., Jochum K. P., von Nordheim L., Polte P. (2019). Elemental inventory in fish otoliths reflects natal origin of atlantic herring (Clupea harengus) from Baltic Sea juvenile areas. Front. Mar. Sci. 6. doi: 10.3389/fmars.2019.00191
Morán P., Cal L., Cobelo-García A., Almécija C., Caballero P., Garcia de Leaniz C. (2018). Historical legacies of river pollution reconstructed from fish scales. Environ. pollut. 234, 253–259. doi: 10.1016/j.envpol.2017.11.057
Moreau G., Barbeau C., Frenette J. J., Saint-Onge J., Simoneau M. (1983). Zinc, manganese, and strontium in opercula and scales of brook trout (Salvelinus fontinalis) as indicators of lake acidification (Laurentian Park, Quebec). Can. J. Fish. Aquat. Sci. 40, 1685–1691. doi: 10.1139/f83-195
Mustafa M. G., Shanta S. M., Parvez M. S. (2023). “Artisanal fishing crafts and gears of coastal Bangladesh,” in Small in Scale, Big In Contributions: Advancing Knowledge of Small-Scale Fisheries in Bangladesh. Ed. Islam M. M. (Too Big To Ignore (TBTI): TBTI Global Publication Series, Too Big To Ignore (TBTI, St. John’s, NL,Canada), 82–103. Available at: http://toobigtoignore.net/small-is-scale-big-in-contributions/ (Accessed December 4, 2024).
Oladebeye A. O. (2017). Assessment of Heavy Metals in Nigerian Vegetables and Soils in Owo and Edo Axes Using X-Ray Fluorescence (XRf) Technique (Owo, Ondo State, Nigeria: Achievers University).
Parvez M. S., Czédli H., Hoque M. I., Rahman M. M., Anwar A., Uddin A. H. M. M., et al. (2024a). Accumulation of microplastics and potentially toxic elements in plant leaves along an urbanization gradient in Bangladesh. Toxics 12, 848. doi: 10.3390/toxics12120848
Parvez M. S., Ullah H., Faruk O., Simon E., Czédli H. (2024b). Role of microplastics in global warming and climate change: a review. Water Air Soil Pollut. 235, 201. doi: 10.1007/s11270-024-07003-w
Pender P. J., Griffin R. K. (1996). Habitat history of barramundi lates calcarifer in a North Australian river system based on barium and strontium levels in scales. Trans. Am. Fish. Soc 125, 679–689. doi: 10.1577/1548-8659(1996)125<0679:hhobci>2.3.co;2
Pouilly M., Point D., Sondag F., Henry M., Santos R. V. (2014). Geographical origin of Amazonian freshwater fishes fingerprinted by 87Sr/86Sr ratios on fish otoliths and scales. Environ. Sci. Technol. 48, 8980–8987. doi: 10.1021/es500071w
Pourang N. (1995). Heavy metal bioaccumulation in different tissues of. Environ. Monit. Assess. 35, 207–219. doi: 10.1007/BF00547632
Rahman S. A., Abdullah N. A., Chowdhury A. J. K., Yunus K. (2018). Fish scales as a bioindicator of potential marine pollutants and carcinogens in Asian sea bass and red tilapia within the coastal waters of Pahang, Malaysia. J. Coast. Res. 82, 120–125. doi: 10.2112/SI82-016.1
Rejomon G., Nair M., Joseph T. (2010). Trace metal dynamics in fishes from the southwest coast of India. Environ. Monit. Assess. 167, 243–255. doi: 10.1007/s10661-009-1046-y
Seshaya R., Ambujarai P., Kalyani M. (1963). “Amino acid composition of ichthylepidin from fish scales,” in Ramachandran GN (ed) Aspects of protein structure (Academic Press, London), 343–356.
Shakir H. A., Qazi J. I., Chaudhry A. S., Irfan M., Khan M., Ali S., et al. (2020). Bioaccumulation of metals in fishes’ Scales – A reliable non-lethal assessor of food security. Sarhad J. Agric. 36 (1), 95–100. doi: 10.17582/journal.sja/2020/36.1.95.100
Silva I., Rina D. J., Medeiros S., Margarete M., Marcos C., Bezerra D. A., et al. (2014). Analysis of metal contamination and bioindicator potential of predatory fish species along contas river basin in Northeastern Brazil. Bull. Environ. Contam. Toxicol. 92, 551–556. doi: 10.1007/s00128-013-1188-z
Tray E., Brophy D., Maoiléidigh N., Finlay R., de Eyto E., Poole R., et al. (2022). Investigating post-depositional alteration of trace elements in fish scales using tagged and recaptured wild salmon. Fish. Res. 248, 106207. doi: 10.1016/j.fishres.2021.106207
Tripp A., Murphy H. M., Davoren G. K. (2020). Otolith chemistry reveals natal region of larval capelin in coastal Newfoundland, Canada. Front. Mar. Sci. 7. doi: 10.3389/fmars.2020.00258
Vašek M., Souza A. T., Říha M., Kubečka J., Znachor P., Hejzlar J. (2021). Stable isotope evidence from archived fish scales indicates carbon cycle changes over the four-decade history of the Římov Reservoir (Czechia). Sci. Total Environ. 755 (Part 2), 142550. doi: 10.1016/j.scitotenv.2020.142550
Wang T. H., Lai Y. C., Chiang C. C., Cheng Y. R., Hsieh Y. K., Wang C. F. (2016). Element distribution over the surface of fish scales and its connection to the geochemical environment of habitats: a potential biogeochemical tag. Environ. Monit. Assess. 188, 1–12. doi: 10.1007/s10661-016-5174-x
Wells B. K. (2000). Evaluation of Fish Scale Chemistry for Determining Habitat Associations (Norfolk, Virginia, United States: Old Dominion University). Available at: https://digitalcommons.odu.edu/biology_etds/76/ (Accessed December 3, 2024).
Keywords: fish scale, element profile, feeding habit, habitat, biomarker
Citation: Parvez MS, Hoque MI, Siddique MNM, Rahman MM, Baranyai E, Sajtos Z, Döncző B, Aib H, Kader MA, Simon E and Czédli H (2025) Elemental analysis in the scales of commercially important coastal fishes and their connections with fish feeding habits and habitats. Front. Mar. Sci. 12:1546313. doi: 10.3389/fmars.2025.1546313
Received: 07 January 2025; Accepted: 10 March 2025;
Published: 01 April 2025.
Edited by:
Marco Albano, University of Messina, ItalyReviewed by:
Letizia Sion, University of Bari Aldo Moro, ItalyCopyright © 2025 Parvez, Hoque, Siddique, Rahman, Baranyai, Sajtos, Döncző, Aib, Kader, Simon and Czédli. This is an open-access article distributed under the terms of the Creative Commons Attribution License (CC BY). The use, distribution or reproduction in other forums is permitted, provided the original author(s) and the copyright owner(s) are credited and that the original publication in this journal is cited, in accordance with accepted academic practice. No use, distribution or reproduction is permitted which does not comply with these terms.
*Correspondence: Herta Czédli, aGVydGEuY3plZGxpQGVuZy51bmlkZWIuaHU=
Disclaimer: All claims expressed in this article are solely those of the authors and do not necessarily represent those of their affiliated organizations, or those of the publisher, the editors and the reviewers. Any product that may be evaluated in this article or claim that may be made by its manufacturer is not guaranteed or endorsed by the publisher.
Research integrity at Frontiers
Learn more about the work of our research integrity team to safeguard the quality of each article we publish.