 Guangsheng Zhang
 Zhaomin Zhang
 Hao Yuan2
94% of researchers rate our articles as excellent or good
Learn more about the work of our research integrity team to safeguard the quality of each article we publish.
Find out more
ORIGINAL RESEARCH article
Front. Mar. Sci., 24 February 2025
Sec. Marine Affairs and Policy
Volume 12 - 2025 | https://doi.org/10.3389/fmars.2025.1546146
This article is part of the Research TopicChallenges and Opportunities for Decarbonizing the Maritime IndustryView all 8 articles
Market-based carbon cap-and-trade mechanisms play a pivotal role in reducing the carbon emissions of shipping logistics companies. Focusing on the issue of emission reduction investment in the competitive shipping logistics service supply chain (SLSSCs) under carbon cap-and-trade, this paper constructs a game theory model for emission reduction investment decision-making in the SLSSC, which comprises two participants-a shipping logistics service provider (SLSP) and a shipping logistics service integrator (SLSI)-discusses the equilibrium strategy of emission reduction investment based on optimization theory, and further explores the benefits of participating entities, consumer surplus, and social welfare under different emission reduction strategies. The findings indicate that: (1) a no-reduction investment strategy, a single-chain investment strategy, and a dual-chain investment strategy can each serve as equilibrium strategies, which are influenced by the interplay among the unit carbon emission trading price, the spillover effect of emission reduction investments, and the associated cost coefficient. (2) Both single-chain and dual-chain emission reduction strategies in the SLSSCs contribute to consumer surplus; however, their impact on social welfare is contingent on the SLSI’s cost coefficient for emission reductionn investments. (3) Under the single-chain equilibrium strategy, the spillover effect from the SLSI’s emission reduction investment has a favorable impact on returns for participants in the non-investing chain, consumer surplus, and social welfare, but adversely affectts returns for participants in the investing chain. Under the dual-chain equilibrium strategy, the spillover effect benefits both chains’ participants’ returns, consumer surplus, and social welfare. In addition, the SLSP’s altruistic inclination enhances participants’ returns, consumer surplus, and social welfare across all strategies.
In recent years, the global shipping industry has been undergoing a low-carbon transition, focusing on innovative measures for using clean energy, enhancing energy efficiency, and reducing emissions (Romano and Yang, 2021; Tadros et al., 2023). Aiming to reduce net greenhouse gas emissions by 55% by 2030 compared with 1990 levels, the EU Commission established the EU Emission Trading System, a mandatory system that seeks to control annual emissions in the EU region, operating on a “cap-and-trade” mechanism. The shipping industry was added to the EU Emission Trading System in January 2024, meaning that this industry also needs to follow the EU’s cap-and-trade rules for carbon emissions. Shipowners, operators, and service providers are now looking for ways to manage the impact of the regulations. With the EU taking the lead in monitoring emissions from the shipping sector, the International Maritime Organization set its own emission-reduction target at the MEPC 80 meeting, aiming to achieve net-zero emissions by around 2050. The carbon cap-and-trade mechanisms is characterized by its clear emission-reduction targets, relatively high efficiency, and low policy implementation resistance (Zhang and Yu, 2022; Yang et al., 2023). Hence, it has been widely adopted as an emission-reduction strategy in regions such as Europe, North America, and East Asia. As a market-oriented policy, the carbon cap-and-trade mechanisms has become an important strategy for limiting the CO2 emissions produced by companies, playing a dominant role in global emission reduction.
Meanwhile, the shipping industry has rapidly grown in tandem with technological advancements and the upgrading of business models. Information technology in shipping has continuously improved, with its logistics services moving toward high efficiency and intensification. The integrity and complexity of modern shipping logistics service outsourcing have increased. Various shipping logistics organizations cooperate based on shipping demand, forming a complete shipping logistics service system with multilevel supply-and-demand relationships, thus constituting a shipping logistics service supply chain (SLSSC). As a cross-enterprise organization, SLSSC is a new management model comprising different levels of shipping logistics service integrators (SLSIs) and shipping logistics service providers (SLSPs). It is a complex network that ensures the operation of shipping supply chains through shipping logistics services.
In SLSSC, SLSPs provide specific logistics services to SLSIs. SLSIs currently face increasing environmental protection demands from governments and consumers and are also affected by carbon emission restrictions and trading mechanisms. Among them, SLSPs (e.g., shipowners and ship operators) are the entities directly responsible for reducing greenhouse gas (GHG) emissions of ships. Thus, recognizing the urgency of transitioning to low-carbon practices, SLSIs actively pursue emission-reduction investment strategies. The emission-reduction investment strategies of SLSIs are influenced not only by upstream and downstream enterprises in SLSSC but also by horizontal competitors. On the one hand, when making emission-reduction investment strategies, two SLSSCs need to consider the potential spillover effects of their emission-reduction actions on external competitors. On the other hand, they need to ensure the continuous and stable operation of the supply chain. Upstream SLSPs might exhibit altruistic tendencies, which are prevalent in supply chains (Liu et al., 2018; Jia et al., 2022; Zhang and Yu, 2022; Meng et al., 2023), Altruistic preference refers to a situation where managers, when making decisions, consider not only their own interests but also the consequences for their cooperative partners. Such decision-makers are willing to support others in maximizing social welfare, enhance supply chain efficiency, and thereby elevate their own returns—ultimately realizing mutually beneficial outcomes. Maersk provides a prominent illustration of forward-looking collaboration: in 2018, the company helped Damco build a digital freight-forwarding platform to boost both parties’ competitive edge; in 2019, Maersk invested USD 30 million in the German freight forwarder Freight Hub to develop a digital platform to improve operational efficiency and reduce carbon emissions. Such altruistic behavior is mainly used to mitigate the emission-reduction investment pressure on SLSIs. In this circumstance, the goal of SLSPs is not to maximize their own profits but to maintain the sustainable development of the supply chain, balancing their own profits and those of SLSIs. There is currently no literature available, however, have considered emission-reduction investment in competitive SLSSCs with emission-reduction spillover effects and SLSPs’ altruistic preferences in the cap-and-trade context. To address these issues, this paper focuses on competitive shipping logistics service supply chains. Based on game theory and optimization theory, it analyzes the equilibrium emission reduction investment strategies for two shipping logistics service supply chains under the scenarios of emission reduction spillovers by shipping logistics integrators and altruistic preferences of shipping logistics providers. Furthermore, it compares the participant profits, consumer surplus, and social welfare under different emission reduction strategies to explore the optimal equilibrium strategy. This study mainly addresses the following questions:
(1) Based on different emission-reduction investment strategies in SLSSCs, how should SLSPs and SLSIs determine the optimal prices and quantities? How should the government optimize free carbon allowances to improve social welfare?
(2) How do different emission-reduction investment strategies affect the earnings of SLSPs, SLSIs, and their supply chains? What is the equilibrium strategy achieved by two SLSSCs?
(3) How do the spillover effects of SLSI emission-reduction investments and SLSPs’ altruistic tendencies jointly influence supply chain participants’ profits, consumer surplus, and overall social welfare?
Building on the preceding analysis, this study develops an emission-reduction investment decision model for two SLSSCs that captures both the spillover effects of SLSIs’ emission-reduction investments and SLSPs’ altruistic preferences. By examining multiple equilibrium strategies, we find that, under competitive conditions, carbon quota allocation is primarily influenced by the carbon emission trading price rather than by each SLSP’s position within the SLSSC. Furthermore, under different emission-reduction strategies, the decisions and resulting equilibrium strategies of SLSIs and SLSPs depend on the interplay among the unit carbon emission trading price, the spillover effects of the SLSIs’ emission-reduction investments, and the cost coefficients of these investments. The main contributions of this study are as follows: (1) For two competitive SLSSCs, we derive the optimal pricing and decision-making variables under no-investment, single-chain investment, and dual-chain investment models, indicating that under various strategies, returns for the SLSI, the SLSP, and the overall supply chain are shaped by the inherent relationships among the unit carbon emission trading price, the spillover from the integrator’s emission-reduction investment, and associated cost coefficients. (2) We further investigate and determine the optimal initial free carbon emission quota for the SLSI, showing that it is largely dictated by the unit carbon emission trading price in the carbon market, irrespective of a participant’s position. (3) Lastly, we examine how the three investment strategies affect the performance of the two competitive SLSSCs, proposing differentiated investment strategies for SLSIs and SLSPs, thus enabling flexible formulation and adjustment of emission-reduction strategies under varying market conditions.
The rest of this paper is organized as follows. Section 2 reviews the literature. Sections 3 and 4 provide the model assumptions and develop the basic no-investment model, single-chain emission-reduction investment model, and dual-chain emission-reduction investment model within the context of China’s SLSSCs. Section 5 analyzes the effects of the three investment models on the earnings of providers, SLSIs, and the two SLSSCs overall. Section 6 examines the effects of optimal decisions in competitive SLSSCs on consumer surplus and social welfare. Section 7 describes the simulation and sensitivity analysis. Section 8 concludes with management insights and directions for future research.
Research on SLSSCs primarily falls into two categories. The first involves qualitative analyses of the operational mechanisms, cooperation models, and coordination mechanisms within SLSSCs. Studies by Bichou and Gray (2004); Song and Panayides (2008); Tongzon and Lee (2016), and Jiang et al. (2021), and Xu et al. (2024a) explore how different stakeholders in the shipping industry collaborate to enhance efficiency and service quality. These works examine the complexities of maritime logistics and the importance of integrating various services to optimize the supply chain. The second category encompasses quantitative analyses focused on the optimization and integration of shipping logistics service chains, including the selection and profit distribution among chain members. Lee and Song (2017), and Kim et al. (2021), and Xu et al. (2024b), and Xiao et al. (2024) utilize mathematical models and simulations to optimize logistics processes and improve the competitiveness of shipping companies. These studies address issues such as route optimization, cost reduction, and service level enhancement.
Despite extensive research, there is no universally accepted definition of an SLSSC. The terminology varies, including “shipping supply chain,” “shipping service chain,” “port transport chain,” and “maritime transport chain.” Talley and Ng (2013) introduced the concept of the maritime transport chain and conducted studies analyzing its components-maritime carriers, land carriers, ports, and shippers. They examined selection behaviors among these entities and evaluated port performance within the constructed maritime transport chain. Based on previous research, this paper defines the SLSSC, SLSPs, and SLSIs. The SLSSC refers to the network of enterprises and organizations involved in providing shipping logistics services from suppliers to end customers. It encompasses the full range of services involved in the maritime transportation of goods, including transportation, warehousing, loading and unloading, distribution, and other end-to-end services. SLSPs are enterprises that directly offer specific shipping logistics services, such as shipowners, ship operators, port operators, and transportation companies (Hingley et al., 2011). They are responsible for the actual transportation and handling of goods. SLSIs are enterprises that integrate various shipping logistics services to provide comprehensive solutions for customers. By coordinating and managing multiple SLSPs, they offer integrated logistics services; examples include international freight forwarders and fourth-party logistics (4PL) companies.
Environmental concerns have recently shifted research focus toward emission reduction in the shipping supply chain. Liu H. et al. (2023) developed a model involving ports and liner companies to assess the effects of carbon tax policies on emission-reduction technologies. They found that knowledge sharing and consumers’ green preferences significantly influence carbon emission benefits, yielding gains for both ports and liners. Mao et al. (2024) emphasized the shipping industry’s role in achieving carbon neutrality and meeting the temperature targets set by the Paris Agreement. They suggested potential solutions to the challenges posed by the EU’s maritime carbon emission trading system. Most research on SLSSCs focuses on single-chain coordination under normal conditions. However, interchain competition and government carbon policies are critical in real-world operations. Therefore, exploring coordination in competitive SLSSCs under carbon cap-and-trade mechanisms is necessary to offer managerial insights for sustainable development.
Under rapid economic globalization, supply chains have become critical determinants of the competitiveness of enterprises, industries, and even nations. Current research in this field can be categorized into two types. The first focuses on vertical integration and coordination within supply chains, and the second concerns the design of cooperative contracts within supply chains.
First, in competitive supply chain structures, the operational outcomes of enterprises can be significantly improved by selecting an appropriate equilibrium structure. Li et al. (2020) investigated structures with partially vertical integration in two competitive supply chains. Zhao H. et al. (2022) explored contract strategies for competitive supply chains under demand uncertainty. They found that manufacturers will adopt wholesale price contracts under scenarios of moderate price competition and high demand volatility. Conversely, when price competition and demand are relatively stable, revenue-sharing contracts are preferred. Second, regarding internal and external coordination contracts in competitive supply chains, some studies have investigated vertical channel contracts under chain-to-chain competition or asymmetric Nash bargaining models, focusing on buyback contracts, outsourcing contracts, and wholesale pricing. Xia et al. (2023) studied the effects of market competition intensity and consumers’ low-carbon preferences on equilibrium strategies and corporate profits, finding that intense competition reduced manufacturers’ emission-reduction efforts and negatively affected profits. Liu et al. (2023a) evaluated the equilibrium conditions of government subsidies, consumer trust, and competition intensity using a game theory model for two competitive manufacturers and one retailer. The results showed that equilibrium strategies with market effects exhibit “four highs”: high prices, high quantities, high profits, and high environmental benefits.
The Chinese Governments have implemented various carbon management policies to encourage supply chain enterprises to participate in carbon reduction activities. Such policies involve carbon taxes, carbon cap-and-trade mechanisms, and direct subsidies. Studies indicate that carbon emission trading mechanisms have stronger incentivizing effects (Sun and Yang, 2021; Zhao X. et al. (2022); Fan et al., 2023; Zhang et al., 2024). Many countries have identified the carbon cap-and-trade mechanisms as the main measure for controlling emissions from major carbon-emitting enterprises (Grubb, 2012; Zhang et al., 2016). Several researchers have explored supply chain emission reduction investments under carbon cap-and-trade schemes. Xu et al. (2017) investigated production and emission reduction decisions for a make-to-order supply chain consisting of manufacturers and retailers under such policies. Chen et al. (2021) analyzed how different trading mechanisms influence the optimal decisions of a power company that invests in conventional energy under a cap-and-trade framework for renewable energy. Zou et al. (2023), building on carbon quota trading systems and the effect of retailers’ risk aversion, employed variational inequality theory to develop a network equilibrium model that incorporates inventory-capacity constraints. Their findings suggest that, when retailers exhibit risk aversion, an increase in the risk-aversion coefficient lowers manufacturers’ carbon emissions and profits but raises product prices as well as retailers’ profits. Altruism is a social preference representing an irrational economic factor that influences decision-making. Some have incorporated altruistic preferences into studies of low-carbon and green supply chain management. Feng et al. (2021) examined retailers’ altruistic behaviors and designed a profit distribution mechanism for joint replenishment under the cap-and-trade policy. Moreover, a few studies have combined altruism with low-carbon investment in a supply chain. Jiang et al. (2024) considered consumers’ increased environmental awareness, which encourages competitive shippers to voluntarily disclose their carriers’ carbon reduction information. The equilibrium information disclosure strategies of competitive shippers were tested in that study.
This section has reviewed the research on emission-reduction investments in SLSSCs under carbon cap-and-trade mechanisms, mainly focusing on SLSSCs, competitive supply chain decisions, and emission-reduction investments under carbon cap-and-trade mechanisms. Existing studies of supply chain emission-reduction investments under cap-and-trade policies have mostly addressed vertical spillover effects between upstream and downstream entities, with limited exploration of horizontal spillover effects among competitive firms (Wang et al., 2021; Zhang and Zhang (2022); Mao et al., 2024). Although some studies have examined the effects of horizontal spillovers on emission-reduction strategies among competitive firms, systematic analyses of emission-reduction investments in SLSSCs in the cap-and-trade context are lacking. Additionally, many studies overlook the integration of cross-chain spillover effects and vertical altruistic behavior in SLSSCs, especially the interaction between these factors and their effects on emission-reduction decisions. This study, therefore, examines the competitive SLSSC structure, considering horizontal investment spillovers among SLSIs and the altruistic preferences of SLSPs within the chain. Furthermore, it considers the effects of emission-reduction investment spillovers and SLSPs’ altruistic behaviors on emission-reduction investments in competitive SLSSCs.
Under the carbon cap-and-trade mechanisms, this study models two SLSSCs with substitutable logistics services. Each supply chain consists of an SLSP and an SLSI. Within SLSSC (), the SLSP offers one or more logistics services and sells these services to the SLSI at a wholesale price . The SLSI then generates comprehensive logistics solutions by integrating logistics resources and sells the integrated services to logistics service demanders at a market price . Under government-imposed carbon emission limits and trading policies, if the carbon emissions of two SLSIs exceed the stipulated quotas, they can purchase carbon emission allowances in the carbon trading market. Conversely, if an SLSI has surplus emission quotas, it can sell these excess allowances to other enterprises in need. To comply with carbon emission constraints, SLSIs can choose to invest in green, low-carbon solutions or technologies to reduce emissions, or they can purchase the necessary allowances through the carbon trading market. Assume that two SLSIs exhibit similar investment efficiency. Their efforts in emission-reduction investment might lead to emission-reduction spillover effects owing to knowledge diffusion or transfer. Furthermore, when focusing on their own interests, SLSPs consider the revenue of SLSIs to ensure the stability of SLSSC and avoid disrupting cooperation owing to high investment costs. SLSPs with altruistic preferences can alleviate the pressure on SLSIs in emission-reduction investments, further incentivizing them to pursue low-carbon transformation.
This study explores a decision-making model for carbon emission-reduction investments in competitive SLSSCs while incorporating the altruistic preference of SLSPs and the technology spillover from logistics integrators. The specific decision process is as follows. First, the government maximizes social welfare and determines the specific carbon allowances for logistics integrators in two competitive SLSSCs. Second, each logistics integrator independently chooses whether to implement emission-reduction strategies and then determines optimal production levels and selling prices. Figure 1 shows the framework of the competitive SLSSC model developed in this study. Overall, there are four strategic combinations between logistics integrators in competitive SLSSCs: (1) Neither logistics integrator implements emission-reduction investments [i.e., no emission-reduction investment strategy (NN)]. (2) Only one logistics integrator conducts emission-reduction investments (i.e., single-chain emission-reduction investment strategy (YN)/(NY) with similarities, thus showing (YN) as a representative). (3) Both logistics integrators in the competitive SLSSC implement emission-reduction investments [i.e., dual-chain emission-reduction investment strategy (YY)]. Table 1 gives the corresponding details.
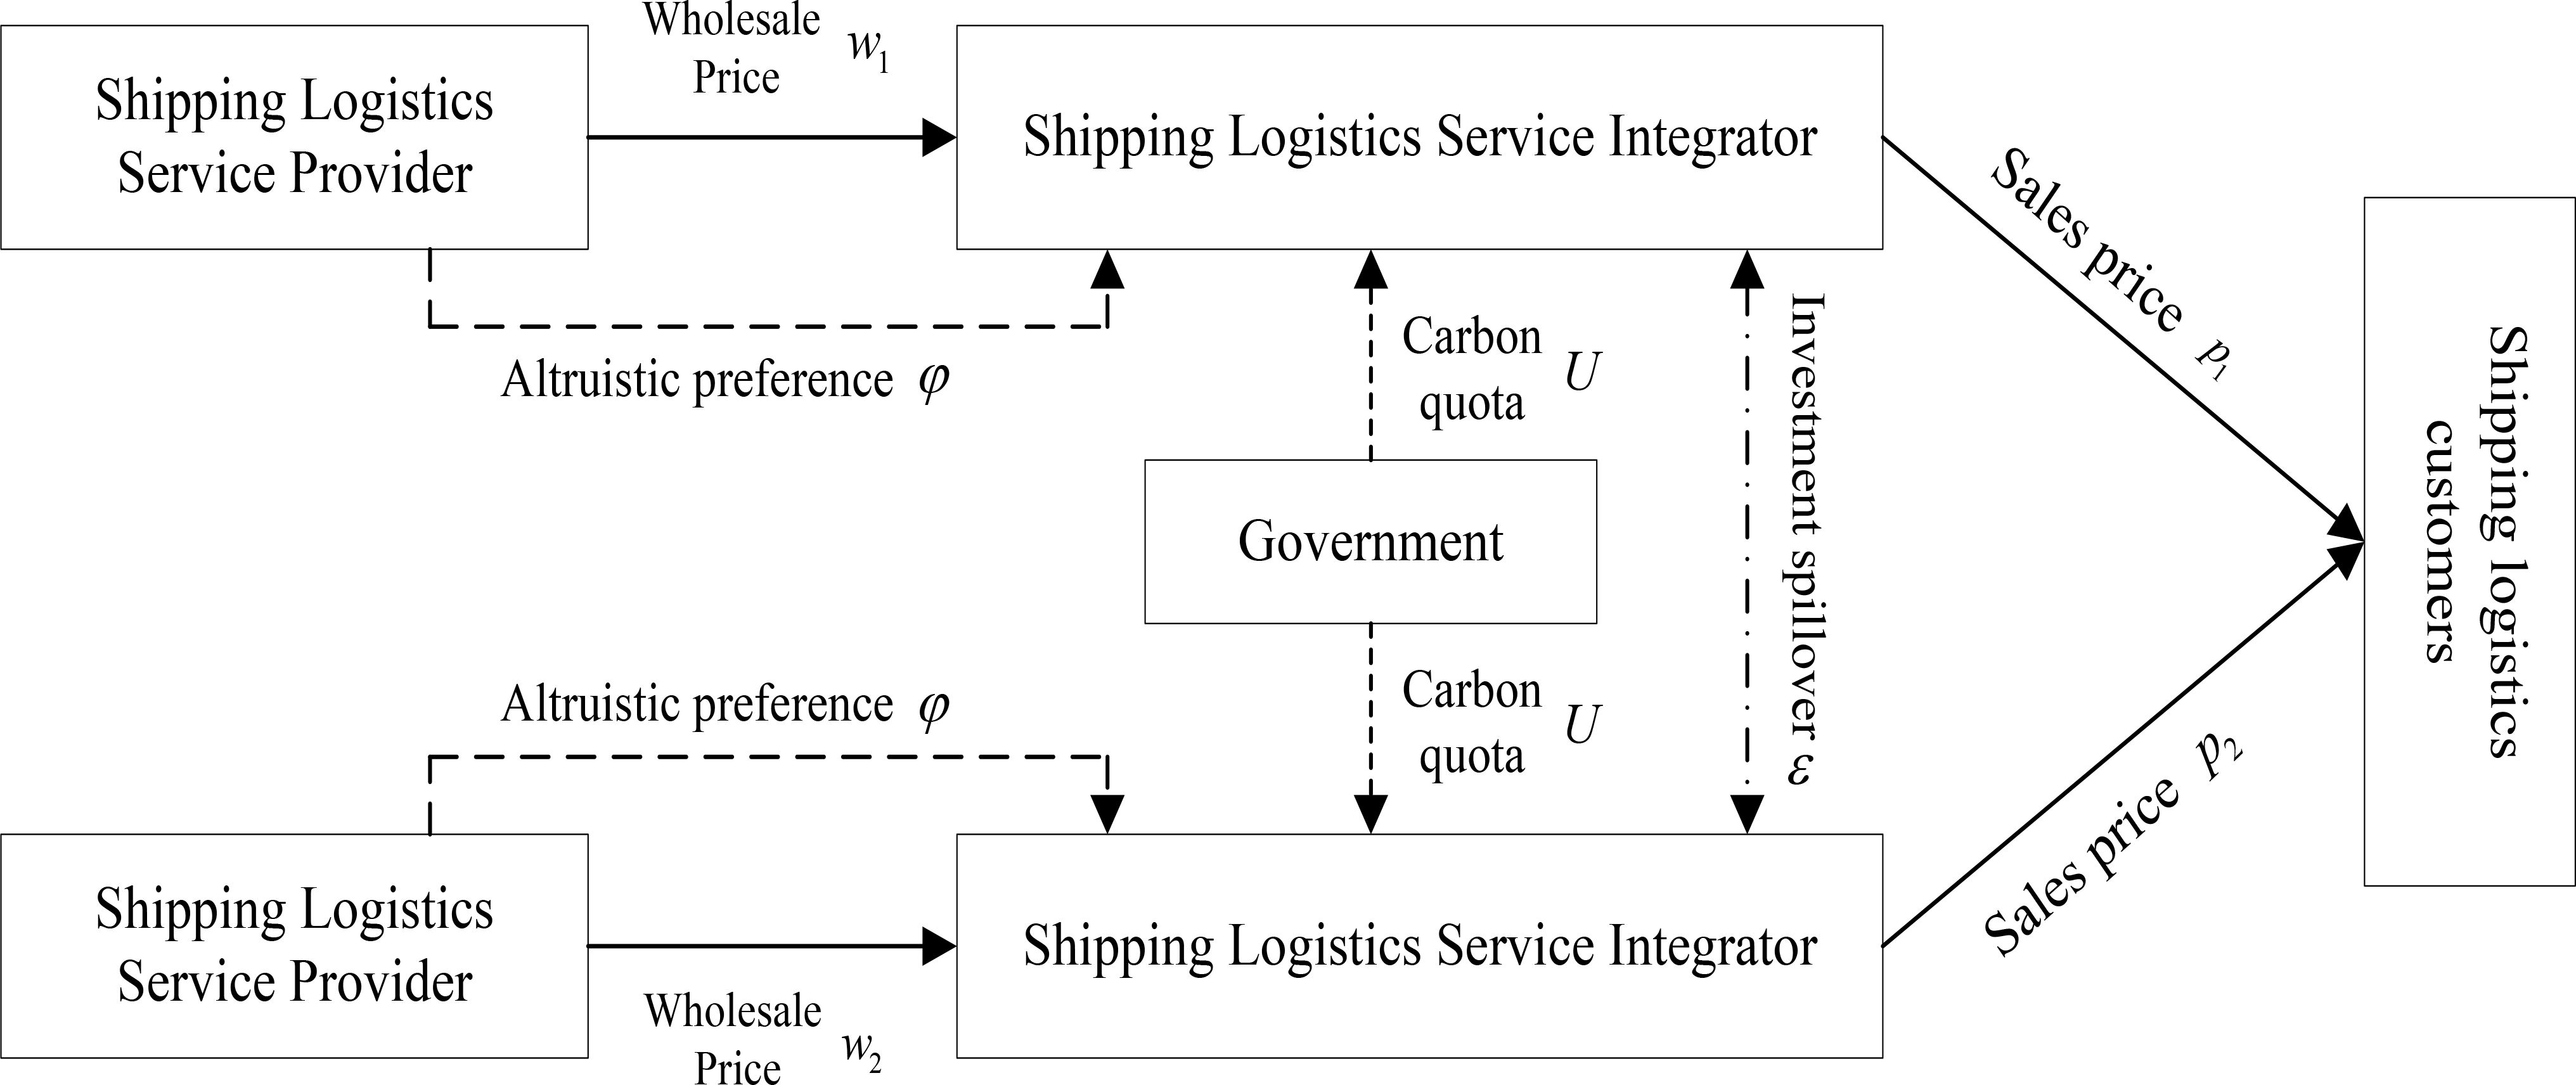
Figure 1. Model of emission-reduction investment in competitive SLSSCs under carbon cap-and-trade mechanisms.
Table 1. Parameter descriptions.
The parameters used in this study are described in Table 1.
This section begins with the formulation of the baseline model without emission-reduction investment (NN), the single-chain emission-reduction investment model (YN), and the dual-chain emission-reduction investment model (YY). Then, optimal pricing and service decisions are solved for the two SLSPs and the two SLSIs under each of the three models. These solutions serve as the foundational basis for subsequent discussions relevant to the effect of emission-reduction investments by SLSIs. Based on the widespread application of linear demand functions in the operations-related literature (Liu et al., 2020; Dong et al., 2023), this study assumes that the market demands faced by two SLSSCs can be represented by and while . In this equation, stands for the maximum market demand for shipping logistics services, () is the degree of substitution between the two SLSSCs, indicates completely nonsubstitutable, represents partially substitutable, and means totally substitutable.
This section details the construction of a baseline model (NN) where neither of the two chains invests in emission reduction. The profit function of the SLSP within the supply chain can be expressed as follows: (). This yields the corresponding profit functions for SLSSC 1 and SLSSC 2 as follows:
In Equations 1, 2, the first part calculates the service revenue of each SLSP, and the second part computes the service costs of each SLSP.
Similarly, the profit function of SLSIs in SLSSC can be written as (). The profit functions of the SLSIs in the two SLSSCs are shown below:
In Equations 3, 4, the first part represents the sales revenue of each SLSI, and the second part represents the SLSI’s costs (or revenue) in purchasing (selling) insufficient (excess) carbon allowances in the carbon trading market.
In the preceding context, it is assumed that both SLSPs in the two SLSSCs have altruistic preferences. Based on the literature on altruistic preferences (Wang et al., 2021; Yu et al., 2024), the utility function expression for SLSPs in SLSSC is . The utility functions of the SLSPs in the two chains are as follows:
In Equations 5 and 6, the first part gives the profit of the SLSP, and the second part gives the partial profit of the SLSI.
Since the two single-chain emission-reduction investment models (YN)/(NY) are almost identical, without loss of generality, this study solely discusses (YN), which supposes that the SLSI in SLSSC 1 implements emission-reduction investments while the SLSI in SLSSC 2 does not. In this scenario, the profit functions of the SLSPs in the two chains are as follows:
In Equations 7, 8, the first part represents the service revenue of the SLSP, and the second part represents the service cost of the SLSP.
Similarly, the profit functions of the SLSIs in the two SLSSCs can be written as follows:
In Equations 9, 10, the first part represents the sales revenue of the SLSI. The second part represents the costs (or revenue) of the SLSI in purchasing (selling) insufficient (excess) carbon allowances in the carbon trading market. Note that the third part of Equation 9 represents the expenditure cost of SLSI 1 for implementing emission-reduction investments.
Suppose the providers in both SLSSCs have altruistic preferences. The utility functions of the SLSPs in the two chains are as follows:
In Equations 11, 12, the first part represents the profit of the SLSP, and the second part represents a portion of the profit of the SLSI.
Regarding the dual-chain emission-reduction investment model (YY), the SLSIs in both SLSSCs implement emission-reduction investments. In this situation, the profit functions of the SLSPs in the two chains are expressed by the following equations:
In Equations 13, 14, the first part represents the service revenue of the SLSP, and the second part represents the logistics service cost of the SLSP.
Similar to the abovementioned expressions, the profit functions of the SLSIs in the two SLSSCs are as follows:
In Equations 15, 16, the first part represents the sales revenue of the SLSI. The second part represents the costs (or revenue) of the SLSI in purchasing (selling) insufficient (excess) carbon allowances in the carbon trading market. The third part of Equations 15 and 16 shows the expenditure costs of SLSI 1 and SLSI 2 for implementing emission-reduction investments.
Given the altruistic preferences of the providers in the two SLSSCs, the utility functions of the SLSP in the two supply chains are as follows:
In Equations 17, 18, the first part represents the profit of the SLSP, and the second part represents a portion of the profit of the SLSI.
This section explores the social welfare aspects of the above models with no emission-reduction investment (NN), single-chain emission-reduction investment (YN), and dual-chain emission-reduction investment (YY). It includes the social cost of initial carbon allowances allocated by the government, total revenues of the SLSPs in the two SLSSCs, total revenues of the SLSIs in the two SLSSCs, and consumer surplus. In consideration of cost convexity, and referring to previous studies, the square of the initial government carbon emission quota is perceived as the social cost while consumer surplus in the SLSSC market is as follows:
The expression of social welfare is
Under the carbon cap-and-trade policy, the decision sequence for competitive SLSSCs is as follows. First, the government sets the free carbon allowances for SLSI 1 and SLSI 2 () to maximize social welfare. Second, SLSP 1 and SLSP 2 in the two SLSSCs independently set their individual wholesale prices per unit of logistics service and to maximize their utility. Third, based on government carbon allowances and wholesale prices per unit of logistics service set by the SLSPs, SLSI 1 and SLSI 2 independently decide whether to implement emission-reduction investments and set the unit sales prices and for logistics services to maximize their own profits. By searching for solutions in reverse order, the decisions of the SLSPs and SLSIs in the two SLSSCs can be obtained, as detailed in Theorem 1.
Theorem 1 Under the three emission-reduction investment models within the carbon cap-and-trade policy, the Table 1 in the Appendix shows the optimal logistics service prices for the SLSPs in the two SLSSCs (, ), the optimal unit logistics service sales prices for integrators (, ), and the optimal logistics service order quantities for integrators (, ), where i = NN, YN, YY.
Proof: See the proof of Theorem 1 in the Appendix.
Based on the optimal equilibrium solutions of the providers and integrators in the two SLSSCs shown in Supplementary Table 1, the Chinese government determines the optimal initial carbon allowances for the two SLSIs with the maximization of social welfare, as detailed in Proposition 1.
Proposition 1 The optimal carbon allowances freely allocated by the government to the SLSIs in the two SLSSCs can be expressed as , where i = NN, YN, YY.
Proof: See the proof of Proposition 1 in the Appendix.
We can see in Proposition 1 that the government allocation of free carbon allowances to SLSIs in SLSSC is positively correlated with the unit carbon emission trading price (). In a competitive environment, when the government allocates carbon allowances, the unit carbon emission trading price in the carbon market is the main factor rather than the position of the allocation entities in SLSSC. As the unit carbon emission trading price increases, economic supply-and-demand theory suggests more indications. A higher unit trading price indicates that the demand for carbon allowances exceeds the current supply of carbon allowances. This means that enterprises do not have enough carbon allowances to fit their carbon emission constraints; thus, they will need to receive higher government-allocated carbon allowances or purchase additional allowances from the market to meet their emission targets. Since excessively high carbon trading prices could place a heavy burden on enterprises and affect the stable operation of the entire market, the government and regulatory authorities might need to relax policy measures to control price fluctuations. Measures could include adjusting the allocation of allowances and introducing offset mechanisms, among others. The purpose is to guide market expectations and promote innovation and development in the carbon trading market.
This section presents an analysis based on the government’s optimal allocation of free carbon allowances to compare the equilibrium solutions of three models: the baseline model without emission-reduction investment (NN), the single-chain emission-reduction investment model (YN), and the dual-chain emission-reduction investment model (YY). Furthermore, it analyzes the effects of these three investment modes on the profits of SLSPs, SLSIs, and the overall supply chain in the two SLSSCs.
This section analyzes the profits of integrators under three investment models, (NN), (YN), and (YY), and studies the corresponding effects and interrelationships. It provides a basis for the SLSIs in the two SLSSCs to make optimal investment decisions, as detailed in Proposition 2.
Proposition 2
(1) If , and , the following expressions exist:
if , then ;
if , then ;
if , then ;
if , then ; and
if , then .
(2) If , and , the following expressions exist:
if , then ;
if , then ;
if , then ;
if , then ; and
if , then .
Proof: See the proof of Proposition 2 in the Appendix, with detailed expressions of , , , , , and .
The findings below can be obtained according to Proposition 2. Under different investment strategies, the profits of the SLSIs in the two SLSSCs are influenced by the interrelationship between the unit carbon emission trading price (), the spillover effect of emission-reduction investments by SLSIs (), and the cost coefficient of emission-reduction investments by SLSIs (). There are two coexisting constraint conditions for the three strategies, (NN), (YN), and (YY). In Proposition 2, (1) some SLSIs’ spillover effects of emission-reduction investments are high ( and ). In Proposition 2, (2) the unit trading prices of some carbon emissions are low, and the spillover effect of emission-reduction investments by SLSIs is low ( and ). When the unit trading price of carbon emissions is high, and the spillover effect of emission-reduction investments by SLSIs is low, only strategies YY and NN exist for SLSIs 1 and 2 while strategy YN does not exist.
Proposition 2 part (1) explores the scenario where the spillover effect of emission-reduction investments by SLSIs is high. If the emission-reduction investment cost coefficients of the two SLSIs are below the threshold (i.e., ), the profits of the two SLSIs are optimal when adopting YY. When selecting YN, the profits of SLSI 1 are higher than those of SLSI 2, but both are less than those generated by strategy YY. The profits are the least when adopting strategy NN. Similar to , if the emission-reduction investment cost coefficient of the SLSI is within the interval , the best strategy for optimizing profits is YY while the strategy with the least profits is NN. However, the profits of SLSI 2 are higher than those of SLSI 1 under the single-chain emission-reduction investment strategy YN. This indicates that when the cost coefficient of the emission-reduction investments of SLSIs () is less than a specific threshold ()—that is, when the investment efficiency is high-the YY strategy will increase the profits of SLSIs 1 and 2. Meanwhile, the NN strategy can reduce the profits of SLSIs 1 and 2. As the investment cost coefficient further increases (i.e., investment efficiency further decreases), the profit of SLSI 1 gradually becomes lower than that of SLSI 2. When , the profits of SLSIs 1 and 2 are optimal under strategy YY. However, profits are the lowest for SLSI 1 when adopting strategy YN or NN. When , SLSIs have different optimal solutions. The profit of SLSI 1 is optimal under strategy YY but lower than that of SLSI 2 under strategy YN, and it is the lowest under strategy YN. The profit of SLSI 2 is optimal under strategy YN and the lowest under strategy NN. When , the profit of SLSI 1 is optimal when adopting strategy NN and the lowest when adopting strategy YN. The profit of SLSI 2 is optimal when adopting strategy YN and the lowest when adopting strategy YY. This indicates that when the cost coefficient () of emission-reduction investments by SLSIs is above a specific threshold ()-that is, when investment efficiency is low-the single-chain emission-reduction investment strategy YN of SLSI 1 reduces its own profits, keeping it at the lowest level. By contrast, SLSI 2 benefits from the spillover effect of emission-reduction investment. Strategy YN increases the profit of SLSI 2. However, when investment efficiency decreases to a certain level, strategy YY reduces the profits of SLSIs 1 and 2. In summary, based on the symmetry of the emission-reduction investment model, when only one SLSSC chooses the emission-reduction investment strategy, it increases the profit of the SLSI in the investing chain while reducing that of the integrator in the no-investment chain. When both SLSSCs consistently choose the investment strategy, the profit of SLSIs is higher under the dual-chain investment strategy than under the no emission-reduction investment strategy.
Part (2) in Proposition 2 is different from part (1), which illustrates the situation of low unit trading prices for carbon emissions and low spillover effects of emission-reduction investments by SLSIs. If the emission-reduction investment cost coefficients of the two SLSIs are below the threshold (), the profit of SLSI 1 is the highest under strategy YN and the lowest when adopting strategy NN. Regarding SLSI 2, strategy YY is the optimal strategy, and YN corresponds to the least profits. This shows that the single-chain emission-reduction investment strategy YN can increase the profit of SLSI 1 while decreasing that of SLSI 2. When the emission-reduction investment cost coefficients of the two SLSIs are within the interval , the profit of SLSI 1 is the highest when adopting strategy YN and lowest when adopting strategy YY; the profit of SLSI 2 is the highest under strategy NN and lowest under strategy YN. Therefore, the emission-reduction investment strategy in SLSSC can increase the profit of SLSI 1 in the investment chain and decrease the profit of SLSI 2 in the no-investment chain. However, some conclusions differ from those in the interval . Owing to the gradual decrease in investment efficiency, when the two SLSSCs have the same emission-reduction investment strategy, the profit is lower under strategy YY than under strategy NN. When , the profit of SLSI 1 is the highest when adopting strategy YN and lowest when adopting strategy YY; the profit of SLSI 2 is the highest under strategy NN and lowest under strategy YY. We can see that the dual-chain emission-reduction investment strategy of SLSIs further reduces their profits. When the emission-reduction investment cost coefficients of the two SLSIs are within the interval and , the optimal strategy for both SLSIs is NN while YY is the least-preferred strategy. In other words, as the cost coefficient increases above a certain threshold (), strategy YY will reduce the profits of SLSIs 1 and 2. As investment efficiency gradually decreases, the profit of SLSI 1 under strategy YN becomes lower than that of SLSI 2.
This section analyzes the profits of SLSPs under three investment models: the baseline model without emission-reduction investment, the single-chain emission-reduction investment model, and the dual-chain emission-reduction investment model. It examines the effect of different investment models on the profits of SLSPs, as detailed in Proposition 3.
Proposition 3
(1) If and , then .
(2) If and , then .
Proof: See the proof of Proposition 3 in the Appendix, with detailed expressions of , , , and .
Instructive information can be obtained from Proposition 3. The profits of the SLSPs in the two SLSSCs under different investment strategies are influenced by the interrelationship between the unit carbon emission trading price () and the spillover effects of emission-reduction investments by SLSIs (). The coexistence of three strategies, (NN), (YN), and (YY), requires the following constraints. In Proposition 3 part (1), the spillover effect of emission-reduction investments by SLSIs is high ( and ). In Proposition 3 part (2), the unit trading price of carbon emissions is low and with a low spillover effect of emission-reduction investments by SLSIs ( and ). When the unit trading price of carbon emissions is high and the spillover effect of emission-reduction investments by SLSIs is low, only strategies YY and NN exist in the two SLSSCs while strategy YN does not exist. The conclusions are as follows.
Part (1) of Proposition 3 considers the scenario in which the spillover effect of SLSIs’ emission-reduction investments is high. When SLSP 1 adopts strategy YY, its profit is the highest, and it is the lowest when adopting strategy NN. Similarly, when SLSP 2 adopts strategy YY, its profit is the highest, and it is the lowest when adopting strategy NN. This indicates that the dual-chain emission-reduction investment strategy can increase the profits of SLSP 1 and SLSP 2 while the base model without emission-reduction investments will decrease their profits. Under strategy YN, SLSP 1’s profit is higher than SLSP 2’s, which shows that the single-chain emission-reduction investment strategy can increase the profit of SLSP 1 but decrease that of SLSP 2. According to the symmetry of the model, when only one SLSSC implements the emission-reduction investment strategy, the provider’s profit increases in the investment chain and decreases in the no-investment chain. When both SLSSCs implement the emission-reduction investment strategy, the dual-chain investment strategy results in higher profits for the providers than in the base model without emission-reduction investments.
Different from part (1) of Proposition 3, section (2) considers the scenario in which both the unit trading price of carbon emissions and the spillover effect of the SLSI’s emission-reduction investments are low. In this case, the profit of SLSP 1 is the highest when adopting strategy YN and the lowest when adopting strategy NN. Similarly, the profit of SLSP 2 is the highest when adopting strategy YY and the lowest when adopting strategy YN. This indicates that the single-chain emission-reduction investment strategy can increase the profit of SLSP 1 while decreasing that of SLSP 2. Conversely, the base model without emission-reduction investments can decrease the profits of both SLSSCs 1 and 2. Then, similar to part (1), when only one SLSSC implements the emission-reduction investment strategy, the provider’s profit increases in the investment chain and decreases in the no-investment chain. When both chains implement the emission-reduction investment strategy, the dual-chain investment strategy results in higher profits for the providers than in the base model without emission-reduction investments.
This section analyzes the profits of SLSSCs under three investment modes: the baseline model without emission-reduction investment NN, the single-chain emission-reduction investment model YN, and the dual-chain emission-reduction investment model YY. The analysis includes the effect of different investment models on supply chain profits, as detailed in Proposition 4.
Proposition 4
(1) If and , then the following conclusions exist:
when , then ;
when , then ;
when , then ;
when , then ; and
when , the .
(2) If and , then the following conclusions exist:
when , then ;
when , then ;
when , then ;
when , then ; and
when , then .
Proof: See the proof of Proposition 4 in the Appendix, with detailed expressions of , , , and .
Part (1) of Proposition 4 considers the high spillover effects of emission-reduction investments by SLSIs. If the emission-reduction investment cost coefficient of SLSIs is below a certain threshold (i.e., ), the total profits of SLSSCs 1 and 2 are the highest under strategy YY. When adopting the YN strategy, the total profit of SLSSC 1 is higher than that of SLSSC 2. The total profits of both SLSSCs 1 and 2 are lowest when adopting the NN strategy. Similar to the scenario, if the emission-reduction investment cost coefficient is within the range of , the total profits of the two SLSSCs are the highest when adopting strategy YY and the lowest when adopting strategy NN. However, under the single-chain emission-reduction investment strategy YN, the total profit of SLSSC 2 is higher than that of SLSSC 1. When the emission-reduction investment cost coefficient () is below a specific threshold ()-that is, when investment efficiency is high-the YY strategy will increase the total profits of SLSSCs 1 and 2. Conversely, the strategy will decrease their total profits. Moreover, as investment efficiency further decreases, the total profit of SLSSC 1 gradually becomes lower than that of SLSSC 2. When , the total profits of SLSSCs 1 and 2 are the highest when adopting strategy YY. However, the total profit of SLSSC 1 is the lowest when adopting strategy YN, and the total profit of SLSSC 2 is the lowest when adopting strategy NN. When the total profit of SLSSC 1 is the highest under strategy YY and the lowest under strategy YN. The total profit of SLSSC 2 is the highest when adopting strategy YN and the lowest when adopting strategy NN. When , the total profit of SLSSC 1 is the highest under strategy NN and the lowest under strategy YN. The total profit of SLSSC 2 is the highest when adopting strategy YN and the lowest when adopting strategy YY. In summary, when the investment cost coefficient is low (investment efficiency is high), strategy YY increases the profits of both SLSSC 1 and 2, but strategy NN reduces their profits. Moreover, as the investment cost coefficient increases (investment efficiency decreases), the profit of SLSSC 1 gradually becomes lower than that of SLSSC 2.
Different from part (1), part (2) in Proposition 4 considers the scenario in which both the unit trading price of carbon allowances and the spillover effect of emission-reduction investment by SLSIs are low. If the emission-reduction investment cost coefficient of SLSIs is below a certain threshold (), the total profit of SLSSC 1 is the highest when adopting strategy YN and the lowest when adopting strategy NN. The total profit of SLSSC 2 is the highest under strategy YY and the lowest under strategy YN. This indicates that the single-chain emission-reduction investment strategy YN can increase the total profit of SLSSC 1 while decreasing the total profit of SLSSC 2. From Propositions 2 and 3, we can see that the single-chain emission-reduction investment strategy YN can increase the profits of both SLSI 1 and SLSP 1 in SLSSC 1 while reducing those of SLSI 2 and SLSP 2 in SLSSC 2. These findings suggest that implementing an emission-reduction investment strategy YN in only one SLSSC will increase the total profit of the chain that invests while reducing that of the chain that does not invest. When both SLSSCs have the same investment behavior-that is, YY or NN -the total profit under the dual-chain emission-reduction investment strategy YY is higher than that under the no emission-reduction investment strategy NN. When the carbon reduction investment cost coefficient of the SLSI lies within the interval , the total profit of SLSSC 1 is the highest when adopting strategy YN and the lowest when adopting strategy YY. The total profit of SLSSC 2 is the highest when adopting strategy NN and the lowest when adopting strategy YN. Within this range, the single-chain emission-reduction investment strategy YN can also increase the profit of SLSSC 1 while reducing that of SLSSC 2. However, when both SLSSCs adopt the emission-reduction investment strategy YY, the total profit is lower than that under the no emission-reduction investment strategy NN. When the carbon reduction investment cost coefficient of the SLSI lies within the interval of either or , the total profits of both SLSSC 1 and 2 are the highest when adopting strategy NN and the lowest when adopting strategy YY. In the corresponding interval, the no-investment strategy NN can increase the total profits of SLSSCs 1 and 2 while the emission-reduction investment strategy YY decreases the total profit of both supply chains. However, under the single-chain emission-reduction investment strategy YN, when the emission-reduction investment cost coefficient of SLSSC 1 exceeds the threshold , the total profit of SLSSC 1 is lower than that of SLSSC 2. Similar to Propositions 2 and 3, it is known that when the unit trading price of carbon emissions is high and the spillover effect of emission-reduction investment is low, SLSSCs 1 and 2 only have strategies YY and NN and do not have strategy YN.
This section analyzes the game theory situation of emission-reduction investments by shipping and logistics integrators within SLSSCs, investigating the optimal equilibrium investment decisions of SLSSC 1 and SLSSC 2, as detailed in Proposition 5.
Proposition 5
(1) If and , when , the equilibrium decision for the two SLSSCs is strategy YY; when , the equilibrium decision is strategy YN; and when , the equilibrium decision is strategy NN.
(2) If and , when , the equilibrium decision of the two SLSSCs is strategy YY; when , the equilibrium decision is strategy NN.
(3) If and , when , the equilibrium decision of the two SLSSCs is strategy YY; when , the equilibrium decision is strategy YN; and when , the equilibrium decision is strategy NN.
Proof: See the proof of Proposition 5 in the Appendix.
Proposition 5 indicates that the optimal investment decision for equilibrium in SLSSCs 1 and 2 depends on the relationships among the unit trading price of carbon emissions (), the spillover effect of emission-reduction investments by logistics integrators (), and the cost coefficient of emission-reduction investments by logistics integrators (). Figures 2, 3 provide illustrations.
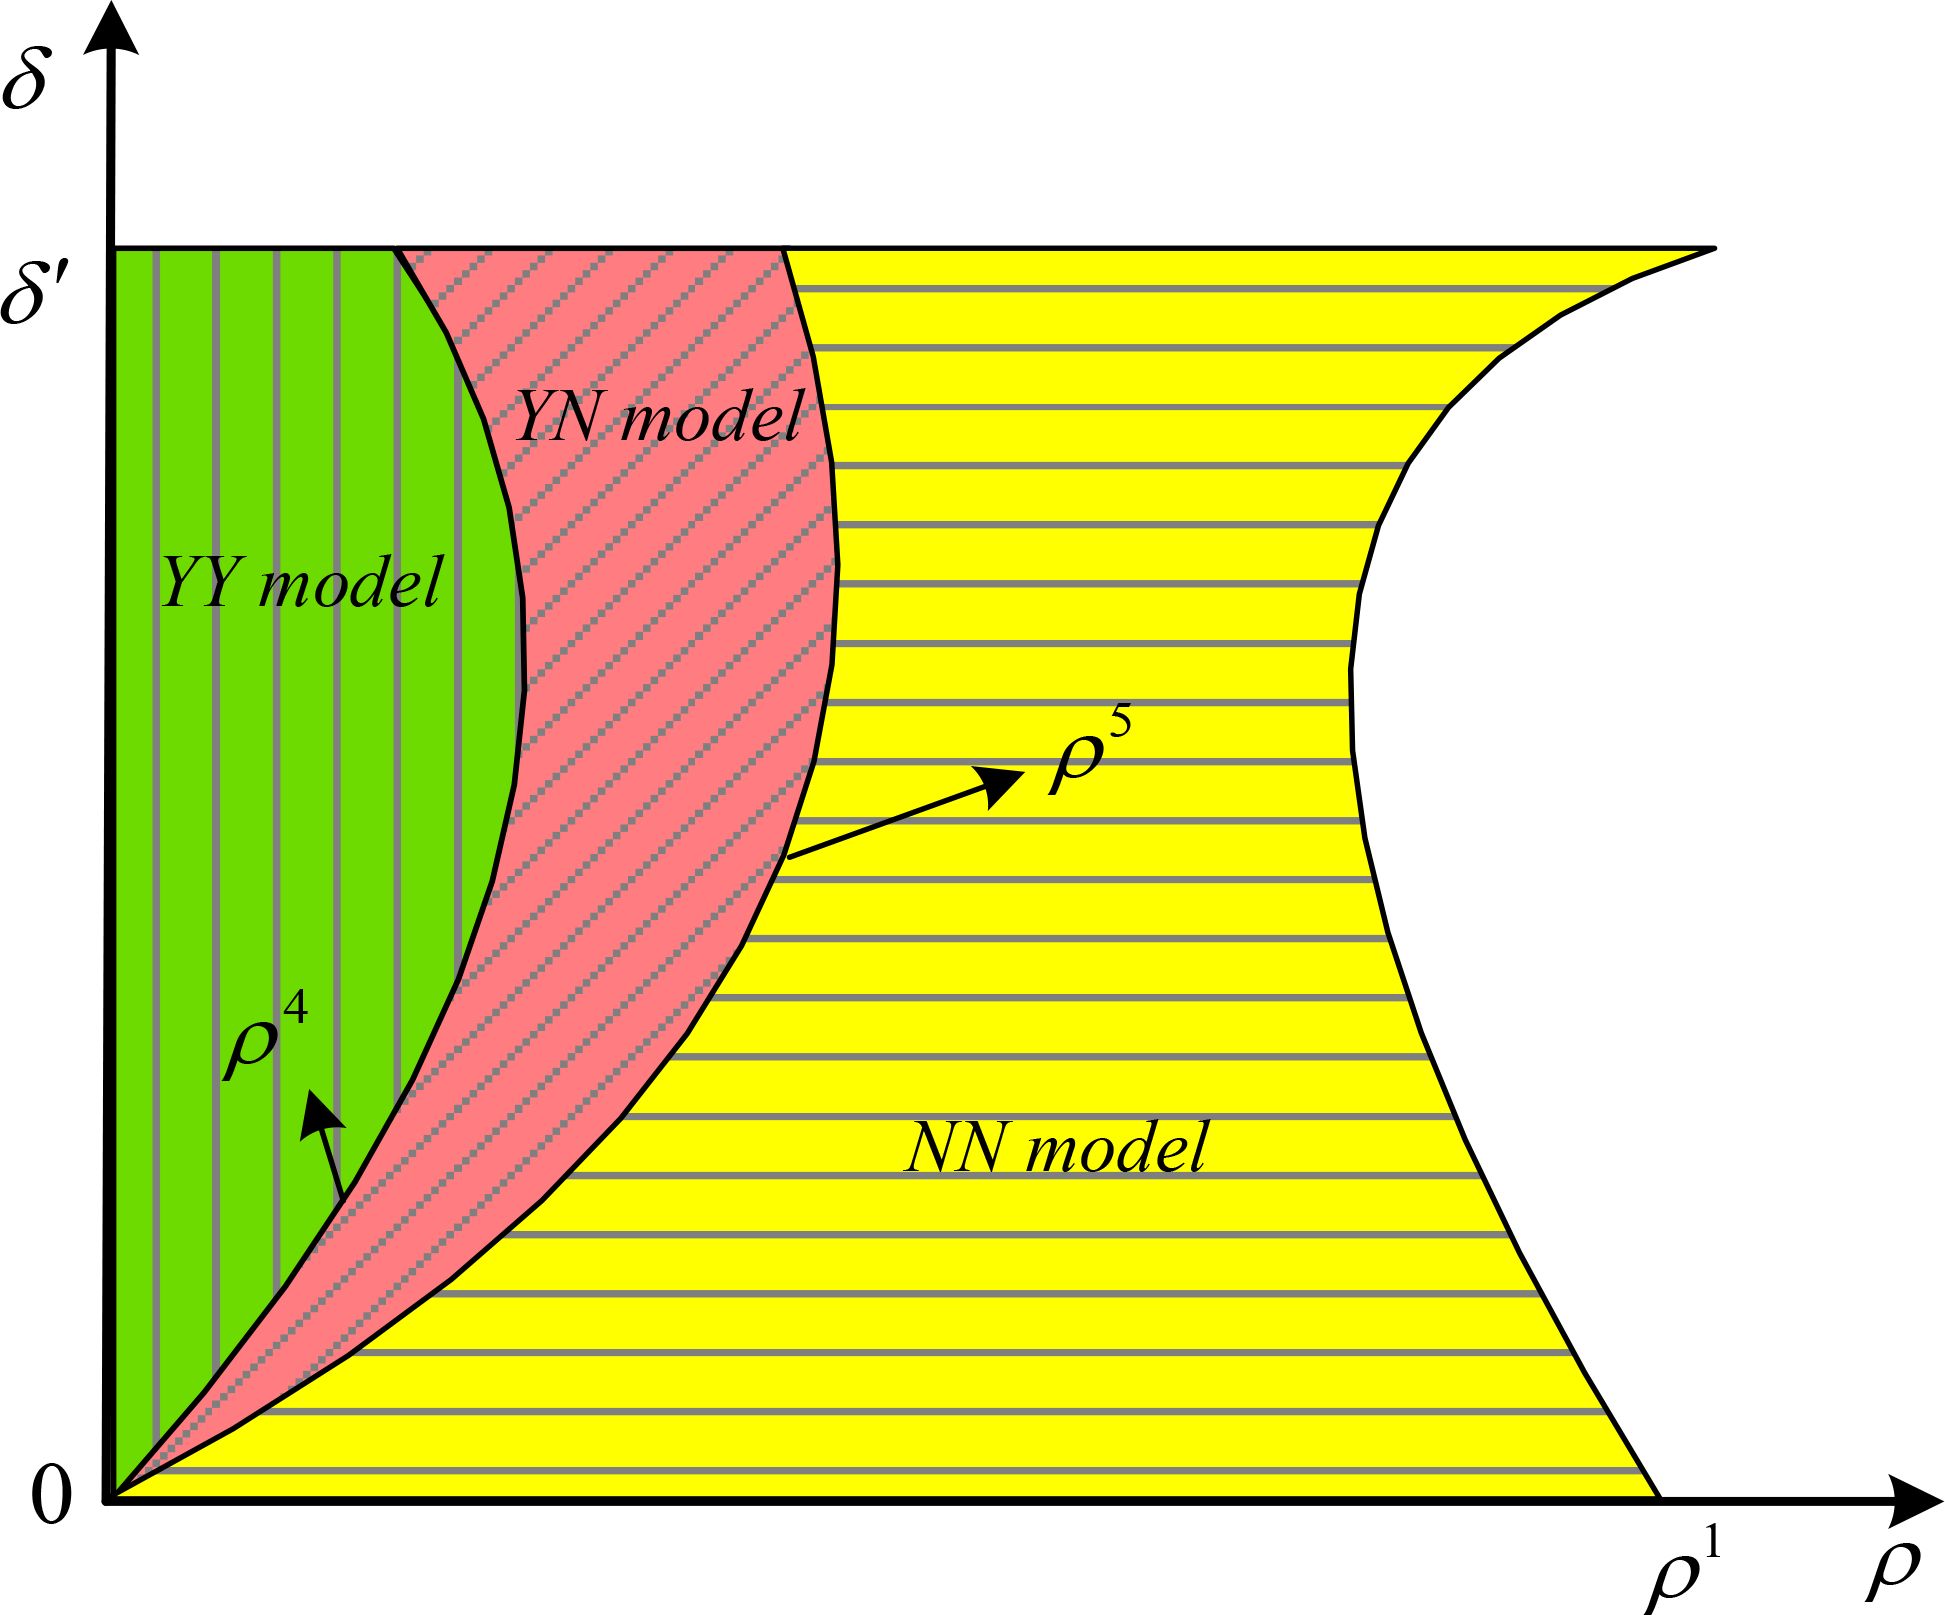
Figure 2. Optimal investment when . Figure 2 shows the equilibrium strategy of the scenario in which the spillover effect of emission-reduction investments by logistics integrators is low (). If the unit trading price of carbon emissions is low (), the strategic selection of the logistics integrators in the two competitive SLSSCs depends on the cost coefficient of emission-reduction investments by logistics integrators (). When the cost coefficient of emission-reduction investments by logistics integrators is in a lower range (), the equilibrium strategy for the two SLSSCs is YY, where logistics integrators in both chains choose to invest in emission reduction. The main reason is that the low spillover effect and high investment efficiency of emission-reduction investments enable logistics integrators to achieve higher profits during the emission-reduction process, thus encouraging them to choose the emission-reduction investment strategy.
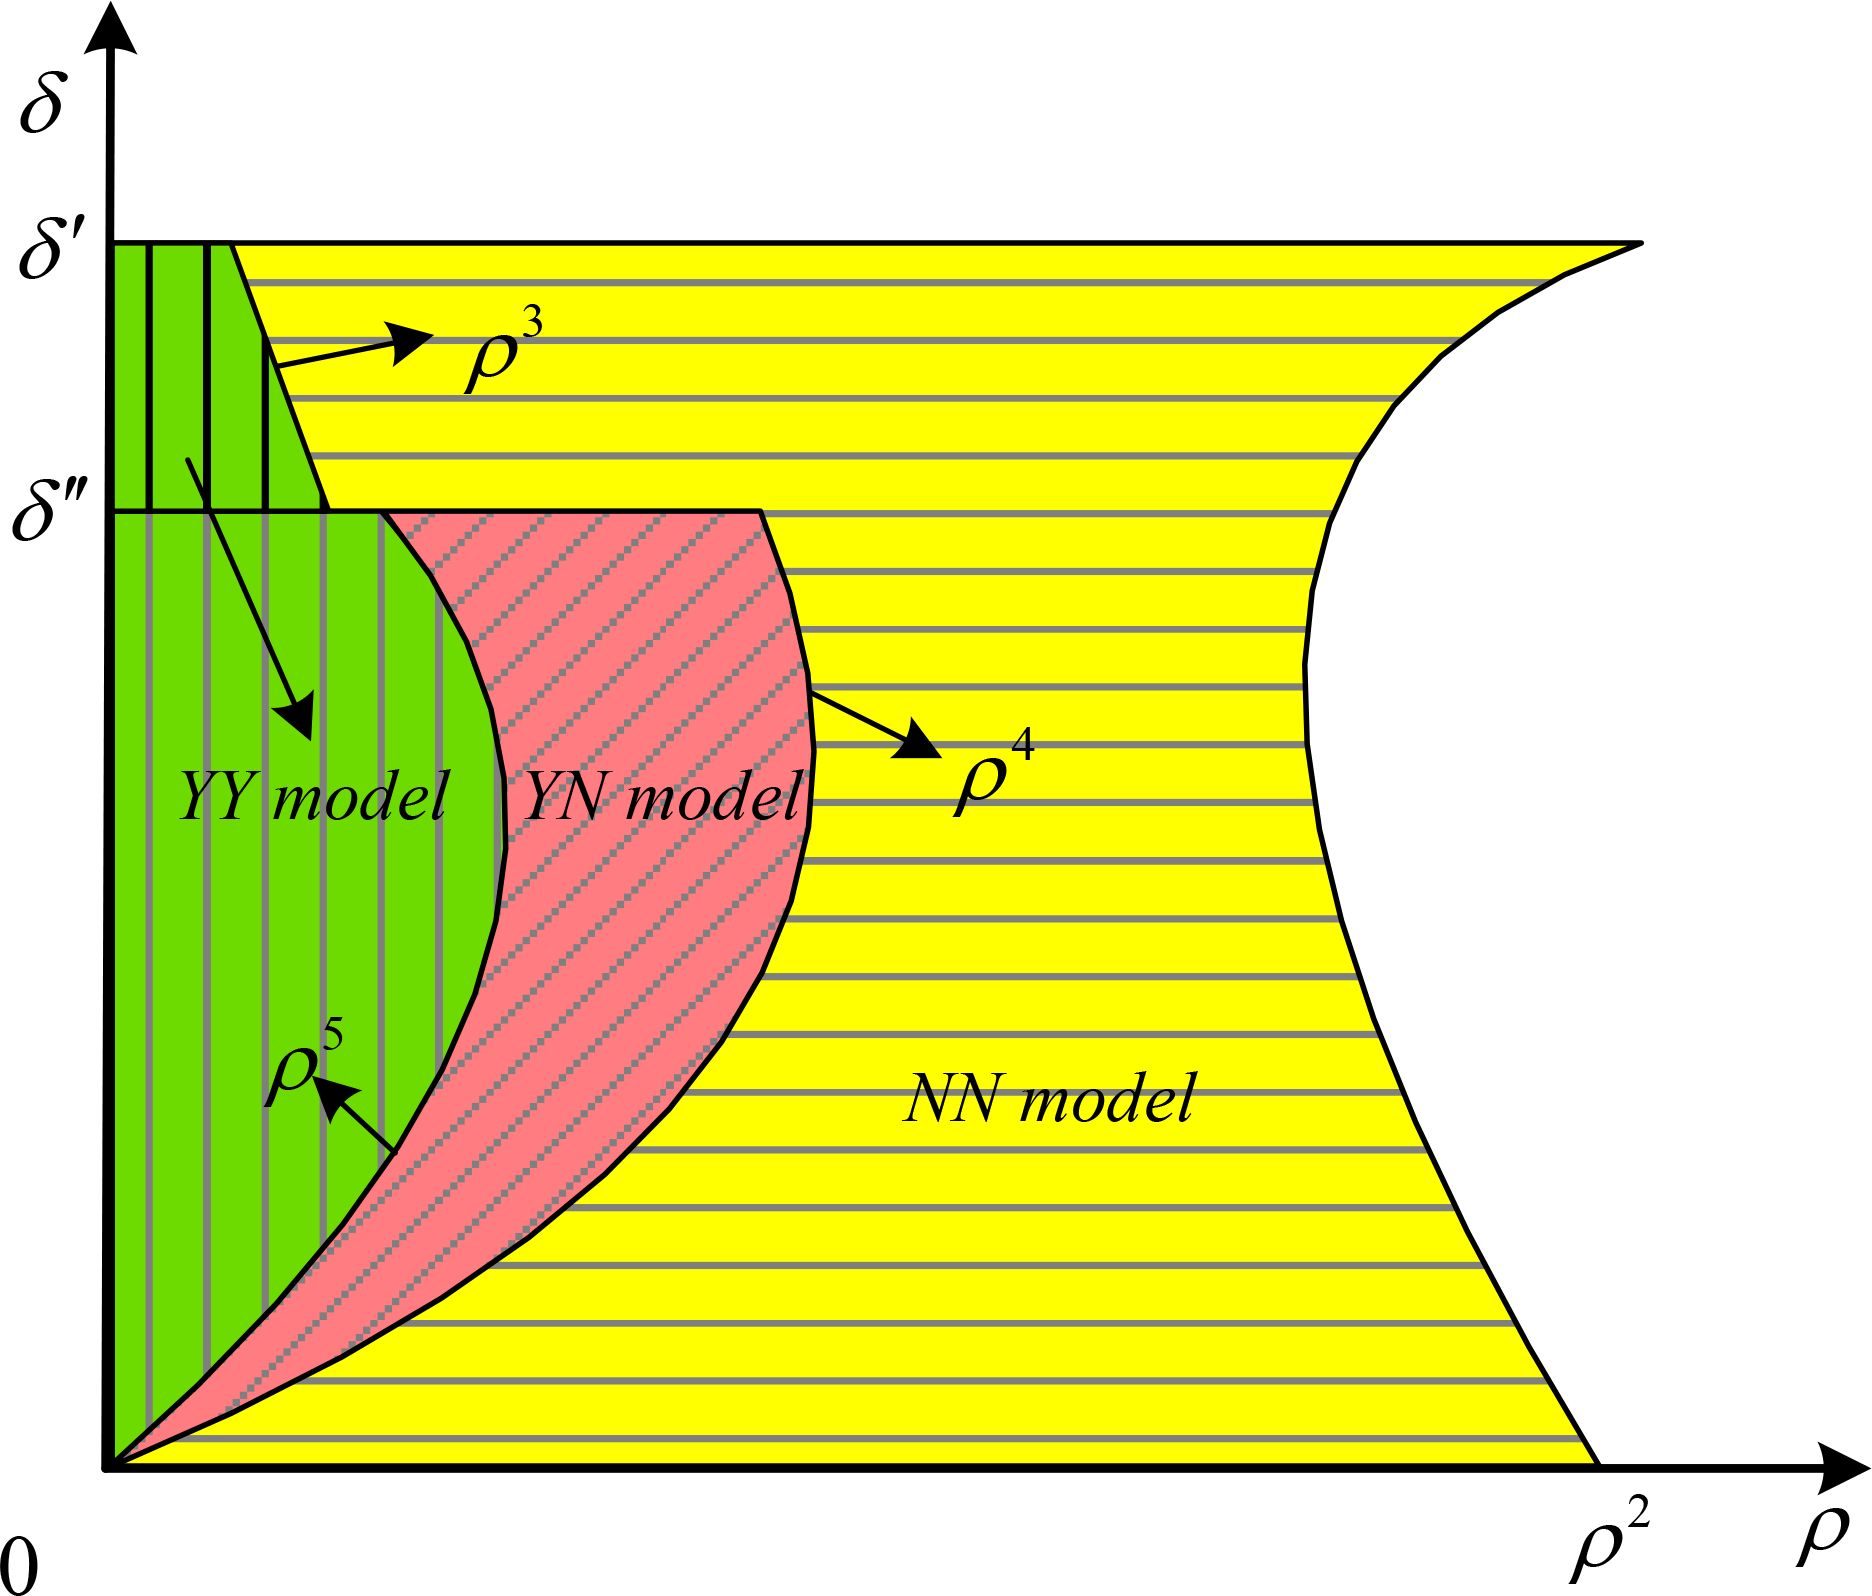
Figure 3. Optimal investment when . Figure 3 shows the equilibrium strategies when the spillover effect of emission-reduction investments by logistics integrators is high (). The strategic choices of the integrators in the two competitive SLSSCs simply depend on the cost coefficient of emission-reduction investments by logistics integrators (). When the cost coefficient of emission-reduction investments by logistics integrators is in a lower range (), the equilibrium strategy for the two chains is YY. The reason is similar to that for the scenario, where high investment efficiency enables integrators to achieve higher profits during the emission-reduction process, leading them to choose the emission-reduction investment strategy. When increases to a specific range (), the equilibrium strategy is YN, where only one of the two SLSSCs chooses to invest in emission reduction. When exceeds a certain threshold (), the equilibrium decision for the two chains is strategy NN. In other words, as investment efficiency continues to decline, logistics integrators in both SLSSCs will choose not to invest in emission reduction.
When the cost coefficient of emission-reduction investments by logistics integrators increases to a specific range (), the equilibrium strategy for the two SLSSCs becomes YN, where only one logistics integrator in chain 1 or 2 chooses to invest in emission reduction. This occurs when investment efficiency decreases to a certain extent, causing the profits from emission reduction for logistics integrators to be lower than the spillover benefits from competitors. Consequently, only one logistics integrator tends toward the emission-reduction investment strategy. When the cost coefficient of emission-reduction investments by logistics integrators exceeds a specific threshold (), the equilibrium strategy for the two SLSSCs is NN, where neither of the logistics integrators in chains 1 and 2 chooses to invest in emission reduction. This is mainly because the excessively low investment efficiency significantly increases the cost of emission-reduction investment for logistics integrators. Additionally, if the unit trading price of carbon emissions is high (), strategy YN does not exist. When the cost coefficient of emission-reduction investment by logistics integrators is in a lower range (), the equilibrium decision for the two SLSSCs is strategy YY. When the cost coefficient of emission-reduction investment by logistics integrators exceeds a specific threshold (), the equilibrium strategy is NN, where neither logistics integrator chooses to invest in emission reduction.
Corollary 1
This section explores the effect of the altruistic preference coefficient () of SLSPs on the equilibrium strategic decisions of logistics integrators. The specific conclusions are as follows:
(1) If , then , .
(2) If or , then . If or , then .
Proof: See the proof of Corollary 1 in the Appendix.
According to Corollary 1, the altruistic preference coefficient () of SLSPs in SLSSC affects the critical thresholds of the decision coefficients , , , and for the emission-reduction investment strategy of logistics integrators. Furthermore, the influence of the altruistic preference coefficient () of SLSPs on the equilibrium strategies of logistics integrators can be determined. It is known that the threshold of the unit trading price of carbon emissions () is a decreasing function of the altruistic preference coefficient () of SLSPs. The reason is that the altruistic preference of SLSPs alters the original optimal decision-making process. A higher altruistic preference coefficient strengthens the operational efficiency of SLSSCs, enhances cooperation between logistics integrators and SLSPs, and facilitates carbon emission trading at higher efficiency levels. The threshold cost coefficients of emission-reduction investments and for logistics integrators are increasing functions of the altruistic preference coefficient () of SLSPs. Additionally, when the altruistic preference coefficient () of SLSPs is relatively low or high, the threshold cost coefficient of emission-reduction investment is an increasing function of the altruistic preference coefficient (). The reasons are as follows. As the altruistic preference coefficient () of SLSPs increases, logistics integrators need to consider the interests of SLSPs more when implementing emission-reduction investments. At the same time, logistics integrators will choose strategies more favorable to SLSPs to maintain ongoing cooperation. This further reduces investment efficiency, increasing the cost coefficient of emission-reduction investments for integrators.
This section analyzes the effect of the optimal equilibrium investment strategies of SLSSCs 1 and 2 on consumer surplus and social welfare, as detailed in Propositions 6 and 7.
This part investigates consumer surplus under the equilibrium strategies with and without emission-reduction investments in the two SLSSCs. It analyzes the effect of equilibrium strategies under different investment models on consumer surplus.
Proposition 6
This section compares the effects of strategies (YY), (YN), and (NN) on consumer surplus. The following conclusions can be drawn: , .
Proof: See the proof of Proposition 6 in the Appendix.
Consumer surplus under strategies YY and YN by SLSSCs 1 and 2 is higher than that under the strategy without emission-reduction investment NN. In other words, the emission-reduction investment strategies of SLSSCs can increase consumer surplus, showing a positive effect on consumers. This demonstrates that, in promoting emission-reduction investments by logistics integrators, SLSSCs have not adopted the approach of compensating for emission-reduction costs by raising the sales price of logistics services, which would harm consumer interests. Instead, they aim to protect consumer rights and increase consumer surplus. Therefore, SLSSCs and downstream consumers both hold a positive attitude toward this approach and are willing to accept and support emission-reduction investments by logistics integrators.
This section explores social welfare under the equilibrium strategies with and without emission-reduction investment in the two SLSSCs. It analyzes the corresponding effect of equilibrium decisions under different investment models on social welfare.
Proposition 7
This section compares the effects of the strategies (YY), (YN), and (NN) on social welfare. The following conclusions can be drawn:
(1) when , then ;
(2) when , then ;
(3) when , then ; and
(4) when , then .
Proof: See the proof of Proposition 7 in the Appendix, with detailed expressions of and .
According to Proposition 7, the relationship between social welfare under strategies (YY), (YN), and (NN) and emission-reduction investments by SLSSCs 1 and 2 depends on the cost coefficient () of emission-reduction investments by logistics integrators-that is, the investment efficiency of logistics integrators in the service supply chain. When the cost coefficient of emission-reduction investment () by logistics integrators is below a certain threshold, indicating relatively high investment efficiency, social welfare levels are significantly higher under strategies YY and YN. In this situation, emission-reduction investments by SLSSCs can actively enhance social welfare. However, if the cost coefficient of emission-reduction investment () exceeds the specified threshold, reflecting low investment efficiency, social welfare levels under strategies YY and YN will be lower than those under strategy NN. In this case, emission-reduction investments by SLSSCs not only fail to enhance social welfare but might even reduce it.
The Pearl River Delta region of China is at the forefront of the country’s reform and opening-up initiatives and serves as one of the world’s major manufacturing and trade hubs. This region holds a highly strategic position in the international shipping logistics chain. In recent years, driven by the growth in logistics demand from economic development, government policy support and guidance, the urgency of environmental protection, and increasingly stringent international emission reduction standards, shipping logistics enterprises in the Pearl River Delta have implemented effective emission reduction measures. These initiatives not only meet stricter environmental regulations but also actively explore green development pathways tailored to their operations, achieving a win-win outcome for economic benefits and social responsibility. This study selects the shipping logistics service supply chains in the Pearl River Delta as the focus of field research primarily due to the region’s representative business models, scale, and service scope, which effectively reflect common issues in the shipping logistics industry. This section aims to identify simulation parameters through field surveys and interviews, evaluate the application effects of different emission reduction investment strategies in actual business operations, and validate the effectiveness and practicality of the proposed maritime sustainable development strategy model.
This section takes an SLSSC company in the Pearl River Delta as a case study to confirm the reliability of the results. MATLAB is used for numerical simulation to analyze the sensitivity of the spillover effect of the emission-reduction investment and altruistic preference coefficient of SLSPs. Furthermore, it explores their effect on logistics integrators’ profits, logistics providers’ profits, consumer surplus, and social welfare. This section considers the following data: (1) the annual shipping logistics demand of the company = 80 million*tons/kilometer; (2) in SLSSC, the unit logistics cost =40 yuan/ton*kilometer; (3) the initial unit carbon emission =100 grams/ton*kilometer; (4) the difference in unit carbon emissions between emission-reduction measures and traditional measures =20 grams/ton*kilometer; (5) the unit trading price of carbon emissions =0.1 yuan/kilogram (based on the latest carbon trading price in China); (6) the substitution intensity of SLSSC =0.5; and (7) the cost coefficient of emission-reduction investments by logistics integrators =0.5. When considering the spillover effect of emission-reduction investment , assume the altruistic preference coefficient of SLSPs is =0.4. When discussing the effect of the altruistic preference coefficient , the spillover effect of emission-reduction investment is =0.5.
Based on the optimal equilibrium solutions of the basic model without emission-reduction investment NN-YN and YY for the single- and dual-chain emission-reduction investment models, respectively-this section compares the effects of the emission-reduction investment spillover effect of SLSIs () on the profits of SLSPs, the profits of SLSIs, consumer surplus, and social welfare in the two SLSSCs.
This study explores the effect of investment spillover () on the optimal profits of the SLSPs and integrators in the two supply chains, as shown in Figures 4–6.
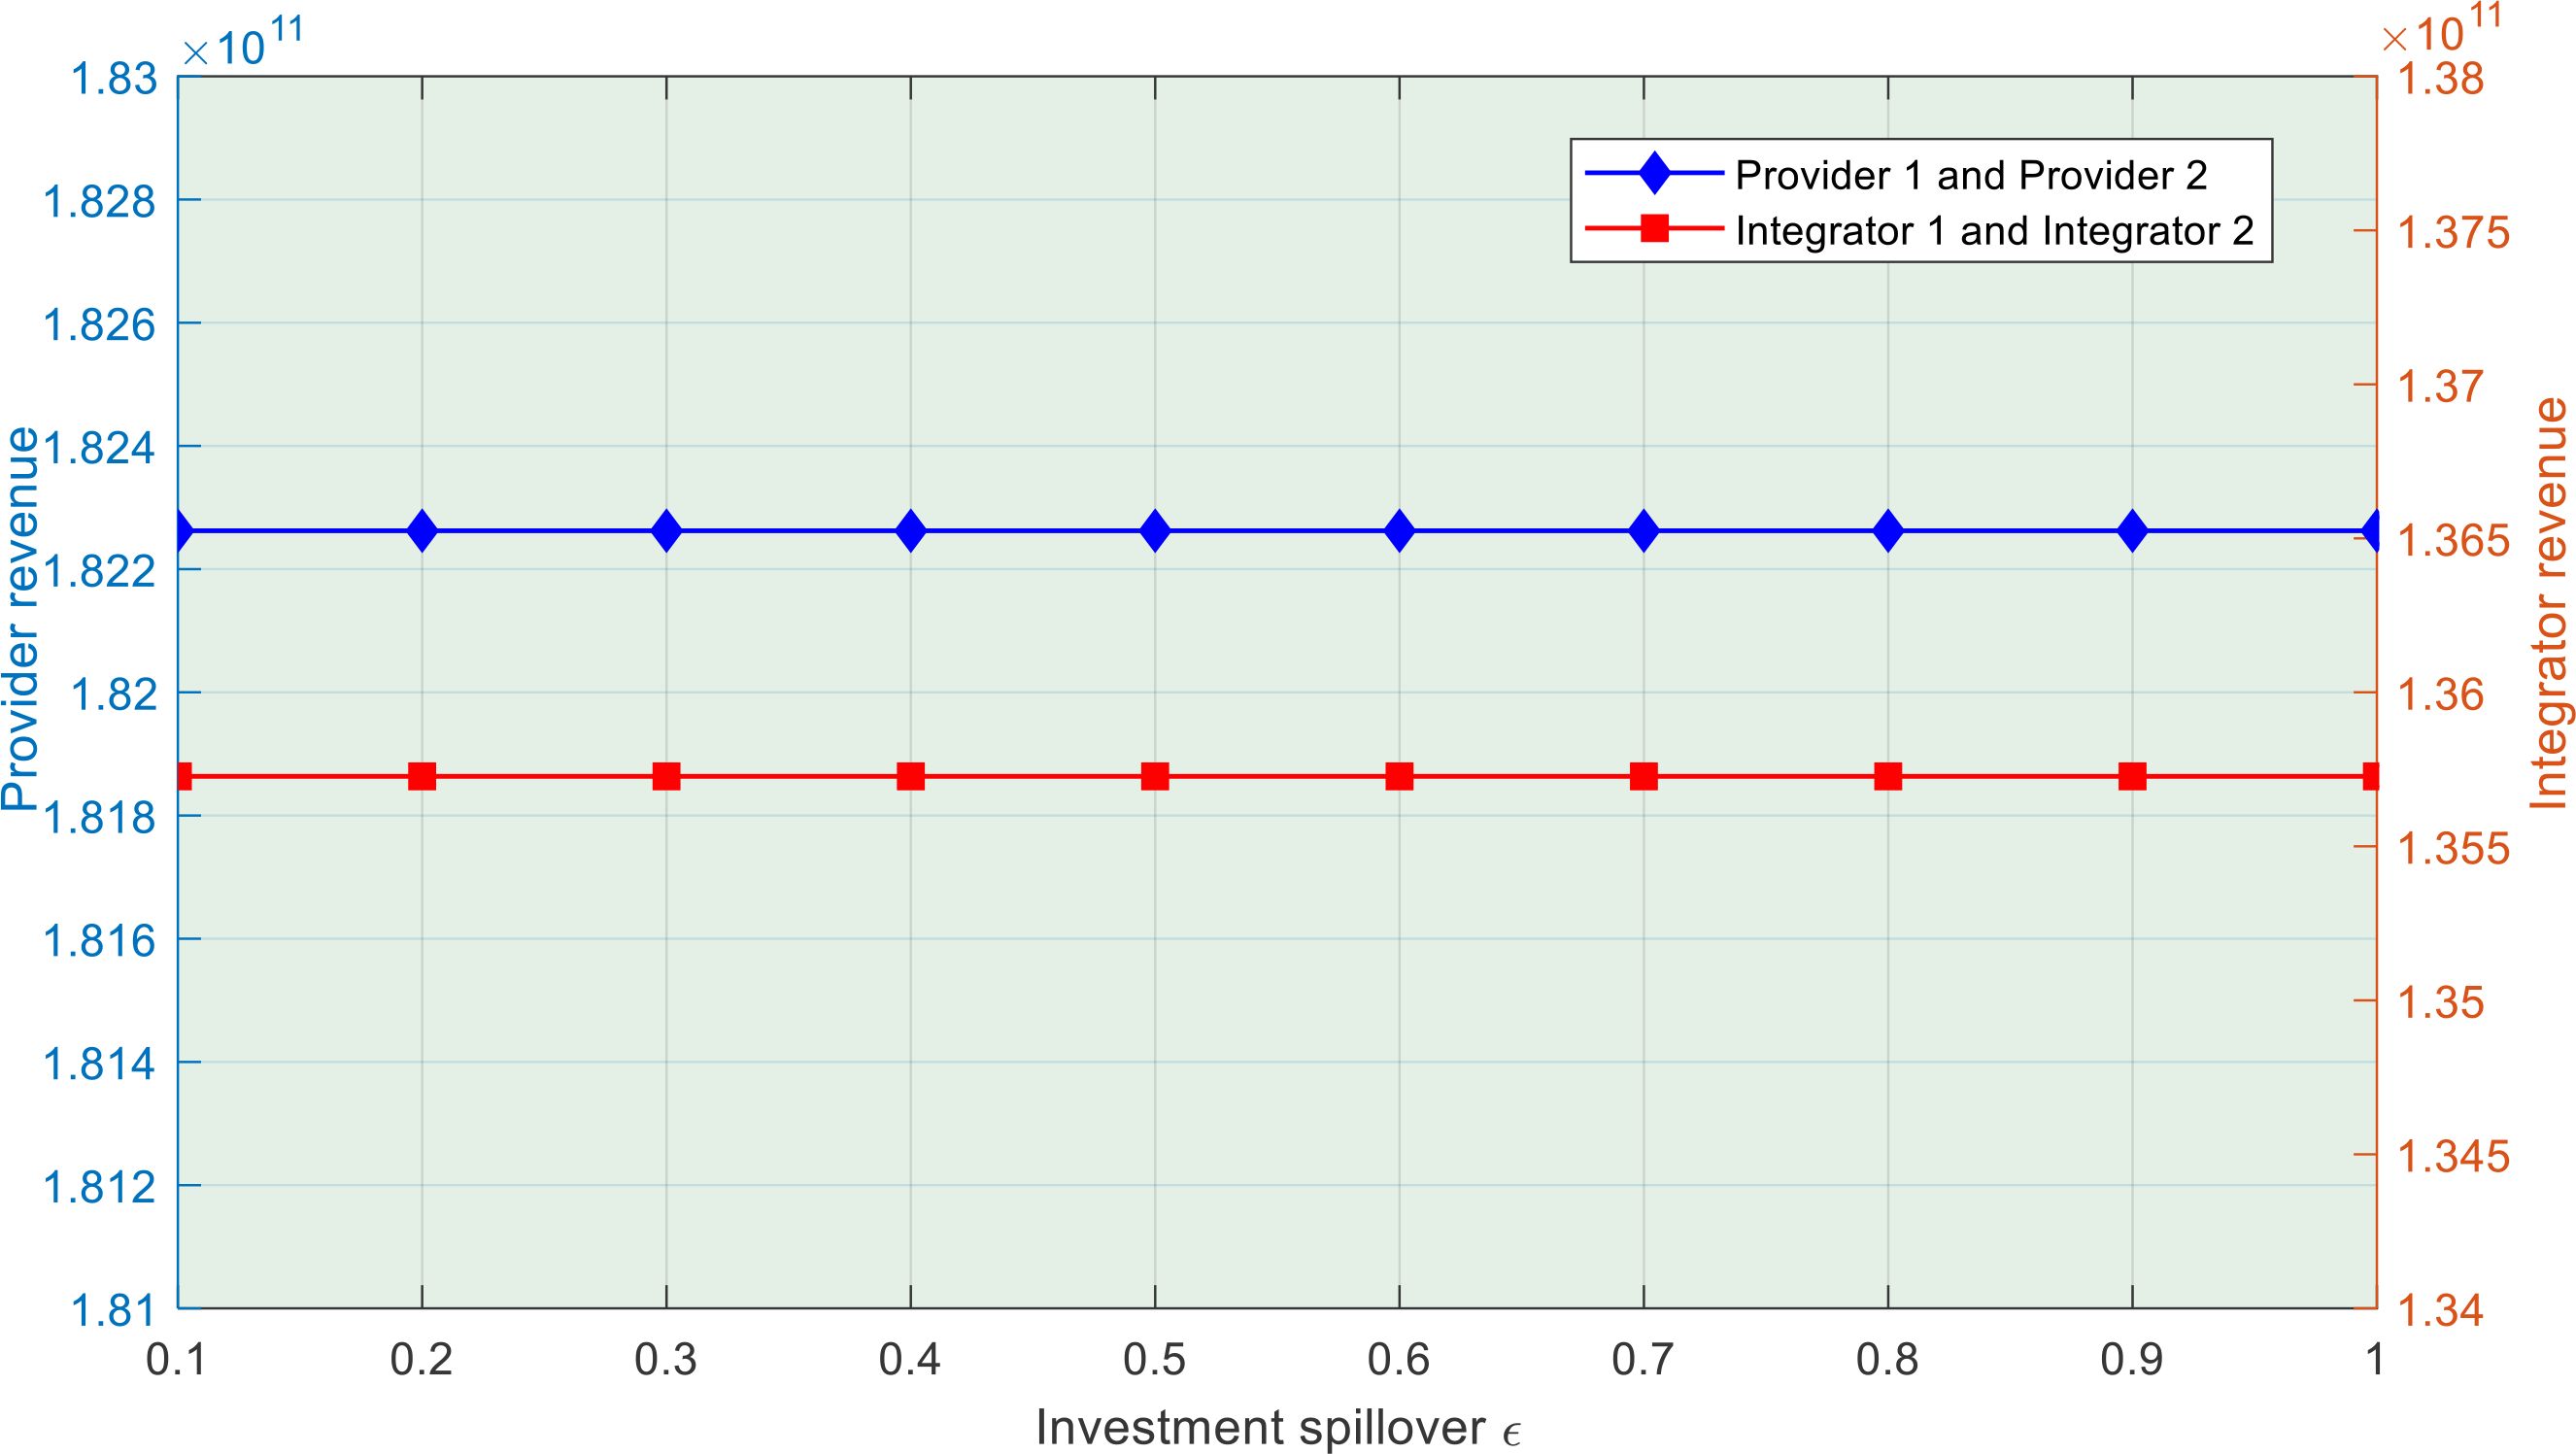
Figure 4. Effect of investment spillover () on the profits of model NN.
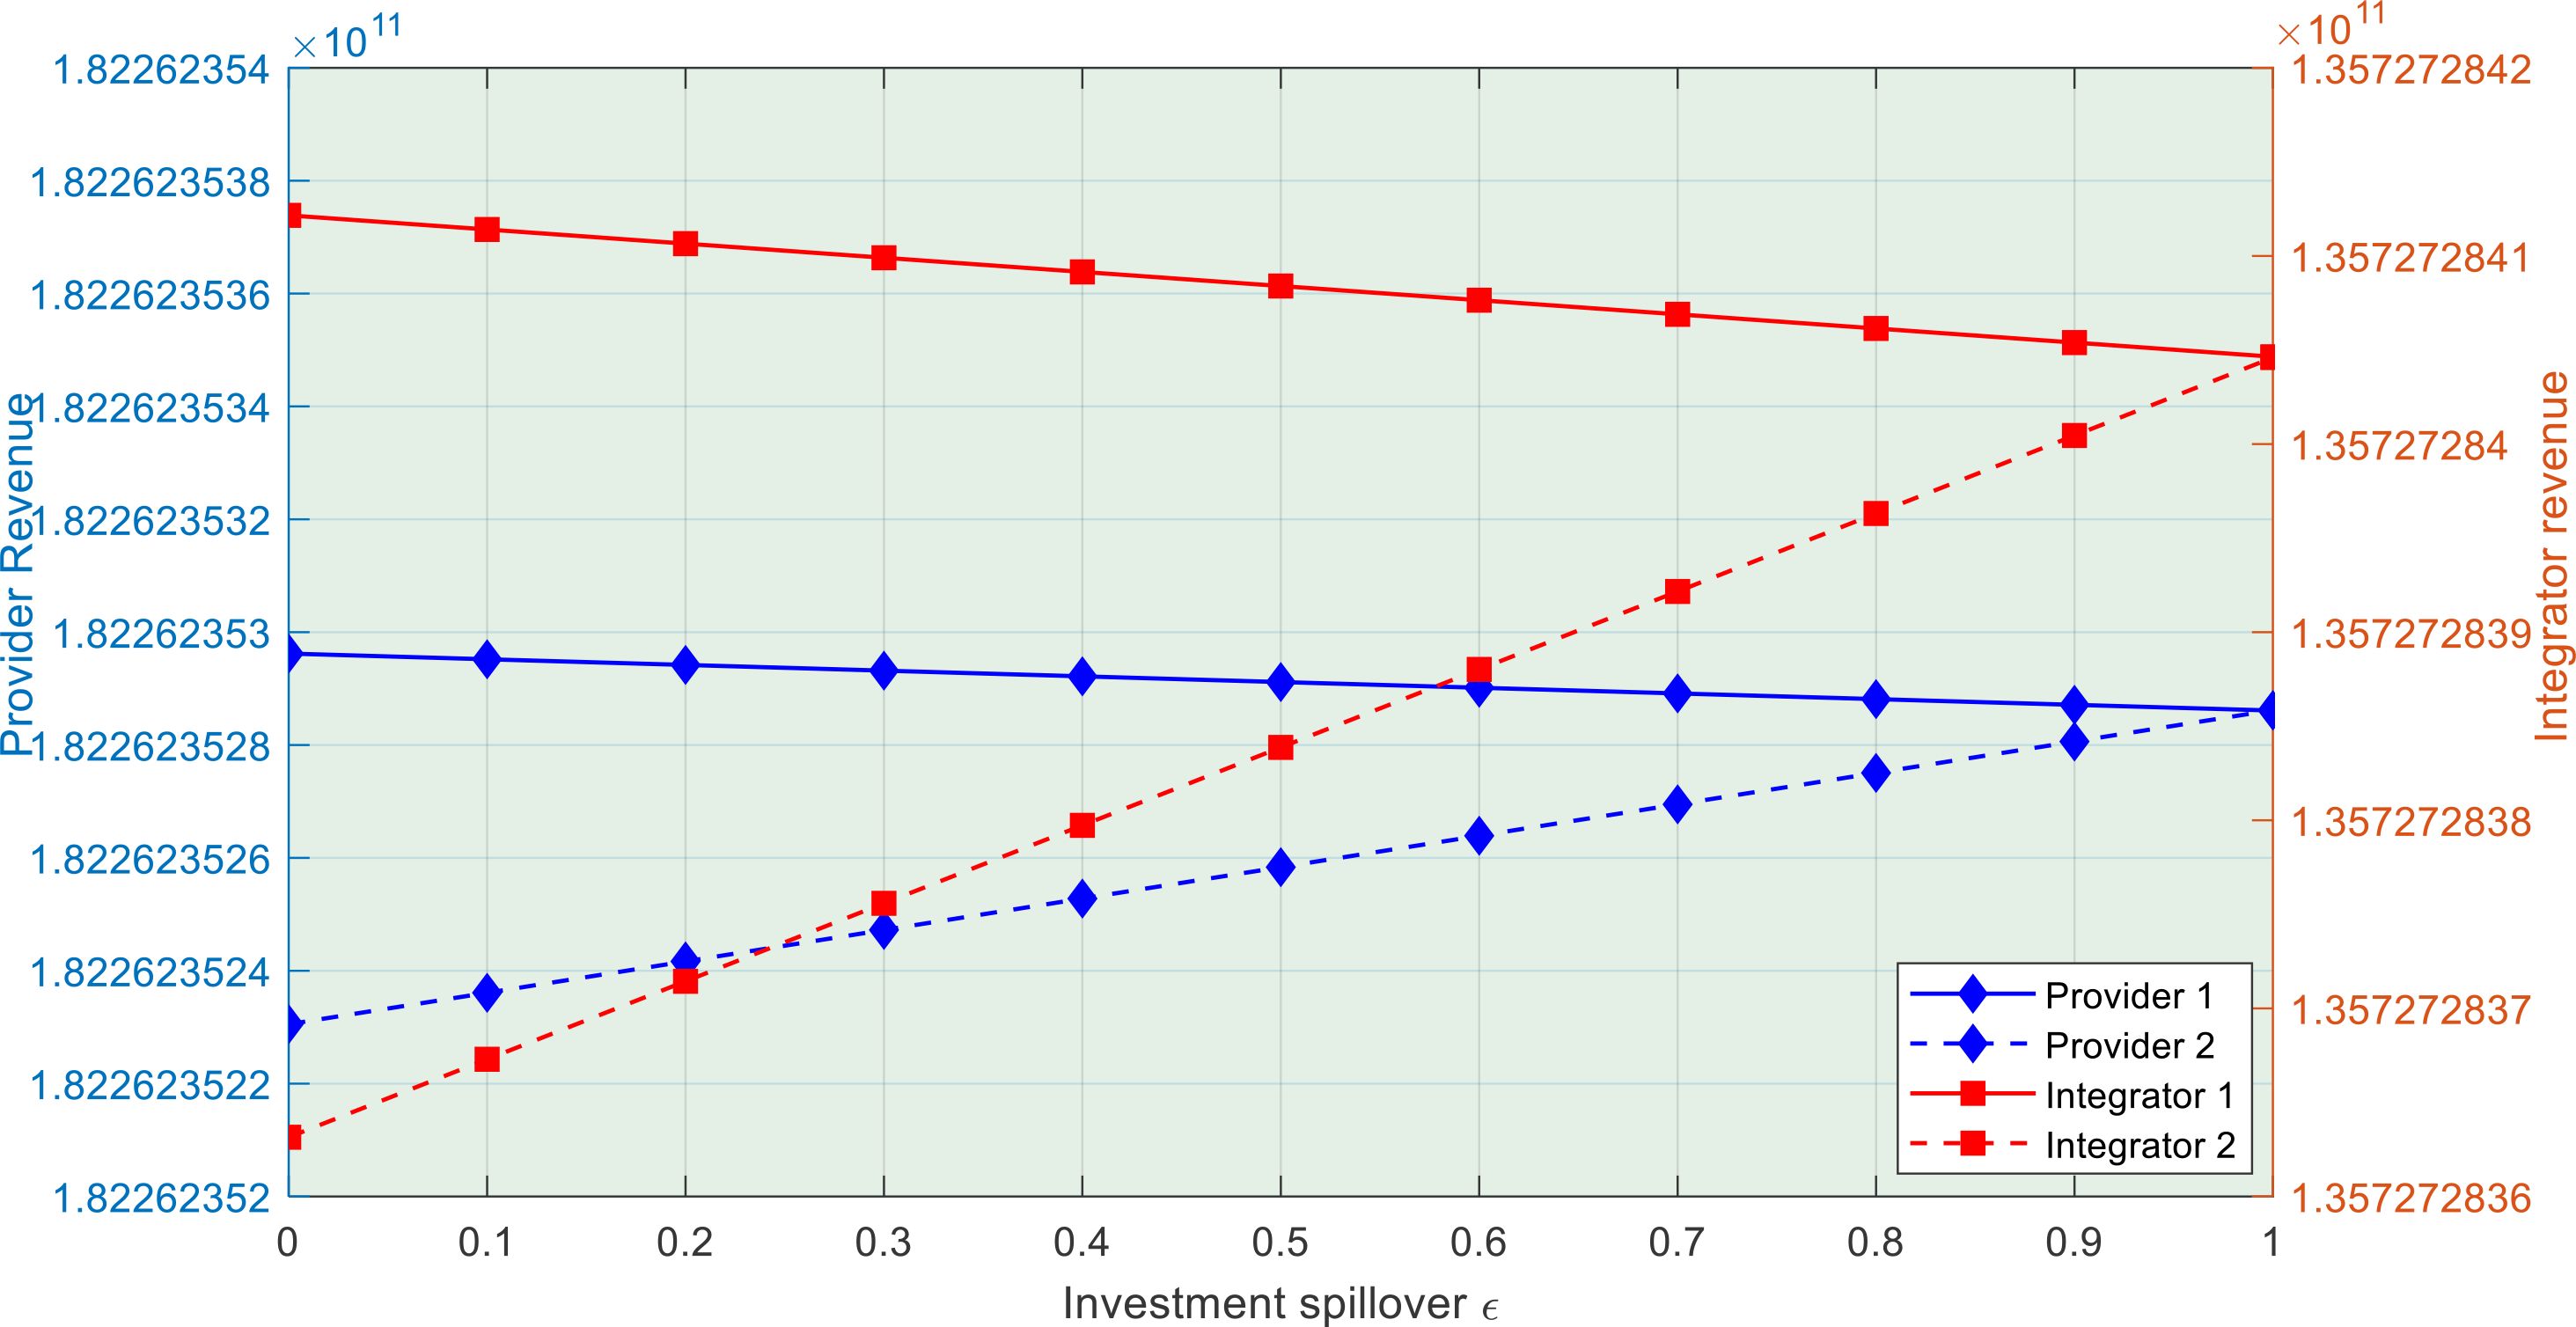
Figure 5. Effect of investment spillover () on the profits of model YN.
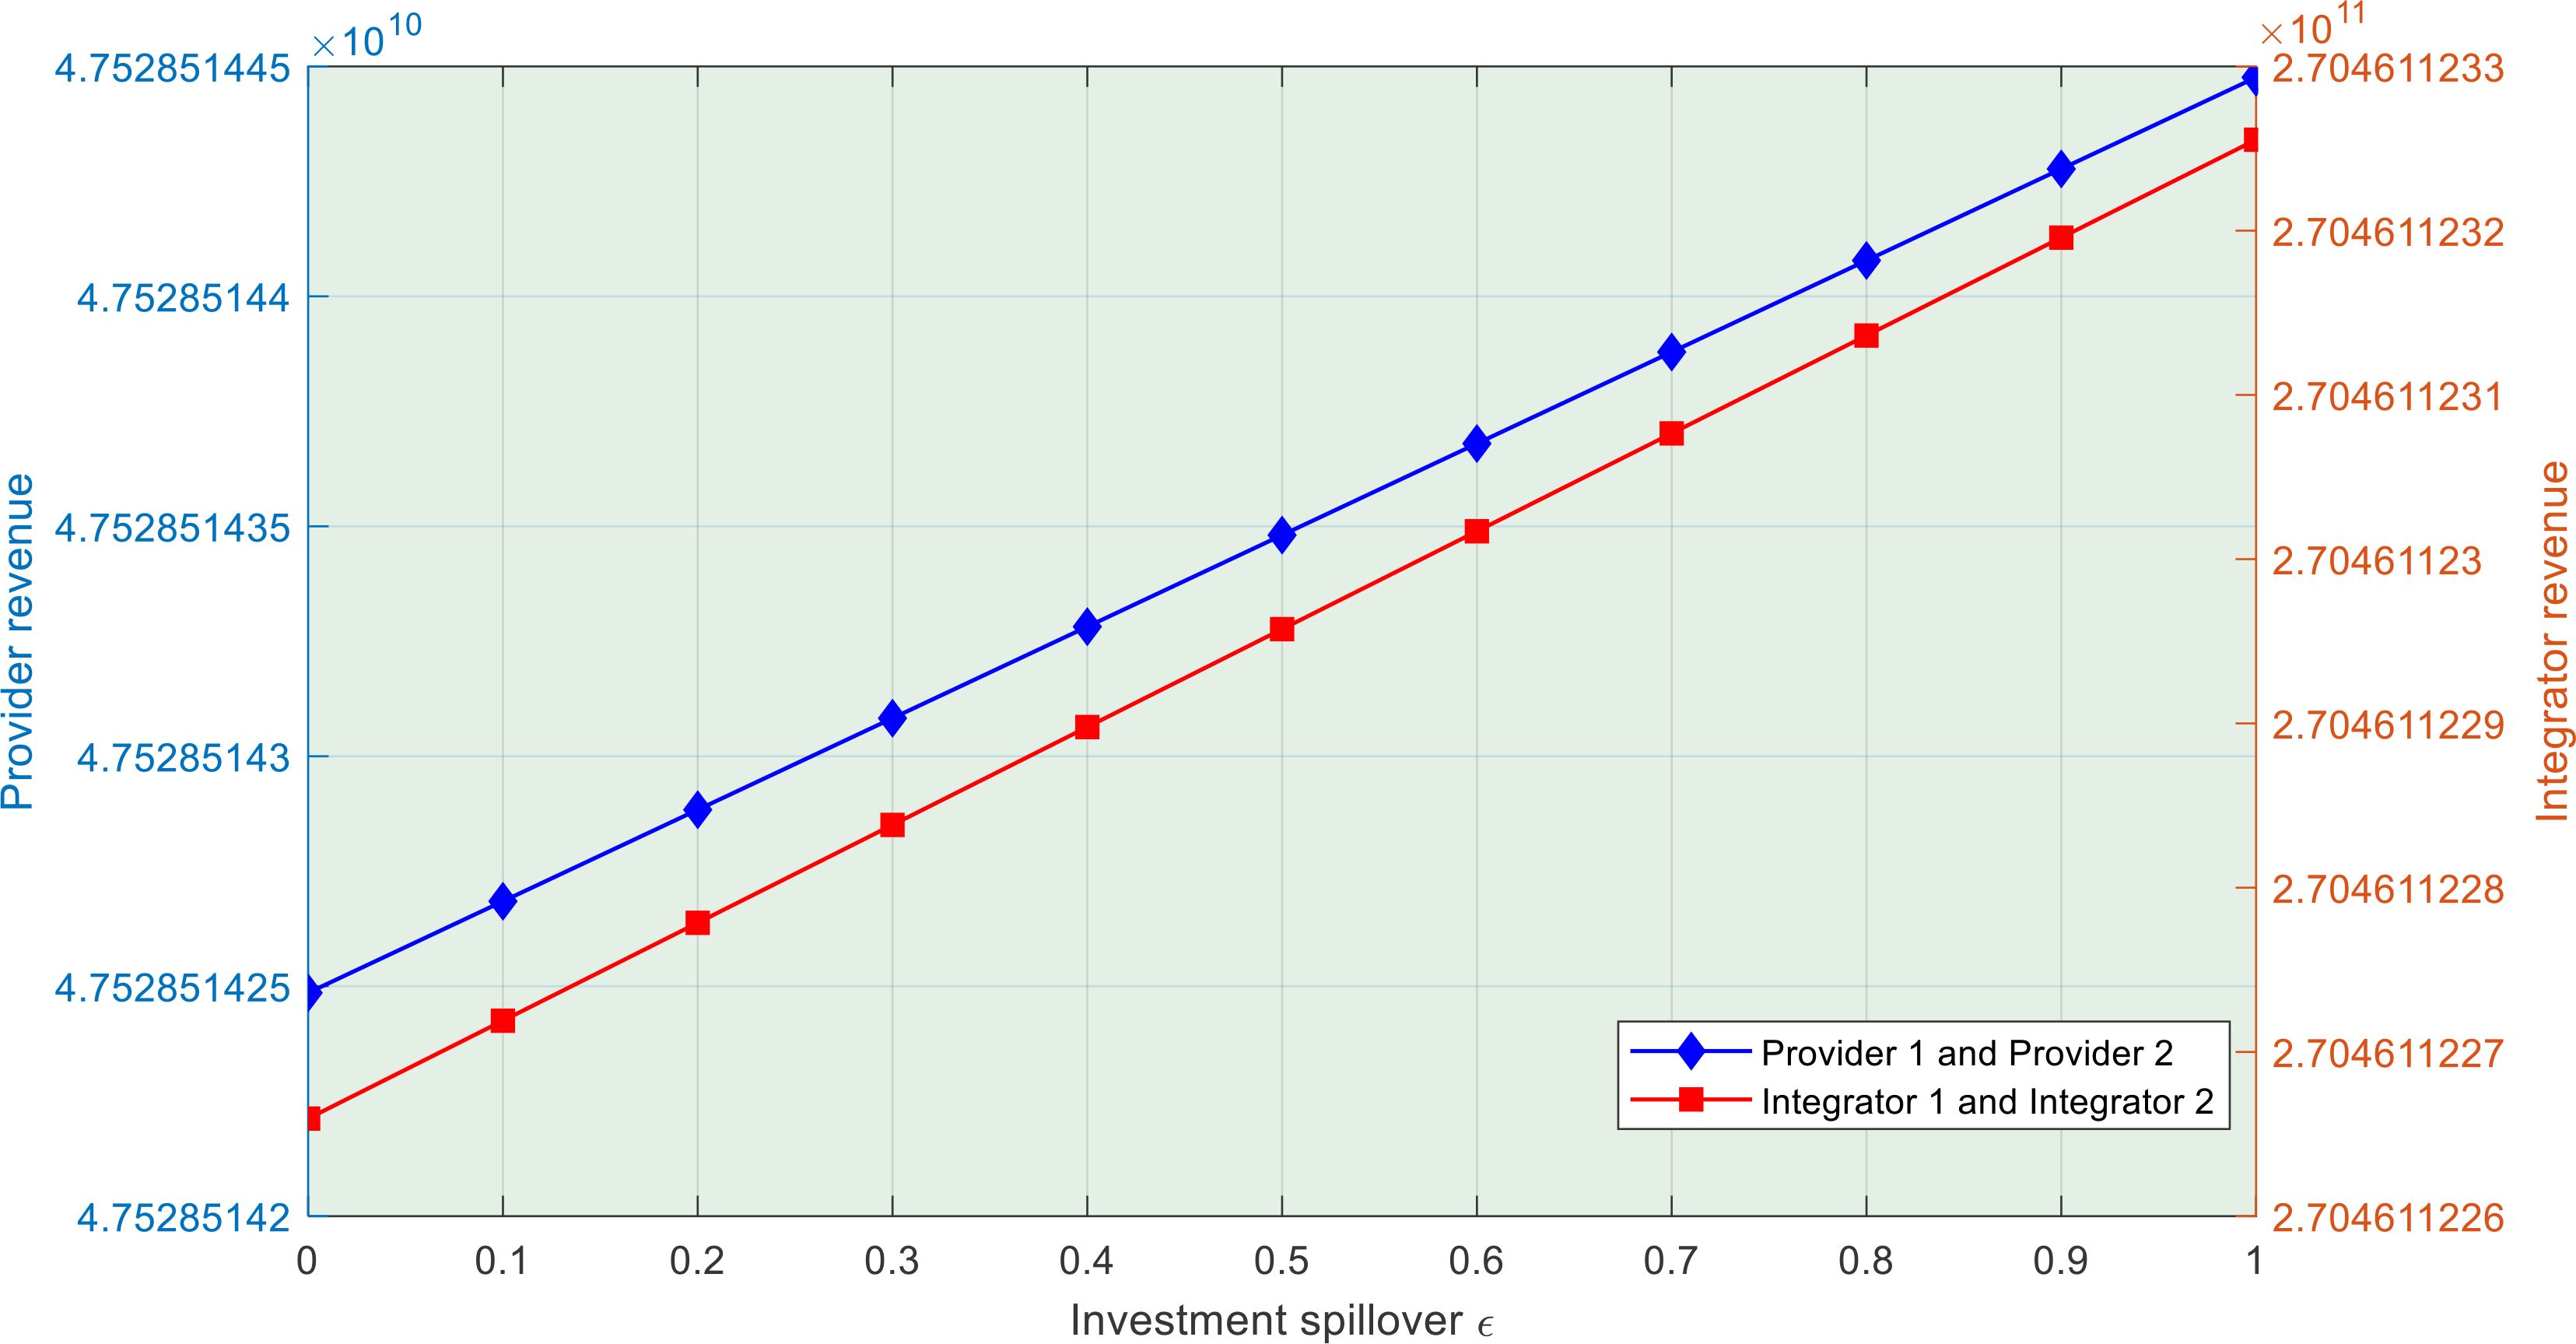
Figure 6. Effect of investment spillover () on the profits of model YY.
Figure 4 shows that when the two SLSSCs choose a strategy without emission-reduction investment NN, the optimal profits of SLSPs and integrators in both supply chains are independent of the investment spillover effect.
Based on Figure 5, when the two SLSSCs choose a single-chain emission-reduction investment strategy YN, the optimal profits of SLSPs and integrators in the chain with emission-reduction investment are negatively correlated with the investment spillover effect (). Their optimal profits decrease as the investment spillover effect () of the SLSI increases. By contrast, in the chain without emission-reduction investment, the optimal profits of providers and integrators are positively correlated with the investment spillover effect (), meaning their optimal profits increase as the investment spillover effect increases. This indicates that as the SLSI’s investment spillover effect () increases, the single-chain emission-reduction investment strategy YN negatively affects the profits of firms in the chain implementing investment but positively affects those of firms in the chain not implementing investment.
Figure 6 shows that when the two SLSSCs choose the dual-chain emission-reduction investment strategy YY, the optimal profits of the SLSPs in both supply chains are the same, and their optimal profits are also the same. At this point, the optimal profits of both providers and integrators are positively correlated with the investment spillover effect (), meaning their optimal profits continuously increase as the investment spillover effect () increases.
This section compares the effect of the altruistic preference coefficient () of SLSPs on providers’ and integrators’ profits, consumer surplus, and social welfare across three investment models in the two SLSSCs. This section examines the effect of the altruistic preference coefficient () on the optimal profits of the providers and integrators in the two chains, as shown in Figures 7–9.
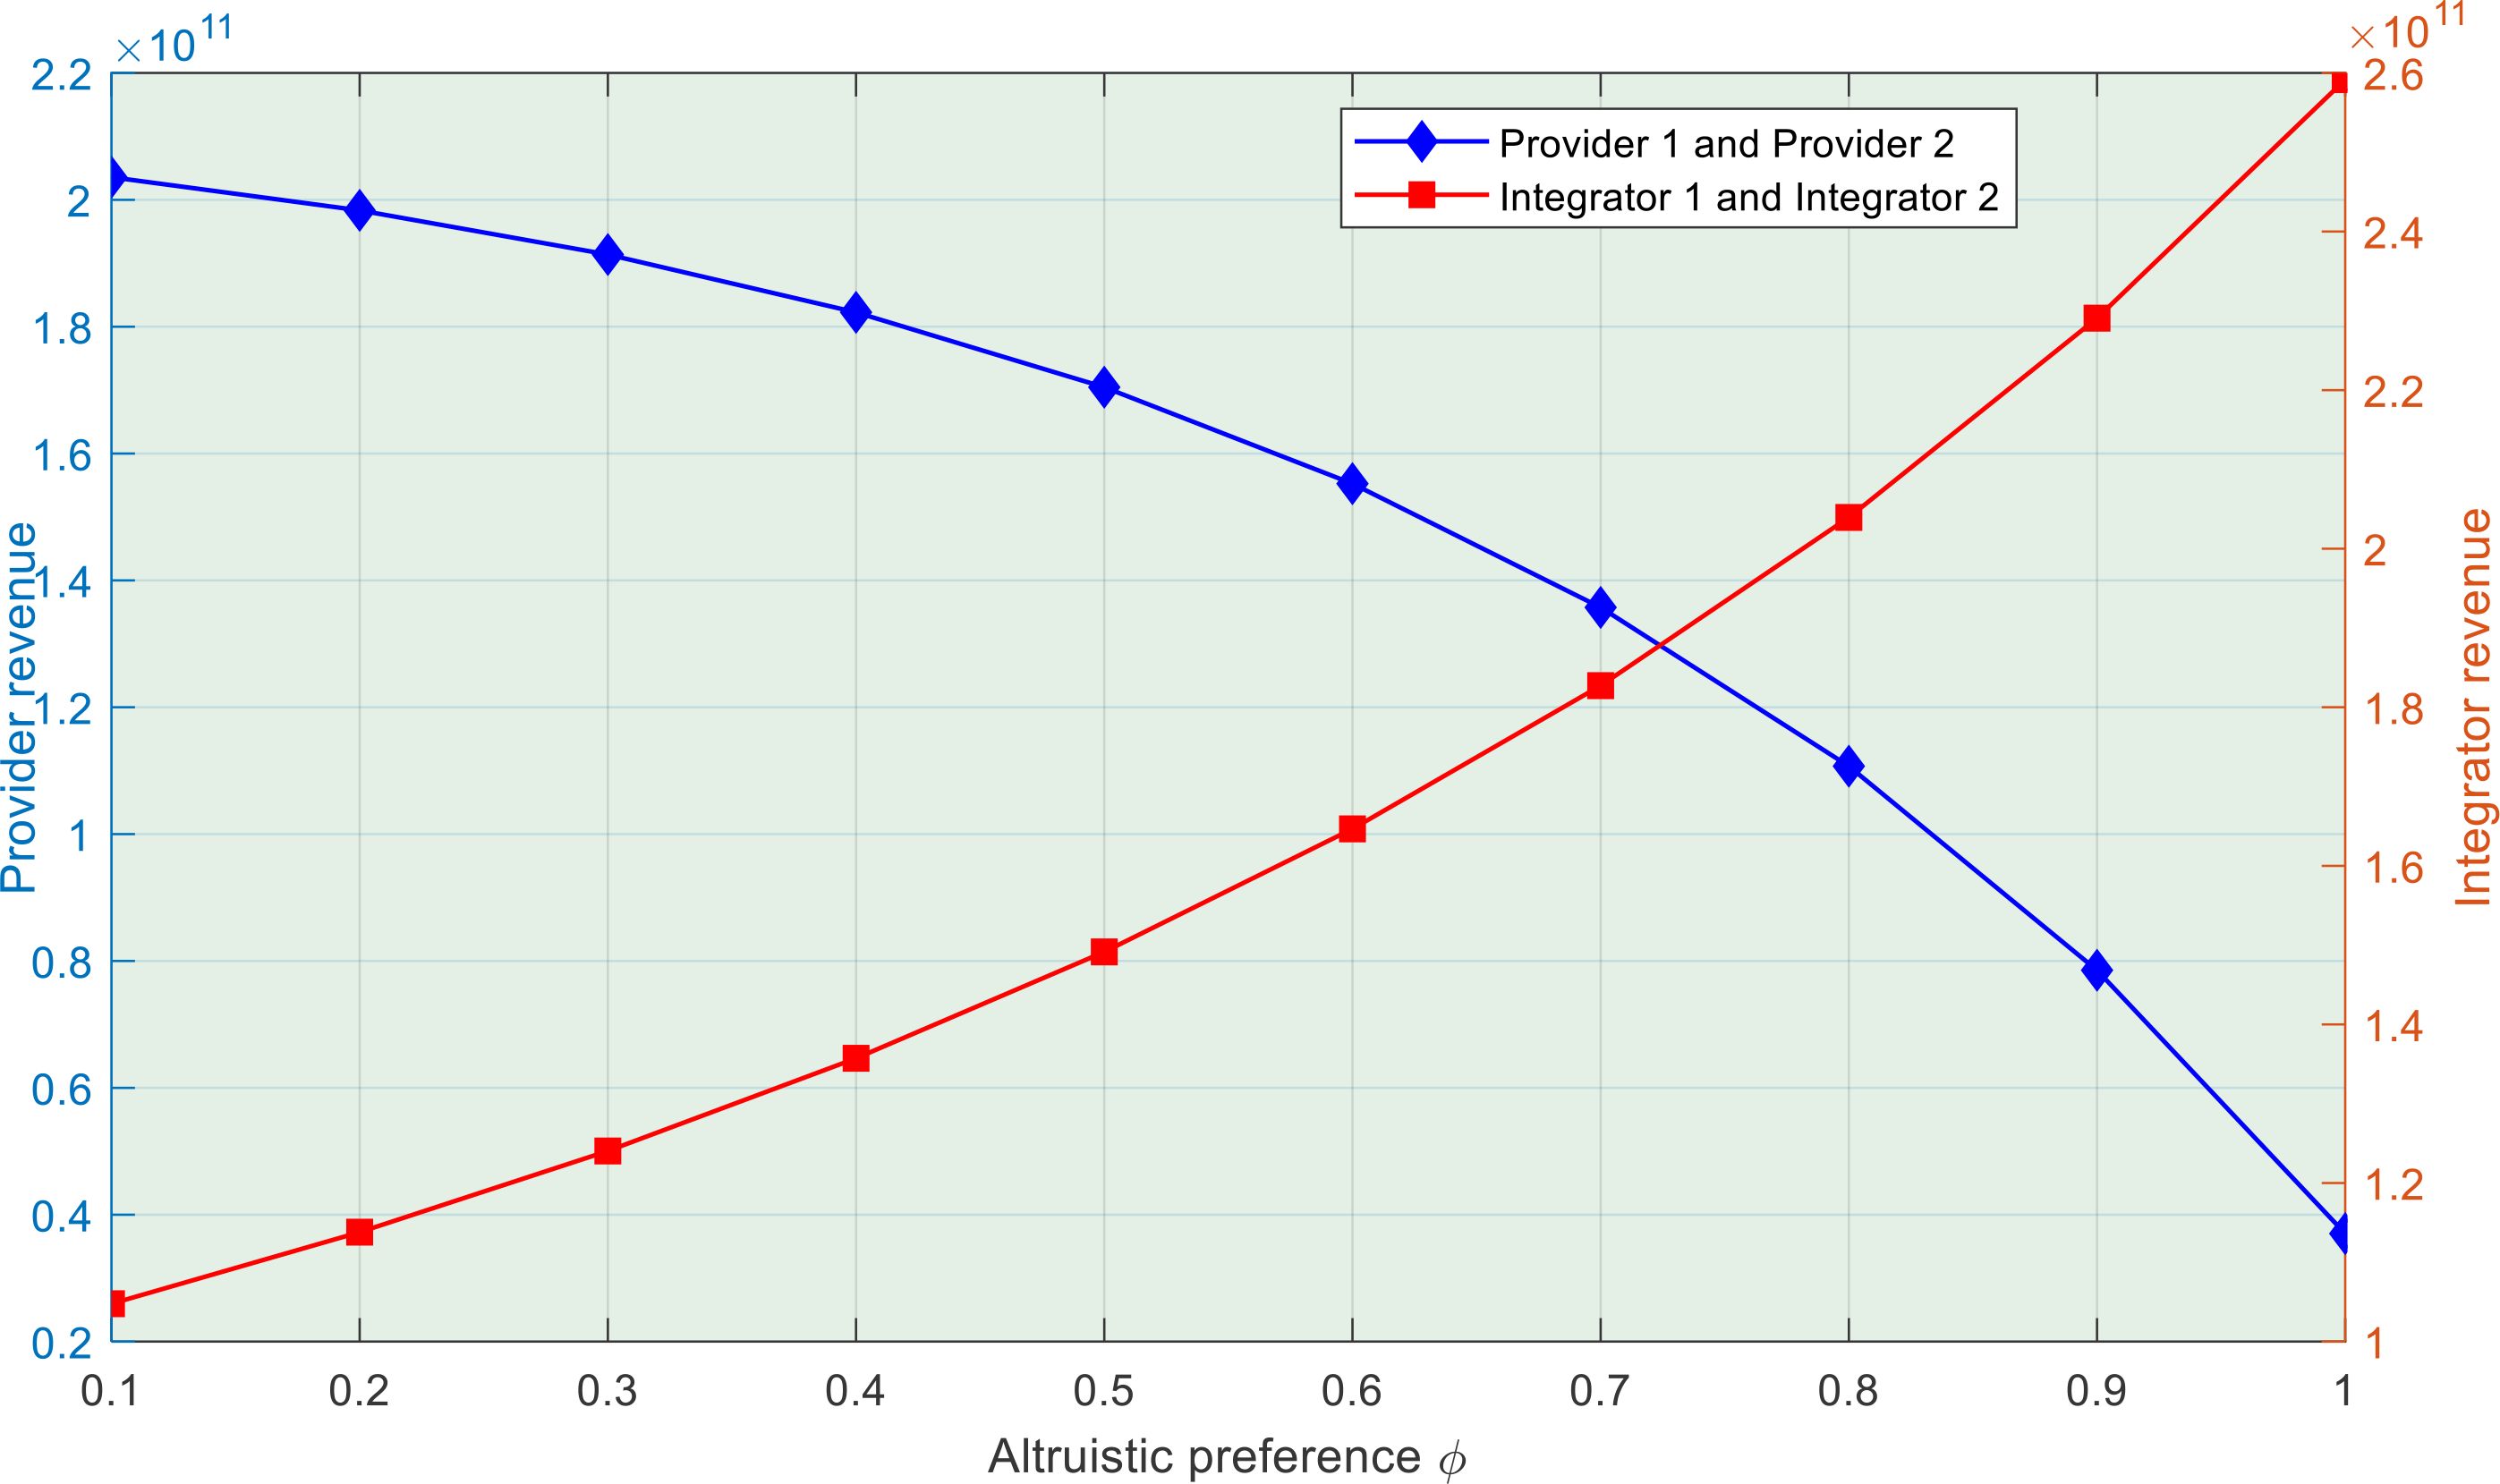
Figure 7. Effect of the altruistic preference coefficient () on the profits of model NN.
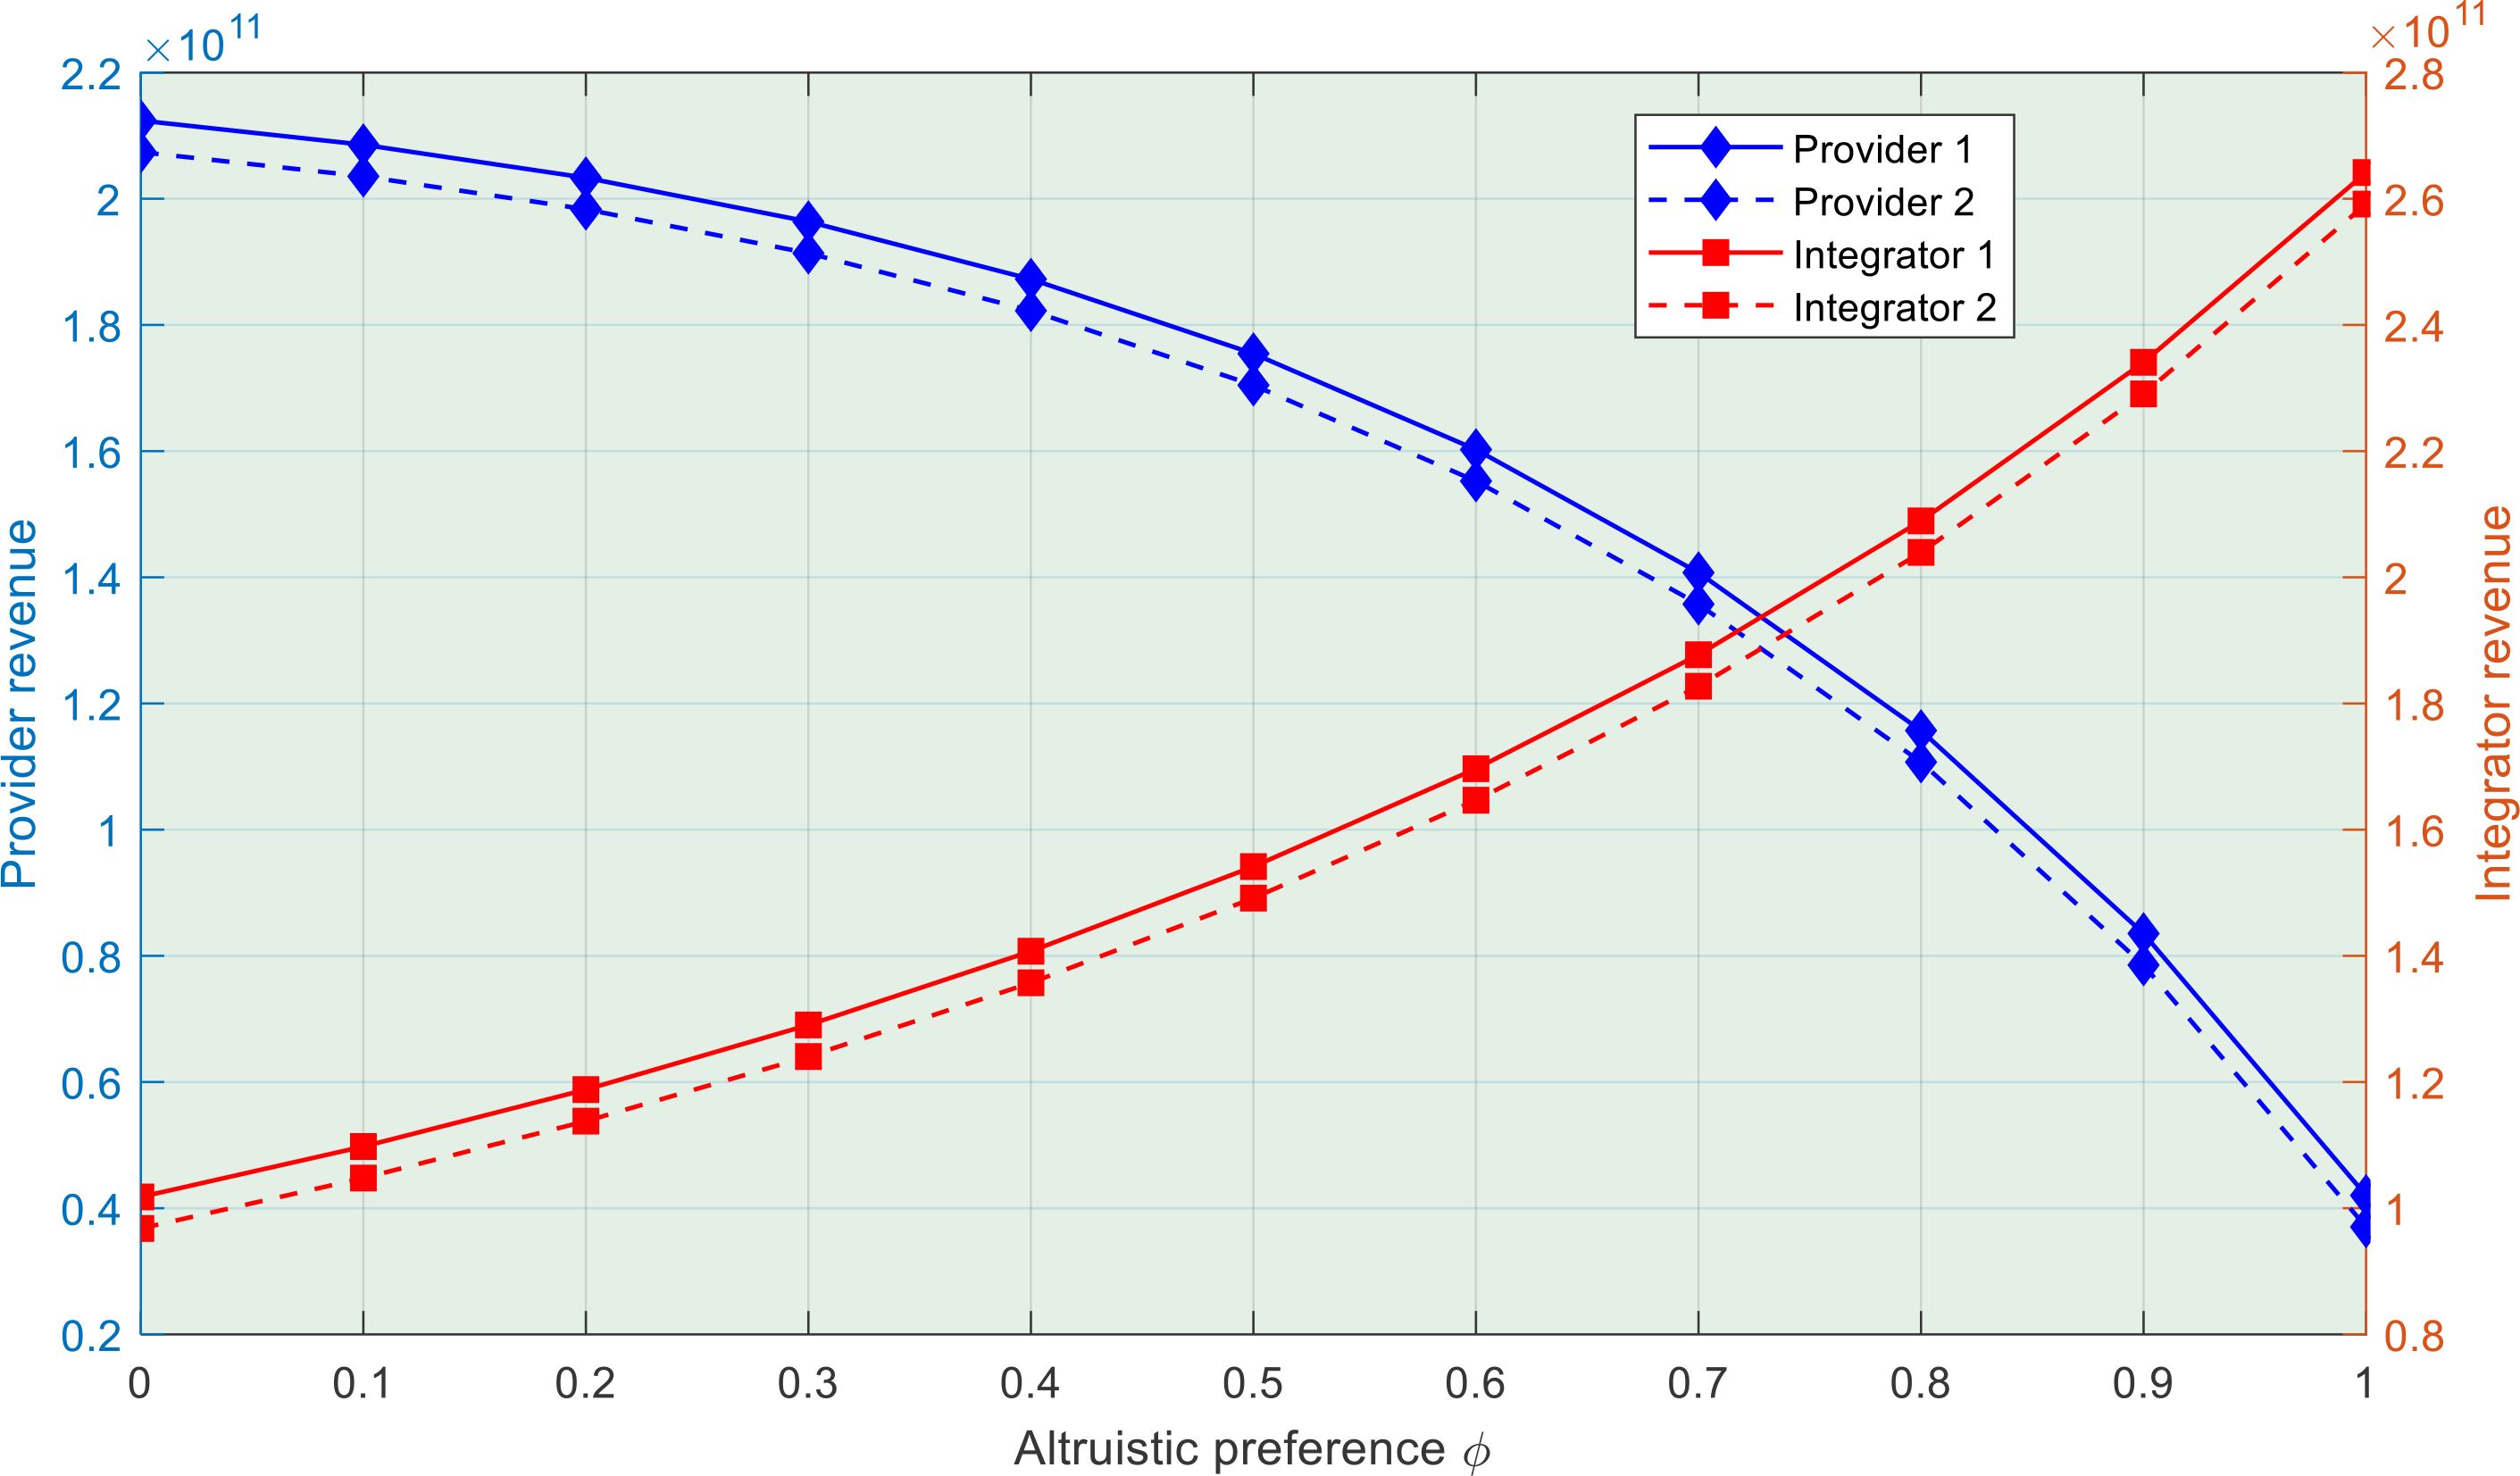
Figure 8. Effect of the altruistic preference coefficient () on the profits of model YN.
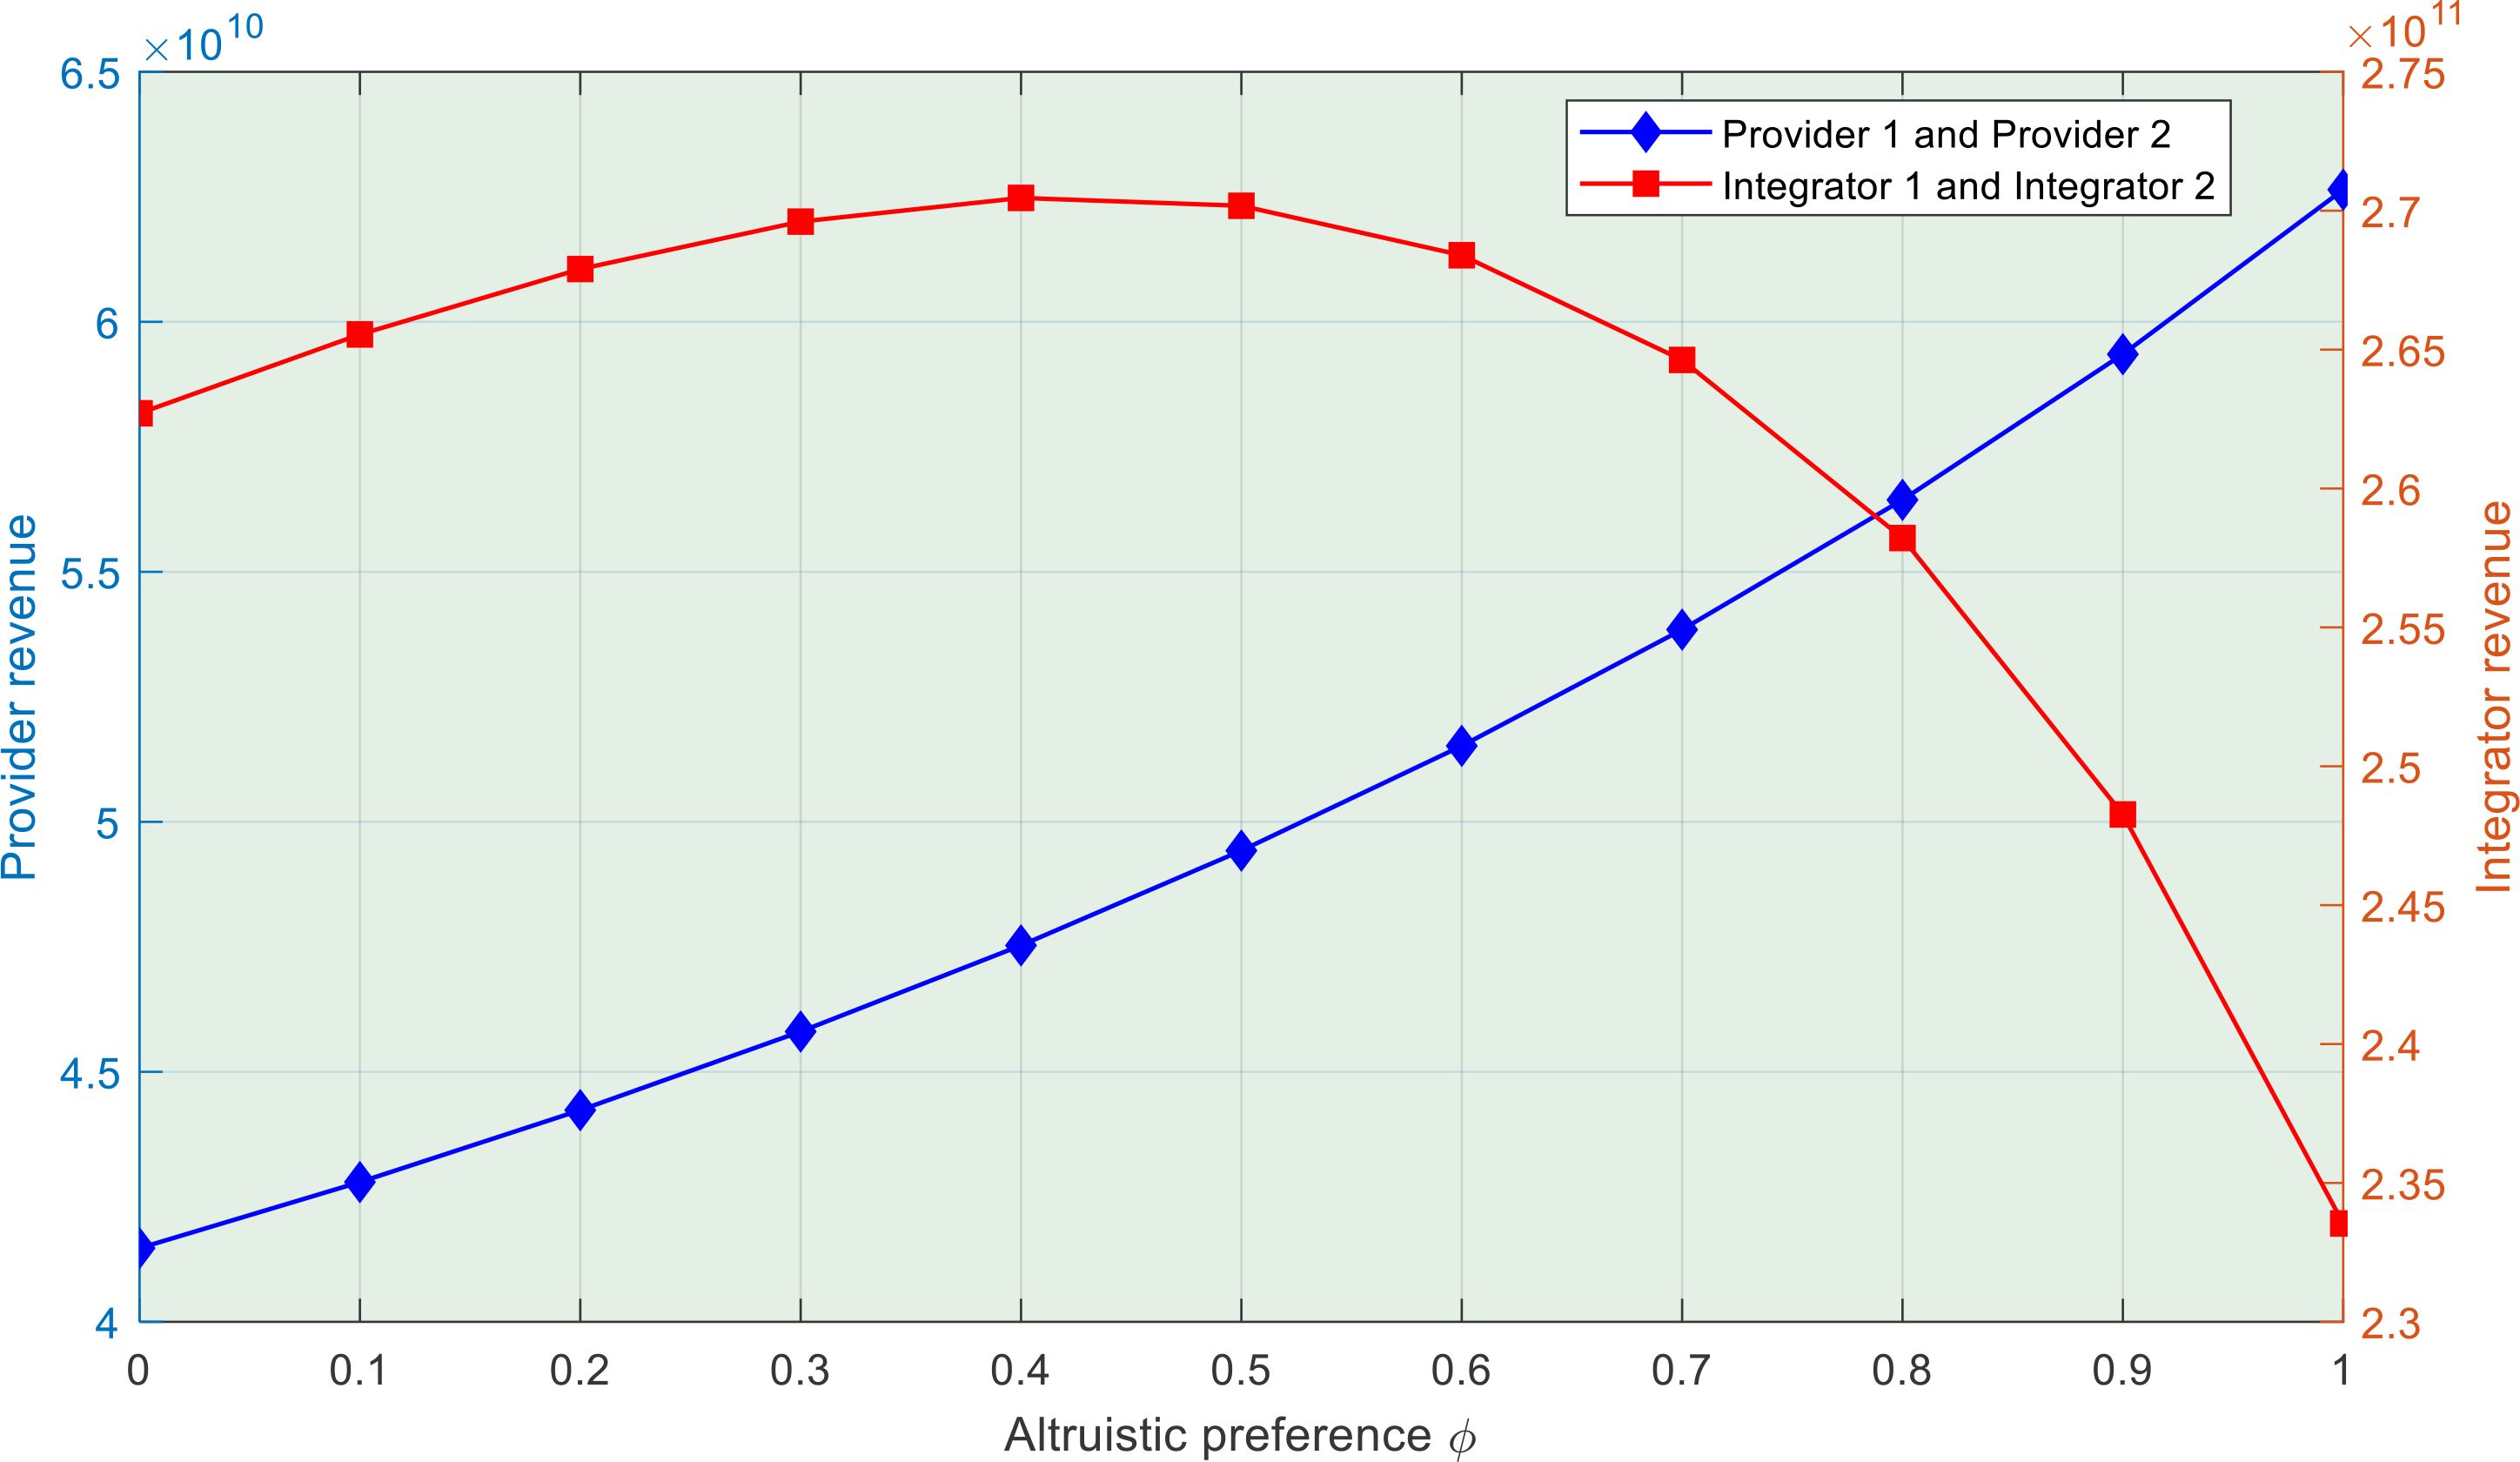
Figure 9. Effect of the altruistic preference coefficient () on the profits of model YY.
Based on Figures 7, 8, when the two SLSSCs choose the no emission-reduction strategy NN and the single-chain emission-reduction strategy YN, the optimal profits of SLSPs are negatively correlated with the altruistic preference coefficient (). However, the optimal profits of logistics integrators are positively correlated with (). This indicates that as the altruistic preference coefficient () of SLSPs increases, their profits decrease while logistics integrators’ profits increase. In Figure 9, when the two SLSSCs choose the dual-chain emission-reduction investment model YY, the optimal profits of both logistics providers are the same, and the optimal profits of both logistics integrators are also the same. In this case, logistics providers’ optimal profits are positively correlated with the altruistic preference coefficient () but lower than those in the NN and YN models. The optimal profits of logistics integrators are negatively correlated with () and higher than those in the NN and YN models. The main reason is that in the dual-chain emission-reduction investment model YY, as logistics providers’ altruistic preference coefficient () increases, logistics integrators need to consider the interests of the providers more when implementing emission-reduction investment. The logistics integrators tend to choose strategies that are more favorable to logistics providers to maintain the stability of SLSSC.
Based on the above research results, this study’s main conclusions are summarized below.
(1) In a competitive environment, when the government allocates carbon quotas, the unit price of carbon emissions in the carbon market is the main factor. The position of participants in SLSSC is not crucial. This indicates that the government needs to allocate free carbon quotas to SLSIs in the supply chain based on carbon emission trading prices, thereby promoting innovation and development in the carbon trading market. Therefore, under the guidance and regulation of existing shipping emission reduction policies (Meng et al., 2022; Liu et al. (2023b), the government can establish a dynamic carbon quota allocation mechanism linked to market carbon prices. When carbon market prices consistently rise, the government can relax related carbon policies by increasing carbon quota allocations to maritime logistics enterprises, thereby alleviating cost pressures. Conversely, when carbon prices are low, reducing free quota allocations can incentivize enterprises to improve energy efficiency and adopt low-carbon technologies. These policies not only influence the behavior of participants in the shipping logistics service supply chain but also drive the entire industry toward more sustainable development.
(2) In contrast to the research conclusions on shipping and logistics emission reduction investment decisions derived from a single-enterprise or single-supply-chain perspective (Metzger and SChinas (2019); Shang et al., 2024), Under different investment strategies, the profits of SLSIs, SLSPs, and the overall supply chain in the two SLSSCs are influenced by the interrelationships among the unit price of carbon emissions in the carbon market, the spillover effects of emission-reduction investments by SLSIs, and the cost coefficients of emission-reduction investments by SLSIs. When investment spillover effects are low and carbon emission trading prices are high, since single-chain investment might not be an equilibrium strategy, SLSIs should seek cooperation with other SLSSCs to jointly invest in carbon reduction projects. This approach facilitates sharing the high costs of carbon emissions and exploring the establishment of industry alliances or collaborative mechanisms to collectively promote policy support. When investment spillover effects are low and unit carbon emission trading prices are low, or when investment spillover effects are high and SLSIs’ cost coefficients for carbon reduction investments are high, strategies should focus on cost control and efficiency improvement. This involves optimizing existing operational processes and asset utilization efficiency while actively seeking low-cost or innovative carbon reduction solutions. Suppose SLSIs’ cost coefficients for carbon reduction investments are moderate. In that case, they should adopt a single-chain investment strategy, selectively investing in carbon reduction projects with relatively short payback periods and high technological maturity to ensure economic benefits. A dual-chain investment strategy should be pursued if SLSIs’ cost coefficients for carbon reduction investments are low. This strategy encourages investment in carbon reduction projects by their own supply chains as well as their competitors or partners, facilitating rapid scalability and cost reduction per unit of carbon reduction. Leveraging spillover effects enhances the overall carbon reduction efficiency of the entire industry. This can not only help the shipping logistics service supply chain better adapt to increasingly stringent environmental requirements but also promote collaboration and innovation within the industry, ultimately achieving a win-win situation for economic benefits and environmental protection.
(3) In a competitive environment, the equilibrium investment decisions of SLSSCs also depend on the relationships among the unit price of carbon emissions, the spillover effects of emission-reduction investments by SLSIs, and the cost coefficients of emission-reduction investments by SLSIs. When faced with different cost coefficients for carbon reduction investments and carbon emission trading prices, SLSPs should adopt specific and actionable strategies. When the cost coefficient for the carbon reduction investments of SLSIs is high, they should initially refrain from large-scale investment. Instead, they should focus on improving the energy efficiency of existing assets and optimizing operational processes. This could involve optimizing route planning through data analysis, reducing idle time, and increasing loading rates to effectively reduce carbon emissions costs. When the cost coefficient for the carbon reduction investments of SLSIs is moderate, they should implement a single-chain investment strategy. This strategy involves identifying the most carbon-intensive processes, such as transportation or warehouse operations, and investing targeted funds in energy-saving and emission-reducing technology upgrades in those areas. When the cost coefficient for the carbon reduction investments of SLSIs is low, they should collaborate with competitors to establish a carbon reduction fund. This fund should be used to devote resources to cutting-edge emission-reduction technologies and infrastructure, such as green fuel storage and supply facilities and efficient energy management systems. By promoting effective emission-reduction technologies within the industry through knowledge sharing, SLSPs can accelerate the industry-wide transition to low-carbon operations.
Against the background of carbon cap-and-trade mechanisms, this study constructs two competitive SLSSCs, each consisting of an SLSP and an SLSI that are mutually substitutable. First, based on game theory, this study considers no emission-reduction investment NN, single-chain emission-reduction investment YN, and dual-chain emission-reduction investment YY. It solves the optimal pricing and service decisions of SLSPs and SLSIs under these three models. Second, under the assumption of government-designed initial free optimal carbon quotas, this study analyzes the effect of the three emission-reduction investment modes on the profits of SLSPs, SLSIs, and the overall supply chain. It compares the effects of the no emission-reduction investment baseline model, single-chain emission-reduction investment model, and dual-chain emission-reduction investment model, deriving equilibrium solutions for the two competitive SLSSCs. Subsequently, this study further examines the effects of the optimal equilibrium emission-reduction decisions of SLSSCs on consumer surplus and social welfare. Finally, using practical examples, it examines the spillover effects of emission-reduction investments by SLSIs and the altruism coefficient of SLSPs on the profits of SLSSCs, consumer surplus, and social welfare.
Based on the conclusions, this study addresses investment strategies for carbon reduction in competitive SLSSC environments. Management insights are offered with regard to governments, SLSIs, and SLSPs. First, regarding the government allocation of free carbon quotas, in a competitive environment, the government allocates carbon quotas to SLSIs based not on their position in SLSSC but on the unit carbon trading price in the maritime carbon market. Second, regarding SLSIs’ carbon reduction investment strategies, the equilibrium strategy choices of two competing SLSSCs are determined by the relationships among unit carbon emission trading prices, carbon reduction investment spillover effects of SLSIs, cost coefficients of carbon reduction investments, and altruistic preference thresholds. SLSIs should adopt differentiated investment strategies and flexibly formulate and adjust their carbon reduction investment strategies based on different market conditions. Finally, in terms of SLSPs’ carbon reduction investment strategies, even when the unit carbon emission trading price is low, both SLSIs might still choose to implement carbon reduction investment strategies. This depends on the cost coefficient for carbon reduction investments determined by the altruistic preference coefficient of SLSPs. These actionable strategies not only help shipping logistics service supply chains effectively address challenges posed by varying cost factors and carbon prices but also drive the entire shipping industry toward greater sustainability. Meanwhile, by enhancing internal management and external collaboration, shipping logistics enterprises can achieve emission reduction goals while maintaining their competitiveness.
This study has certain limitations. Future work could focus on two aspects. First, this study assumes that the SLSIs in the two SLSSCs have the same investment efficiency. In a competitive environment, however, SLSIs will typically continue to innovate emission-reduction measures. Therefore, future research should be extended to situations where the SLSIs in the two SLSSCs have different investment efficiencies in a competitive environment. Second, since emission-reduction investments in SLSSCs are often multiperiod behaviors, future research should extend the study to multiple periods and analyze the key characteristics of cross-period emission-reduction investments.
The original contributions presented in the study are included in the article/Supplementary Material. Further inquiries can be directed to the corresponding author.
GZ: Writing – original draft. ZZ: Writing – review & editing. HY: Supervision, Writing – original draft. WC: Supervision, Writing – review & editing.
The author(s) declare financial support was received for the research, authorship, and/or publication of this article. This work was supported by National Social Science Foundation of China, grant number 21BJY227. 2023 Annual Project of Shenzhen “14th Five-Year” Education Science Plan (cgpy23022), and the Business Administration Discipline Construction Program of Shenzhen Polytechnic University (6022311006S).
We would like to be grateful to the editors and referees for their valuable comments.
The authors declare that the research was conducted in the absence of any commercial or financial relationships that could be construed as a potential conflict of interest.
The author(s) declare that no Generative AI was used in the creation of this manuscript.
All claims expressed in this article are solely those of the authors and do not necessarily represent those of their affiliated organizations, or those of the publisher, the editors and the reviewers. Any product that may be evaluated in this article, or claim that may be made by its manufacturer, is not guaranteed or endorsed by the publisher.
The Supplementary Material for this article can be found online at: https://www.frontiersin.org/articles/10.3389/fmars.2025.1546146/full#supplementary-material
Bichou K., Gray R. (2004). A logistics and supply chain management approach to port performance measurement. Maritime Policy Manage. 31, 47–67. doi: 10.1080/0308883032000174454
Chen W., Chen J., Ma Y. (2021). Renewable energy investment and carbon emissions under cap-and-trade mechanisms. J. Clean. Product. 278, 123341. doi: 10.1016/j.jclepro.2020.123341
Dong B., Ren Y., McIntosh C. (2023). A co-opetitive newsvendor model with product substitution and a wholesale price contract. Eur. J. Operat. Res. 311, 502–514. doi: 10.1016/j.ejor.2023.04.036
Fan X., Chen K., Chen Y. J. (2023). Is price commitment a better solution to control carbon emissions and promote technology investment? Manage. Sci. 69, 325–341. doi: 10.1287/mnsc.2022.4365
Feng H., Zeng Y., Cai X., Qian Q., Zhou Y. (2021). Altruistic profit allocation rules for joint replenishment with carbon cap-and-trade policy. Eur. J. Operat. Res. 290, 956–967. doi: 10.1016/j.ejor.2020.08.040
Hingley M., Lindgreen A., Grant D. B., Kane C. (2011). Using fourth-party logistics management to improve horizontal collaboration among grocery retailers. Supply Chain Manage.: Int. J. 16, 316–327. doi: 10.1108/13598541111155839
Jia H., Li J., Liang L., Peng W., Xie J., Xie J. (2022). Advance selling of uncertain demand in low-carbon supply chain. Ind. Manage. Data Syst. 122, 2680–2709. doi: 10.1108/IMDS-04-2022-0239
Jiang M., Lu J., Qu Z., Yang Z. (2021). Port vulnerability assessment from a supply Chain perspective. Ocean Coast. Manage. 213, 105851. doi: 10.1016/j.ocecoaman.2021.105851
Jiang Y., Meng Q., Guo Y., Zhang Z. (2024). Strategic disclosure of carrier’s carbon emission reduction information by competitive shippers in marine supply chains. Ocean Coast. Manage. 253, 107165. doi: 10.1016/j.ocecoaman.2024.107165
Kim C. S., Dinwoodie J., Roh S. (2021). Developing measurement scales of collaboration in shipping logistics. Int. J. Logist. Res. Appl. 24, 494–510. doi: 10.1080/13675567.2020.1770708
Lee C. Y., Song D. P. (2017). Ocean container transport in global supply chains: Overview and research opportunities. Transport. Res. Part B: Methodol. 95, 442–474. doi: 10.1016/j.trb.2016.05.001
Li J., Yang S., Shi V., Zhai S. (2020). Partial vertical centralization in competing supply chains. Int. J. Product. Econ. 224, 107565. doi: 10.1016/j.ijpe.2019.107565
Liu G., Shao X., Lang X. (2020). On the interaction of technology upgrade and buyer entry in a supply chain. Int. J. Product. Econ. 221, 107478. doi: 10.1016/j.ijpe.2019.08.013
Liu H., Mao Z., Li X. (2023). Analysis of international shipping emissions reduction policy and China’s participation. Front. Mar. Sci. 10, 1093533. doi: 10.3389/fmars.2023.1093533
Liu J., Xu H., Lyu Y. (2023a). Emission reduction technologies for shipping supply chains under carbon tax with knowledge sharing. Ocean Coast. Manage. 246, 106869. doi: 10.1016/j.ocecoaman.2023.106869
Liu W., Yan X., Wei W., Xie D., Wang D. (2018). Altruistic preference for investment decisions in the logistics service supply chain. Eur. J. Ind. Eng. 12, 598–635. doi: 10.1504/EJIE.2018.093647
Liu J., Zhao H., Chen J. (2023b). Blockchain-driven win-win strategy of economy and environment in the asymmetric competitive supply chain. Comput. Ind. Eng. 176, 108978. doi: 10.1016/j.cie.2023.108978
Mao Z., Ma A., Zhang Z. (2024). Towards carbon neutrality in shipping: Impact of European Union’s emissions trading system for shipping and China’s response. Ocean Coast. Manage. 249, 107006. doi: 10.1016/j.ocecoaman.2023.107006
Meng L., Liu K., He J., Han C., Liu P. (2022). Carbon emission reduction behavior strategies in the shipping industry under government regulation: A tripartite evolutionary game analysis. J. Clean. Product. 378, 134556. doi: 10.1016/j.jclepro.2022.134556
Meng L., Lv W., Yuan G. X., Wang H. (2023). The dynamic risk profiles and management strategies in supply chain coopetition under altruistic preference. Int. Rev. Finan. Anal. 90, 102895. doi: 10.1016/j.irfa.2023.102895
Metzger D., SChinas O. (2019). Fuzzy real options and shared savings: Investment appraisal for green shipping technologies. Transport. Res. Part D: Transport Environ. 77, 1–10. doi: 10.1016/j.trd.2019.09.016
Romano A., Yang Z. (2021). Decarbonisation of shipping: A state of the art survey for 2000-2020. Ocean Coast. Manage. 214, 105936. doi: 10.1016/j.ocecoaman.2021.105936
Shang T., Wu H., Wang K., Yang D., Jiang C., Yang H. (2024). Would the shipping alliance promote or discourage green shipping investment? Transport. Res. Part D: Transport Environ. 128, 104102. doi: 10.1016/j.trd.2024.104102
Song D. W., Panayides P. M. (2008). Global supply chain and port/terminal: integration and competitiveness. Maritime Policy Manage. 35, 73–87. doi: 10.1080/03088830701848953
Sun H., Yang J. (2021). Optimal decisions for competitive manufacturers under carbon tax and cap-and-trade policies. Comput. Ind. Eng. 156, 107244. doi: 10.1016/j.cie.2021.107244
Tadros M., Ventura M., Soares C. G. (2023). Review of current regulations, available technologies, and future trends in the green shipping industry. Ocean Eng. 280, 114670. doi: 10.1016/j.oceaneng.2023.114670
Talley W. K., Ng M. W. (2013). Maritime transport chain choice by carriers, ports and shippers. Int. J. Product. Econ. 142, 311–316. doi: 10.1016/j.ijpe.2012.11.013
Tongzon J. L., Lee S. Y. (2016). Achieving an ASEAN single shipping market: shipping and logistics firms’ perspective. Maritime Policy Manage. 43, 407–419. doi: 10.1080/03088839.2015.1105393
Wang Y., Yu Z., Jin M., Mao J. (2021). Decisions and coordination of retailer-led low-carbon supply chain under altruistic preference. Eur. J. Operat. Res. 293, 910–925. doi: 10.1016/j.ejor.2020.12.060
Xia T., Wang Y., Lv L., Shen L., Cheng T. C. E. (2023). Financing decisions of low-carbon supply chain under chain-to-chain competition. Int. J. Product. Res. 61, 6153–6176. doi: 10.1080/00207543.2021.2023833
Xiao G., Pan L., Lai F. (2024). Application, opportunities, and challenges of digital technologies in the decarbonizing shipping industry: A bibliometric analysis. Front. Mar. Sci. 12, 1523267. doi: 10.3389/fmars.2025.1523267
Xu X., He P., Xu H., Zhang Q. (2017). Supply chain coordination with green technology under cap-and-trade regulation. Int. J. Product. Econ. 183, 433–442. doi: 10.1016/j.ijpe.2016.08.029
Xu L., Shen C., Chen J., Pan X., Xiao G. (2024a). Efficiency evaluation and improvement pathway of sulfur-oxide emissions in European ports based on Context-dependent SBM-DEA model. Mar. Pollut. Bull. 208, 117002. doi: 10.1016/j.marpolbul.2024.117002
Xu L., Wu J., Zhao Q., Chen J., Liu J., Gao F., et al. (2024b). Spatial-temporal characteristics of port infrastructures on sulfur-oxide concentrations of coastal port in China. Ocean Coast. Manage. 258, 107399. doi: 10.1016/j.ocecoaman.2024.107399
Yang C., Yang Z., Li Y. (2023). Negotiation mechanism of carbon emission quota trading process. Sustain. Product. Consumpt. 39, 336–344. doi: 10.1016/j.spc.2023.05.010
Yu T., Guan Z., Zhang J., Dong J. (2024). Blockchain adoption and contract coordination of poverty alleviation supply chain considering altruistic preference. Comput. Ind. Eng. 188, 109879. doi: 10.1016/j.cie.2023.109879
Zhang W., Hua Z., Xia Y., Huo B. (2016). Dynamic multi-technology production-inventory problem with emissions trading. IIE Trans. 48, 110–119. doi: 10.1080/0740817X.2015.1011357
Zhang C., Xiao G., Xu L. (2024). Manufacturers’ emission-reduction investments in competing supply chains with Prisoner’s Dilemma: The economic and environmental impacts of Retailer (s) capital Constraint (s). Transport. Res. Part E: Logist. Transport. Rev. 187, 103602. doi: 10.1016/j.tre.2024.103602
Zhang Z., Yu L. (2022). Supply chain joint emission reduction differential decisions and coordination considering altruistic behavior and reference low-carbon effect. Environ. Sci. pollut. Res. 29, 1–25. doi: 10.1007/s11356-021-16901-z
Zhang C., Zhang X. (2022). Evolutionary game analysis of air pollution co-investment in emission reductions by steel enterprises under carbon quota trading mechanism. J. Environ. Manage. 317, 115376. doi: 10.1016/j.jenvman.2022.115376
Zhao H., Chen J., Ai X. (2022). Contract strategy in the presence of chain to chain competition. Int. J. Product. Res. 60, 1913–1931. doi: 10.1080/00207543.2021.1876945
Zhao X., Shang Y., Ma X., Xia P., Shahzad U. (2022). Does carbon trading lead to green technology innovation: recent evidence from Chinese companies in resource-based industries. IEEE Trans. Eng. Manage. 71, 2506–2523. doi: 10.1109/TEM.2022.3186905
Keywords: carbon cap-and-trade mechanisms, competitive shipping logistics service supply chain, emission-reduction investment, consumer surplus, social welfare
Citation: Zhang G, Zhang Z, Yuan H and Chen W (2025) Emission-reduction investment strategies in competitive shipping supply chains under carbon cap-and-trade mechanisms. Front. Mar. Sci. 12:1546146. doi: 10.3389/fmars.2025.1546146
Received: 16 December 2024; Accepted: 31 January 2025;
Published: 24 February 2025.
Edited by:
Lang Xu, Nanyang Technological University, SingaporeCopyright © 2025 Zhang, Zhang, Yuan and Chen. This is an open-access article distributed under the terms of the Creative Commons Attribution License (CC BY). The use, distribution or reproduction in other forums is permitted, provided the original author(s) and the copyright owner(s) are credited and that the original publication in this journal is cited, in accordance with accepted academic practice. No use, distribution or reproduction is permitted which does not comply with these terms.
*Correspondence: Zhaomin Zhang, emh6aG1pbkBzenB1LmVkdS5jbg==
Disclaimer: All claims expressed in this article are solely those of the authors and do not necessarily represent those of their affiliated organizations, or those of the publisher, the editors and the reviewers. Any product that may be evaluated in this article or claim that may be made by its manufacturer is not guaranteed or endorsed by the publisher.
Research integrity at Frontiers
Learn more about the work of our research integrity team to safeguard the quality of each article we publish.