 Ting Chen
 Shuai Zhang
 Peiwen Jiang
 Zuozhi Chen
 Jun Zhang
 Shannan Xu
 Min Li
94% of researchers rate our articles as excellent or good
Learn more about the work of our research integrity team to safeguard the quality of each article we publish.
Find out more
ORIGINAL RESEARCH article
Front. Mar. Sci., 27 March 2025
Sec. Marine Fisheries, Aquaculture and Living Resources
Volume 12 - 2025 | https://doi.org/10.3389/fmars.2025.1544827
This article is part of the Research TopicGenetics and Genomics applied to Fisheries and AquacultureView all 5 articles
Monitoring fish diversity in open ocean environments presents substantial challenges, particularly due to the limitations of traditional sampling methods such as trawling, which are costly, labor-intensive, and ineffective for deeper water layers. Environmental DNA (eDNA) technology offers an economical and efficient alternative, complementing conventional survey techniques. In this study, eDNA analysis was employed to characterize fish species composition and diversity in the central South China Sea (SCS). Additionally, generalized additive models (GAMs) were applied for the 5 m and 200 m depth layers to assess the influence of environmental variables on fish communities. A total of 190 fish species, spanning 32 orders, 68 families, and 135 genera, were detected across eight sampling sites. The 5 m and 200 m depth layers harbored 184 and 178 species, respectively, with 172 species common to both layers. α-and β-diversity analyses revealed no significant differences in fish species composition or diversity between the two depths (p > 0.05). GAM results highlighted temperature as a key environmental driver of fish distribution, with significant effects on species abundance at both depths (p < 0.05). These findings underscore the utility of eDNA for monitoring fish diversity and elucidating the ecological mechanisms shaping vertical species distribution in deep-sea ecosystems. Given the logistical constraints of traditional survey methods in deep-sea environments, eDNA-based approaches offer valuable insights for the sustainable management and conservation of fishery resources in the central SCS.
The South China Sea (SCS), the third-largest marginal sea in the world, is situated in the western Pacific and spans approximately 3.5 million km² (Apriansyah et al., 2022). As one of the most ecologically and economically important marine regions globally, the SCS supports a vast and diverse marine ecosystem (Sheng et al., 2024). Encompassing both tropical and subtropical zones, the SCS harbors a rich variety of ecosystem types. It is characterized by numerous islands, shoals, and coral reefs, while its complex oceanographic conditions foster abundant fishery resources (Zhang et al., 2022). In the deep-water zones of the central SCS, a wide range of pelagic fish species, including commercially valuable ones such as tuna, jacks, and pompanos, are present. Studies have demonstrated that pelagic fish not only contribute substantially to economic fisheries but also play a pivotal role in carbon sequestration processes (St. John et al., 2016). Long-term monitoring of the diversity and spatiotemporal distribution of these species is crucial for understanding energy flow within global biogeochemical cycles and for promoting the sustainable management of offshore fishery resources (Jiang et al., 2023). However, the remote nature of oceanic ecosystems poses significant challenges for surveying and monitoring marine biodiversity, making it difficult to accurately characterize the distribution patterns of marine communities (Adams et al., 2019). Moreover, the highly variable weather conditions in open waters further complicate efforts to monitor species composition and diversity (Sigsgaard et al., 2020).
To date, surveys of pelagic species remain scarce, with sampling efforts covering only about 1% of the total area (Higgs and Attrill, 2015). It is estimated that approximately 1.5 million pelagic species remain undiscovered, and comprehensive data on their spatiotemporal distribution are largely lacking (Costello and Chaudhary, 2017; Danovaro et al., 2020; Wedding et al., 2013). Traditional survey methods, such as trawling, require prolonged operations in open waters and often fail to generate high-resolution data (Yu et al., 2022). Similarly, light traps, which rely on fish phototaxis, can introduce species-specific sampling biases, thereby limiting their ability to accurately reflect the actual fish distribution and affecting the reliability of fishery resource assessments (Jiang et al., 2024a). These conventional methods are not only labor-intensive and costly but also demand a high level of taxonomic expertise from practitioners (Hering et al., 2018).
Given these limitations, adopting non-invasive biological monitoring technologies is essential for efficiently tracking the abundance, composition, and distribution of pelagic fish across large areas. This approach can complement existing biodiversity data, facilitating a more accurate assessment of marine ecosystem health.
Increasingly, studies have demonstrated the effectiveness of eDNA technology as an emerging tool in biodiversity research. This technology can rapidly detect a wide range of species, characterize differences in marine habitats and community types, and reveal previously unrecognized aspects of biodiversity (Li et al., 2022; Wang et al., 2021b). Due to its time efficiency, low cost, sensitivity, accuracy, and non-invasive nature, eDNA holds significant potential for advancing the study of pelagic fish diversity (Thomsen et al., 2012; Wu and Minamoto, 2023). Unlike traditional survey methods, eDNA surveys only require the collection of environmental samples (Bohmann et al., 2014), eliminating the need for extensive efforts to capture target species. This approach reduces workload, avoids habitat disruption, and minimizes the risk to endangered species (Tsuji et al., 2023). A particularly notable application of eDNA is metabarcoding, a non-invasive molecular tool that extracts DNA from environmental samples and employs high-throughput sequencing technologies to assess biodiversity (Li et al., 2023). Several studies have integrated eDNA techniques with traditional methods, demonstrating a reasonable degree of reliability between eDNA-based monitoring and conventional survey results (Cheang et al., 2020; Westgaard et al., 2024; Zou et al., 2020). In aquatic ecosystems, eDNA technology is primarily employed for qualitative species analysis, biodiversity assessments, and biomass quantification (Barnes et al., 2020). Given its simplicity, non-invasiveness, and high sensitivity, eDNA has found widespread application in fisheries resource management, species composition and diversity monitoring, resource assessment, and population distribution studies (Boulanger et al., 2021).
The structure, diversity, and spatial distribution of fish communities are influenced by various environmental parameters, including temperature, salinity, pH, and dissolved oxygen (Araújo et al., 2008; Steichen et al., 2024; Wang et al., 2021a). For example, Kume et al. (2021b), investigated estuarine and coastal fish communities in Japan and found that latitude and water temperature were key factors affecting community structure. Similarly, Zhu et al. (2024), employing acoustic methods, analyzed the impact of abiotic factors on the distribution of small and medium-sized pelagic fish in different water layers of the Northwest Pacific. Their findings revealed that temperature and longitude significantly influenced fish density. The relationship between fish communities and environmental factors is often complex, exhibiting both nonlinearity and non-additivity (Feng et al., 2021; Liu et al., 2022; Rawat et al., 2024). Generalized Additive Models (GAMs), which extend GLMs by incorporating flexible, non-parametric smooth functions, are widely used for analyzing nonlinear relationships between multiple explanatory and response variables (Venables and Dichmont, 2004). GAMs have been widely applied in fisheries resource monitoring and management to assess the effects of environmental factors on fish populations (Ma et al., 2020, 2022; Wang et al., 2023b).
To gain a more comprehensive understanding of the diversity and spatial distribution of pelagic fish in the central SCS, this study employs eDNA technology to assess species composition and community diversity in the region. The study develops a practical and efficient method for monitoring pelagic fish diversity, while also examining the impact of environmental factors on fish communities. The findings will offer valuable technical insights for the management and monitoring of pelagic fisheries resources.
The study area (111°E–116°E, 9°N–16°N) encompasses the central basin of the SCS, specifically targeting two ecologically significant depth strata: the surface layer (5 m) and the lower euphotic zone (200 m). The selection of the 5 m stratum strategically avoids diurnal surface turbulence caused by wind-wave interactions and solar irradiance fluctuations in the upper layer, while still capturing the epipelagic community (Calbet and Landry, 2004; Bernal et al., 2017; Irigoien et al., 2014). The lower stratum (200 m depth) corresponds to the base of the euphotic zone, where photosynthetically active radiation (PAR) attenuates to approximately 1% of surface irradiance (Klevjer et al., 2016). This transitional boundary marks the maximum penetration depth of daylight and serves as a critical ecotone for diel vertical migratory species (Teixeira et al., 2015; Wang et al., 2019).
Sample collection and environmental parameter measurements were conducted aboard the fisheries research vessel “Nan Feng” operated by the South China Sea Fisheries Research Institute of the Chinese Academy of Fishery Sciences, from May to June 2021. Water samples were collected from 8 sites at two depths: 5 m and 200 m below the sea surface. The distribution of sampling sites in the study area was visualized using Ocean Data View (ODV, Version 5.6.7) (Figure 1). Water samples were collected using a CTD (Sea-Bird CTD, Flnturtd, USA) instrument, with 5 L of water taken at each depth per station. The water samples were stored in 5 L bottles disinfected with bleach. Filtration was performed using 0.22 µm nitrocellulose membranes (Whatman™, GE Healthcare Life Sciences, USA), with each membrane filtering 1 L of water. The membranes were placed in 1.5 mL cryovials and stored in liquid nitrogen until eDNA extraction. Additionally, 1 L of deionized water was filtered as a negative control for each station and depth. All work surfaces were disinfected, and filtration equipment was bleached to minimize contamination risk.
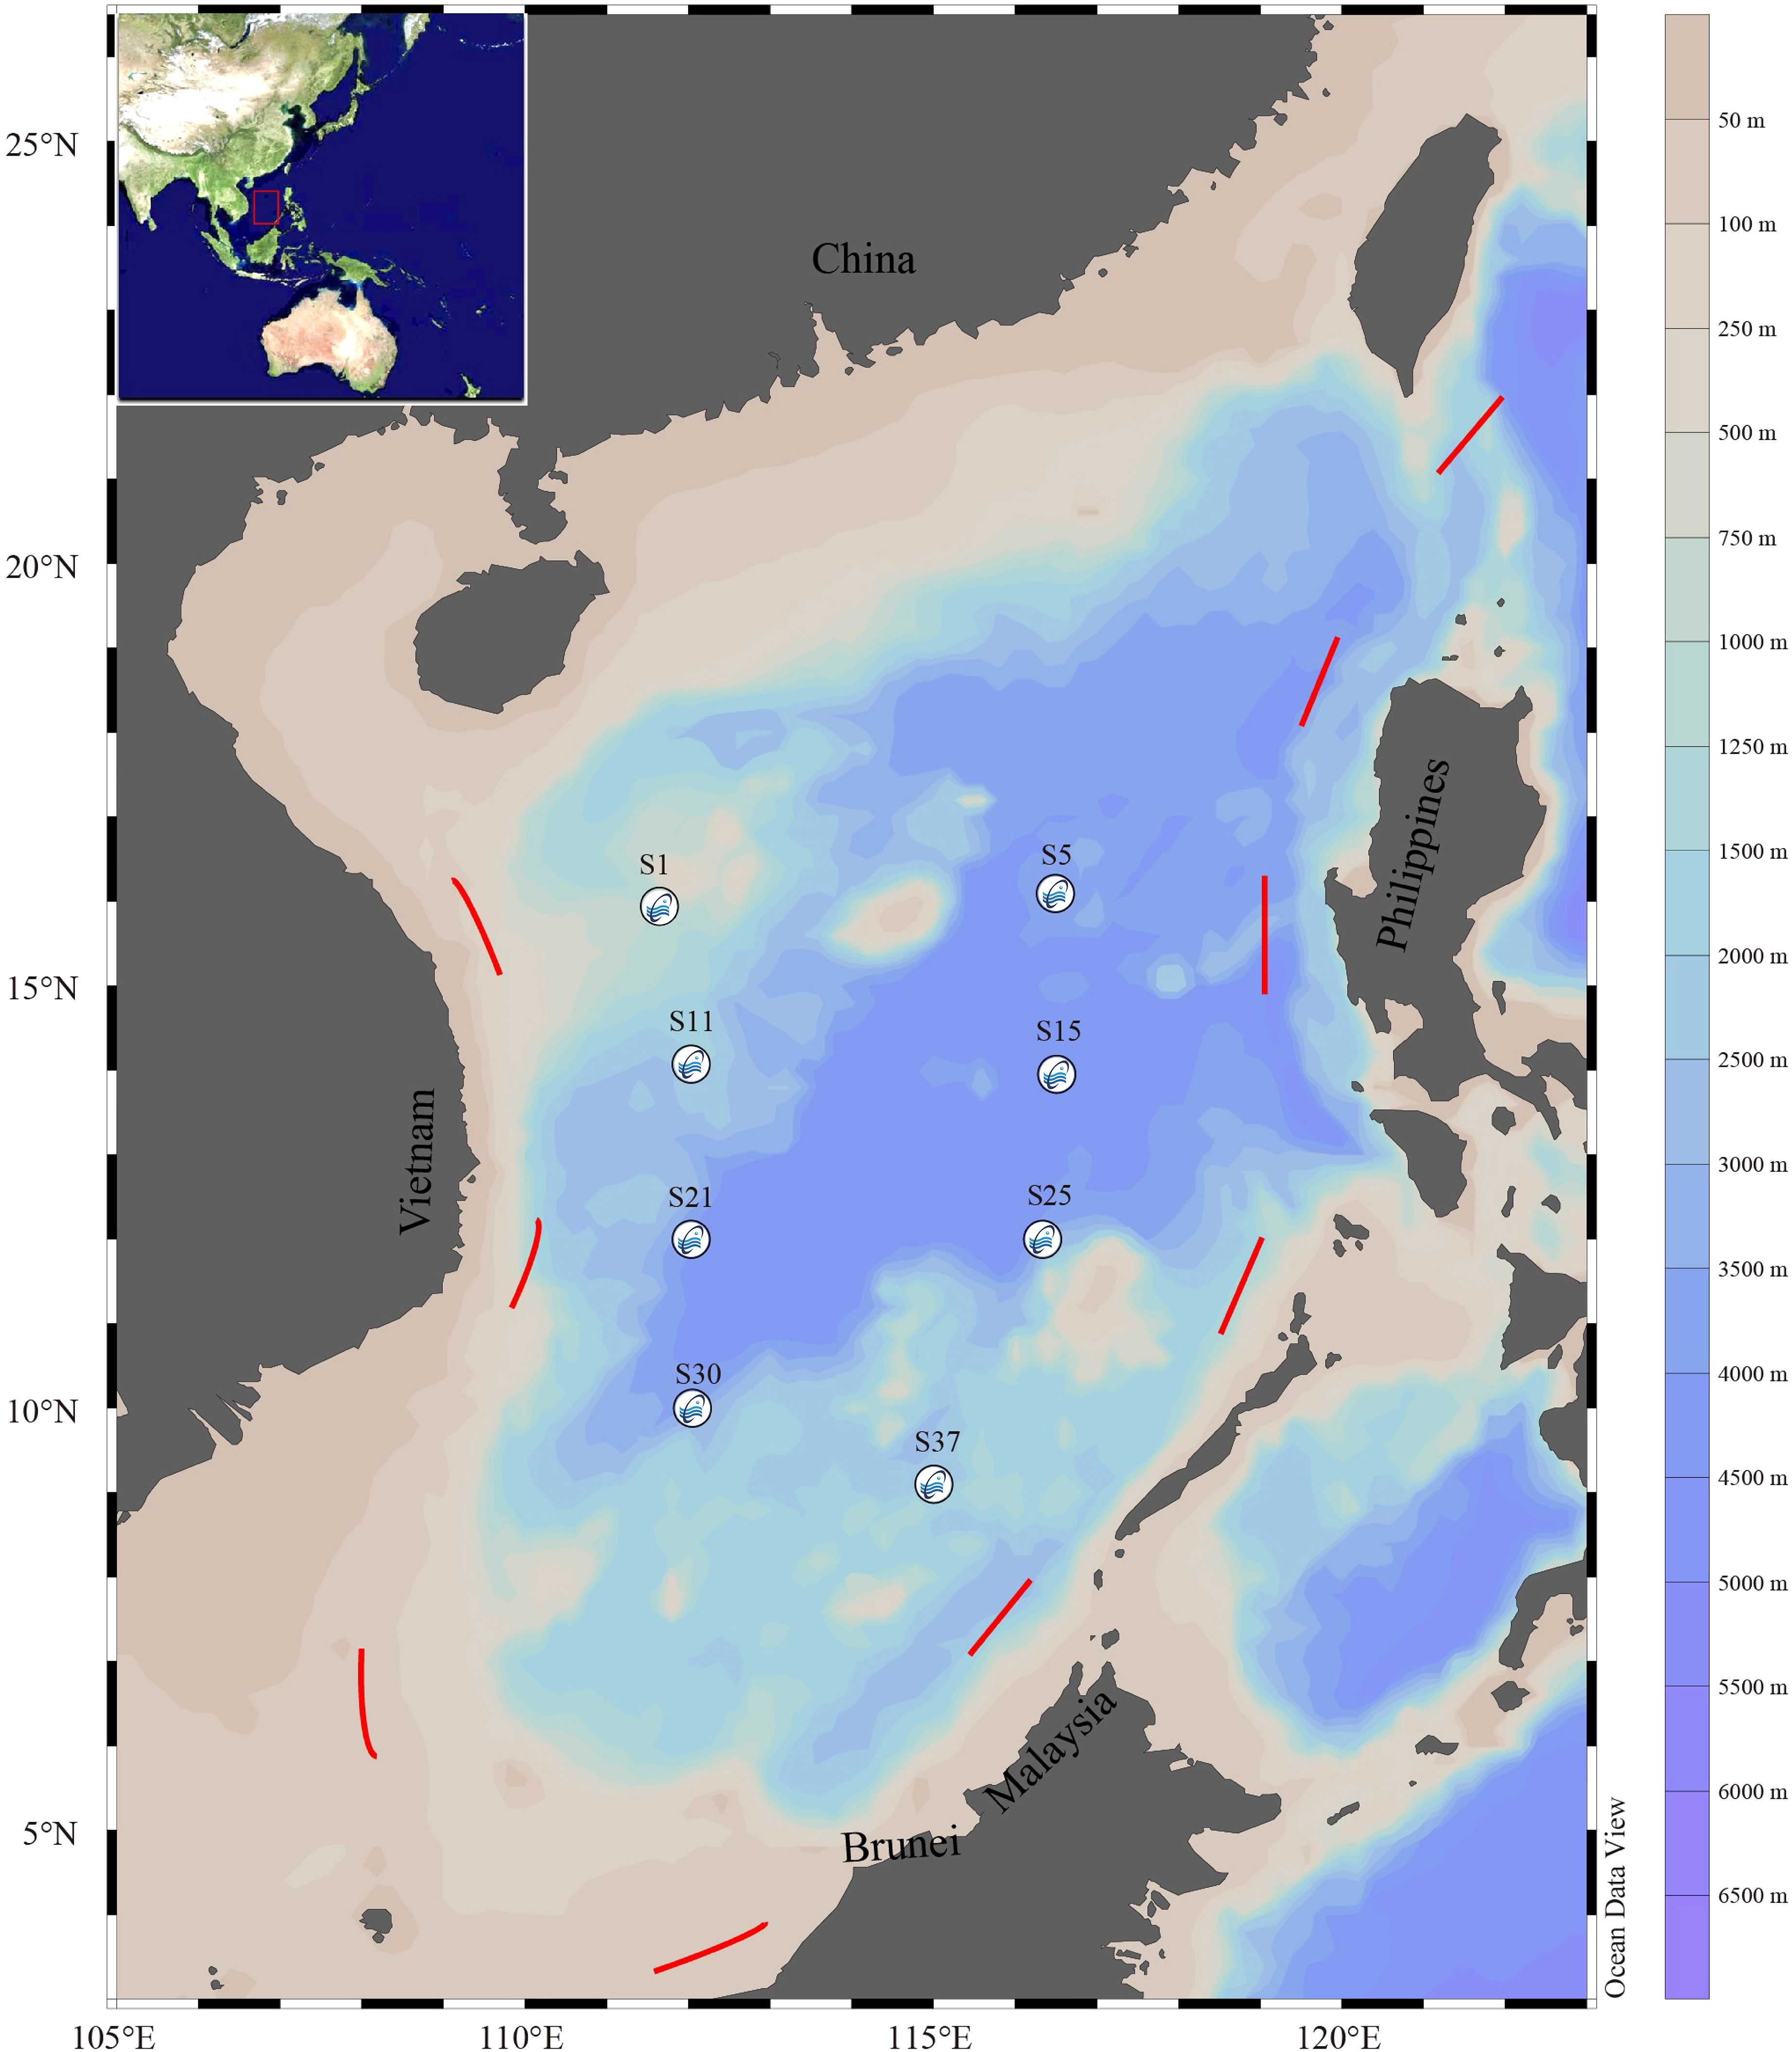
Figure 1. Map showing the sampling locations for eDNA collection in the central region of the South China Sea.
The extraction of DNA was performed using the TIANamp Marine Animals DNA Kit (Tiangen, DP324, China) strictly according to the manufacturer’s protocol provided in the instruction manual. Before the experiment, the laboratory was sterilized using ultraviolet light for 2 h. All necessary materials and reagents for DNA extraction were prepared in advance, with all consumables sterilized by autoclaving. The workbench and hands were disinfected using 75% ethanol before extraction. All reagents and consumables were purchased separately and aliquoted into small portions, and each sample’s extraction was performed using individual sets to avoid cross-contamination. The extraction process was conducted within a laminar flow hood to ensure a sterile environment.
Sample Preparation and DNA Extraction: Filter membranes were cut into small pieces and placed into 2 mL centrifuge tubes. To each sample, 800 µL of GA buffer and 80 µL of proteinase K were added, followed by vortexing. The samples were incubated at 56°C for 2.5 h, with periodic vortexing every 30 min. Then, 500 µL of GB buffer was added, and the mixture was incubated at 70°C for 10 min, followed by centrifugation at 12,000 rpm for 30 s. The supernatant was transferred to a new tube. DNA Purification and Elution: Absolute ethanol (400 µL) was added to the mixture, mixed, and transferred into a CB3 spin column. The column was centrifuged at 12,000 rpm for 30 s, and the flow-through was discarded. Successive washes with GD buffer and PW wash buffer were performed, with centrifugation steps at 12,000 rpm. After drying, 100 µL of TE buffer was added to the column and incubated at room temperature for 10 min. DNA was eluted by centrifuging at 12,000 rpm for 2 min, and this step was repeated to collect the DNA. A blank filter and negative control were extracted alongside the samples using the same procedure. The DNA concentration of the extracted samples was measured using a microvolume spectrophotometer, and 2% agarose gel electrophoresis was used to check for contamination in the control groups. The DNA samples were stored at –20°C for further PCR amplification.
This study utilized the universal fish 12S primers (MiFish U-F: 5′-GTCGGTAAAACTCGTGCCAGC-3′, MiFish U-R: 5′-CATAGTGGGGTATCTAATCCCAGTTTG-3′) to amplify the eDNA template via PCR, generating an amplicon of approximately 180 bp (Miya et al., 2015). The PCR mixture consisted of 25 µL of Pro Taq Master Mix (Accurate Biology, China), 3 µL of DNA template, 2 µL of each primer, and 18 µL of ultrapure water (DNase, RNase and Protease-Free). The PCR cycling conditions were as follows: initial denaturation at 98°C for 10 min, followed by 10 cycles of denaturation at 98°C for 10 s, annealing at 58°C for 30 s, and extension at 72°C for 20 s; then 10 cycles with annealing at 56°C for 30 s and extension at 72°C for 20 s; followed by 15 cycles with annealing at 54°C for 30 s and extension at 72°C for 20 s; and a final extension at 72°C for 5 min. Each sample was subjected to triplicate PCR reactions. ddH2O was used as a negative control for all reactions, and 2% agarose gel electrophoresis was used to check the PCR products. The results indicated that no target bands were present in the negative controls, confirming no contamination by exogenous fish DNA. PCR products were detected in samples from all eight sites. PCR products were detected in samples from all eight sites. Libraries preparation and high-throughput sequencing followed the approach used in Jiang et al. (2023). All libraries were then sequenced on the Illumina Nova6000 platform, generating 250 bp paired-end reads. (Guangdong Magigene Biotechnology Co., ltd. Guangzhou, China).
The environmental data from the 5 m and 200 m water layers in the central SCS include temperature (Temp), salinity (Sal), dissolved oxygen (DO), pH, Chl-a, NO2- (NO2), NO3- (NO3), NH4+ (NH4), total inorganic nitrogen (TIN), PO43- (PO4), and SiO32-. The process of acquiring environmental data is as follows: First, real-time water column data, including salinity (Sal) and temperature (Temp) measured by the ship’s CTD, as well as dissolved oxygen (DO) and pH values measured on-site using a YSI (YSI ProDSS, USA), were collected. Next, water samples for the analysis of chlorophyll and nutrients were collected from the two water layers using the CTD. The chlorophyll samples were pre-processed by filtering the water through a 0.45 μm glass fiber membrane, which was then wrapped in aluminum foil and stored in sealed bags. The nutrient samples were pre-processed by filtering the water through a 0.22 μm acetate fiber membrane, and the filtered water was collected in sterilized 500 ml bottles. The pre-processed samples were stored in a –40°C freezer for preservation. Finally, in the laboratory, the concentrations of Chl-a were measured using spectrophotometry, NO2- (NO2) and NO3- (NO3) using colorimetric methods, NH4+ (NH4) using colorimetric analysis with Nessler’s reagent, total inorganic nitrogen (TIN) using the colorimetric method, PO43- (PO4) using colorimetric methods., and SiO32- (SiO3) using colorimetric methods.
In the processing of high-throughput sequencing data after sequencing, quality control is first performed to ensure the reliability of the data (Zhang et al., 2023). Fastp is used for quality filtering of raw sequencing data to remove low-quality reads, and a sliding window method (-W4 -M20) is applied to ensure the sequences meet quality standards (Callahan et al., 2017; Bokulich et al., 2013). Further, the DADA2 denoising plugin is used to remove noise, eliminate chimeric sequences, and cluster the remaining sequences into Amplicon Sequence Variants (ASVs). ASVs are unique DNA sequences obtained from high-throughput sequencing of marker genes, commonly used in eDNA studies to identify and quantify biodiversity (Callahan et al., 2016). Each ASV represents a distinct genetic variant, typically corresponding to a specific taxonomic unit, such as a species or genus, depending on the resolution of the reference database (Callahan et al., 2017). However, a single ASV read does not directly equate to an individual organism; rather, it reflects the presence of a specific genetic marker in the sampled environment (Deiner et al., 2017). The number of ASV reads can be influenced by factors such as DNA shedding rates, sequencing depth, and PCR amplification biases, making it a relative rather than absolute measure of abundance (Elbrecht and Leese, 2015; Lahoz-Monfort et al., 2016).After performing blastn sequence alignment of ASVs against the NCBI database, a threshold of 98% sequence similarity is selected to ensure higher accuracy, and only ASVs with ≥ 98% similarity are classified as specific species (Marques et al., 2020; Ruan et al., 2022). Based on the sequence analysis results from each sampling point, fish species that were either unmatched or absent from the central SCS are removed. ASVs identified as the same species are then merged and classified. ASVs belonging to the same species are merged into a single Operational Taxonomic Unit (OTU). The taxonomic composition is visualized at four taxonomic levels (Order, Family, Genus, Species) using Fishbase, showing the abundance and species count of different sequences (Boulanger et al., 2021).
The fish species detected via eDNA reflect the local fish diversity, while sequence reads provide count data. Thus, we used the total reads of all detected fish species, along with multiple environmental factors, to construct a GAM model to examine how these factors influence fish communities across different water layers. This study employed GAMs to model the total reads of fish of all fish species detected by eDNA, while accounting for environmental factors. Two separate GAMs were established to explain the 5 m and 200 m water layers investigated in the study. The total reads of fish detected by eDNA at the 5 m and 200 m water layers was used as the response variable, while multiple environmental factors were included as explanatory variables (Zhu et al., 2024).
The general expression for all GAMs is:
Before constructing the models, highly correlated explanatory variables were excluded based on the variance inflation factor (VIF) to avoid collinearity affecting model accuracy (Ma et al., 2020). The VIF threshold was set at 5, and variables with a VIF greater than 5 were removed (Liu et al., 2021; Ma et al., 2022). To determine which variables fit the model, Akaike Information Criterion (AIC) and a stepwise selection method were applied to obtain the optimal model (Venables and Dichmont, 2004). The AIC is calculated as:
where k is the number of parameters, and L is the likelihood function. A smaller AIC value indicates a better model fit. The GAM was run in RStudio 4.3.2 using the “mgcv” package (Wood, 2010).
Species richness was analyzed using total reads of fish species from each station. Origin 2021(OriginLab Corporation, Northampton, MA, USA) was used to plot stacked bar charts of fish species percentages, showing the relative abundance of fish species in the central SCS to analyze the composition of fish species in this area. To explore the differences in fish diversity between the 5 m and 200 m water layers in the central SCS, several α-diversity indices (Shannon index, Simpson index, Chao1 index, and Pielou’s evenness) were calculated using R, and boxplots of the α-diversity indices were drawn using Origin. Additionally, significance analysis was conducted using Pearson tests. To further investigate the differences in fish community structure between the 5 m and 200 m water layers, non-metric multidimensional scaling (NMDS) analysis based on Bray-Curtis distances was performed using the “metaMDS” function from the R package vegan (Dixon, 2003). Finally, the significance of these results was tested using permutational multivariate analysis of variance (PERMANOVA) via the “adonis2” function in the vegan package.
A total of 14 amplicons were obtained from 8 stations at a depth of 5 m and 200 m (Amplification failed for S1 and S37 at 200 m). This study obtained a total of 2,092 sequences using eDNA technology. Through sequence clustering and species annotation, 190 fish species were identified, belonging to 32 orders, 68 families, and 135 genera (Figure 2A). Among these, 184 species were found at 5 m and 178 species at 200 m, with 172 species common to both depths (Figure 2B). The top five orders were Perciformes (30 species, 15.79%), Myctophiformes (20 species, 10.53%), Carangiformes (12 species, 6.32%), Labriformes (12 species, 6.32%), and Tetraodontiformes (10 species, 5.26%) (Figure 2A). Based on the overall relative abundance of fish in this marine area, the five fish species with the highest reads were Decapterus macrosoma, Carangoides fulvoguttatus, Cephalopholis spiloparaea, Decapterus maruadsi, and Gnathodentex aureolineatus (Figure 3).
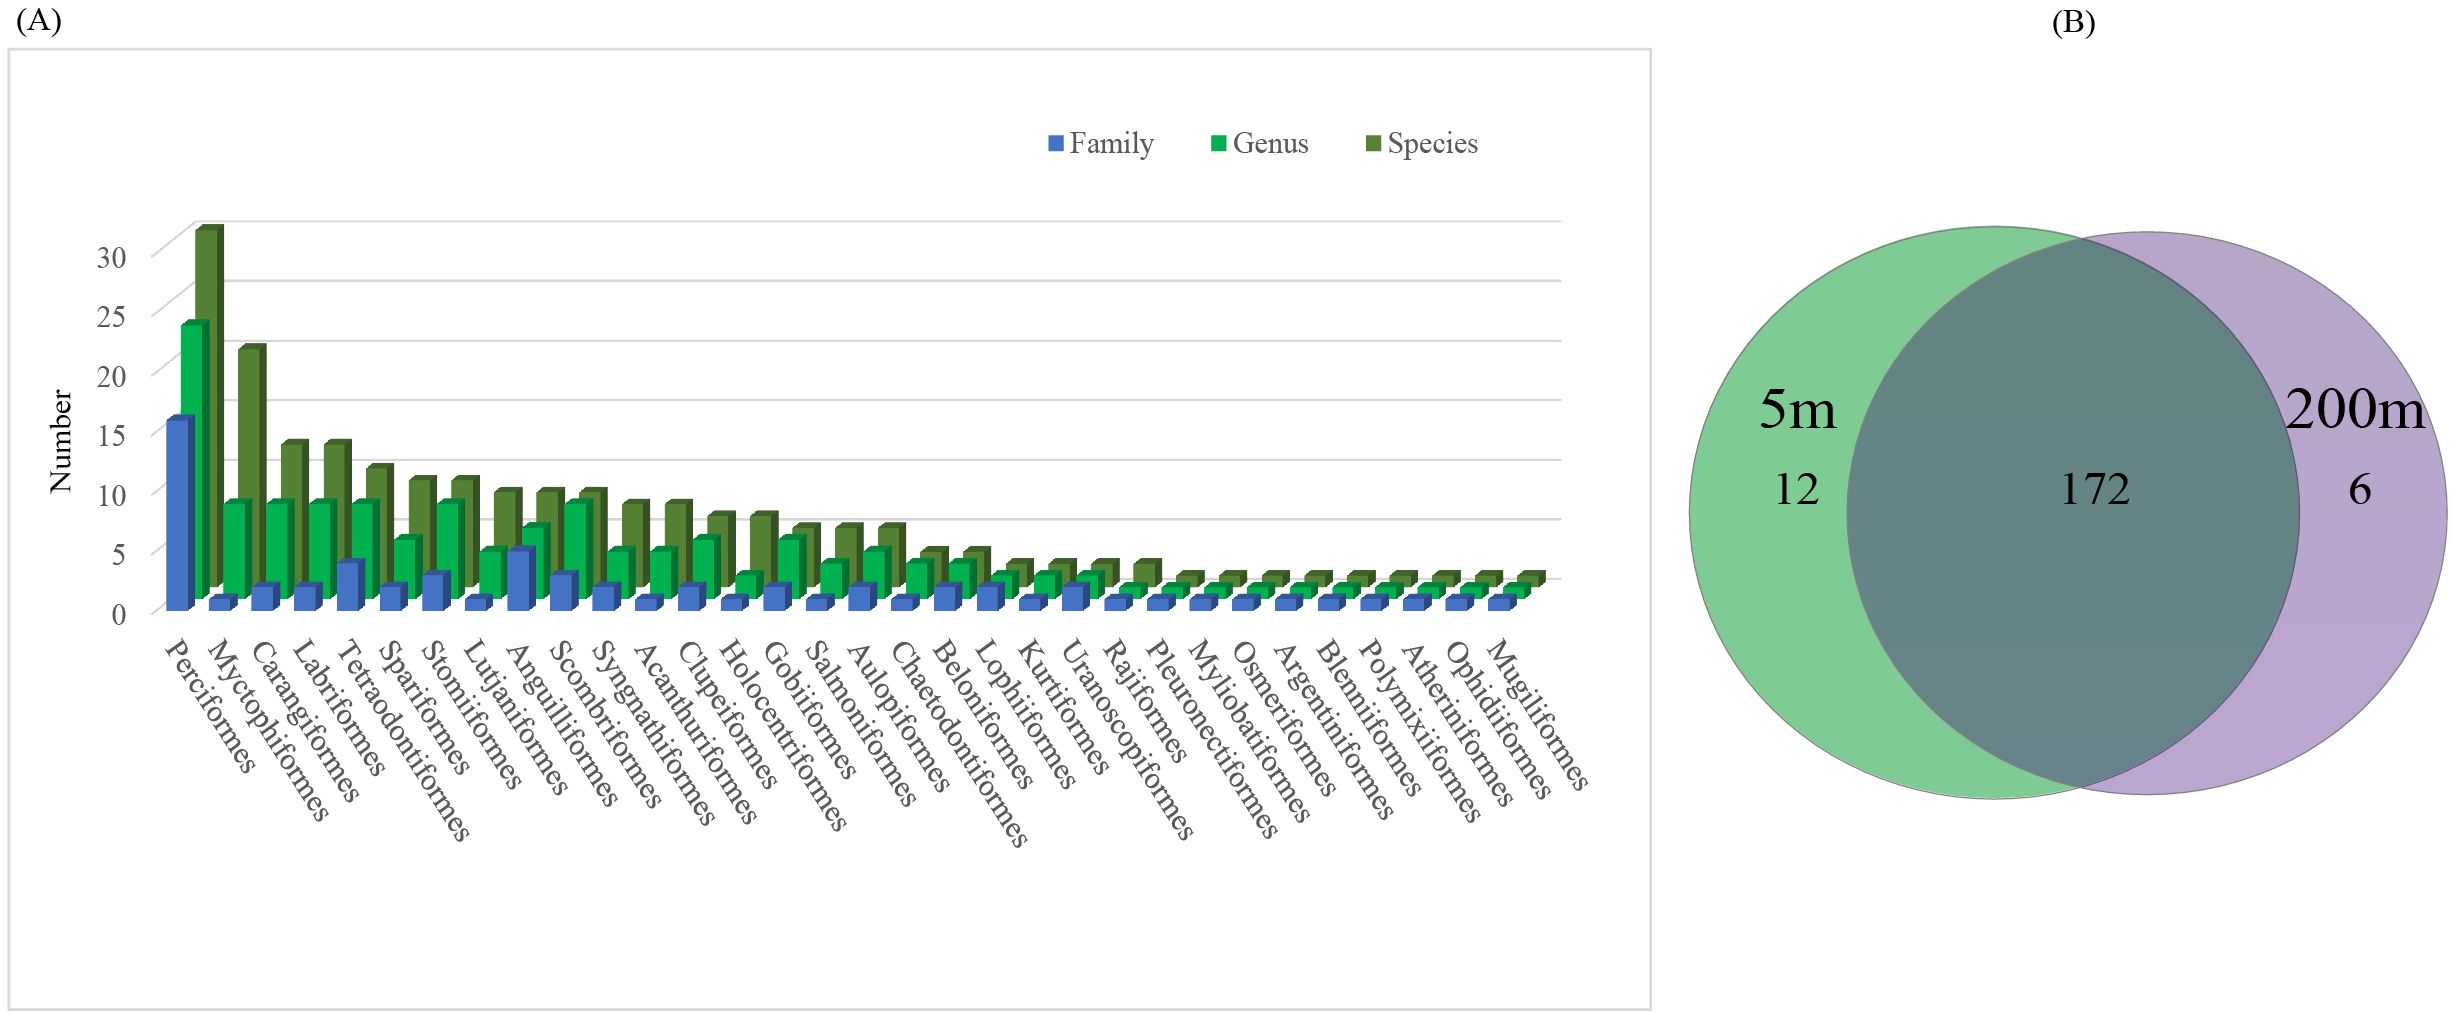
Figure 2. The composition of fish family, genus, and species (A) detected through eDNA in the central South China Sea is described. A comparison of fish species detected using eDNA at the 5 m and 200 m water layers (B).
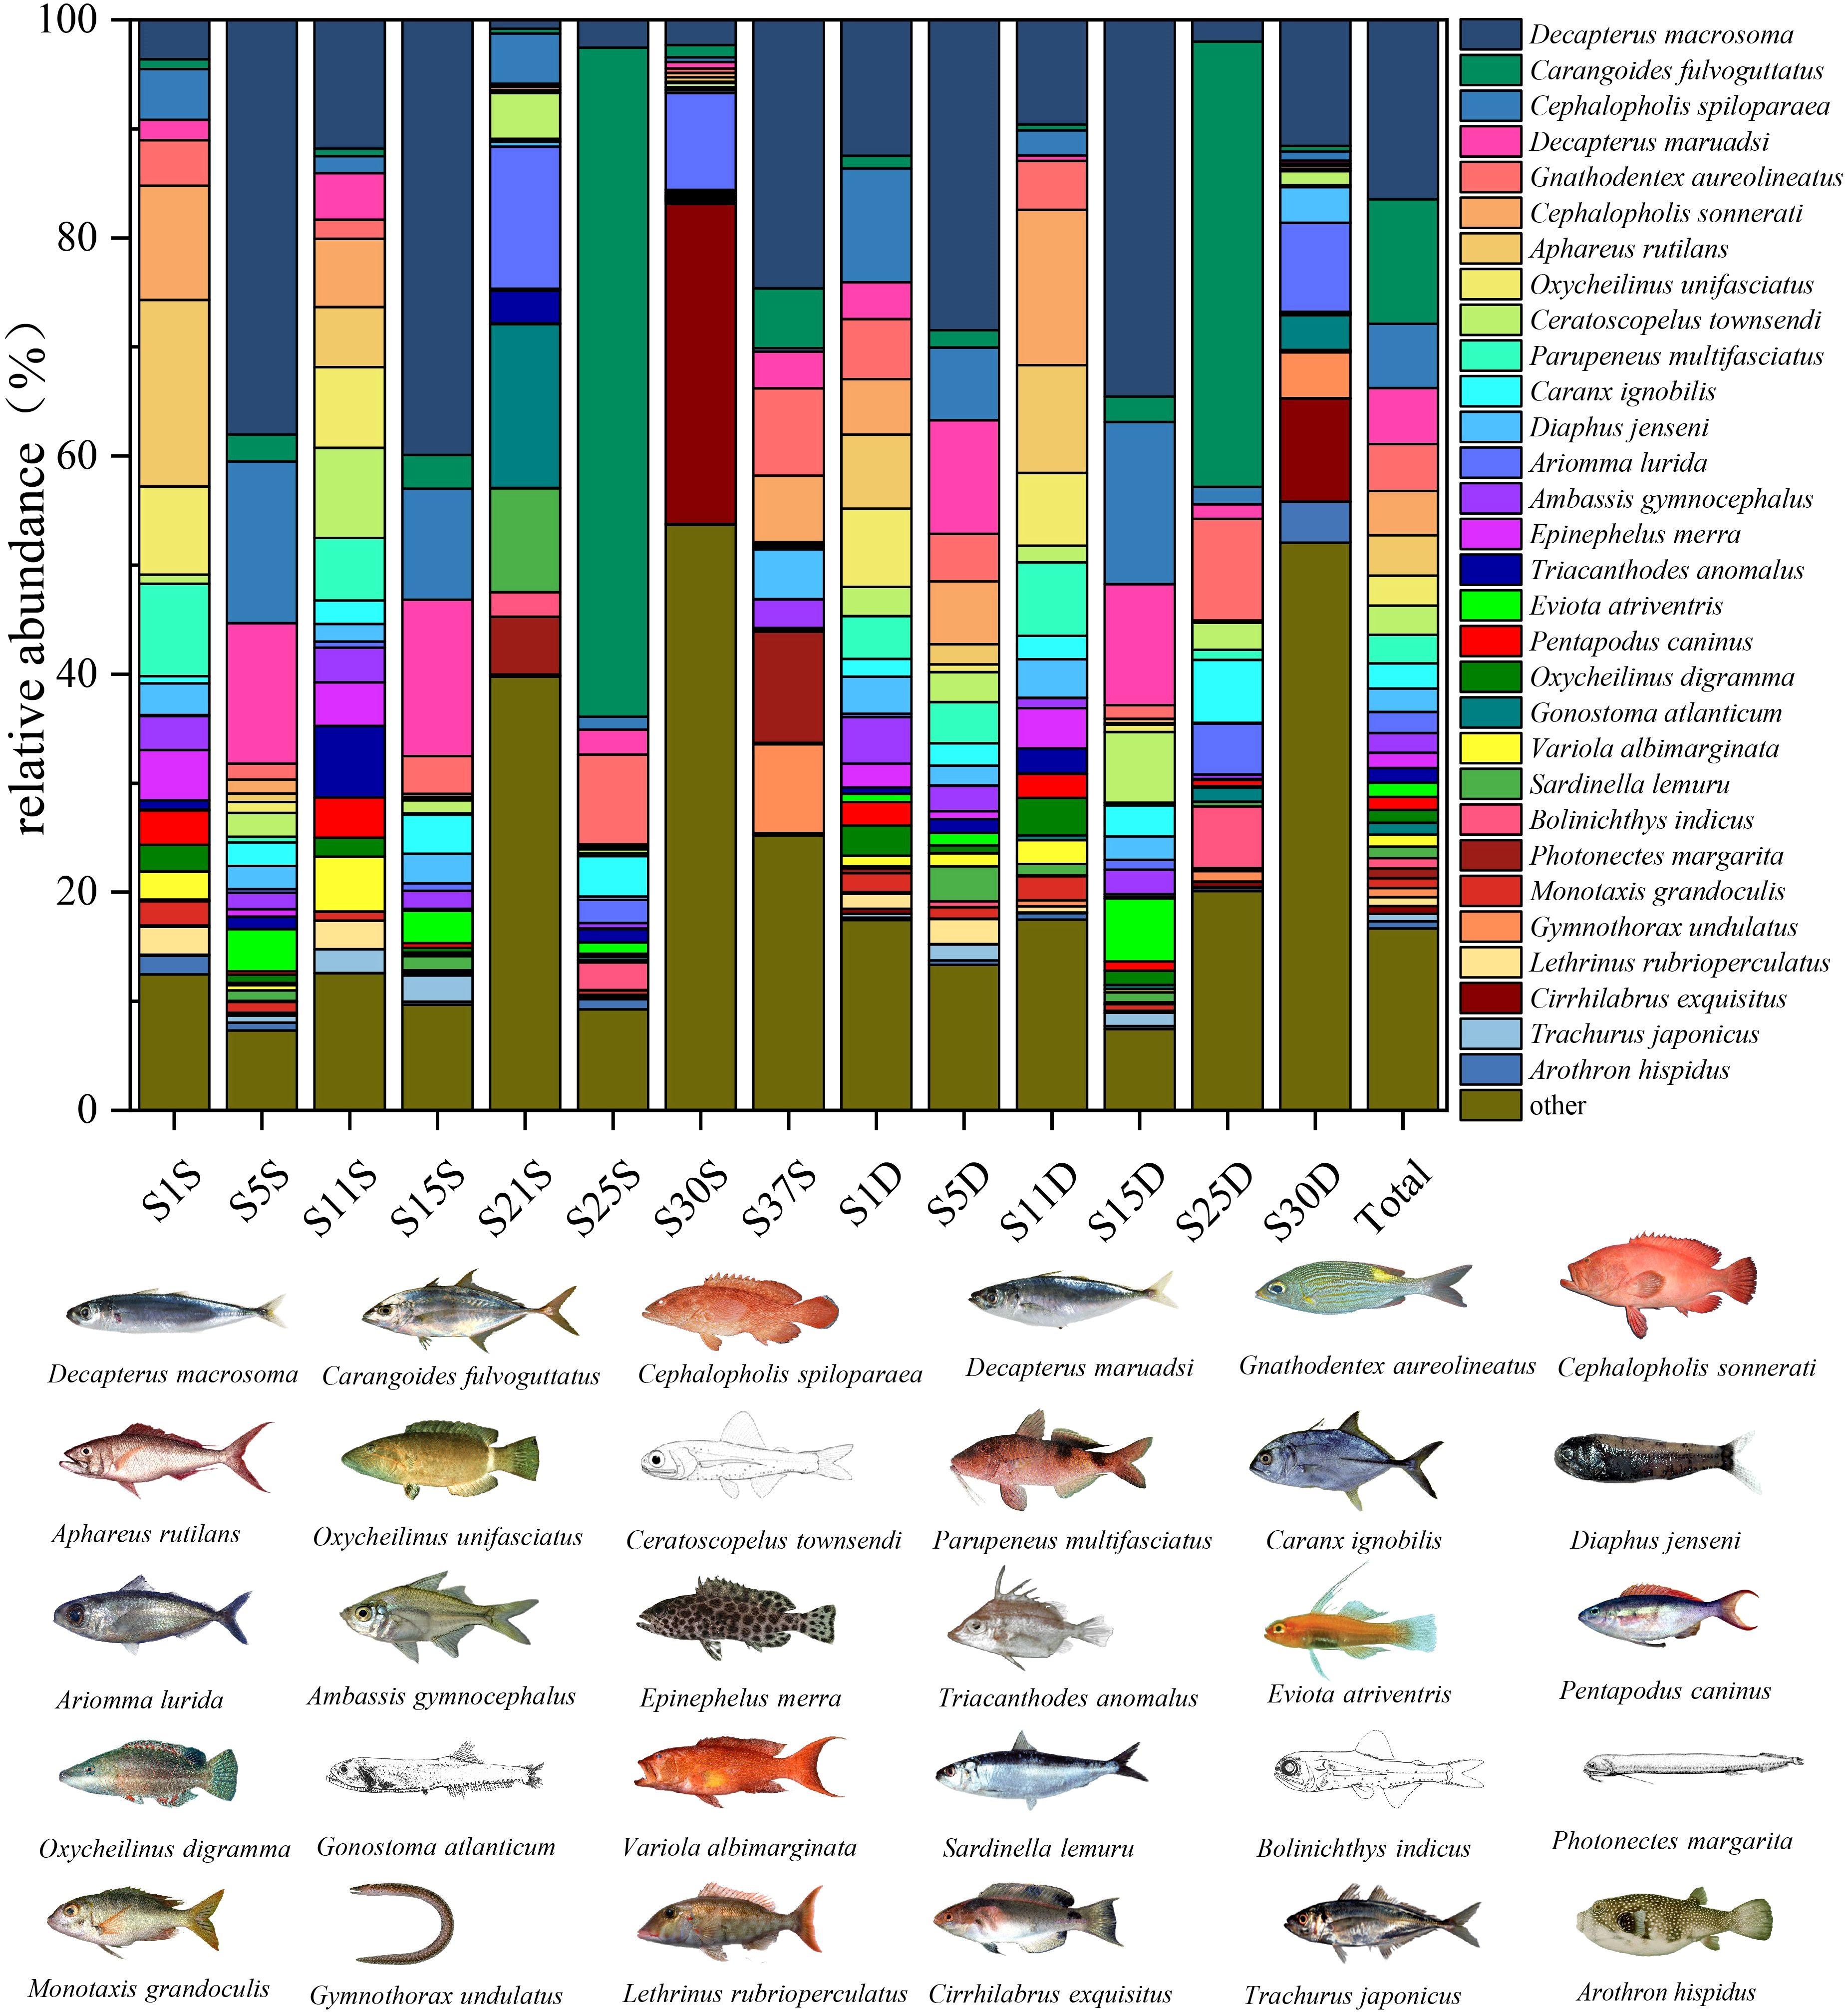
Figure 3. The relative abundance (%) of fish species detected at each sampling site and the total number of fish species across all sites based on eDNA analysis. For each site, the top 30 fish species with the highest total read counts were displayed, while the remaining species were grouped under “Other.” “S” represents the 5 m water layer, “D” represents the 200 m water layer, and “Total” refers to the total number of fish species detected across all sampling sites.
By calculating α-diversity indices to evaluate species diversity within habitats, this study analyzes the correlations in fish diversity across different water layers using the Shannon index, Simpson index, Chao1 index, and Pielou’s evenness. The α-diversity indices for fish at each station in the central SCS are shown in Supplementary Table S1. The Shannon index ranged from 1.89 to 3.39, with an average of 2.60 at the 5 m layer and 3.00 at the 200 m layer. The Simpson index ranged from 0.61 to 0.95, with an average of 0.84 at the 5 m layer and 0.86 at the 200 m layer. The Chao1 index ranged from 115.5 to 175.23, with an average of 150.94 at the 5 m layer and 149.22 at the 200 m layer. Pielou’s evenness ranged from 0.39 to 0.68, with an average of 0.54 at the 5 m layer and 0.62 at the 200 m layer. There were no significant differences in α-diversity indices between the 5 m and 200 m layers in the central SCS (p > 0.05) (Figure 4A).
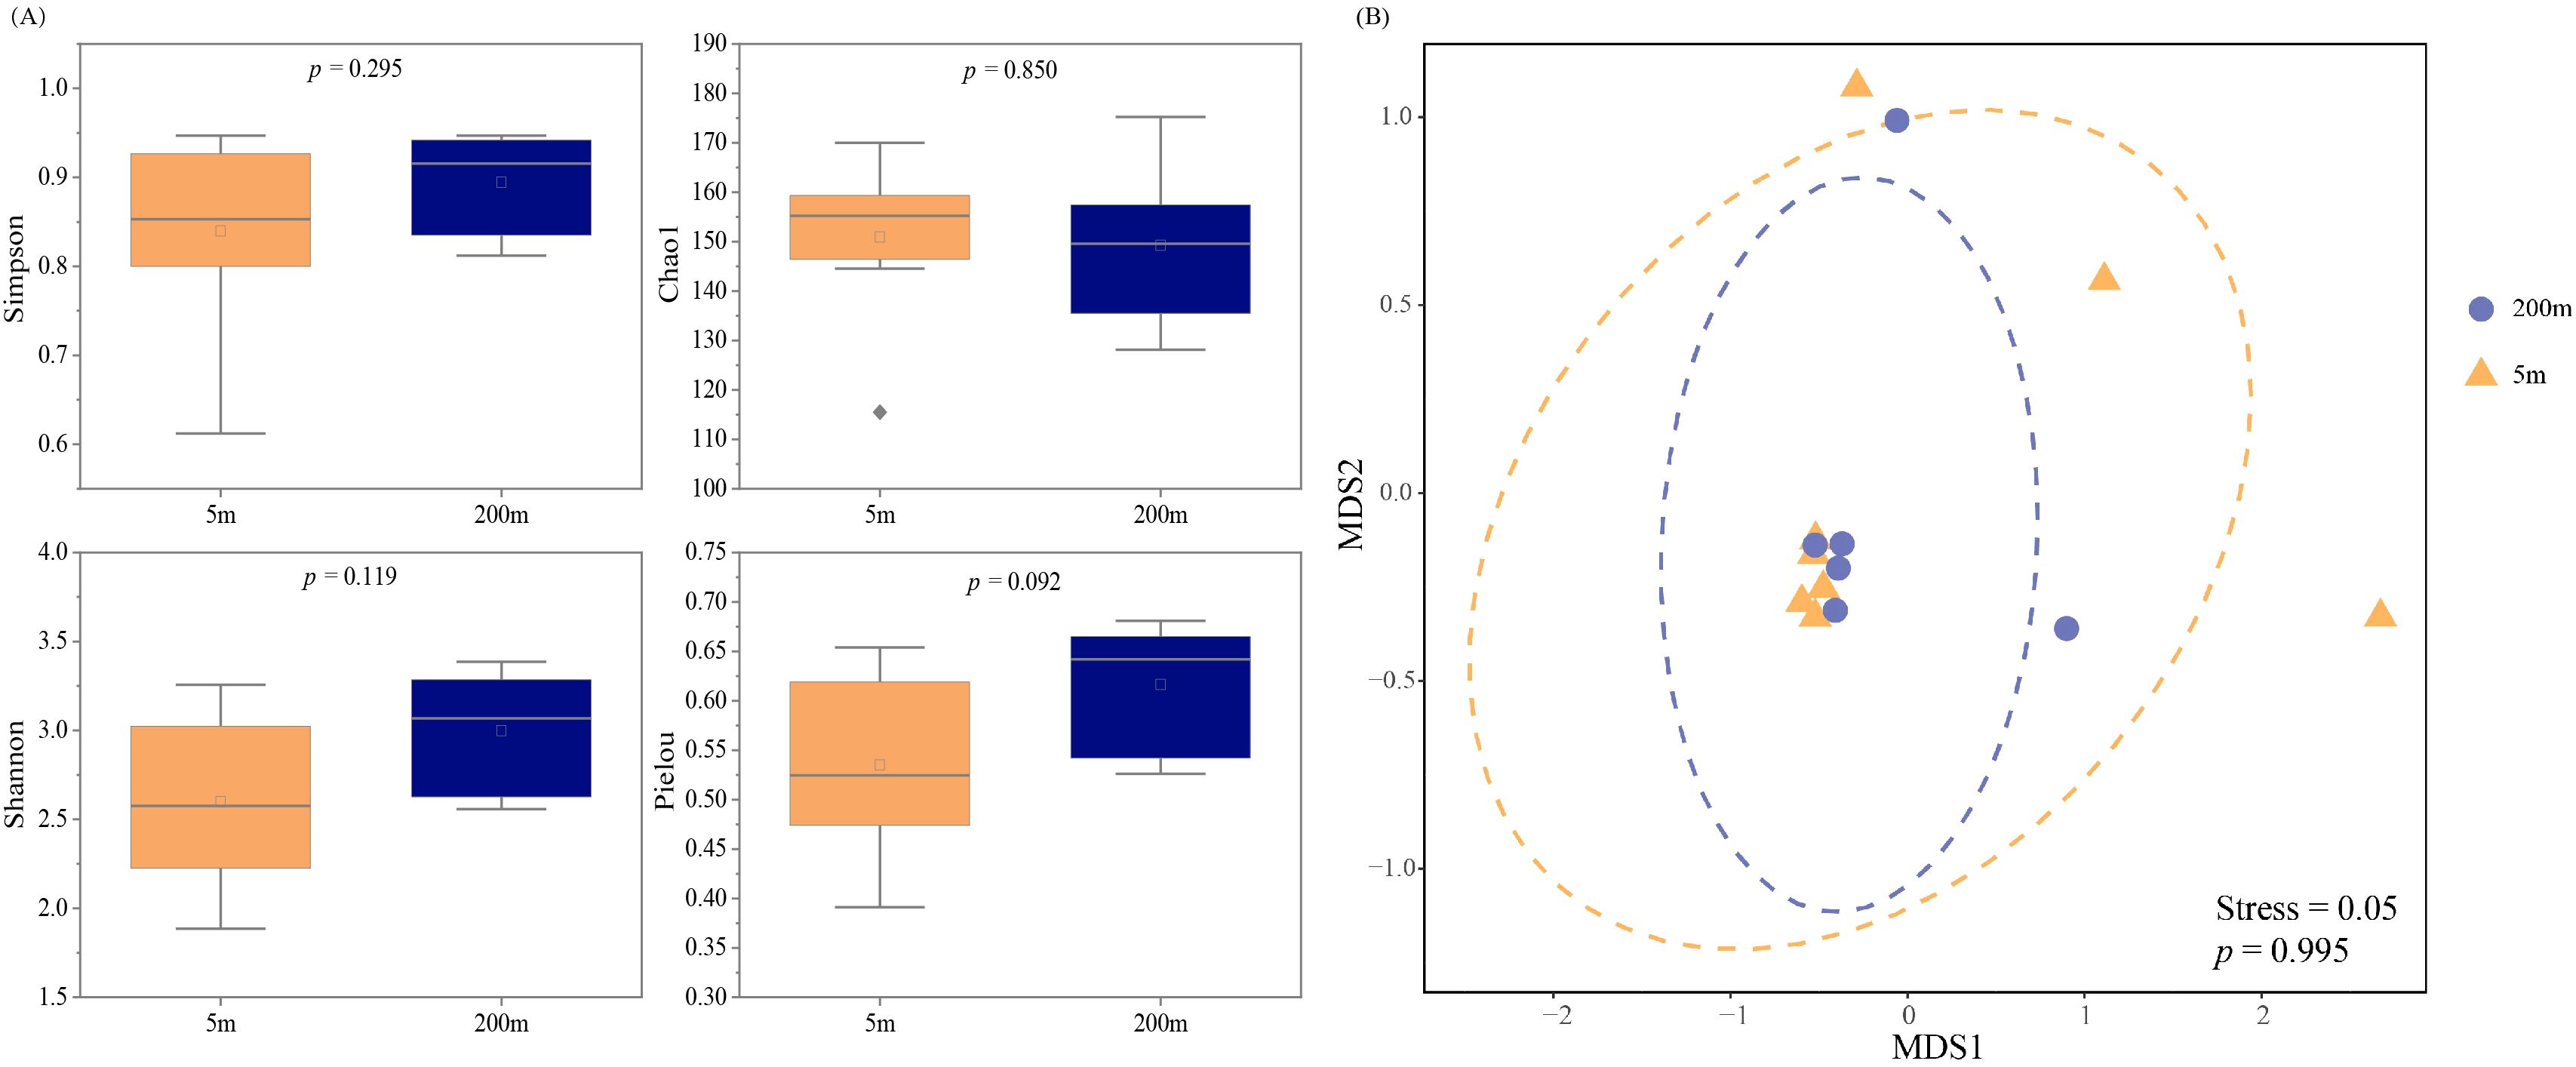
Figure 4. The fish α-diversity (A) (Shannon index, Simpson index, Chao1 index, and Pielou index) at the 5 m and 200 m water layers in the central South China Sea, as detected by eDNA, along with the β-diversity (NMDS) (B).
NMDS based on the Bray-Curtis dissimilarity index (Figure 4B) revealed vertical differences in the fish community composition between sampling points at 5 m and 200 m water layers in the central SCS. Grouping the sampling points by water layer and testing with PERMANOVA, no significant difference in fish community composition was found between the 5 m and 200 m water layers (p > 0.05). The NMDS analysis yielded a stress value of 0.046, indicating that the two-dimensional ordination plot provides a good representation of the community structure.
There were significant changes in environmental parameters between the 5 m and 200 m water layers in the central SCS. From 5 m to 200 m, Temp (independent-sample t-test, p < 0.001), DO (p < 0.01), pH (p < 0.001), NH4 (p < 0.05), and Chl-a (p < 0.01) significantly decreased. At the same time, Sal (p < 0.001), NO3 (p < 0.001), TIN (p < 0.01), PO4 (p < 0.001), and SiO3 (p < 0.001) significantly increased. NO2 was the only parameter without a significant difference (p > 0.05) (Figure 5A).
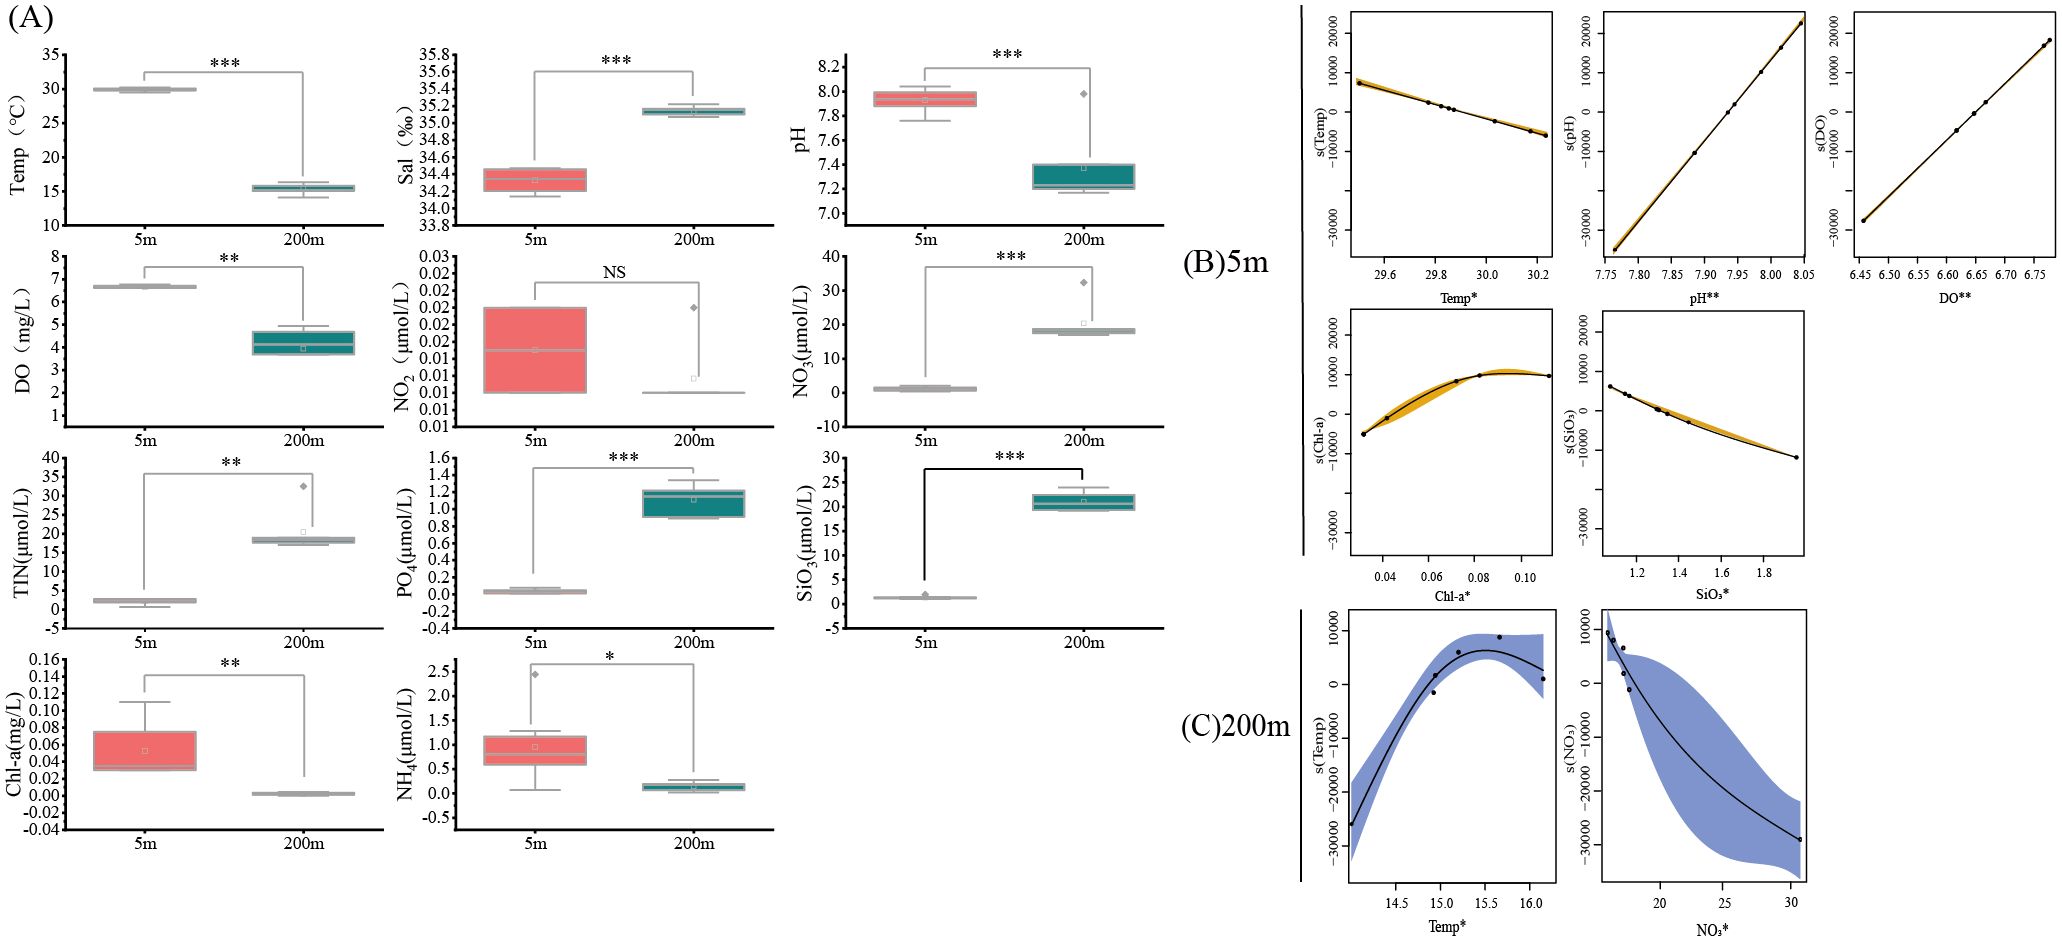
Figure 5. Comparison of different environmental factors between the 5 m and 200 m water layers in the central South China Sea (A), and the effects of environmental factors on total reads of fishat sampling points in the 5 m (B) and 200 m (C) water layers in the central South China Sea based on the optimal GAM model. (Note: ‘NS’: not significant; *: p < 0.05, Differences exist; **: p < 0.01, Significant differences; ***: p < 0.001, Extremely significant differences).
Collinearity analysis was performed for all environmental factors at both the 5 m and 200 m layers, and variables with high collinearity were excluded based on VIF values below 5. For the 5 m layer, environmental factors such as Sal, NO2, NO3, NH4, TIN, and PO4 were excluded. The optimal GAMs were constructed using the selected environmental factors: Temp, pH, DO, Chl-a, SiO3. In the case of the 200 m water layer, environmental factors such as DO, Sal, NO2, Chl-a, pH, NH4, TIN, PO4, SiO3 were excluded. The best GAMs were built using the selected environmental factors: Temp, NO3.
Stepwise model construction was employed, and the optimal models were determined based on AIC values. The cumulative deviance explained by the final models was 88.63% for the 5 m layer (AIC = 128.56) and 70.52% for the 200 m layer (AIC = 111.64), meeting the conditions for the best GAMs (Table 1). While the contributions of different environmental factors to total reads of fish varied between the two layers, Temp made a significant contribution to each optimal GAMs.
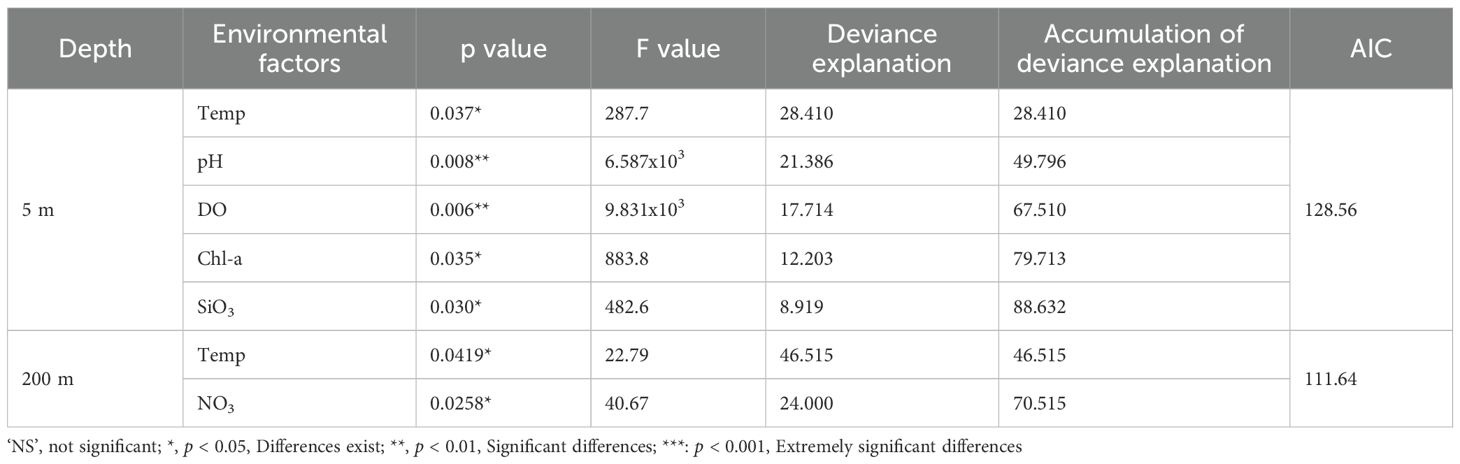
Table 1. The relevant parameters for each explanatory variable in the best GAMs for the 5 m and 200 m water layers in the central South China Sea.
The nonlinear relationships between explanatory variables and response variables at the 5 m water layer are shown in Figure 5B. Narrower confidence intervals indicate a higher correlation. In the GAMs for the 5 m water layer, the differences in total reads of fish for all variables were highly significant (p < 0.01) (Table 1). Temperature had a negative correlation with total reads of fish, which decreased as temperature increased. pH showed a positive correlation, with total reads of fish increasing as pH rose. Dissolved oxygen also had a positive correlation, with total reads of fish increasing alongside higher oxygen levels. The relationship between chlorophyll-a and total reads of fishfollowed an initial increase, then levelled off, with the highest total reads of fish observed at a chlorophyll-a concentration of 0.08 mg/L. Silicate exhibited a negative correlation, with total reads of fish decreasing as silicate concentrations increased.
The nonlinear relationships at the 200 m water layer are shown in Figure 5C. Narrower confidence intervals again indicate a higher correlation. In the GAMs for the 200 m layer, the differences in total reads of fish for all variables were significant (p < 0.05). The relationship between temperature and total reads of fish followed an increase and then a decline, with the highest total reads of fish observed at around 15.5°C. Nitrate had a negative correlation with total reads of fish, though its correlation was weaker due to a larger confidence interval.
This study utilizes eDNA technology to evaluate fish species composition and diversity in the central SCS, while concurrently assessing the effects of environmental factors on fish community. Compared to traditional methodologies, eDNA offers substantial benefits in ecological surveys, including greater efficiency, ease of use, and reduced invasiveness (Ammon et al., 2023). In contrast, conventional approaches frequently encounter challenges in completing comprehensive data collection in a single survey. Consequently, eDNA has emerged as a highly promising tool for biodiversity monitoring and species identification (Xu et al., 2021; Zhou et al., 2024). In this study, eDNA facilitated the identification of 190 fish species in the central SCS, surpassing the number of species detected through traditional trawling methods. Additionally, by applying GAMs, we examined the relationship between environmental factors and total reads of fish, advancing our understanding of fish diversity and the environmental determinants shaping these communities in the region.
Previous studies on oceanic fish diversity in the SCS have primarily relied on traditional methods such as trawling, light trapping, and handlining to collect biological samples for morphological identification, resulting in relatively incomplete data (Valdivia-Carrillo et al., 2021). In addition, traditional survey methods typically provide instantaneous assessments of fish diversity. Research indicates that eDNA released by aquatic organisms can remain detectable in water systems for 72 hours to 21 days post-shedding (Barnes et al., 2020; Troth et al., 2021). The exceptional sensitivity of eDNA techniques enables detection of genetic material even at ultralow concentrations (Furlan et al., 2016; Song et al., 2020), making metabarcoding an effective method for capturing temporal biodiversity patterns. Current fish diversity assessments through eDNA analysis focus on two key parameters: spatial distribution patterns and population density across habitats (Sales et al., 2021; Zhu et al., 2023). Controlled laboratory experiments (Klymus et al., 2015; Yamamoto et al., 2016) and field studies in diverse aquatic environments-including freshwater ecosystems (Doi et al., 2017; Hu et al., 2022), estuarine zones (Jiang et al., 2023), and marine systems (Boussarie et al., 2018; Valdivia-Carrillo et al., 2021)-consistently demonstrate significant positive correlations between species abundance/biomass and corresponding eDNA concentrations. However, recent findings suggest this relationship may be disproportionately influenced by high-abundance species, potentially due to taxonomic biases during PCR amplification and metabarcoding processes (Skelton et al., 2022). These methodological limitations necessitate cautious interpretation of quantitative eDNA data.
This study used eDNA technology to analyze the composition of fish species in the central SCS, detecting 190 species. Compared to previous fish resource surveys in the SCS (Appendix Supplementary Table S2), Zhang et al. (2016b), discovered 84 fish species using acoustic and light trap surveys. Xu et al. (2016), identified 115 fish species in the autumn of 2014 and 150 species in the winter of 2015 using mid-water trawls. Li et al. (2016), found 18 fish species using acoustic and light trap surveys. Diao et al. (2022), detected 61 fish species in the central SCS using eDNA technology. In this study, a greater number of fish species were identified. Although Hou et al. (2022), surveyed economically important epipelagic fish using acoustic and light trapping methods, this study did not detect species such as Thunnus albacares, Katsuwonus pelamis, Auxis rochei, and Selar crumenophthalmus, likely due to fewer sampling stations. Previous surveys indicate that fish communities in the central SCS are dominated by Perciformes, Myctophiformes, and Carangiformes, with Decapterus macrosoma, Decapterus maruadsi, and Decapterus macarellus being the dominant species, which are also the main targets of offshore oceanic fisheries (Zhang et al., 2018, 2016). In summary, at the taxonomic order level, the results of this study show similarities with the fish species identified through traditional survey methods.
In this study, the number of species between the two water layers was similar, with 184 species detected at 5 m and 178 species at 200 m. Studies suggest that oceanic fish communities are mainly concentrated at 0–50 m (Kang et al., 2024; Zhu et al., 2024), and this study lacks sampling at the 50 m water layer, which requires improvement in future research. The study also detected reef fish species such as Cephalopholis spiloparaea, Gnathodentex aureolineatus, and Cephalopholis sonnerati, whose eDNA signals may come from larvae or eggs, possibly found farther from the adult habitats (Govindarajan et al., 2023; Madduppa et al., 2021). Overall, this study demonstrates that eDNA technology can reveal hidden species diversity undetectable by traditional monitoring methods, emphasizing its importance in exploring marine fish resources. As an efficient and sensitive biological detection tool, eDNA technology shows great potential as a powerful tool for surveying oceanic fish resources.
Oceanic fish diversity plays a critical role in marine ecosystems. These fish sustain the food chains of upper-level predators and contribute to the global carbon cycle through diel vertical migration (DVM). Additionally, studying their diversity aids in resource management and the formulation of marine conservation policies (Iglesias et al., 2023; Santora et al., 2021). This study found no significant differences in fish diversity and community composition between the 5 m and 200 m water layers. This suggests that above 200 m, there is no difference in the diversity and community structure of oceanic fish. This could be because the water column above 200 m is part of the euphotic zone, where food resources are concentrated. Thus, most DVM activities of oceanic fish occur for feeding and spawning (Jiang et al., 2024b; Wang et al., 2023a, 2019; Xu et al., 2021).
In the local area of the SCS, surface currents show horizontal divergence, causing vertical upwelling of subsurface water, known as upwelling (Liang et al., 2018). Currents and tides may affect the long-distance transport of eDNA, leading to potential false positive species detections and inaccurate biodiversity assessments. Although studies have shown that eDNA technology may be influenced by tides and coastal currents on small spatial scales (< 5 km), the diffusion of eDNA in the habitat is limited (Jeunen et al., 2019a). A potential explanation for these results is that species connectivity across basins could be achieved through the transport of eDNA by biological diffusion, migration, water movements, or wind-driven water flows at certain locations (Pukk et al., 2021; Sakata et al., 2020; Shogren et al., 2017). However, marine eDNA studies have shown that on small geographic scales, eDNA transfer between sampling sites can be negligible (Jeunen et al., 2019b; Li et al., 2022). Given the relatively large distances between sampling sites in this study (16–545 km), eDNA diffusion has minimal impact on the results, as the distance between the sampling points exceeds the typical range within which environmental DNA is likely to diffuse. The factors influencing these results are manifold, which could also be due to various ecological reasons (Gray, 2001). In the context of this study, however, these results might be attributed to technical challenges during sampling and laboratory work. Given the limited number of sampling sites, future work should involve more detailed and large-scale sampling to establish a more complete study layout.
Previous studies have utilized GAM models to establish nonlinear relationships between eDNA concentration and environmental factors, demonstrating their application in fish community analysis (Rourke et al., 2021; Yang et al., 2025). This study developed GAMs for the 5 m and 200 m water layers to investigate the relationship between environmental factors and total reads of fish. In both water layers, temperature was identified as a key variable influencing the distribution of total reads of fish in the upper-middle layers. Furthermore, studies have shown that temperature affects fish growth, survival, and distribution, and is highly correlated with biodiversity (Kume et al., 2021a; Sogawa et al., 2019). In addition, increased metabolism and activity levels at higher temperatures may promote eDNA shedding (Jo et al., 2019; Lacoursière‐Roussel et al., 2016). However, the specific mechanisms by which temperature influences eDNA concentrations in marine systems remain unclear. The effects of temperature on shedding and decay rates, along with inherent variability across species and animal forms (Andruszkiewicz Allan et al., 2020), compounded by seasonal changes in species distributions and activity levels, may result in differing effects across study systems and organisms (Rourke et al., 2021). Nevertheless, our study utilizes eDNA technology to assess fish biodiversity in the open ocean and, by integrating multiple environmental factors in a GAM model, reveals the impact of environmental factors on the vertical distribution of fish in the study area.
In this study, environmental factors in the 5 m and 200 m water layers of the central SCS showed significant differences. The total reads of fish at the 5 m water layer was influenced by five environmental factors: Temp, pH, DO, Chl-a, and SiO3. Plankton, which prefers areas with high concentrations of dissolved oxygen and nutrients, directly and indirectly, impact certain pelagic fish species that feed on plankton, thus being influenced by environmental factors (Labiosa et al., 2003; Xue et al., 2021). The total reads of fish at the 200 m water layer was primarily influenced by temperature, with the highest total reads of fish observed around 15.5°C. Some pelagic upper-layer fish species are cold-water species, while others are warm-water species. The different relationships between temperature and total reads of fish may result from variations in fish species and their different life stages.
The influence of environmental factors on total reads of fish differed between the two water layers in this study, which may be attributed to the interference of ocean currents and other factors within different water layers (Gao et al., 2023; Song et al., 2022). Understanding the influence of environmental factors on the vertical distribution of fish is crucial, as temperature, salinity, and dissolved oxygen determine the distribution and reproduction of fish communities across different water layers (Karpowicz and Ejsmont-Karabin, 2018). Temperature gradients, food resource density, and ocean currents all affect the spatial distribution of fish communities (Longhi and Beisner, 2009; Rahman, 2021). Understanding these factors aids in predicting habitat selection and provides a basis for the management and conservation of marine ecosystems.
The use of eDNA metabarcoding for the quantitative assessment of fish communities is a topic of ongoing debate in current research (Lin et al., 2022; Xiong et al., 2022). Some studies have indicated a significant positive linear correlation between read counts and fish abundance/biomass in marine environments (Dafforn et al., 2015; Dukan et al., 2024; Gibb et al., 2019), while others have reported no significant relationship between read abundance and capture-based abundance/biomass (Fraija-Fernandez et al., 2020; Lamb et al., 2019). Although the GAM model was applied in this study to identify the relationship between environmental factors and eDNA total reads of fish, the process of quantifying fish abundance using eDNA is inherently complex. eDNA-based quantification of fish abundance is influenced by various factors, including biological factors such as biomass (Jo et al., 2019)and life stage (Maruyama et al., 2014), as well as abiotic factors such as pH (Strickler et al., 2015; Yang et al., 2025), ultraviolet radiation (Mächler et al., 2018), metabolic activity (Salter, 2018) and microorganisms (Joseph et al., 2022). These factors have been identified as key determinants of eDNA release and degradation. In addition to other experimental factors, such as in mixed DNA template libraries, some species may exhibit enhanced amplification, while others may experience reduced amplification or complete failure of amplification due to variations in primer binding sites (Schenekar et al., 2020). Therefore, caution is needed when using eDNA metabarcoding total reads of fish as a proxy for actual fish abundance/biomass.
Leveraging eDNA technology, this study revealed that the fish species composition in the central SCS is consistent with historical data from traditional surveys and, in some instances, indicates a higher species diversity than previously recorded. Additionally, no significant difference was observed in the fish species diversity and community composition between the 5 m and 200 m water layers in this region, suggesting that the fish diversity in oceanic areas is less affected by other ecosystems. Furthermore, the study identified significant differences in the environmental factors influencing fish communities between the 5 m and 200 m layers, with Temp changes being a critical factor driving the vertical distribution of fish communities. Consequently, these findings demonstrate that in pelagic regions where fish diversity surveys are challenging, eDNA can serve as a reliable tool, enhancing the ability to assess fish diversity and community composition in oceanic ecosystems.
The original contributions presented in the study are included in the article/supplementary material. Further inquiries can be directed to the corresponding author/s.
The manuscript presents research on animals that do not require ethical approval for their study.
TC: Writing – original draft, Data curation, Investigation, Methodology, Visualization. SZ: Conceptualization, Writing – review & editing. PJ: Investigation, Methodology, Writing – review & editing. ZC: Funding acquisition, Project administration, Validation, Writing – review & editing. JZ: Data curation, Investigation, Writing – review & editing. SX: Data curation, Supervision, Validation, Writing – review & editing. ML: Conceptualization, Funding acquisition, Project administration, Supervision, Writing – review & editing.
The author(s) declare that financial support was received for the research and/or publication of this article. This study was supported by National Key R & D Program of China (No. 2024YFD2400501), the Marine Environmental Protection Project of the CNOOC Marine Environment & Ecological Protection Welfare Foundation (No. CF-MEEC/TR/2024-15), the Fishery Development Subsidy Fund of Ministry of Agriculture and Rural Affairs, China, the Financial Fund of the Ministry of Agriculture and Rural Affairs, P. R. China (No. NHZX2024). The Central Public-interest Scientific Institution Basal Research Fund, CAFS (No. 2023TD16), and Research on Industrial Innovation Technology for Guangdong Modern Marine Ranching (2024-MRI-01-14).
We would like to express our appreciation to Xiaolei Chen, Yancong Cai, Yutao Yang, and all crew members of the Nan Feng vessel for their support during this research project.
The authors declare that the research was conducted in the absence of any commercial or financial relationships that could be construed as a potential conflict of interest.
The author(s) declare that no Generative AI was used in the creation of this manuscript.
All claims expressed in this article are solely those of the authors and do not necessarily represent those of their affiliated organizations, or those of the publisher, the editors and the reviewers. Any product that may be evaluated in this article, or claim that may be made by its manufacturer, is not guaranteed or endorsed by the publisher.
The Supplementary Material for this article can be found online at: https://www.frontiersin.org/articles/10.3389/fmars.2025.1544827/full#supplementary-material
Adams C. I. M., Knapp M., Gemmell N. J., Jeunen G. J., Bunce M., Lamare M. D., et al. (2019). Beyond biodiversity: can environmental DNA (eDNA) cut it as a population genetics tool? Genes-basel. 10, 192. doi: 10.3390/genes10030192
Ammon U. V., Pochon X., Casanovas P., Trochel B., Zirngibl M., Thomas A., et al. (2023). Net overboard: Comparing marine eDNA sampling methodologies at sea to unravel marine biodiversity. Mol. Ecol. Resour. 23, 440–452. doi: 10.1111/1755-0998.13722
Andruszkiewicz Allan E., Zhang W. G., C. Lavery A., F. Govindarajan A. (2020). Environmental DNA shedding and decay rates from diverse animal forms and thermal regimes. Environ. DNA 3, 492–514. doi: 10.1002/edn3.141
Apriansyah A., Jaya I., Nugroho D., Akhir M. F. (2022). Seasonal oceanographic changes and their implications for the abundance of small pelagic fishes in the southern South China Sea. Reg. Stud. Mar. Sci. 54, 102499. doi: 10.1016/j.rsma.2022.102499
Araújo F. G., Pinto B. C. T., Teixeira T. P. (2008). Longitudinal patterns of fish assemblages in a large tropical river in southeastern Brazil: evaluating environmental influences and some concepts in river ecology. HYDROBIOLOGIA. 618, 89–07. doi: 10.1007/s10750-008-9551-5
Barnes M. A., Chadderton W. L., Jerde C. L., Mahon A. R., Turner C. R., Lodge D. M. (2020). Environmental conditions influence eDNA particle size distribution in aquatic systems. Environ. DNA 3, 643–653. doi: 10.1002/edn3.160
Bernal D., Brill R. W., Dickson K. A., Shiels H. A. (2017). Sharing the water column: physiological mechanisms underlying species-specific habitat use in tunas. Rev. Fish Biol. Fish. 27, 843–880. doi: 10.1007/s11160-017-9497-7
Bohmann K., Evans A., Gilbert M. T., Carvalho G. R., Creer S., Knapp M., et al. (2014). Environmental DNA for wildlife biology and biodiversity monitoring. Trends Ecol. Evol. 29, 358–367. doi: 10.1016/j.tree.2014.04.003
Bokulich N. A., Subramanian S., Faith J. J., Gevers D., Gordon J. I., Knight R., et al. (2013). Quality-filtering vastly improves diversity estimates from Illumina amplicon sequencing. Nat. Methods. 10, 57–59. doi: 10.1038/nmeth.2276
Boulanger E., Loiseau N., Valentini A., Arnal V., Boissery P., Dejean T., et al. (2021). Environmental DNA metabarcoding reveals and unpacks a biodiversity conservation paradox in Mediterranean marine reserves. Proc. Biol. Sci. 288, 20210112. doi: 10.1098/rspb.2021.0112
Boussarie G., Bakker J., Wangensteen O. S., Mariani S., Bonnin L., Juhel J. B., et al. (2018). Environmental DNA illuminates the dark diversity of sharks. Sci. Adv. 4, eaap9661. doi: 10.1126/sciadv.aap9661
Calbet A., Landry M. R. (2004). Phytoplankton growth, microzooplankton grazing, and carbon cycling in marine systems. Limnol. Oceanogr. 49, 51–57. doi: 10.4319/lo.2004.49.1.0051
Callahan B. J., McMurdie P. J., Holmes S. P. (2017). Exact sequence variants should replace operational taxonomic units in marker-gene data analysis. ISME J. 11, 2639–2643. doi: 10.1038/ismej.2017.119
Callahan B. J., McMurdie P. J., Rosen M. J., Han A. W., Johnson A. J. A., Holmes S. P. (2016). DADA2: High-resolution sample inference from Illumina amplicon data. Nat. Methods 13, 581–583. doi: 10.1038/nmeth.3869
Cheang C. C., Lee B. Y., Ip B. H., Yiu W. H., Tsang L. M., Ang P. O. Jr. (2020). Fish and crustacean biodiversity in an outer maritime estuary of the Pearl River Delta revealed by environmental DNA. Mar. pollut. Bull. 161, 111707. doi: 10.1016/j.marpolbul.2020.111707
Costello M. J., Chaudhary C. (2017). Marine biodiversity, biogeography, deep-sea gradients, and conservation. Curr. Biol. 27, R511–R527. doi: 10.1016/j.cub.2017.04.060
Dafforn K. A., Johnston E. L., Ferguson A., Humphrey C. L., Monk W., Nichols S. J., et al. (2015). Big data opportunities and challenges for assessing multiple stressors across scales in aquatic ecosystems. Mar. Freshw. Res. 67, 393–413. doi: 10.1071/MF15108
Danovaro R., Fanelli E., Aguzzi J., Billett D., Carugati L., Corinaldesi C., et al. (2020). Ecological variables for developing a global deep-ocean monitoring and conservation strategy. Nat. Ecol. Evol. 4, 181–192. doi: 10.1038/s41559-019-1091-z
Deiner K., Bik H. M., Machler E., Seymour M., Lacoursiere-Roussel A., Altermatt F., et al. (2017). Environmental DNA metabarcoding: Transforming how we survey animal and plant communities. Mol. Ecol. 26, 5872–5895. doi: 10.1111/mec.14350
Diao C., Jia H., Guo S., Hou G., Xian W., Zhang H. (2022). Biodiversity exploration in autumn using environmental DNA in the South China sea. Environ. Res. 204, 112357. doi: 10.1016/j.envres.2021.112357
Dixon P. (2003). VEGAN, a package of R functions for community ecology. J. Veg. Sci. 14, 927–930. doi: 10.1111/j.1654-1103.2003.tb02228.x
Doi H., Inui R., Akamatsu Y., Kanno K., Yamanaka H., Takahara T., et al. (2017). Environmental DNA analysis for estimating the abundance and biomass of stream fish. Freshw. Biol. 62, 30–39. doi: 10.1111/fwb.12846
Dukan N., Cornelis I., Maes S., Hostens K., De Backer A., Derycke S. (2024). Vertical and horizontal environmental DNA (eDNA) patterns of fish in a shallow and well-mixed North Sea area. Sci. Rep. 14, 16748. doi: 10.1038/s41598-024-66912-2
Elbrecht V., Leese F. (2015). Can DNA-based ecosystem assessments quantify species abundance? Testing primer bias and biomass—Sequence relationships with an innovative metabarcoding protocol. PloS One 10, e0130324. doi: 10.1371/journal.pone.0130324
Feng Y., Yao L., Zhao H., Yu J., Lin Z. (2021). Environmental effects on the spatiotemporal variability of fish larvae in the western guangdong waters, China. J. Mar. Sci. Eng. 9, 316. doi: 10.3390/jmse9030316
Fraija-Fernandez N., Bouquieaux M., Rey A., Mendibil I., Cotano U., Irigoien X., et al. (2020). Marine water environmental DNA metabarcoding provides a comprehensive fish diversity assessment and reveals spatial patterns in a large oceanic area. Ecol. Evol. 10, 7560–7584. doi: 10.1002/ece3.6482
Furlan E. M., Gleeson D., Hardy C. M., Duncan R. P. (2016). A framework for estimating the sensitivity of eDNA surveys. Mol. Ecol. Resour. 16, 641–654. doi: 10.1111/1755-0998.12483
Gao T., Tong J., Xue M., Zhu Z., Qiu Y., Kindong R., et al. (2023). Characterizing the sound-scattering layer and its environmental drivers in the north equatorial current of the central and western pacific ocean. J. Mar. Sci. Eng. 11 (7), 1477. doi: 10.3390/jmse11071477
Gibb R., Browning E., Glover-Kapfer P., Jones K. E. (2019). Emerging opportunities and challenges for passive acoustics in ecological assessment and monitoring. Methods Ecol. Evol. 10, 169–185. doi: 10.1111/2041-210X.13101
Govindarajan A. F., Llopiz J. K., Caiger P. E., Jech J. M., Lavery A. C., McMonagle H., et al. (2023). Assessing mesopelagic fish diversity and diel vertical migration with environmental DNA. Front. Mar. Sci. 10. doi: 10.3389/fmars.2023.1219993
Gray J. (2001). Marine diversity: the paradigms in patterns of species richness examined. Sci. Mar. 65, 41–56. doi: 10.3989/scimar.2001.65s241
Hering D., Borja A., Jones J. I., Pont D., Boets P., Bouchez A., et al. (2018). Implementation options for DNA-based identification into ecological status assessment under the European Water Framework Directive. Water Res. 138, 192–205. doi: 10.1016/j.watres.2018.03.003
Higgs N. D., Attrill M. J. (2015). Biases in biodiversity: wide-ranging species are discovered first in the deep sea. Front. Mar. Sci. 2. doi: 10.3389/fmars.2015.00061
Hou Y. W., Liu S. G., Li Y., Song P. Q., Chen Z. Z., Lin L. S., et al. (2022). Acoustic assessment of commercially important pelagic fish resources in the central and southern South China Sea in the summer of 2019 based on acoustic research. Mar. Fish. 44, 267–279. doi: 10.13233/j.cnki.mar.fish.20220507.001
Hu W., Su C., Liu Q., Kong Y., Hua S., Hu Z. (2022). Comparison of fish communities using environmental DNA metabarcoding and capture methods in a freshwater lake: A new set of universal PCR primers. Fish. Res. 253, 106365. doi: 10.1016/j.fishres.2022.106365
Iglesias I. S., Santora J. A., Fiechter J., Field J. C. (2023). Mesopelagic fishes are important prey for a diversity of predators. Front. Mar. Sci. 10. doi: 10.3389/fmars.2023.1220088
Irigoien X., Klevjer T. A., Røstad A., Martinez U., Boyra G., Acuña J. L., et al. (2014). Large mesopelagic fishes biomass and trophic efficiency in the open ocean. Nat. Commun. 5, 3271. doi: 10.1038/ncomms4271
Jeunen G. J., Knapp M., Spencer H. G., Lamare M. D., Taylor H. R., Stat M., et al. (2019a). Environmental DNA (eDNA) metabarcoding reveals strong discrimination among diverse marine habitats connected by water movement. Mol. Ecol. Resour. 19, 426–438. doi: 10.1111/1755-0998.12982
Jeunen G. J., Lamare M. D., Knapp M., Spencer H. G., Taylor H. R., Stat M., et al. (2019b). Water stratification in the marine biome restricts vertical environmental DNA (eDNA) signal dispersal. Environ. DNA. 2, 99–111. doi: 10.1002/edn3.49
Jiang P., Xu Y., Zhang S., Xu S., Cai Y., Yang Y., et al. (2024a). Advancing fish diversity monitor in degraded marine ecosystem with environmental DNA approach: Unveiling hidden riches. Ecol. Indic. 160, 111893. doi: 10.1016/j.ecolind.2024.111893
Jiang Y., Zhang J., Cai Y., Kong X., Gong Y., Lin Z., et al. (2024b). Length-weight relationships and condition factors of 24 mesopelagic fishes from the South China Sea. Egypt. J. Aquat. Res 50, 528–537. doi: 10.1016/j.ejar.2024.09.002
Jiang P., Zhang S., Xu S., Xiong P., Cao Y., Chen Z., et al. (2023). Comparison of environmental DNA metabarcoding and bottom trawling for detecting seasonal fish communities and habitat preference in a highly disturbed estuary. Ecol. Indic. 146, 109754. doi: 10.1016/j.ecolind.2022.109754
Jo T., Murakami H., Yamamoto S., Masuda R., Minamoto T. (2019). Effect of water temperature and fish biomass on environmental DNA shedding, degradation, and size distribution. Ecol. Evol. 9, 1135–1146. doi: 10.1002/ece3.4802
Joseph C., Faiq M. E., Li Z., Chen G. (2022). Persistence and degradation dynamics of eDNA affected by environmental factors in aquatic ecosystems. HYDROBIOLOGIA. 849, 4119–4133. doi: 10.1007/s10750-022-04959-w
Kang M., Oh S., Oh W., Kang D.-J., Nam S., Lee K. (2024). Acoustic characterization of fish and macroplankton communities in the Seychelles-Chagos Thermocline Ridge of the southwest Indian ocean. Deep-sea Res. Pt Ii. 213, 105356. doi: 10.1016/j.dsr2.2023.105356
Karpowicz M., Ejsmont-Karabin J. (2018). Influence of environmental factors on vertical distribution of zooplankton communities in humic lakes. Ann. Limnol-int J. Lim. 54, 11. doi: 10.1051/limn/2018004
Klevjer T. A., Irigoien X., Røstad A., Fraile-Nuez E., Benítez-Barrios V. M., Kaartvedt S. (2016). Large scale patterns in vertical distribution and behaviour of mesopelagic scattering layers. Sci. Rep. 6, 19873. doi: 10.1038/srep19873
Klymus K. E., Richter C. A., Chapman D. C., Paukert C. (2015). Quantification of eDNA shedding rates from invasive bighead carp Hypophthalmichthys nobilis and silver carp Hypophthalmichthys molitrix. Biol. Conserv. 183, 77–84. doi: 10.1016/j.biocon.2014.11.020
Kume M., Lavergne E., Ahn H., Terashima Y., Kadowaki K., Ye F., et al. (2021b). Factors structuring estuarine and coastal fish communities across Japan using environmental DNA metabarcoding. Ecol. Indic. 121, 107216. doi: 10.1016/j.ecolind.2020.107216
Kume G., Shigemura T., Okanishi M., Hirai J., Shiozaki K., Ichinomiya M., et al. (2021a). Distribution, feeding habits, and growth of chub mackerel, scomber japonicus, larvae during a high-stock period in the northern satsunan area, southern Japan. Front. Mar. Sci. 8. doi: 10.3389/fmars.2021.725227
Labiosa R. G., Arrigo K. R., Genin A., Monismith S. G., van Dijken G. (2003). The interplay between upwelling and deep convective mixing in determining the seasonal phytoplankton dynamics in the Gulf of Aqaba: Evidence from SeaWiFS and MODIS. Limnol. Oceanogr. 48, 2355–2368. doi: 10.4319/lo.2003.48.6.2355
Lacoursière-Roussel A., Côté G., Leclerc V., Bernatchez L., Cadotte M. (2016). Quantifying relative fish abundance with eDNA: a promising tool for fisheries management. J. Appl. Ecol. 53, 1148–1157. doi: 10.1111/1365-2664.12598
Lahoz-Monfort J. J., Guillera-Arroita G., Tingley R. (2016). Statistical approaches to account for false-positive errors in environmental DNA samples. Mol. Ecol. Resour. 16, 673–685. doi: 10.1111/1755-0998.12486
Lamb P. D., Hunter E., Pinnegar J. K., Creer S., Davies R. G., Taylor M. I. (2019). How quantitative is metabarcoding: A meta-analytical approach. Mol. Ecol. 28, 420–430. doi: 10.1111/mec.14920
Li B., Chen G. B., Guo Y., Zhi C. Z., Zhang J., Xu W. D. (2016). Hydroacoustic assessment of spatial-temporal distribution and biomass of fishery resources in the central South China Sea. South China Fish. Sci. 12, 28–37. doi: 10.3969/j.issn.2095-0780.2016.04.004
Li Z., Jiang P., Wang L., Liu L., Li M., Zou K. (2023). A comparison of seasonal composition and structure of fish community between environmental DNA technology and gillnetting in the Pearl River Estuary, China. Ecol. Indic. 147, 109915. doi: 10.1016/j.ecolind.2023.109915
Li C., Long H., Yang S., Zhang Y., Tang F., Jin W., et al. (2022). eDNA assessment of pelagic fish diversity, distribution, and abundance in the central Pacific Ocean. Reg. Stud. Mar. Sci. 56, 102661. doi: 10.1016/j.rsma.2022.102661
Liang W., Tang D., Luo X. (2018). Phytoplankton size structure in the western South China Sea under the influence of a ‘jet-eddy system’. J. Mar. Syst. 187, 82–95. doi: 10.1016/j.jmarsys.2018.07.001
Lin Y., Li J., Wang Z., Zhang S., Wang K., Li X. (2022). A comparison of fish diversity in rocky reef habitats by multi-mesh gillnets and environmental DNA metabarcoding. Front. Ecol. Evol. 10. doi: 10.3389/fevo.2022.874558
Liu X., Gao C., Zhao J., Tian S., Ye S., Ma J. (2021). Modeling and comparison of count data containing zero values: a case study of Setipinna taty in the south inshore of Zhejiang. Environ. Sci. pollut. Res. 28, 46827–46837. doi: 10.1007/s11356-021-13440-5
Liu K. M., Huang L. H., Su K. Y. (2022). Assessment of the impact on 20 pelagic fish species by the Taiwanese small-scale longline fishery in the western north pacific using ecological risk assessment. ANIMALS-BASEL. 12, 2124. doi: 10.3390/ani12162124
Longhi M. L., Beisner B. E. (2009). Environmental factors controlling the vertical distribution of phytoplankton in lakes. J. Plankton Res. 31, 1195–1207. doi: 10.1093/plankt/fbp065
Ma W., Gao C., Tang W., Qin S., Ma J., Zhao J. (2022). Relationship between engraulis japonicus resources and environmental factors based on multi-model comparison in offshore waters of southern zhejiang, China. J. Mar. Sci. Eng. 10, 657. doi: 10.3390/jmse10050657
Ma J., Li B., Zhao J., Wang X., Hodgdon C. T., Tian S. (2020). Environmental influences on the spatio-temporal distribution of Coilia nasus in the Yangtze River estuary. J. Appl. Ichthyol. 36, 315–325. doi: 10.1111/jai.14028
Mächler E., Osathanunkul M., Altermatt F. (2018). Shedding light on eDNA: neither natural levels of UV radiation nor the presence of a filter feeder affect eDNA-based detection of aquatic organisms. PloS One 13, e0195529. doi: 10.1371/journal.pone.0195529
Madduppa H., Cahyani N. K. D., Anggoro A. W., Subhan B., Jefri E., Sani L. M. I., et al. (2021). eDNA metabarcoding illuminates species diversity and composition of three phyla (chordata, mollusca and echinodermata) across Indonesian coral reefs. Biodivers. Conserv. 30, 3087–3114. doi: 10.1007/s10531-021-02237-0
Marques V., Guérin P.É., Rocle M., Valentini A., Manel S., Mouillot D., et al. (2020). Blind assessment of vertebrate taxonomic diversity across spatial scales by clustering environmental DNA metabarcoding sequences. Ecography. 43, 1779–1790. doi: 10.1111/ecog.05049
Maruyama A., Nakamura K., Yamanaka H., Kondoh M., Minamoto T. (2014). The release rate of environmental DNA from juvenile and adult fish. PloS One 9, e114639. doi: 10.1371/journal.pone.0114639
Miya M., Sato Y., Fukunaga T., Sado T., Poulsen J. Y., Sato K., et al. (2015). MiFish, a set of universal PCR primers for metabarcoding environmental DNA from fishes: detection of more than 230 subtropical marine species. R. Soc Open Sci. 2, 150088. doi: 10.1098/rsos.150088
Pukk L., Kanefsky J., Heathman A. L., Weise E. M., Nathan L. R., Herbst S. J., et al. (2021). eDNA metabarcoding in lakes to quantify influences of landscape features and human activity on aquatic invasive species prevalence and fish community diversity. Divers. Distrib. 27, 2016–2031. doi: 10.1111/ddi.13370
Rahman M. M. (2021). Factors influencing the vertical distribution of copepods in a tropical oligotrophic estuary, South China sea. Estuar. Coast. SHELF S. 250, 107165. doi: 10.1016/j.ecss.2021.107165
Rawat V. S., Fujikawa R., Azhikodan G., Yokoyama K. (2024). Relationship between hydro-environmental variables and Coilia nasus catch in a highly turbid macrotidal estuary in Japan. Estuarine Coast. Shelf Science. 302, 108773. doi: 10.1016/j.ecss.2024.108773
Rourke M. L., Fowler A. M., Hughes J. M., Broadhurst M. K., DiBattista J. D., Fielder S., et al. (2021). Environmental DNA (eDNA) as a tool for assessing fish biomass: A review of approaches and future considerations for resource surveys. Environ. DNA 4, 9–33. doi: 10.1002/edn3.185
Ruan H. T., Wang R. L., Li H. T., Liu L., Kuang T. X., Li M., et al. (2022). Effects of sampling strategies and DNA extraction methods on eDNA metabarcoding: A case study of estuarine fish diversity monitoring. Zool. Res. 43, 192–204. doi: 10.24272/j.issn.2095-8137.2021.331
Sakata M. K., Watanabe T., Maki N., Ikeda K., Kosuge T., Okada H., et al. (2020). Determining an effective sampling method for eDNA metabarcoding: a case study for fish biodiversity monitoring in a small, natural river. LIMNOLOGY. 22, 221–235. doi: 10.1007/s10201-020-00645-9
Sales N. G., Wangensteen O. S., Carvalho D. C., Deiner K., Præbel K., Coscia I., et al. (2021). Space-time dynamics in monitoring neotropical fish communities using eDNA metabarcoding. Sci. Total Environ. 754, 142096. doi: 10.1016/j.scitotenv.2020.142096
Salter I. (2018). Seasonal variability in the persistence of dissolved environmental DNA (eDNA) in a marine system: The role of microbial nutrient limitation. PloS One 13, e0192409. doi: 10.1371/journal.pone.0192409
Santora J., Schroeder I., Bograd S., Chavez F., Cimino M., Fiechter J., et al. (2021). Pelagic biodiversity, ecosystem function, and services: an integrated observing and modeling approach. OCEANOGRAPHY. 34, 212. doi: 10.5670/oceanog.2021.212
Schenekar T., Schletterer M., Lecaudey L. A., Weiss S. J. (2020). Reference databases, primer choice, and assay sensitivity for environmental metabarcoding: Lessons learnt from a re-evaluation of an eDNA fish assessment in the Volga headwaters. River Res. Appl. 36, 1004–1013. doi: 10.1002/rra.3610
Sheng J., Qiao S., Shi X., Liu J., Liu Y., Liu S., et al. (2024). Modern sedimentation and sediment budget in the South China Sea and their comparisons with the eastern China seas. Mar. Geol. 475, 107348. doi: 10.1016/j.margeo.2024.107348
Shogren A. J., Tank J. L., Andruszkiewicz E., Olds B., Mahon A. R., Jerde C. L., et al. (2017). Controls on eDNA movement in streams: Transport, Retention, and Resuspension. Sci. Rep. 7, 5065. doi: 10.1038/s41598-017-05223-1
Sigsgaard E. E., Jensen M. R., Winkelmann I. E., Moller P. R., Hansen M. M., Thomsen P. F. (2020). Population-level inferences from environmental DNA-Current status and future perspectives. Evol. Appl. 13, 245–262. doi: 10.1111/eva.12882
Skelton J., Cauvin A., Hunter M. E. (2022). Environmental DNA metabarcoding read numbers and their variability predict species abundance, but weakly in non-dominant species. Environ. DNA 5, 1092–1104. doi: 10.1002/edn3.355
Sogawa S., Hidaka K., Kamimura Y., Takahashi M., Saito H., Okazaki Y., et al. (2019). Environmental characteristics of spawning and nursery grounds of Japanese sardine and mackerels in the Kuroshio and Kuroshio Extension area. Fish. Oceanogr. 28, 454–467. doi: 10.1111/fog.12423
Song J. W., Schultz M. T., Casman E. A., Bockrath K. D., Mize E., Monroe E. M., et al. (2020). A probabilistic model for designing and assessing the performance of eDNA sampling protocols. Mol. Ecol. Resour. 20, 404–414. doi: 10.1111/1755-0998.13113
Song Y., Yang J., Wang C., Sun D. (2022). Spatial patterns and environmental associations of deep scattering layers in the northwestern subtropical Pacific Ocean. Acta Oceanolog. Sin. 41, 139–152. doi: 10.1007/s13131-021-1973-1
Steichen J. L., Gonzalez L., Quigg A. (2024). Seasonal and spatial variations between the fish community and environmental factors in a subtropical estuary. Estuar. Coast. SHELF S. 301, 108753. doi: 10.1016/j.ecss.2024.108753
St. John M. A., Borja A., Chust G., Heath M., Grigorov I., Mariani P., et al. (2016). A dark hole in our understanding of marine ecosystems and their services: perspectives from the mesopelagic community. Front. Mar. Sci. 3. doi: 10.3389/fmars.2016.00031
Strickler K. M., Fremier A. K., Goldberg C. S. (2015). Quantifying effects of UV-B, temperature, and pH on eDNA degradation in aquatic microcosms. Biol. Conserv. 183, 85–92. doi: 10.1016/j.biocon.2014.11.038
Teixeira C. M., Gamito R., Leitão F., Murta A. G., Cabral H. N., Erzini K., et al. (2015). Environmental influence on commercial fishery landings of small pelagic fish in Portugal. Reg. Environ. Change 16, 709–716. doi: 10.1007/s10113-015-0786-1
Thomsen P. F., Kielgast J., Iversen L. L., Moller P. R., Rasmussen M., Willerslev E. (2012). Detection of a diverse marine fish fauna using environmental DNA from seawater samples. PloS One 7, e41732. doi: 10.1371/journal.pone.0041732
Troth C. R., Sweet M. J., Nightingale J., Burian A. (2021). Seasonality, DNA degradation and spatial heterogeneity as drivers of eDNA detection dynamics. Sci. Total Environ. 768, 144466. doi: 10.1016/j.scitotenv.2020.144466
Tsuji S., Shibata N., Inui R., Nakao R., Akamatsu Y., Watanabe K. (2023). Environmental DNA phylogeography: Successful reconstruction of phylogeographic patterns of multiple fish species from cups of water. Mol. Ecol. Resour. 23, 1050–1065. doi: 10.1111/1755-0998.13772
Valdivia-Carrillo T., Rocha-Olivares A., Reyes-Bonilla H., Dominguez-Contreras J. F., Munguia-Vega A. (2021). Integrating eDNA metabarcoding and simultaneous underwater visual surveys to describe complex fish communities in a marine biodiversity hotspot. Mol. Ecol. Resour. 21, 1558–1574. doi: 10.1111/1755-0998.13375
Venables W. N., Dichmont C. M. (2004). GLMs, GAMs and GLMMs: an overview of theory for applications in fisheries research. Fish. Res. 70, 319–337. doi: 10.1016/j.fishres.2004.08.011
Wang X., Lu G., Zhao L., Du X., Gao T. (2021b). Assessment of fishery resources using environmental DNA: The large yellow croaker (Larimichthys crocea) in the East China Sea. Fish. Res. 235, 105813. doi: 10.1016/j.fishres.2020.105813
Wang L., Ma S., Liu Y., Li J., Liu S., Lin L., et al. (2021a). Fluctuations in the abundance of chub mackerel in relation to climatic/oceanic regime shifts in the northwest Pacific Ocean since the 1970s. J. Mar. Syst. 218, 103541. doi: 10.1016/j.jmarsys.2021.103541
Wang F., Wu Y., Chen Z., Zhang J. (2023a). Nitrogen supply in the upwelling of mid-west region of the South China Sea: The case of mesopelagic fishes. Ecol. Indic. 153, 110427. doi: 10.1016/j.ecolind.2023.110427
Wang J., Xu B., Zhang C., Ji Y., Xue Y., Ren Y. (2023b). Seasonal and spatial dynamics of phylogenetic structure of fish communities in coastal waters. Estuar. Coast. SHELF S. 290, 108373. doi: 10.1016/j.ecss.2023.108373
Wang X., Zhang J., Zhao X., Chen Z., Ying Y., Li Z., et al. (2019). Vertical distribution and diel migration of mesopelagic fishes on the northern slope of the South China sea. Deep-sea Res. Pt Ii. 167, 128–141. doi: 10.1016/j.dsr2.2019.05.009
Wedding L. M., Friedlander A. M., Kittinger J. N., Watling L., Gaines S. D., Bennett M., et al. (2013). From principles to practice: a spatial approach to systematic conservation planning in the deep sea. Proc. R. Soc B. 280, 20131684. doi: 10.1098/rspb.2013.1684
Westgaard J.-I., Præbel K., Arneberg P., Ulaski B. P., Ingvaldsen R., Wangensteen O. S., et al. (2024). Towards eDNA informed biodiversity studies – Comparing water derived molecular taxa with traditional survey methods. Prog. Oceanogr. 222, 103230. doi: 10.1016/j.pocean.2024.103230
Wood S. N. (2010). Fast stable restricted maximum likelihood and marginal likelihood estimation of semiparametric generalized linear models. J. R Stat. Soc. B. 73, 3–36. doi: 10.1111/j.1467-9868.2010.00749.x
Wu Q., Minamoto T. (2023). Improvement of recovery yield of macro-organismal environmental DNA from seawater samples. Anal. Sci. 39, 713–720. doi: 10.1007/s44211-023-00280-1
Xiong F., Shu L., Zeng H., Gan X., He S., Peng Z. (2022). Methodology for fish biodiversity monitoring with environmental DNA metabarcoding: The primers, databases and bioinformatic pipelines. WBS. 1, 100007. doi: 10.1016/j.watbs.2022.100007
Xu Y. W., Jiang Y., Fan J. T., Kong X. L., Zhang K., Chen Z. Z. (2016). Preliminary study on community structure of mesopelagic species in the central South China Sea during autumn and winter. South China Fish. Sci. 12, 49–56. doi: 10.3969/j.issn.2095-0780.2016.04.006
Xu L., Wang X., Van Damme K., Huang D., Li Y., Wang L., et al. (2021). Assessment of fish diversity in the South China Sea using DNA taxonomy. Fish. Res. 233, 105771. doi: 10.1016/j.fishres.2020.105771
Xue M., Tong J., Tian S., Wang X. (2021). Broadband characteristics of zooplankton sound scattering layer in the kuroshio–oyashio confluence region of the northwest pacific ocean in summer of 2019. J. Mar. Sci. Eng. 9, 938. doi: 10.3390/jmse9090938
Yamamoto S., Minami K., Fukaya K., Takahashi K., Sawada H., Murakami H., et al. (2016). Environmental DNA as a ‘Snapshot’ of fish distribution: A case study of Japanese jack mackerel in maizuru bay, sea of Japan. PloS One 11, e0149786. doi: 10.1371/journal.pone.0149786
Yang Y., Liu K., Zhang J., Xu M., Guo F., Zhou X., et al. (2025). Key environmental factors influencing eDNA quantitative detection of golden mussel (Limnoperna fortunei) in a long-distance water diversion project. Environ. Technol. Innovation. 37, 103998. doi: 10.1016/j.eti.2024.103998
Yu Z., Ito S. I., Wong M. K., Yoshizawa S., Inoue J., Itoh S., et al. (2022). Comparison of species-specific qPCR and metabarcoding methods to detect small pelagic fish distribution from open ocean environmental DNA. PloS One 17, e0273670. doi: 10.1371/journal.pone.0273670
Zhang S., Cao Y., Chen B., Jiang P., Fang L., Li H., et al. (2023). Assessing the potential use of environmental DNA for multifaceted genetic monitoring of cetaceans: Example of a wandering whale in a highly disturbed bay area. Ecol. Indic. 148, 110125. doi: 10.1016/j.ecolind.2023.110125
Zhang K., Li M., Li J., Sun M., Xu Y., Cai Y., et al. (2022). Climate-induced small pelagic fish blooms in an overexploited marine ecosystem of the South China Sea. Ecol. Indic. 145, 109598. doi: 10.1016/j.ecolind.2022.109598
Zhang J., Qiu Y. S., Chen Z. Z., Zhang P., Zhang K., Fan J., et al. (2018). Advances in pelagic fishery resources survey and assessment in open South China Sea. South China Fish. Sci. 14, 118–127. doi: 10.12131/20180037
Zhang J., Zhang P., Chen Z. Z., Chen G. B., Zhang K., Xu Y. W., et al. (2016a). Biomass and distribution of carangoid fish resources in the offshore South China Sea. South China Fish. Sci. 12, 38–48. doi: 10.3969/j.issn.2095-0780.2016.04.005
Zhang P., Zhang J., Li Y., Zhang R., Lin L. S., Lei Y., et al. (2016b). An exploratory fishing survey of light falling-net fisheries in the central and southern South China Sea in autumn. South China Fish. Sci. 12, 67–74. doi: 10.3969/j.issn.2095-0780.2016.02.010
Zhou C., Zhu C., Cheng Y., Lei Y., Nan Y., Ouyang S., et al. (2024). Exploring freshwater snail diversity and community structure in China’s largest lake using eDNA technology. Ecol. Indic. 158, 111577. doi: 10.1016/j.ecolind.2024.111577
Zhu M., Kuroki M., Kobayashi T., Yamakawa T., Sado T., Kodama K., et al. (2023). Comparison of fish fauna evaluated using aqueous eDNA, sedimentary eDNA, and catch surveys in Tokyo Bay, Central Japan. J. Mar. Syst. 240, 103886. doi: 10.1016/j.jmarsys.2023.103886
Zhu Z., Tong J., Xue M., Sarr O., Gao T. (2024). Assessing the influence of abiotic factors on small pelagic fish distribution across diverse water layers in the Northwest Pacific Ocean through acoustic methods. Ecol. Indic. 158, 111563. doi: 10.1016/j.ecolind.2024.111563
Keywords: eDNA, central South China Sea, fish diversity, fish community structure, environmental factors
Citation: Chen T, Zhang S, Jiang P, Chen Z, Zhang J, Xu S and Li M (2025) Detecting fish community structure in open waters using environmental DNA: a case study from the central South China Sea. Front. Mar. Sci. 12:1544827. doi: 10.3389/fmars.2025.1544827
Received: 13 December 2024; Accepted: 11 March 2025;
Published: 27 March 2025.
Edited by:
Grazielle Evangelista Gomes, Federal University of Pará, BrazilReviewed by:
Brian R. MacKenzie, Technical University of Denmark, DenmarkCopyright © 2025 Chen, Zhang, Jiang, Chen, Zhang, Xu and Li. This is an open-access article distributed under the terms of the Creative Commons Attribution License (CC BY). The use, distribution or reproduction in other forums is permitted, provided the original author(s) and the copyright owner(s) are credited and that the original publication in this journal is cited, in accordance with accepted academic practice. No use, distribution or reproduction is permitted which does not comply with these terms.
*Correspondence: Min Li, bGltaW5Ac2NzZnJpLmFjLmNu; Shannan Xu, eHVzaGFubmFuQHNjc2ZyaS5hYy5jbg==
Disclaimer: All claims expressed in this article are solely those of the authors and do not necessarily represent those of their affiliated organizations, or those of the publisher, the editors and the reviewers. Any product that may be evaluated in this article or claim that may be made by its manufacturer is not guaranteed or endorsed by the publisher.
Research integrity at Frontiers
Learn more about the work of our research integrity team to safeguard the quality of each article we publish.