 Yu Chen
 Huahan Zhang
 Lingling Pei
95% of researchers rate our articles as excellent or good
Learn more about the work of our research integrity team to safeguard the quality of each article we publish.
Find out more
ORIGINAL RESEARCH article
Front. Mar. Sci. , 10 February 2025
Sec. Marine Affairs and Policy
Volume 12 - 2025 | https://doi.org/10.3389/fmars.2025.1544612
This article is part of the Research Topic Challenges and Solutions in Forecasting and Decision-Making in Marine Economy and Management, Volume II View all 4 articles
This paper aims to provide insights into the future trends for the marine industries in China, by forecasting the added value in key sectors and then offering tailored policy recommendations. Those economic indicators at the industry level are characterized by small sample sizes, sectoral heterogeneity, and irregular fluctuations, which require a specialized methodology to handle data features and provide predictions for each industry. To address these issues, the conformable fractional grey model (CFGM), which integrates conformable fractional accumulation with the grey forecasting model, is applied and proven effective through accuracy and robustness tests. First, the results from multi-step experiments demonstrate that the CFGM model significantly outperforms traditional statistical, machine learning models, and grey models in the context of the sectoral added value predictions, with an average accuracy improvement of 32.14%. Second, the robustness and stability of the predictive values generated by CFGM are further verified by the Probability Density Analysis (PDA) and multiple comparisons with the best (MCB) tests, thereby ruling out the possibility that these accurate predictions are the result of mere chance. Third, the CFGM model is used to estimate the future added values across multiple marine industries, accompanied by suggestions to ensure the sustainable development of the marine economy.
In recent years, the marine economy has rapidly developed, becoming a key driver of global and national economic growth (Hynes et al., 2024). On the one hand, the global marine economy is projected to reach 3 trillion USD by 2029, with a compound annual growth rate of 12.2% (QYResearch, 2024). On the other hand, the Chinese government issues the 14th Five-Year Plan for Marine Economy Development, which emphasizes accelerating the establishment of a modern marine industrial system and enhancing independent innovation in marine technology. Moreover, the emphasis on the development of the marine economy and its related technologies is also shown in Figure 1. In detail, the gross ocean product increases from 4558.04 billion yuan in 2011 to 8952.13 billion yuan in 2021, while R&D expenditure grows from 10.91 billion yuan to 32.92 billion yuan during the same period.
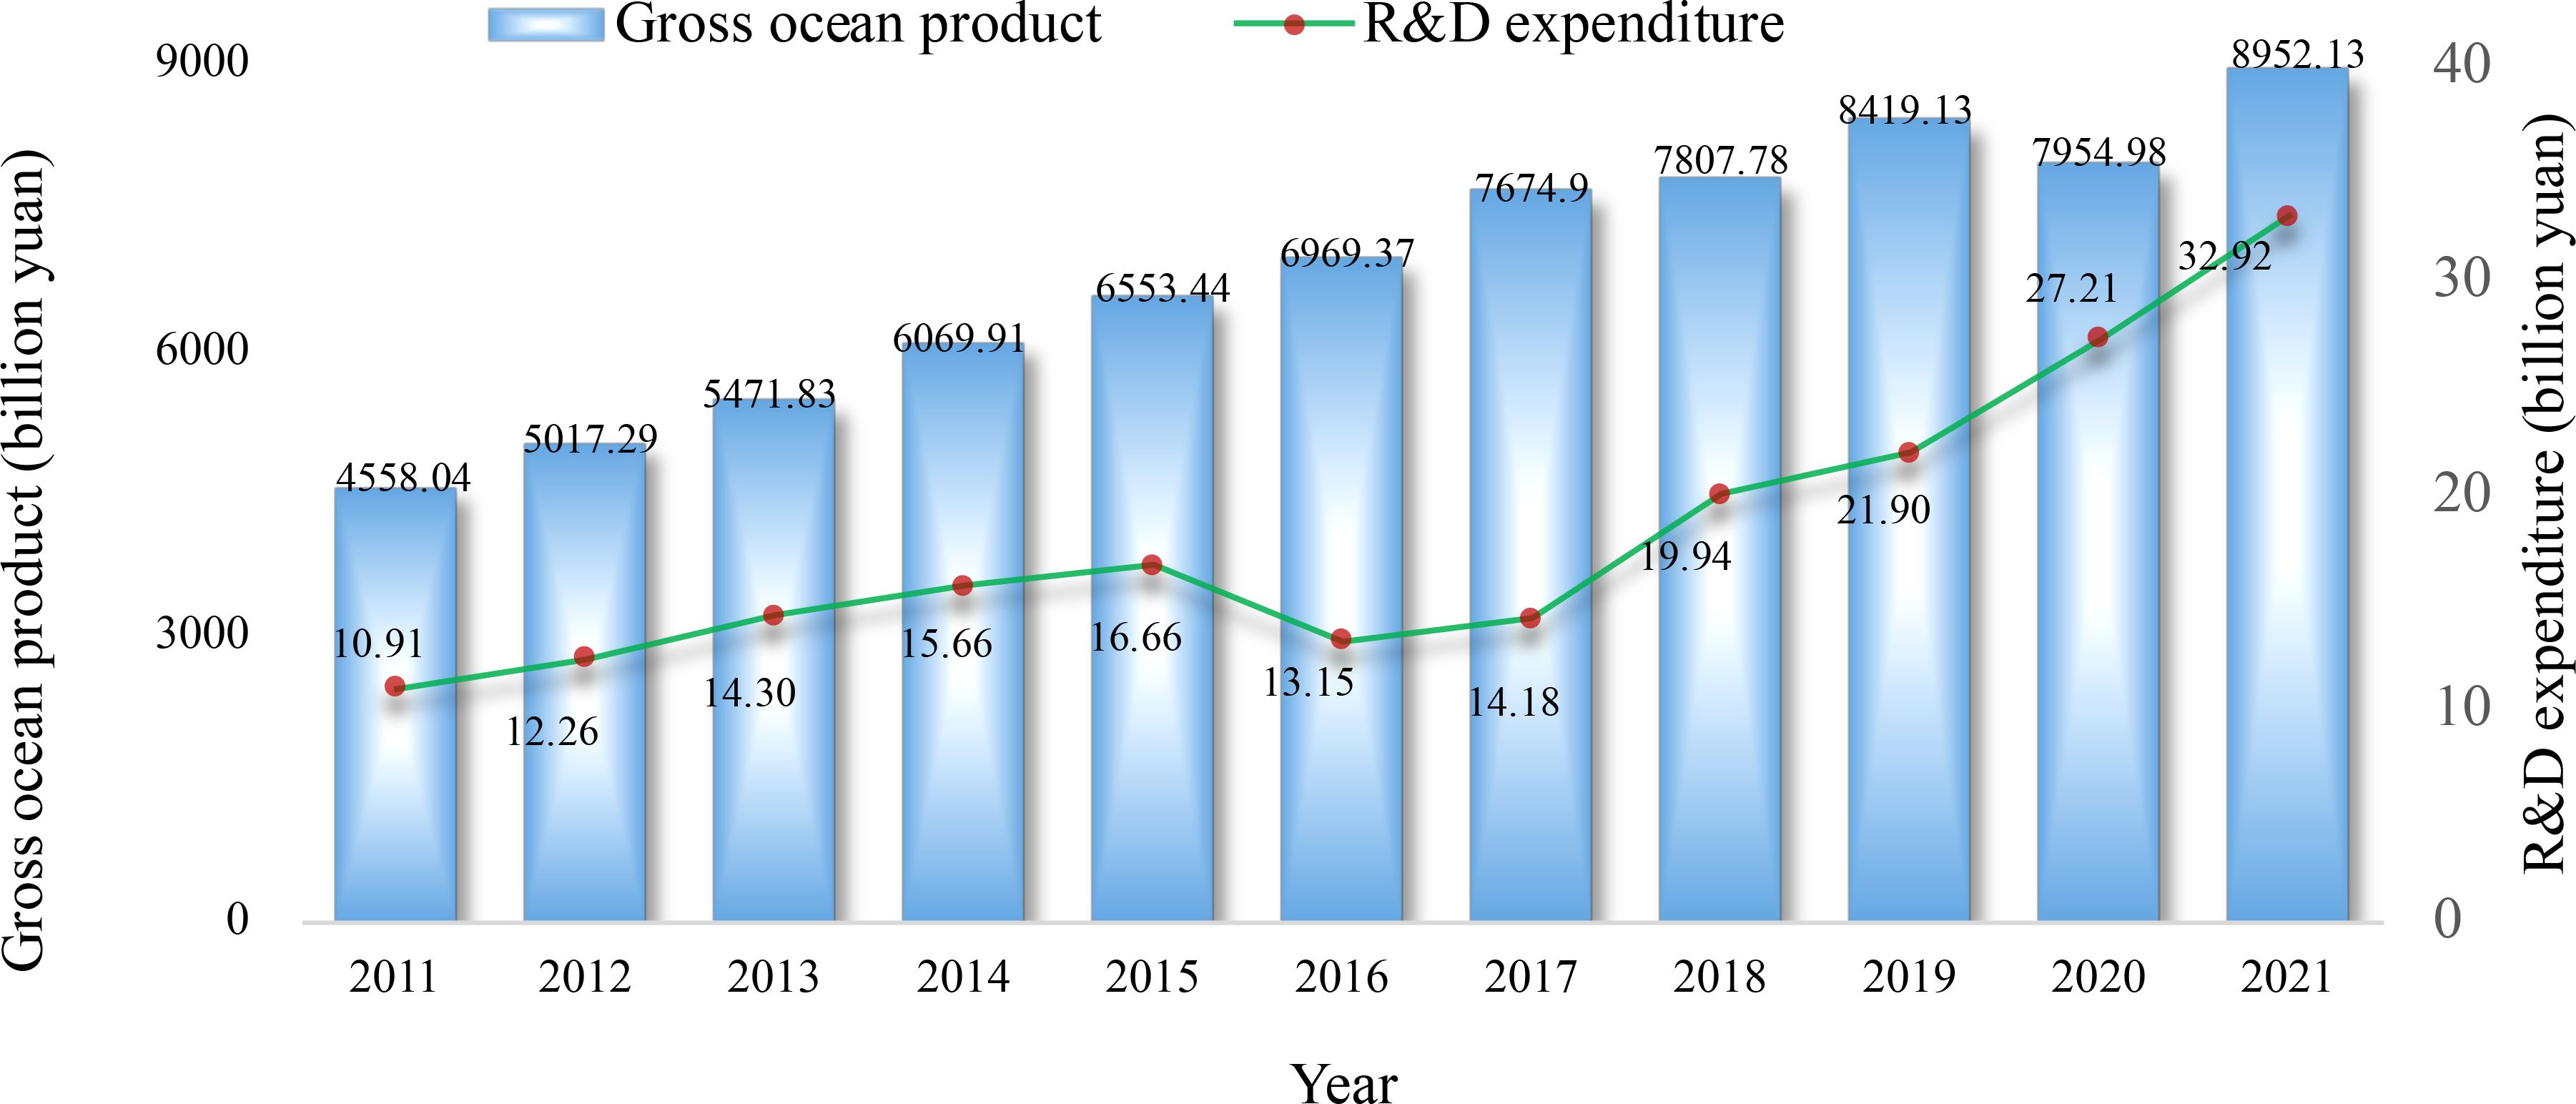
Figure 1. Trends in Chinese gross ocean product and R&D expenditure from 2011 to 2021.
As the importance of the marine economy continues to rise, governments worldwide have introduced various policies at the industry level to foster its development (Ji et al., 2024). For instance, the Zhejiang Provincial Government has issued the “Measures for Strengthening Natural Resource Support to Promote High-Quality Development of the Marine Economy”, which aimed at enhancing resource allocation and promoting the sustainable development of key industries like the marine fishery sector. Importantly, these policies rely heavily on accurate economic data from marine subsectors to ensure the effectiveness of action implementation and goal achievement (Zhang et al., 2024). As a result, given the significance of the marine economy in Chinese overall economic structure, accurate forecasting of the marine economic data at the industrial level is crucial, in guiding sustainable development strategies (Sun et al., 2024).
In the current context, accurate forecasting of the added values for marine industries is of critical importance for multiple stakeholders, including policymakers, investors, and researchers. However, the marine sector faces significant challenges, such as the economic datasets are often sparse and irregular. Furthermore, the added value of the marine economy in different sectors often exhibits substantial variation in development patterns. Besides, those economic indicators of the marine sector fluctuate vastly because of the inconsistent policy frameworks (Li J et al., 2024). These issues complicate the task of accurately predicting the future performance of marine industries while accounting for sectoral differences.
To address the such challenges arising from the volatility, scarcity, and heterogeneity of datasets, the grey forecasting model has been extensively utilized and demonstrated its utility in a multitude of fields, including the prediction of economic performance, carbon emissions, energy consumption, and power generation (Li et al., 2019). Moreover, Scholars have dedicated considerable effort to enhancing grey models from various angles, such as refining the background value (Huang et al., 2024), optimizing parameter estimation techniques (Li J. et al., 2024), restructuring the model architecture (Bilgil, 2021), and innovating accumulation methods (Erdinç and Bilgil, 2024). Among them, advancements in data processing methods, including damping accumulation, fractional order accumulation, and inverse accumulation, have been identified as pivotal improvements (Öztürk et al., 2022). These data accumulation methods can enhance the predicted performance of grey model by handling time series with different trends.
In this paper, the CFGM model, which integrates the Conformable Fractional Accumulation (CFA) method with the traditional grey forecasting model, is used for forecasting, due to its particular suitability for handling small sample sizes and irregularities commonly found in added values of marine economy. Notably, this model is applied to forecast the added value of five key marine industries, including marine fisheries, coastal tourism, marine biomedicine, marine transport, and marine power industries. These predictions are validated through accuracy and robustness tests. Furthermore, based on the specific predicted values and their characteristics, policy recommendations are provided to guide sustainable development strategies for the marine economy.
The core innovations of this study mainly refer to the following aspects:
1. To meet the requirements of precise forecasting in the marine economy at the industry level, this paper applies the CFGM model, which combines CFA and grey forecasting techniques, addressing the industry heterogeneity and small sample sizes in marine economic predictions.
2. To verify the applicability of the CFGM model in marine economic forecasting, this study conducts empirical experiments, which demonstrates that this model consistently achieves higher predictive accuracy across most industries compared to a range of competitive models.
3. To foster sustainable development of the marine economy, this paper formulates customized policy suggestions based on the forecast results. The CFGM model provides future projections for the added value of the Chinese marine economy from 2024 to 2026 at the industry level, further analyzing data characteristics from both value changes and growth rate perspectives. Based on these projections, tailored policy recommendations are offered, emphasizing the need for differentiated development strategies for various sectors.
The structure of this paper is as follows: Section 2 reviews the existing literature on marine economy topics. Section 3 explains the mechanism of the CFGM model. Section 4 presents the data collection process and presents the results of the empirical analysis. Section 5 offers policy recommendations and concludes the paper.
A wide range of forecasting methods have been applied to make predictions in marine economy topics, including statistical models, machine learning models, and grey system models. These models, with their varying data handling capabilities, computational complexities, and adaptability, have shown in Table 1.
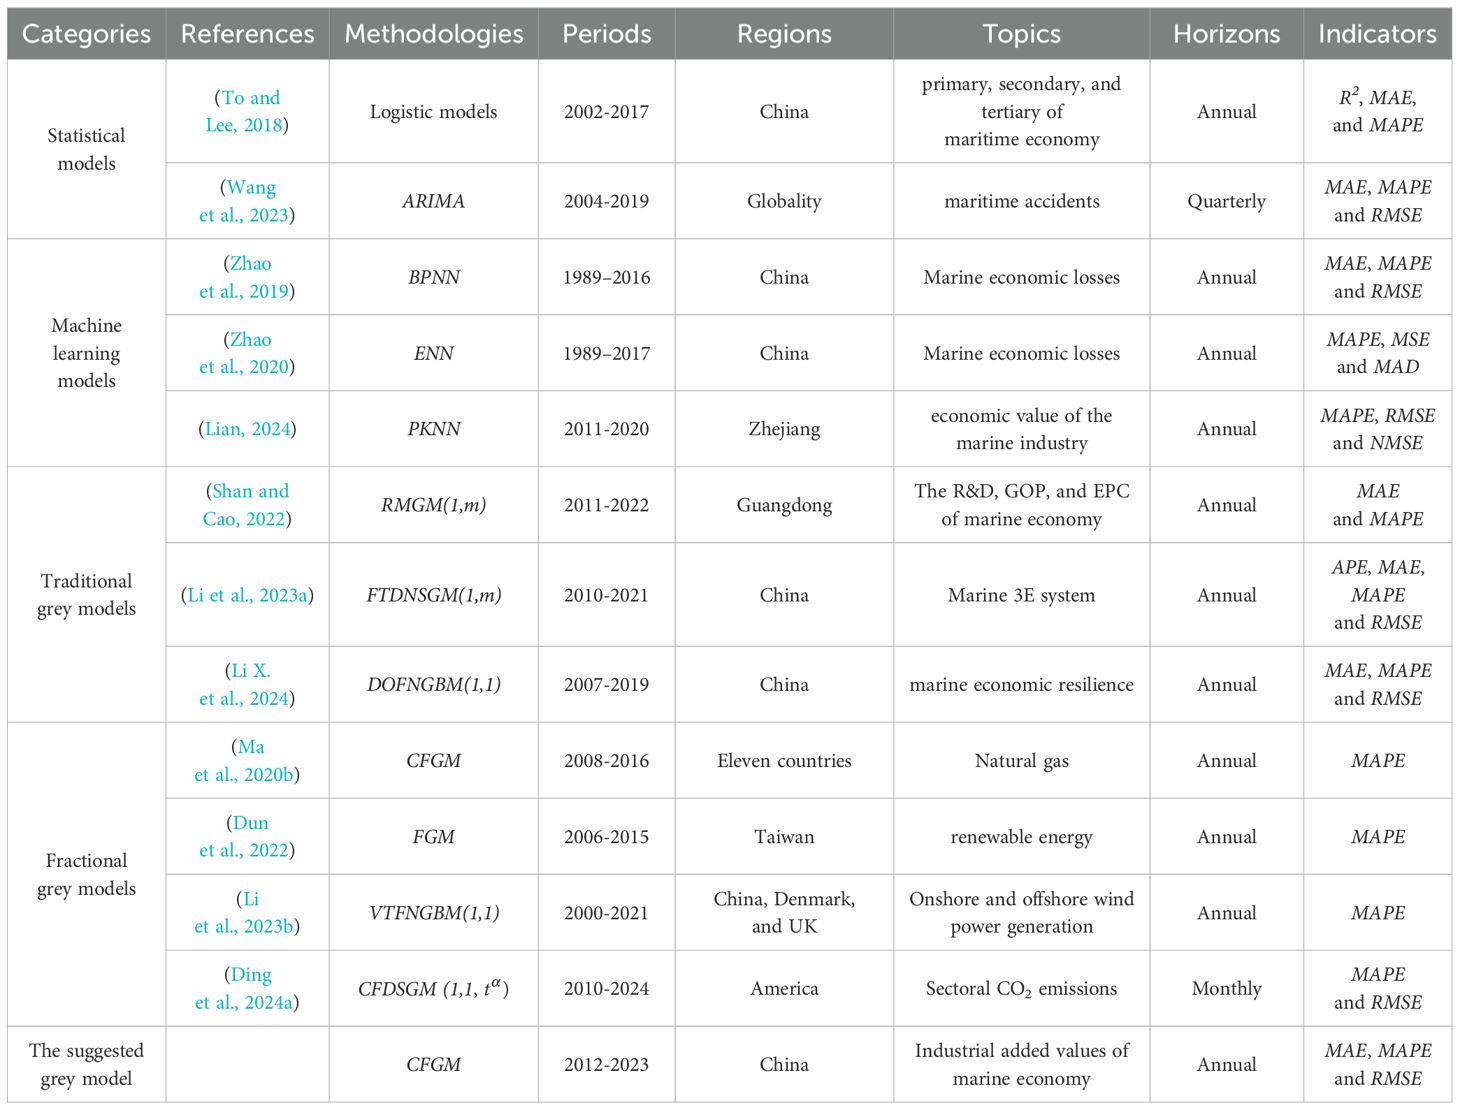
Table 1. The marine economy and fractional grey model related researches.
First, the application of statistical models, such as logistic and the Autoregressive Integrated Moving Average (ARIMA) models, in forecasting the marine economy has been extensively documented. To be specific, To and Lee (2018) applied a logistic model to forecast the Chinese marine economy between 2002 and 2017, successfully predicting its overall growth trajectory in 2019, with the coastal tourism and transportation industries playing a pivotal role. Building on these predictions, their paper offered valuable insights into future growth trends and policy recommendations. Besides, Wang et al. (2023) employed the ARIMA model to provide more accurate forecasts of maritime accidents and their economic consequences, capturing the complex interrelationships between maritime accidents and economic outcomes, and demonstrating superior prediction accuracy and robustness. However, despite their effectiveness in capturing broad economic trends, statistical models face significant limitations when forecasting sector-specific outcomes, as they require stable and well-distributed data for accurate modeling, and fail to provide reliable predictions when such data is lacking or irregular. As a result, inconsistencies in the added value of production in diverse sectors may undermine the adaptability and accuracy of these models.
Second, unlike statistical models, which often rely on assumptions of data distribution and static parameters, machine learning models can automatically capture intricate patterns and adapt to dynamic changes within the marine economy. As a result, Machine learning models have become increasingly popular in forecasting the marine economy due to their ability to handle complexity and instability in datasets. For instance, Zhao et al. (2019) used the Backpropagation Neural Network (BPNN) to make a prediction of direct economic losses of marine disasters, which are characterized by non-linearity, volatility, and small sample sizes. This model provided reliable predictions with significantly improved precision and outperformed traditional models such as ARIMA and the Grey Model (GM). Furthermore, they applied the ENN model (Zhao et al., 2020) to forecast the direct economic losses of marine disasters in China, addressing the challenges of nonlinearity and volatility in marine disaster loss series. Their results provided more reliable interval predictions with the lowest Mean Absolute Percentage Error (MAPE), Root Mean Square Error (RMSE), and Mean Absolute Error (MAE) values. Besides, Lian (2024) proposed a neural-learning network estimation model to forecast the marine economy near the seaport area from 2011 to 2020. Importantly, the MAPE value of this proposed model was controlled between 4% and 10%, proving its robustness and effectiveness in forecasting the marine economic growth in the seaport areas. However, despite the above success, these machine learning models require large, high-quality datasets for training, which remains a challenge in the context of marine economy forecasting, where data is often incomplete or outdated.
Third, grey system models, particularly for handling available data that is sparse or incomplete, have gained increasing attention for marine economy forecasting. Specifically, Shan and Cao (2022) applied the MGM(1,m) model to predict the development trends of marine science and technology innovation, marine economic growth, and employment in coastal regions of Guangdong. The results showed that from 2017 to 2022, the model accurately forecasted the growth of the scale of marine science and technology innovation, marine economy, and employed persons, with MAPE values of 2.1833%, 1.2871%, and 0.0236%, respectively. Li et al. (2023a) introduced an enhanced GM(1,m) model to predict the Economic-Energy-Environmental systems of both marine and land regions. The model successfully handled the nonlinear and time-delay effects, achieving a MAPE range of 0.21% to 1.36% for those regions respectively. Besides, Li X. et al. (2024) developed the fractional nonlinear grey model to predict the output values of the marine power, marine biopharmaceutical, and marine chemical industries in China. By incorporating interaction terms among the three industries, their model achieved MAPE values of 5.54%, 3.68%, and 4.80%, respectively, and outperformed traditional models like GM and ARIMA in accurately forecasting industry growth.
The traditional grey forecasting model primarily relies on a first-order accumulation process to fit an exponential growth pattern, effectively smoothing the data and minimizing the impact of random disturbances within time series. However, this data processing method faces challenges when applied to diverse marine economic industries. For instance, the coastal tourism industry, though experiencing slow growth, has a high absolute value. In contrast, the biopharmaceutical sector, despite having lower output values, demonstrates rapid growth, especially during periods of technological advancement. This discrepancy highlights the need for new data processing methods that can better accommodate the unique characteristics of different marine sectors.
Conformable fractional accumulation, proposed in recent studies, allows for more nuanced modeling of time series data from various marine industries, reflecting their distinct growth patterns and characteristics (Ma et al., 2020b; Dun et al., 2022). In practical applications, the comfortable fractional grey models have gained significant attention in recent years due to their flexibility and effectiveness for forecasting in multiple time series in diverse regions or industries. For instance, Li et al. (2023b) proposed a novel flexible fractional grey Bernoulli model, and forecast onshore and offshore wind power generation trends from China, Denmark, and the UK. Similarly, Ding et al. (2024a) introduced the CFDSGM model, based on the comfortable fractional accumulation, to predict CO2 emissions across the U.S. commercial, industrial, residential, and electric power sectors. Moreover, the superior predictive capability, flexibility, and robustness of this forecasting model are validated because of the MAPE values below 5% during training and 10% during testing.
Overall, statistical models, machine learning, and grey system models are commonly used in marine economy forecasting. Although statistical and machine learning models are effective in prediction, they depend on stable data distributions or require large datasets. In contrast, grey models can provide accurate predictions in the data limited situation. However, heterogeneity and different growth characteristics of added values in diverse industries make high-accuracy predictions difficult with a single grey model.
Consequently, the combination of fractional order accumulation and grey models enables the model to effectively handle similar time series from different regions and industries, such as multi-region wind power generation or multi-industry carbon emissions. When forecasting added values in the marine economy, the CFGM model, consists of the fractional order accumulation and traditional grey model, and can also address challenges in data heterogeneity and instability, filling the gap in the relatively predicted research.
This section discusses the CFGM model, with a focus on its data preprocessing method using conformable fractional accumulation, as described in Subsection 3.2. In addition, the formulation of the model itself is presented in Subsection 3.3, providing a detailed explanation of its mathematical foundation. Furthermore, its hyper-parameter optimization process is further enhanced using Particle Swarm Optimization (PSO), as detailed in Subsection 3.4.
The CFGM integrates the advantages of conformable fractional accumulation and the classical grey forecasting model, making it particularly suitable for analyzing industrial added values characterized by small sample sizes and heterogeneity in the marine economy. The suitability of CFGM stems from two main aspects: data processing and nonlinear fitting, as demonstrated in the Data Preprocessing and Establishment of the Proposed Model parts in Figure 2. On the one hand, the CFA method smooths fluctuations in the time series of industrial added values, which exhibit significant differences across various industries. Notably, by applying different fractional order parameters, the method effectively captures and smooths the unique fluctuation patterns inherent to diverse industries.
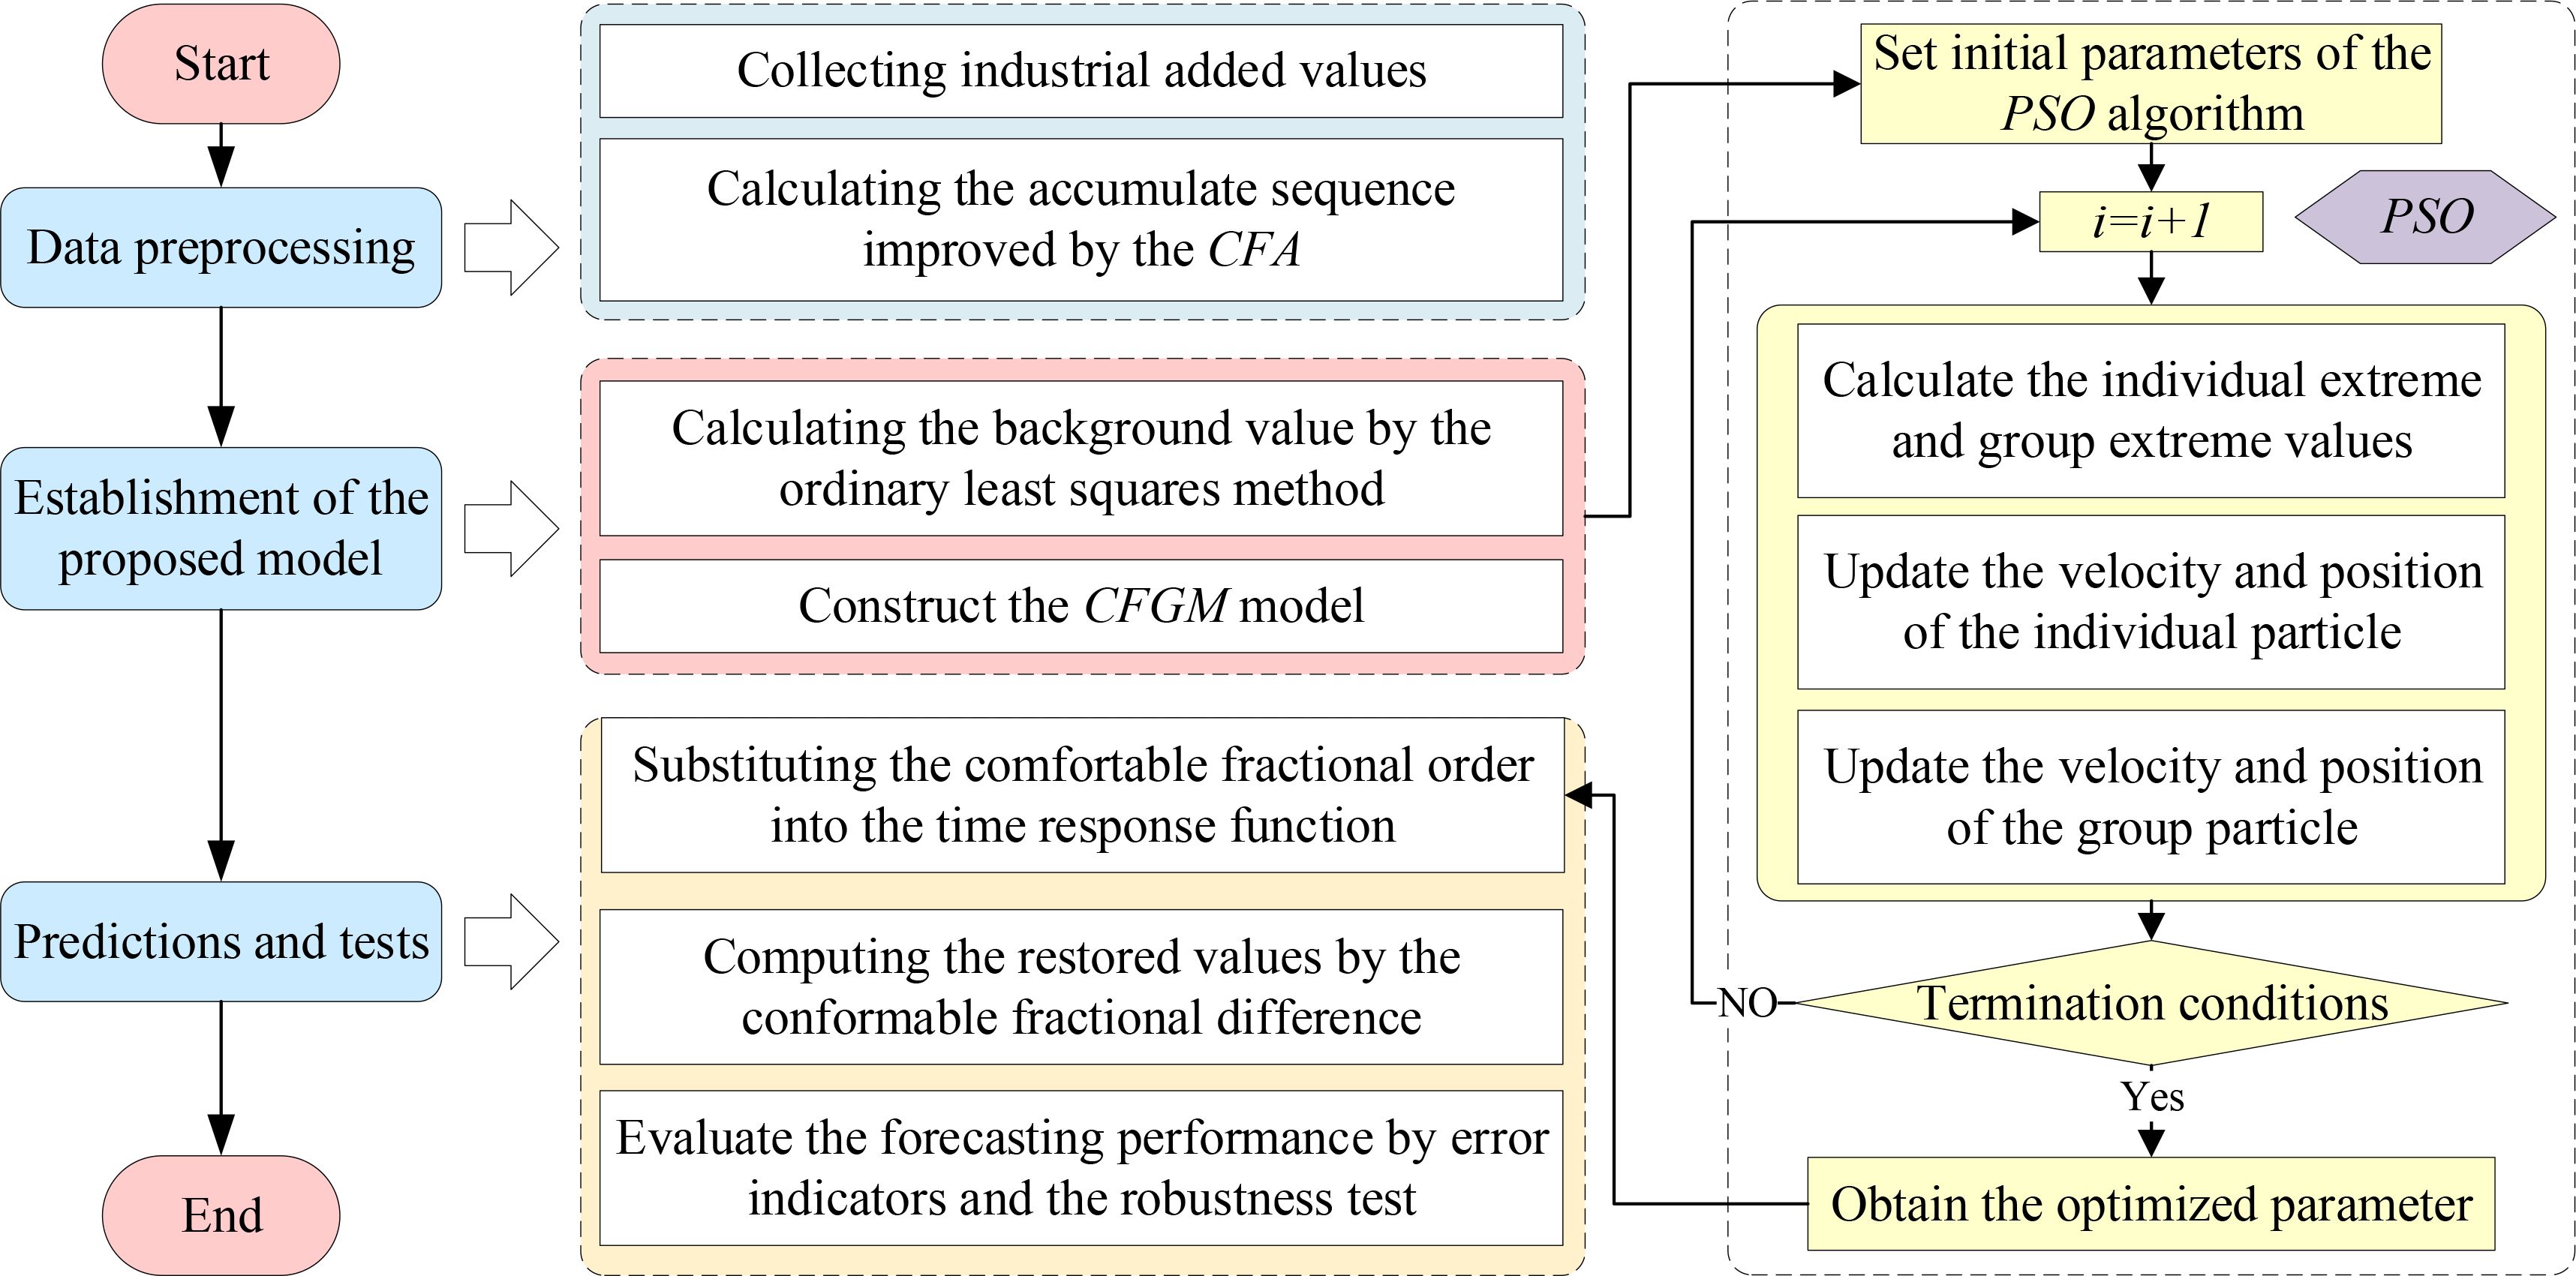
Figure 2. The overall framework of the CFGM model.
On the other hand, grey forecasting efficiently fits the exponential growth of time series, enabling accurate predictions with small samples. Specially, the annual fluctuations in marine economic added values are characterized with the unregular distribution patterns, and data limited situation. Notably, this lack of data distribution regularity, such as normal distribution, poses challenges for statistical models. Additionally, the constrained sample size prevents machine learning models from being sufficiently trained to ensure high prediction accuracy. Therefore, in this study, the CFGM model is recommend to predict the production value of five representative ocean industries, including traditional sectors like marine fisheries, coastal tourism, and marine transportation, as well as emerging industries such as marine biopharmaceuticals and marine power generation. This application highlights the capability of CFGM to address features such as large inter-industry fluctuations and small sample sizes, offering valuable insights into the complex dynamics of the ocean economy.
In the following, we provide a detailed explanation of the operational process of the CFGM model, along with the procedure by which the PSO algorithm determines the optimal fractional order accumulation parameters, with a flowchart as follows.
(1) Data preprocessing. The CFGM model combines conformable fractional accumulation for data smoothing with the classical GM for forecasting. This integration enhances accuracy and adaptability, making it particularly effective for forecasting ocean economy industries characterized by small-sample and heterogeneous data.
(2) Establishment of our suggested model. To enhance performance, the CFGM model parameters are optimized using PSO, which ensures efficient global search and rapid convergence. Furthermore, the stability of results generated by the CFGM model is rigorously verified through Monte Carlo simulations (MCS) and PDA.
(3) Predictions and tests. The CFGM model is evaluated against traditional econometric, machine learning, and grey forecasting models. Importantly, its accuracy is assessed using MAPE, RMSE, and the Improvement Rate (IR) metrics, while its stability is further examined through MCB tests.
Predicting the added value of production of marine industries presents several challenges, especially due to the heterogeneity and data limitations, which often arises from the distinct characteristics of different industrial sectors. These differences lead to time series that exhibit volatility, non-stationarity, and irregular patterns, making prediction difficult. To address these issues, an effective data preprocessing method, such as the comfortable fractional accumulation, is required to smooth the data, reduce noise, and improve the overall accuracy of the forecasting model.
Let the original time series data be represented as , where each represents the data point at time . The goal of fractional accumulation is to transform this original data into a new series, , that exhibits reduced volatility and improved trend representation. As a result, the -order-CFA is denoted as:
where represents the initial time series size and represents the observation in this sequence. Besides, the conformable fractional accumulation process is defined by the following equation
The transformed series exhibits improved stability, reducing the noise and irregular fluctuations present in the original data. This makes the data more suitable for forecasting, as it helps to smooth out the irregularities inherent in such datasets, ensuring more reliable forecasting outcomes of ocean industries. Consequently, by applying conformable fractional accumulation to the time series of ocean industries such as marine fisheries, coastal tourism, and marine transportation, the resulting data becomes more stable and accurate, enabling the CFGM model to make more precise predictions.
After the establishment of the conformable fractional accumulation time series, the forecasting model is constructed by applying the differential equation, shown in Equation 3, to fit the growth trend of the accumulated sequence.
The next step involves using the white equation, shown in Equation 4, to model the underlying dynamics of the time series and estimate the parameters and , which represent the growth rate and the background value, respectively.
To estimate these parameters and , we calculate the background value and use using the Ordinary Least Squares (OLS) method.
This background value is essential for understanding the driving force behind the time series and is incorporated into the whitening process, which reduces the noise and enhances the accuracy of predictive results generated by the CFGM model. Then, these parameters are obtained through the OLS, which minimizes the error between the forecasted values and the observed data. Finally, to generate forecasts for future values, the accumulated data is subtracted using the following fractional order deaccumulation process:
While traditional methods such as OLS can be used for estimating the parameters and , the fractional order , which plays a crucial role in determining the stability and predictive accuracy of the forecasting model, requires a more sophisticated approach for optimization. Further, PSO is employed to optimize by minimizing the forecasting error, which helps to identify the optimal smoothing level that improves the forecasting performance of the CFGM model (Wang and Li, 2019). In particular, it is important to optimize this parameter for each specific time series data, particularly for complex, noisy, and heterogeneous marine industry datasets.
In the PSO algorithm, a swarm of particles represents candidate values of the fractional order , and each particle moves through the solution space, guided by its personal best position and the global best position of the swarm. The optimization process aims to find the value of that minimizes the error between the forecasted and actual values, typically using error metrics such as MAPE. Furthermore, the min MAPE and optimal parameter can be solved according to the following conditions:
The above update process for all particles is sequentially performed until the target criteria or the maximum number of iterations is reached. In this paper, the search dimension and learning factors are set as default in Rstudio. Besides, the maximum number of iterations is set by default to 500 times while the population size is set to 50.
In summary, PSO optimizes the fractional order of the CFA process, ensuring that the smoothing and trend extraction are performed at the optimal level for each specific dataset. This results in improved forecasting accuracy and model stability, making the CFGM model more reliable for predicting the production value of ocean industries.
Predicting the value-added of marine production is critical for understanding the dynamics and growth of various industries within the marine economy. Furthermore, accurate forecasting helps guide investments, policy decisions, and strategic planning (Wang and Jv, 2021). This is particularly true for industries that significantly contribute to the marine economy, including both traditional sectors like marine fisheries, coastal tourism, and marine transportation, as well as emerging industries like marine power and biopharmaceuticals.
However, the challenge lies in the need for a universal forecasting model capable of handling the complexities of multiple time series data. Such a model must achieve not only high prediction accuracy but also demonstrate robustness and adaptability across different industries (Ding and Zhang, 2023). Given the diversity of marine sectors, a versatile and reliable model is essential to provide actionable insights for policymakers and industry stakeholders alike.
This section provides an overview of the objectives covered in Subsections 4.1 through 4.4. Subsection 4.1 focuses on data collection and describes the marine value-added data used in this study. Moreover, this section outlines the experimental design, detailing the model selection, forecasting methodology, and the criteria used to evaluate accuracy and stability in prediction; Subsection 4.2 and 4.3 presents the results of the multi-step forecasting experiments, comparing the predictive performance of different models and validating the stability and reliability of the CFGM. Finally, Subsection 4.4 demonstrates the effectiveness and reliability of the proposed model, projecting future added values in industry-level marine, thus providing valuable data for policymakers and researchers.
To evaluate the forecasting performance of the CFGM model and assess its adaptability to multiple marine production value-added time series, this study adopts a comprehensive experiment design. As a result, the CFGM model is specifically chosen due to its ability to handle time series data effectively while offering the flexibility needed for diverse marine sectors, including traditional sectors such as marine fisheries, coastal tourism, and transportation, as well as emerging industries like marine energy and biopharmaceuticals.
This study aims to analyze the trends in marine production value added across five industries from 2012 to 2023, utilizing data from diverse sectors of the marine economy. Those industries covered include traditional sectors, including marine fisheries, coastal tourism, and transportation, alongside emerging sectors like marine biomedicine and marine power industries. These industries are integral to the marine economy, each contributing in distinct ways to its growth and diversification. The selection of the time period and industries is influenced by several macroeconomic factors, including key policies and the impact of the COVID-19 pandemic.
On the one hand, the year 2012 is chosen as the starting point due to the implementation of the “13th Five-Year Plan for National Marine Economic Development,” which marked a significant shift in the trajectory of marine economic growth. The original datasets used in this study are primarily sourced from the Ifind database (https://www.51ifind.com), with supplementary data derived from the marine economic statistical reports published by the Ministry of Natural Resources. Besides, given that the most recent data available from these sources is up to 2023, this year has been selected as the endpoint for the analysis.
On the other hand, the selection of industries reflects the main disruptions caused by the COVID-19 pandemic. Given the significant halt in production in marine heavy industries such as marine oil and gas and marine mining, these sectors are excluded from the analysis. Instead, the study focuses on more stable and representative industries, including marine fisheries, coastal tourism, marine biomedicine, marine transportation, and marine power, ensuring the reliability and validity of the results. As a result, the final dataset spans the period from 2012 to 2023, reflecting the five marine industries, including the marine fisheries, coastal tourism, transportation, biomedicine, and power sectors, during this time.
In the experimental design, this paper includes multi-step forecasting, accuracy testing, and robustness analysis to ensure the predictive performance of the CFGM model is not only accurate but also stable across different time series (Egger et al., 2022).
First, the experiment involves multi-step forecasting, where the ability of CFGM to predict future added values of the marine economy is tested across different time horizons. Specifically, in Table 2, the study uses two types of out-of-sample forecasts: one-step and two-step predictions. The one-step forecast refers to predicting the data point in 2023, while the two-step forecast projects two future data points from 2022 to 2023. Importantly, the use of two forecast steps allows for a more robust evaluation of the forecasting ability of all forecasting models. Additionally, the results generated by CFGM will be compared against six other forecasting models, including the ARIMA, Exponential Trend Smoothing (ETS), Support Vector Regression (SVR), BPNN, GM and Discrete Grey Model (DGM). This above comparison will help to show the relative strengths of the CFGM model in forecasting added values that are characterized by data limitations and heterogeneity in the marine economy.
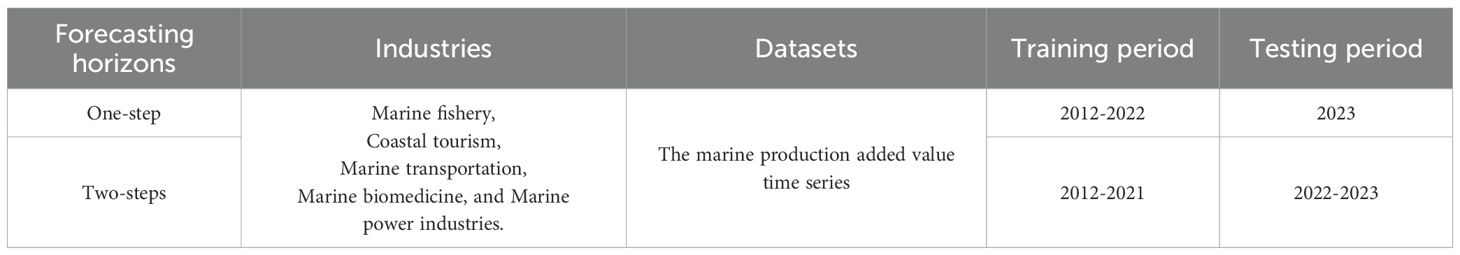
Table 2. The multi-step forecasting experiment set about the one-step and two-step predictions.
Second, we use three key metrics, including the MAPE, RMSE, and IR, to evaluate the forecasting accuracy of the above models. On one hand, shown in Equation 8, MAPE offers an intuitive understanding of forecast accuracy across all models, while RMSE is particularly useful for identifying larger errors when the external predicted values occur. On the other hand, IR quantifies the improvement in accuracy achieved by the CFGM model compared to other models, calculated by comparing the MAPE of the CFGM and the corresponding indicator of competing models. Most importantly, the higher IR or litter MAPE values indicate the superior forecasting performance of the CFGM model, highlighting its effectiveness in providing more accurate predictions.
Third, to assess the robustness of the forecasting models, we employ several methods, including MCS, PDA, and MCB tests. These techniques are used to examine the stability and reliability of the CFGM model across various conditions and ensure that its highly accurate results are not due to specific circumstances in the added values datasets. To be specific, the MCS involves running multiple simulations with varying inputs of the hyper-parameter to observe how the model performs under different scenarios, providing insights into its overall robustness (Portillo Juan and Negro Valdecantos, 2024). Then, the PDA further complements this robustness check by assessing the distribution of forecasting results (Li J. et al., 2024). Finally, MCB analysis performs repeated predictions using CFGM across multiple forecasting horizons (Ye et al., 2024), ensuring that the CFGM model consistently generates the forecasting values with high accuracy. By applying these methods, we aim to demonstrate that the CFGM model not only achieves high accuracy but also exhibits significant robustness, distinguishing it from other forecasting models.
This section presents the results of the forecasting experiments, evaluating the performance of the CFGM model in comparison to several other forecasting methods. From the industry forecasting perspective, in subsection 4.2.1, we examine the overall prediction accuracy of the models across five marine industries, analyzing the results based on key metrics such as MAPE, RMSE, and IR. Besides, from the modeling perspective, in subsection 4.2.2, we compare the applicability and performance of the CFGM model with traditional statistical models, machine learning models, and gray prediction models. This comparison is made through the distribution of MAPE and RMSE values, analyzing metrics like the mean, variance, as well as the maximum and minimum values. Finally, subsection 4.2.3 focuses on the robustness of the CFGM model by employing PCA and MCB tests, assessing the stability and reliability of the model under varying conditions, and validating its performance across different forecasting horizons and industries.
This section presents a comprehensive analysis of the forecasting performance of the models, with detailed evaluations based on the MAPE and RMSE metrics, as shown in Table 3, and the IR, as presented in Table 4. Specifically, based on the five industrial predictions, Table 3 provides the mean values and standard deviations of MAPE and RMSE for each model across different forecasting periods (in-sample and out-of-sample), allowing for a comparison of their accuracy and stability. On the other hand, Table 4 presents the improvement rates in MAPE for each model relative to CFGM, highlighting how much better or worse each competing model performs compared to CFGM in various industries.
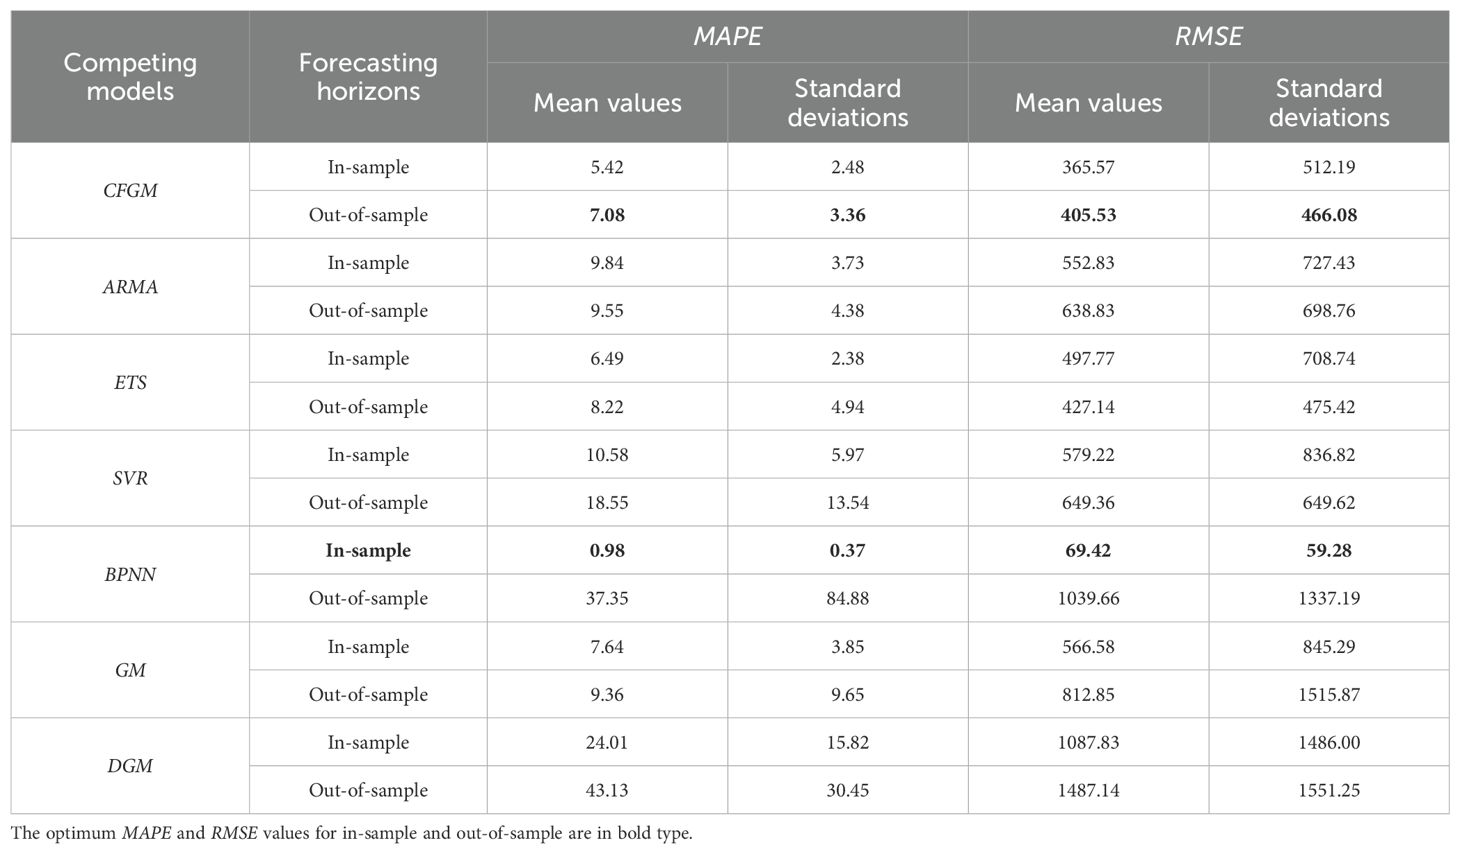
Table 3. The statistical descriptions of MAPE and RMSE generated by all forecasting models for five industrial added value time series.
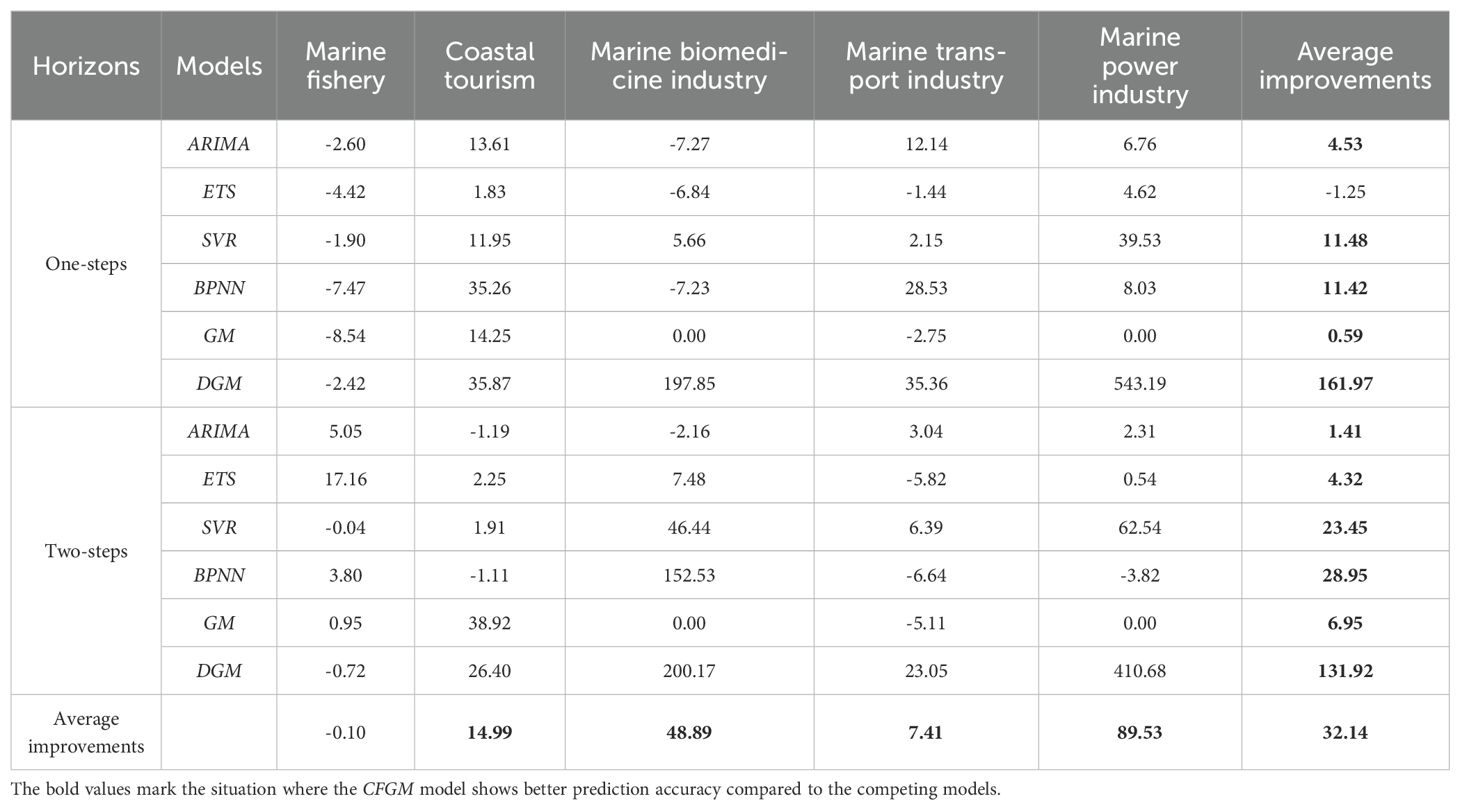
Table 4. The predicting MAPE improvement rates (%) between CFGM and its competitors.
From Table 3, we can conclude that the CFGM model consistently demonstrates the best overall forecasting performance, although this model is defeated by BPNN in the fitting period. In detail, CFGM demonstrates more consistent and reliable forecasting performance because it achieves a balanced forecasting performance in both fitting and testing periods. To be special, while CFGM generates MAPE (5.42%) and RMSE (365.57) are slightly higher in the in-sample forecast than BPNN, it performs significantly better in the out-of-sample forecast, with the lowest MAPE (7.08%) and RMSE (405.53), as shown in Table 3. Additionally, CFGM exhibits the lowest standard deviations for both MAPE and RMSE in the out-of-sample period, indicating its stability across all industries. In contrast, considering the in-sample forecasting performance, the BPNN model performs the best with the lowest MAPE (0.98%) and RMSE (69.42), indicating an excellent fit to the training data. However, this strong performance deteriorates significantly in the out-of-sample forecast, with MAPE increasing to 37.35% and RMSE rising to 1039.66. This indicates that BPNN struggles with overfitting problems. Similar conclusions can be found in other competitive forecasting models. Consequently, the performance in both in-sample and out-of-sample periods suggests that CFGM maintains high accuracy in predictions across diverse industries, making it more consistent and reliable in overall predictions.
In Table 4, we examine the IR for CFGM relative to its competitors across different industries and forecasting horizons. The improvement rates clearly demonstrate the superior forecasting accuracy of the CFGM model, both in terms of industry-specific performance and the forecasting horizon, including one-step and two-step predictions.
From the industry perspective, CFGM consistently outperforms other models in most sectors, with the exception of the marine fishery industry, where it shows a marginal improvement of -0.10%. This suggests that CFGM provides a slight decrease in accuracy for marine fishery forecasts. But, its performance across other industries remains notably superior. In the marine power industry, for example, the improvement rate reaches 89.53%, showcasing a significant gain in forecasting accuracy compared to other models.
In addition, from the forecasting horizon perspective, we can see the CFGM demonstrates a clear advantage in two-step forecasting, where it consistently outperforms all other models across all industries. In this context, CFGM yields positive improvement rates for all industries, with the highest improvements (200.17%) compared with the DGM model and the lowest improvements in the marine power sector (1.41%) compared with the ARIMA model. Similar conclusions can be found in the one-step forecasting situation.
Overall, the analysis of Tables 3 and 4 shows that CFGM outperforms other models in both forecasting accuracy and consistency across industries and forecasting horizons. This makes CFGM a highly adaptable and reliable model, capable of providing more accurate and consistent forecasts than its competitors, especially when facing time series with more complex and data heterogeneity environments.
This section focuses on evaluating the applicability of the CFGM model compared to other forecasting models based on their prediction performance. To achieve this, we analyze the results presented in Figures 3, 4, which illustrate the MAPE and RMSE boxplots for the in-sample period and out-of-sample period, respectively. These figures provide insights into the performance and stability of CFGM against statistical models (ARIMA and ETS), machine learning models (SVR and BPNN), and gray models (GM and DGM). Together, these metrics, including MAPE and RMSE, offer a comprehensive view of the suitability of those forecasting models under varying conditions, especially in small-sample, heterogeneous, and complex time series datasets.
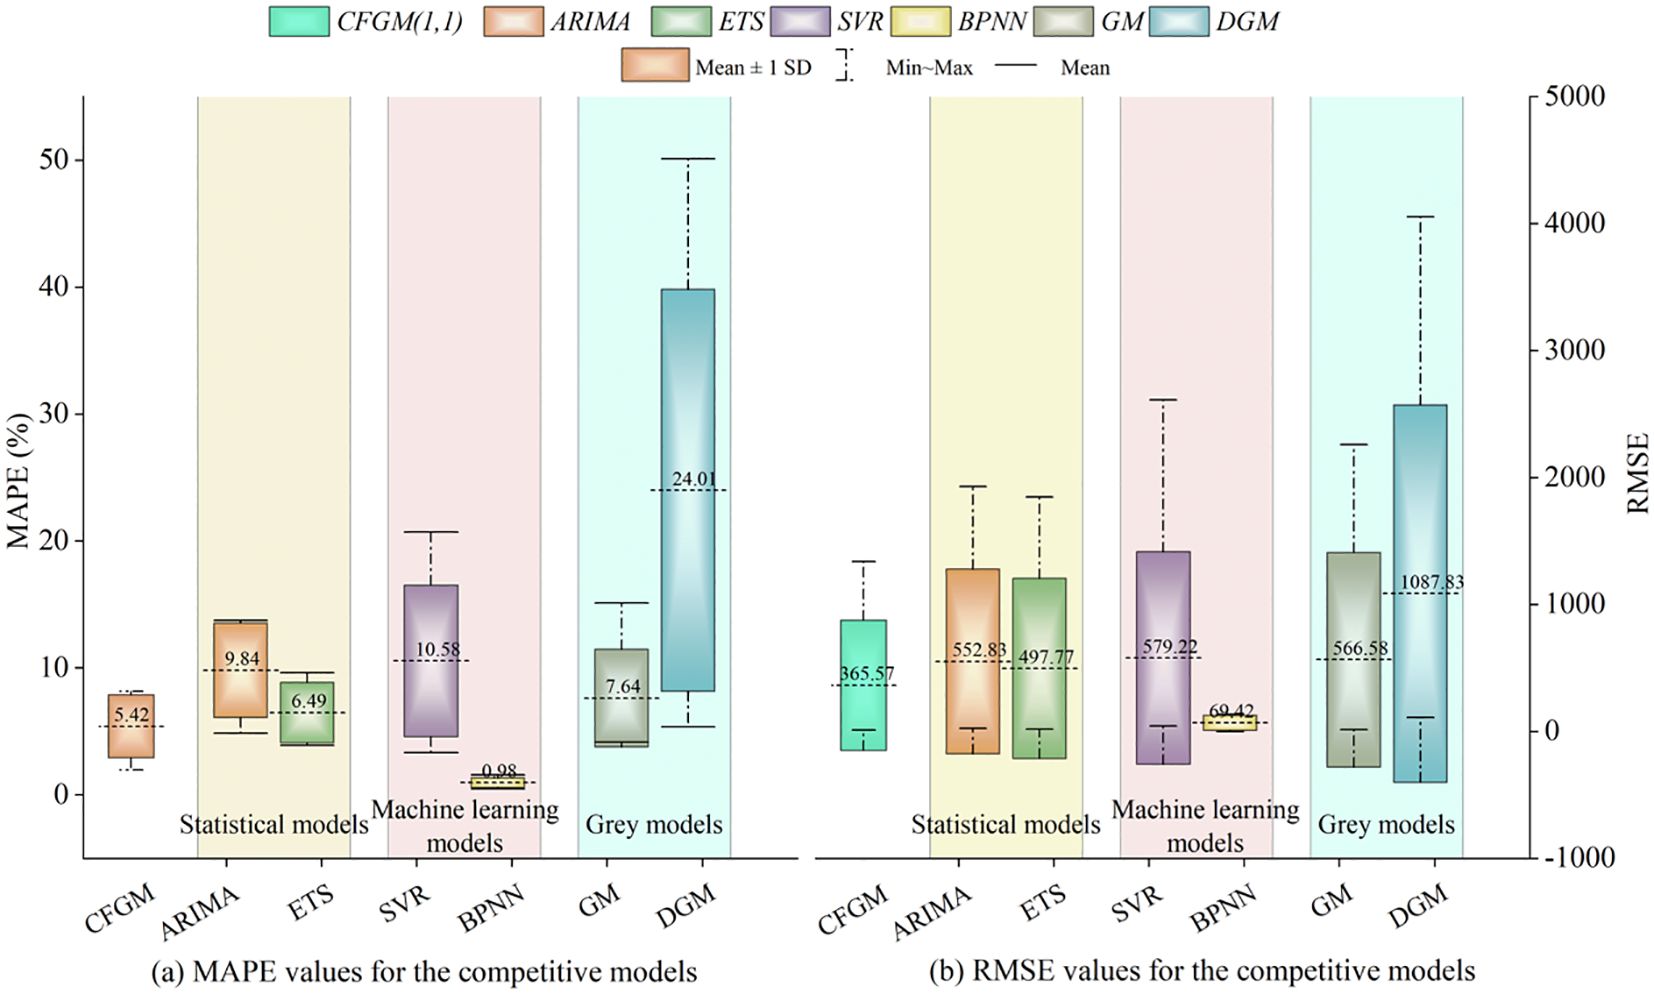
Figure 3. (A,B) The MAPE and RMSE boxplots of the CFGM and traditional predictive models for the in-sample period.
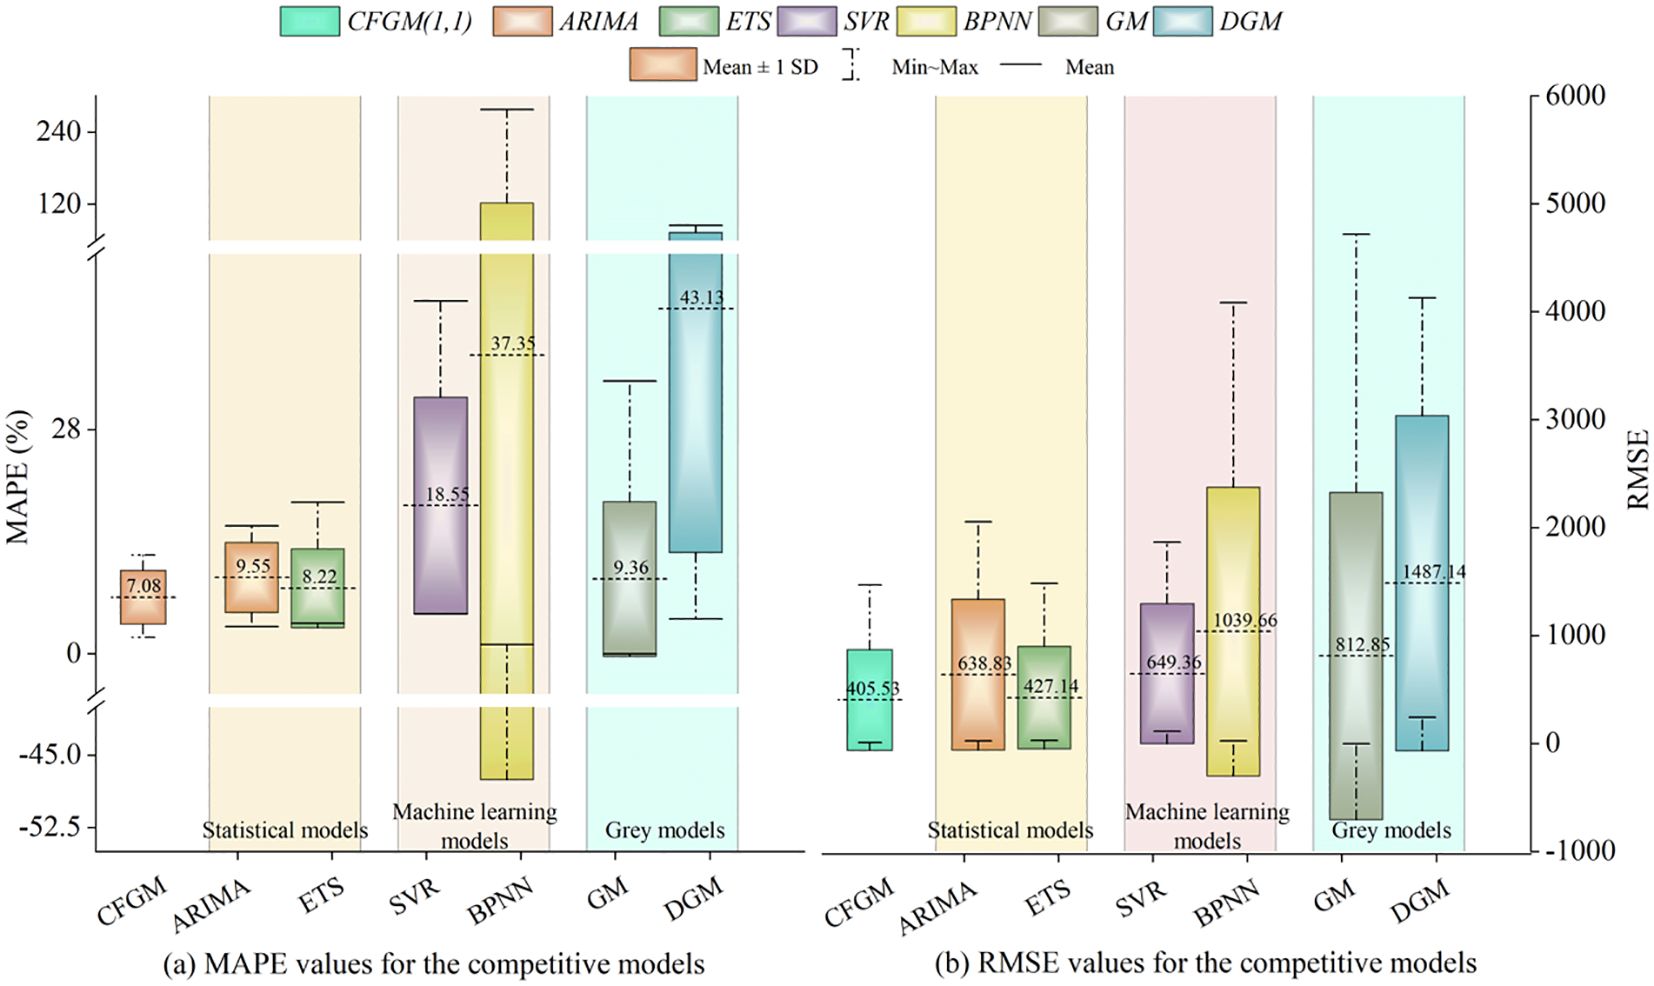
Figure 4. (A,B) The MAPE and RMSE boxplots of the CFGM and traditional predictive models for the out-of-sample period.
First, from the perspective of statistical models, Figures 3 and 4 compare the in-sample and out-of-sample performance of ARIMA and ETS. For ARIMA, CFGM consistently outperforms in both periods. In terms of MAPE, CFGM achieves the smallest mean, variance, and range (maximum and minimum values), as shown in Figure 3A. For example, CFGM’s in-sample MAPE mean (5.42%) is significantly lower than ARIMA’s (9.84%), and this advantage extends to the out-of-sample period, where CFGM’s mean MAPE (7.08%) is also lower than ARIMA’s (9.55%). Moreover, CFGM demonstrates consistently smaller MAPE variance and range, indicating greater stability and more evenly distributed prediction errors across industries.
Similarly, CFGM exhibits superior RMSE performance. Although specific RMSE values are omitted, CFGM consistently shows lower mean, variance, and range across both periods, underscoring its ability to maintain accurate and stable forecasts. ETS, while slightly better than ARIMA, still falls short of CFGM in all aspects. The underperformance of statistical models can be attributed to their reliance on strict assumptions about the data, such as stationarity or normality (Ma et al., 2020a). In real-world applications, particularly in small-sample marine industries, these assumptions are often unmet, leading to larger errors and reduced stability. This highlights the limitations of statistical models in complex, small-sample environments and underscores the need for adaptive approaches like CFGM.
Second, from the perspective of machine learning models, Figures 3 and 4 also compare CFGM with BPNN and SVR. In the out-of-sample period, CFGM consistently outperforms BPNN. While BPNN achieves the lowest in-sample MAPE (0.98%) among all models, its out-of-sample MAPE rises sharply to 37.35% (Figure 4A), far exceeding CFGM’s out-of-sample MAPE (7.08%). This dramatic increase underscores BPNN’s overfitting tendencies and poor generalization. Furthermore, BPNN’s out-of-sample MAPE variance and range are significantly higher than CFGM’s, emphasizing its instability across industries. For example, BPNN’s maximum out-of-sample MAPE (277.52%) vastly exceeds CFGM’s, highlighting its unreliable predictions.
Regarding RMSE, a similar pattern emerges. While BPNN achieves the lowest in-sample RMSE (69.42) in Figure 3B, its out-of-sample RMSE rises to 1039.66, compared to CFGM’s significantly lower RMSE of 405.53 (Figure 4B). These results reinforce BPNN’s susceptibility to overfitting and poor generalization. SVR follows a similar trend, performing moderately well in the in-sample period but showing high variability and reduced accuracy out-of-sample due to its reliance on sufficient sample sizes. These findings highlight CFGM’s superior adaptability and robustness in small-sample environments like the marine industry, where data limitations constrain machine learning models (Zhou et al., 2025).
Third, from the perspective of gray models, Figures 3 and 4 further illustrate CFGM’s superiority over GM and DGM. For example, in the in-sample period (Figure 3A), GM achieves a mean MAPE of 7.64%, higher than CFGM’s 5.42%. This trend becomes more pronounced in the out-of-sample period, where GM’s mean MAPE rises to 9.36%, while CFGM maintains a lower value of 7.08%. Additionally, GM’s MAPE variance and range are consistently higher, reflecting greater instability. For example, GM’s maximum and minimum MAPE values (15.11% and 4.17%) show a wider spread compared to CFGM’s, which remains more consistent across industries.
For RMSE, CFGM again outperforms GM, showing consistently lower mean, variance, and range in both periods. DGM performs even worse, with larger prediction errors and greater variability. These results highlight the limitations of traditional gray models, which, despite their independence from large samples or strict data assumptions, lack advanced data processing capabilities to handle complex and heterogeneous time series (Wang and Li, 2024). In contrast, CFGM leverages conformable fractional accumulation to effectively capture intricate patterns in small-sample datasets, making it more reliable and adaptable.
In summary, the comparative analysis across statistical models, machine learning models, and gray models demonstrates that CFGM consistently outperforms its competitors, especially in the out-of-sample period. Unlike statistical models, CFGM does not rely on strict assumptions about data distributions, such as stationarity or normality, making it more suitable for real-world datasets that are often small, heterogeneous, and complex. Similarly, compared to machine learning models like BPNN and SVR, CFGM avoids issues of overfitting and instability, which commonly arise due to limited sample sizes. Furthermore, in comparison with traditional gray models, CFGM incorporates advanced data processing capabilities because of the conformable fractional accumulation, which enables it to fit a wide range of time series effectively and achieve superior performance in various scenarios.
Overall, the forecasting ability of CFGM to achieve the smallest mean, variance, and range in the out-of-sample period highlights its superior performance across diverse industries and forecasting horizons. Moreover, these strengths can be attributed to its unique data processing mechanism, which enhances its adaptability and effectiveness in handling small-sample, heterogeneous, and complex datasets. As a result, CFGM emerges as a highly reliable and robust choice for predictive modeling in added values in diverse marine industries.
To ensure the reliability and applicability of the CFGM model, robustness testing is conducted to evaluate the stability and accuracy of its predictive performance under varying conditions. Importantly, robustness tests are particularly important in forecasting models as they validate whether the anticipated values remain precise and consistent across multiple scenarios, such as diverse industries or time horizons.
In this study, two complementary methods are adopted to assess the robustness of CFGM. On the one hand, PDA is used to examine the stability of one-step forecasted values by analyzing their probability distribution curves, which are derived through MCS and kernel density estimation (Wang et al., 2020). On the other hand, the MCB test is performed to statistically compare CFGM with benchmark models across multiple industries. This test evaluates whether CFGM significantly outperforms other models in multi-step forecasting scenarios by analyzing their average rankings and confidence intervals. In short, these two approaches provide a comprehensive evaluation of the robustness of CFGM, verifying both the precision of its predictions and its relative superiority over competing models.
As outlined in the PSO procedure, the initialization of the population and particles is inherently stochastic, leading to variations in the optimal parameter -order-CFA across repeated predictions under identical experimental conditions. This inherent randomness introduces uncertainty into the model’s predictive performance, as the fitted and forecasted values are contingent upon the specific parameter configurations. To address this issue and ensure the robustness of the proposed model, we incorporate the PDA framework. This approach systematically evaluates the stability and accuracy of the predictive outcomes, thereby enhancing the reliability of the model in practical applications.
Moreover, the inherent randomness, from the optimal parameters in each repeated experiment, has a direct impact on the prediction outcomes of the CFGM model, as the fitted and forecasted values vary depending on the comfortable fractional parameters (Ding et al., 2024b). As a result, MCS involves repeating the optimization process for finding hyper-parameter ζ 1000 times, resulting in a dataset of predicted values in the one-step prediction. These values, denoted as , are used as input for describing PDA, and this process can be calculated as follow.
here, denotes the bandwidth, a smoothing parameter that is set based on the specific data characteristics, and represent the predicted values generated by CFGM.
By applying the above method to CFGM, we can generate the probability density curves shown in Figure 5, which provide intuitive insights into the stable predictions generated by the CFGM across different industries. Specifically, the PDA in one-step forecasting of CFGM is displayed for five marine industries: the red, orange, yellow, green, and blue curves represent the marine fishery, coastal tourism, biomedicine, transportation, and power industries, respectively. In detail, the X-axis corresponds to the forecasted added values of the marine economy, while the height of the probability density curve at any given point represents the likelihood of that forecasted value occurring. As a result, the peak of each curve marks the forecasted value with the highest probability of occurrence. Notably, when a probability density curve exhibits a unimodal pattern, it indicates that the predictions by CFGM are highly stable, as the predicted values are concentrated around a single point with minimal fluctuations.
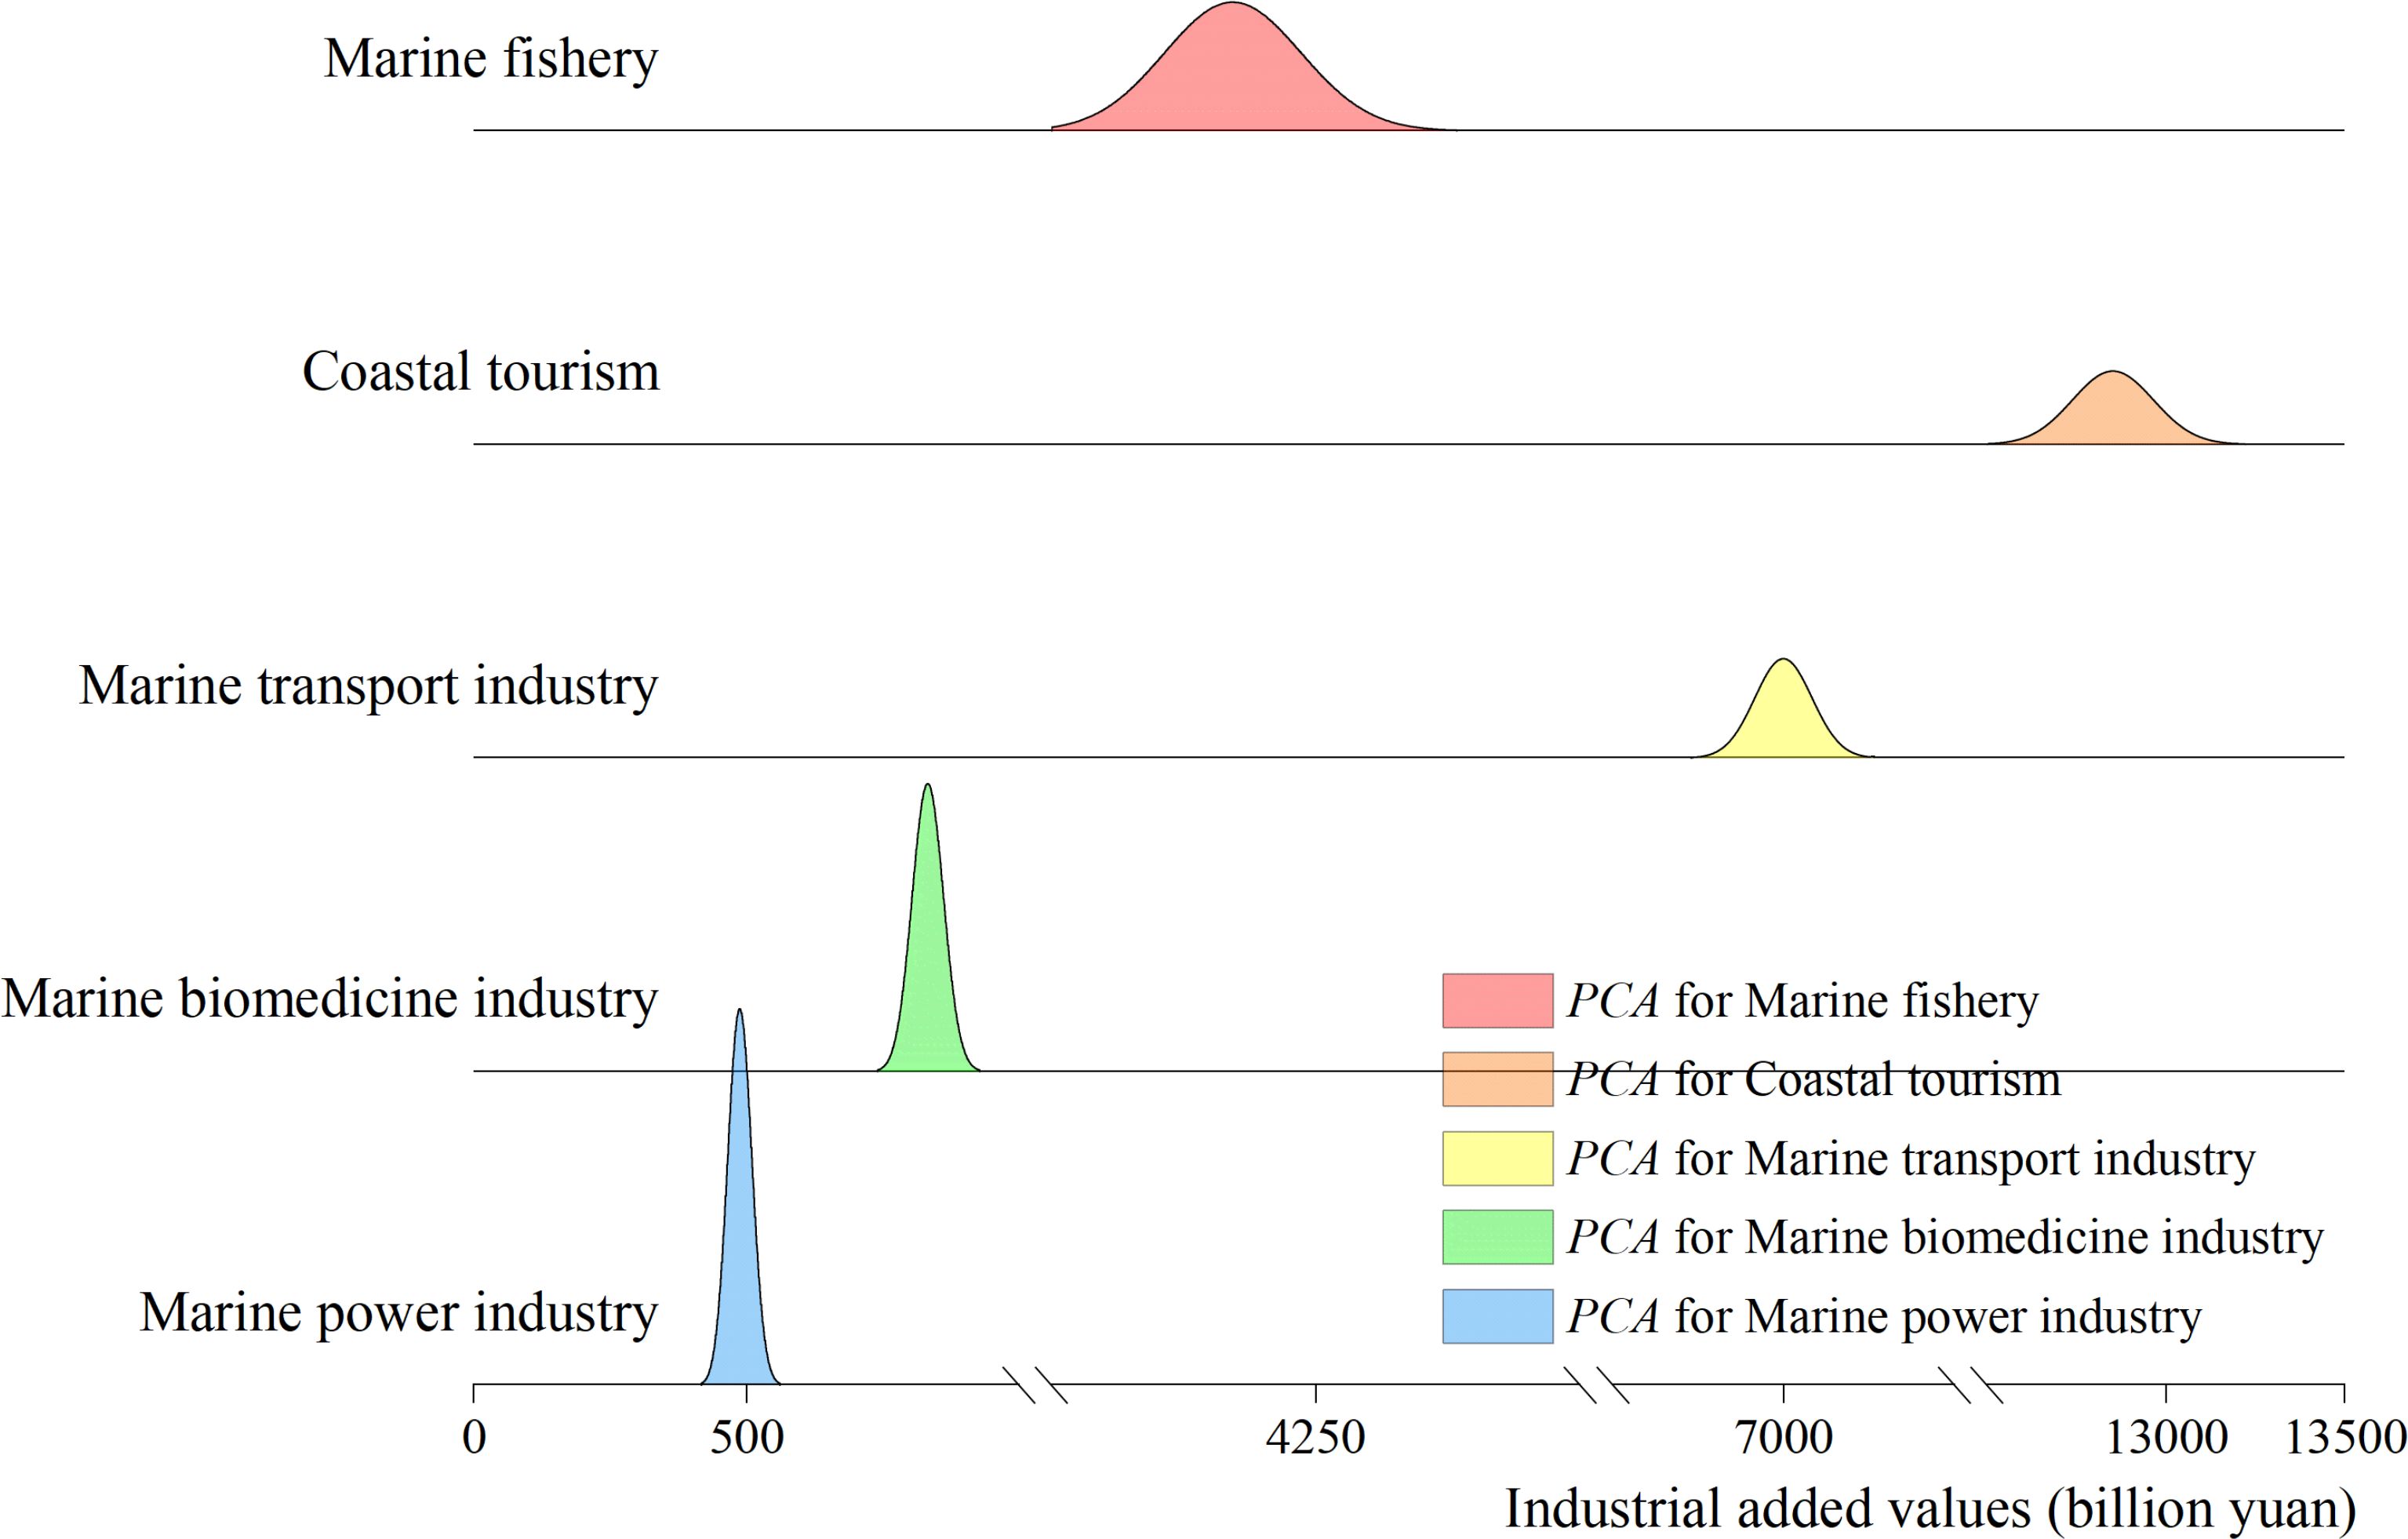
Figure 5. Probability density curves of all industrial predictions for one-step forecasts by CFGM.
For example, focusing on the marine power industry (shown in the blue curve in Figure 3), the peak of the probability density curve occurs near 450, while the actual added value for this industry in 2023 is 446. This demonstrates that the CFGM model generates an accurate and stable prediction. On the one hand, the unimodal pattern confirms the stability of the forecasts, as the predicted values are tightly concentrated around the peak. On the other hand, the proximity of the peak value to the actual added value highlights the precision in the predictions of the CFGM model. Similar conclusions can be drawn for the other industries, where the unimodal probability density curves confirm the stability and accuracy of predictions generated by CFGM across different scenarios. This indicates that the predictive results of CFGM remain robust even under varying scenarios, fulfilling the requirements for stable and precise time series forecasting.
The MCB test was used to statistically compare the performance of CFGM against benchmark models, utilizing Absolute Percentage Error (APE) values from multi-step forecasts. This method computes the average ranks of models across various industrial predictions and their corresponding confidence intervals, providing statistical evidence to assess whether differences in performance are meaningful rather than due to random variations. Notably, the BPNN model was excluded from the MCB test due to its overfitting tendency, avoiding potential distortions caused by such models.
As shown in Figure 6, the average ranks of CFGM and its competitors are displayed, along with their confidence intervals. The analysis highlights two key aspects of the comparative performance. First, in regard to non-overlapping confidence intervals, models such as DGM (the average rank: 4.89), SVR (the average rank: 3.72), ARIMA (the average rank: 3.47), and ETS (the average rank: 2.97) have confidence intervals that do not overlap with CFGM (the average rank: 2.52). This lack of overlap statistically confirms that CFGM significantly outperforms these models in multi-step forecasting tasks, indicating their relatively poor predictive performance compared to CFGM.
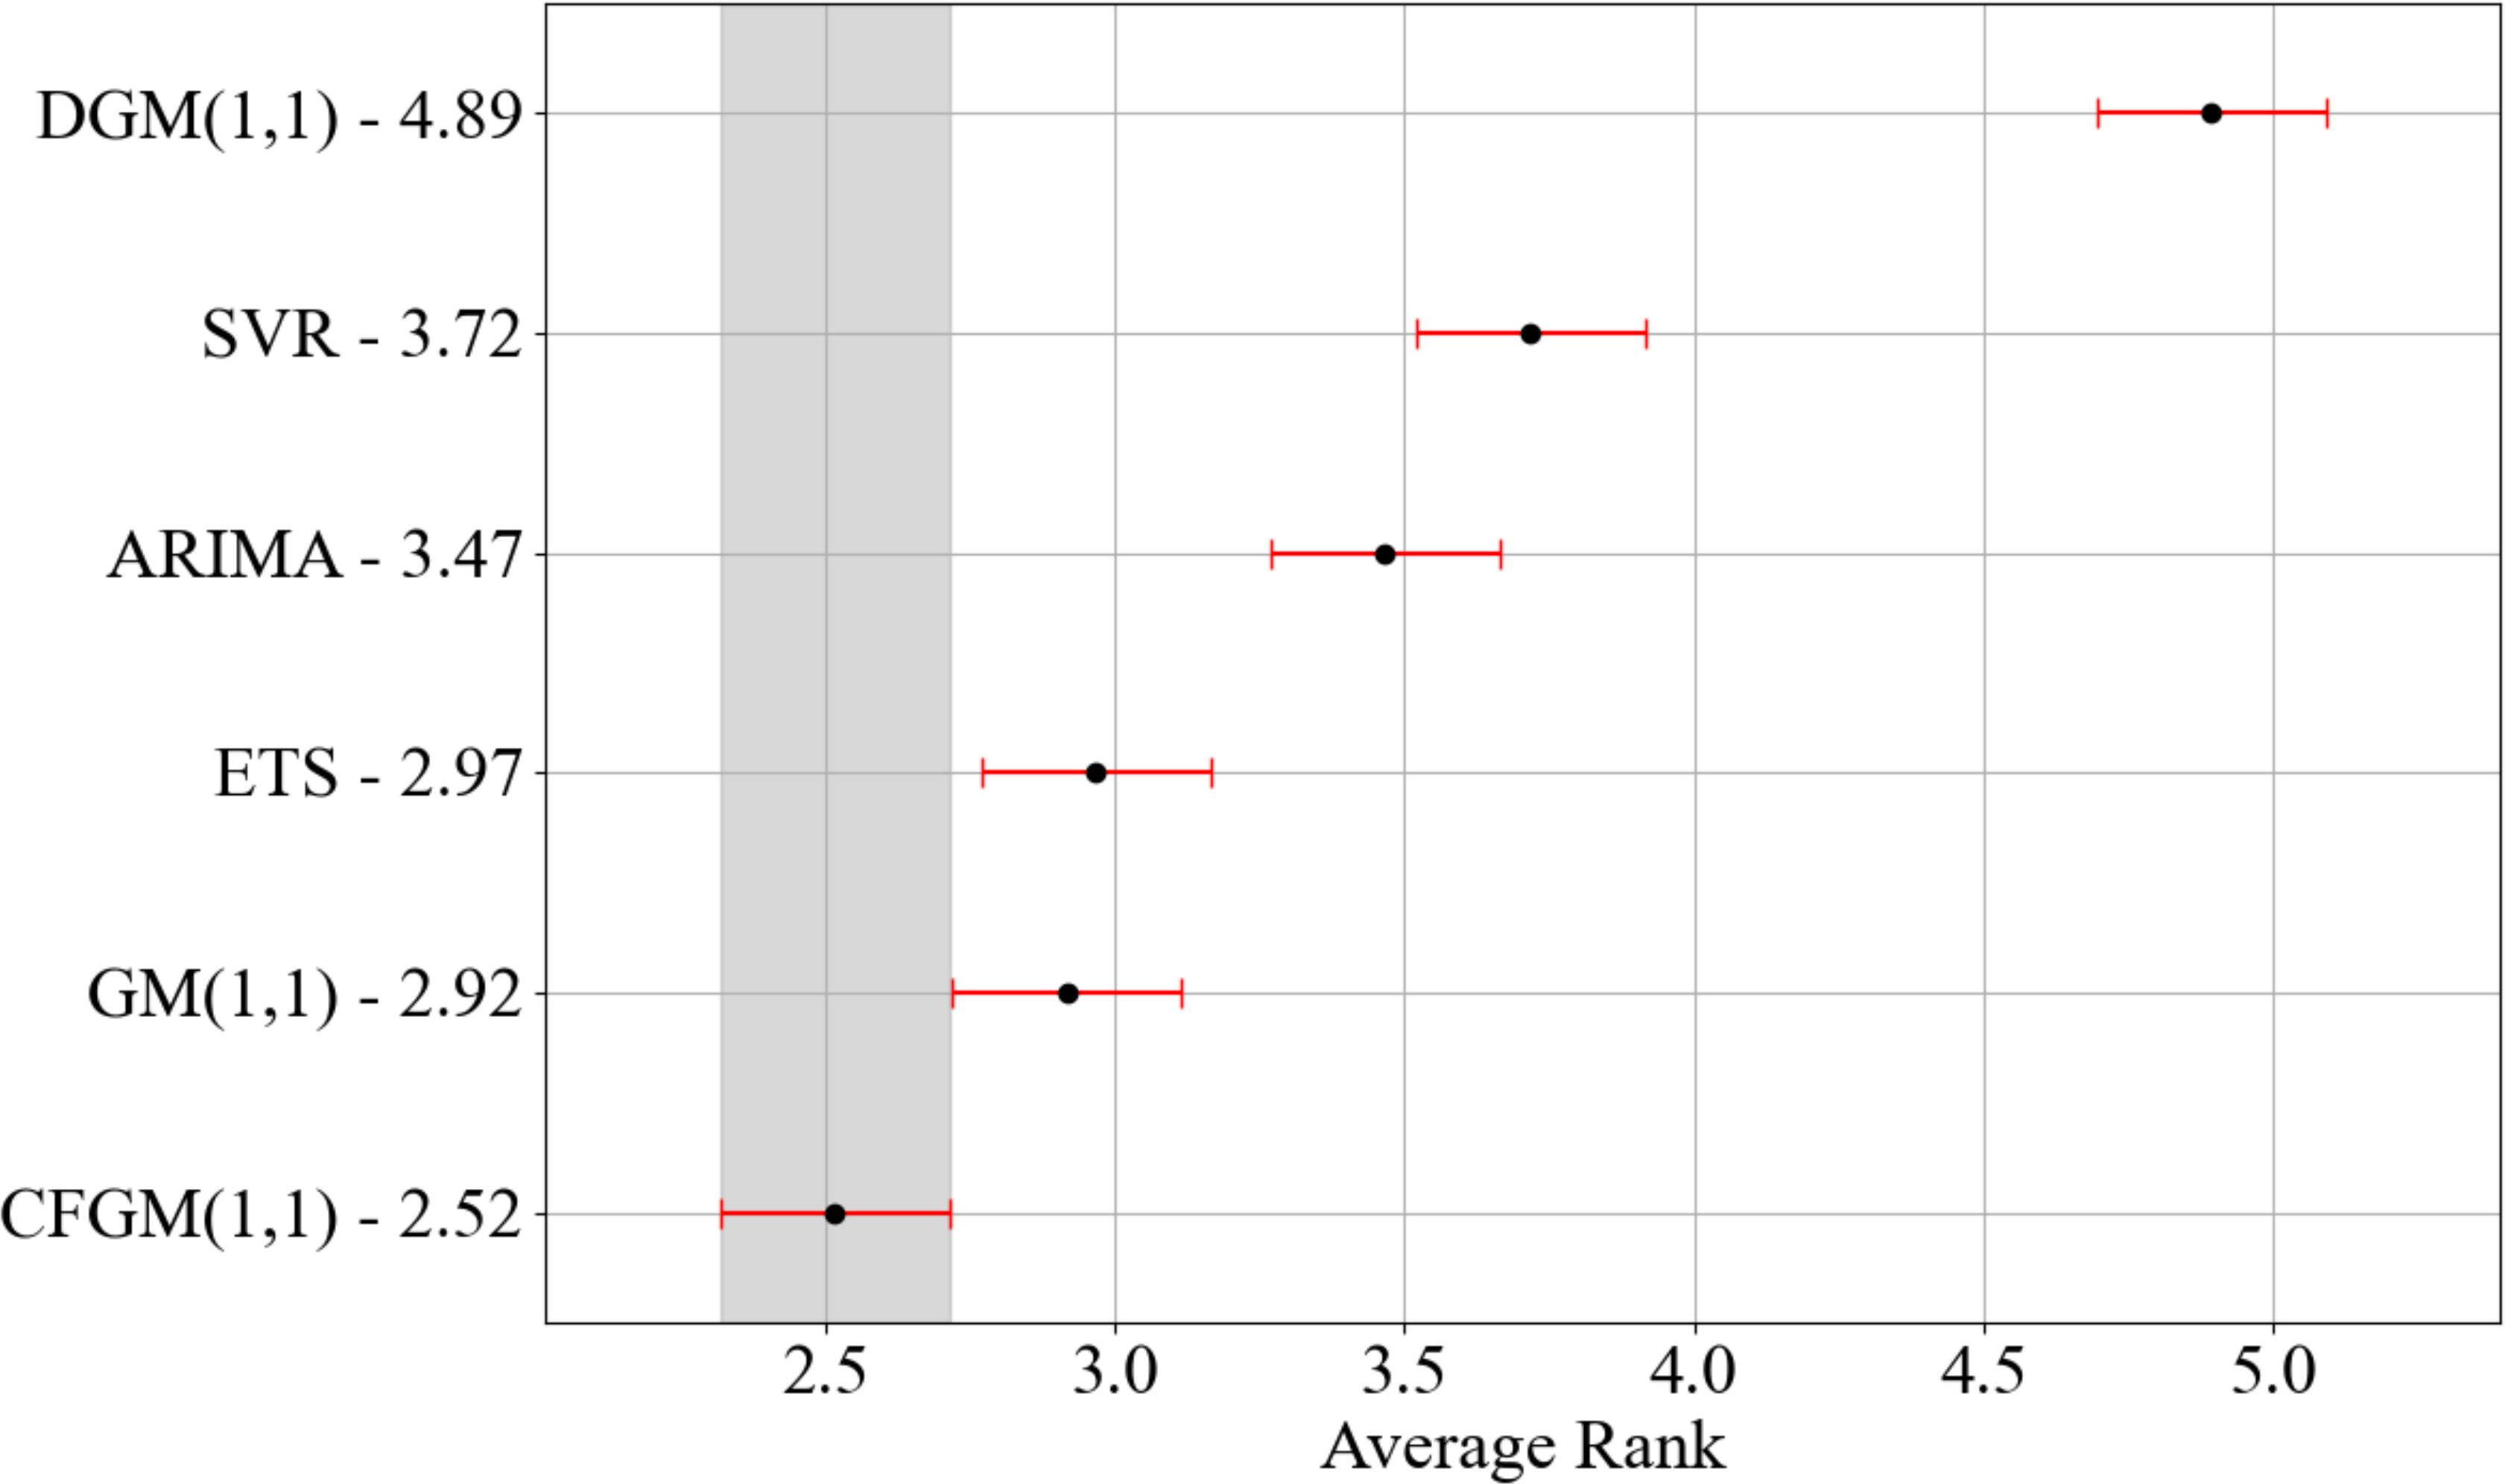
Figure 6. Statistical significance at the 5% level: MCB test for CFGM and benchmark models for multi-step forecasts across the added value time series of all industries.
Furthermore, from the perspective of overlapping confidence intervals, GM (the average rank: 2.92) has a confidence interval that overlaps with CFGM, but it still ranks slightly lower. Consequently, this phenomenon suggests that GM exhibits less stability and reliability in predictive accuracy, as evidenced by its lower ranking than the CFGM model.
In conclusion, the results of the MCB test demonstrate that CFGM consistently achieves superior performance compared to competing models across multiple industries and forecasting horizons. These findings, combined with insights from the PDA and MCB tests, verify the reliability and applicability of CFGM in addressing heterogeneous and complex marine industrial added value time series. Moreover, by demonstrating both precision and stability tests, CFGM proves to be a reliable tool for future predictions, offering valuable insights for decision-making and strategic planning in diverse marine industry scenarios.
To explore the future economic trends of five major marine industries, the CFGM model is employed to predict their added values of the marine economy for the period 2024–2026, based on fitted values from 2012–2023. The results, as presented in Figure 7 and Table 5, reveal industry-specific variations in both added values and growth rates, providing a robust scientific basis for future policy formulation.
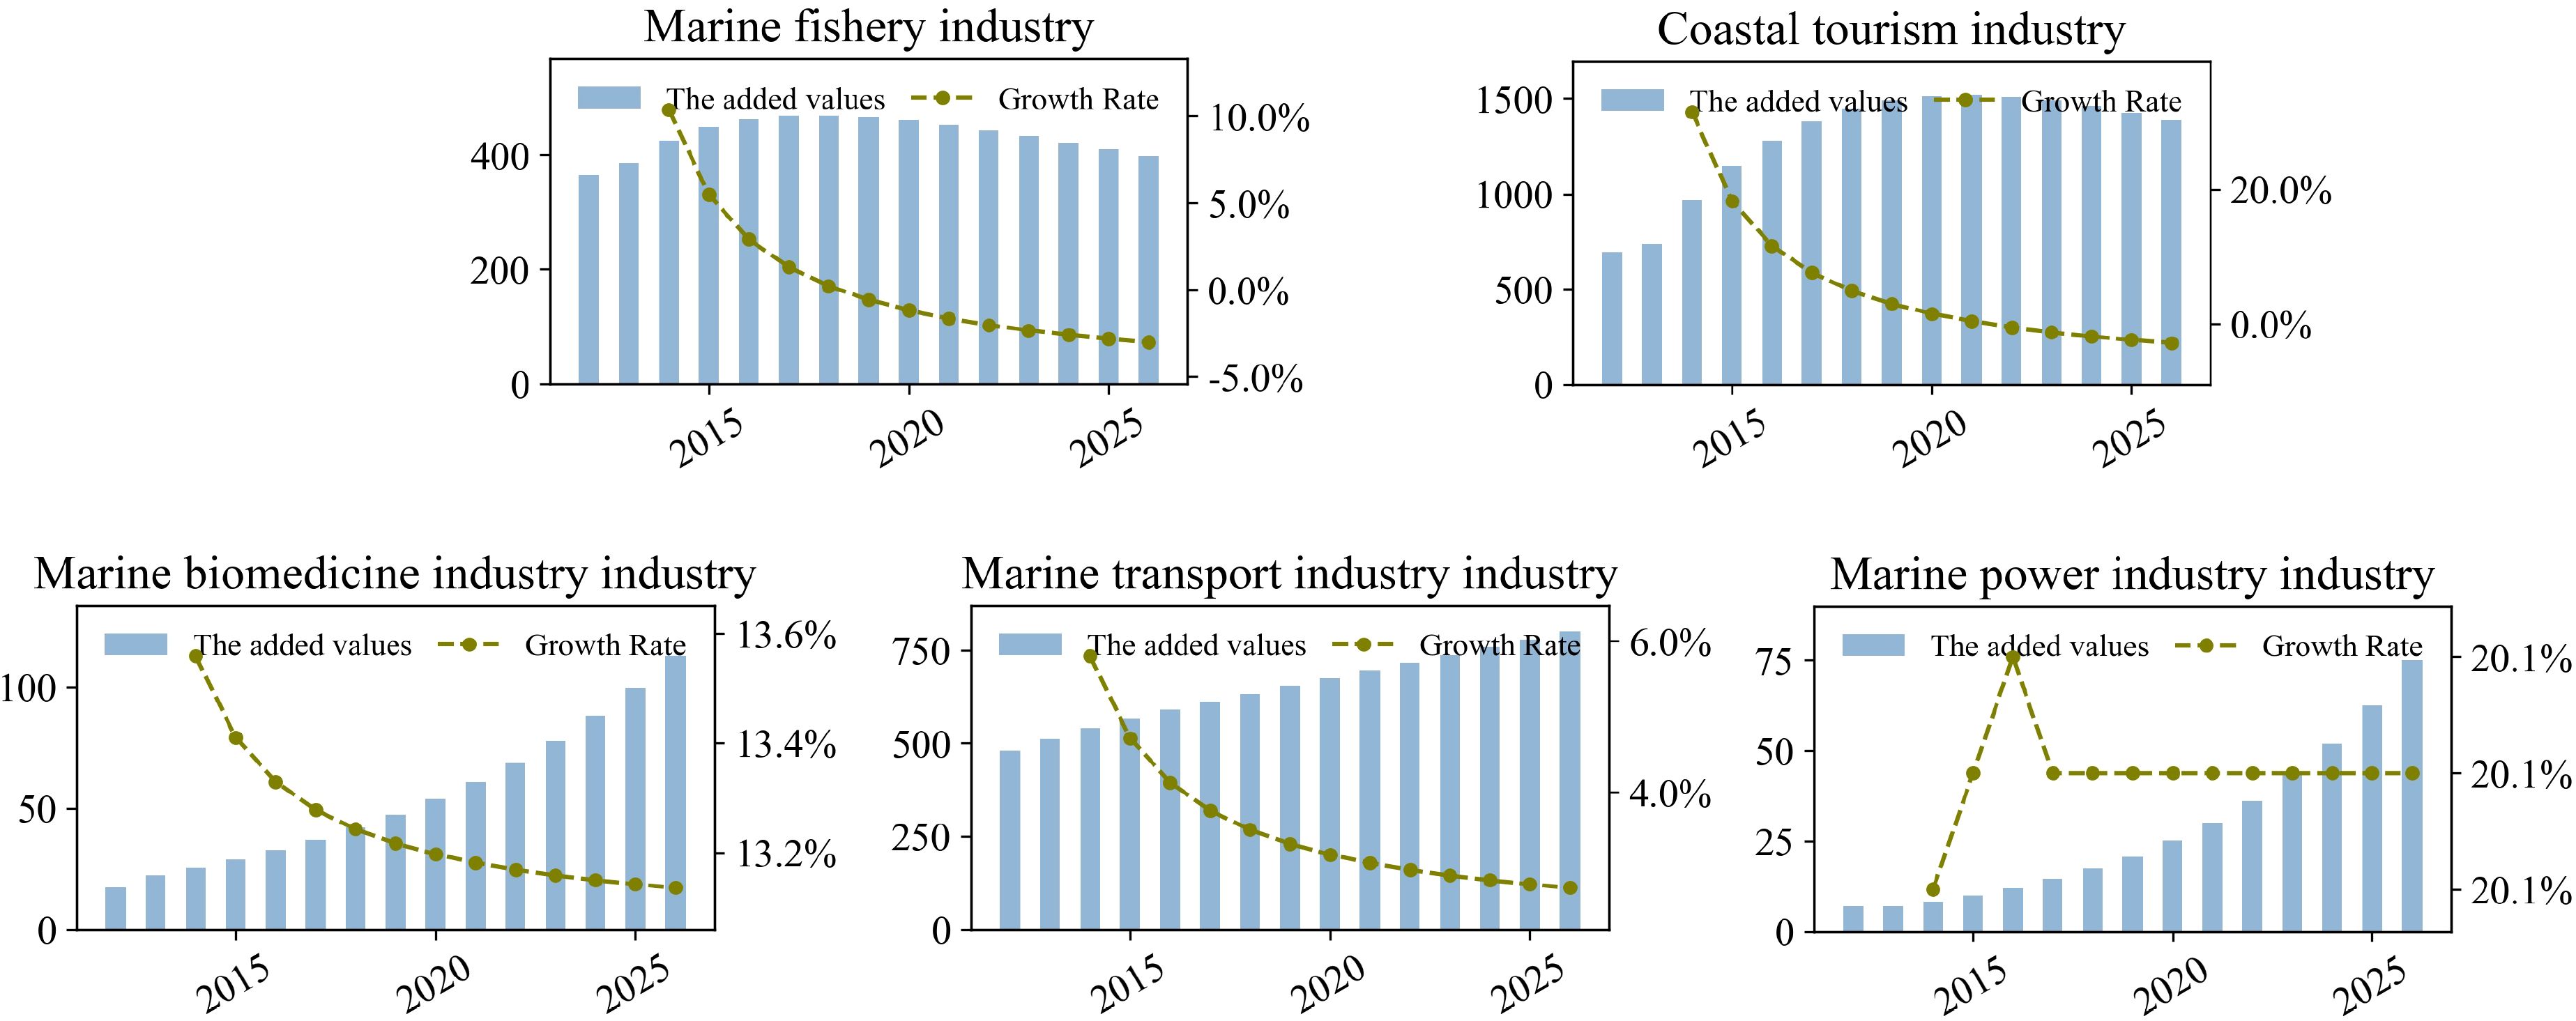
Figure 7. Future five industrial added value predictions from 2012 to 2026. The Y-axis data for each subgraph represents the added values (billion yuan) while the X-axis data represents the years.
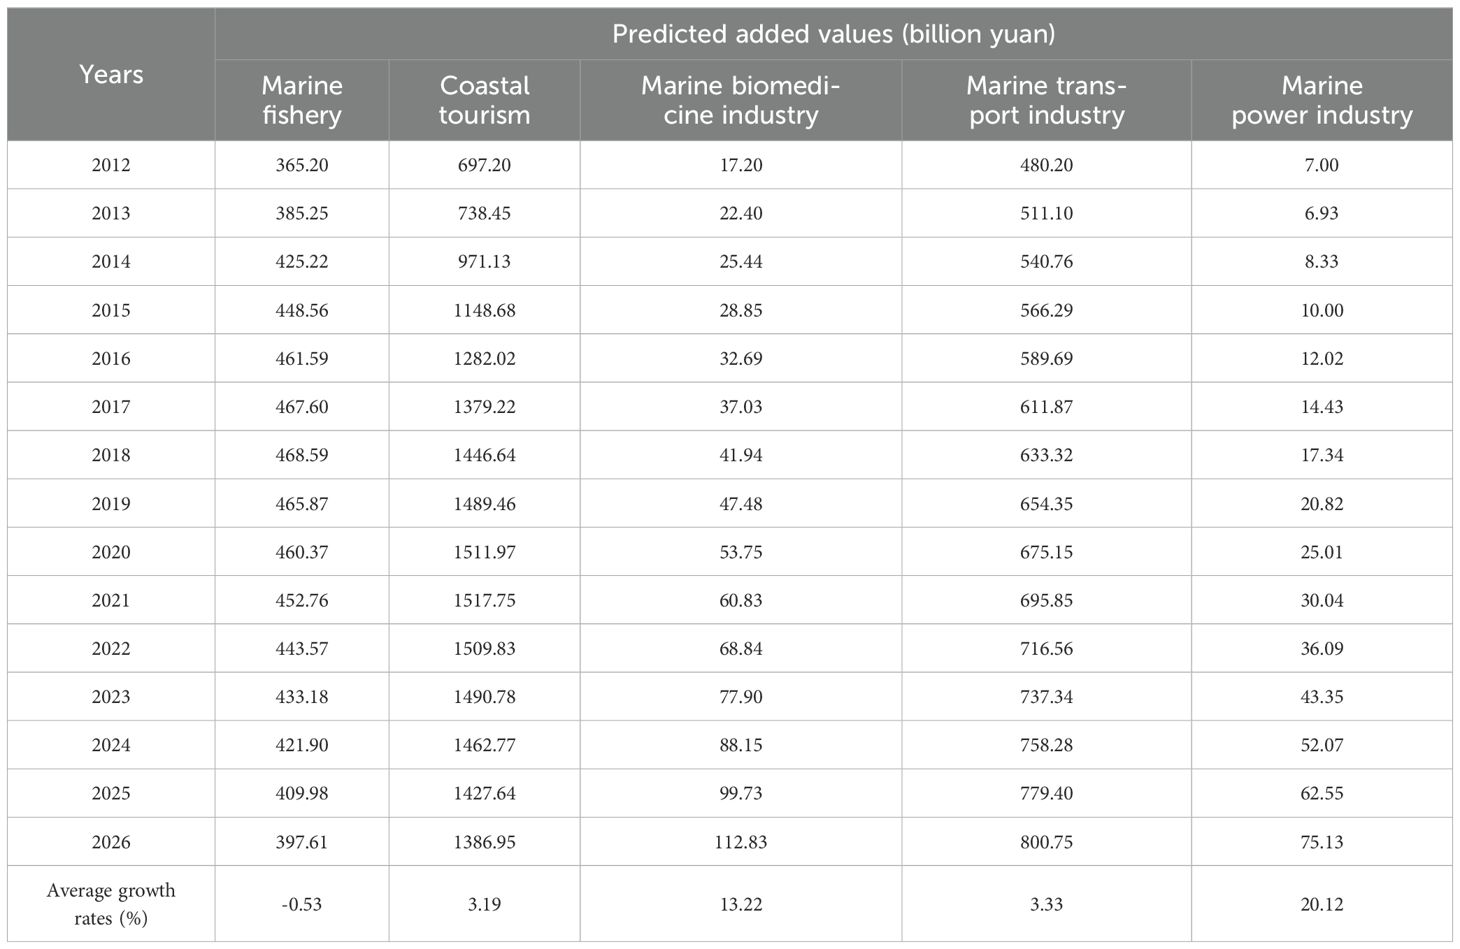
Table 5. The predicted values and their average growth rate for five industrial added value time series.
The marine fishery industry: this sector shows a consistent decline in added value, dropping from 433.18 billion yuan in 2023 to 397.61 billion yuan in 2026. Besides, the average growth rate remains negative at -0.53% (shown in Column (1) of Table 5), reflecting the contraction of the added values in this sector. This decline may result from overexploitation of resources and stricter environmental regulations, which limit the availability of fish stocks and impose constraints on production capacity, ultimately reducing growth potential (Bahamon et al., 2024; Firpo et al., 2023).
The coastal tourism industry: this sector exhibits steady growth in added value, rising from 1490.78 billion yuan in 2023 to 1386.95 billion yuan in 2026. Besides, the average growth rate is positive at 3.19% (shown in Column (2) of Table 5), indicating moderate expansion. Although the added value in the next three years has declined slightly, the industry can still maintain the trend of growth for a long time from the perspective of growth rate, which reflects the strong resilience of the industry (Liu, 2023; Cramer et al., 2023).
The marine biomedicine industry: this sector demonstrates rapid growth, with added value increasing from 77.90 billion yuan in 2023 to 112.83 billion yuan in 2026. Moreover, the average growth rate reaches an impressive 13.22% (shown in Column (3) of Table 5), making it the fastest-growing industry among the five. The high growth rate may be driven by advancements in biotechnology and increasing demand for marine-based pharmaceuticals (Al-Belushi et al., 2015). However, the slight decline in growth rates over time reflects challenges such as market competition and high research and development costs (Miller and Virmani, 2023).
The marine transport industry: this industry experiences steady growth, with added value rising from 737.34 billion yuan in 2023 to 800.75 billion yuan in 2026. Additionally, the average growth rate remains stable at 3.33% (shown in Column (4) of Table 5), reflecting consistent demand for transportation services. This stability is likely due to the reliance on international trade and well-established logistics networks (Liu et al., 2022), though external factors like fluctuating global trade volumes and fuel prices may influence future trends.
The marine power industry: this sector shows the most dynamic growth, with added value soaring from 43.35 billion yuan in 2023 to 75.13 billion yuan in 2026. Furthermore, the average growth rate is exceptionally high at 20.12% (shown in Column (5) of Table 5), indicating substantial expansion potential. This rapid growth is driven by investments in renewable energy technologies (Sinfield et al., 2024), such as offshore wind and tidal energy.
In summary, these predictions provide valuable insights into the economic dynamics of the marine industries, showcasing distinct sectoral characteristics. Specifically, the coastal tourism industry is projected to maintain the largest added value of production, reflecting its foundational role in the marine economy. Similarly, the marine power industry stands out with the fastest average growth rate, highlighting its importance and rapid expansion driven by advancements in renewable energy technologies. Besides, the marine biomedicine industry also demonstrates substantial growth potential, underscoring its emergence as a key innovation-driven sector. In contrast, the marine fishery industry faces negative growth, reflecting challenges such as resource overexploitation and regulatory pressures. Meanwhile, the marine transport industry exhibits steady and stable growth, reinforcing its essential role in supporting global trade. These diverse trends emphasize the need for differentiated policy measures to ensure sustainable and balanced development across the marine economy.
Numerous explanations can be provided to interpret the predicted sectoral variations in marine economic growth, including technological advancements, resource utilization patterns, and environmental constraints. Based on these findings, the following policy recommendations are proposed to promote sustainable and balanced development across the marine economy:
Promoting the rapid development of strategic marine technologies. To capitalize on the growth potential of the marine power industry and marine biomedicine industry, targeted policies should prioritize increased funding for research and development and the establishment of tax incentives for innovation-driven companies (Araújo et al., 2021). Additionally, fostering international cooperation in renewable energy and biotechnology could accelerate technological breakthroughs and facilitate market expansion (Fang et al., 2024), ensuring these sectors sustain their high growth rates and drive the marine economy forward.
Strengthening resource management for marine industries. Given the declining trend in the marine fishery industry, stricter resource management policies are essential (Chai et al., 2024). Measures such as implementing scientific fishing quotas, expanding marine protected areas, and supporting sustainable aquaculture practices can mitigate overexploitation and environmental degradation (Alves, 2021). Furthermore, diversification of economic activities within traditional fishing communities may help offset the economic losses caused by reduced fishery outputs.
Optimizing industrial structure and promoting balanced growth. For industries with stable or moderate growth, such as the coastal tourism industry and marine transport industry, policies should focus on enhancing infrastructure and driving green transitions (Song and Dong, 2024). For coastal tourism, this includes developing eco-friendly tourism practices, improving coastal resilience to climate change, and upgrading visitor facilities to attract higher-value tourism. For marine transport, investments in clean-energy vessels and digitalized port operations are necessary to align growth with sustainability objectives while maintaining global competitiveness (D’Amato and Korhonen, 2021).
This paper sheds light on the development of the marine economy by forecasting the added value in key sectors, including marine fishery, coastal tourism, marine biomedicine, marine transport, and marine power industries. Our findings underscore the augmented accuracy achieved by the CFGM model over conventional approaches, providing practical implications for enhancing marine economic forecasts.
Specifically, the added value time series of production for marine industries often exhibits mall-sample, heterogeneous, and non-stationarity, making traditional forecasting methods inadequate for accurate predictions. In this context, the CFGM model was developed to address these challenges, by incorporating conformable fractional accumulation and traditional grey forecasting models. The model enhances data smoothing and improves predictive accuracy, making it particularly well-suited for forecasting the diverse added value of marine industries.
In empirical analysis, to validate the accuracy and robustness of the CFGM model, we performed both accuracy tests and robustness checks. On the one hand, in the accuracy tests, three types of models are compared, including the statistical (ARIMA and ETS), machine learning (SVR and BPNN), and grey forecasting (GM and DGM) models. In terms of the MAPE, RMSE, and IR indicators, the competitive results showed that the CFGM model consistently defeated its competitors because of its lowest MAPE and RMSE, with values of 7.08% and 405.53 in the out-of-sample period, respectively. Moreover, these predictions fluctuated within the smallest range, as those above forecast errors of CFGM had the lowest mean, variance, and range of maximum and minimum values. Additionally, the IR for CFGM showed a significant improvement, with an average 32.14% increase in predictive ability than the other models, further highlighting its superior predictive accuracy. On the other hand, for robustness, the PDA and MCB results further confirm the robustness and superior performance of the CFGM model across multiple industries.
Over the next three years, the future projections derived from the CFGM model offer valuable insights into Chinese marine industries from 2024 to 2026. In detail, the added value of production in the marine power industry is expected to grow significantly, with an annual growth rate of 20.12%. Meanwhile, the corresponding data in the marine biomedicine sector is projected to increase by 13.22% annually. In contrast, the added value of production in the marine fishery industry is forecast to decline from 421.90 billion yuan in 2024 to 397.61 billion yuan by 2026, due to overfishing and regulations. Similarly, the coastal tourism industry will decrease slightly, from 1462.77 billion yuan to 1386.95 billion yuan. Besides, the marine transport sector is expected to have a rise from 737.34 billion yuan to 800.75 billion yuan, supported by global trade. Most importantly, the projected values across different industries show significant disparities, such as high growth rates and large values. Based on these data characteristics, this paper offers differentiated policy recommendations tailored to each industrial unique trend.
In the future, there are several promising directions for further research in the field of marine economy forecasting. For example, more advanced data preprocessing techniques could be incorporated to address potential outliers and abrupt changes in marine economic data series, which may arise from factors such as extreme weather events or significant policy shifts. Additionally, efforts could focus on enhancing the CFGM model’s capability to handle multivariate relationships within the marine economy, which is influenced by various factors such as oceanographic conditions, technological advancements, and global economic trends. Furthermore, given the global nature of the marine economy, applying the CFGM model to investigate international marine economic trends and comparisons would be highly valuable. Overall, the field of marine economy forecasting holds significant potential for further theoretical and practical contributions.
The original contributions presented in the study are included in the article/supplementary material. Further inquiries can be directed to the corresponding author.
YC: Writing – original draft, Writing – review & editing. HZ: Writing – original draft, Writing – review & editing. LP: Writing – original draft, Writing – review & editing.
The author(s) declare that financial support was received for the research, authorship, and/or publication of this article. This work is funded by the National Social Science Fund of China (23BTJ021); The PRTP project of ZUFE; Zhejiang university students science and technology innovation activity plan (New Talent Program).
The authors declare that the research was conducted in the absence of any commercial or financial relationships that could be construed as a potential conflict of interest.
The author(s) declare that no Generative AI was used in the creation of this manuscript.
All claims expressed in this article are solely those of the authors and do not necessarily represent those of their affiliated organizations, or those of the publisher, the editors and the reviewers. Any product that may be evaluated in this article, or claim that may be made by its manufacturer, is not guaranteed or endorsed by the publisher.
Al-Belushi K. I. A., Stead S. M., Burgess J. G. (2015). The development of marine biotechnology in Oman: Potential for capacity building through open innovation. Mar. Policy 57, 147–157. doi: 10.1016/j.marpol.2015.03.001
Alves C. (2021). Marine resource management and fisheries governance in Belize exhibit a polycentric, decentralized, and nested institutional structure. Ocean Coast. Manage. 211, 105742. doi: 10.1016/j.ocecoaman.2021.105742
Araújo R., Vázquez Calderón F., Sánchez López J., Azevedo I. C., Bruhn A., Fluch S., et al. (2021). Current status of the algae production industry in Europe: an emerging sector of the blue bioeconomy. Front. Mar. Sci. 7. doi: 10.3389/fmars.2020.626389
Bahamon N., Recasens L., Sala-Coromina J., Calero B., Garcia J. A., Rotllant G., et al. (2024). Selectivity-based management for reversing overexploitation of demersal fisheries in North-western Mediterranean Sea. Mar. Policy 165, 106185. doi: 10.1016/j.marpol.2024.106185
Bilgil H. (2021). New grey forecasting model with its application and computer code. AIMS Math. 6, 1497–1514. doi: 10.3934/math.2021091
Chai Y., Wei J., Wang J., Guo W., Yu Y., Zhang X. (2024). Research on carbon sink prices in China’s marine fisheries: An analysis based on transcendental logarithmic production function model from 1979 to 2022. Front. Mar. Sci. 11. doi: 10.3389/fmars.2024.1429631
Cramer L. A., Beaullieu J., Doyle J., Maldonado M., Egna H., Johnson M., et al. (2023). The importance of the seafood processing sector to coastal community resilience. Mar. Policy 156, 105797. doi: 10.1016/j.marpol.2023.105797
D’Amato D., Korhonen J. (2021). Integrating the green economy, circular economy and bioeconomy in a strategic sustainability framework. Ecol. Econ. 188, 107143. doi: 10.1016/j.ecolecon.2021.107143
Ding S., Shen X., Zhang H., Cai Z., Wang Y. (2024a). An innovative data-feature-driven approach for CO2 emission predictive analytics: A perspective from seasonality and nonlinearity characteristics. Comput. Ind. Eng. 192, 110195. doi: 10.1016/j.cie.2024.110195
Ding S., Ye J., Cai Z. (2024b). Multi-step carbon emissions forecasting using an interpretable framework of new data preprocessing techniques and improved grey multivariable convolution model. Technol. Forecast. Soc. Change 208, 123720. doi: 10.1016/j.techfore.2024.123720
Ding S., Zhang H. (2023). Forecasting Chinese provincial CO2 emissions: A universal and robust new-information-based grey model. Energy Econ. 121, 106685. doi: 10.1016/j.eneco.2023.106685
Dun M., Xu Z., Wu L., Chen Y. (2022). The information priority of conformable fractional grey model. J. Comput. Appl. Math. 415, 114460. doi: 10.1016/j.cam.2022.114460
Egger C., Plutzar C., Mayer A., Dullinger I., Dullinger S., Essl F., et al. (2022). Using the SECLAND model to project future land-use until 2050 under climate and socioeconomic change in the LTSER region Eisenwurzen (Austria). Ecol. Econ. 201, 107559. doi: 10.1016/j.ecolecon.2022.107559
Erdinç Ü., Bilgil H. (2024). Analyzing coal consumption in China: forecasting with the ecfgm(1, 1) model and a perspective on the future. Turkish J. Forecast. 8, 45–53. doi: 10.34110/forecasting.1458131
Fang X., Zhang Y., Yang J., Zhan G. (2024). An evaluation of marine economy sustainable development and the ramifications of digital technologies in China coastal regions. Econ. Anal. Policy 82, 554–570. doi: 10.1016/j.eap.2024.03.022
Firpo C., Militelli M. I., Chaparro M. A. E., Mauna C., Lértora P. (2023). Clutch fullness index as an early indicator of overexploitation of the Southern King Crab: Implications for fisheries management. Ocean Coast. Manage. 243, 106762. doi: 10.1016/j.ocecoaman.2023.106762
Huang R., Zhang X., Dong S., Huang L., Liao H., Li Y. (2024). A refined grey Verhulst model for accurate degradation prognostication of PEM fuel cells based on inverse hyperbolic sine function transformation. Renewable Energy 237, 121770. doi: 10.1016/j.renene.2024.121770
Hynes S., Cawley M., Deely J., Norton D. (2024). Alternative approaches to measuring the value of tourism in marine and coastal areas in ocean economy accounting. Mar. Policy 168, 106299. doi: 10.1016/j.marpol.2024.106299
Ji J., Chi Y., Yin X. (2024). Research on the driving effect of marine economy on the high-quality development of regional economy – Evidence from China’s coastal areas. Reg. Stud. Mar. Sci. 74, 103550. doi: 10.1016/j.rsma.2024.103550
Li X., Cao Y., Wang J., Dang Y., Kedong Y. (2019). A summary of grey forecasting and relational models and its applications in marine economics and management. Mar. Econ. Manage. 2, 87–113. doi: 10.1108/MAEM-04-2019-0002
Li J., Cui C., Xiao Z., Wang B., Xu C. (2024). Reliability and sensitivity analyses of monopile supported offshore wind turbines based on probability density evolution method with pre-screening of controlling parameters. Ocean Eng. 310, 118746. doi: 10.1016/j.oceaneng.2024.118746
Li X., Zhou S., Zhao Y. (2023b). Onshore and offshore wind power generation forecasting using a novel flexible time-varying fractional nonlinear grey model. Energy Convers. Manage. 297, 117695. doi: 10.1016/j.enconman.2023.117695
Li X., Zhou S., Zhao Y., Wan G. (2024). A CRITIC-TOPSIS and optimized nonlinear grey prediction model: A comparative convergence analysis of marine economic resilience. Expert Syst. Appl. 236, 121356. doi: 10.1016/j.eswa.2023.121356
Li X., Zhou S., Zhao Y., Yang B. (2023a). Marine and land economy–energy–environment systems forecasting by novel structural-adaptive fractional time-delay nonlinear systematic grey model. Eng. Appl. Artif. Intell. 126, 106777. doi: 10.1016/j.engappai.2023.106777
Lian Z. (2024). Sustainable synergistic development of marine economic degree growth and marine art industry. J. Sea Res. 198, 102474. doi: 10.1016/j.seares.2024.102474
Liu X. (2023). Tourism development, environmental regulations, and natural resource management: Evidence from G20 countries. Resour. Policy 86, 104224. doi: 10.1016/j.resourpol.2023.104224
Liu F., Huang Y., Zhang L., Li G. (2022). Marine environmental pollution, aquatic products trade and marine fishery Economy——An empirical analysis based on simultaneous equation model. Ocean Coast. Manage. 222, 106096. doi: 10.1016/j.ocecoaman.2022.106096
Ma X., Jiang P., Jiang Q. (2020a). Research and application of association rule algorithm and an optimized grey model in carbon emissions forecasting. Technol. Forecast. Soc. Change 158, 120159. doi: 10.1016/j.techfore.2020.120159
Ma X., Wu W., Zeng B., Wang Y., Wu X. (2020b). The conformable fractional grey system model. ISA Trans. 96, 255–271. doi: 10.1016/j.isatra.2019.07.009
Miller A., Virmani J. I. (2023). Advanced marine technologies for ocean research. Deep Sea Res. Part II: Topical Stud. Oceanogr. 212, 105340. doi: 10.1016/j.dsr2.2023.105340
Öztürk Z., Bilgil H., Erdinç Ü. (2022). An optimized continuous fractional grey model for forecasting of the time dependent real world cases. Hacettepe J. Math. Stat 51, 308–326. doi: 10.15672/hujms.939543
Portillo Juan N., Negro Valdecantos V. (2024). A novel model for the study of future maritime climate using artificial neural networks and Monte Carlo simulations under the context of climate change. Ocean Model. 190, 102384. doi: 10.1016/j.ocemod.2024.102384
QYResearch (2024). Marine Economy Report 2024, Global Revenue, Key Companies Market Share & Rank. Available online at: https://www.qyresearch.com.cn/reports/3260589/marine-economy (Accessed November 01, 2024).
Shan X., Cao Y. (2022). Forecasting Guangdong’s marine science and technology, marine economy, and employed persons by coastal regions—Based on rolling grey MGM(1,m) model. Water 14, 824. doi: 10.3390/w14050824
Sinfield J. V., Ajmani A., McShane W. (2024). Strategic roadmapping to accelerate and risk-mitigate enabling innovations: A generalizable method and a case illustration for marine renewable energy. Technol. Forecast. Soc. Change 209, 123761. doi: 10.1016/j.techfore.2024.123761
Song Y., Dong J. (2024). Impact of climate policy uncertainty on corporate green investment: Examining the moderating role of financing constraints. Front. Mar. Sci. 11. doi: 10.3389/fmars.2024.1456079
Sun X., Yan D., Wu S., Chen Y., Qi J., Du Z. (2024). Enhanced forecasting of chlorophyll-a concentration in coastal waters through integration of Fourier analysis and Transformer networks. Water Res. 263, 122160. doi: 10.1016/j.watres.2024.122160
To W.-M., Lee P. K. C. (2018). China’s maritime economic development: A review, the future trend, and sustainability implications. Sustainability 10, 4844. doi: 10.3390/su10124844
Wang Z.-X., Jv Y.-Q. (2021). A non-linear systematic grey model for forecasting the industrial economy-energy-environment system. Technol. Forecast. Soc. Change 167, 120707. doi: 10.1016/j.techfore.2021.120707
Wang Z.-X., Li Q. (2019). Modelling the nonlinear relationship between CO2 emissions and economic growth using a PSO algorithm-based grey Verhulst model. J. Clean. Product. 207, 214–224. doi: 10.1016/j.jclepro.2018.10.010
Wang H., Li Y. (2024). A novel seasonal grey prediction model with fractional order accumulation for energy forecasting. Heliyon 10, e29960. doi: 10.1016/j.heliyon.2024.e29960
Wang Z.-X., Li D.-D., Zheng H.-H. (2020). Model comparison of GM(1,1) and DGM(1,1) based on Monte-Carlo simulation. Phys. A: Stat. Mech. Its Appl. 542, 123341. doi: 10.1016/j.physa.2019.123341
Wang J., Zhou Y., Zhuang L., Shi L., Zhang S. (2023). A model of maritime accidents prediction based on multi-factor time series analysis. J. Mar. Eng. Technol. 22, 153–165. doi: 10.1080/20464177.2023.2167269
Ye L., Xie N., Boylan J. E., Shang Z. (2024). Forecasting seasonal demand for retail: A Fourier time-varying grey model. Int. J. Forecast. 40, 1467–1485. doi: 10.1016/j.ijforecast.2023.12.006
Zhang R., Gao Q., Gao K. (2024). Impact of marine industrial agglomeration on the high-quality development of the marine economy——A case study of China’s coastal areas. Ecol. Indic. 158, 111410. doi: 10.1016/j.ecolind.2023.111410
Zhao X., Li H., Ding L., Liu M. (2019). Research and application of a hybrid system based on interpolation for forecasting direct economic losses of marine disasters. Int. J. Disaster Risk Reduct. 37, 101121. doi: 10.1016/j.ijdrr.2019.101121
Zhao X., Li H., Ding L., Wang W., Xue Y. (2020). Forecasting direct economic losses of marine disasters in China based on a novel combined model. Int. J. Disaster Risk Reduct. 51, 101921. doi: 10.1016/j.ijdrr.2020.101921
Keywords: grey forecasting model, marine economic prediction, marine sustainable development, marine industry strategic plan, policy analyses
Citation: Chen Y, Zhang H and Pei L (2025) The development trend of China’s marine economy: a predictive analysis based on industry level. Front. Mar. Sci. 12:1544612. doi: 10.3389/fmars.2025.1544612
Received: 13 December 2024; Accepted: 16 January 2025;
Published: 10 February 2025.
Edited by:
Junjie Wang, Nanjing University of Aeronautics and Astronautics, ChinaReviewed by:
Xin Ma, Southwest University of Science and Technology, ChinaCopyright © 2025 Chen, Zhang and Pei. This is an open-access article distributed under the terms of the Creative Commons Attribution License (CC BY). The use, distribution or reproduction in other forums is permitted, provided the original author(s) and the copyright owner(s) are credited and that the original publication in this journal is cited, in accordance with accepted academic practice. No use, distribution or reproduction is permitted which does not comply with these terms.
*Correspondence: Huahan Zhang, MjQwNDA3MDExMDA2QHp1ZmUuZWR1LmNu; Lingling Pei, bGluZ2xpbmdwZWlAenVmZS5lZHUuY24=
Disclaimer: All claims expressed in this article are solely those of the authors and do not necessarily represent those of their affiliated organizations, or those of the publisher, the editors and the reviewers. Any product that may be evaluated in this article or claim that may be made by its manufacturer is not guaranteed or endorsed by the publisher.
Research integrity at Frontiers
Learn more about the work of our research integrity team to safeguard the quality of each article we publish.