 Wen Li
 Jinqing Ye2*
 Hongjun Li
94% of researchers rate our articles as excellent or good
Learn more about the work of our research integrity team to safeguard the quality of each article we publish.
Find out more
ORIGINAL RESEARCH article
Front. Mar. Sci., 26 February 2025
Sec. Marine Pollution
Volume 12 - 2025 | https://doi.org/10.3389/fmars.2025.1542611
This article is part of the Research TopicFate and Effects of Sediment and Emerging Pollutants in Marine and Estuarine EnvironmentsView all 4 articles
Estuaries are increasingly threatened by pollutants derived from human activities, which severely impair their water quality, biodiversity, and ecological functions. Therefore, within this context, it is essential to conduct comprehensive and scientifically rigorous assessments of estuarine ecological quality. Taking the Yellow River estuary as a case study, a composite index was here developed to evaluate the impacts of eutrophication and heavy metal pollution on estuarine ecological quality. The Trix eutrophication index and potential ecological risk index revealed significant risks of eutrophication and heavy metal pollution. Redundancy analysis identified that nutrients (NO2-N and NO3-N) and heavy metals (Cd, Hg, and Cr) were the primary pollutants affecting the composition of dominant macrofauna. Threshold Indicator Taxa Analysis was used to identify indicator species for these pollutants and, based on them, bioindicators capable of reflecting eutrophication and heavy metal pollution levels were then determined. A composite index integrating these bioindicators with other biotic indexes was constructed for comprehensive ecological quality assessment. The results showed that the ecological quality of the estuary was good, with values being even lower in the nearshore area. Structural equation modeling confirmed that estuarine ecological quality was significantly influenced, both directly and indirectly, by multiple pollutants, validating the effectiveness of the composite index as an analytical tool. We argue that integrating bioindicators of major pollutants with other benthic indexes into the developed composite index allows to effectively assess the effects of multiple pollutants on estuarine ecological quality and provide valuable insights for ecosystem management.
Estuaries are areas where complex interactions between riverine and oceanic processes take place. These transition zones play a critical role in global biogeochemical cycling and are important for nutrient filtration and material deposition (Asmala et al., 2017; Carstensen et al., 2020). However, the activities of ports, shipping, and the discharge of industrial and agricultural pollutants from urban areas release nutrients, heavy metals, polycyclic aromatic hydrocarbons, and other exogenous compounds that may accumulate in sediments, thus affecting ecological quality (Liu et al., 2024; Sun et al., 2023). In particular, the accumulation of nutrients and heavy metals has been shown to severely damage the environmental quality, biodiversity, and ecosystem functions of estuaries and surrounding marine areas (Sun et al., 2015; Wang et al., 2021). Eutrophication, which is driven by nutrient enrichment, has been identified as a high-risk ecological process (Ménesguen and Lacroix, 2018). High concentrations of key nutrients such as nitrites, ammonia, and nitrogen compounds can severely impact the physiological functions of aquatic organisms, disrupting their growth and development (Kocour Kroupová et al., 2018). Additionally, excessive nutrient loading can trigger harmful algal blooms. When these algae die, their decomposition by seafloor bacteria consumes large amounts of oxygen, leading to hypoxia and the formation of an anoxic “dead zone”, which can cause the death of various marine organisms and disrupt ecosystems (Olisah et al., 2022). Heavy metal pollution also presents a major environmental issue globally. Due to their high toxicity, persistence, and non-degradable nature, heavy metals can harm marine organisms (Bryan and Langston, 1992). Furthermore, they can bioaccumulate and undergo biomagnification along the food web, resulting in higher concentrations in top predators, which poses risks to human health (Solis-Weiss et al., 2004).
Because of their high taxonomic diversity, limited mobility, relatively long lifespan, and broad sensitivity to environmental stressors (Liu et al., 2023), macrofaunal species are widely used as reliable indicators of the ecological quality of marine ecosystems. Given the varying sensitivities of benthic macrofauna to environmental stress, changes in community composition occur as the stress levels increase (Koperski, 2021; Wang et al., 2022a). In highly polluted environments, pollution-tolerant traits, such as sediment feeding and characteristics like small body size and high fecundity, tend to dominate as a response to disturbance (Van Der Linden et al., 2017). For instance, eutrophication can lead to a decline in the species richness of soft-bottom benthos, with species composition shifting toward small sensitive mollusks and annelids (Trannum et al., 2018). High levels of heavy metal contamination in sediments have significant negative effects on the growth of some benthic macrofauna (Horng et al., 2009; Rumisha et al., 2012; Trannum et al., 2004). Opportunistic species tolerant of fouling and adapted to high heavy metal concentrations become dominant, with a gradual shift in species composition toward subsurface sediment feeders, secondary opportunistic fauna, and tube-building species (Hu et al., 2019).
Given the sensitivity of benthic macrofauna to environmental pollution and its value for environmental assessment, more than 100 biotic indexes have been developed to date (Borja and Dauer, 2008). Most of these indexes have specific assessment focuses or are tailored to particular environmental conditions, and often exhibit the potential for over- or under-estimation under complex environmental circumstances (Wu et al., 2022). For example, AMBI and M-AMBI are two of the most widely used indices for benthic assessment (Anaisce et al., 2023), but many studies have shown that these indices are more suitable for areas with rich organic matter (Sivaraj et al., 2014). Consequently, researchers have suggested that it is not advisable to rely on a single biotic index in isolation to assess ecological quality. Instead, the integration of multiple biotic indexes offers a more comprehensive approach (Bevilacqua et al., 2011; Lu et al., 2021); although ecological quality assessments should not overlook the impact of specific environmental pollution. Integrated assessments that combine biotic indexes with relevant environmental pollution indexes are being increasingly used (Dong et al., 2023; Gao et al., 2024; Guerra-García et al., 2021). It is important to note, however, that there is a fundamental difference between the assessment reference standards for biotic indexes and those for environmental pollution indexes. In comparison, the integration of indicator species reflecting relevant pollution with other widely used biotic indexes offers an effective assessment of true ecological quality.
The sea area adjacent to the Yellow River estuary is impacted by pollution derived from several rivers, including excessive nutrient and heavy metal loads, as well as by other anthropogenic disturbances. As the most sediment-laden fluvial system, the Yellow River discharges approximately (1.71–3.12) × 105 tons of anthropogenic pollutants annually into its estuarine zone (Hu et al., 2023). The Flow-Sediment Regulation Project (FSRP) is a significant engineering initiative that affects the Yellow River estuary and adjacent sea areas. It aims to regulate reservoir water flow to scour riverbed sediments, thereby increasing the supply of freshwater and sediment to the estuary region. Since its implementation in 2002, the annual artificial flooding process has greatly altered the hydrological cycle of the lower Yellow River, resulting in the rapid influx of organic carbon, nutrients, and metal pollutants into the estuary, which then accumulate quickly in the estuary and surrounding sea areas (Chen et al., 2024). Given these threats, it is crucial to assess the ecological quality of this area and examine the effects of eutrophication and heavy metals on its ecosystem health. To this end, based on the macrofauna community composition, a framework was here developed for assessing the ecological quality of the sea area adjacent to the Yellow River estuary in response to eutrophication and heavy metal pollution. The objectives of this study were to: (1) characterize the extent and spatial distribution of eutrophication and heavy metal pollution in the coastal area, (2) identify indicator species across the gradient of nutrient and heavy metal concentrations, and (3) construct a composite index to assess the ecological quality of the estuary and explore the pathways through which it is influenced by nutrients and heavy metals.
The study area is located in the sea area adjacent to the Yellow River estuary in the southern Bohai Sea (37.31°N–37.51°N, 118.18°E–119.31°E). A total of 13 sites were selected for sampling between 2019 and 2022 (Figure 1). At each sampling site, four seawater samples were collected using Niskin bottles, and sediment samples were obtained using a 0.05-m² grab. The duplicate samples from each site were combined into a single sample, which was filtered in a 0.5mm sieve on board and fixed with 5% formaldehyde. Biological samples are transported to a laboratory for species identification and individual counting.
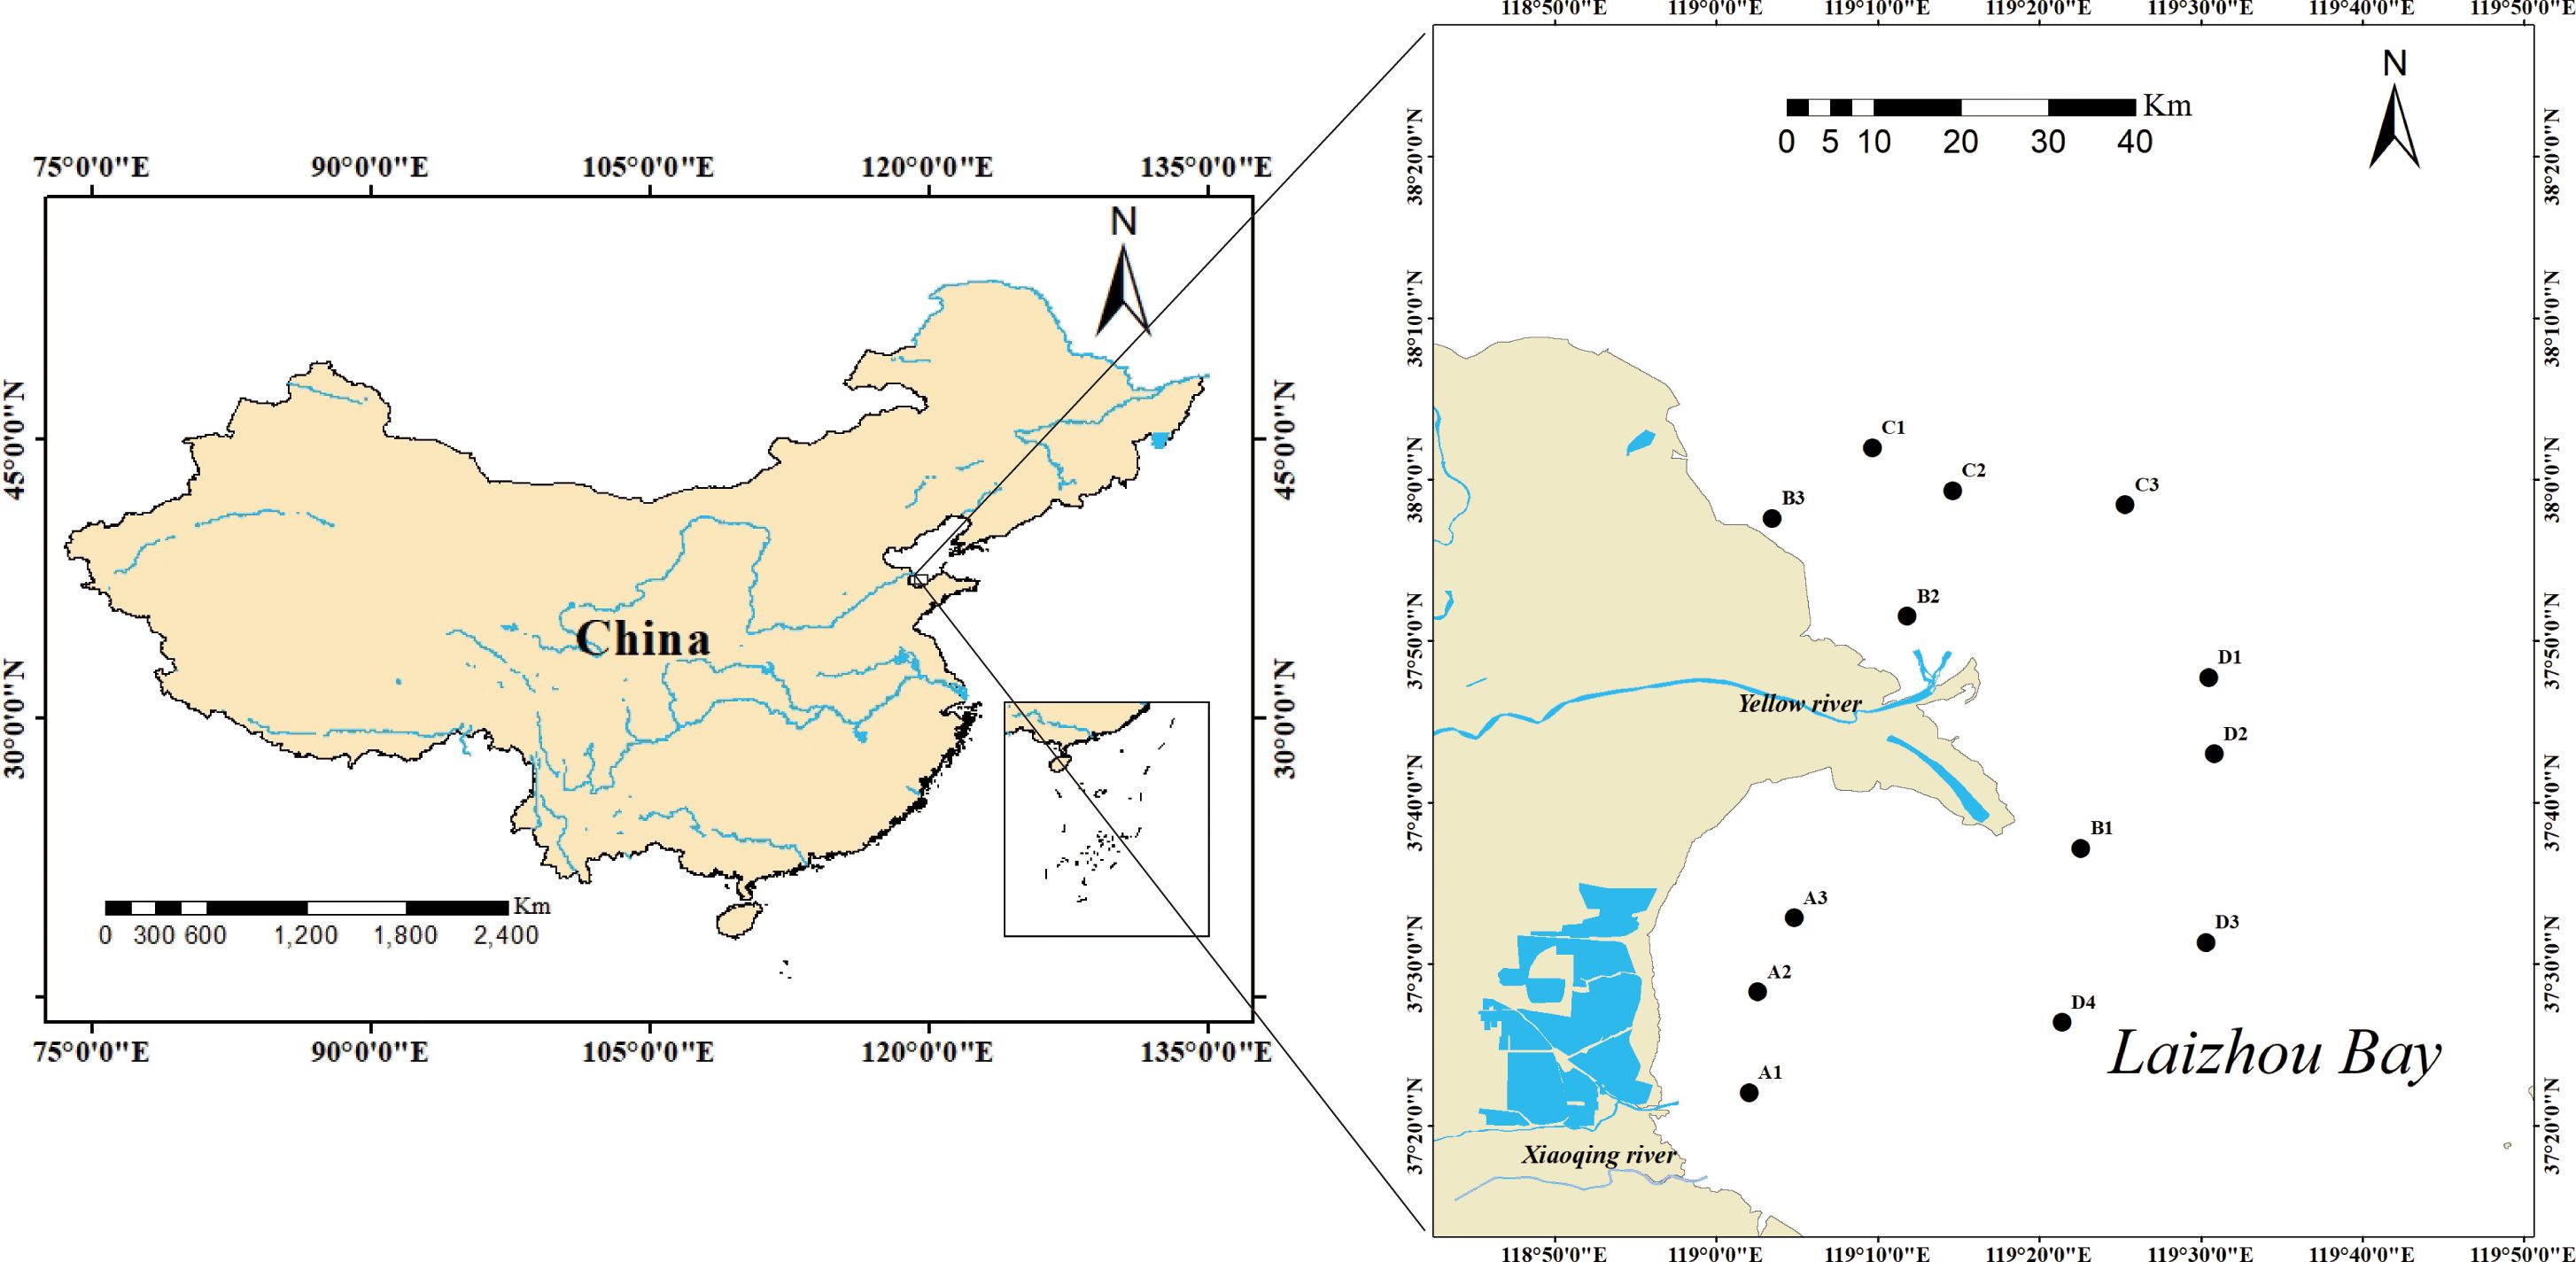
Figure 1. Map of the sea area adjacent to the Yellow River estuary examined in this study indicating the sampling points.
A total of 18 physiochemical variables in both seawater and sediment were measured for further analyses (Supplementary Table S1). The water chemistry parameters included dissolved oxygen (DO), pH, nitrite nitrogen (NO2-N), nitrate nitrogen (NO3-N), ammonia nitrogen (NH4-N), phosphate (PO4-P), and chlorophyll a (Chla), while the sediment variables included total organic carbon (TOC) and metal concentrations (Cu, Zn, Cr, Cd, and Hg). Other parameters included water depth, salinity (Sal), and sediment grain size (sand, silt, and clay).
(1) The degree of eutrophication was assessed using the Trix eutrophication index (Vollenweider et al., 1998). This index is applied in coastal areas and integrates multiple nutrient indicators, providing a comprehensive reflection of nutrient levels. The formula is as follows:
where the dissolved phosphorus (DIP), dissolved nitrogen (DIN), and chlorophyll a (Chla) concentrations are indicated in mgL-1, and aD%O2 is the absolute standard deviation of DO in the water body.
(2) Heavy metal pollution was assessed using the Potential Ecological Risk Index (RI) (Hakanson, 1980), which is constructed on the basis of heavy metal content and toxicity. This index includes the parameters Toxicity Response Factors () for heavy metals and Background Value References () for the study area (Wang et al., 2022b). The formula is as follows:
where is the toxicity response factor for metal i, indicating the level of toxicity and potential biological risk, is the measured concentration of metal i, and is the background value for heavy metals in the study area.
The Threshold Indicator Taxa Analysis (TITAN), which combines indicator species analysis with non-parametric mutation (Baker and King, 2010), was used to identify indicator species and determine response thresholds. This method is based on the principle of comparing the mutation points of water quality indicators across all species in a community. When multiple species respond similarly to a small range of concentration changes, this range is considered the response threshold for the community. A maximum indicator score (InVal) is calculated to determine the optimal mutation point for each species along an environmental gradient. Then, based on their relative abundance and frequency around the change point, species are categorized into two groups: negatively responding species and positively responding species (i.e., those whose populations decrease or increase as the environmental concentration gradient rises, respectively) (Dufrêne and Legendre, 1997). The reliability of indicator species is assessed by performing 500 bootstrap resamplings based on a sample of 250 observations, which allows to estimate the uncertainty, purity, and reliability of the change points for each group.
In this study, we selected a range of widely used indicators specifically designed for evaluating ecological quality in response to environmental pollution. These were: the Shannon–Wiener diversity index (H’), Simpson’s diversity index (D), Pielou’s evenness index (J), species richness (S), AZTI Marine Biotic Index (AMBI) (Borja et al., 2000), Multivariate AZTI Marine Biotic Index (M-AMBI) (Muxika et al., 2007), BENTIX (Simboura and Zenetos, 2002), N-(Nutrient), N-(Heavy metal), and N+(Heavy metal) (see Supplementary Tables S3 and S4 for details and results). The first four (H’, D, J, and S), which are the commonly used traditional diversity indices, serve as generalized representative indices for describing benthic community diversity, while AMBI, M-AMBI, and BENTIX were used as generalized representative indexes to study the response to environmental pollution or ecological stress. N-(Nutrient), N-(Heavy metal), and N+(Heavy metal) were designed as bioindicators to specifically reflect the levels of nutrient and heavy metal pollution. Indicator species for these pollutants were categorized, and the sum of their abundances was used as a bioindicator to assess environmental pollution. For example, N-(Nutrient)represented the sum of the abundances of negatively responding indicator species to major nutrients, with a higher species abundance indicating less eutrophic conditions. The correlations between indicators were analyzed to ensure each one represented unique information (Supplementary Table S5). Indicators with low correlation to others were retained, while those showing high correlations (r > 0.75) were combined into a single indicator. Finally, H’, S, AMBI, N-(Nutrient), N-(Heavy metal), and N+(Heavy metal) were selected as the core evaluation indicators (the screening process is summarized in Figure 2).
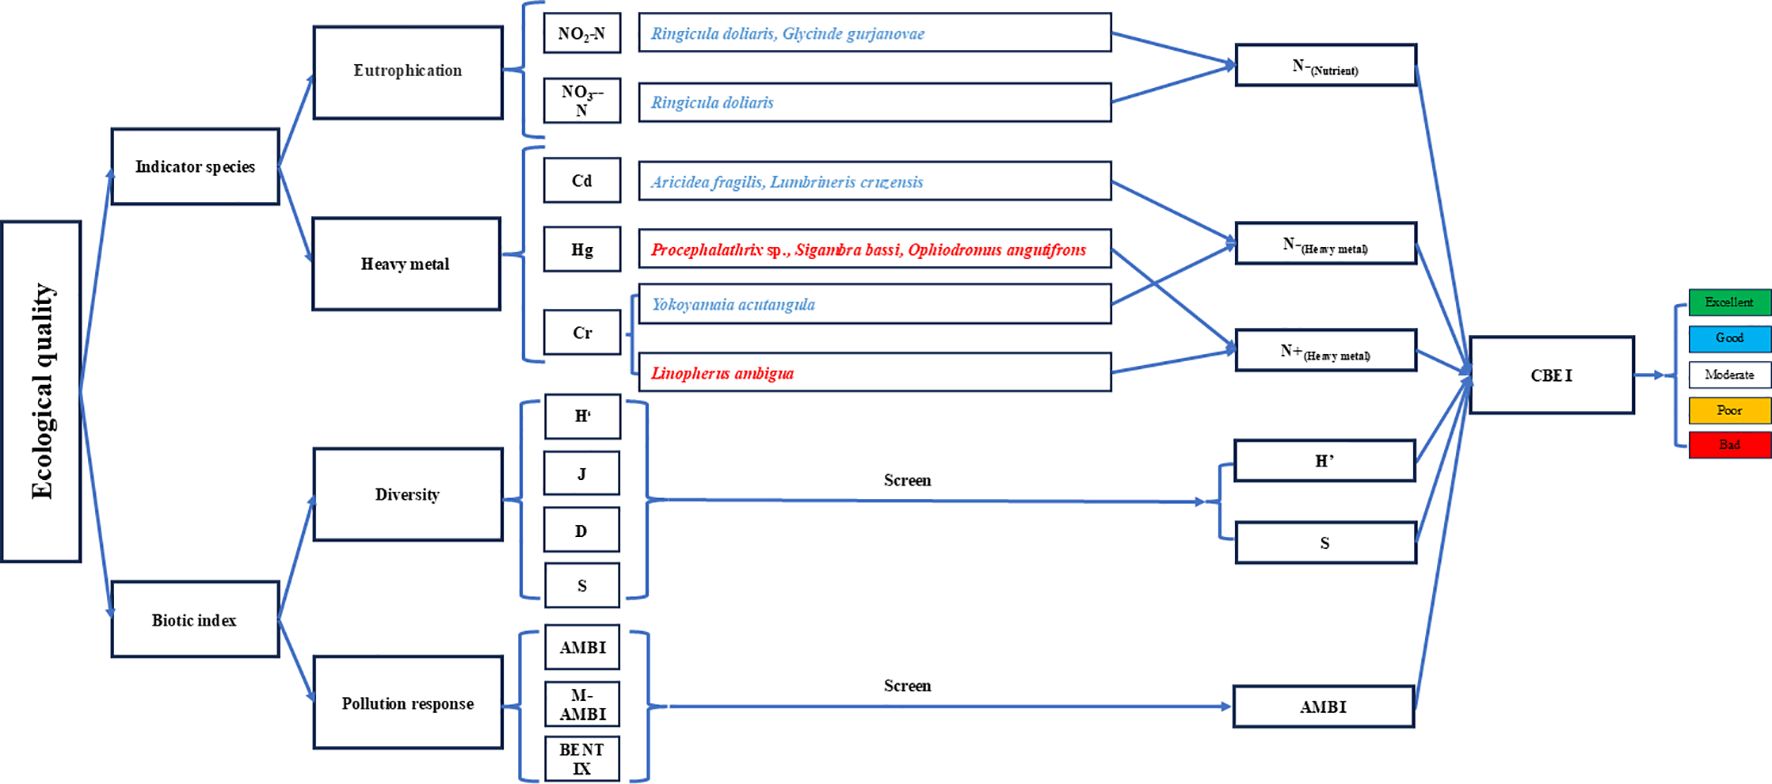
Figure 2. Conceptual flowchart describing the construction of the Composite Benthic Ecological Index (CBEI). The Latin names of positive indicator species are highlighted in red and the Latin names of negative indicator species are highlighted in blue.
The sites were ranked in ascending order based on the values of each core indicator using the ecological quality assessment value of the low-disturbance site at the 95th percentile and high-disturbance site at the 5th percentile as the optimal and poorest reference standard, respectively. The optimal reference standard corresponds to least disturbed site and not “pristine condition” as well as the poorest reference is the worst from my dataset. The evaluation criteria for each site were then standardized based on these reference standards. Specifically, the positive core indicators H’, S, N-(Nutrient), N-(Heavy metal) were standardized as follows:
The negative core indicators AMBI and N+(Heavy metal) were standardized as follows:
Each standardized core indicator is divided into 5 levels, with scores ranging from 1 to 5, corresponding to bad, poor, moderate, good, and excellent. Some indicators (such as AMBI, S, H’) are divided into 5 levels based on an equal interval between the standardized minimum and maximum values. Bioindicators based on indicator species differ from other indicators. For positive bioindicators, if the abundance of the corresponding indicator species is 0 (standardized value = 0), it is classified as bad. The remaining regions are divided into four levels: poor, moderate, good, and excellent, based on equal intervals between the standardized minimum and maximum values. For negative core bioindicators, the classification is the opposite. If the abundance of the indicator species is 0 (standardized value = 1), it is classified as excellent. The remaining regions are divided into four levels: bad, poor, moderate, and good, based on equal intervals between the standardized minimum and maximum values. Finally, the scores of each core indicator are summarized to calculate the Composite Benthic Ecological Index (CBEI).
The correlations between the bioindicators and associated environmental pollution indexes were analyzed using the Kruskal–Wallis test in PRISM to assess the significance of temporal variations in environmental variables and also using linear regression analysis. The spatial distribution of nutrient and heavy metal pollution as well as the comprehensive ecological quality in the sea area adjacent to the Yellow River estuary were investigated using the Kriging interpolation method based on the pollution indexes Trix and RI and the final CBEI in ArcGIS 10.0 (Esri Inc., USA). In order to screen indicator species in the concentration gradient of pollutants change. Firstly, filter species with a relative abundance greater than 1% to get 23 abundant species, and use the R package “ggplot2” to plot the abundance distribution of these species. Next, redundancy analysis (RDA) was applied to identify the environmental factors that primarily affected the composition of these 23 species. The analysis included all environmental data, which were log-transformed. Finally, the TITAN method was employed to examine the variations in abundance for the 23 species under the gradient changes in major pollutant concentrations and to select the indicator species for these pollutants. The analysis was conducted in R4.3 using the “TITAN2” package. AMOS 28.0 was used for structural equation modeling (SEM) to explore the pathways through which multiple pollutants affected CBEI, with model validity being verified using various fitting indexes (CMIN/DF, RMSEA, CFI, ILI).
In the sea area adjacent to the Yellow River estuary, significant differences were detected in the natural environment between the nearshore (Sites A and B) and offshore (Sites C and D) areas. The average nearest distance from the shore, depth, and salinity values were 5.97 km, 4.88 m, and 25.07, respectively, for the nearshore area, and 17.18 km, 14.01 m, and 29.52, respectively, for the offshore area. The sediment in all areas consisted primarily of silt, and sediment analysis revealed a higher sand content in the nearshore area than in the offshore area (Supplementary Table S7). Most of the 18 environmental variables examined did not show significant interannual variations, except for Hg and Cd concentrations, for which fluctuations were obvious (Supplementary Figure S1).
The reference standards for Trix and RI are shown in Table 1. The Trix values obtained indicated that the eutrophication level in the coastal area nearby the Yellow River estuary was moderately high (Trix > 5) (Figure 3A). The eutrophication gradient indicates higher eutrophication levels in near-shore areas and lower levels in offshore areas, decreasing from southwest to northeast (Figure 3C). The RI incorporated Cu, Zn, Cr, Hg, and Cd concentrations. The coastal area near the Yellow River estuary faced a moderate risk of heavy metal pollution (RI > 150) (Figure 3B) and exhibited a narrow environmental gradient, with more severe heavy metal pollution near the actual estuary (Figure 3D).
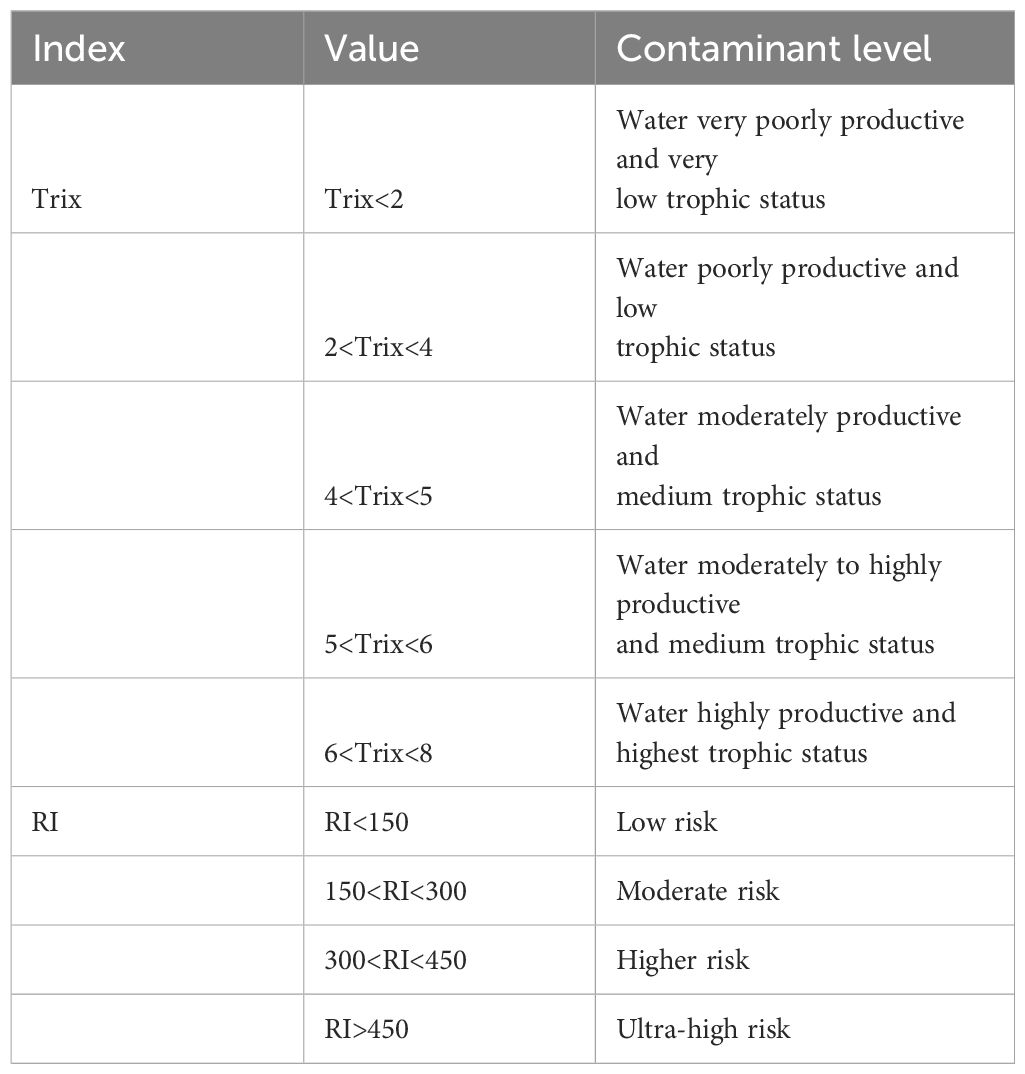
Table 1. Criteria for assessing nutrification and heavy metal pollution.
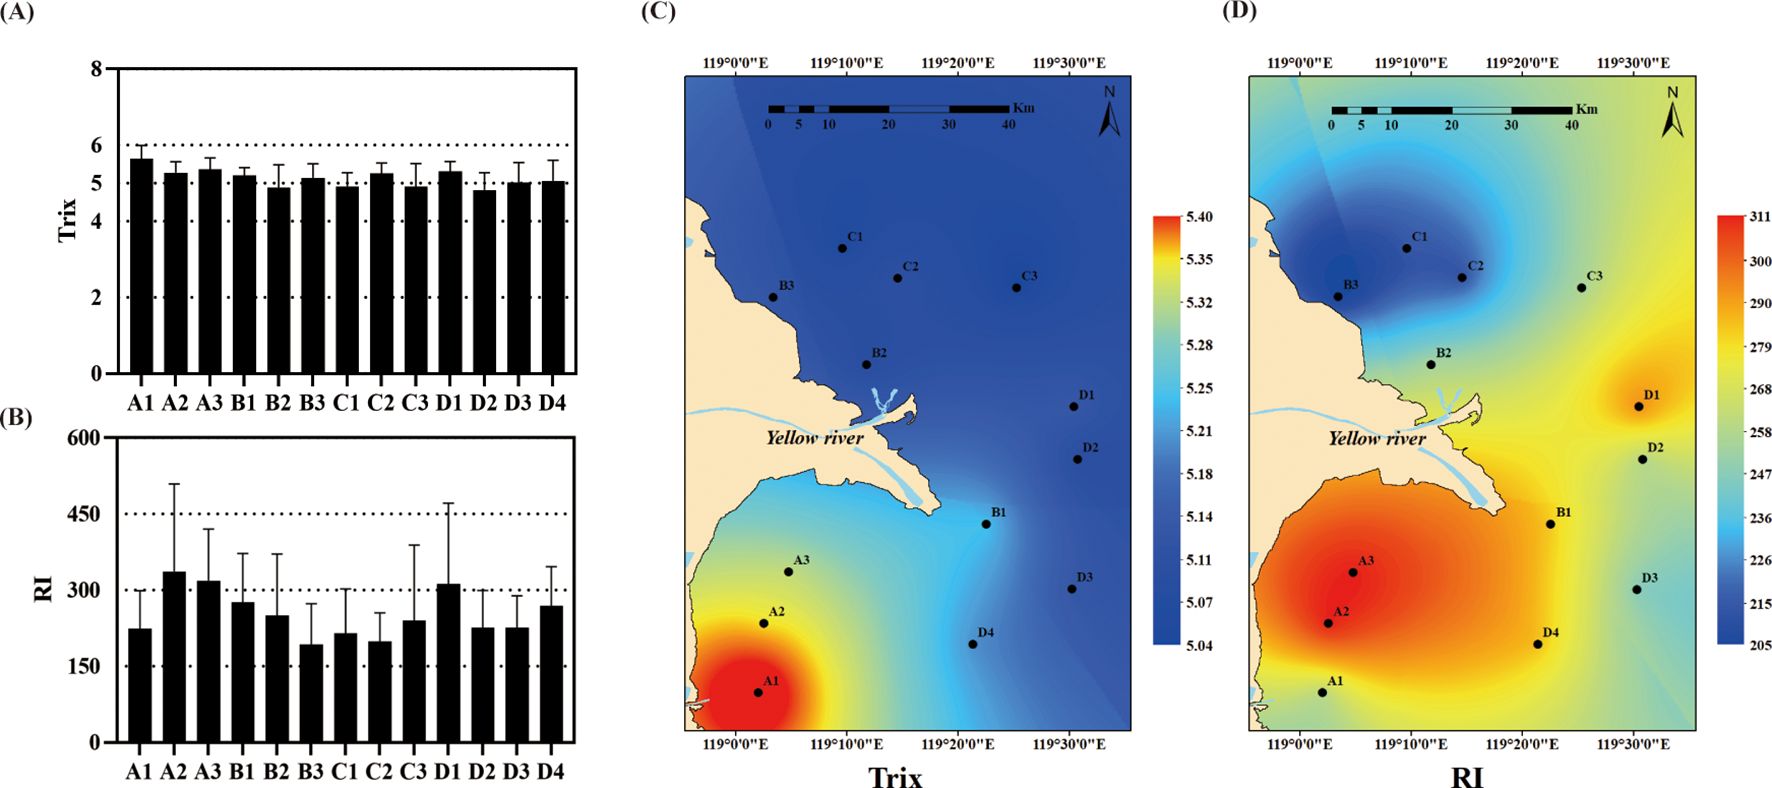
Figure 3. Spatial distribution of eutrophication and heavy metal pollution in the sea area adjacent to the Yellow River estuary. A and B are the average pollution levels as determined by the Trix eutrophication index and the potential ecological risk index (RI) at each sampling point, while C and D are their corresponding spatial distributions.
Overall, 142 species were investigated in this study (Supplementary Table S2). A total of 23 dominant species with a relative abundance > 1% were obtained after screening, with annelids being the most abundant, followed by mollusks, arthropods, and nemerteans (Figure 4). Polychaetes were the dominant group in the study area, exhibiting high abundances across all sites. RDA showed that environmental factors explained 28% of the variation in the composition of the 23 abundant species (Figure 5). Nutrient salts (NO2-N, and NO3-N), heavy metals (Cd, Hg, and Cr), sand content, and DO were the primary factors significantly affecting species composition, with the first two being the most important (Table 2). These pollutants were further analyzed using the TITAN method to identify indicator species under changing environmental concentration gradients (Supplementary Figure S2). Only negative indicator species were identified for the nutrient salts NO2-N and NO3-N. Specifically, these were Glycinde gurjanovae and Ringicula doliaris (the former only for NO2-N). Both negative and positive indicator species were identified for heavy metals. Specifically, Aricidea fragilis and Lumbrineris cruzensis were revealed as negative indicator species for Cd, while Procephalathrix sp., Sigambra bassi, and Ophiodromus angutifrons were identified as positive indicator species for Hg. Moreover, Linopherus ambigua and Yokoyamaia acutangula were revealed as positive and negative indicator species for Cr, respectively.
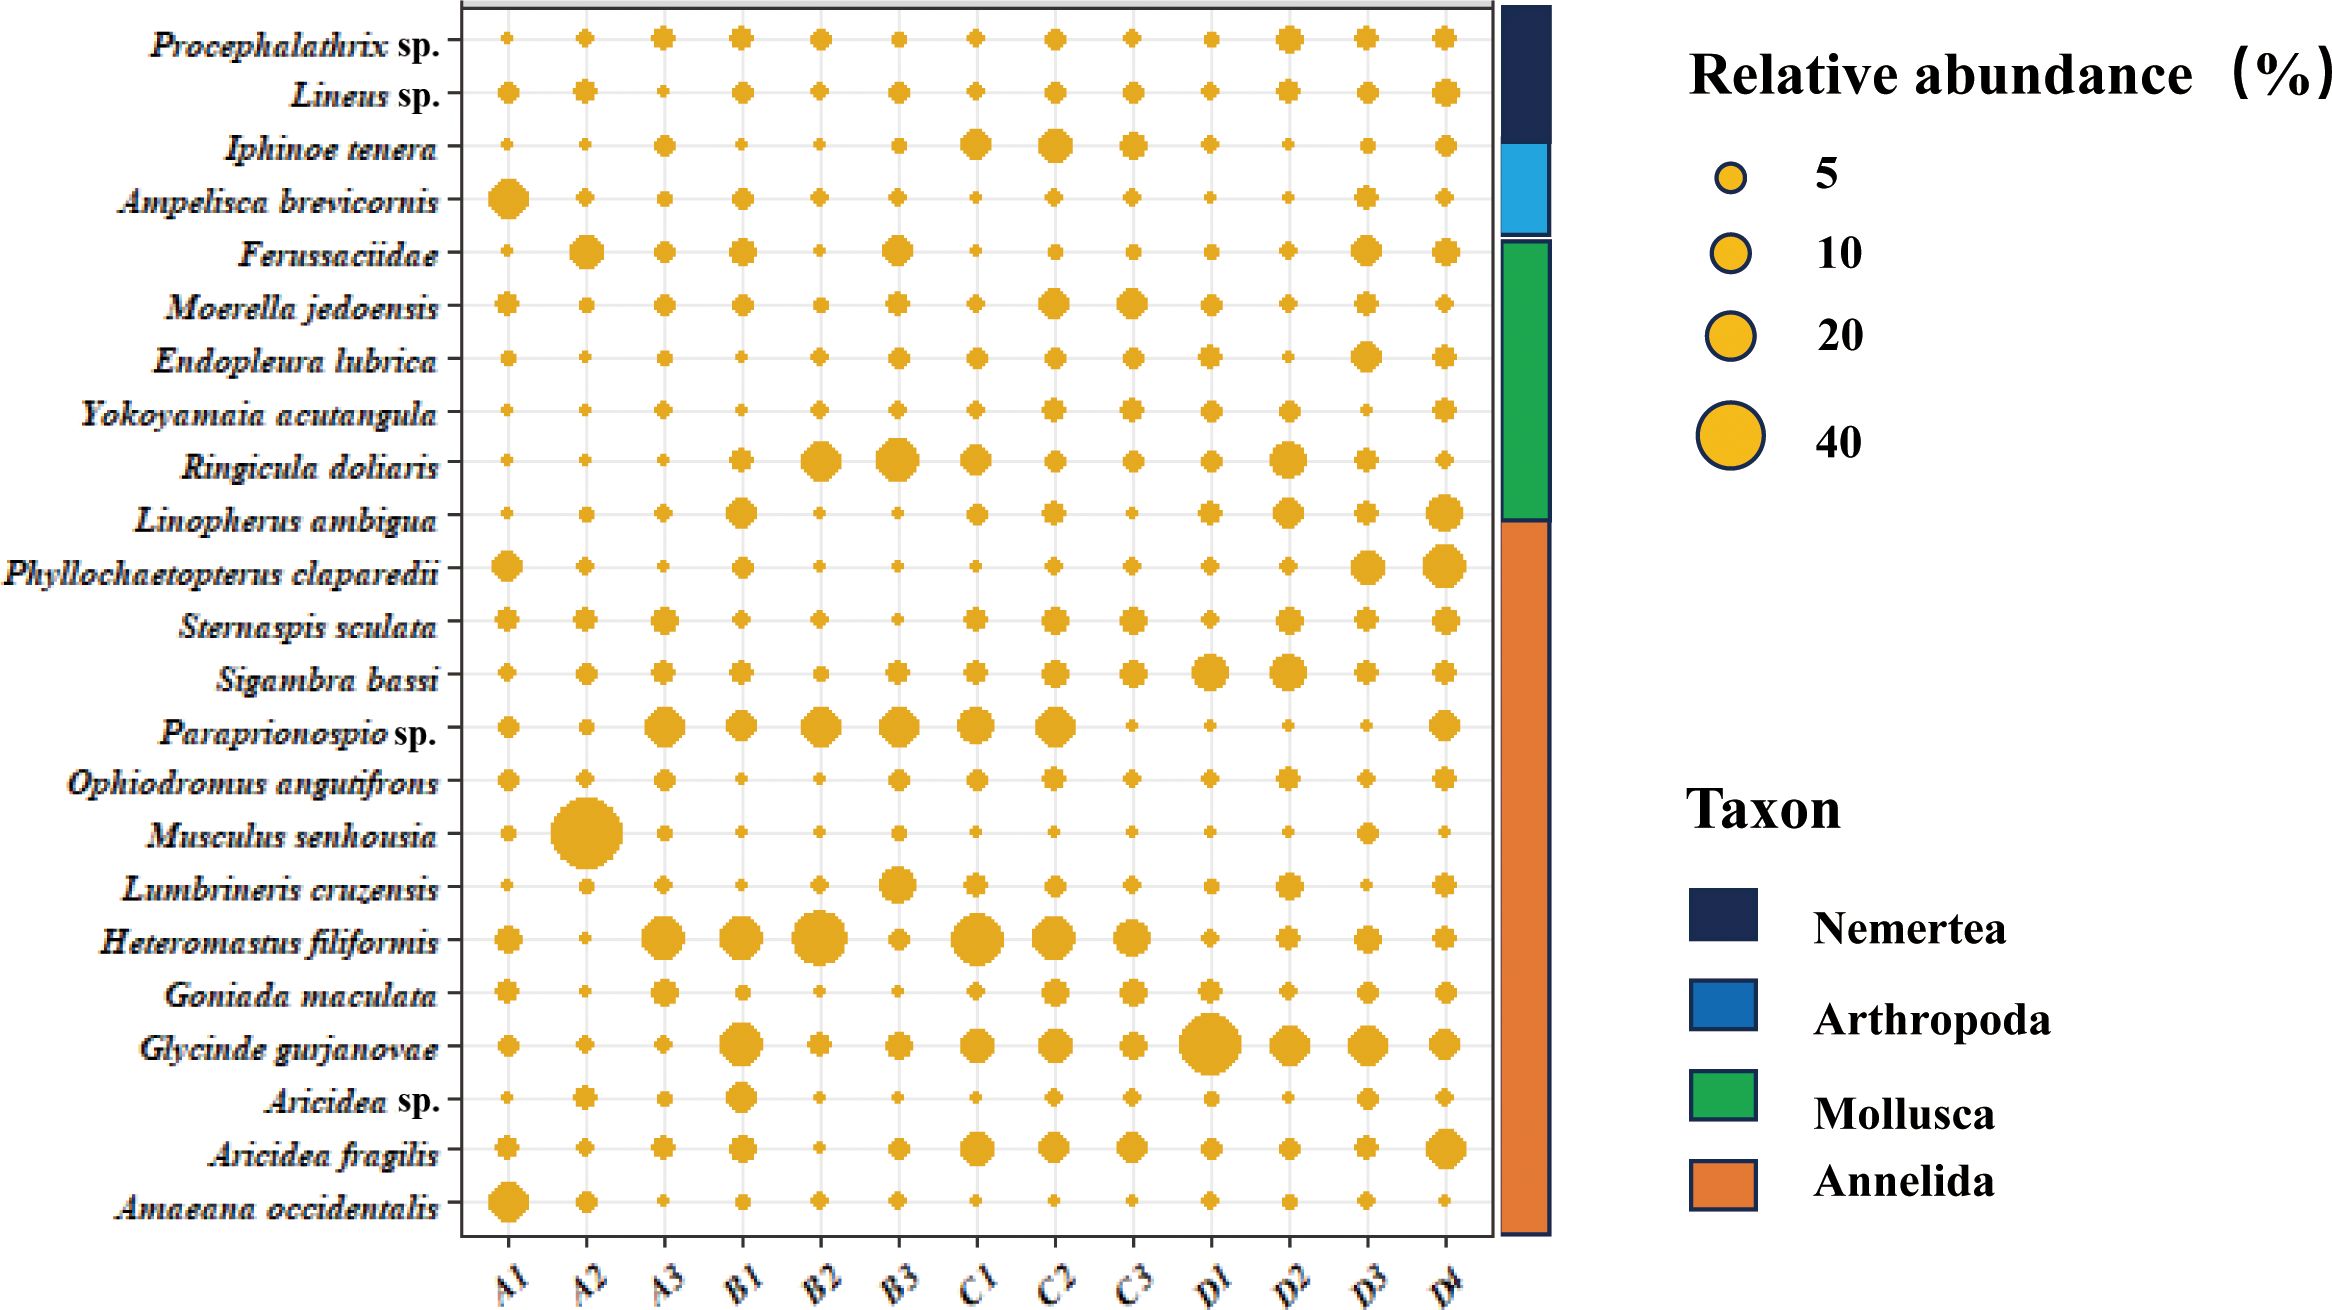
Figure 4. Species composition and distribution in the Yellow River estuary. The size of the circle indicates the relative abundance of species, while the different colored rectangles represent the species classification.
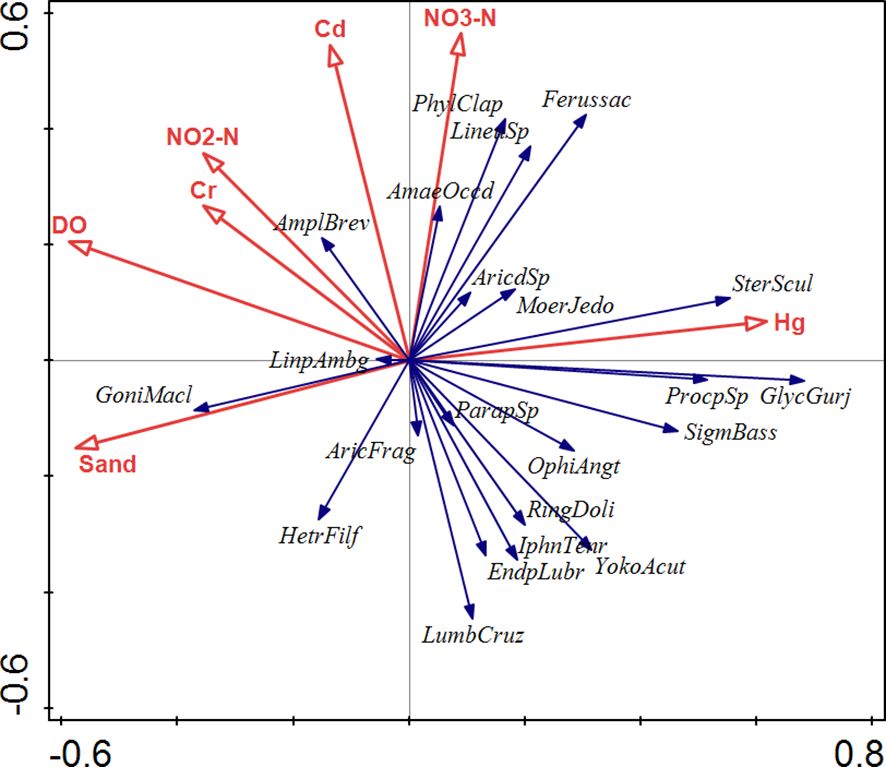
Figure 5. Results of redundancy analysis showing the correlation between environmental factors and abundant species with a relative abundance > 1%, with environmental factors explaining 28% of the variation. The names of abundant species are represented by abbreviations of Latin names.
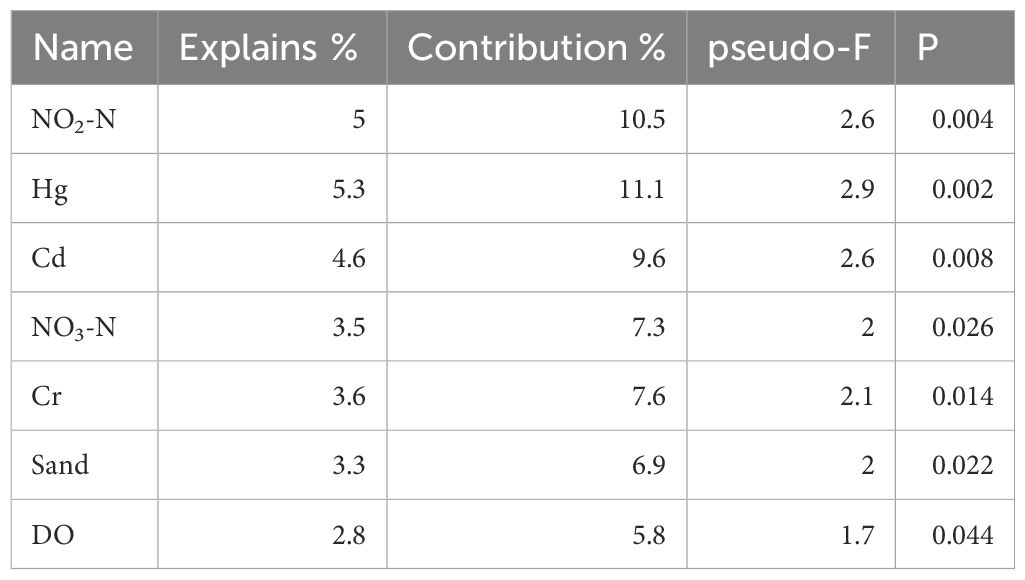
Table 2. Significant environmental factors that affect the macrofauna community.
The obtained indicator species for nutrient salts and heavy metals were used as key indicators to assess eutrophication and heavy metal pollution. The sum of the abundances of negative indicator species for NO2-N and NO3-N, denoted as N−(Nutrient), was used as a bioindicator of eutrophication (Figure 6A). This bioindicator was lower at sites A1, A2, and A3, and higher at the other sites. The sums of the abundances of positive and negative indicator species for Cd, Hg, and Cr, denoted as N+(Heavy metal) (Figure 6E) and N−(Heavy metal) (Figure 6C), respectively, were used as bioindicators for heavy metal pollution. N−(Heavy metal) was lower at sites A2, A3, B1, B2, and D1 and higher at the other sites, and N+(Heavy metal) was extremely high at site D1. Linear regression analysis showed a significant negative correlation between N−(Nutrient) and Trix (R² = 0.485, p = 0.008) (Figure 6B) and between N−(Heavy metal) and RI (R² = 0.324, p = 0.042) (Figure 6D), but a weak positive correlation between N+(Heavy metal) and RI (R² = 0.105, p = 0.280) (Figure 6F). These results suggested that the total abundance of bioindicators responded to changes in nutrient and heavy metal pollution to some extent.
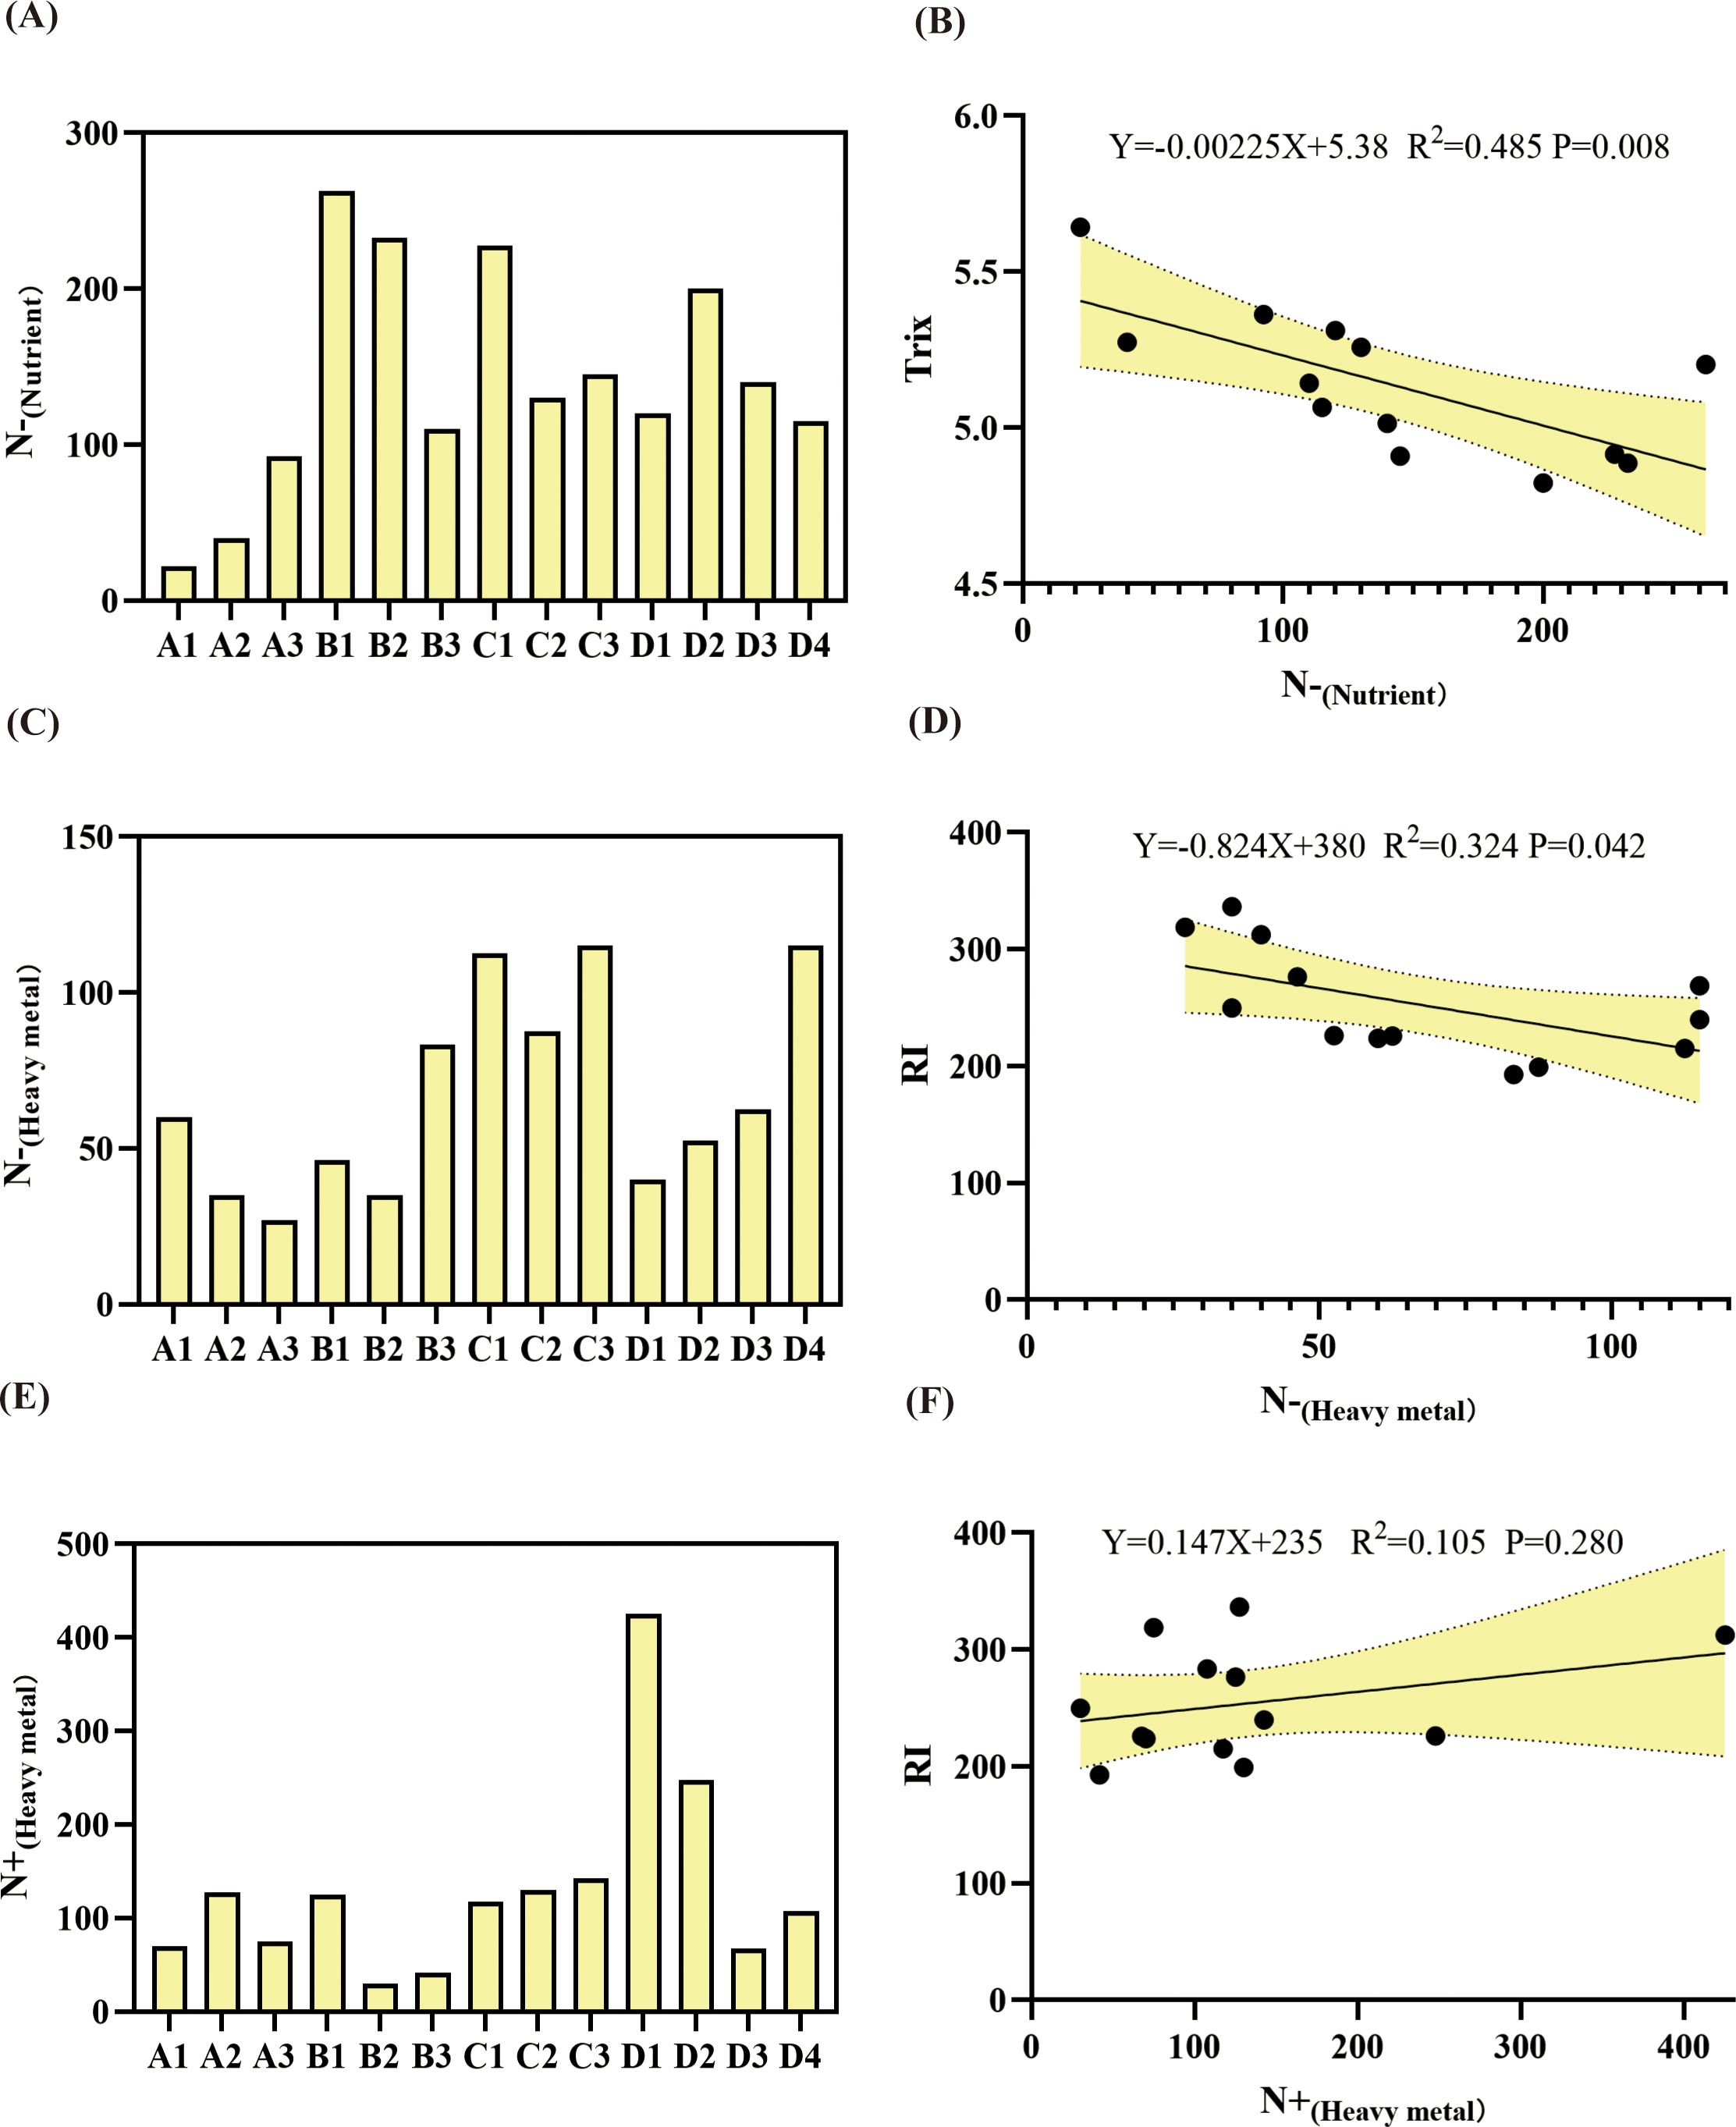
Figure 6. Spatial distribution of bioindicators based on indicator species (A, C, E) and associated pollution indexes (as determined via linear regression analysis) (B, D, F). N-(Nutrient) is the sum of the abundances of negative indicator species for NO2-N and NO3-N (i.e., Glycinde gurjanovae and Ringicula doliaris); N-(Heavy metal) is the sum of the abundances of negative indicator species for Cd and Cr (i.e., Aricidea fragilis, Lumbrineris cruzensis, and Yokoyamaia acutangula); and N+(Heavy metal) is the sum of the abundances of positive indicator species for Hg and Cr (i.e., Procephalathrix sp., Sigambra bassi, Ophiodromus angutifrons, and Linopherus ambigua).
In this study, four types of indicators were selected to assess ecological quality. Highly correlated indexes (r > 0.75) were merged based on correlation analysis, resulting in the selection of the following six indicators for constructing the CBEI: N-(Nutrient), N-(Heavy metal), and N+(Heavy metal) to represent eutrophication and heavy metal pollution, H’ and S to measure biodiversity, and AMBI to quantify pollution pressure (Figure 2). According to the results, the mean CBEI values at different sites ranged from 16.25 to 21.25. The ecological quality at most sites was classified as good (Figure 7A), except at A2, A3, B1 and B2 where moderate conditions prevailed (CBEI<18). Spatially, the CBEI values tended to be lower near the shore and estuary and higher farther from the shore (Figure 7B). These results indicated that the overall ecological quality of the sea area adjacent to the Yellow River estuary was good, with the ecosystem being affected by anthropogenic disturbance to a certain degree.
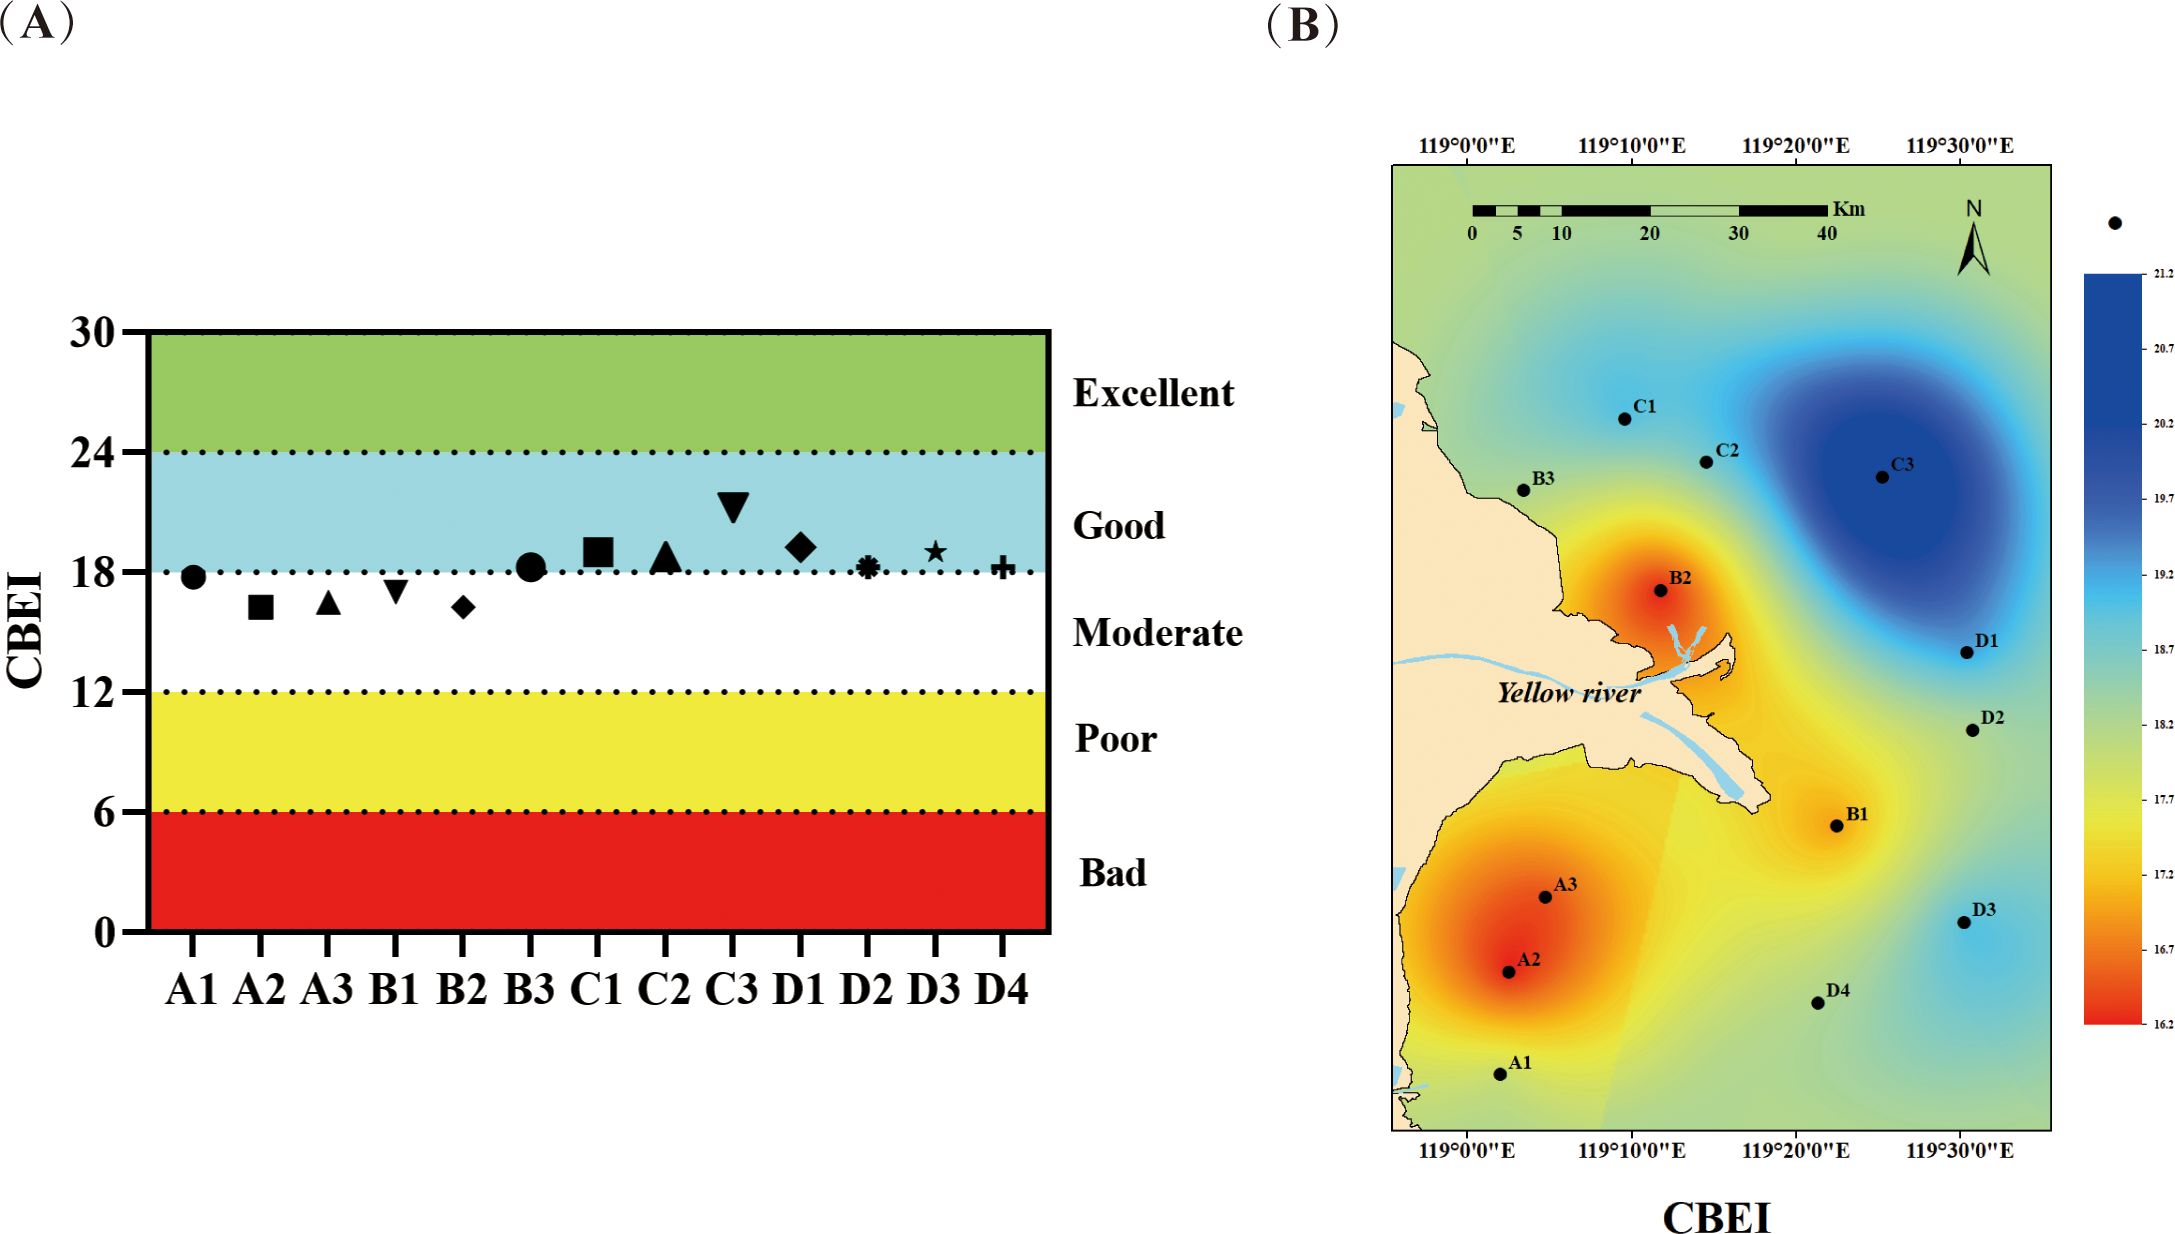
Figure 7. Composite Benthic Ecological Index (CBEI) values (A) and their spatial distribution (B).
In the present study, structural equation modeling (SEM) was used to describe the pathways through which eutrophication and heavy metal pollution influence estuarine ecological quality. The environmental variables obtained from actual measurements were categorized into two groups: exogenous inputs (nutrients and heavy metals) and other marine environmental variables. Based on the correlations between different variables and CBEI, a hypothetical model was developed to represent the effects of environmental factors on estuarine ecological quality (Figure 8). The fit of the conceptual model was assessed using several fitting parameters during validation. After correction, both the absolute fit (CMIN/DF = 1.115 and RMSEA = 0.048) and the relative fit (CFI = 0.952 and ILI = 0.965) indexes met the criteria of a high fit (CMIN/DF< 4, RMSEA< 0.5, CFI > 0.90, ILI > 0.9), indicating that the model could accurately represent the ecological quality of the benthic environment under the influence of environmental pollutants. According to the path coefficients, nutrients and heavy metals had significant direct effects on CBEI (r = -0.21 and r = -0.32, respectively). In addition, nutrients indirectly affected CBEI through the pathways of Chla (r = 0.45, -0.27), pH (r = 0.29, 0.49, -0.33), and TOC (r = 0.26, -0.33), while heavy metals did so through the pathway of TOC (r = 0.36, -0.33). In conclusion, the ecological quality of the sea area adjacent to the Yellow River estuary was shown to be disturbed to varying degrees by nutrient salts and heavy metals, both directly and indirectly.
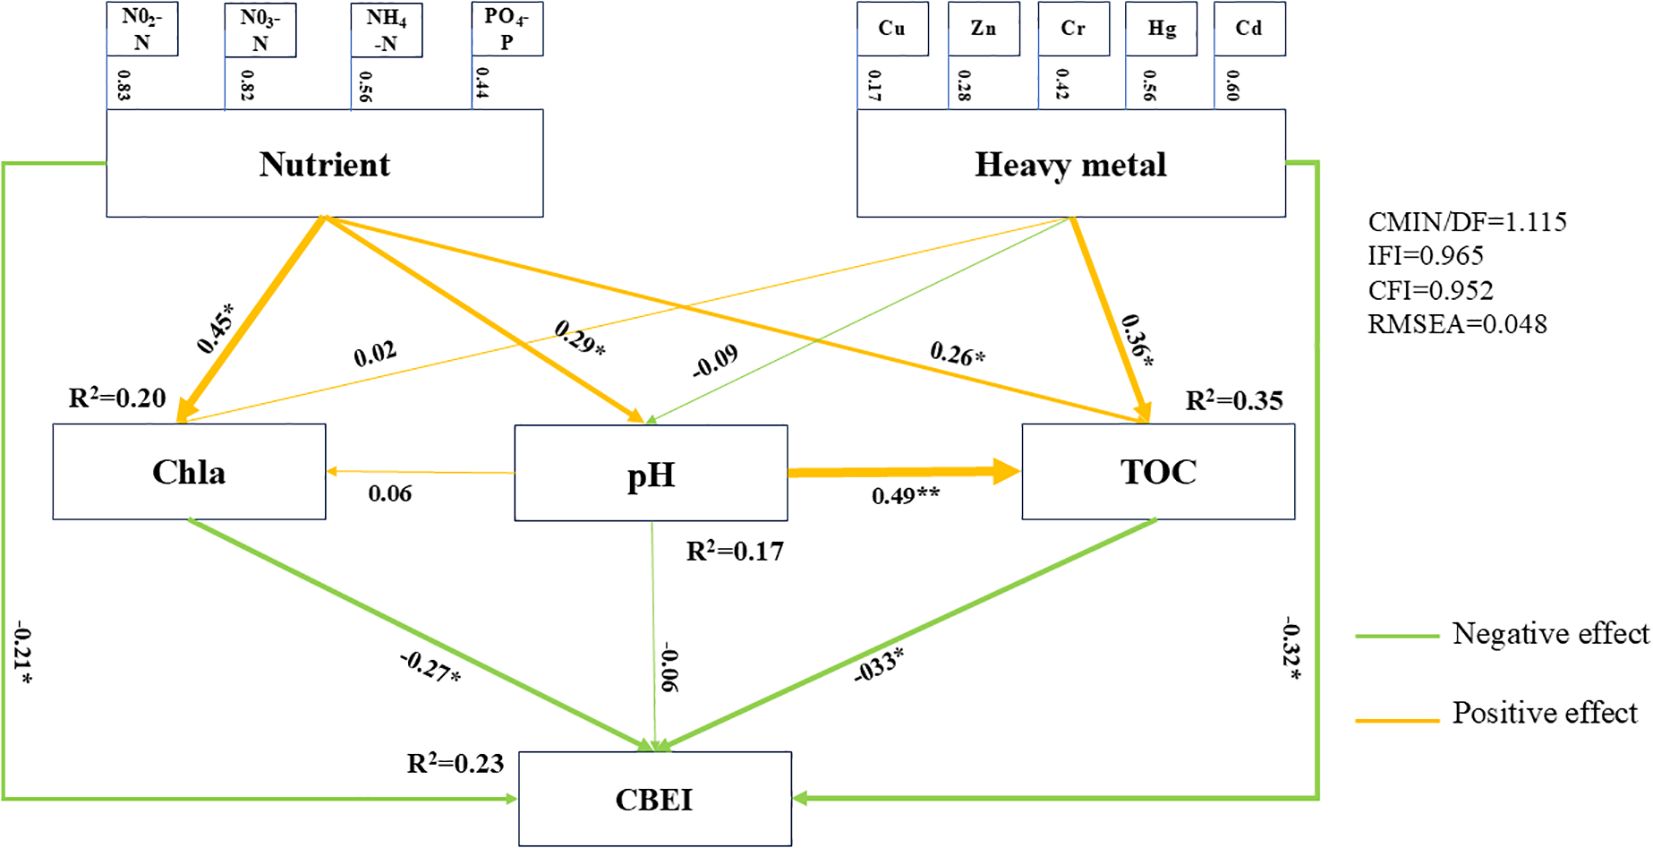
Figure 8. Structural equation model describing the direct and indirect contributions of environmental variables to the Composite Benthic Ecological Index (CBEI). The solid lines indicate significant effects at ***P< 0.001, **P< 0.01, *P< 0.05.
Accurately identifying pollution sources and controlling their emissions is crucial for effective ecosystem management. Ocean pollution occurs via atmospheric deposition and riverine input (Gao et al., 2015), with the latter representing the primary pathway through which pollutants enter the ocean, accounting for approximately 50% of total pollutant inputs compared with other sources (Kennish, 2002; Zhu et al., 2019). In this study, moderate levels of eutrophication and a moderate risk of heavy metal pollution were observed in the sea area adjacent to the Yellow River estuary, which aligned with the findings of previous studies (Rao et al., 2018; Yu et al., 2020). Compared to other areas of Laizhou Bay, which exhibit low levels of eutrophication and heavy metal pollution (Lü et al., 2015; Wei et al., 2022), the sea areas near the Yellow River estuary in the northwest of Laizhou Bay have higher levels of both eutrophication and heavy metal contamination. Furthermore, differences were detected in the distribution of eutrophication and heavy metal pollution (Figure 3). Eutrophication exhibited a wide gradient, with higher pollution levels near the shore and lower pollution levels farther offshore, especially at the A1 site near the Xiaoqing River, where an extremely high value was recorded (Figure 3C). It is possible that the nutrient salts in the sea area adjacent to the Yellow River estuary primarily originate from the Xiaoqing River (Zhang et al., 2023). In several cities it flows through, this river is surrounded by large industrial parks hosting a wide range of industries that produce fertilizers, plastics, and pharmaceuticals, among other things (Ci et al., 2021). In contrast, heavy metal pollution exhibited a narrow environmental gradient, with more severe contamination observed near the Yellow River estuary (Figure 3D). This phenomenon may be related to the flow sediment regulation project (FSRP) and the impact of ocean currents on the river’s input of heavy metals (Rao et al., 2018). Heavy metals in the sea area near the estuary are likely primarily derived from the extensive use of agrochemicals and fertilizers in the Yellow River Basin plains as well as from oil field runoff. The combined action of the Flow-Sediment Regulation Project (FSRP) and ocean currents weakens the heavy metal pollution gradient by altering the texture of sediments and facilitating the migration of these heavy metals. The FSRP will increase the sediment transport volume in the estuary area and change the particle size distribution of sediment, thus affecting the migration and deposition patterns of heavy metals. This may lead to an exacerbation of heavy metal pollution in certain areas, especially those where fine - grained sediment is concentrated. In our study, compared with the nearshore areas, the sediment in the offshore areas had a lower sand content (Supplementary Table S7) and may have a finer particle size. Finer particles have a stronger heavy metal adsorption capacity (Sudhanandh et al., 2011), resulting in higher heavy metal concentrations in the offshore area, thus disrupting the heavy metal gradient. Furthermore, through the southern current of the Bohai Sea and the northern current of the Yellow Sea, these metals re transported northward into Bohai Bay and southward into Laizhou Bay and ultimately accumulate in the sea area near the Yellow River estuary (Liu et al., 2016; Lu et al., 2016). This process may also have altered the spatial distribution of heavy metals.
The pollution derived from human activities is the primary anthropogenic pressure in the sea area adjacent to the Yellow River estuary, where it directly affects the composition of macrofauna. Macrofauna can be classified into five ecological taxa based on their sensitivity to increasing gradients of multiple anthropogenic stresses: sensitive, indifferent, tolerant, secondary opportunistic, and primary opportunistic (Borja et al., 2000). In disturbed areas, tolerant or opportunistic species tend to dominate, as they exhibit higher tolerance to environmental fluctuations or more effective coping strategies (Levin et al., 2009), which leads to their high abundance in these areas. In contrast, less disturbed areas are characterized by a higher abundance of more sensitive species (Rosenberg et al., 2004; Ugland et al., 2008). The present study identified indicator species that responded to changes in the concentration gradients of nutrient salts (NO2-N and NO3-N) and heavy metals (Cd, Hg, and Cr), which influence the composition and abundance of macrofauna communities (Supplementary Figure S2). Specifically, Glycinde gurjanovae and Ringicula doliaris were shown to be negative indicator species for NO2-N and NO3-N, responding to increasing concentrations by decreasing in abundance, as reflected in the AMBI ecological classification. The abundance of these species was low at sites A1 and A2, where eutrophication was high, but higher at other sites with relatively lower eutrophication levels (Figure 6A). Similarly, Aricidea fragilis, Lumbrineris cruzensis, and Yokoyamaia acutangula were identified as negative indicator species for heavy metals (Cd and Cr), representing more sensitive taxa in the AMBI classification. Their abundance was lower at sites with relatively higher levels of disturbance (i.e., A2, A3, B1, B2, and D1) and higher in low-disturbance areas (Figure 6C). In contrast, Procephalathrix sp., Sigambra bassi, Linopherus ambigua, and Ophiodromus angutifrons were shown to be positive indicators of heavy metal pollution (Hg and Cr), with most of them being tolerant species that maintain a higher abundance in response to increasing environmental stress, according to the AMBI classification (Supplementary Table S6). In particular, these species were more abundant at site D1, where heavy metal pollution was more severe (Figure 6E). Based on these findings and the correlation between bioindicators derived from indicator species and environmental pollution indexes, it can be concluded that these species respond to varying degrees of environmental pollution and can serve as bioindicators for specific types of pollution.
The type and intensity of environmental stress vary spatially across different sites within the same marine area. In regions with significant differences in stress type and intensity, the use of a single biotic index is not appropriate. Most biotic indexes commonly used to evaluate marine environments have specific assessment focuses or are tailored to particular environmental conditions. For instance, the value of diversity indexes, such as H’, depends on species composition and abundance. In heavily polluted areas, pollution-tolerant species dominate, which can result in relatively high abundances and species composition, potentially leading to an overestimation of ecological quality. For example, in areas with high heavy metal concentrations, H’ may be less appropriate for assessments than other indexes (Ryu et al., 2011). AMBI, which relies heavily on ecological taxon composition and relative abundance, is limited in its application to environments characterized by very low biodiversity and species richness (Borja, 2004). Most studies support the applicability of this index in areas where organic matter is abundant in sediments (Medeiros et al., 2012; Sivaraj et al., 2014; Yang et al., 2023). Therefore, combining multiple indexes for ecological quality assessment yields more comprehensive and objective results, helping to compensate for the limitations of assessments based on a single index (Wetzel et al., 2012). However, there may be environmental differences among different ecological regions and habitats. Strategies developed based on successful reference conditions inferred in a specific geographical area may not be applicable to other regions (Berthelsen et al., 2018; Dias et al., 2022). The use of benthic indices requires verification and the establishment of appropriate reference conditions in new regions to ensure accurate results (Moriarty et al., 2018; Santibañez-Aguascalientes et al., 2020).
The sea area adjacent to the Yellow River estuary is subjected to multiple forms of pollution, including eutrophication and heavy metal pollution. A comprehensive assessment using multiple commonly employed biotic indexes alone is insufficient to effectively evaluate the true ecological quality. To address its limits, which are due to local complexity or special environmental conditions, this approach should be complemented with specific environmental pollution assessments. Therefore, in this study, four types of indexes were selected to evaluate the ecological quality of the Yellow River estuary under the influence of multiple pollutants. These included biodiversity indexes commonly used in marine areas, biotic indexes reflecting pollution pressure, and bioindicators of eutrophication and heavy metal pollution. The integrated assessment results indicated that the ecological quality in most sites in the Yellow River estuary was good, with only four sites being classified as “moderate”. Values tended to be lower near the shore and higher farther offshore (Figure 7). The coastal areas near the estuary, which are likely influenced by pollutants derived from riverine inputs (Rao et al., 2018; Yu et al., 2020; Zhang et al., 2023, 2024), exhibited a lower ecological quality. In these areas, pollution-tolerant species, such as Musculus senhousia and Heteromastus filiformis, were dominant. These species are capable of thriving in highly polluted environments and are frequently found in zones rich in organic matter (Borja et al., 2000; Mistri, 2002).
The impacts of environmental pollutants on ecosystems can be broadly categorized into direct and clearly negative (toxic) effects or indirect effects that alter other environmental parameters (Abreo et al., 2015). In the present study, multiple pollutants were shown to significantly affect ecological quality (CBEI) through direct or indirect pathways (Figure 8). Nutrient salts can significantly promote the production of chlorophyll a, resulting in a rapid increase in primary productivity, which will have a serious impact on benthic ecological quality. For example, under eutrophic conditions, the excessive uptake of CO2 by phytoplankton in the surface layer leads to the production of large amounts of marine-derived organic matter, which increases oxygen consumption in the bottom waters, thereby creating a hypoxic environment (Zhao et al., 2020). Under hypoxic conditions, the proportion of low-oxygen tolerant species increases dramatically, while the proportion of sensitive species declines sharply, impacting the structure and composition of macrofauna communities (Brzana et al., 2020). Heavy metals have a direct and significant negative impact on benthic ecological quality. Through geochemical reactions, they are desorbed from mineral particles, releasing free metal ions that can be directly absorbed by aquatic organisms. These ions interfere with metabolic processes, affecting growth, reproduction, and immune functions (Li et al., 2016). At the same time, heavy metals accumulate in the food chain, along which their toxicity is amplified, and affect species at higher trophic levels, thereby reducing the functional diversity of the ecosystem (Gao et al., 2021). TOC is a key environmental parameter influenced by the accumulation of nutrients and heavy metals that directly affects benthic ecological quality. Under eutrophic conditions, phytoplankton produce significant amounts of organic matter. In this context, heavy metals promote TOC accumulation by binding to the organic matter, thereby increasing the risk of organic pollution and indirectly reducing the ecological quality (Sundaramanickam et al., 2016). In this study, the effects of nutrient salts and heavy metal were explored using SEM, which yielded an R²of 0.23, indicating only a moderate contribution of these pollutants to changes in estuarine ecological quality. Such moderate effect may be due to the lack of a significant concentration gradient of anthropogenic pollutants, leading to a milder biological response to stressors.
The sea area adjacent to the Yellow River estuary, which is affected by eutrophication and heavy metal pollution, serves as a specific case study for understanding the variation in ecological quality under the pressure of environmental stresses derived from human activities. Based on the macrofauna community composition, a composite index was developed for assessing the ecological quality of this area under the influence of multiple pollutants. The Trix and RI values revealed moderately high eutrophication and moderate heavy metal pollution in the study area. The TITAN method was used to assess the impact of these stressors, resulting in the identification of indicator species for nutrient salts (NO2-N and NO3-N) and heavy metals (Cd, Hg, and Cr), which altered the macrofauna community composition. Finally, based on the CBEI, it was determined that the ecological quality of the sea area adjacent to the Yellow River estuary and of the entire estuary was impacted by varying degrees of eutrophication and heavy metal pollution, both directly and indirectly. This study identified the main areas affected by nutrient and heavy metal pollution in the Yellow River estuary and highlighted the impact of these pollutants on the estuarine ecological quality, providing guidance for future monitoring and management programs.
The datasets presented in this study can be found in online repositories. The names of the repository/repositories and accession number(s) can be found in the article/Supplementary Material.
The manuscript presents research on animals that do not require ethical approval for their study.
WL: Writing – original draft, Writing – review & editing. JY: Funding acquisition, Resources, Supervision, Writing – review & editing. XG: Investigation, Software, Writing – review & editing. YZ: Supervision, Writing – review & editing. YL: Visualization, Writing – review & editing. HJL: Conceptualization, Funding acquisition, Investigation, Project administration, Resources, Supervision, Validation, Writing – review & editing.
The author(s) declare financial support was received for the research, authorship, and/or publication of this article. This work was financially supported by the National Key Research and Development Program of China (2024YFF0506903).
The authors declare that the research was conducted in the absence of any commercial or financial relationships that could be construed as a potential conflict of interest.
The author(s) declare that no Generative AI was used in the creation of this manuscript.
All claims expressed in this article are solely those of the authors and do not necessarily represent those of their affiliated organizations, or those of the publisher, the editors and the reviewers. Any product that may be evaluated in this article, or claim that may be made by its manufacturer, is not guaranteed or endorsed by the publisher.
The Supplementary Material for this article can be found online at: https://www.frontiersin.org/articles/10.3389/fmars.2025.1542611/full#supplementary-material
Abreo N. A. S., Macusi E. D., Cuenca G. C., Ranara C. T. B., Andam M. B., Cardona L., et al. (2015). Nutrient enrichment, sedimentation, heavy metals and plastic pollution in the marine environment and its implications on Philippine marine biodiversity: A Review. IAMURE Int. J. Ecol. Conserv. 15, 111–168. doi: 10.7718/ijec.v15i1.999
Anaisce R., Juen L., Ligeiro R. (2023). Scientometrics of the assessment of biotic integrity in estuaries. Ecol. Indic. 156, 111112. doi: 10.1016/j.ecolind.2023.111112
Asmala E., Carstensen J., Conley D. J., Slomp C. P., Stadmark J., Voss M. (2017). Efficiency of the coastal filter: Nitrogen and phosphorus removal in the Baltic Sea. Limnol. Oceanogr. 62, S222–S238. doi: 10.1002/lno.10644
Baker M. E., King R. S. (2010). A new method for detecting and interpreting biodiversity and ecological community thresholds. Methods Ecol. Evol. 1, 25–37. doi: 10.1111/j.2041-210x.2009.00007.x
Berthelsen A., Atalah J., Clark D., Goodwin E., Patterson M., Sinner J. (2018). Relationships between biotic indices, multiple stressors and natural variability in New Zealand estuaries. Ecol. Indic. 85, 634–643. doi: 10.1016/j.ecolind.2017.10.060
Bevilacqua S., Fraschetti S., Musco L., Guarnieri G., Terlizzi A. (2011). Low sensitiveness of taxonomic distinctness indices to human impacts: evidences across marine benthic organisms and habitat types. Ecol. Indic. 11, 448–455. doi: 10.1016/j.ecolind.2010.06.016
Borja A. (2004). The biotic indices and the Water Framework Directive: the required consensus in the new benthic monitoring tools. Mar. pollut. Bull. 48, 405–408. doi: 10.1016/j.marpolbul.2003.10.024
Borja A., Dauer D. M. (2008). Assessing the environmental quality status in estuarine and coastal systems: comparing methodologies and indices. Ecol. Indic. 8, 331–337. doi: 10.1016/j.ecolind.2007.05.004
Borja A., Franco J., Pérez V. (2000). A marine biotic index to establish the ecological quality of soft-bottom benthos within European estuarine and coastal environments. Mar. pollut. Bull. 40, 1100–1114. doi: 10.1016/s0025-326x(00)00061-8
Bryan G., Langston W. (1992). Bioavailability, accumulation and effects of heavy metals in sediments with special reference to United Kingdom estuaries: a review. Environ. pollut. 76, 89–131. doi: 10.1016/0269-7491(92)90099-v
Brzana R., Janas U., Tykarska M. B. (2020). Effects of a 70-year old artificial offshore structure on oxygen concentration and macrobenthos in the Gulf of Gdańsk (Baltic Sea). Estuar Coast. Shelf Sci. 235, 106563. doi: 10.1016/j.ecss.2019.106563
Carstensen J., Conley D. J., Almroth-Rosell E., Asmala E., Bonsdorff E., Fleming-Lehtinen V., et al. (2020). Factors regulating the coastal nutrient filter in the Baltic Sea. Ambio 49, 1194–1210. doi: 10.1007/s13280-019-01282-y
Chen J., Liu M., Wang F., Ding Y., Fan D., Wang H. (2024). Accumulation and migration of particulate trace metals by artificial flood event of the Yellow River: From Xiaolangdi reservoir to estuary. Sci. Total Environ. 912, 168614. doi: 10.1016/j.scitotenv.2023.168614
Ci M., Zhang G., Yan X., Dong W., Xu W., Wang W., et al. (2021). Occurrence of antibiotics in the Xiaoqing River basin and antibiotic source contribution-a case study of Jinan city, China. Environ. Sci. pollut. Res. 28, 25241–25254. doi: 10.1007/s11356-020-12202-z
Dias H. Q., Sukumaran S., Mulik J., Janakiram P. (2022). Ecological quality status assessment of tropical estuaries with benthic indices using differently derived reference conditions. Mar. pollut. Bull. 177, 113457. doi: 10.1016/j.marpolbul.2022.113457
Dong J., Wang X., Zhang X., Bidegain G., Zhao L. (2023). Integrating multiple indices based on heavy metals and macrobenthos to evaluate the benthic ecological quality status of Laoshan Bay, Shandong Peninsula, China. Ecol. Indic. 153, 110367. doi: 10.1016/j.ecolind.2023.110367
Dufrêne M., Legendre P. (1997). Species assemblages and indicator species: the need for a flexible asymmetrical approach. Ecol. Monogr. 67, 345–366. doi: 10.2307/2963459
Gao X., Li W., Zhang Y., Song H., Li Y., Li H. (2024). Integrated assessment of ecological quality combining biological and environmental data in the Yellow River estuary. Water 16, 1615. doi: 10.3390/w16111615
Gao Y., Wang R., Li Y., Ding X., Jiang Y., Feng J., et al. (2021). Trophic transfer of heavy metals in the marine food web based on tissue residuals. Sci. Total Environ. 772, 145064. doi: 10.1016/j.scitotenv.2021.145064
Gao X., Zhou F., Chen C.-T. A., Xing Q. (2015). Trace metals in the suspended particulate matter of the Yellow River (Huanghe) Estuary: Concentrations, potential mobility, contamination assessment and the fluxes into the Bohai Sea. Continental Shelf Res. 104, 25–36. doi: 10.1016/j.csr.2015.05.005
Guerra-García J. M., Navarro-Barranco C., Ros M., Sedano F., Espinar R., Fernández-Romero A., et al. (2021). Ecological quality assessement of marinas: An integrative approach combining biological and environmental data. J. Environ. Manage. 286, 112237. doi: 10.1016/j.jenvman.2021.112237
Hakanson L. (1980). An ecological risk index for aquatic pollution control. A sedimentological approach. Water Res. 14, 975–1001. doi: 10.1016/0043-1354(80)90143-8
Horng C., Wang S., Cheng I. (2009). Effects of sediment-bound Cd, Pb, and Ni on the growth, feeding, and survival of Capitella sp. I. J. Exp. Mar. Biol. Ecol. 371, 68–76. doi: 10.1016/j.jembe.2009.01.008
Hu C., Dong J., Gao L., Yang X., Wang Z., Zhang X. (2019). Macrobenthos functional trait responses to heavy metal pollution gradients in a temperate lagoon. Environ. pollut. 253, 1107–1116. doi: 10.1016/j.envpol.2019.06.117
Hu X., Sun Z., Yu L., Chen B. (2023). Potential impacts of exogenous nitrogen enrichment on distribution and transfer of nitrogen in plant-soil system of suaeda salsa marsh in the Yellow River Estuary, China. J. Ocean Univ. China 22, 258–270. doi: 10.1007/s11802-023-5248-7
Kennish M. J. (2002). Environmental threats and environmental future of estuaries. Environ. Conserv. 29, 78–107. doi: 10.1017/s0376892902000061
Kocour Kroupová H., Valentová O., Svobodová Z., Šauer P., Máchová J. (2018). Toxic effects of nitrite on freshwater organisms: a review. Rev. Aquacult. 10, 525–542. doi: 10.1111/raq.12184
Koperski P. (2021). Linear and nonlinear effects of nutrient enrichments on the diversity of macrobenthos in lowland watercourses. Aquat. Ecol. 55, 1011–1031. doi: 10.1007/s10452-021-09878-x
Levin L., Ekau W., Gooday A., Jorissen F., Middelburg J., Naqvi S., et al. (2009). Effects of natural and human-induced hypoxia on coastal benthos. Biogeosciences 6, 2063–2098. doi: 10.5194/bg-6-2063-2009
Li M., Yang W., Sun T., Jin Y. (2016). Potential ecological risk of heavy metal contamination in sediments and macrobenthos in coastal wetlands induced by freshwater releases: A case study in the Yellow River Delta, China. Mar. pollut. Bull. 103, 227–239. doi: 10.1016/j.marpolbul.2015.12.014
Liu X., Wang Y., Meng X., Zhang C., Chen Z. (2023). Improved method for benthic ecosystem health assessment by integrating chemical indexes into multiple biological indicator species—A case study of the Baiyangdian Lake, China. J. Environ. Manage. 335, 117530. doi: 10.1016/j.jenvman.2023.117530
Liu J., Yin P., Chen B., Gao F., Song H., Li M. (2016). Distribution and contamination assessment of heavy metals in surface sediments of the Luanhe River Estuary, northwest of the Bohai Sea. Mar. pollut. Bull. 109, 633–639. doi: 10.5194/bg-6-2063-2009
Liu H., Zhao B., Jin M., Wang R., Ding Z., Wang X., et al. (2024). Anthropogenic-induced ecological risks on marine ecosystems indicated by characterizing emerging pollutants in Pearl River Estuary, China. Sci. Total Environ. 926, 172030. doi: 10.1016/j.scitotenv.2024.172030
Lu Q., Bai J., Gao Z., Zhao Q., Wang J. (2016). Spatial and seasonal distribution and risk assessments for metals in a Tamarix Chinensis wetland, China. Wetlands 36, 125–136. doi: 10.1007/s13157-014-0598-y
Lu X., Xu J., Xu Z., Liu X. (2021). Assessment of benthic ecological quality status using multi-biotic indices based on macrofaunal assemblages in a semi-enclosed bay. Front. Mar. Sci. 8. doi: 10.3389/fmars.2021.734710
Lü D., Zheng B., Fang Y., Shen G., Liu H. (2015). Distribution and pollution assessment of trace metals in seawater and sediment in Laizhou Bay. Chin. J. Oceanol. Limnol. 33, 1053–1061. doi: 10.1007/s00343-015-4226-3
Medeiros J., Chaves M., Silva G., Azeda C., Costa J., Marques J., et al. (2012). Benthic condition in low salinity areas of the Mira estuary (Portugal): lessons learnt from freshwater and marine assessment tools. Ecol. Indic. 19, 79–88. doi: 10.1016/j.ecolind.2011.09.008
Ménesguen A., Lacroix G. (2018). Modelling the marine eutrophication: A review. Sci. Total Environ. 636, 339–354. doi: 10.1016/j.scitotenv.2018.04.183
Mistri M. (2002). Ecological characteristics of the invasive Asian date mussel, Musculista senhousia, in the Sacca di Goro (Adriatic Sea, Italy). Estuaries 25, 431–440. doi: 10.1007/bf02695985
Moriarty P., Hodgson E., Froehlich H., Hennessey S., Marshall K., Oken K., et al. (2018). The need for validation of ecological indices. Ecol. Indic. 84, 546–552. doi: 10.1016/j.ecolind.2017.09.028
Muxika I., Borja Á., Bald J. (2007). Using historical data, expert judgement and multivariate analysis in assessing reference conditions and benthic ecological status, according to the European Water Framework Directive. Mar. pollut. Bull. 55, 16–29. doi: 10.1016/j.marpolbul.2006.05.025
Olisah C., Rubidge G., Human L. R., Adams J. B. (2022). Organophosphate pesticides in South African eutrophic estuaries: Spatial distribution, seasonal variation, and ecological risk assessment. Environ. pollut. 306, 119446. doi: 10.1016/j.envpol.2022.119446
Rao Q., Sun Z., Tian L., Li J., Sun W., Sun W. (2018). Assessment of arsenic and heavy metal pollution and ecological risk in inshore sediments of the Yellow River estuary, China. Stochastic Environ. Res. Risk Assess. 32, 2889–2902. doi: 10.1007/s00477-018-1588-z
Rosenberg R., Blomqvist M., Nilsson H. C., Cederwall H., Dimming A. (2004). Marine quality assessment by use of benthic species-abundance distributions: a proposed new protocol within the European Union Water Framework Directive. Mar. pollut. Bull. 49, 728–739. doi: 10.1016/j.marpolbul.2004.05.013
Rumisha C., Elskens M., Leermakers M., Kochzius M. (2012). Trace metal pollution and its influence on the community structure of soft bottom molluscs in intertidal areas of the Dar es Salaam coast, Tanzania. Mar. pollut. Bull. 64, 521–531. doi: 10.1016/j.marpolbul.2011.12.025
Ryu J., Khim J. S., Kang S. G., Kang D., Lee C.h., Koh C.h. (2011). The impact of heavy metal pollution gradients in sediments on benthic macrofauna at population and community levels. Environ. pollut. 159, 2622–2629. doi: 10.1016/j.envpol.2011.05.034
Santibañez-Aguascalientes N. A., Borja Á., Montero-Muñoz J. L., Herrera-Dorantes M. T., Ardisson P. L. (2020). Setting reference conditions to assess the ecological status of the sublittoral and bathyal benthic communities of the southern Gulf of Mexico. Ecol. Indic. 111, 105964. doi: 10.1016/j.ecolind.2019.105964
Simboura N., Zenetos A. (2002). Benthic indicators to use in ecological quality classification of Mediterranean soft bottom marine ecosystems, including a new biotic index. Mediterr. Mar. Sci. 3, 77–111. doi: 10.12681/mms.249
Sivaraj S., Murugesan P., Muthuvelu S., Vivekanandan K., Vijayalakshmi S. (2014). AMBI and M-AMBI indices as a robust tool for assessing the effluent stressed ecosystem in Nandgaon Coastal waters, Maharashtra, India. Estuar. Coast. Shelf Sci. 146, 60–67. doi: 10.1016/j.ecss.2014.05.024
Solis-Weiss V., Aleffi F., Bettoso N., Rossin P., Orel G., Fonda-Umani S. (2004). Effects of industrial and urban pollution on the benthic macrofauna in the Bay of Muggia (industrial port of Trieste, Italy). Sci. Total Environ. 328, 247–263. doi: 10.1016/j.scitotenv.2004.01.027
Sudhanandh V., Udayakumar P., Ouseph P., Amaldev S., Babu K. N. (2011). Dispersion and accumulation trend of heavy metals in coastal and estuarine sediments and its textural characteristics, a case study in India. J. Hum. Ecol. 36, 85–90. doi: 10.1080/09709274.2011.11906421
Sun Y., Li H., Liu D., Wang X., Wang Q., Cui X., et al. (2023). Benthic bacterial communities indicate anthropogenic activity footprints in coastal area under long-term marine spatial planning practice. Acta Oceanol. Sin. 42, 107–116. doi: 10.1007/s13131-023-2166-x
Sun Z., Mou X., Tong C., Wang C., Xie Z., Song H., et al. (2015). Spatial variations and bioaccumulation of heavy metals in intertidal zone of the Yellow River estuary, China. Catena 126, 43–52. doi: 10.1016/j.catena.2014.10.037
Sundaramanickam A., Shanmugam N., Cholan S., Kumaresan S., Madeswaran P., Balasubramanian T. (2016). Spatial variability of heavy metals in estuarine, mangrove and coastal ecosystems along Parangipettai, Southeast coast of India. Environ. pollut. 218, 186–195. doi: 10.1016/j.envpol.2016.07.048
Trannum H. C., Gundersen H., Oug E., Rygg B., Norderhaug K. M. (2018). Soft bottom benthos and responses to climate variation and eutrophication in Skagerrak. J. Sea Res. 141, 83–98. doi: 10.1016/j.seares.2018.08.007
Trannum H. C., Olsgard F., Skei J. M., Indrehus J., Øverås S., Eriksen J. (2004). Effects of copper, cadmium and contaminated harbour sediments on recolonisation of soft-bottom communities. J. Exp. Mar. Biol. Ecol. 310, 87–114. doi: 10.1016/j.jembe.2004.04.003
Ugland K. I., Bjørgesæter A., Bakke T., Fredheim B., Gray J. S. (2008). Assessment of environmental stress with a biological index based on opportunistic species. J. Exp. Mar. Biol. Ecol. 366, 169–174. doi: 10.1016/j.jembe.2008.07.021
Van Der Linden P., Marchini A., Smith C. J., Dolbeth M., Simone L. R. L., Marques J. C., et al. (2017). Functional changes in polychaete and mollusc communities in two tropical estuaries. Estuar. Coast. Shelf Sci. 187, 62–73. doi: 10.1016/j.ecss.2016.12.019
Vollenweider R., Giovanardi F., Montanari G., Rinaldi A. (1998). Characterization of the trophic conditions of marine coastal waters with special reference to the NW Adriatic Sea: proposal for a trophic scale, turbidity and generalized water quality index. Environmetrics 9, 329–357. doi: 10.1002/(sici)1099-095x(199805/06)9:3<329::aid-env308>3.0.co;2-9
Wang Z., Lin K., Liu X. (2022b). Distribution and pollution risk assessment of heavy metals in the surface sediment of the intertidal zones of the Yellow River Estuary, China. Mar. pollut. Bull. 174, 113286. doi: 10.1016/j.marpolbul.2021.113286
Wang Y., Liu D., Xiao W., Zhou P., Tian C., Zhang C., et al. (2021). Coastal eutrophication in China: Trend, sources, and ecological effects. Harmful Algae 107, 102058. doi: 10.1016/j.hal.2021.102058
Wang Q., Shi S., Liu X. (2022a). Functional diversity of macrofaunal assemblages as indicators to assess heavy metal pollution in the Bohai Sea, China. Mar. pollut. Bull. 185, 114265. doi: 10.1016/j.marpolbul.2022.114265
Wei Y., Cui H., Hu Q., Bai Y., Qu K., Sun J., et al. (2022). Eutrophication status assessment in the Laizhou Bay, Bohai Sea: further evidence for the ecosystem degradation. Mar. pollut. Bull. 181, 113867. doi: 10.1016/j.marpolbul.2022.113867
Wetzel M. A., Von Der Ohe P. C., Manz W., Koop J. H., Wahrendorf D. S. (2012). The ecological quality status of the Elbe estuary. A comparative approach on different benthic biotic indices applied to a highly modified estuary. Ecol. Indic. 19, 118–129. doi: 10.1016/j.ecolind.2011.08.007
Wu H., Fu S., Hu W., Chen F., Cai X., Chen Q., et al. (2022). Response of different benthic biotic indices to eutrophication and sediment heavy metal pollution, in fujian coastal water, East China sea. Chemosphere 307, 135653. doi: 10.1016/j.chemosphere.2022.135653
Yang C., Song H., Sun Y., Xie P., Liu Y., Li H. (2023). Seasonal implications for taxonomic sufficiency to simplify M-AMBI methodology in the coastal area adjacent to a eutrophic estuary. Acta Oceanol. Sin. 42, 108–116. doi: 10.1007/s13131-022-2094-1
Yu X., Li B., Wang T., Liu Y., Zhan C., Cui B. (2020). The horizontal and vertical distribution of nutrients and the potential eutrophication assessment in the Yellow River Estuary in dry season. J. Coast. Res. 99, 208–213. doi: 10.2112/si99-030.1
Zhang F., Fu H., Lou H., Sun X., Zhang D., Sun P., et al. (2023). Assessment of eutrophication from Xiaoqing River estuary to Laizhou Bay: further warning of ecosystem degradation in typically polluted estuary. Mar. pollut. Bull. 193, 115209. doi: 10.1016/j.marpolbul.2023.115209
Zhang F., Fu H., Zhang D., Lou H., Sun X., Sun P., et al. (2024). Co-pollution risk of petroleum hydrocarbons and heavy metals in typically polluted estuarine wetlands: Insights from the Xiaoqing River. Sci. Total Environ. 948, 174694. doi: 10.1016/j.scitotenv.2024.174694
Zhao Y., Liu J., Uthaipan K., Song X., Xu Y., He B., et al. (2020). Dynamics of inorganic carbon and pH in a large subtropical continental shelf system: Interaction between eutrophication, hypoxia, and ocean acidification. Limnol. Oceanogr. 65, 1359–1379. doi: 10.1002/lno.11393
Keywords: Yellow River estuary, macrofauna, ecological quality, multiple pollutants, indicator species, composite index
Citation: Li W, Ye J, Gao X, Zhang Y, Li Y and Li H (2025) Integrated ecological quality assessment of the sea area adjacent to the Yellow River estuary under multiple pollutants. Front. Mar. Sci. 12:1542611. doi: 10.3389/fmars.2025.1542611
Received: 10 December 2024; Accepted: 10 February 2025;
Published: 26 February 2025.
Edited by:
Lingshi Yin, Hunan Agricultural University, ChinaReviewed by:
Mario Lepage, INRAE Nouvelle-Aquitaine Bordeaux, FranceCopyright © 2025 Li, Ye, Gao, Zhang, Li and Li. This is an open-access article distributed under the terms of the Creative Commons Attribution License (CC BY). The use, distribution or reproduction in other forums is permitted, provided the original author(s) and the copyright owner(s) are credited and that the original publication in this journal is cited, in accordance with accepted academic practice. No use, distribution or reproduction is permitted which does not comply with these terms.
*Correspondence: Jinqing Ye, anF5ZUBubWVtYy5vcmcuY24=; Hongjun Li, aGpsaUBubWVtYy5vcmcuY24=
Disclaimer: All claims expressed in this article are solely those of the authors and do not necessarily represent those of their affiliated organizations, or those of the publisher, the editors and the reviewers. Any product that may be evaluated in this article or claim that may be made by its manufacturer is not guaranteed or endorsed by the publisher.
Research integrity at Frontiers
Learn more about the work of our research integrity team to safeguard the quality of each article we publish.