 Jinxing Shen
 Wenlong Gao1
 Xuejun Feng
94% of researchers rate our articles as excellent or good
Learn more about the work of our research integrity team to safeguard the quality of each article we publish.
Find out more
REVIEW article
Front. Mar. Sci., 18 February 2025
Sec. Marine Affairs and Policy
Volume 12 - 2025 | https://doi.org/10.3389/fmars.2025.1542255
This article is part of the Research TopicChallenges and Opportunities for Decarbonizing the Maritime IndustryView all 8 articles
Greenhouse gas (GHG) emissions from ports have gained increasing attention due to their significant impact on climate change. Nevertheless, the existing research in this domain remains fragmented, with limited generalizable findings. To address this gap, an integrative framework is proposed in this study to systematically review the literature and identify future research directions. Using the Web of Science database, a bibliometric analysis of 230 documents and an in-depth review of 68 studies are conducted, focusing on emission sources, emission calculations, and abatement technologies. Key findings can be drawn as follows: (1) Research on port-related GHG emissions has expanded rapidly since the Paris Agreement, but international collaboration and institutional coordination remain insufficient, hindering the development of comprehensive solutions. (2) Inconsistent classification of GHG emission sources across studies leads to biases and limits comparability. Reclassifying emissions based on equipment operation locations could improve both accuracy and cross-study alignment. (3) Activity-based approaches are the primary methods for emissions assessment but heavily rely on static emission factor datasets, particularly for container ports. Expanding these datasets for diverse port types, updating localized factors in real-time, and integrating alternative energy sources can enhance adaptability and accuracy. (4) Current mitigation strategies focus on technological innovations, energy substitution, and operational optimization. However, limitations such as high implementation costs, slow commercialization, and insufficient policy support continue to impede progress. To achieve zero-carbon port operations, future research should prioritize the integration of technical innovations with economic and policy frameworks. A multidisciplinary approach is essential for overcoming current barriers and promoting sustainable practices in port management.
Ports are essential hubs in the logistics supply chain, facilitating swift regional trade and socio-economic advancement (Xu et al., 2024a). However, port operations (e.g., loading, unloading, storage, and transportation) are energy-intensive, generating significant greenhouse gas (GHG) emissions. These emissions contribute to climate change and cause health risks to port workers, which would potentially impact job satisfaction and undermine the overall efficiency of port activities (Jiang et al., 2017). In 2023, the shipping sector accounted for 3% of global GHG emissions (UNCTD, 2024). In response, governments and organizations have established various ambitious decarbonization objectives to support low-carbon and sustainable port development. For example, in 2020, the Chinese government announced a target to peak carbon emissions by 2030 and achieve carbon neutrality by 2060 (Wang and Li, 2023). Similarly, the International Maritime Organization (IMO) developed a strategy aimed at cutting annual GHG emissions from the shipping industry by 70%–80% by 2040 compared to 2008 and reaching net zero GHG emissions by approximately 2050 (IMO, 2023). Furthermore, the International Association of Ports and Harbors (IAPH) has encouraged port authorities to prioritize the GHG reduction initiatives in response to the IMO’s decarbonization goals (IAPH, 2024).
Despite these global efforts, reducing GHG emissions from ports remains a challenging task, due to the diverse sources of GHG emissions and the intrinsic complexity of port operations. Earlier studies have explored various solutions, including shore power technologies, energy efficiency improvements, alternative fuels, and hybrid energy systems. Several review articles have synthesized findings to guide the selection of abatement technologies. For instance, Iris and Lam (2019) analyzed 146 studies to identify opportunities for improving energy efficiency in ports through operational strategies and technological innovations. Similarly, Alzahrani et al. (2021) reviewed 35 documents related to the decarbonization of seaports and examined the effects of renewable energy, smart control technologies, regulatory landscapes, etc., on the reduction in the seaport carbon emissions. Subsequently, Wang et al. (2023) reviewed 57 Chinese and 79 English publications to identify emission sources and evaluate the effectiveness of abatement technologies. Wang and Li (2023)reviewed 49 studies on methodologies for estimating carbon emissions, emphasizing the emission reduction technologies for ships, quay cranes, yard trucks, and yard cranes. More recently, Wang et al. (2024a) conducted a bibliometric analysis examining the characteristics, emission inventories, applications, and energy management approaches of shore power systems.
Although these previous reviews have advanced the understanding of port-related GHG emissions, they mainly focused on specific aspects such as emission sources, abatement technologies, or calculation methods. Such fragmented approaches limit the ability to analyze comprehensively the complex interaction among the characteristics, abatement strategies, and their effectiveness. Accordingly, this study aims to bridge such a gap by proposing an integrated framework combining bibliometric analysis and systematic review. Specifically, it aims to address the following issues. (1) What are the annual trends in research outcomes on GHG emissions from ports in the Web of Science database? Who are the leading authors in this field? Which journals focus on this area? What is the temporal evolutionary path of the research theme? (2) What are the identified sources of GHG emissions from ports within the existing studies? What methods are used to calculate GHG emissions? What strategies have been implemented to reduce GHG emissions? (3) What are the emerging trends in the evolution of research topics in this field? What gaps exist in the current research? What research directions should be focused on to reduce GHG emissions more effectively in future?
The remainder of the sections are organized as follows: Section 2 describes methodology and framework for the literature review. Section 3 addresses Issue 1 through the bibliometric analysis, focusing on trends, key contributors, and thematic evolution in the field of port GHG emissions. Subsequently, Section 4 addresses Issue 2 through a systematic review of further screened literature, which can provide comprehensive investigations of the emission sources, calculation methods, and abatement measures of GHG emissions from ports. Section 5 identifies research gaps and discusses future directions to address Issue 3. Finally, Section 6 concludes the study by summarizing key findings and contributions.
In this study, a framework that combines bibliometric analysis and systematic literature review is applied to provide a comprehensive and insightful analysis of the collected literature. As illustrated in Figure 1, the proposed research framework can be divided into 4 steps.
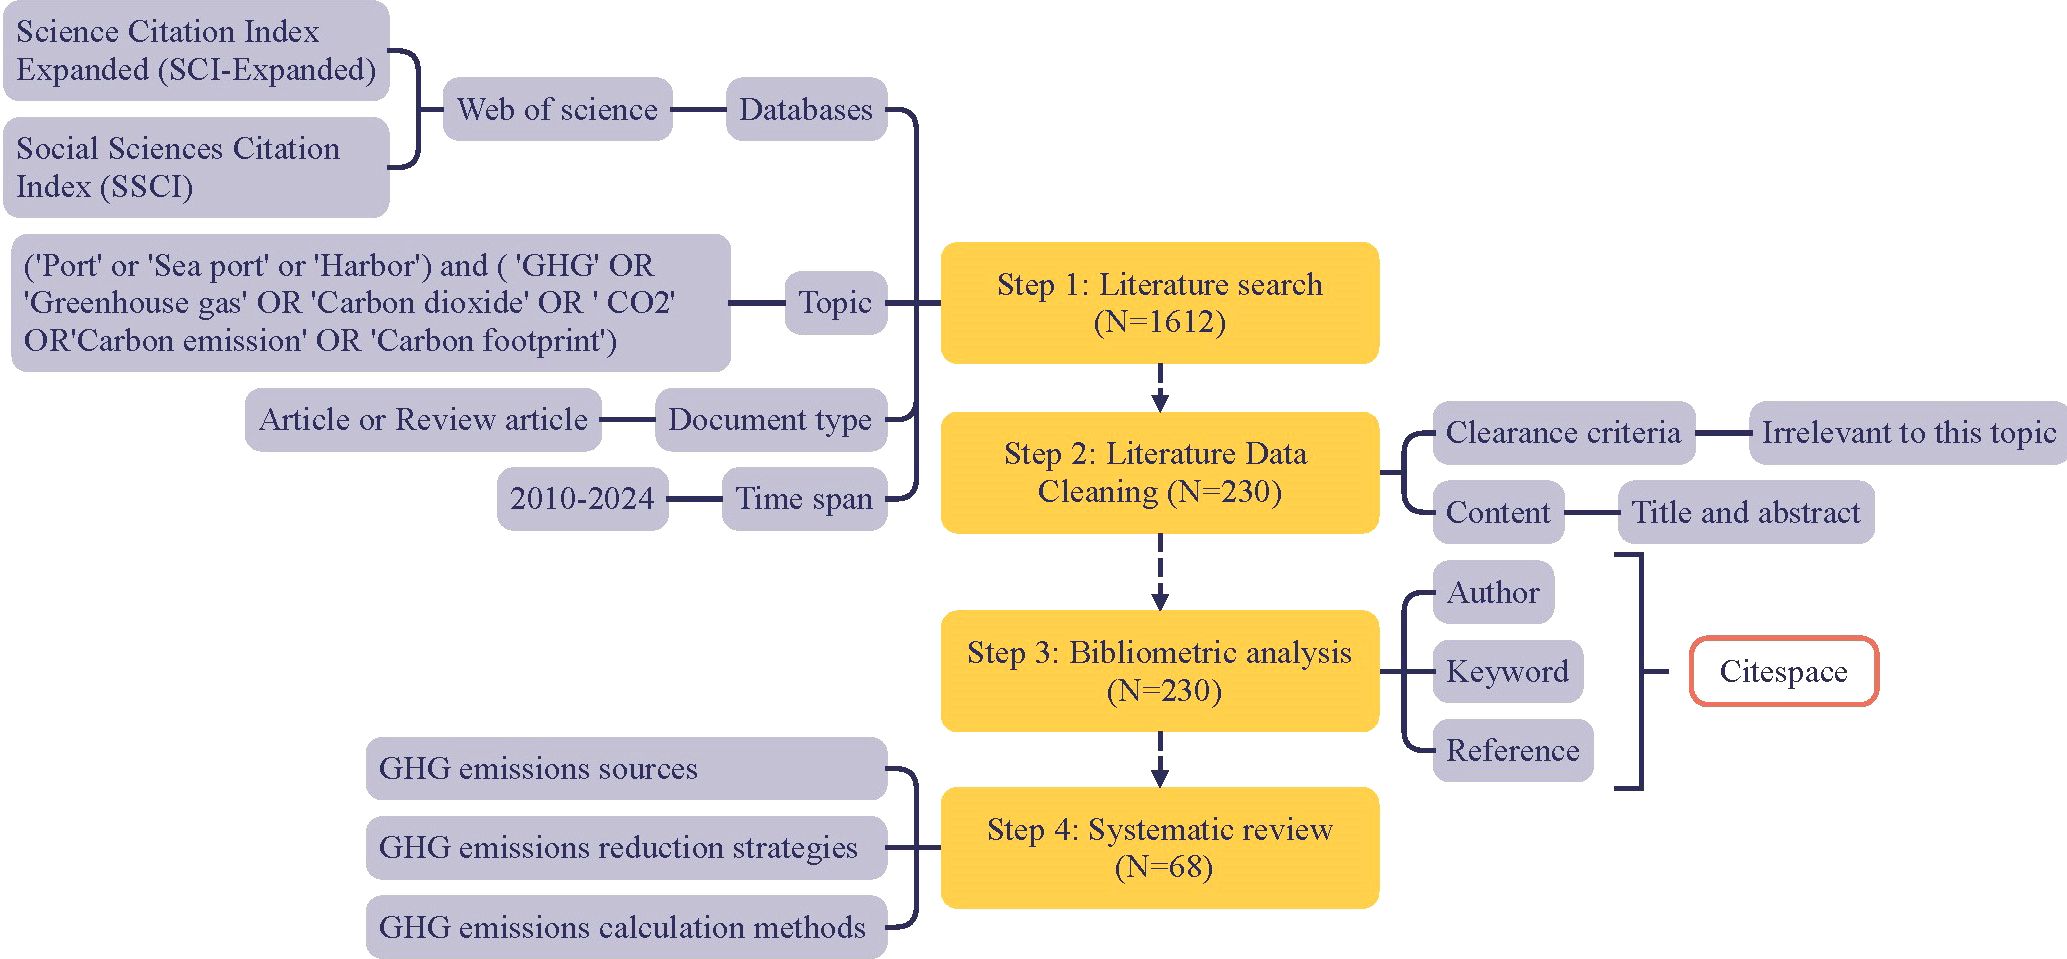
Figure 1. Flow chart of research framework (N is the number of literature).
In step 1, relevant topic terms were selected to retrieve detailed literature on GHG emissions from ports using the Web of Science (WoS) database. WoS was selected for its extensive collection of peer-reviewed, high-quality publications across multiple disciplines, including science, engineering, technology, and social sciences. Compared to other databases, WoS applies rigorous indexing standards, ensuring that credible and influential research is included. Given the multidisciplinary nature of the port-related GHG emissions research, spanning the fields like science, technology, engineering, and social sciences, the search was confined to the Science Citation Index Expanded and Social Science Citation Index to ensure high-quality results. Moreover, to capture a broad range of studies, the search terms have included keywords related to ‘port’ (e.g., port, seaport, and harbor) and ‘GHG’ (e.g., GHG, greenhouse gas, carbon dioxide, CO2, carbon emission, and carbon footprint). The search was limited to journal articles published between January 1, 2010, and August 31, 2024, to focus on the relevant findings, resulting in the identification of 1,612 articles. In step 2, the retrieved articles were then screened based on their titles, abstracts, and research areas. Articles unrelated to GHG emissions or port operations were excluded. Accordingly, the dataset was refined to 230 articles, which were subsequently bibliometrically analyzed in Step 3. CiteSpace was selected as the bibliometric tool for its advanced capabilities in visualizing co-citation networks and identifying emerging trends. Compared to other tools like VOSviewer (Jiang et al., 2020), which primarily focus on clustering and simpler visualizations, CiteSpace offers unique advantages, such as highlighting the temporal progression of research themes and identifying citation bursts. These features make it particularly effective for analyzing the dynamics of a rapidly evolving field like port-related GHG emissions. The analysis was conducted using CiteSpace 6.4.R1 (64-bit, advanced edition), including the enhanced features and improved compatibility for handling large datasets. Based on the findings of the bibliometric analysis, 68 significant articles were selected for an in-depth systematic review in step 4. The selection criteria for this stage included: (1) The literature should incorporate at least one element related to GHG emission resources, calculation methods, and reduction measures. (2) When multiple studies addressed similar topics, preference was given to the most recent publications in high-impact journals to ensure the inclusion of up-to-date and authoritative findings. This systematic review can facilitate a thorough analysis of high-quality and relevant literature, providing valuable insights into port-related GHG emissions and guidance for future research directions.
Over the past 15 years, the annual publication trends of 230 papers on GHG emissions from ports were analyzed, as shown in Figure 2. A clear turning point in the number of papers on GHG emissions from ports was evident between 2016 and 2017. Before 2016, GHG emissions from ports appeared to receive limited attention, with a peak of only 5 papers published in 2014. In contrast, following the Paris Agreement signed in 2016, research in this area surged in 2017. The agreement mandated substantial action from most nations to combat climate change. From 2017 to 2023, the number of published papers increased over five times during a seven-year span. Notably, the number of publications in 2024 was reduced to about 80% of the 2023 total. Considering that the dataset only includes papers published up to August 2024, it is reasonable to anticipate that the total number of papers in 2024 will surpass that of 2023.
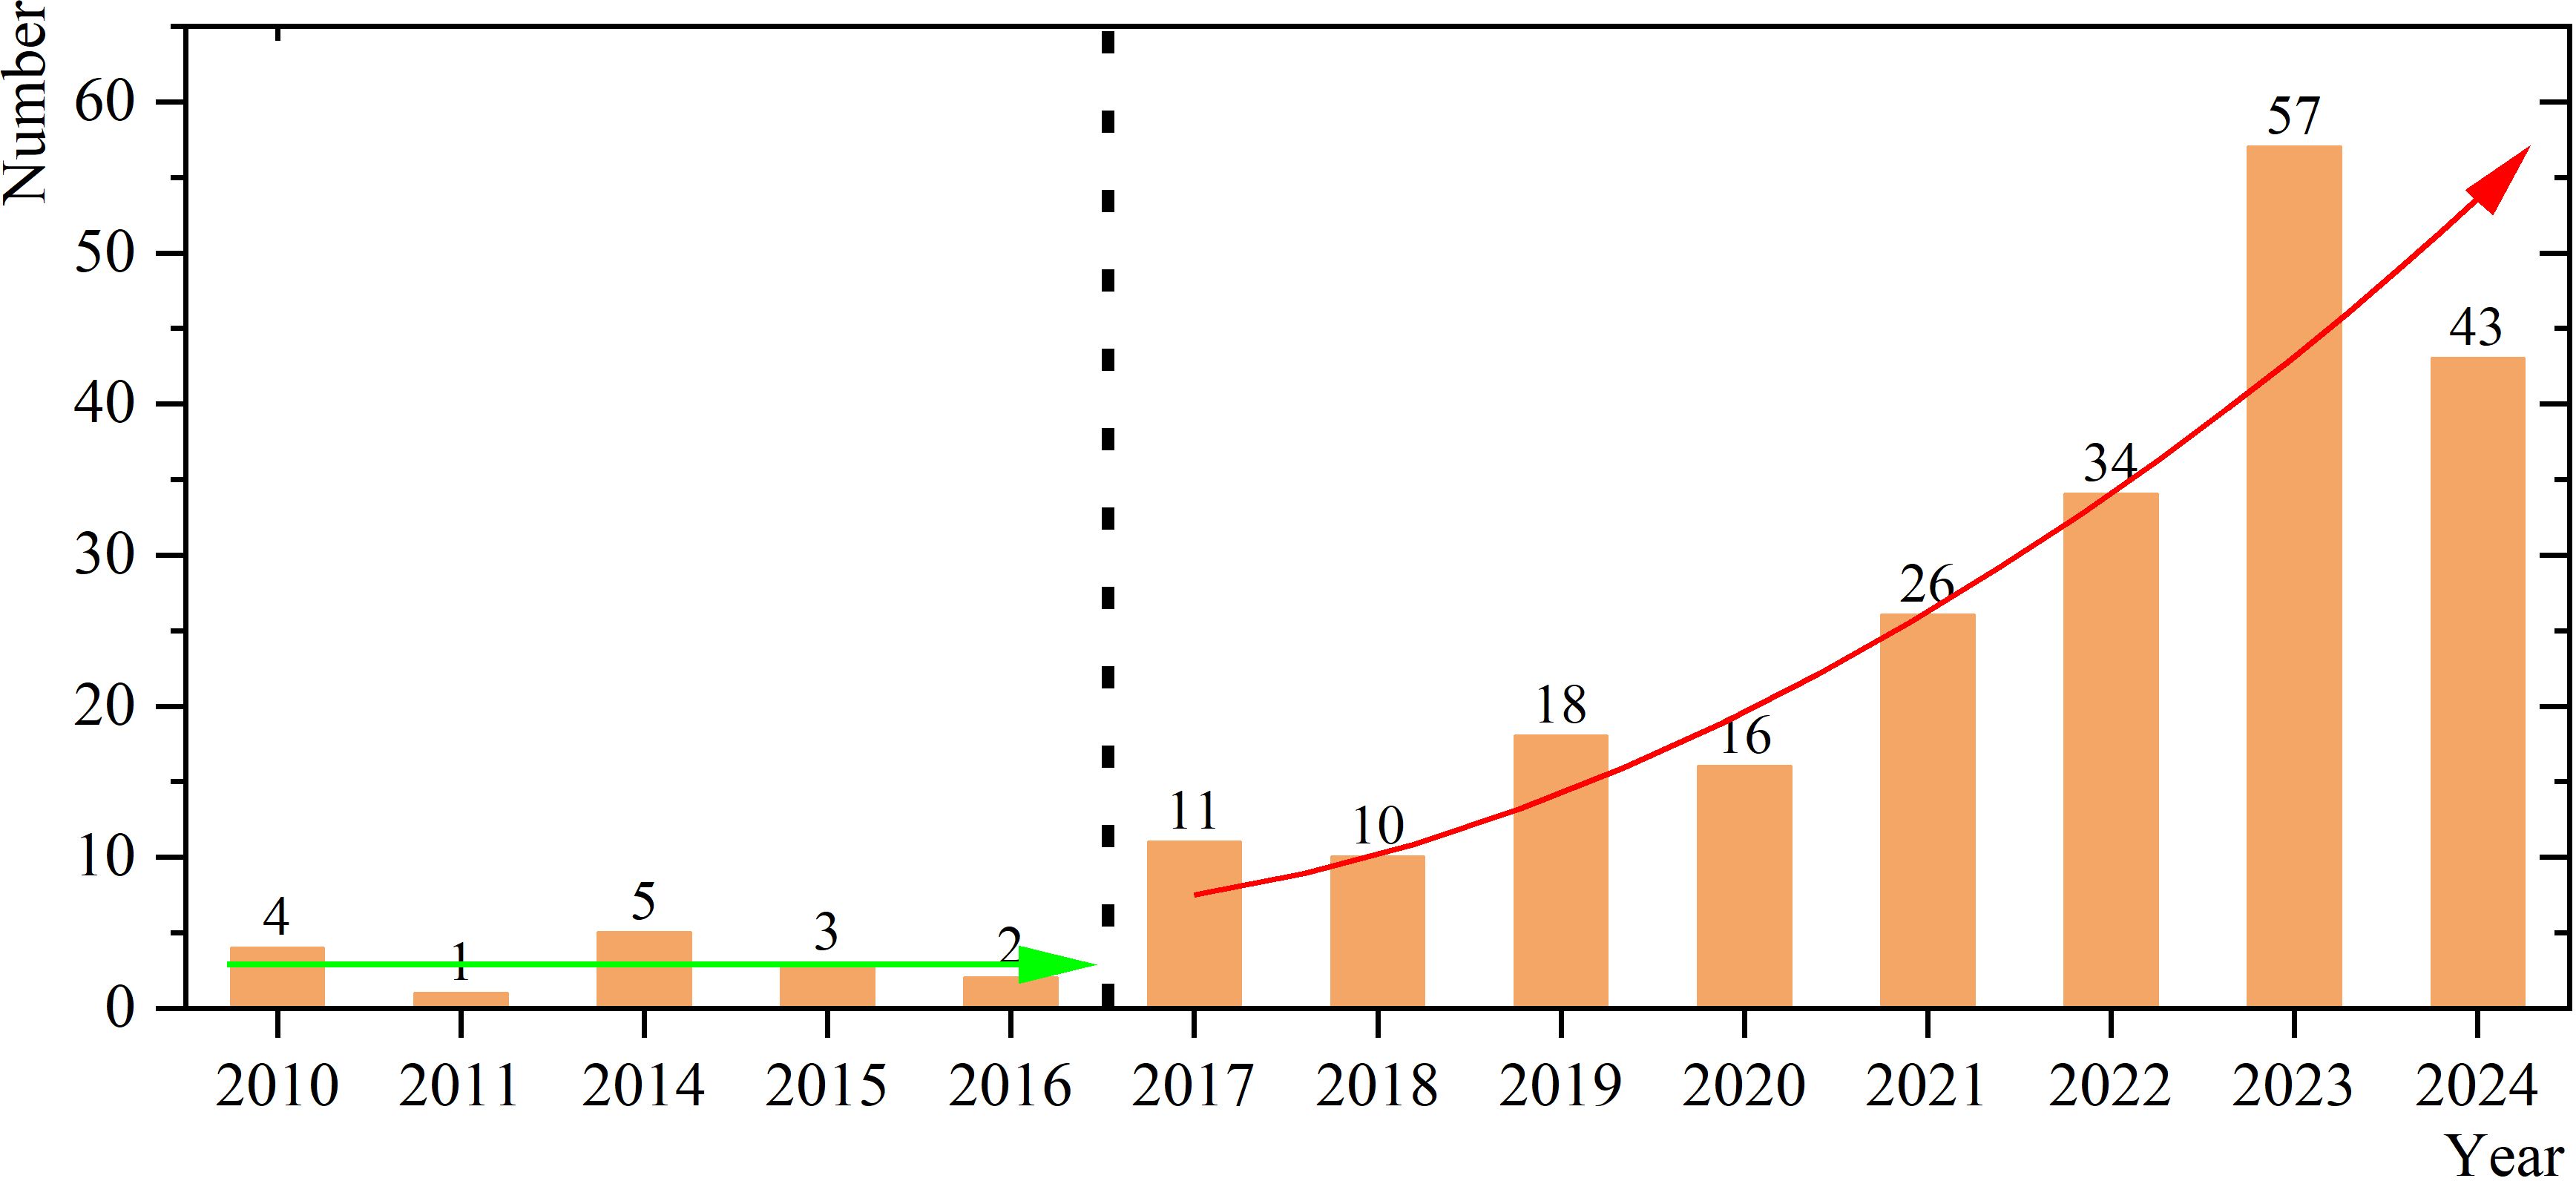
Figure 2. Annual trends in publication numbers from 2010 to 2024.
There were 765 authors on these papers, with the top 5 authors ranked in Table 1 in terms of the total number of publications and citations. Most of these authors are Chinese scholars. Specifically, regarding the ranking of the document numbers, all of them are from China, except for Gonzalo Fernandez-Sanchez, a Spanish scholar with 4 papers. Among the Chinese scholars, Lu Zhen ranked first with 7 publications, followed by Wenyuan Wang with 6 papers. However, the citation rankings highlight opportunities for improvement among Chinese scholars. The two foremost researchers, Cagatay Iris from the UK and Jasmine Siu Lee Lam from Denmark, each authored three publications, accumulating nearly 400 citations.

Table 1. Ranking of authors according to publications and citations.
The analysis of author collaborations found limited cooperation among scholars from different countries and regions. Among them, the largest collaborative network includes only 24 authors, as shown in Figure 3.
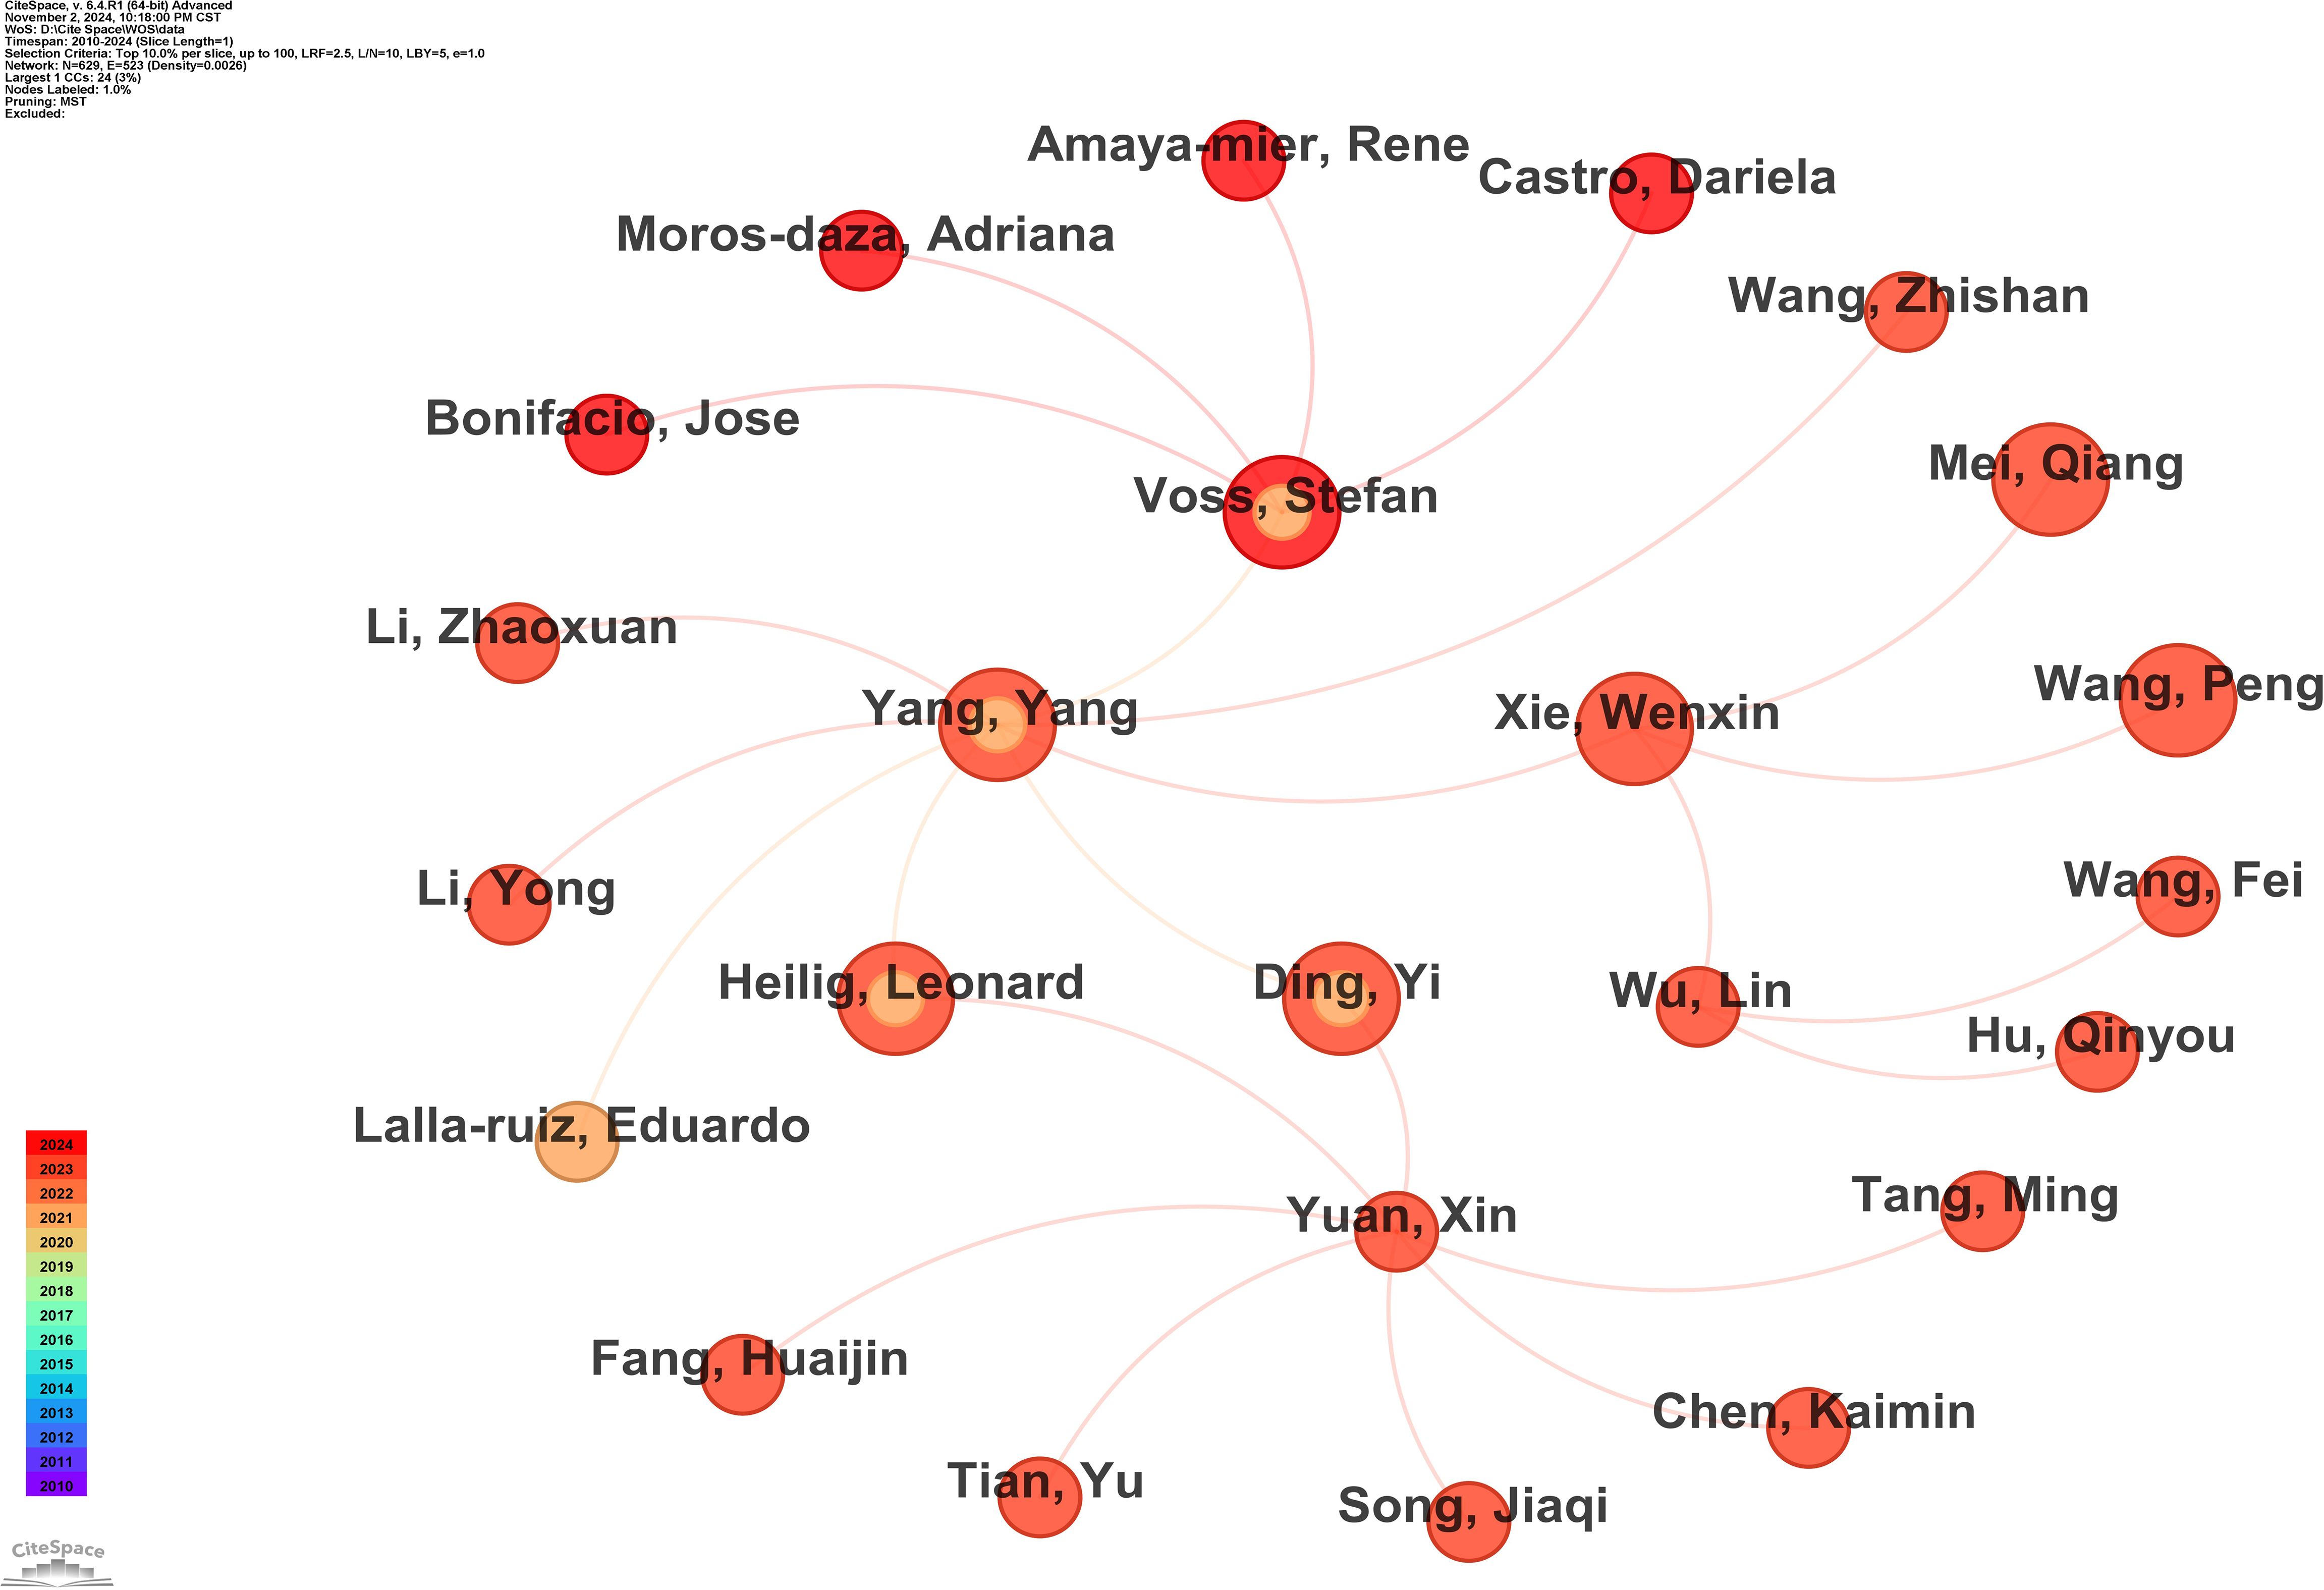
Figure 3. Cooperation networks between authors.
The node size is proportional to the number of published articles, while the color of each circle within the node indicates the average publication time of the article. As shown in Figure 3, Yang Yang and Stefan Voss hold central positions in the cooperation network. In recent years, they have consistently published on this topic and actively collaborated with other researchers. Figure 4 shows that 50 research institutes focus on GHG emissions from ports, and 15 of them form the largest cooperation networks.
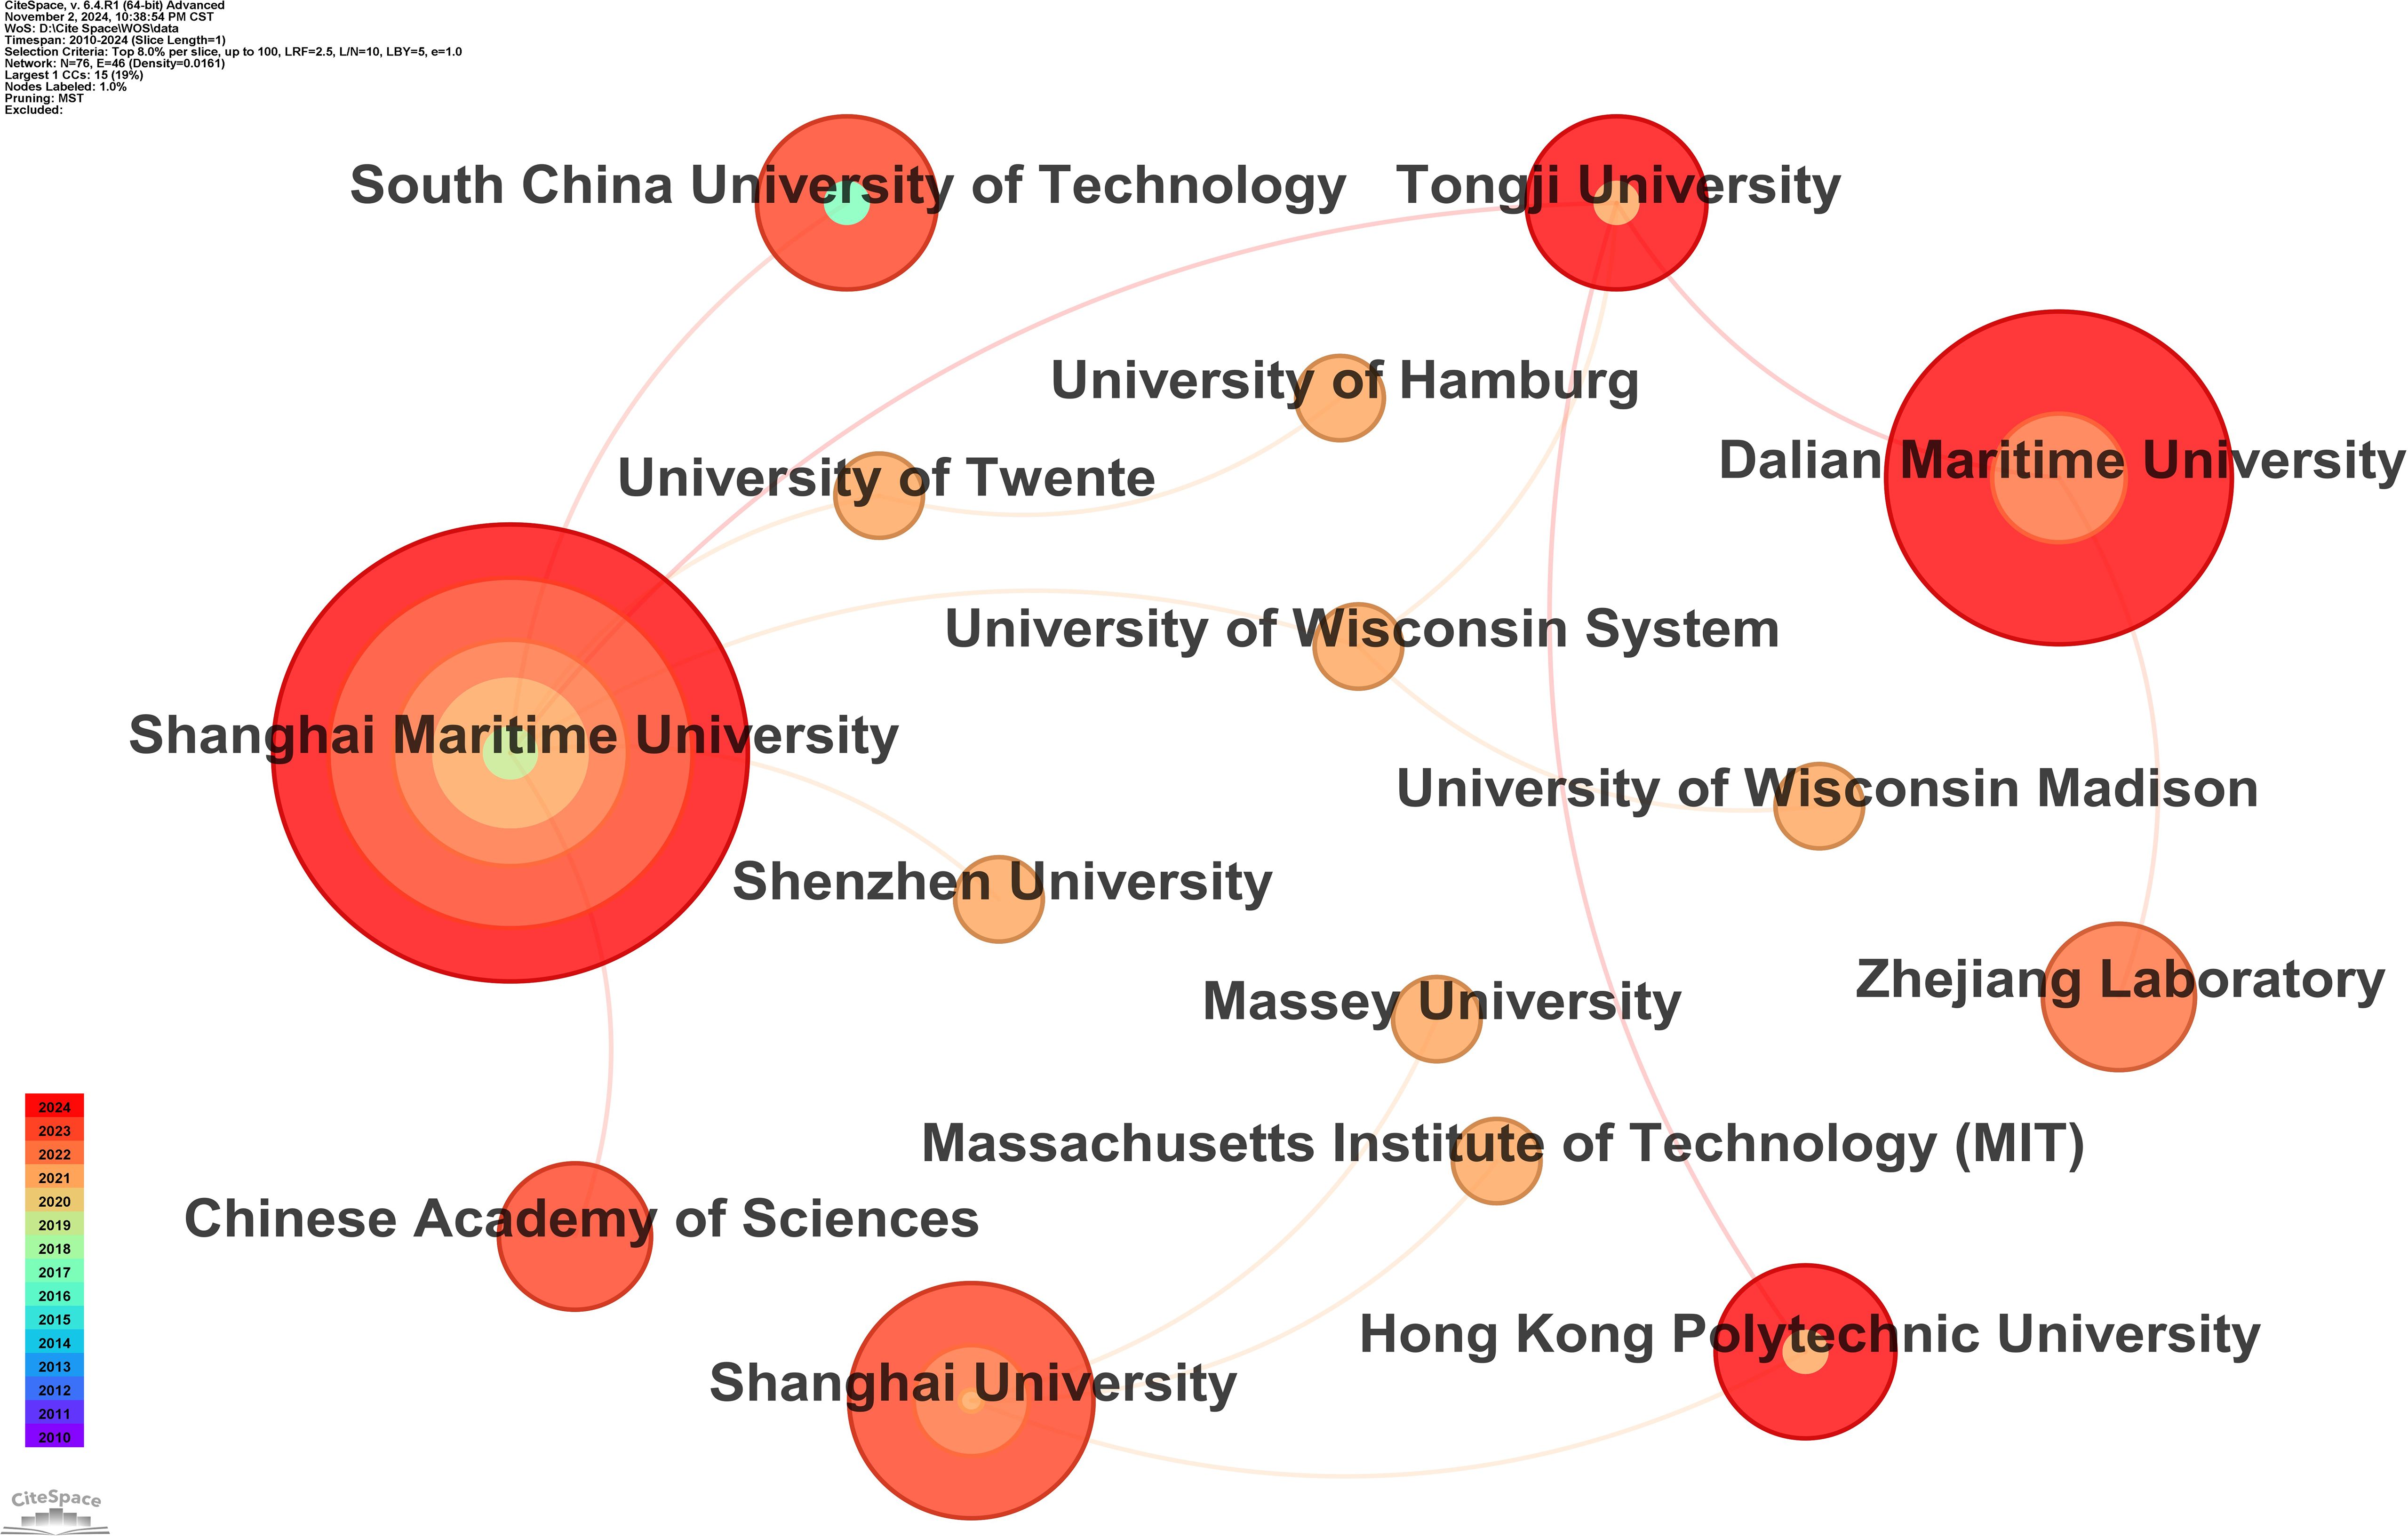
Figure 4. Cooperation networks between organizations.
It is evident that Shanghai Maritime University leads in publication volume with 32 papers. Its consistent output across different periods demonstrates sustained research productivity. The university has established strong collaborations with notable institutions such as the University of Twente, Shenzhen University, the Chinese Academy of Sciences, and the South China University of Technology. Dalian Maritime University and Dalian University of Technology rank second and third in publication volume, with 19 and 11 papers, respectively. Despite its significant contribution, Dalian University of Technology has a distinct research focus that diverges from the research interest of other institutions in this collaboration network. In contrast, Shanghai University, with a total of nine publications, ranks third, highlighting its notable research contributions in this domain.
A review of public sources indicates that these papers were published across 88 journals. Notably, there is significant variation in the number of papers published by different journals. Specifically, Sustainability published 30 papers, ranking first and approximately double the output of the Journal of Cleaner Production, which ranked second with 16 papers. Journals ranked 3rd to 5th in publication volume are Journal of Marine Science & Engineering (15 papers), Maritime Policy & Management (11 papers), and Ocean & Coastal Management (9 papers).
Further analysis revealed that these documents were cited by papers published in 310 journals, with the largest cooperation network comprising 27 journals, as shown in Figure 5. The node size in the figure represents citation intensity, with larger nodes indicating higher levels of citations. The color coding of the various node circles corresponds to the citation period. It is evident that Journal of Cleaner Production, Transportation Research Part D, Maritime Policy & Management, Energy Policy, and European Journal of Operational Research are the journals that have been consistently focused on and cited.
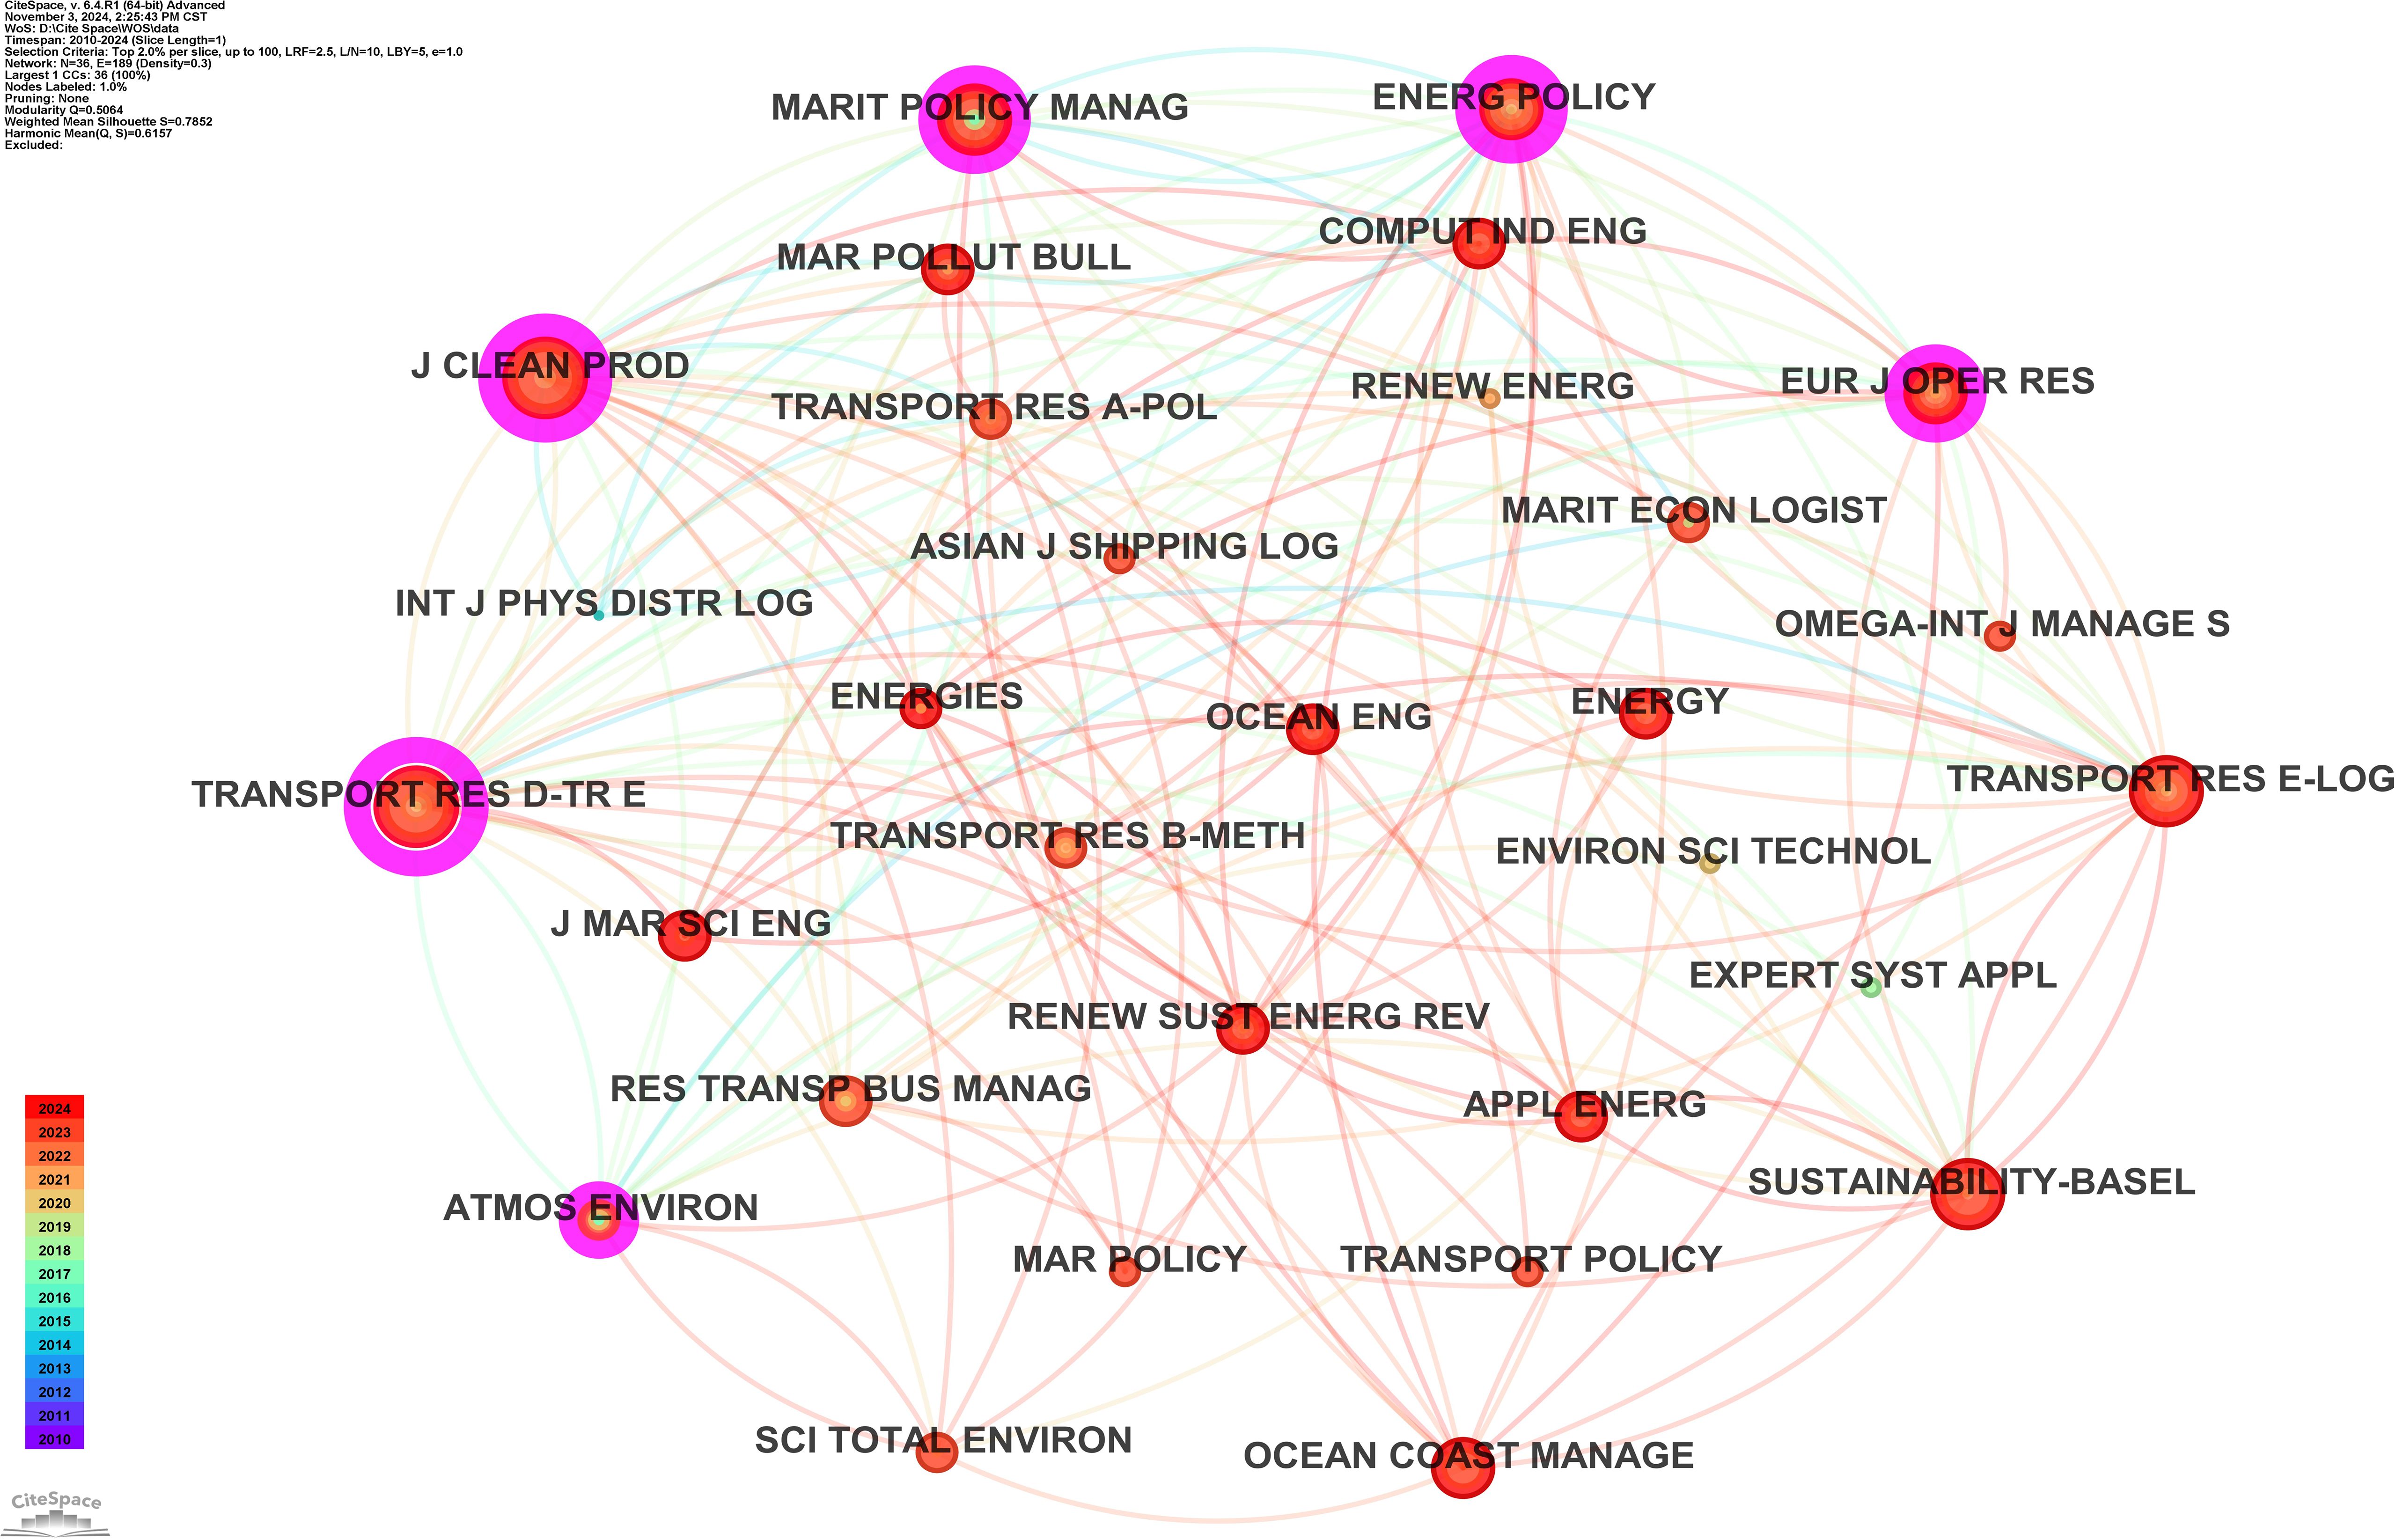
Figure 5. Cooperation networks between citation journals.
Keywords typically represent research interests, fields, objects, topics, and methods, forming the basis for analyzing the research hotspots. A total of 1159 keywords were extracted from these papers. By examining the co-occurrences and associations of these keywords, the largest connection network comprising 27 keywords was generated, as shown in Figure 6. Particularly, the keywords ‘greenhouse gas emissions,’ ‘green ports,’ and ‘shore power’ appeared with the highest frequency. Besides, the keywords ‘greenhouse gas emissions,’ ‘green ports,’ ‘shore power,’ ‘emission calculation,’ ‘carbon taxation,’ and ‘container ports’ are identified as crucial nodes with high centrality in the network (highlighted by purple circles), linking various research topics.
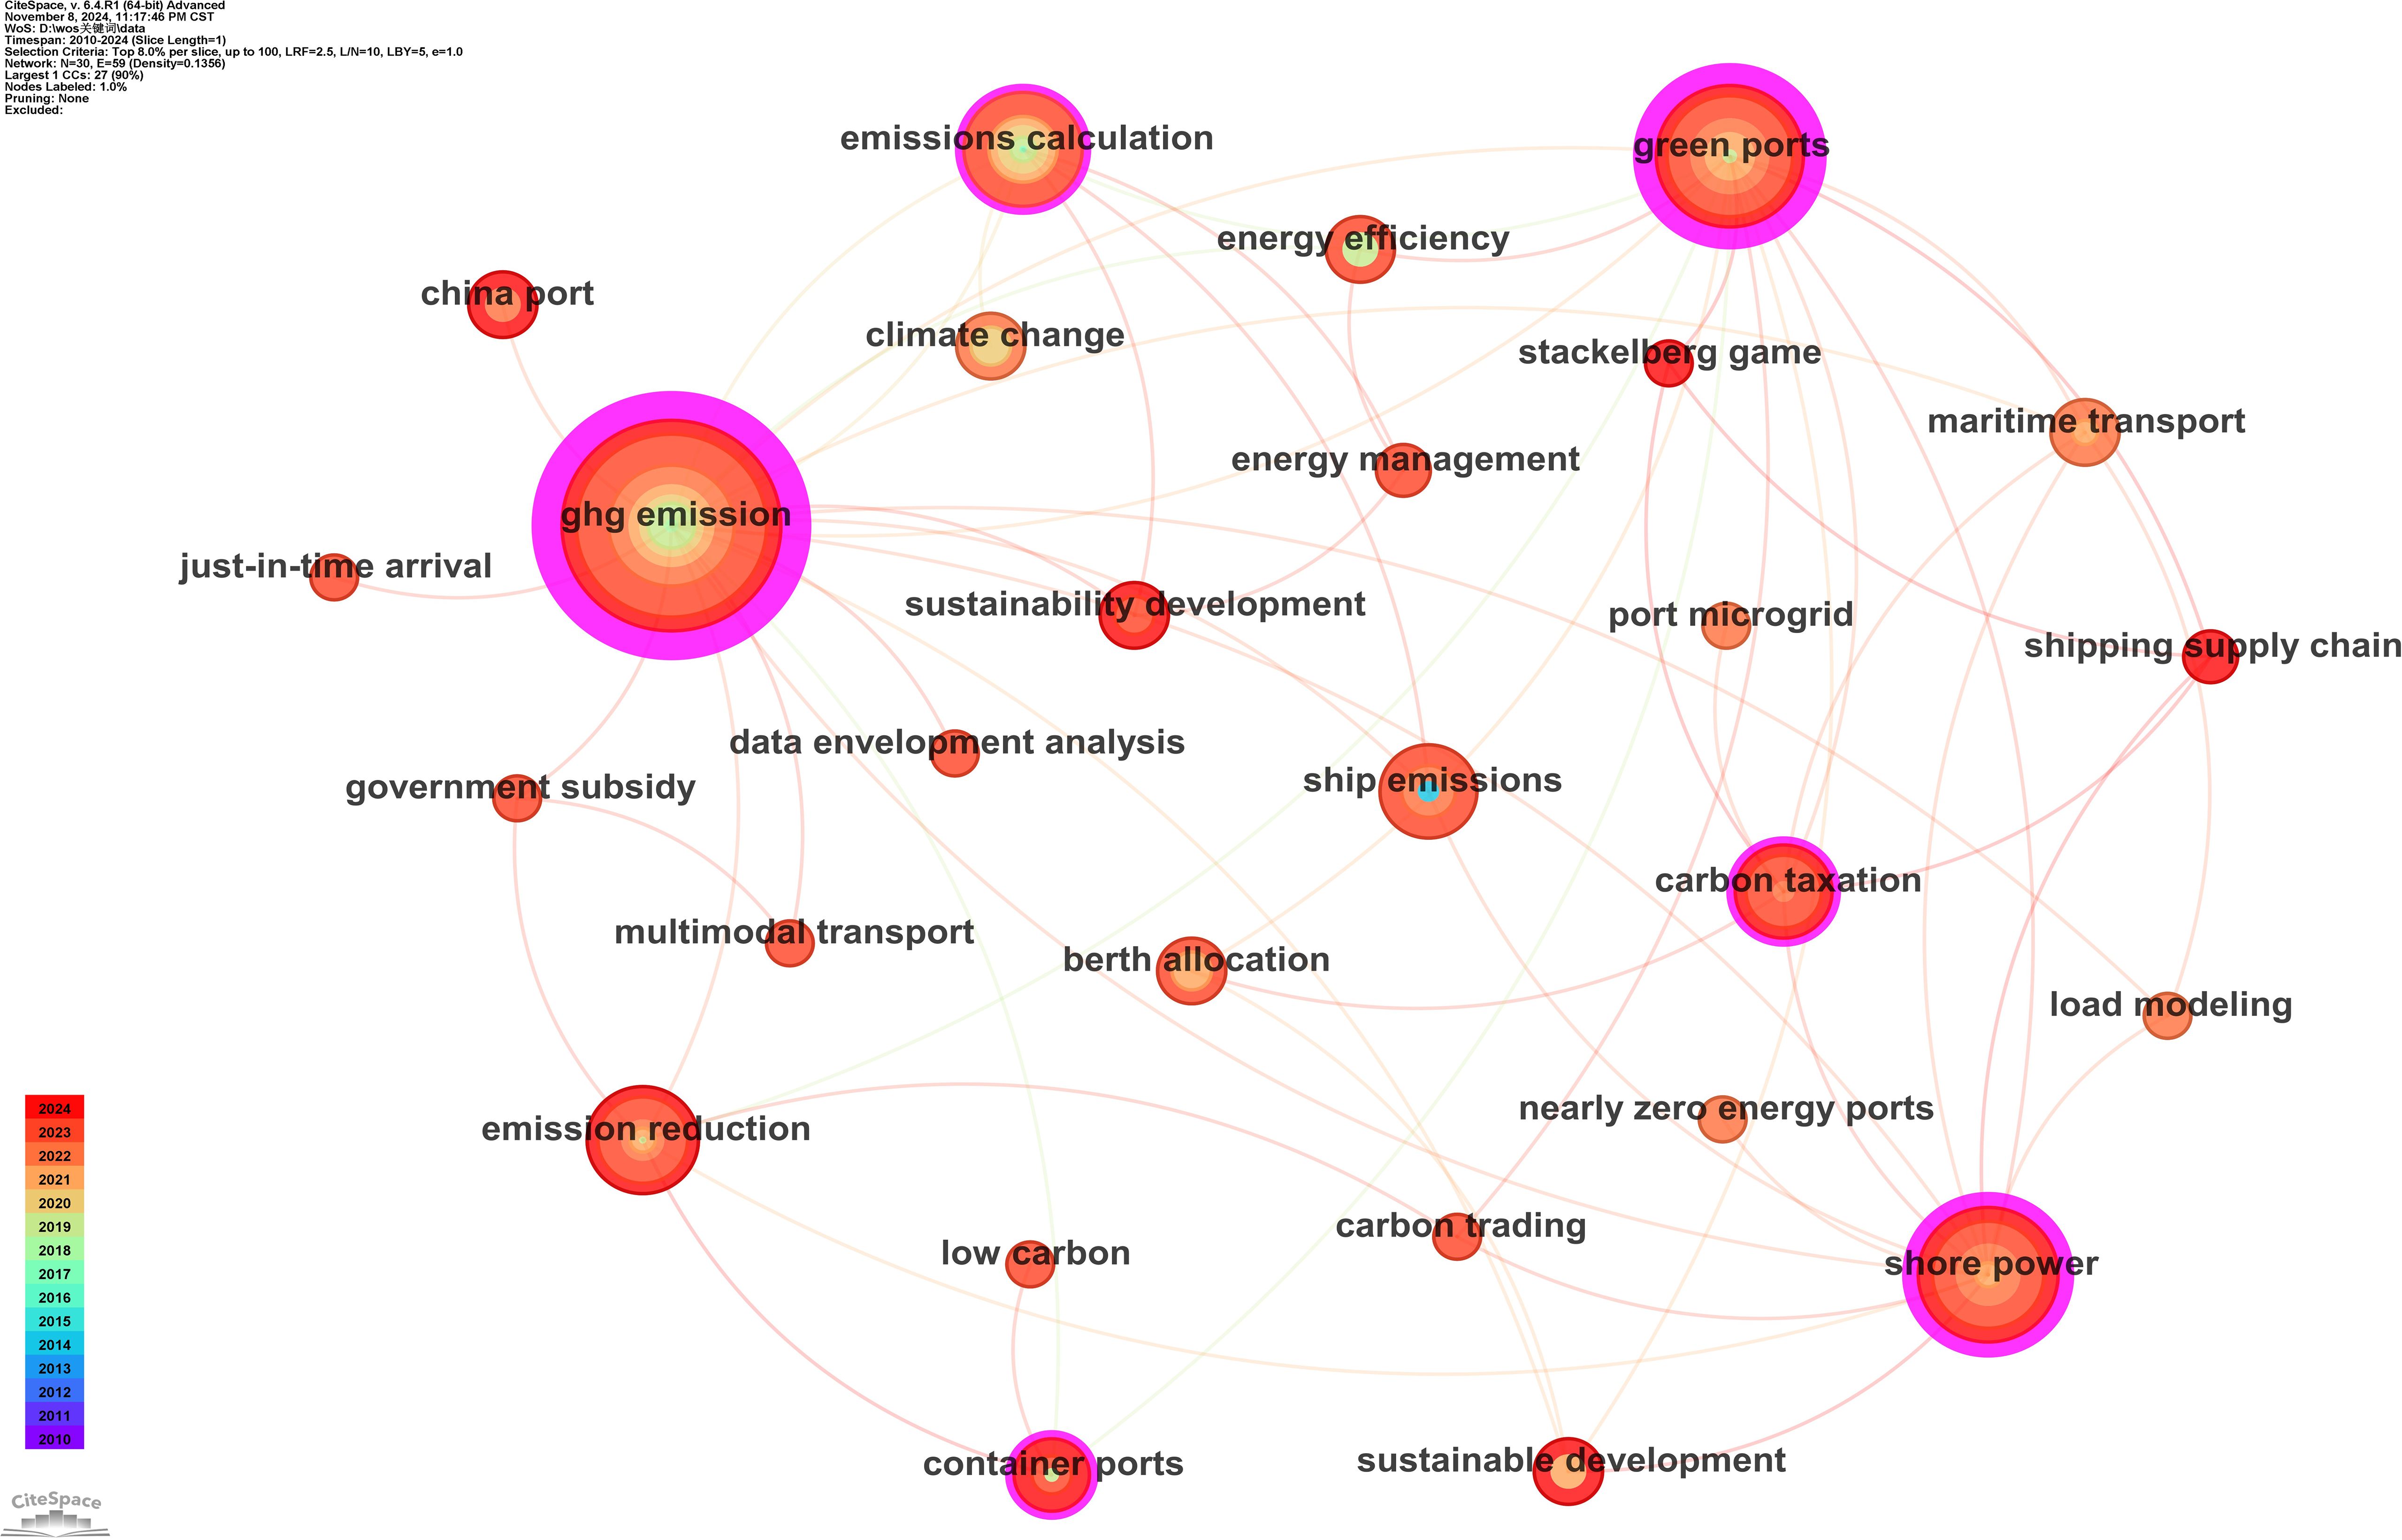
Figure 6. Connection network for keyword co-occurrence.
Given the fragmented nature of research topics in this field, Figure 6 illustrates that the largest co-occurring network of keywords comprises only 27 nodes. To further analyze the focus and current state of various topics, the keywords were clustered. As shown in Figure 7, the five most prominent clusters were selected.
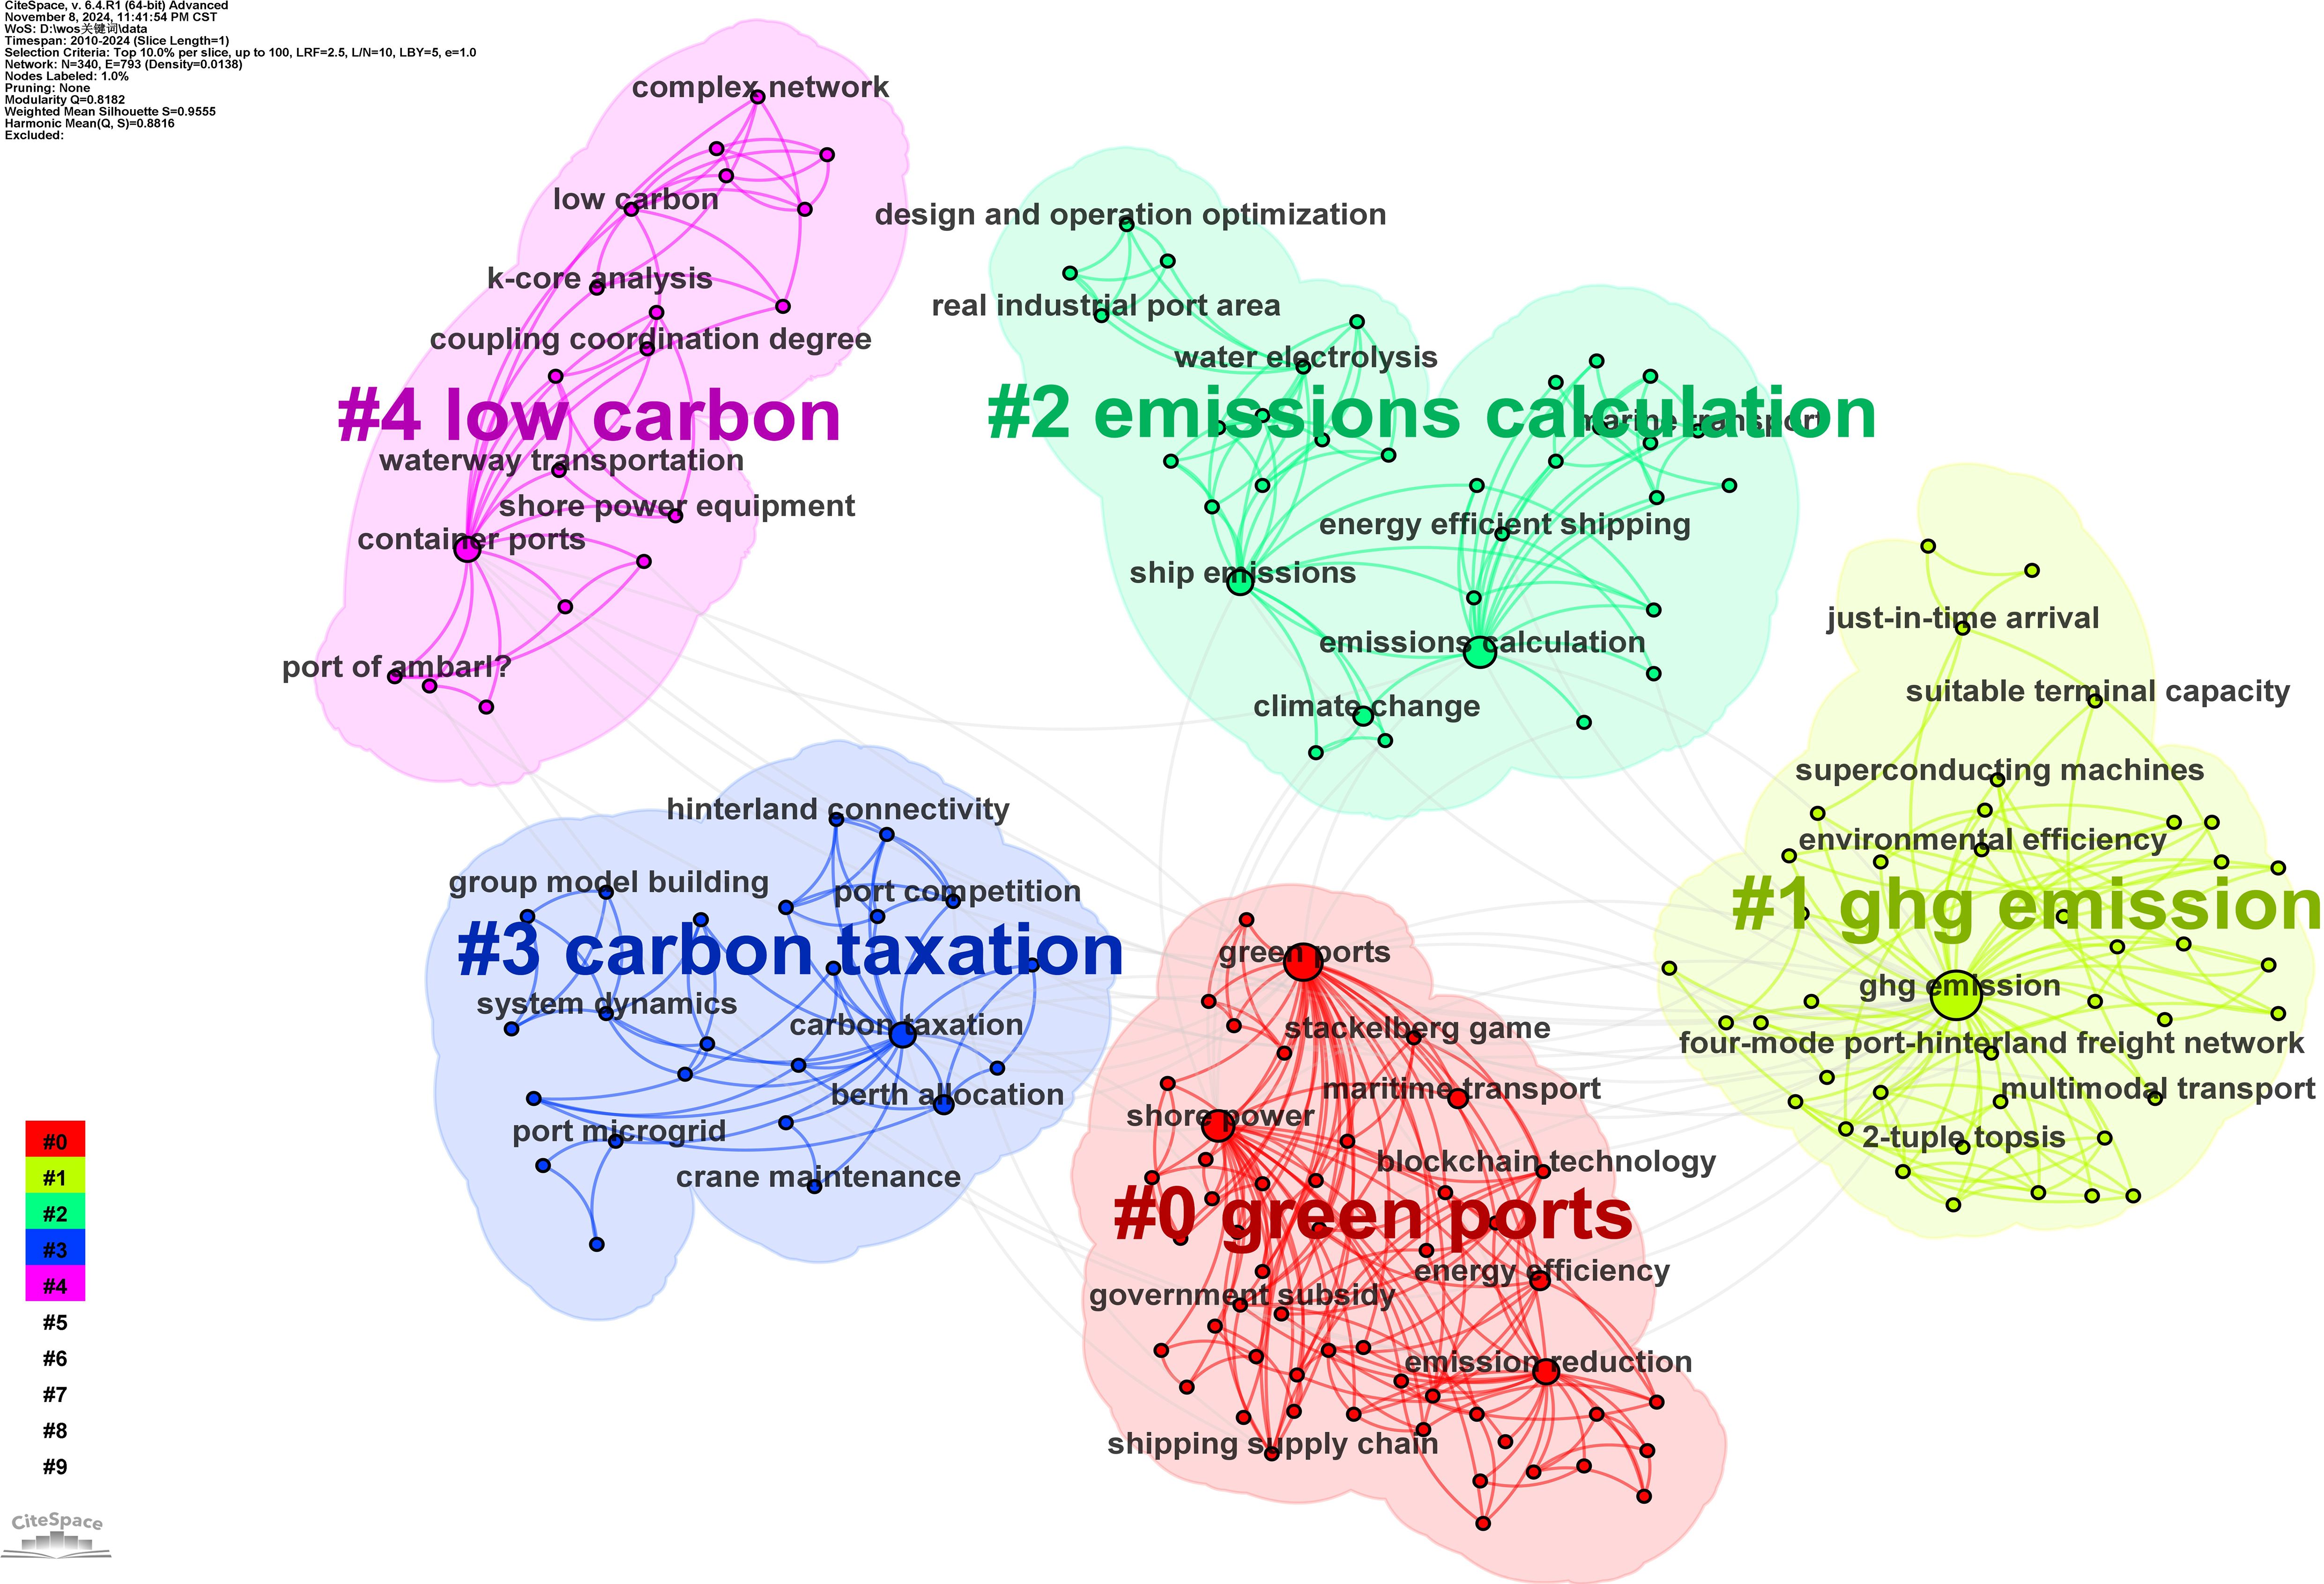
Figure 7. Visualization results of keyword clusters.
As shown in Figure 7, the red cluster (#0) is labeled as ‘green ports.’ Studies in this category have extensively explored shore power, covering topics such as its utilization and installation costs, energy efficiency, government subsidies, and carbon taxes. The yellow cluster (#1), labeled ‘ghg emission’, focuses on environmental efficiency, multimodal transport, suitable terminal capacity, etc. Cluster #2 is represented by green and labeled as ‘emissions calculation.’ Its primary focus is on ship emissions and energy efficiency, with a goal of optimizing design and operation. Cluster #3 is represented by blue and labeled as the keyword ‘carbon tax,’ which refers to a special tax based on total GHG emissions that aims to incentivize ports to reduce GHG emissions (e.g., berth allocation and port microgrid) and promote energy transformation through economic strategy. It not only effectively reduces GHG emissions but also provides financial support for constructing and maintaining low-carbon facilities (e.g., cranes) in ports, making it a crucial tool for improving ports’ competitiveness. Besides, the purple cluster (#4) is associated with ‘low carbon.’ Studies in this cluster mainly focus on low-carbon technologies for container terminals, with particular attention to shore power, the coupling coordination of various technologies, and their empirical application. Accordingly, Figure 8 illustrates the temporal evolution of various research themes.
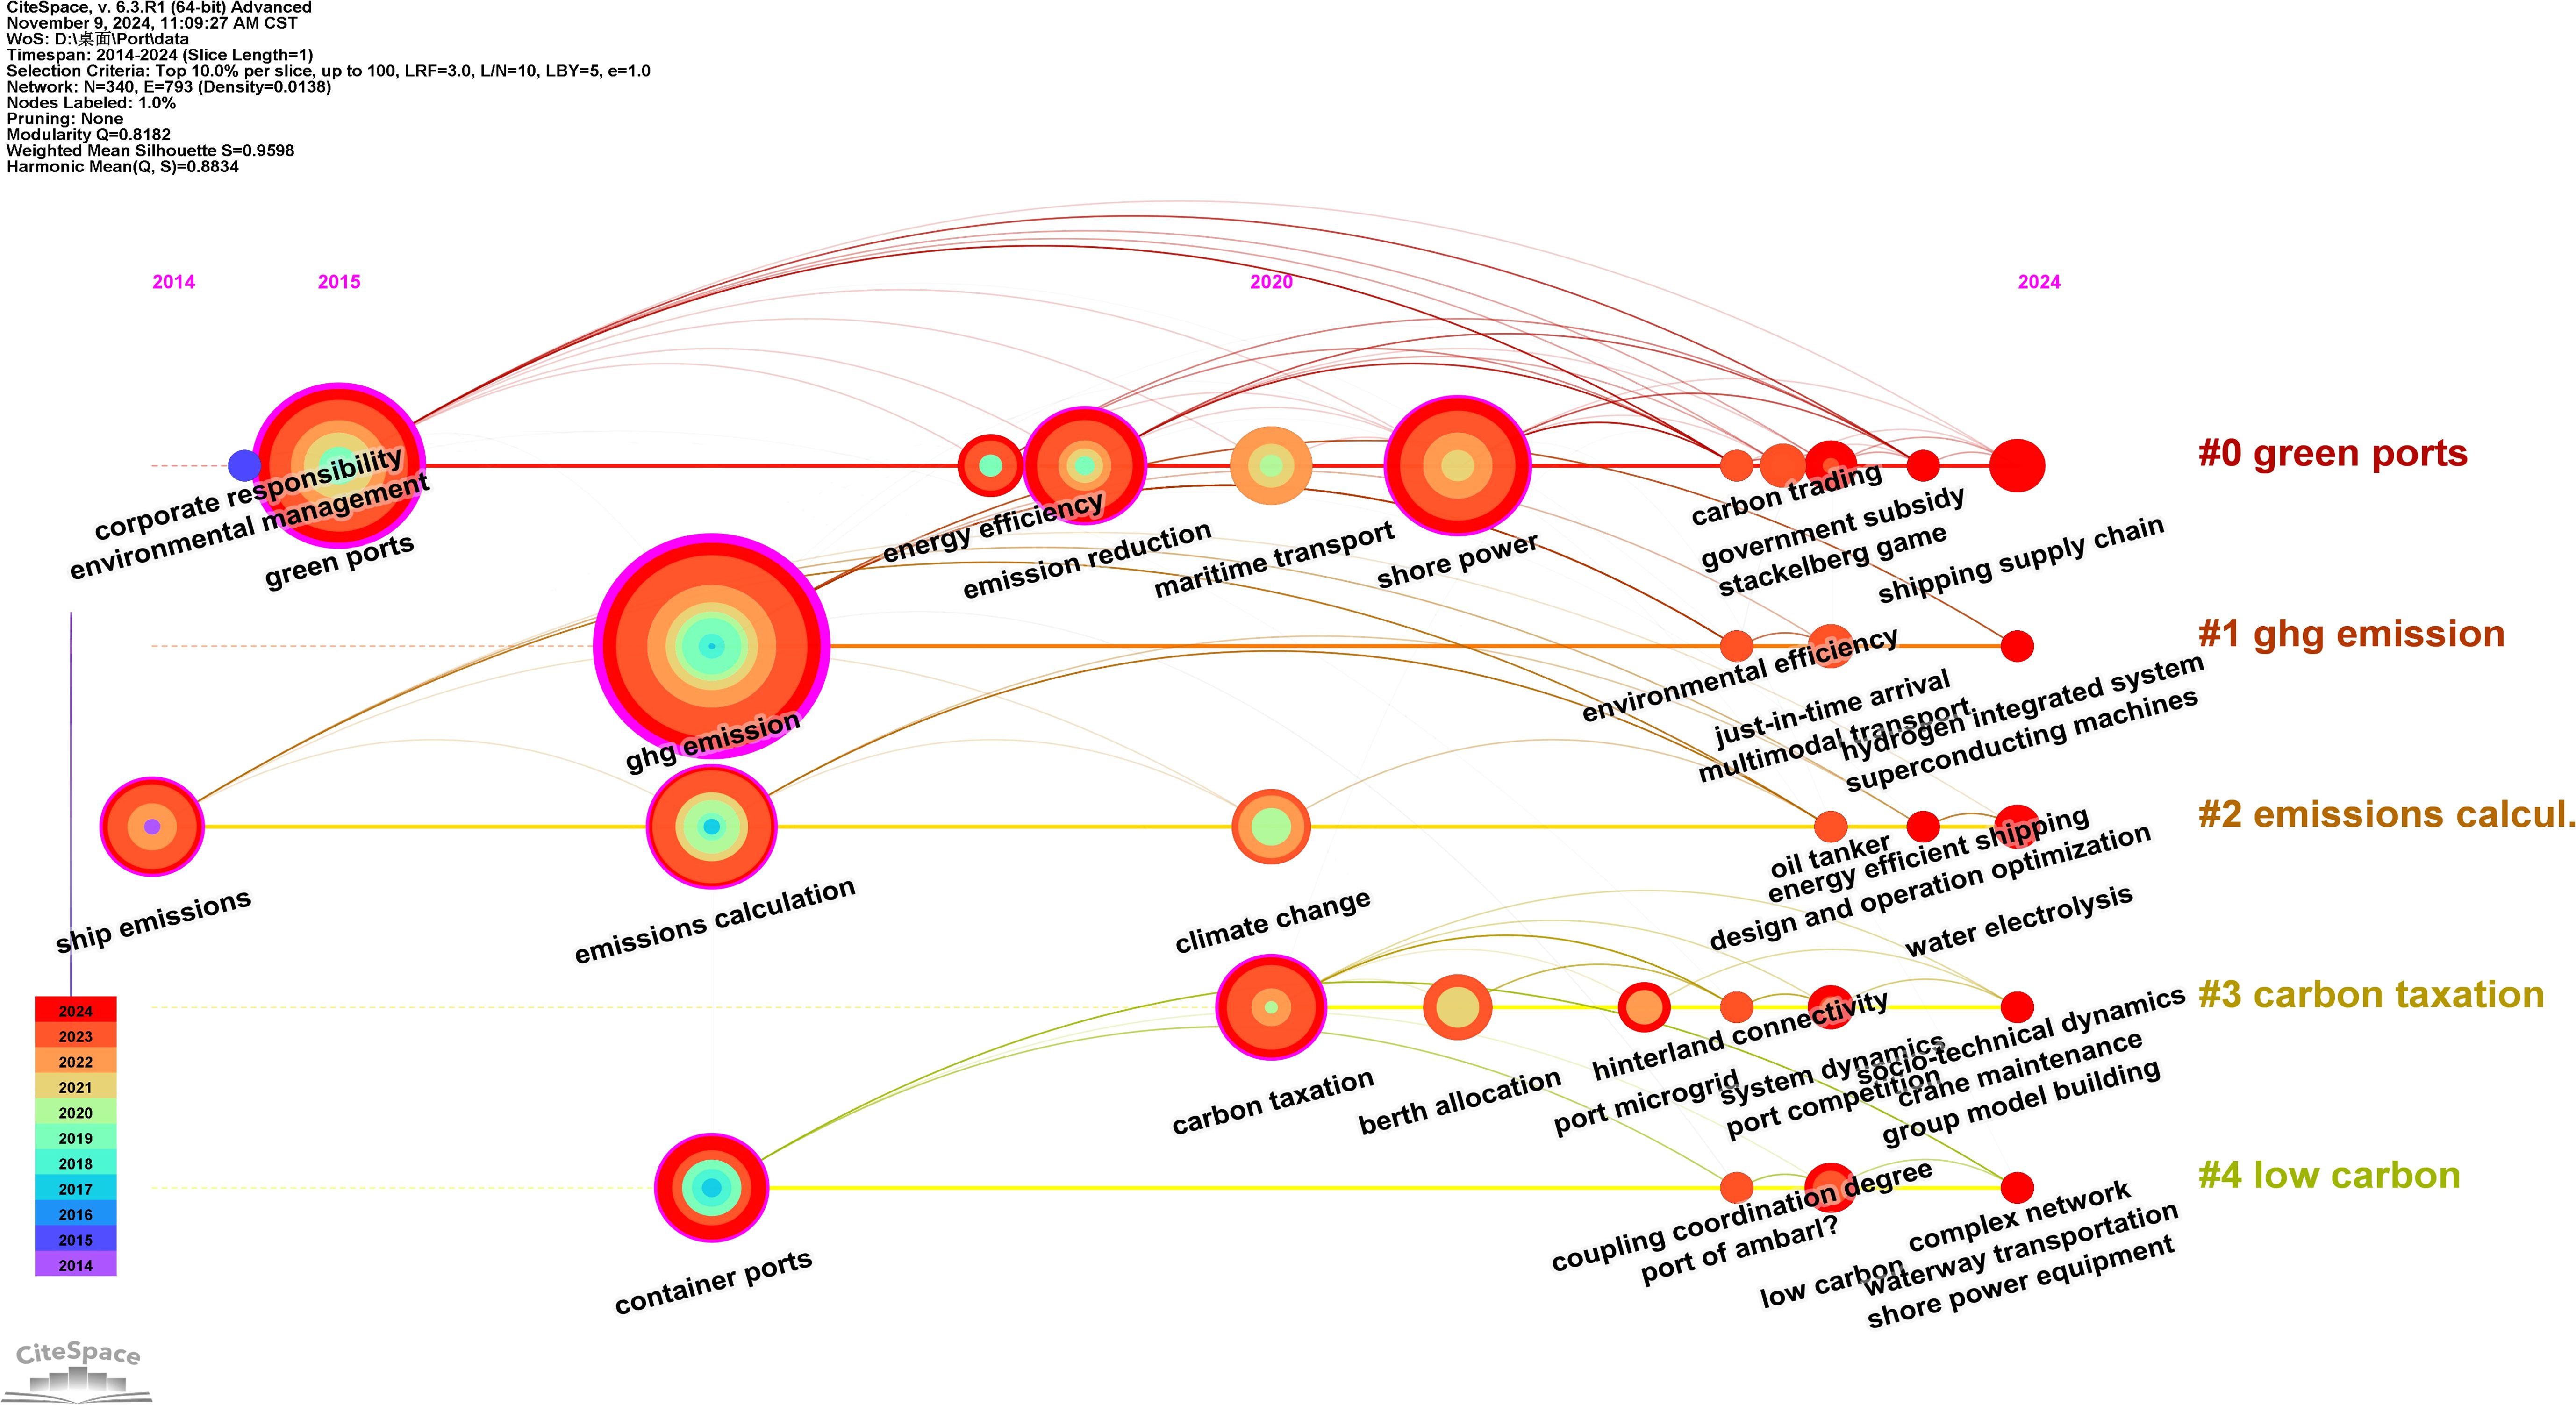
Figure 8. The timeline visualization of keyword clusters.
As shown in Figure 9, the evolutionary path of keywords can be categorized into three stages: early (2010-2015), middle (2016-2020), and recent (2021-2024). In the early stage, research primarily focused on fundamental issues related to GHG emissions from ports (e.g., ‘ship emissions’), specific responsibilities (e.g., ‘corporate responsibility’), and regulatory requirements (e.g., ‘environmental management’). In the middle stage, research expanded to address climate change, with a strong focus on GHG emissions (e.g., ‘emission calculation’) and increasing attention to mitigating its effects through economic tools (e.g., ‘carbon taxation’) and management strategies (e.g., ‘energy efficiency’). In the recent stages, research has shifted toward implementing practical technologies and policies aimed at reducing emissions. These efforts include innovative technologies (e.g., ‘shore power,’ ‘berth allocation,’ and ‘crane maintenance’), policies (e.g., ‘carbon trading,’ ‘government subsidies,’ ‘energy-efficient shipping,’ and ‘design and operation optimization’) and sustainable operational strategies (e.g., ‘socio-technical dynamics,’ ‘port microgrid,’ ‘hydrogen integrated system,’ ‘just-in-time arrival,’ and ‘shipping supply chain’).
Figure 9. Classification of Port GHG Emission Sources.
Based on the bibliometric analysis results, 68 papers were screened for systematic review considering their content, analytical methods, and findings. The review process is composed of three sections.
The review indicates that port operations involve a complex workflow relying on various equipment and machinery. These consume diverse energy types and generate multiple sources of GHG emissions with distinct characteristics. Depending on the purpose of the study, emission sources can be categorized in various ways, as shown in Figure 9, where one common categorization method follows the guidelines outlined in Carbon Footprinting for Ports (WPCI, 2010). Moreover, emissions can be classified based on source mobility into stationary sources, mobile sources, purchased electricity, and employee commuting (Azarkamand et al., 2020).
Scope 1 (direct emissions) and Scope 2 (indirect sources) address GHG emissions from vehicle fleets, loading/unloading facilities, buildings, and other auxiliary facilities directly owned and operated by the port. Specifically, Scope 1 accounts for direct GHG emissions from the consumption of fossil fuels (e.g., diesel, gasoline, biofuels, and natural gas), while Scope 2 covers indirect emissions from purchased electricity. Moreover, Scope 3 includes emissions from other sources, such as direct and indirect emissions generated by port tenants during operation (e.g., ships, vehicles, equipment, buildings, and auxiliary facilities) and emissions from employee commuting.
At container terminals, shore cranes and mobile port cranes perform loading and unloading operations between ships and the shore. A range of equipment is utilized within the yard, including rail-mounted gantries, rubber-tired cranes, empty container handlers, container reach stackers, and forklift trucks. Moreover, container transshipment between the shore and the yard is mainly accomplished by terminal tractors and container trailers. Due to the requirement for significant flexibility and high power, the early design and manufacture of rubber-tired cranes, mobile port cranes, container reach stackers, and forklift trucks are frequently powered by diesel engines. Similarly, container tractors are typically diesel-powered to meet the requirement for long-range operation and adaptability to complex road conditions. At the Port of Valencia, a case study indicated that rubber-tired gantry cranes and tractors are the primary source of GHG emissions within the land area, contributing about 68.1% of total emissions (Martínez-Moya et al., 2019). In the case of Ambarlı Port, fuel-powered equipment for container operations emitted 77.16% of total GHG emissions (Okşaş, 2023). Specifically, container tractors, container reach stackers, empty container handlers, mobile harbor cranes, and rubber-tired cranes account for 65.95%, 11.88%, 9.01%, 3.87%, and 1.57% of emissions, respectively. However, a study on the Port of Ningbo highlighted the significant environmental impact of rubber-tired cranes, which ranked as the second-largest source of emissions after ship operations, consuming approximately 3 tons of diesel annually (Chen and Zeng, 2022).
Indirect GHG emissions from port equipment powered by electricity sourced outside the port boundaries fall under Scope 2. Although these units do not produce GHG within the port boundary, emissions are generated externally during energy production, particularly when fossil fuels like coal are used. At the Port of Ningbo, transitioning rubber-tired cranes to electric rubber-tired cranes can reduce GHG emissions by about 13,000 tons of standard coal equivalent annually (Chen and Zeng, 2022). At Ambarlı Port, indirect GHG emissions from electricity used by container-handling equipment account for about 22.84% of the total emissions (Okşaş, 2023). Specifically, shore cranes, rail-mounted gantries, rubber-tired cranes, and mobile harbor cranes account for 32.29%, 31.26%, 19.83%, and 14.56%, respectively. The findings from a case study of the Oslo port demonstrated that GHG emissions belonging to Scope 2 accounted for about 34% of the total emissions (Azarkamand et al., 2020). In addition to equipment usage, cargo storage procedures in port yards generate GHG emissions through electricity consumption. For example, refrigeration is frequently needed to preserve goods stored in the port yards. Other auxiliary services requiring electricity consumption, including lighting, machinery maintenance, waste disposal, and office operation, also contribute to indirect GHG emissions. According to Moros-Daza et al. (2024), reefer containers, lighting, and offices account for 47.87%, 12.70%, and 5.53% of total port GHG emissions, respectively. By comparison, a case study of Chennai Port found that indirect emissions from electricity consumed by equipment (e.g., cranes, lighting, building air conditioning, reefer containers, and auxiliary facilities) within Scope 2 contributed about 11.01% of total emissions (Misra et al., 2017).
Existing studies on Scope 3 emission sources have primarily concentrated on ship-related emissions. The main sources of GHG emissions from ship activities are identified as navigation and the stopping process. Depending on the location of the stopping, they can be further divided into two stages: stopping at the anchorage for waiting in line and berthing at the wharf for operations. GHG emissions from ships maneuvering in port waters are typically measured during their 12-mile voyage between the port boundary and terminal berths. It is worth noting that for these two different processes, there are no consistent conclusions on which of these two stages could produce more GHG. A recent case study in Tianjin Port revealed that ships at berth were a major source of GHG emissions due to their substantial tonnage and extended operational hours at the terminals (Qi et al., 2024). Conversely, an earlier study on container terminals found that port maneuvering accounted for 51.13% of total GHG emissions, while the berthing process contributed only 0.57% (Sim, 2018). Beyond GHG emissions from operating ships in port waters, emissions from auxiliary ships at ports also require consideration. A study of Mediterranean ports reported that seven tugboats emitted an average of 1,024.8 kilograms of GHG per hour (Murcia González, 2021). Additionally, Scope 3 also includes GHG emissions from employee commuting and cargo transport between port yards and the hinterland via various transport modes (e.g., train, trailer, and pipeline). However, the emission sources included in Scope 3 varied across these studies. A case study at Oslo port considered only commuter-related GHG emissions within scope 3, which accounted 22% of total GHG emissions (Azarkamand et al., 2020).
Reliable quantification of GHG emissions based on the characteristics of their sources is an essential precondition for comprehending their contribution to climate change and designing effective decarbonization strategies. To ensure consistency and comparability in GHG emissions reporting, the IPCC has established guidelines for national-level GHG inventories, offering a standardized framework for compiling data across various countries. The guidelines were first published in 1996, and were then comprehensively revised in 2006, with further updates in 2019 (IPCC, 2019). Following this guideline, the World Ports Climate Initiative (WPCI) published a detailed guidance document on port carbon footprinting in 2010, which outlined the boundaries and calculation methods for GHG accounting (WPCI, 2010).
The recommendations for calculating GHG emissions from ports mainly utilize three different approaches, depending on the level of detail in the emission inventory, i.e., the activity-based, the surrogate-based, and the hybrid methods. The activity-based calculation methodology is widely applied in the literature for comprehensive analysis of port GHG emissions and the development of target mitigation strategies.
where represents the amount of GHG emissions from source i, typically expressed in weight units (e.g., kilograms or tons of CO2 equivalent, CO2E). Notably, equivalent CO2 is used because the IPCC Guidelines classify multiple gases as GHG (e.g., N2O and CH4), which are converted to CO2E using global warming potential (GWP) factors. The GWPs of CO2, CH4, and N2O are 1, 21, and 310, respectively. represents energy consumption, which depends on the performance and activity data of the equipment. Relevant data includes engine rating, actual power consumption, fuel consumption rate, etc. Activity data for the equipment includes operating hours/miles, load factor and fuel consumption, etc. is the CO2E emission factor, representing the GHG emissions generated per unit of energy or fuel consumed.
Within this framework, a revised calculation formula was proposed (Geerlings and Van Duin, 2011), as shown in Equation 2, specifically for the operating activities of container terminals.
where represents the total CO2 emission produced at terminal T, i refers to the type of operating equipment (e.g., quay cranes, barge cranes, rail cranes, reach stackers, automated stacking cranes, rail-mounted stacking cranes, and automated guided vehicles), while j indicates the operating mode (e.g., inland shipping, road, rail, shortsea, and inter-terminal transport). denotes the emission factor per liter of diesel, and is the emission factor per kWh of electricity. specifies the number of equipment i operating in mode j. and refer to the fixed and variable fuel consumption per equipment, respectively. represents the distance travelled by equipment i in mode j, while indicates the fixed electricity consumed per equipment.
Equation 3 presents an improved calculation formula proposed to quantify emissions from specific sources, including ocean-going ships, harbor craft, cargo handling equipment, heavy-duty vehicles, and railroad locomotives (Mamatok and Jin, 2017). This formula allows for a comprehensive assessment of emission reduction measures across different scenarios.
where represents the total GHG emissions from ocean-going ships, and refers to emissions from the main engines. These emissions are calculated using the maximum continuous rated power of the main engines (), the navigation speed (), the maximum speed (), the navigation distance (), the emission factor for main engines (), and the annual number of ship visits (). represents the total GHG emissions from auxiliary engines. These are calculated based on the average auxiliary load during navigation (), the emission factor for auxiliary engines (), average auxiliary load during maneuvering (), the maneuvering distance (), the maneuvering speed (), the average auxiliary load at berth (), and the berth hours (). represents total GHG emissions from auxiliary boilers, determined by the average boiler load during maneuvering () and the emission factor for auxiliary boilers system (). represents the total GHG emissions from harbor crafts, calculated using the rated power (), load factor (), annual operating time (), and the emission factor of engine (). represents the total GHG emissions from cargo handling equipment, calculated based on the rated power (), load factor (), operating time (), and the emission factor of the equipment engine (). represents the total GHG emissions from heavy-duty vehicles, calculated using the number of truck trips (), average idle time (), average trip distance (), average region trip distance (), idling emission factor (), and running emission factor (). represents total GHG emissions from railroad locomotives, calculated using the rated power (), load factor (), operating time (), and the emission factor for the locomotive engine ().
Peng et al. (2018) proposed an improved calculation formula for estimating GHG emissions from ships using different fuels, as presented in Equation 4.
where denotes the number of ships, and refers to the type of fuel utilized by the ship. and represent the power of main engines and auxiliary engines, while and correspond to their respective fuel consumption rates. and represent the load coefficients of the main and auxiliary engines, respectively, while denotes the number of auxiliary engines. and indicate the operational speed and the design speed of the ship, respectively. and denote the waiting period at anchorage and berth. The equation accounts for 3 types of energy sources, i.e., the main engine uses LNG and diesel during navigation, while the auxiliary engine uses diesel, LNG, or shore power during anchorage and berthing. When shore power is utilized, and are set to 0; otherwise, they are set to 1.
For GHG emissions from employee commuting under Scope 3, distance-based calculations are applied, as shown in Equation 5.
where represents the average commute distance of employee . indicates the average commute days per week, and denotes the GHG emission factor per unit commute mile for travel mode k.
Moreover, surrogate-based methods estimate total GHG emissions from ports when detailed activity data are unavailable, as shown in Equation 6.
where represents the carbon emission density of vessel maneuver, while represents the carbon emission density of vessels at berth. Similarly, denotes the carbon emission density of container cranes, and refers to the carbon emission density of yard trucks and yard cranes. indicates the carbon emission density of container trailers, and represents the number of containers, measured in TEUs. A case study by Sim (2018) provided the values of these parameters, as listed in Table 2.
Table 2. Parameter values for surrogate-based methods.
Over the past decades, scholars have suggested numerous measures to mitigate GHG emissions from ports.
Shore power, also referred to as cold ironing, shoreside power, shore-to-ship power, alternative marine power, or onshore power supply, provides electricity from shore to anchored or berthed ships, reducing the fuel consumption of auxiliary engines. It not only eliminates noise pollution produced by the operation of the auxiliary engines but also reduces direct emissions of GHG and other pollutants such as nitrogen oxides, sulfur oxides, and particulate matter (Xu et al., 2024b, 2024c). Accordingly, shore power has become a key strategy for emission reduction in the maritime sector over the past decades (Misra et al., 2017). Since shore power typically uses electricity from the national grid, its effectiveness in reducing emissions varies significantly across regions, achieving reductions of 99.5% in Norwegian ports, about 85% in France, and just 9.4% in the United States. These discrepancies can be attributed to the differences in electricity generation methods. Norway relies on hydroelectric power, France on nuclear power, while the United States primarily uses a fuel mix of coal and natural gas (Hall, 2010). Therefore, in the development and promotion of shore power technologies, it is essential to consider GHG emissions during power generation. When a ship is waiting at anchor or berth, its suitability for shore power should depend on the energy mix of power generation and the docking duration rather than just its tonnage or displacement (Sun et al., 2022).
Moreover, several factors related to shore power technology have hindered its promotion and broader adoption. A review of ports that have applied shore power technology (e.g., the Port of Los Angeles, the Port of Gothenburg, the Port of Long Beach, and the Port of Shanghai) indicates that shipowners should deal with voltage discrepancies in shore power across various countries. Specifically, the US, Canada, and Brazil operate on a 60 Hz power grid, whereas China, most European countries, and India use a 50 Hz grid (Daniel et al., 2022). This difference presents a technical obstacle for shipowners who must adapt to varying power systems across different regions. In addition, port authorities face significant financial challenges, such as the cost of port power capacity expansion (e.g., adding substations and transformer equipment) and costs related to routine operation and maintenance (Daniel et al., 2023). For instance, the installation of a shore power facility at Shenzhen Shekou Container Terminal has caused a cost of $2.2 million, which creates significant barriers for port enterprises to achieve profitability through such investments. Thus, government subsidies can play a critical role in facilitating the adoption and implementation of shore power systems (Wan et al., 2021). A case study on a 5-berth container port in China indicates that the shore power system presents the economic drawbacks of shore power when the electricity price exceeds 0.3 $/kWh (Peng et al., 2019).
In order to make shore power more financially viable, providing certain financial subsidies for shore power facilities and suitable environmental incentives for daily operation appears to be economically viable. Specifically, financial subsidies could encourage the development of additional shore power facilities, while environmental incentives may improve profitability for ports (Tan et al., 2023). Findings based on the Shanghai port suggest that carbon trading as additional revenue fails to improve the profitability of shore power investments, whereas a significant increase in electricity revenues appears to be more effective (Dai et al., 2019). Although implementing a robust carbon tax, increased financial subsidies, higher electricity prices, and increased fuel costs may alleviate the economic pressure on port authorities. However, a comprehensive analysis of berthing patterns, vessel energy requirements, and environmental advantages is necessary in the present context (Bullock et al., 2023). Therefore, it is advisable to efficiently optimize the allocation of shore power and electric scheduling through collaboratively considering berth availability, shore power infrastructure, the stochastic nature of ship arrivals, and the environmental impact of reducing greenhouse gas emissions (Peng et al., 2021). A case study demonstrated that implementing lithium-ion batteries and supercapacitors during the transition from auxiliary engines to shore power can reduce the total GHG emissions by around 55% while the ship is berthed in port (Barone et al., 2024). Furthermore, providing shore power to ships through renewable energy sources (e.g., hydrogen, wind, and photovoltaics) is a crucial strategy that can significantly improve competitiveness (Wang et al., 2024a).
Gantry cranes are essential equipment in the container terminal yard for handling and stacking containers. These cranes are categorized into two types based on their structure and movement: tire gantry cranes and rail gantry cranes. As indicated by their designation, rail gantry cranes are typically affixed to rails for operation and can be readily connected to the port grid for electrical power supply. In comparison, tire gantry cranes are mainly diesel-driven due to the requirement of flexibility and maneuverability. Consequently, converting diesel-powered tire gantry cranes into electric drives is a significant strategy for mitigating GHG emissions in container ports (Ding et al., 2021). Electrification refers to the process of installing an electric motor on a conventional tire-type gantry crane and connecting it to the power grid through a cable reel system. A case study of the Ningbo Port indicated that this electrification of tire cranes can reduce the total GHG emissions by two-thirds (Peng et al., 2016).
Once electrification is completed, yard gantry cranes primarily operate on electric power, relying on diesel drives solely for transitions between operational zones where the cable reel system is restricted (Yu et al., 2019). Switching between power sources during operation requires additional time, leading to diminished efficiency in yard operations. Given the operational demand and environmental benefits, it is essential to select an appropriate electric engine during the electrification process (Martínez-Moya et al., 2019). However, due to port financial pressures, port authorities are often unable to electrify all their diesel-driven tire gantry cranes in the short term. When container terminals have both diesel- and electric-driven cranes, irrational scheduling optimization strategies can significantly increase total GHG emissions (Yao et al., 2024). Considering the actual arrival time of containers and the allocation of container trucks, synergistically optimizing the co-scheduling of quay cranes and yard cranes can reduce the total GHG emissions within the port region (Wang et al., 2019). It is worth noting that the scheduling optimization of tire gantry cranes also requires comprehensively considering the interactions between shipping lanes, berths, and yard layout (Jiang et al., 2024b).
The activity time of ships, vehicles, and machines involved in port operations is also a significant factor that affects total port emissions. Reducing the activity duration is a more effective measure to reduce GHG emissions from ports than carbon tax policies and port resource allocation optimization (Kenan et al., 2022). Implementing compact terminal layouts can minimize terminal area while simultaneously reducing horizontal transshipment time for container trucks. For example, adopting such a compact terminal layout at the Port of Rotterdam can reduce CO2 emissions by about 70% (Geerlings and Van Duin, 2011). Furthermore, optimizing quay configurations at the terminal front and the distribution of cranes, considering the uncertainty of ship arrival schedules and loading/unloading capacities, is essential for minimizing idle durations and achieving low GHG emission targets (Zhen et al., 2021). Hu et al. (2022) concluded that for bulk ports, optimizing terminal layouts should be accompanied by the integration of these layouts into the overall operational process. Thus, loading and unloading costs can be reduced, ship operating time can be reduced, and low-carbon production can be realized. Improvement of Operation Efficiency.
While electrifying container terminal equipment (e.g., tire cranes) significantly reduces GHG emissions, some ports with high operational pressure (e.g., Taiwan port) face challenges in achieving electrification in the short term due to high acquisition costs (Yang, 2017). In this case, reducing the idle time of container trucks, loading/unloading equipment, and ships can effectively lower emissions while ensuring high operational performance. The optimization of operating efficiency of equipment, trucks, docks, and yards is a crucial strategy for diminishing energy usage and GHG emissions (Iris and Lam, 2019). The evidence from Shanghai Yangshan Deepwater Port indicates that the idle crane ratio is about 23%, suggesting the potential for significant energy savings and emission reductions through better equipment utilization and scheduling (Sha et al., 2017).
The conventional procedure for docking a vessel at a berth requires the collaboration of the mooring team and crew and sometimes even the help of a pilot and a tugboat. For example, the conventional mooring procedure can typically take 20 to 90 minutes in the Chennai Harbor, India. The implementation of an automated mooring system enables a single operator to complete the mooring process in around 30 seconds, significantly enhancing port operational efficiency and reducing GHG emissions by about 33 tons annually (Misra et al., 2017). Additionally, the limited availability of berth space requires a thorough consideration of the balance between ship berth demand and terminal capacity. Through efficient berth allocation scheduling, terminal utilization and operational efficiency can be significantly improved, and thereby ship idle time at anchor and GHG emissions can be reduced (Jauhar et al., 2023).
Inefficient channel management leads to prolonged idle times for ships at anchor, which in turn increases the GHG emissions from ports. Thus, coordinating port and ship scheduling by integrating ship emission characteristics during low-speed voyages with port service capacity is crucial for achieving superior environmental performance. The previous studies have indicated that such co-scheduling strategy can reduce GHG emissions from ships by 8.0%-11.9% (Xia et al., 2021).
Over the long term, the GHG emission reduction policies formulated by the government will provide guidance for port authorities to improve operational efficiency and reduce energy consumption, thereby increasing their market competitiveness. However, in the short term, port authorities, especially small and medium-sized ports, may face financial challenges, including the closure risks, which are derived from heightened operating expenses related to facility upgrades or operational modifications (Meng et al., 2022). As a result, the government has proposed a series of financial subsidy programs to incentivize port authorities to actively participate in and promote the GHG emission reduction. Subsidies for shore power are common policies aimed at promoting the installation of shore power by port authorities and attracting more ships to use it. This study suggests that directly providing subsidies to port authorities was suboptimal, and implementing subsidies based on reducing GHG emissions from ports after implementing shore power would be superior (Zhen et al., 2023).
Notably, these policies face significant challenges in balancing environmental objectives with the conflicting interests of multiple stakeholders, such as governments, port authorities, cargo owners, and shipping companies (Luo et al., 2024). When cargo owners show little interest in low-carbon transport technologies, governments should incentivize port authorities in upgrading their equipment through subsidies for low-carbon technology. However, such investments may lead to higher service costs at ports, which could negatively impact cargo owners. Governments can enhance decarbonization efforts by developing targeted strategies that encourage cargo owners to adopt low-carbon transportation technologies (Li et al., 2024). The insights from the Shanghai Yangshan Port suggested that the temporal value of goods, market dynamics, and competitive pricing among alternative transportation modes should be considered when developing subsidy policies for cargo owners (Chen et al., 2023).
In addition to subsidies, the carbon tax is another common financial policy. A well-designed carbon tax can efficiently guide port authorities in allocating port berth resources, optimizing ship schedules, and utilizing yard resources, thereby reducing GHG emissions (Wang et al., 2018). A case study of the Shanghai Port showed that a carbon tax rate of $1,500/ton can reduce the total GHG emissions of ports by about 24%. However, when the carbon tax rate reaches $4,500/ton, it cannot prompt a reduction in total GHG emissions and increase the operational pressure (Lin et al., 2023). Another case study about the electrification of tire gantry cranes revealed that carbon tax policy is beneficial for long-term planning periods, but financial subsidies are more suitable for shorter-term planning durations (Lin et al., 2022). Hybrid Renewable Energy Systems.
A promising strategy for reducing greenhouse gas emissions in ports involves transitioning existing energy sources to renewable energy systems, such as solar, wind, ocean, and geothermal (Song et al., 2020). A case study in the Port of Naples found that 60% of the port’s energy demand can be fulfilled by integrating solar and ocean energy into its energy system (Buonomano et al., 2024). This transition process requires a comprehensive evaluation of the relationship among environmental benefits, economic costs, and energy attributes (e.g., supply capacity, demand characteristics, storage prices, and technical feasibility) (Li et al., 2019). A case study in Egypt demonstrated that solar energy was the cleanest energy with the lowest environmental impact from a life-cycle perspective. Generally, wind energy is superior to solar energy in terms of potential economic benefits if the ecological impact criteria are lowered. The drawback of tidal and wave energy is usually regarded as the lower power density (Elkafas and Seddiek, 2024). However, despite these advantages, maintaining a balance between energy supply and demand remains challenging due to the fluctuating and intermittent nature of renewable energy supply and the temporal and spatial dislocation of energy demand from operational activities (Odoi-Yorke et al., 2022).
As reported, an effective strategy was proposed to address the mismatch between renewable energy supply and port operational energy demand, and thereby an optimized energy management strategy was designed to adjust the peak energy demand, i.e., a peaking strategy (Sifakis et al., 2021). Another effective strategy was also developed to balance the disparity between energy supply and demand over time through energy storage systems, which can enhance the competitiveness of ports and the ability to provide emergency protection (Sifakis et al., 2022). Therefore, in addition to the uncertainty of the power generated by renewable energy sources (e.g., wind and photovoltaics), the relationship between the energy storage capacity and the fluctuations in energy demand in the port was synergistically considered in practical applications (Shi et al., 2024). Moreover, with the completion of port electrification, the fluctuation of port electrical loads and the required collaborative management were determined by port operational activities, i.e., the coupled operation of transportation and electricity (Yin et al., 2024). A case study showed that through integrating management between the scheduling of port operational activities and electrical loads, the operating costs and total GHG emissions can be reduced by 31.9% and 9.4%, respectively (Yin et al., 2023). A further technique was designed to build an integrated system that combined renewable energy systems with hydrogen energy technology (Wang et al., 2024c). The energy storage system of hydrogen primarily refers to the process of generating hydrogen from surplus renewable energy by electrolyzing water, storing it safely and non-pollutedly, and then reusing it (Vichos et al., 2022). However, the main challenge in implementing this method is the high cost of hydrogen production from renewable energy. For instance, a Singapore case study found that electrolytic hydrogen production became economically feasible only when the costs were reduced by at least 30% (Pivetta et al., 2024b).
In port waters, ships consume large amounts of fuel during navigation, anchorage, and berthing periods. As noted in Section 4.3.1, shore power systems are often used to replace traditional heavy fuel oil during anchorage and berthing. Meanwhile, hydrogen power has emerged as an efficient alternative energy source for ships during navigation. However, it is essential to evaluate the impact of conversion expenses, subsidies, hydrogen energy utilization prices, and operational and maintenance costs comprehensively (Zhang et al., 2024). Utilizing LNG as an alternative to ship fuel oil can reduce GHG emissions by around 8 percent during voyages (Peng et al., 2018).
On port land, energy consumption typically involves diesel, electricity, gasoline, and natural gas. As discussed in section 4.3.2, electrifying tire gantry cranes to replace diesel with electricity is an effective way to reduce GHG emissions at container ports. Meanwhile, trucks are the most common mode of container movement between yards and terminals. They are frequently powered by diesel fuel, which is a primary source of GHG in ports, and are challenging to electrify due to the frequent starts and stops during operations and the high load demand. Additionally, electrifying gasoline-powered vehicles (used by employees for commuting) can significantly lower GHG emissions (Maleki et al., 2024). Notably, port electrification necessitates consideration of electricity sources, emphasizing renewable energy to minimize indirect GHG emissions. Taking the Ningbo port as an example, electrification significantly reduced direct GHG emissions, leading to indirect GHG emissions accounting for more than 90% of total emissions. However, since electricity is mainly generated from fossil fuels, the total GHG emissions have been reduced by only 14% (Ezeh et al., 2024). For fishing harbors, the objective of zero carbon emissions can be achieved by utilizing solar-generated electricity to replace reliance on the national grid (Alzahrani et al., 2022).
Apart from electricity, hydrogen is another common alternative energy source for harbors (Pivetta et al., 2024a). Recently, some ports have adopted hydrogen fuel cells to replace diesel fuel in powering container trucks, reducing direct GHG and air pollutant emissions. Although hydrogen fuel cell trucks and their fuel usage involve high costs, daily operating expenses can still be reduced by about 50% (Wang et al., 2024b). Similarly, forklifts used for stacking containers often operate under heavy loads, requiring high and stable power output over extended periods, which makes hydrogen power more advantageous than electricity (Wang et al., 2022).
Regarding the characteristics of the multi-energy system and the uncertainty of renewable energy (e.g., solar, wind, and tidal) power generation, the measures were proposed to build a microgrid energy system for ports. Due to energy price fluctuations, this approach can improve renewable energy efficiency and significantly reduce costs for low-carbon port operations (Iris and Lam, 2021).
Recently, with the increasing demand for wind and hydroelectric power generation in harbor environments, the use of high-temperature superconducting generators has become an alternative method to conventional generators. The application of this generator in ports could reduce the GHG emissions by about 6.8%, and more stable electricity for hydrogen production from electrolyzed water and lower-carbon hydrogen production can be realized (Tsuzuki et al., 2024).
In cold chain logistics networks, ports should configure stacking areas for reefer containers to comply with the rigorous temperature storage requirements for specialized cargo, including fresh food, pharmaceuticals, and chemicals. However, the storage procedure is energy-intensive due to external weather conditions and stacking schemes. By implementing an underground storage measure, the port can reduce total GHG emissions by approximately 61% (Moros-Daza et al., 2024).
Carbon capture and storage (CCS) is a process that involves separating CO2 from the source of emissions, followed by its transportation to a designated site for injection into deep geological structures for underground storage. CCS is essential to achieving zero carbon emissions in ports where direct GHG emissions cannot be avoided (Swennenhuis et al., 2024).
This section outlines a wide range of strategies designed to achieve substantial reductions in GHG emissions from port operations. These strategies include technological innovations such as shore power systems and equipment electrification, as well as policy-driven approaches (e.g., financial subsidies and carbon taxes). For a deep understanding, Table 3 lists a side-by-side comparison of these strategies, summarizing their costs, emission reduction impacts, and the specific contexts where they are most applicable.
Table 3. Comparison of Port Emission Reduction Strategies.
In this section, the bursts and temporal variance of keywords are analyzed to clarify the academic hotspots, and thus the emerging research directions are summarized.
Figure 10 illustrates the burst analysis outcomes of the top ten cited keywords among all the keywords. Specifically, ‘ghg emission,’ ‘green ports,’ and ‘emission calculation’ are the keywords with a high-strength burst and lasting for a long period. This means these keywords are consistent research hotspots and significant topics of long-term interest. In addition, methods for calculating emissions from ports have gained great attention between 2017 - 2021. This may be because accurate emission calculations are essential for developing effective emission reduction strategies. ‘container ports’ and ‘sustainable development’ are burst keywords characterized by early and short durations. Container ports emerged as an early research hotspot, primarily due to their high carbon emissions and role as critical nodes in global trade. ‘sustainable development’ became a short-term hotspot from 2020 to 2021, focusing on the balance between economic efficiency and environmental responsibility in port development. ‘emission reduction,’ ‘maritime transportation,’ ‘climate change,’ and ‘carbon taxation’ are keywords that have been boosted recently and endured for a longer period of time. ‘Emission reduction’ has remained a prominent research hotspot since 2019. Since 2020, GHG emission reduction in ‘maritime transport’ has emerged as a significant topic for coping with ‘climate change,’ and ‘carbon taxation’. Moreover, as the essential technology for the GHG emission reduction during ship calls, the keyword ‘shore power’ burst in 2021 and quickly became a popular research direction with a high-strength burst. The temporally varying trend of keyword bursts indicates that early research concentrated on how to calculate GHG emissions. Subsequently, substantial carbon reduction technologies (e.g., ‘shore power’) and economic instruments (e.g., ‘carbon taxation’) have gained increasing attention. More recently, greater emphasis has been placed on integrating multifaceted mitigation strategies.
Figure 10. Top 10 keywords with the strongest citation bursts.
The preceding conclusion indicates that existing studies have distinctly categorized the emission sources in ports. However, there exists an issue of ambiguous categorization across various studies. For instance, the ship emissions are primarily classified as Scope I in certain studies, whereas they are categorized under Scope 3 in others. Emissions from employee commuting were essential but were not adequately considered in most studies. Besides, the electrification of port equipment can substantially change the total emissions from Scope 1 and Scope 2, which can significantly affect comparing emissions from ports in different regions and the quality of GHG emission reduction policy. Moreover, there are apparent differences in the ownership of ports by their administrative bodies, leading to substantial variations in statistical outcomes across different scopes. Specifically, some ports own and are responsible for all vehicle fleets, buildings, operating equipment, and auxiliary services, and these emissions are counted as Scope 1. In contrast, the other ports rent operating facilities and ancillary services, which are often classified as Scope 3. Accordingly, as shown in Figure 11, future research should focus on classifying GHG emissions based on the locations where machinery and equipment are operated.
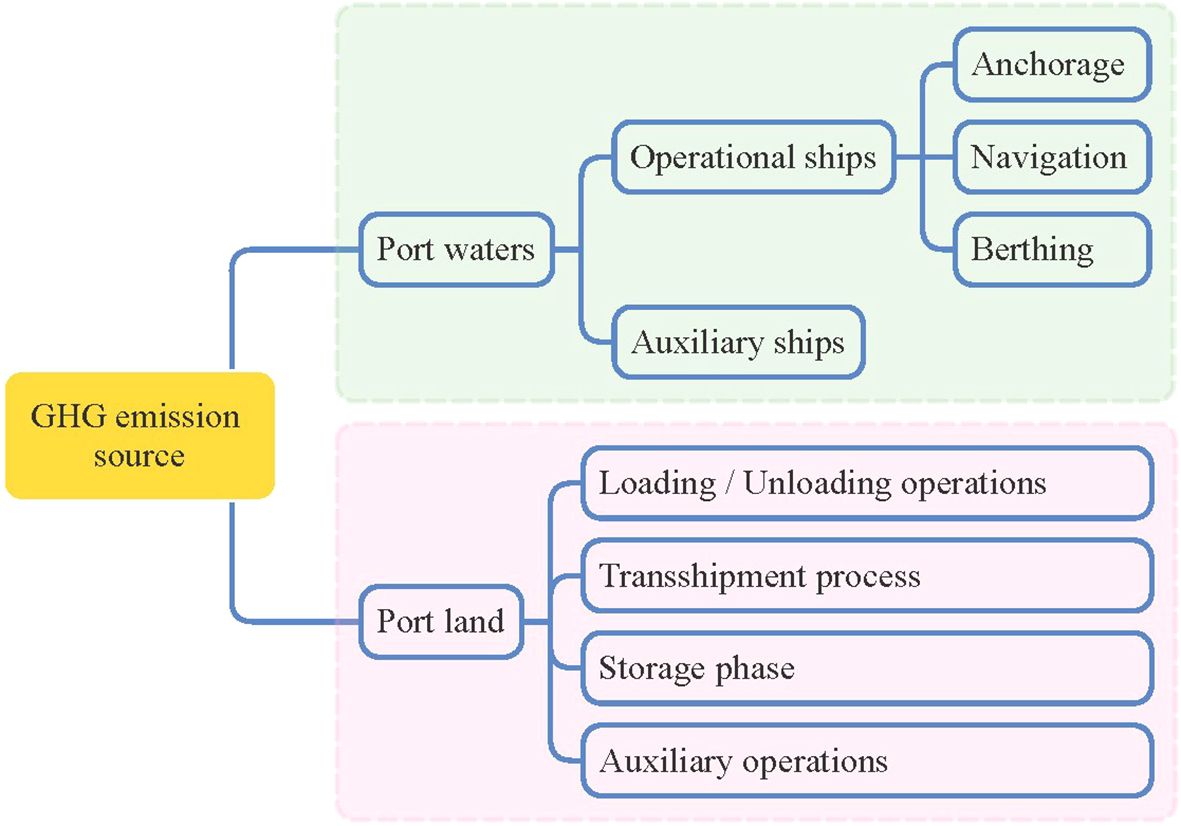
Figure 11. Revised classification of port GHG emission sources.
As shown in Figure 11, port-related GHG emissions can be divided into port waters and port lands. In port waters, GHG emissions from operational and auxiliary ships are counted during the 12-nautical-mile voyage between the port boundary and the berth of the dock. On port lands, GHG emissions are counted according to the cargo handling processes of loading/unloading, transshipment, storage, and auxiliary services. The primary advantage of this categorization is that it is suitable for longitudinal comparisons of total GHG emissions before and after adopting reduction measures such as energy restructuring, technological advances, and policy changes. For example, the influences of adopting shore power or alternative fuels (e.g., biomass fuels, low-sulfur oils, hydrogen, etc.) on GHG emissions from ships in port waters can be analyzed. It is also possible to comprehensively understand the effects of electrifying port equipment or other energy alternatives on GHG emissions in ports rather than just comparing them within Scope 1 or Scope 2. Additionally, this categorization method allows horizontal comparison of GHG emissions within different scopes across various regions and avoids discrepancies in statistical standards arising from differing facility ownership (owned or rented).
Although the methodology and framework for calculating GHG emissions from ports have been well-developed and are no longer a recent research hotspot, there are still some notable shortcomings. Initially, these studies focused mainly on containerized ports, with insufficient exploration of GHG emissions from other types of ports. The primary reason may be that containerized transport is a significant modality of global trade, accounting for about 14 percent of the total deadweight tons of goods transported worldwide. Standardizing operating processes and equipment types in container ports makes GHG emission calculation methods universal. Moreover, large container ports are usually equipped with superior energy monitoring and management systems, and activity data are relatively easy to obtain, making the conditions for research more mature. In contrast, while dry bulk and oil transport account for 43% and 28% of total global deadweight tonnage, respectively (UNCTD, 2024), research on these ports is limited, which can be ascribed to the lower visibility of their economic activities in international trade and the challenges of acquiring performance and activity data., respectively, there are fewer research outcomes due to the low visibility of their economic activities in international trade and the challenges associated with acquiring data on equipment performance and activities. Furthermore, research on new energy is relatively underdeveloped, and insufficient investigation is conducted into the actual emission characteristics of emerged energy (e.g., hydrogen and ammonia), making it challenging to provide a reliable foundation for new energy transformation. Moreover, numerous existing studies rely on static data, which cannot capture dynamic evolutions in the emission reduction effects. Finally, these studies have inadequately addressed data analysis and trend forecasting over extended periods, making it challenging to assess the long-term effects of emission reduction measures.
Future studies are expected to apply advanced IoT technologies and sensors to extensively collect activity data and GHG emission profiles from various port types, particularly dry bulk and oil terminals. A comprehensive analysis of GHG emission variations across port types allows for a deeper understanding of the impact of ports on climate change and facilitates the development of targeted emission reduction strategies. To improve the accuracy and timeliness of GHG accounting, it is essential to enhance the database of emission factors applicable to various energy equipment (e.g., hydrogen and ammonia) with the combination of the data on operational activities and GHG emissions collected online. Meanwhile, due to technological developments, improvements in fuel quality over time, and the heterogeneity of activity-level data in different regions, the influences of uncertain factors, such as the accuracy of data collection and variations in emission factors, should also be taken into consideration for the assessment of total GHG. Another essential recommendation is to analyze the temporal change characteristics of various decarbonization strategies (single or combined) based on long-term collected data on port operational activities and emission factors. Additionally, with the combination of scenario simulation methods, we can comprehensively assess the long-term effects of decarbonization strategies and promote the sustainable development of ports.
Up to now, a variety of innovative and effective measures have been proposed, which have made significant contributions to reducing port emissions, but multiple challenges remain. For example, the high cost of some low-carbon technologies, especially in equipment upgrades, operation, and maintenance, causes them to be less affordable for small and medium-sized ports. Some emerging technologies (e.g., hydrogen fuels, ammonia fuels, high-temperature superconducting devices etc.) are still in the experimental phase and are not widely commercialized. The limited scopes of policies such as carbon taxes and subsidies make it challenging to utilize their emission reduction capacity fully. Moreover, existing research primarily emphasizes the single emission reduction program or an effective comparison of several different carbon reduction measures, overlooking the benefits of combining different technologies and management strategies.
Building on the findings from the investigation of temporal trends in keyword bursts, future research should focus on the integration of multiple emission reduction strategies. Priority should be given to the approaches that combine technological advancements, management practices, and policy frameworks for maximum effectiveness. For example, more in-depth studies are needed to assess the feasibility and emission reduction potential of emerging energy sources like hydrogen and ammonia. These evaluations should involve technology development, policy guidance, and economic advantages. Specifically, progress in hydrogen fuel cell and ammonia combustion technologies, along with their auxiliary apparatus, could enhance production, storage, transportation, and refueling processes. Such developments would not only improve efficiency and safety but also reduce operational costs. Additionally, by utilizing incentives such as carbon taxes and subsidies, comprehensive cost-benefit analyses could explore the long-term economic and environmental advantages of adopting hydrogen and ammonia as alternative energy sources. Given the volatility of renewable energy supply and the unpredictability of port energy demands of ports, coupling renewable energy conversion processes (hydrogen, ammonia, and electricity) with microgrid or intelligent grid energy management can enable near-zero or zero carbon emissions. It is also vital to optimize port operations and energy usage through technologies like the adaptive truck platoon (Jiang et al., 2024a) and advanced predictive control technology (Xiao et al., 2025). These tools can be favorable for the implementation of strategies such as energy peak shaving, battery charging, and shore power utilization, and thereby indirect greenhouse gas emissions can be effectively decreased. Furthermore, research should examine the acceptance of GHG reduction strategies by the public, operators, and governments. This should also evaluate the impact of temporal uncertainties related to emission reduction measures on the regional economic growth. By addressing these uncertainties, policymakers can develop adaptable and practical carbon tax and subsidy programs that balance environmental considerations and financial goals.
Research on greenhouse gas (GHG) emissions from ports has expanded rapidly in recent years, driven by growing concerns over climate change and the demand for global decarbonization. Nevertheless, the findings remain scattered and lack a unified framework due to the complexity of port operational activities. Hence, this study integrates bibliometric analysis and systematic review to summarize the current status of research, gaps, and future research directions. The findings aim to support the development of effective strategies for port decarbonization. Using the Web of Science (WoS) core dataset, 1,612 articles published between 2010 and 2024 were initially retrieved. After excluding irrelevant studies, 230 records were selected for bibliometric analysis using Citespace software. The analysis indicates that the topic has garnered substantial attention since the signing of the Paris Agreement, resulting in explosive growth in research outcomes. The majority of the top five authors by publication count in this field are predominantly from China. Despite this progress, there is little cooperation among researchers from various nations and regions. Among these journals, with Sustainability at the forefront, about double the output of the second-ranked Journal of Cleaner Production. The citation sources for these papers cover 310 journals, with the largest collaborative network containing 27 journals. The evolution path of these keywords can be categorized into early stages (2010-2015), mid-term stages (2016-2020), and near-term stages (2021-2024).
The systematic review of 68 articles identified three main categories of GHG emission sources in ports. However, the classification of GHG emission sources in ports varies widely across studies, resulting in inconsistent estimates and limited comparability of results. Some studies have exclusively concentrated on specific emission sources, such as vessels or port equipment, which may underestimate total emissions. Despite the considerable advancements in computational methodologies and frameworks, research on emissions from other types of ports and new energy sources remains limited. Meanwhile, the existing studies primarily rely on static emission factors, which cannot account for temporal variability or the uncertainties associated with emerging technologies and mitigation strategies. An extensive review of existing studies reveals that port authorities commonly adopt technology (e.g., shore power, gantry crane electrification, port terminal layout optimization, high-temperature superconducting generator, underground refrigerated container, and CCS), energy (e.g., renewable energy, energy alternative, and microgrid), management (e.g., operation efficiency), and policies (e.g., subsidy and carbon tax) to reduce emissions directly or indirectly. However, practical implementation remains challenging due to high costs, technical barriers, and insufficient policy support.
In the future, research should refine the categorization of GHG emission sources by further considering the spatial and operational contexts of ports. It is essential to update emission factors for various types of ports and emerging energy technologies for GHG calculations. The keyword burst analysis reveals that the integration of multiple abatement measures will be a priority in future research. Although this study attempts to provide a comprehensive review of the research related to GHG emissions from ports, certain limitations should be recognized. The dependence on the SCIE and SSCI datasets from WoS may have excluded relevant studies from other sources. Additionally, earlier literature that precedes recent technological advancements may have been overlooked. Despite these constraints, this study offers valuable insights into the current research status, identifies critical gaps, and provides actionable directions for future work to accelerate the efforts towards port decarbonization.
JS: Methodology, Resources, Writing – original draft, Writing – review & editing. WG: Methodology, Software, Writing – review & editing. JL: Data curation, Writing – review & editing. FL: Visualization, Writing – review & editing. XF: Funding acquisition, Supervision, Writing – review & editing.
The author(s) declare financial support was received for the research, authorship, and/or publication of this article. This research was supported by the Natural Science Foundation of Jiangsu Province (Grant No. BK20242055), the China Scholarship Council (Grant No. 202406710030), and the Undergraduate Innovation Training Program of Hohai University (Grant No. 202410294229Y).
The authors declare that the research was conducted in the absence of any commercial or financial relationships that could be construed as a potential conflict of interest.
The author(s) declare that no Generative AI was used in the creation of this manuscript.
All claims expressed in this article are solely those of the authors and do not necessarily represent those of their affiliated organizations, or those of the publisher, the editors and the reviewers. Any product that may be evaluated in this article, or claim that may be made by its manufacturer, is not guaranteed or endorsed by the publisher.
Alzahrani A., Petri I., Ghoroughi A., Rezgui Y. (2022). A proposed roadmap for delivering zero carbon fishery ports. Energy Rep. 8, 82–88. doi: 10.1016/j.egyr.2022.01.083
Alzahrani A., Petri I., Rezgui Y., Ghoroghi A. (2021). Decarbonisation of seaports: A review and directions for future research. Energy Strategy Rev. 38, 100727. doi: 10.1016/j.esr.2021.100727
Azarkamand S., Ferré G., Darbra R. M. (2020). Calculating the Carbon Footprint in ports by using a standardized tool. Sci. Total Environ. 734, 139407. doi: 10.1016/j.scitotenv.2020.139407
Barone G., Buonomano A., Del Papa G., Maka R., Palombo A. (2024). Approaching zero emissions in ports: implementation of batteries and supercapacitors with smart energy management in hybrid ships. Energy Conversion Manage. 314, 118446. doi: 10.1016/j.enconman.2024.118446
Bullock S., Higgins E., Crossan J., Larkin A. (2023). Improving shore power project economics at the Port of Aberdeen. Mar. Policy 152, 105625. doi: 10.1016/j.marpol.2023.105625
Buonomano A., Giuzio G. F., Maka R., Palombo A., Russo G. (2024). Empowering sea ports with renewable energy under the enabling framework of the energy communities. Energy Conversion Manage. 314, 118693. doi: 10.1016/j.enconman.2024.118693
Chen S., Zeng Q. (2022). Carbon-efficient scheduling problem of electric rubber-tyred gantry cranes in a container terminal. Eng. Optimization 54, 2034–2052. doi: 10.1080/0305215X.2021.1972293
Chen Z., Zhang Z., Bian Z., Dai L., Hu H. (2023). Subsidy policy optimization of multimodal transport on emission reduction considering carrier pricing game and shipping resilience: A case study of Shanghai port. Ocean Coast. Manage. 243, 106760. doi: 10.1016/j.ocecoaman.2023.106760
Dai L., Hu H., Wang Z., Shi Y., Ding W. (2019). An environmental and techno-economic analysis of shore side electricity. Transportation Res. Part D: Transport Environ. 75, 223–235. doi: 10.1016/j.trd.2019.09.002
Daniel H., Antunes C. H., Trovão J. P. F., Williams D. (2023). Shore operations enhancement of bulk carriers based on a multi-objective sizing approach. Energy Conversion Manage. 276, 116497. doi: 10.1016/j.enconman.2022.116497
Daniel H., Trovão J. P. F., Williams D. (2022). Shore power as a first step toward shipping decarbonization and related policy impact on a dry bulk cargo carrier. eTransportation 11, 100150. doi: 10.1016/j.etran.2021.100150
Ding Y., Yang Y., Heilig L., Lalla-Ruiz E., Voss S. (2021). Deployment and retrofit strategy for rubber-tyred gantry cranes considering carbon emissions. Comput. Ind. Eng. 161, 107645. doi: 10.1016/j.cie.2021.107645
Elkafas A. G., Seddiek I. S. (2024). Application of renewable energy systems in seaports towards sustainability and decarbonization: Energy, environmental and economic assessment. Renewable Energy 228, 120690. doi: 10.1016/j.renene.2024.120690
Ezeh C. I., Richter U. H., Seufert J. H., Peng C. (2024). Operational-based decarbonization of container ports: The case of Ningbo-Zhoushan Port. Int. J. Sustain. Transportation 18, 34–45. doi: 10.1080/15568318.2023.2197859
Geerlings H., Van Duin R. (2011). A new method for assessing CO2-emissions from container terminals: a promising approach applied in Rotterdam. J. Cleaner Production 19, 657–666. doi: 10.1016/j.jclepro.2010.10.012
Hall W. J. (2010). Assessment of CO2 and priority pollutant reduction by installation of shoreside power. Resources Conserv. Recycling 54, 462–467. doi: 10.1016/j.resconrec.2009.10.002
Hu X., Zhou B., Xia J., Chen Y., Hu G. (2022). Energy-saving-oriented berth scheduling model at bulk terminal. Intelligent Automation Soft Computing 33, 1801–1813. doi: 10.32604/iasc.2022.027034
IMO (2023). 2023 IMO Strategy on Reduction of GHG Emissions from Ships (London, UK: International Maritime Organization).
IPCC (2019). 2019 Refinement to the 2006 IPCC Guidelines for National Greenhouse Gas Inventories (Geneva, Switzerland: The Intergovernmental Panel on Climate Change).
Iris Ç., Lam J. S. L. (2019). A review of energy efficiency in ports: Operational strategies, technologies and energy management systems. Renewable Sustain. Energy Rev. 112, 170–182. doi: 10.1016/j.rser.2019.04.069
Iris Ç., Lam J. S. L. (2021). Optimal energy management and operations planning in seaports with smart grid while harnessing renewable energy under uncertainty. Omega 103, 102445. doi: 10.1016/j.omega.2021.102445
Jauhar S. K., Pratap S., Kamble S., Gupta S., Belhadi A. (2023). A prescriptive analytics approach to solve the continuous berth allocation and yard assignment problem using integrated carbon emissions policies. Ann. Oper Res. doi: 10.1007/s10479-023-05493-1
Jiang C., Bhat C. R., Lam W. H. K. (2020). A bibliometric overview of Transportation Research Part B: Methodological in the past forty years, (1979–2019). Transportation Res. Part B: Methodological 138, 268–291. doi: 10.1016/j.trb.2020.05.016
Jiang C., Lu L., Lu J. J. (2017). Socioeconomic factors affecting the job satisfaction levels of self-employed container truck drivers: a case study from Shanghai Port. Maritime Policy Manage. 44, 641–656. doi: 10.1080/03088839.2017.1326182
Jiang C., Yin S., Yao Z., He J., Jiang R., Jiang Y. (2024a). Safety evaluation of mixed traffic flow with truck platoons equipped with (cooperative) adaptive cruise control, stochastic human-driven cars and trucks on port freeways. Physica A: Stat. Mechanics its Appl. 643, 129802. doi: 10.1016/j.physa.2024.129802
Jiang X., Zhong M., Shi J., Li W. (2024b). Optimization of integrated scheduling of restricted channels, berths, and yards in bulk cargo ports considering carbon emissions. Expert Syst. Appl. 255, 124604. doi: 10.1016/j.eswa.2024.124604
Kenan N., Jebali A., Diabat A. (2022). The integrated quay crane assignment and scheduling problems with carbon emissions considerations. Comput. Ind. Eng. 165, 107734. doi: 10.1016/j.cie.2021.107734
Li X., Peng Y., Wang W., Huang J., Liu H., Song X., et al. (2019). A method for optimizing installation capacity and operation strategy of a hybrid renewable energy system with offshore wind energy for a green container terminal. Ocean Eng. 186, 106125. doi: 10.1016/j.oceaneng.2019.106125
Li Z., Wang L., Wang G., Xin X., Chen K., Zhang T. (2024). Investment and subsidy strategy for low-carbon port operation with blockchain adoption. Ocean Coast. Manage. 248, 106966. doi: 10.1016/j.ocecoaman.2023.106966
Lin S., Zhen L., Wang W. (2022). Planning low carbon oriented retrofit of diesel-driven cranes to electric-driven cranes in container yards. Comput. Ind. Eng. 173, 108681. doi: 10.1016/j.cie.2022.108681
Lin S., Zhen L., Wang W., Tan Z. (2023). Green berth and yard space allocation under carbon tax policy in tidal ports. Maritime Policy Manage. 50, 1080–1101. doi: 10.1080/03088839.2022.2047816
Luo C., Zhou Y., Mu M., Zhang Q., Cao Z. (2024). Subsidy, tax or green awareness: Government policy selection for promoting initial shore power usage and sustaining long-run use. J. Cleaner Production 442, 140946. doi: 10.1016/j.jclepro.2024.140946
Maleki F., Bararzadeh Ledari M., Fani M., Kamelizadeh D. (2024). Sustainable hydrogen supply chain development for low-carbon transportation in a fossil-based port region: A case study in a tourism hub. Int. J. Hydrogen Energy 65, 95–111. doi: 10.1016/j.ijhydene.2024.03.362
Mamatok Y., Jin C. (2017). An integrated framework for carbon footprinting at container seaports: the case study of a Chinese port. Maritime Policy Manage. 44, 208–226. doi: 10.1080/03088839.2016.1262077
Martínez-Moya J., Vazquez-Paja B., Gimenez Maldonado J. A. (2019). Energy efficiency and CO2 emissions of port container terminal equipment: Evidence from the Port of Valencia. Energy Policy 131, 312–319. doi: 10.1016/j.enpol.2019.04.044
Meng L., Wang J., Yan W., Han C. (2022). A differential game model for emission reduction decisions between ports and shipping enterprises considering environmental regulations. Ocean Coast. Manage. 225, 106221. doi: 10.1016/j.ocecoaman.2022.106221
Misra A., Panchabikesan K., Gowrishankar S. K., Ayyasamy E., Ramalingam V. (2017). GHG emission accounting and mitigation strategies to reduce the carbon footprint in conventional port activities – a case of the Port of Chennai. Carbon Manage. 8, 45–56. doi: 10.1080/17583004.2016.1275815
Moros-Daza A., Castro D., Bonifacio J., Amaya-Mier R., Voß S. (2024). Greening container terminals: An innovative and cost-effective solution for sustainable reefer container storage. J. Cleaner Production 466, 142664. doi: 10.1016/j.jclepro.2024.142664
Murcia González J.-C. (2021). Analysis and measurement of SOx, CO2, PM and NOx emissions in port auxiliary vessels. Environ. Monit Assess. 193, 374. doi: 10.1007/s10661-021-09145-4
Odoi-Yorke F., Owusu J. J., Atepor L. (2022). Composite decision-making algorithms for optimisation of hybrid renewable energy systems: Port of Takoradi as a case study. Energy Rep. 8, 2131–2150. doi: 10.1016/j.egyr.2022.01.118
Okşaş O. (2023). Carbon emission strategies for container handling equipment using the activity-based method: A case study of Ambarlı container port in Turkiye. Mar. Policy 149, 105480. doi: 10.1016/j.marpol.2023.105480
Peng Y., Dong M., Li X., Liu H., Wang W. (2021). Cooperative optimization of shore power allocation and berth allocation: A balance between cost and environmental benefit. J. Cleaner Production 279, 123816. doi: 10.1016/j.jclepro.2020.123816
Peng Y., Li X., Wang W., Liu K., Li C. (2018). A simulation-based research on carbon emission mitigation strategies for green container terminals. Ocean Eng. 163, 288–298. doi: 10.1016/j.oceaneng.2018.05.054
Peng Y., Li X., Wang W., Wei Z., Bing X., Song X. (2019). A method for determining the allocation strategy of on-shore power supply from a green container terminal perspective. Ocean Coast. Manage. 167, 158–175. doi: 10.1016/j.ocecoaman.2018.10.007
Peng Y., Wang W., Song X., Zhang Q. (2016). Optimal allocation of resources for yard crane network management to minimize carbon dioxide emissions. J. Cleaner Production 131, 649–658. doi: 10.1016/j.jclepro.2016.04.120
Pivetta D., Dall’Armi C., Sandrin P., Bogar M., Taccani R. (2024a). The role of hydrogen as enabler of industrial port area decarbonization. Renewable Sustain. Energy Rev. 189, 113912. doi: 10.1016/j.rser.2023.113912
Pivetta D., Tafone A., Mazzoni S., Romagnoli A., Taccani R. (2024b). A multi-objective planning tool for the optimal supply of green hydrogen for an industrial port area decarbonization. Renewable Energy 232, 120979. doi: 10.1016/j.renene.2024.120979
Qi Y., Yang J., Qin K. S. (2024). Spatial-temporal analysis of carbon emissions from ships in ports based on AIS data. Ocean Eng. 308, 118394. doi: 10.1016/j.oceaneng.2024.118394
Sha M., Zhang T., Lan Y., Zhou X., Qin T., Yu D., et al. (2017). Scheduling optimization of yard cranes with minimal energy consumption at container terminals. Comput. Ind. Eng. 113, 704–713. doi: 10.1016/j.cie.2016.03.022
Shi Z., Fan F., Tai N., Qing C., Meng Y., Guo R. (2024). Coordinated operation of the multiple types of energy storage systems in the green-seaport energy-logistics integrated system. IEEE Trans. Ind. Applicat. 60, 4482–4493. doi: 10.1109/TIA.2024.3359585
Sifakis N., Konidakis S., Tsoutsos T. (2021). Hybrid renewable energy system optimum design and smart dispatch for nearly Zero Energy Ports. J. Cleaner Production 310, 127397. doi: 10.1016/j.jclepro.2021.127397
Sifakis N., Vichos E., Smaragdakis A., Zoulias E., Tsoutsos T. (2022). Introducing the cold-ironing technique and a hydrogen-based hybrid renewable energy system into ports. Intl J. Energy Res. 46, 20303–20323. doi: 10.1002/er.8059
Sim J. (2018). A carbon emission evaluation model for a container terminal. J. Cleaner Production 186, 526–533. doi: 10.1016/j.jclepro.2018.03.170
Song T., Li Y., Zhang X.-P., Wu C., Li J., Guo Y., et al. (2020). Integrated port energy system considering integrated demand response and energy interconnection. Int. J. Electrical Power Energy Syst. 117, 105654. doi: 10.1016/j.ijepes.2019.105654
Sun L., Ding P., Xiong Y., Liu W., Hu Z. (2022). Carbon emission reduction of shore power from power energy structure in China. Front. Mar. Sci. 9. doi: 10.3389/fmars.2022.1077289
Swennenhuis F., De Gooyert V., De Coninck H. C. (2024). Socio-technical dynamics of carbon dioxide capture and storage: A systems view on enablers and barriers at North Sea Port. Int. J. Greenhouse Gas Control 137, 104201. doi: 10.1016/j.ijggc.2024.104201
Tan Z., Zeng X., Wang T., Wang Y., Chen J. (2023). Capacity investment of shore power berths for a container port: Environmental incentive and infrastructure subsidy policies. Ocean Coast. Manage. 239, 106582. doi: 10.1016/j.ocecoaman.2023.106582
Tsuzuki K., Yamada S., Matsumoto Y., Oikawa D., Tsukamoto T. (2024). Study of superconducting system under hydrogen demand for carbon neutral port. IEEE Trans. Appl. Supercond 34, 1–4. doi: 10.1109/TASC.2024.3360940
UNCTD (2024). Review of maritime transport 2024: Navigating maritime chokepoints (New York, USA: United Nation Conference on Trade Development).
Vichos E., Sifakis N., Tsoutsos T. (2022). Challenges of integrating hydrogen energy storage systems into nearly zero-energy ports. Energy 241, 122878. doi: 10.1016/j.energy.2021.122878
Wan Z., Zhang T., Sha M., Guo W., Jin Y., Guo J., et al. (2021). Evaluation of emission reduction strategies for berthing containerships: A case study of the Shekou Container Terminal. J. Cleaner Production 299, 126820. doi: 10.1016/j.jclepro.2021.126820
Wang P., Dou J., Su W., Jiang Z., Shi Y. (2024b). An energy management strategy based on dynamic programming for fuel cell hybrid trucks in ports. Int. J. Hydrogen Energy 82, 123–133. doi: 10.1016/j.ijhydene.2024.07.356
Wang X., Huang W., Wei W., Tai N., Li R., Huang Y. (2022). Day-ahead optimal economic dispatching of integrated port energy systems considering hydrogen. IEEE Trans. Ind. Applicat 58, 2619–2629. doi: 10.1109/TIA.2021.3095830
Wang W., Huo Q., Liu Q., Ni J., Zhu J., Wei T. (2024c). Energy optimal dispatching of ports multi-energy integrated system considering optimal carbon flow. IEEE Trans. Intell. Transport. Syst. 25, 4181–4191. doi: 10.1109/TITS.2023.3336998
Wang L., Li Y. (2023). Estimation methods and reduction strategies of port carbon emissions - what literatures say? Mar. pollut. Bull. 195, 115451. doi: 10.1016/j.marpolbul.2023.115451
Wang T., Li M., Hu H. (2019). Berth allocation and quay crane-yard truck assignment considering carbon emissions in port area. Int. J. Shipp. Transp. Logist. 11, 216–242. doi: 10.1504/IJSTL.2019.099275
Wang J., Li H., Yang Z., Ge Y.-E. (2024a). Shore power for reduction of shipping emission in port: A bibliometric analysis. Transportation Res. Part E: Logistics Transportation Rev. 188, 103639. doi: 10.1016/j.tre.2024.103639
Wang B., Liu Q., Wang L., Chen Y., Wang J. (2023). A review of the port carbon emission sources and related emission reduction technical measures. Environ. pollut. 320, 121000. doi: 10.1016/j.envpol.2023.121000
Wang T., Wang X., Meng Q. (2018). Joint berth allocation and quay crane assignment under different carbon taxation policies. Transportation Res. Part B: Methodological 117, 18–36. doi: 10.1016/j.trb.2018.08.012
WPCI (2010). Carbon footprinting for ports-Guidance document (Tokyo, Japan: World Ports Climate Initiative).
Xia Z., Guo Z., Wang W., Jiang Y. (2021). Joint optimization of ship scheduling and speed reduction: A new strategy considering high transport efficiency and low carbon of ships in port. Ocean Eng. 233, 109224. doi: 10.1016/j.oceaneng.2021.109224
Xiao G., Tong H., Shu Y., Ni A. (2025). Spatial-temporal load prediction of electric bus charging station based on S2TAT. Int. J. Electrical Power Energy Syst. 164, 110446. doi: 10.1016/j.ijepes.2024.110446
Xu L., Shen C., Chen J. (2024a). The impact of the Maritime Silk Road Initiative on the carbon intensity of the participating countries. Marit Econ Logist. doi: 10.1057/s41278-024-00295-z
Xu L., Shen C., Chen J., Pan X., Xiao G. (2024b). Efficiency evaluation and improvement pathway of sulfur-oxide emissions in European ports based on Context-dependent SBM-DEA model. Mar. pollut. Bull. 208, 117002. doi: 10.1016/j.marpolbul.2024.117002
Xu L., Wu J., Zhao Q., Chen J., Liu J., Gao F., et al. (2024c). Spatial-temporal characteristics of port infrastructures on sulfur-oxide concentrations of coastal port in China. Ocean Coast. Manage. 258, 107399. doi: 10.1016/j.ocecoaman.2024.107399
Yang Y.-C. (2017). Operating strategies of CO2 reduction for a container terminal based on carbon footprint perspective. J. Cleaner Production 141, 472–480. doi: 10.1016/j.jclepro.2016.09.132
Yao L., Ng A. K. Y., Liu B., Li D., Feng L. (2024). A study on multiple types of yard cranes rescheduling in ports considering carbon emission. Maritime Policy Manage., 1–35. doi: 10.1080/03088839.2024.2373758
Yin J., Huo Q., He J., Peng X., Wei T. (2024). Energy management and capacity allocation method of hybrid energy storage system based on port transportation-energy coupling characteristics. J. Energy Storage 83, 110745. doi: 10.1016/j.est.2024.110745
Yin J., Peng X., He J., Huo Q., Wei T. (2023). Energy management method of a hybrid energy storage system combined with the transportation-electricity coupling characteristics of ports. IEEE Trans. Intell. Transport. Syst. 24, 14663–14678. doi: 10.1109/TITS.2023.3303497
Yu D., Li D., Sha M., Zhang D. (2019). Carbon-efficient deployment of electric rubber-tyred gantry cranes in container terminals with workload uncertainty. Eur. J. Operational Res. 275, 552–569. doi: 10.1016/j.ejor.2018.12.003
Zhang Q., Tan Z., Wang S., Zhen L. (2024). Shore hydrogen deployment problem in green ports. Comput. Operations Res. 165, 106585. doi: 10.1016/j.cor.2024.106585
Zhen L., Sun Q., Zhang W., Wang K., Yi W. (2021). Column generation for low carbon berth allocation under uncertainty. J. Operational Res. Soc. 72, 2225–2240. doi: 10.1080/01605682.2020.1776168
Keywords: port, GHG emission, emission sources, calculation methodology, abatement strategies
Citation: Shen J, Gao W, Lu J, Li F and Feng X (2025) Sources, calculation methods, and reduction strategies for GHG emissions at ports: current status and future trends. Front. Mar. Sci. 12:1542255. doi: 10.3389/fmars.2025.1542255
Received: 09 December 2024; Accepted: 31 January 2025;
Published: 18 February 2025.
Edited by:
Lang Xu, Nanyang Technological University, SingaporeReviewed by:
Guangnian Xiao, Shanghai Maritime University, ChinaCopyright © 2025 Shen, Gao, Lu, Li and Feng. This is an open-access article distributed under the terms of the Creative Commons Attribution License (CC BY). The use, distribution or reproduction in other forums is permitted, provided the original author(s) and the copyright owner(s) are credited and that the original publication in this journal is cited, in accordance with accepted academic practice. No use, distribution or reproduction is permitted which does not comply with these terms.
*Correspondence: Jinxing Shen, c2hlbmp4MDNAMTYzLmNvbQ==
Disclaimer: All claims expressed in this article are solely those of the authors and do not necessarily represent those of their affiliated organizations, or those of the publisher, the editors and the reviewers. Any product that may be evaluated in this article or claim that may be made by its manufacturer is not guaranteed or endorsed by the publisher.
Research integrity at Frontiers
Learn more about the work of our research integrity team to safeguard the quality of each article we publish.