 Zhi Zhang
 Kai Zhou1,2
- 1Tidal Flat Research Center of Jiangsu Province, Tidal Flat Research Department, Nanjing, China
- 2Key Laboratory of Marine Early Warning and Disaster Reduction Technology, Nanjing, China
Coastal erosion is the leading marine hazard in the Abandoned Yellow River Delta, and coastal erosion vulnerability assessment is essential for disaster mitigation and risk reduction. To comprehensively reflect the erosion status of the coast of the Abandoned Yellow River Delta, a ICVI index that integrates the composition of coastal dynamics(Mean tidal range, Mean significant wave height, Storm surge height), coastal morphology(Seawall Elevation, Rate of coastline change, Rate of tidal flat erosion, Coastal slope, Tidal flat width), and socioeconomic indicators(Population density, Land use, Roads, Artificial protection) was constructed. After that, the coastal erosion vulnerability assessment of the Abandoned Yellow River Delta was carried out, and the physical and socioeconomic vulnerability was calculated and then combined to create an integrated coastal vulnerability index (ICVI). The driving factors and the interactions between these factors of coastal erosion vulnerability were analyzed by using a geodetector method. The results showed that the proportions of the very high, high, medium, low, and very low vulnerability of the whole coast were 13.62%, 19.31%, 18.29%, 27.28%, and 21.5%, respectively. The very high vulnerable areas were mainly distributed in Xiangshui, Binhai, and Sheyang. The coastal erosion vulnerability generally showed a distribution pattern high in the north and low in the south. The spatial differentiation of coastal erosion vulnerability results from the synergistic effect of multiple factors such as coastal dynamics, coastal morphology, and socioeconomic indicators, among which Rate of tidal flat erosion is the dominant factor in the spatial differentiation of coastal erosion vulnerability. The interaction results showed that coastal erosion protection requires the synergistic effect of multiple measures, especially coastline protection and tidal flats erosion protection, which are the most beneficial for coastal erosion protection. The vulnerability maps developed in this study can provide reliable spatial information for the relevant authorities to formulate better erosion risk mitigation policies.
1 Introduction
Deltas are essential estuarine coastal subsystems central to global economic and social development (Grandjean et al., 2024). Under the influence of climate warming, sea level rise, and intensified human activities, more and more estuarine deltas are experiencing a rapid transition from siltation to erosion, with increasing coastal erosion and coastal environmental vulnerability, which poses a severe threat to the sustainable development of land resources and economy (De Andrade et al., 2019; Zhu Q. et al., 2024).
Due to the return of the Yellow River to the north in 1855, sediment input to the coast decreased abruptly, and the Abandoned Yellow River Delta has been subjected to erosion. In the first few decades, the coastline retreated rapidly at a rate of more than 600 m per year. Then it slowed down to about 80 m per year at the beginning of the 20th century, and after the construction of the seawalls in the 1950s, the rate of recession slowed down to less than 20 m per year (Zhu Q. et al., 2024). Coastal erosion leads to substantial environmental and socio-economic damage to coastal ecosystems, coastal road construction, etc. Land use changes and increased pressure from population development dramatically increase the vulnerability of this area. The Abandoned Yellow River Delta region is flat, and these low-lying coastal areas are particularly vulnerable to coastal erosion, resulting in severe property damage, habitat destruction, and threats to human safety and the environment. Vulnerability is the degree to which a system is susceptible to natural hazards and social change, and spatial assessment of coastal erosion vulnerability can help develop and implement coastal erosion mitigation measures (Kantamaneni et al., 2019). Muddy coasts are exceptionally vulnerable due to a combination of soldering activities, soft sedimentary nature, and anthropogenic and natural factors (Yasmeen et al., 2024).However, muddy coasts have not received much attention in previous studies and has become a shortcoming in the application of coastal erosion vulnerability (Li et al., 2015). In addition, human activities have intensified the risk of coastal erosion. Therefore, it is urgent to identify the key influencing factors related to muddy coast erosion, evaluate the vulnerability of coastal erosion, and provide decision support for mitigating coastal erosion.
Many studies have focused on evaluating coastal vulnerability under multiple hazards, such as sea level rise, marine flooding, and climate change. The coastal vulnerability assessment consists of four main approaches (Satta, 2014): (1) Index/Indicator-based methods (Gornitz, 1991; Thieler and Hammar-Klose, 1999; Mclaughlin and Cooper, 2010; Zhang et al., 2021; Dike et al., 2024). (2) Methods based on dynamic computer models (Warrick, 2009; Sajjad et al., 2018). (3) GIS Based Decision Support Tools (Torresan et al., 2010). (4) Visualization tools (Marcy et al., 2011). Among these approaches, the Index/Indicator-based methods can be applied to different types of coastal zones (e.g., cliffs, beaches, or wetlands) are widely used for its conceptual clarity and ease of use despite the high data quality requirements (Ramieri et al., 2011).Among these index methods, the CVI index proposed by Gornitz (Gornitz, 1990; Gornitz et al., 1994)is the most widely used, and the CVI index has carried out coastal vulnerability assessment in the context of sea level rise by using six physical parameter factors, such as sea level rise and tidal range. Thereafter, this method has been employed globally by various scholars to enumerate coastal vulnerability in response to sea-level rise and multi-hazard events (Dwarakish, 2008; Arun Kumar and Kunte, 2012; Sheik Mujabar and Chandrasekar, 2013). However, some researchers have modified the Gornitz method and incorporated various other parameters both physical and socio-economic for a comprehensive study of coastal vulnerability in different parts of the world (Mclaughlin and Cooper, 2010; Ashraful Islam et al., 2016; Ariffin et al., 2023). However, there is almost no coastal erosion vulnerability index system for the Abandoned Yellow River Delta coast.
Considering the importance of the indicators, different weights were set for the indicators; for example, AHP (Serafim et al., 2019), FAHP (Akash et al., 2023), and cloud modeling (Cao et al., 2022) were used to determine the weights of the indicators. Expansion has also been made in application scales such as national scale (Thieler and Hammar-Klose, 1999; Yin et al., 2012), regional-scale (Cai et al., 2022), and grid-scale (Mclaughlin and Cooper, 2010).
Many studies have focused on coastal vulnerability caused by environmental hazards, especially sea-level rise (Nicholls and Cazenave, 2010; Sahin and Mohamed, 2014, Torresan et al., 2020), flood (Schober et al., 2015; Roy and Blaschke, 2015; Samanta et al., 2018), tropical cyclone (Taramelli et al., 2008; Yin et al., 2013),and storm surge (Jisan et al., 2018; Ghosh et al., 2019), but the research on the vulnerability of coastal erosion is still insufficient as a whole.
Li et al. (2015) focused on physical factors and carried out coastal erosion vulnerability evaluation of the Yangtze River Delta at the county scale, and Wang et al. (2021) added socioeconomic factors on top of physical factors and carried out coastal erosion vulnerability assessment of the Yangtze River Delta at the township scale. Fu et al. (2022) evaluated the coastal erosion vulnerability of the Yangtze River Delta at the township scale, taking physical and socio-economic factors into account. Cao et al. (2022) carried out coastal vulnerability assessment at the geographic unit scale by considering physical and socioeconomic factors, and Ahmed et al. (2021) carried out coastal erosion vulnerability assessment at the administrative unit scale by considering physical and socioeconomic factors.
The coast of the Abandoned Yellow River Delta is highly open and vulnerable to the impacts of storm surges and waves, resulting in coastal erosion. Despite the construction of seawalls, the area shows a characteristic pattern of “ hollowing out of the lower part and collapsing of the upper part “ (Zhu S. et al., 2024). Although Liu et al. (2014) carried out a study on the coastal erosion vulnerability of the Abandoned Yellow River Delta using the CVI index, mainly taking into account geological and geomorphological factors in combination with the coastal development situation and development suitability, the research mainly centered around geological and geomorphological factors. As a result, it overlooked major human-activity factors such as population, roads, and coastal protection, as well as coastal dynamic factors like storm surges and wave heights.
In terms of research scale, most of the studies on coastal erosion vulnerability have been carried out at the meso- and macro scale So far very few studies have been performed at a grid scale (Denner et al., 2015; Sekovski et al., 2020). A finer grid resolution can capture the spatial variability of coastal vulnerability information at the local community level (Kienberger et al., 2009). The existing assessment scale is too large and ignores the precise information of small regions (Sahoo, 2017).
In addition, previous studies mainly focused on the separate effect of each factor but neglected the interactions between these factors. some scholars use PCA (Ariffin et al., 2023) and Pearson correlation analysis (Wang et al., 2021) to analyze the effect of coastal vulnerability, while simultaneously quantitatively carrying out the effects of the interaction of individual fingers and indicators on the coastal erosion spatial distribution of vulnerability is almost unheard of.
To address these issues, the study further expands the existing coastal erosion vulnerability index system. A ICVI index that integrates the composition of coastal dynamics(Mean tidal range, Mean significant wave height, Storm surge height), coastal morphology(Seawall Elevation, Rate of coastline change, Rate of tidal flat erosion, Coastal slope, Tidal flat width), and socioeconomic indicators(Population density, Land use, Roads, Artificial protection) was constructed. Then, the study integrates the application of remote sensing, GIS, and in-situ survey data to assess coastal erosion vulnerability at the grid scale and applied the geodetector to quantify the impacts of different factors on coastal erosion vulnerability. The objectives of this study are as follows: 1) To construct a Muti-indicator index that integrates the composition of coastal dynamics, coastal morphology, and socioeconomic indicators 2) to study the spatial pattern of coastal erosion impact vulnerability, and 3) to identify the critical drivers of coastal erosion vulnerability and the effects of factor interactions on coastal erosion vulnerability.
2 Study area and data
2.1 Study area
The study area is located on the coast of the Abandoned Yellow River Delta in Jiangsu, China, and extends from 119°44′E to 120°01′E and 32°38′N to 34°30′N (Figure 1). The coast is controlled by the translational tidal wave of the East China Sea and the rotating tidal wave of the South Yellow Sea. The coastal sea area is mainly of regular semi-diurnal tide. The average tidal range of the northern part of the coast of the Abandoned Yellow River Delta is 2-4 m, and the southern part is more than 4 m, which belongs to the solid tidal zone, and the tidal flats have slopes ranging from 0.01% to 0.03% (Zhang, 1992). The main direction of waves is northeast, with wave heights of 2.9-4.1 m in winter and 0.5-1.0 m in summer (Ren, 1986). From 1128 to 1855, the Yellow River entered the sea from Jiangsu, bringing a large amount of sediment into the south of the Yellow Sea (Wang et al., 2012). Under the combined action of factors such as a large tidal range, weak waves and abundant sediment sources, a wide and flat tidal flat was formed around the Abandoned Yellow River, at a low altitude. In 1855, the Yellow River returned to the north. Due to the sudden decrease of sediment from the coast and the sudden change of sediment dynamic conditions, the coastline from the Abandoned Yellow River estuary to the coast and the underwater delta began to be eroded and transformed. The coastline retreated by about 20 km between 1855 and 1987 (Wang, 2006). Overall, the Abandoned Yellow River estuary and its two flanks are erosion coasts, the Sheyang River estuary to Xinyanggang is an alluvial and silt transition coast, and the south of Xinyanggang estuary is a silt coast. The study area is controlled by monsoon climate, with an average annual temperature of 14°C and annual precipitation of 900-1100 mm (Fang et al., 2015). Fishery farming, port transportation, and tourism are the main economic activities in the area. Since the 1980s, breakwaters have been constructed to slow down coastal erosion, and coastal setbacks have slowed down coastal erosion to diminish it. However, erosion persists due to insufficient sediments (Zhang et al., 2016). Coastal erosion has become the most severe geohazard in the region, and rapid climate change and rising sea levels may accelerate coastal erosion. Increasing coastal erosion can seriously damage the coastal environment, impede agricultural and fishery activities, and interrupt tourism. The study area includes Xiangshui County, Binhai County, Sheyang County, Tinghu County, Dafeng County, and Dongtai County, a total of 6 county-level administrative units, with a coastline length of 370 km.
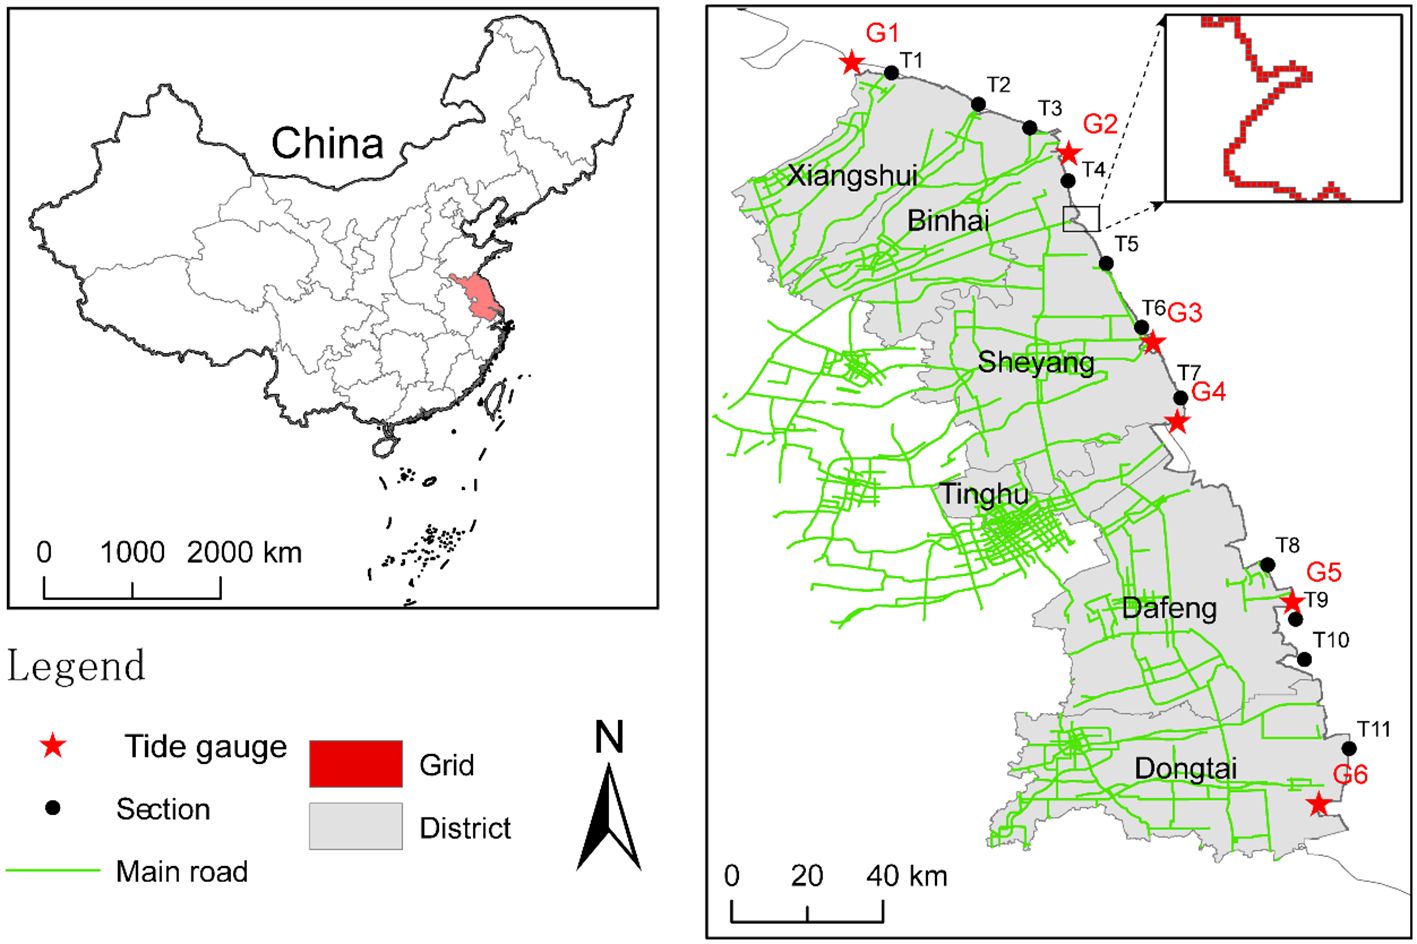
Figure 1. Location of the study area (inset map shows the Abandoned Yellow River Delta). Grids (200m ×200m) were created based on the 2019 revised surveyed coastline.
2.2 Data sources
Conducting coastal erosion vulnerability assessment necessitates the collection of topographic and geomorphological, ocean dynamics, and socio-economic information, and this information data from remote sensing interpretation and measured data, and the primary sources of data for the study are the National Ocean Information Center of China, the Chinese Academy of Sciences (CAS), satellite imagery and Digital Elevation Models (DEMs) from GLOVIS (www.glovis.gov.us), and wave data from ESA, World population data from WorldPop 2020 population density data, and road data from Openlayers. These data are then spatially processed using GIS tools, and the specific sources and data formats are presentedin Table 1.
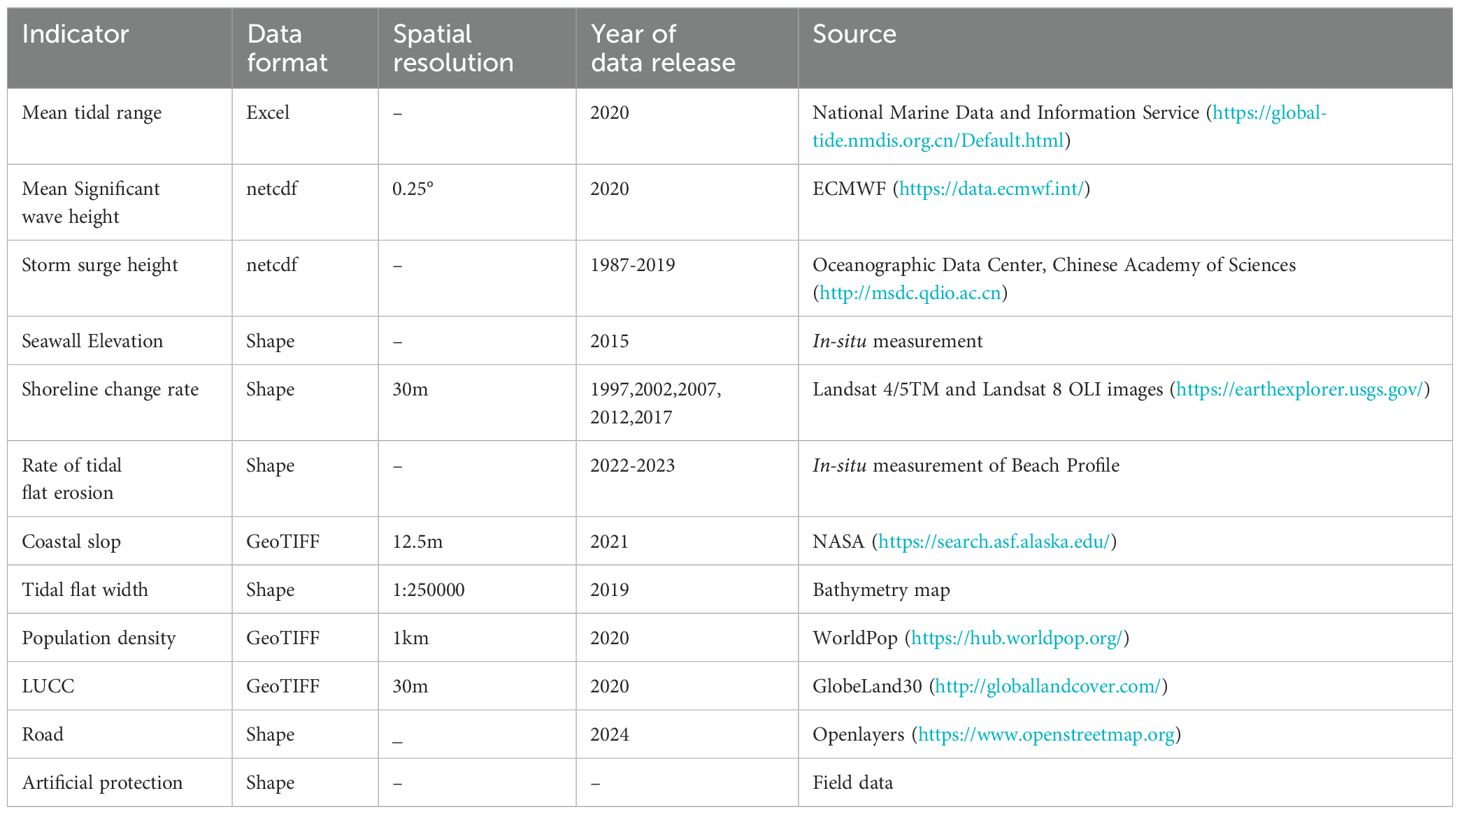
Table 1. Data type and sources used for coastal erosion assessment.
3 Methods
The research method mainly comprises four steps: (1) Selection of evaluation indexes. The ICVI includes three sub-indexes, namely the coastal dynamic index(CFVI), the coastal shape index(CCVI), and the socio-economic index(CSVI). The CFVI includes three indicators, the CCVI includes five indicators, and the CSVI includes four indicators. (2) Index grading assignment. Using the natural breakpoint method and the artificial assignment method, the coastal erosion vulnerability index was divided into five grades, namely very high vulnerability, high vulnerability, medium vulnerability, low vulnerability, and very low vulnerability, and assigned the values of 5, 4, 3, 2, and 1, respectively. (3) Coastal erosion vulnerability calculation. To evaluate the coastal erosion vulnerability, the whole coastline was divided into 2283 grids with a grid size of 200 m × 200 m. After transferring the evaluation results to each grid, the subsequent step was the conversion of the grids into line features to draw the coastal erosion vulnerability map. (4) Driving factor analysis. The geodetector was used to calculate the contribution of coastal erosion factors and analyze the driving factors of spatial differentiation of coastal erosion vulnerability. A flowchart of the coastal erosion vulnerability assessment is presented in Figure 2. Next, the specific steps of the methodology will be described in depth.
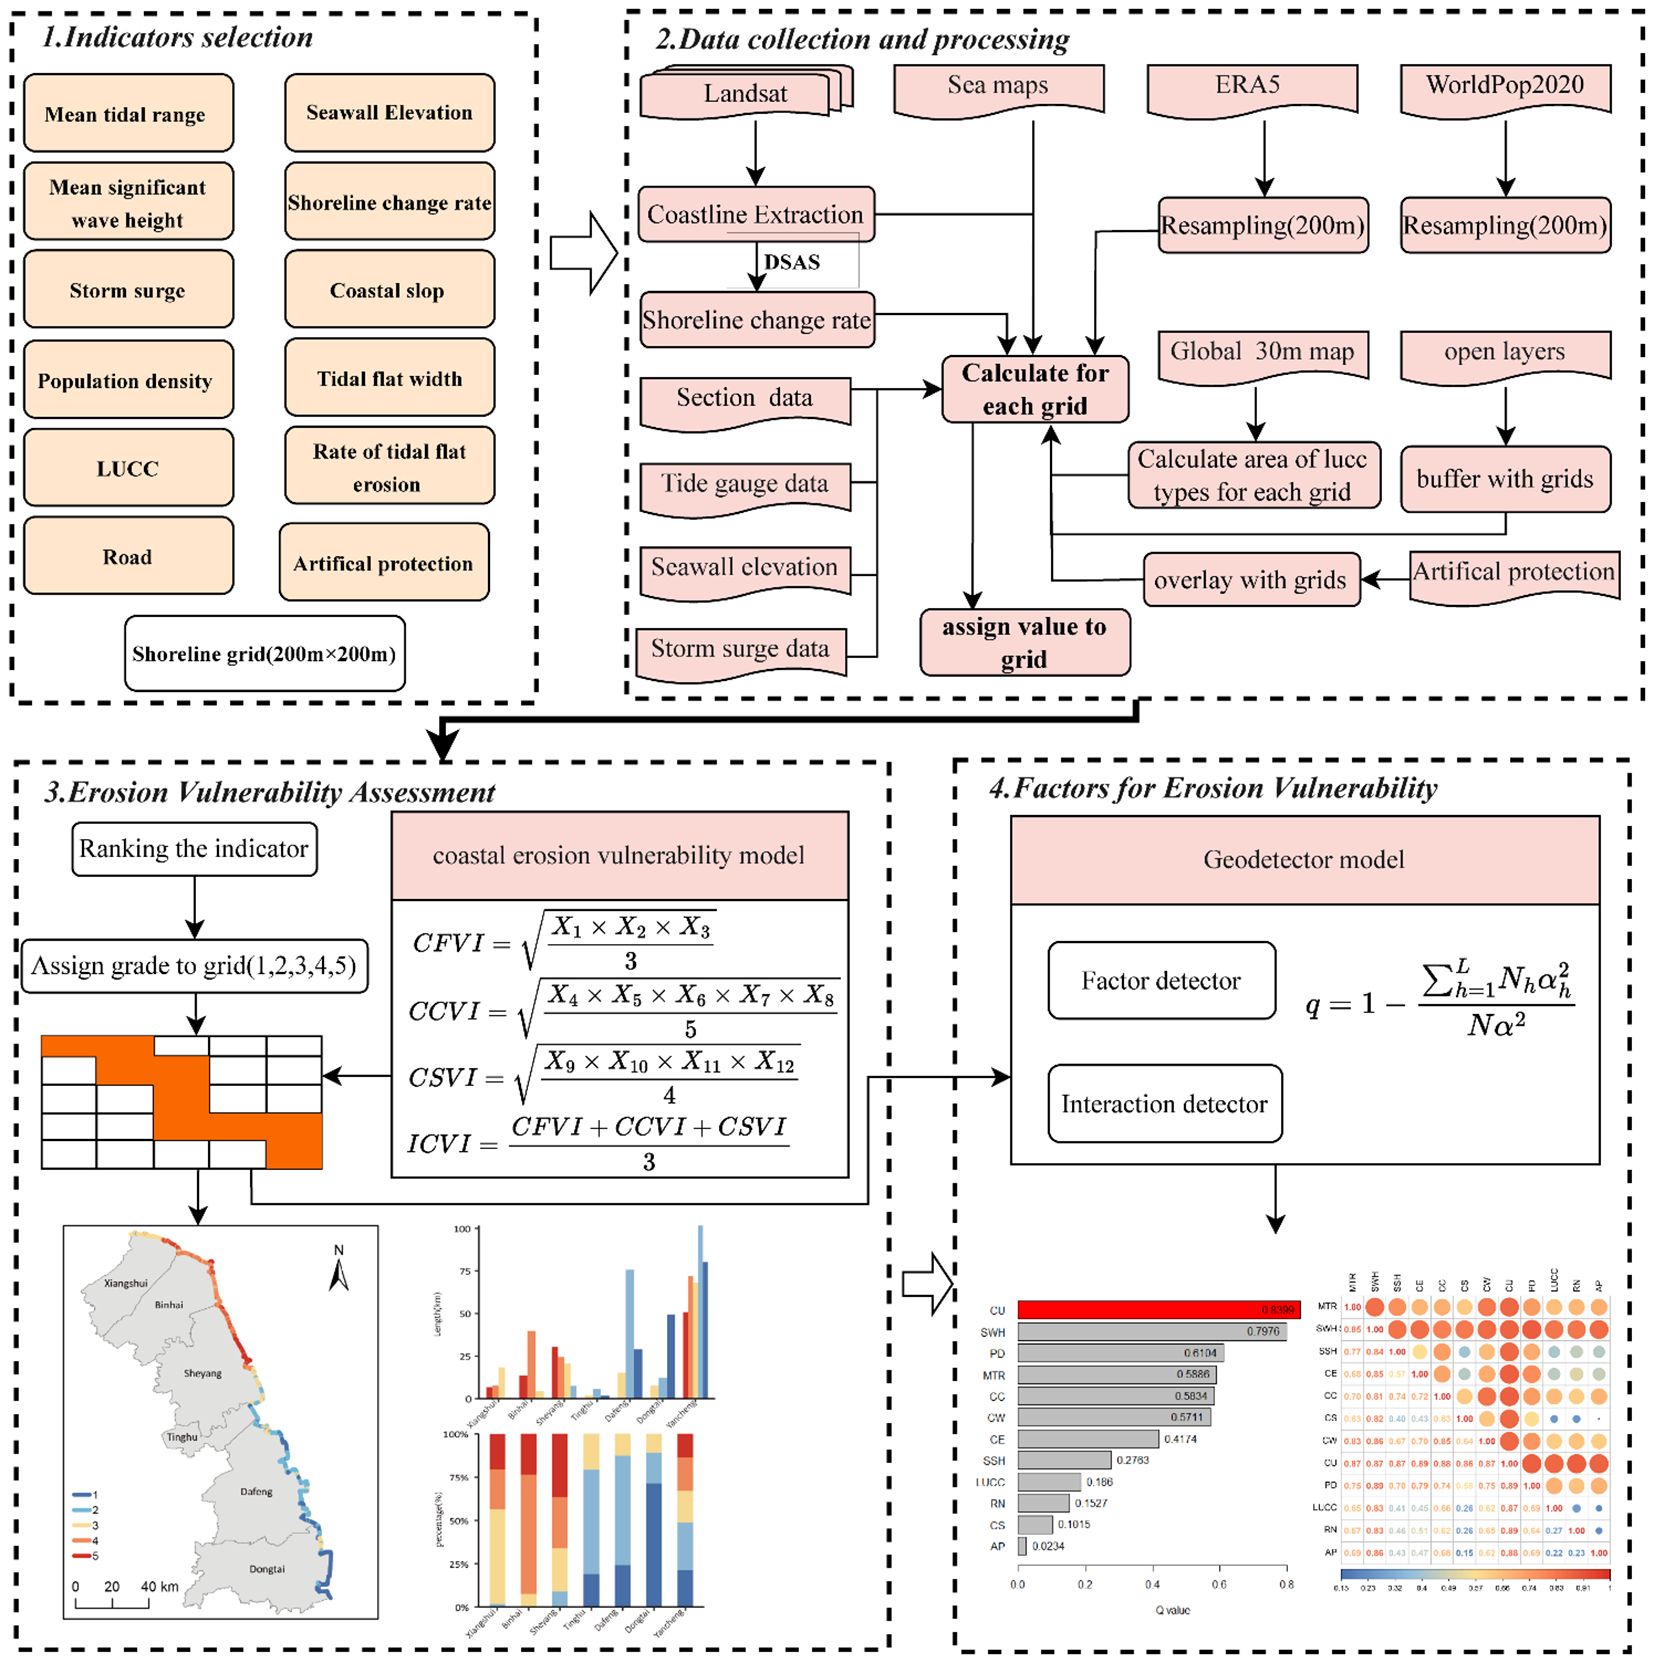
Figure 2. Summarized methodological scheme of the study.
3.1 Selection of assessment indicators
Generally speaking, coastal vulnerability is determined based on the relative contributions of three types of factors: 1) coastal characteristics; 2) coastal force variables; 3) socio-economic factors. These parameters are reasonably selected according to their importance in specific coastal areas (Hamid et al., 2021). Different scholars also select indicators from these three dimensions (Mclaughlin and Cooper, 2010; Mullick et al., 2019). Therefore, we consider the dynamic indicators, coastal morphology indicators and socio-economic indicators respectively to assess the coastal erosion vulnerability. The entire indicator selection process is based on geomorphodynamic and socio-economic criteria that are directly associated with the development of the environmental characteristics of the Abandoned Yellow River coast. In terms of physical factors, the estuary of the Abandoned Yellow River is highly open, and disasters like ocean waves and storm surges have intensified coastal erosion. Hence, the mean significant wave height and storm surge height indicators are included in the assessment system. According to Wang et al. (2021), the tidal flat width is regarded as a very effective factor for assessing coastal erosion vulnerability. Considering the regional similarity, we incorporate the tidal flat width into the evaluation system. Local seawalls have already been constructed, and although the coast has ceased to recede, the coastal undercutting is severe. Consequently, we include the Rate of tidal flat erosion indicator in the assessment system. In terms of socio-economic factors, there are numerous economic activities such as ports and mariculture along the Abandoned Yellow River coast, and the population density is relatively high, with roads being densely distributed. The local government has built seawalls, groins, submerged dikes, and other structures to further prevent coastal erosion. Therefore, we integrate population density, roads, land use, and artificial protection measures into the evaluation system. Additionally, these indicators should be easily observable or measurable using GIS and remote sensing technologies. Based on these principles, the shoreline change rate, seawall height, and slope are considered more appropriate for evaluating the vulnerability of the Abandoned Yellow River estuary coast at a local scale. A total of twelve indicators were selected (as shown in Table 2).
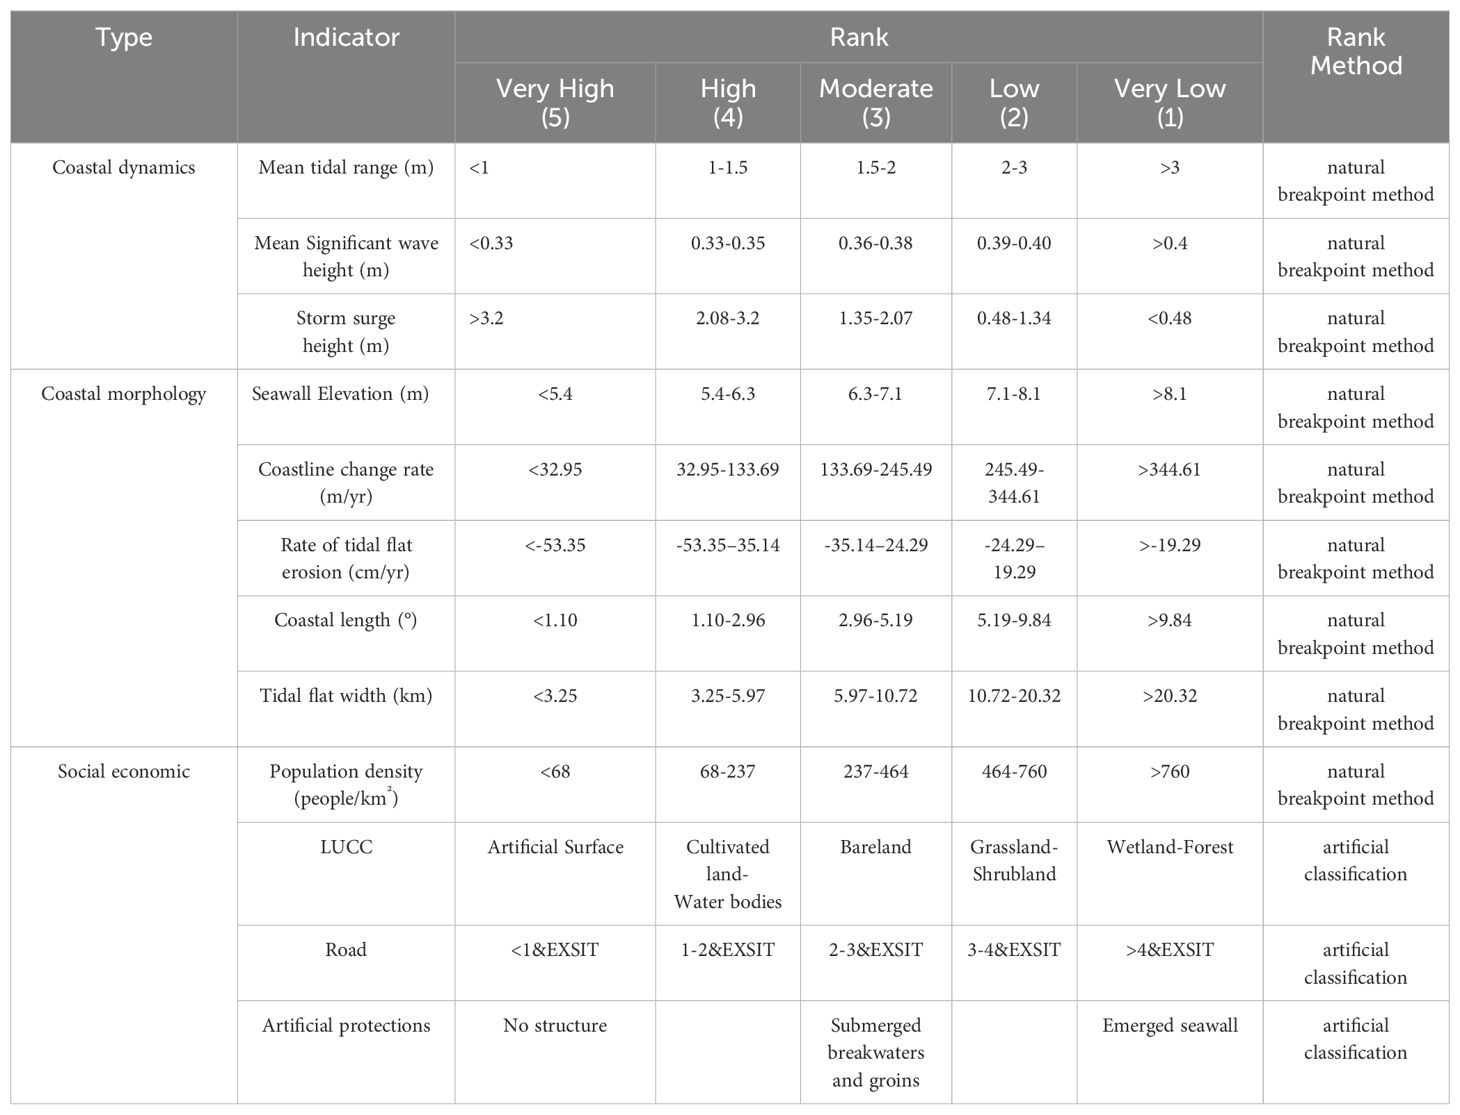
Table 2. Rank of vulnerability indicators for coastal erosion.
3.2.1 Coastal dynamics indicators
3.2.1.1 Mean tidal range
The average tidal range is the difference between the annual average high tide and the average low tide (Ariffin et al., 2023). Both permanent and episodic flood inundation hazards are associated with tidal range, an essential component of the vulnerability index. Different scholars have different opinions about the relationship between tidal spread and vulnerability; some scholars believe that vital tidal beaches have more buffer space when facing storm surges, and the higher the tidal spread, the lower coastal vulnerability (Mclaughlin and Cooper, 2010; Pantusa et al., 2018). Whereas other studies concluded that tidal currents are more robust in areas with higher tidal range, tidal currents can carry debris from the tidal flats to regions with higher tidal range, coastal erosion vulnerability increases with higher tidal range, and coasts with higher tidal range are considered to have higher vulnerability. In comparison, Coastal areas with smaller tidal ranges are deemed to have lower vulnerability (Mahapatra et al., 2015; Mafi-Gholami et al., 2019; Mohd et al., 2019; Mullick et al., 2019; Priya Rajan et al., 2020). This study concluded that the larger the tidal range, the lower the coastal vulnerability. For the assignment of grid tidal range, the method (Nageswara Rao et al., 2008) is referred to divide the grid between two sites into two equal half grids. For example, the grid between point A and point B is divided into two equal parts, while the part close to station A is assigned the estimate of point A, and similarly, the part close to station B is assigned the estimate of the B grid. Similarly, the rest of the grid is assigned according to its closer station.
3.3.1.2 Mean significant wave height
Significant wave height(SWH) is the average height of one-third of the waves in the wave spectrum (trough to peak) at a given time. According to Eq. (1), there is a positive correlation between the mean significant wave height and wave energy density, which can be used to reflect the wave energy density, and the significant wave height can be used as a proxy for wave energy (Hossain et al., 2022). The higher the wave height, the greater the wave energy density, the stronger the wave energy, the greater the amount of sediment transport, and the more likely it is to lead to coastal erosion. Therefore, the higher the mean significant wave height, the higher the vulnerability to coastal erosion. Wave data (0.25° × 0.25°) from ECMWF are used. The data are re-interpolated into 200m × 200m data, and the average significant wave height of the center point of the coastal grid is obtained. Regions with higher wave energy are described as highly vulnerable, while regions with lower wave energy are described as less vulnerable.
Where E is energy density, H is SWH, ρ is water density, and g is the acceleration due to gravity.
3.3.1.3 Storm surge height
Storm surge refers to the abnormal increase in water level caused by cyclones on top of the astronomical tide (Ahmed et al., 2022). Storm surges that can displace large amounts of coastal sediments are a major factor leading to erosion in coastal areas, and coasts that are more exposed to severe storm surges are more likely to experience greater erosion (Parise et al., 2009). Cyclone-induced storm surge is also an important indicator of erosion hazards in the coastal area of the Abandoned Yellow River Delta. Therefore, examining the extreme surge heights in the past may offer a more comprehensive understanding of coastal vulnerability. In this study, the extreme surge heights were extracted from the storm surge and wave reanalysis dataset of the typhoon and cold wave processes in the northern Jiangsu Sea from 1987 to 2019. Among the results, the maximum surge height was used to assess the vulnerability of the shorelines. After the surge heights were assigned to the grids, the next step was to reclassify the grids using the natural break classification algorithm.
3.3.2 Coastal morphology indicators
3.3.2.1 Seawall elevation
Elevation is an essential factor in coastal erosion vulnerability. It has been found that both sea level rise and storm surges can cause coastal flooding (Dike et al., 2024). Higher elevations spots are more resilient to inundation caused by sea level rise, tsunamis, and storm surges (Mani Murali et al., 2013), and this is supported by other studies such as (Angus and Hansom, 2021), which identified low-elevation coasts (0 to 5 m) as vulnerable areas. The higher the altitude, the less the occasional coastal flood is, and the coastal elevation is inversely proportional to the vulnerability of coastal erosion. The study area is a silty coast with a flat topography, so coastal elevation is a significant factor to be considered in the vulnerability assessment. Since seawalls are built all along the coast, the seawall crest elevation is adopted, and the data are from the seawall survey data in 2016.
3.3.2.2 Rate of coastline change
The coastline is the demarcation line between land and sea, a storm buffer zone, and an essential habitat for plant and animal species. Waves, nearshore circulation, sediment, and beach morphology mainly control coastline change. Under waves and currents, eroded materials in coastal areas migrate, and the coastline has always been changing. Coastal landward movement reduces the land area, resulting in the loss of natural and artificial resources, and eroding coastlines are considered vulnerable (Mani Murali et al., 2013), Conversely, silt-accumulating coasts increase land area and are considered less vulnerable (Ashraful Islam et al., 2016).
Eight Landsat images with low cloud content and 30 m spatial resolution from 1997 to 2017 were selected to extract the coastline in 1997, 2002, 2007, 2012, and 2017. Subsequently, the rate of change of the coastline was calculated using DSAS 4.3 software. Relative to the EPR method, the LRR method reduces short-term variability and potential random errors (Addo et al., 2008). The coastline change rate was calculated using the Linear Regression Rate (LRR) method, which uses the least squares method to fit a regression line that fits all coastline locations on the transect (Gibbs et al., 2019). The formula is as follows:
Where y = predicted distance from baseline, m = slope (the rate of change), and b = y-intercept (where the line crosses the y-axis).
3.3.2.3 Rate of tidal flat erosion
Coastal erosion is not only manifested as coastline retreat towards the shore but also as beach undercutting, and the greater the degree of its vulnerability. Due to the lack of long-term continuous monitoring data, many scholars did not consider the vertical erosion and siltation of tidal flats, resulting in the lack of representative vulnerability assessment results (Fu et al., 2022). At present, due to the construction of seawalls in the area of the Abandoned Yellow River estuary, the rate of coastline retreat has slowed down. However, the undercutting of the coastline persists, and it is difficult to truly reflect the coastal erosion only through the rate of change of the coastline. In order to comprehensively evaluate the erosion status of the beach, in March 2022 and March 2023, respectively, during the ebb tide period, the UAV measurement system was used to carry out the elevation measurement of 11 sections in the tidal flat area of the Abandoned Yellow River coast. The measured point cloud data generated a TIN, was converted into a DEM, and the section elevation points were extracted into shapefile format, and the erosion rate of the tidal flat was calculated.
3.3.2.4 Coastal slope
The slope is the ratio between the change in height and the horizontal distance between any two points on the coast (Canul Turriza et al., 2024). Regarding the relationship between slope and coastal erosion, some scholars believe that salt marshes, tidal flats, and deltas have lower slopes and are susceptible to storm surges and large waves (Ghaderi and Rahbani, 2024). The higher the slope, the more vulnerable to erosion (De Pippo et al., 2008). Slope reflects the relative risk of coastal inundation and the potential rate of coastline retreat (Koroglu et al., 2019; Miah et al., 2020); for the exact height of water level rise, the smaller the slope of the tidal flat, the greater the extent of inundation and the greater the vulnerability of the coast to erosion, so the more steep the slope, the lower the vulnerability to coastal erosion (Miah et al., 2020). While other scholars believe that the greater the slope, the lower and steeper the elevation, the more vulnerable the area is to coastal erosion. Vulnerability increases with decreasing elevation because wave action and tides initially affect these areas, and seawater reaches these areas first (Li et al., 2015). This paper concludes that the greater the coastal slope, the lower the coastal vulnerability. Using ArcGIS software, ASTER DEM (12.5m) data was used to calculate the slope of the coastline. The coastal slope was categorized into five classes, where the vulnerability of areas with steep slopes was considered very low. The vulnerability of gently sloping areas was considered very high. Slope can be expressed in degrees or percentages, and in this study, it was expressed in degrees.
3.3.2.5 Tidal flat width
Tidal flat width indicates the distance between the coastline and the low tide line; tidal flats can slow down and attenuate the incoming hydrodynamic energy and serve to protect the coast, whereas the smaller the width of the tidal flats, the greater the energy of the tide to scour the tidal flats, and the higher the corresponding degree of coastline erosion and retreat, and the greater the vulnerability (Davidson-Arnott et al., 2019). In addition, more expansive tidal flats typically have vegetation growing over more considerable distances, buffering and releasing energy, making them relatively less vulnerable (Fu et al., 2022). Tidal flats are narrowed by the continuous retreat of the coastline and the limitation of landward expansion by seawalls, and the width of the tidal flats influences coastal erosion vulnerability, with more extensive tidal flats having greater wave dissipation capacity (Nageswara Rao et al., 2008; Li et al., 2015). Using DSAS4.3 software, the coastline, and the chart 0 m isobath as two-time coastline, for the convenience of calculation, artificially set the time interval of the coastline one year by constructing the baseline on the landward side of the coastline according to the interval of 200 m, generating the cross-section, calculating the rate of change of the endpoints, and the result that is the calculation of the distance between the coastline and the chart 0 m isobath as the width of the tidal flats, and using the ArcGIS connectivity tool to get the tidal flat width of the grid cell finally.
3.3.3 Socio-economic indicators
3.3.3.1 Population density
Population density refers to the intensity of human activity on different coasts over a given period. Population data is the basis for understanding the extent of impacts and damage that may be caused by natural hazards to determine which areas of the population are more vulnerable to marine hazards (e.g., coastal erosion) (Canul Turriza et al., 2024). Rapid coastal population growth puts more pressure on coastal land and natural environments, which in turn increases vulnerability levels. Coastal areas with high population density have more people injured or killed during coastal erosion hazards, and areas with high population density are at greater risk of coastal erosion vulnerability. Population is one of the main socio-economic variables affecting the vulnerability to coastal hazards in a region (Kunte et al., 2014; Charuka et al., 2023; Parvin et al., 2008). In this study, the population density data of coastal areas is derived from the World Population 2020 population density data set. The data was resampled to 200m × 200m, and the population data was divided into 1 to 5 levels using the natural breakpoint optimization classification method.
3.3.3.2 Land use
Land use is an essential indicator of infrastructure vulnerability, and land use/land cover type is an important determinant of coastal vulnerability (Mclaughlin and Cooper, 2010; Mullick et al., 2019). An area is considered vulnerable if it is sufficiently ‘significant’ in economic, cultural, or environmental terms (Mahapatra et al., 2015). The value of land use and land cover can be determined based on the economic losses caused by each LUCC category; for example, built-up areas are more exposed to marine hazards than mudflats to economic losses caused (Dey and Mazumder, 2023). Based on the ranking of the monetary value of the land use cover type in terms of direct human benefit, coastlines were categorized into five classes: very high, high, medium, low, and very low. CAS obtained land cover types from the 2020 land use map (30m resolution), which consists of seven land cover categories: artificial surfaces, cropland, bare ground, grassland, shrubland, wetlands, and water bodies. If a grid consisted of several land cover types, the dominant land cover of the grid was determined based on the area’s size, and the grid’s score was determined based on the dominant land cover type (Sekovski et al., 2020).
3.3.3.3 Roads
Roads are one of the essential means of access to any area and are one of the most critical human infrastructures in coastal regions (Mahapatra et al., 2015). Roads near the coastline are more vulnerable to damage from external coastal forces and coastal erosion (Tano et al., 2016). In addition, roads are costly to maintain, and road damage hinders emergency response in the event of coastal erosion disasters, making it critical to assess the proximity of roads to the current coastline. Road data were obtained from Open Street Map road data in 2024. Using ArcGIS, buffer zones were set up around the grid perimeter according to 1km, 2km, 3km, 4km, and 5km, and the vulnerability level of the grid cells was determined based on the presence or absence of road distribution within different buffer distances, e.g., if there are road data within 1km, then the vulnerability level of the grid is 5 (Table 2).
3.3.3.4 Artificial protection
Coastal engineering structures such as sea walls, dikes, and boulders absorb and/or deflect oceanic energy, thereby protecting their backshore areas from the threat of erosion or structural damage (Jonah et al., 2016).Artificial protection is an element that influences the vulnerability of a coastal sector. Artificial protection serves as a defense of the coast against storm surges and the impacts of coastal erosion (Torresan et al., 2012). The presence of artificial protection is considered a relevant factor that reduces the susceptibility of the coast to coastal erosion and storm flooding (Özyurt and Ergin, 2010). Here a coast was classified with or without artificial protection (Canul Turriza et al., 2024). Each grid was classified according to whether there were coastal protection measures on the outside. Based on whether the grid included protection measures, the coast was divided into sea walls, submerged breakwaters and groins, and no protection measures, and assigned values of 1, 3 and 5 respectively (Mohamed, 2020).
3.2 Indicator criteria and grading
Two methods were used for indicator grading: the natural breakpoint method for numerical data and the manual classification method for type data. The natural breakpoint method is based on the natural grouping inherent in the data. By identifying the classification interval, it can carry out the most appropriate grouping of similar values. Moreover, it maximizes the differences between classes and sets the boundaries at the positions where the data values of each type differ significantly, thus achieving the determination of the indicator grade (Chen et al., 2013). According to the natural breakpoint method, the evaluation indicators are divided into five classes, which are very high (5), high (4), medium (3), low (2), and very low (1), and the criteria of each indicator class are shown in Table 2.
3.3 Calculation of indices
According to Eq. (3), Eq. (4), and Eq. (5), the CFVI, CCVI, and CSVI scores were calculated and categorized into five categories from 1 to 5 indicating very low (1) to very high (5), respectively. Then, all three thematic indices were combined according to Eq. (6) to calculate the quantitative values of the spatial distribution of erosion vulnerability for the whole study area. Finally, the resulting values were categorized into five vulnerability categories using the natural breakpoint method.
Where: CFVI is the Coastal Dynamic Vulnerability Sub-Index, CCVI is the Coastal Morphological Vulnerability Sub-Index, CSVI is the Socio-Economic Vulnerability Sub-Index, and ICVI is the Coastal Erosion Vulnerability Index, and Xi is the scoring value of a single indicator.
3.4 Driving force analysis method for spatial differentiation of coastal erosion vulnerability
A geographical detector is a quantitative analyzing method developed based on spatial partition theory, which can effectively analyze the degree of influence of independent variables on dependent variables (Wang et al., 2010).The method can quantitatively analyze the driving mechanisms of geographic phenomena and is widely used to determine the explanatory power of the drivers and the interactions between the factors without many assumptions (Shi et al., 2018).
The key to using Geodetector is to discretize the detection indicators reasonably. To circumvent the subjective influence of the traditional geographical detector on data discretization, we used the optimal parameters-based geographic detector (OPGD) model (Song et al., 2020) in R to select the combination of discretization parameters that maximizes the q value. A factor detector was then employed to explore the spatial heterogeneity of ecological sensitivity. The formula used is as follows:
Where: h=1,2,……L, L is the number of independent variables X (i.e., indicators) or the number of strata; Nh and N are the number of samples in the stratum and the number of samples in the whole study area, respectively, and are the variance of the values in the stratum and the entire study area, respectively.
The larger the value of q,the stronger the influence of the spatial variability of the indicator on the spatial variability of coastal erosion vulnerability, i.e., the stronger its explanation of the spatial differentiation.
The interaction detector determines whether two individual factors enhance or weaken each other by comparing their combined contribution and their independent contributions (Wang et al., 2010). The model classifies the interactive relationship between two factors into seven types as follows:
4 Results
4.1 Coastal dynamics
4.1.1 Mean tidal range
The tidal range in the study area was distributed between 2.12 m and 4.44 m, with an average value of 3.20 m. The analysis results of the counties showed that Dongtai had the largest mean tidal range of 4.44 m, while Tinghu had the smallest at 2.22 m.
Overall, the northern offshore of the study area was controlled by the rotating wave centered on the no-tide point. The forward tidal wave of the East China Sea constrained the southern sea area. The two tidal waves converged off the shore of the snare, forming a trend of increasing tide difference to the north and south centered on the mouth of the Sheyang River. The coastal erosion vulnerability class by mean tidal range is shown in Figure 3A.
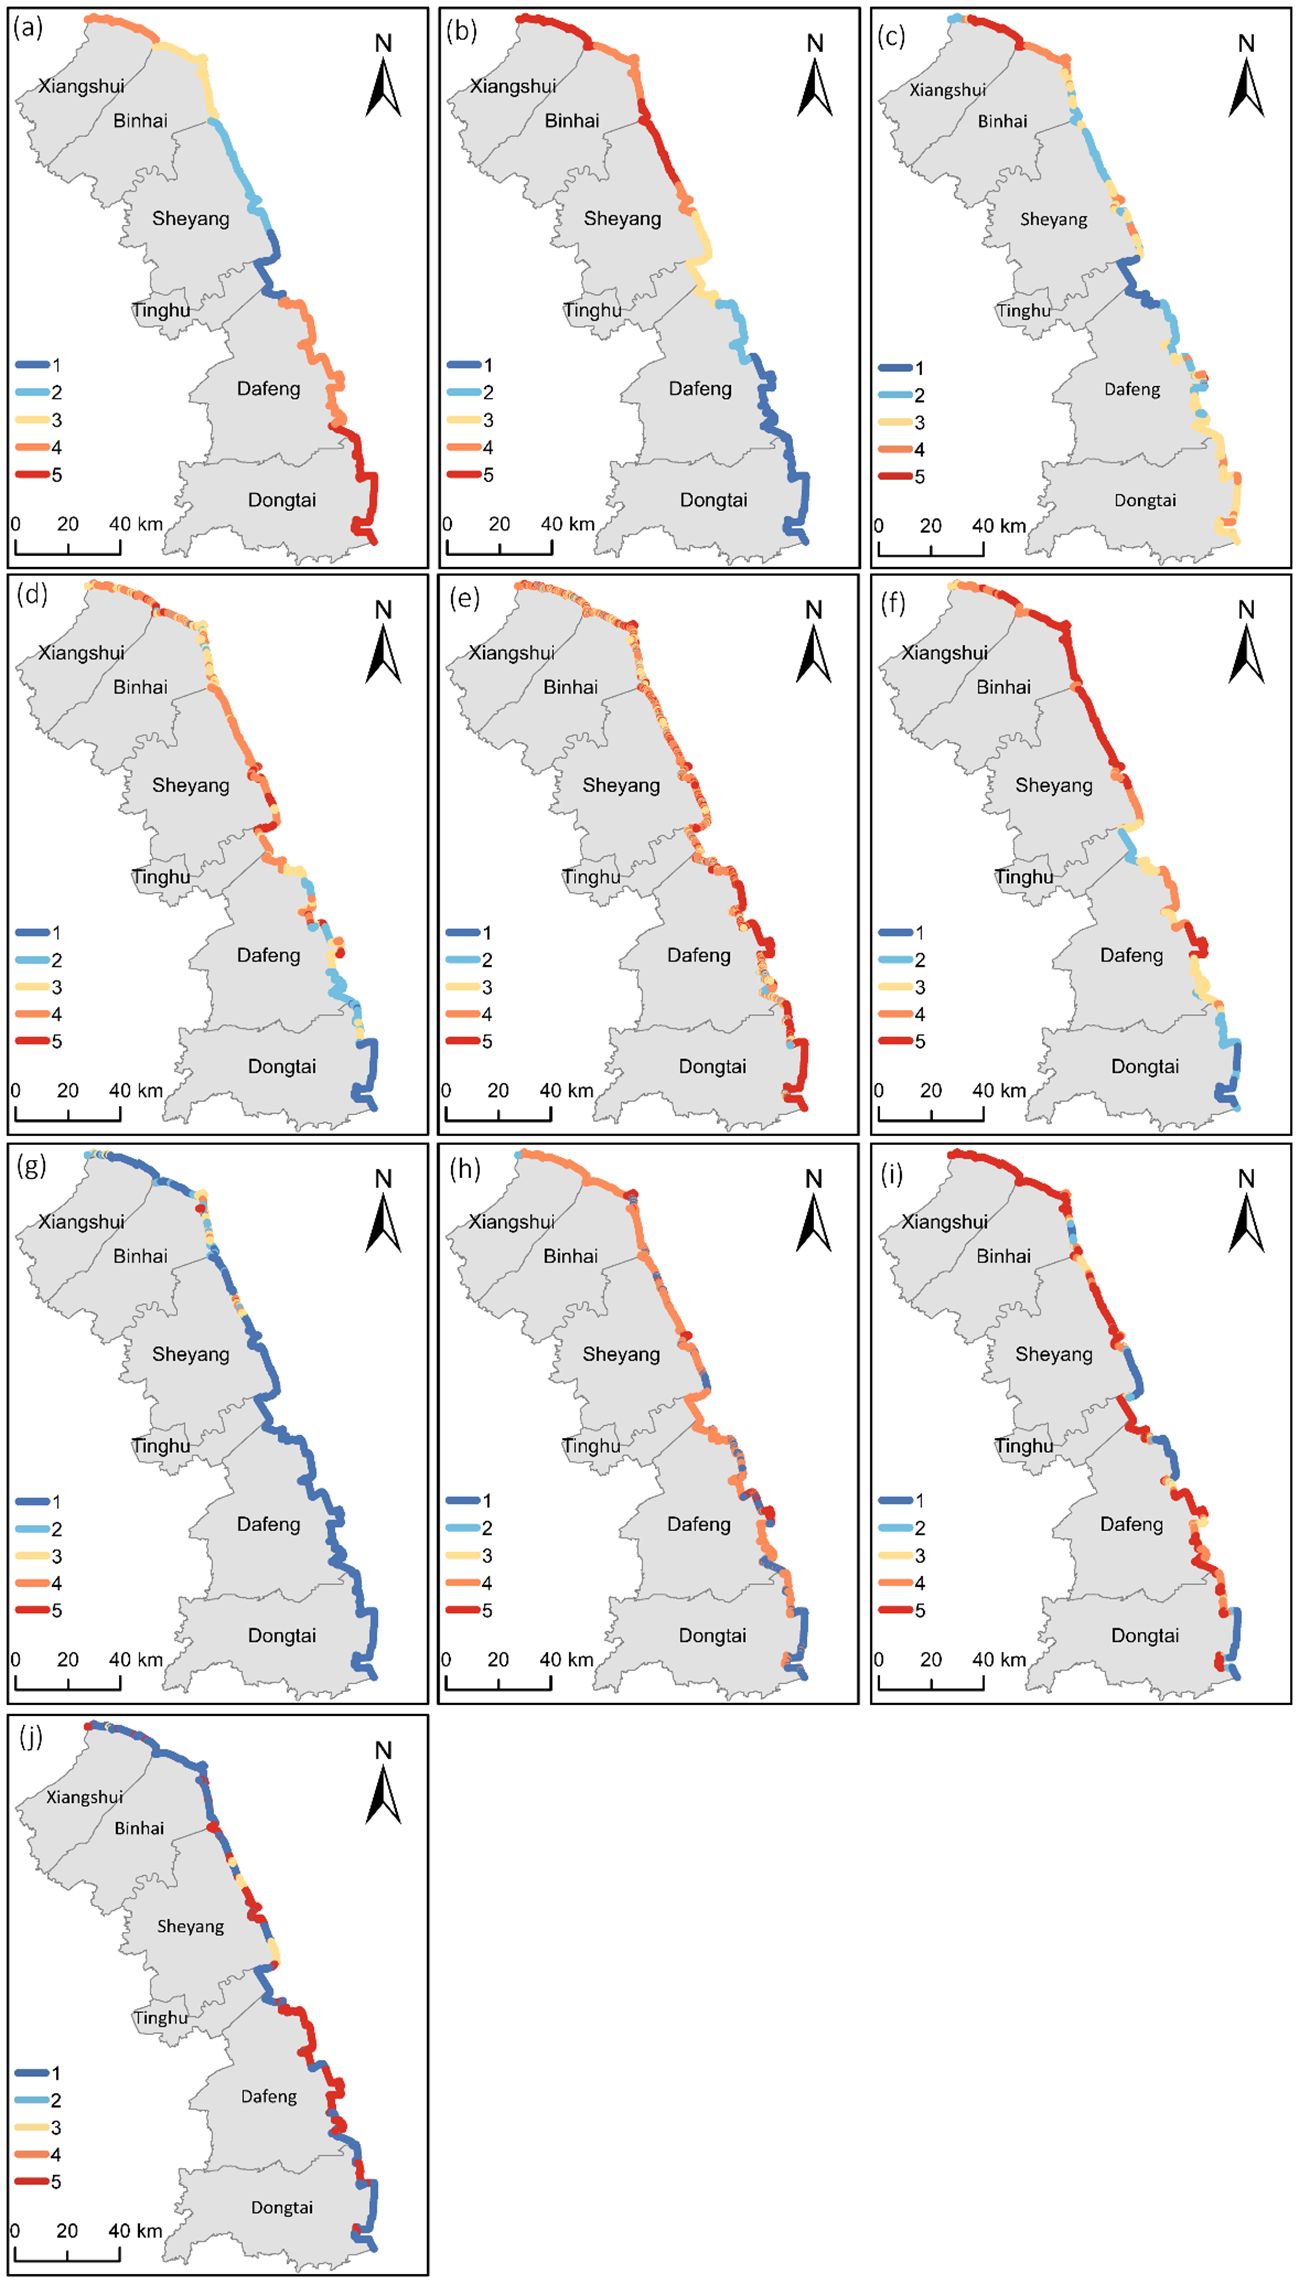
Figure 3. Spatial distribution of erosion vulnerability categories of different indicators such as (A) Mean tidal range, (B) Mean significant wave height, (C) Storm surge height, (D) Seawall elevation, (E) Coastal Slope, (F) Tidal flat width, (G) Population Density, (H) Land use land cover, (I) Roads, (J) Artificial protection.
4.1.2 Mean significant wave height
The mean significant wave height in the study area ranged from 0.312 m to 0.422 m, with an average value of 0.319 m. The results for each county showed that Dongtai had a mean significant wave height of 0.414 m, the highest among all counties.
The average significant wave height in Xiangshui was 0.319m, the lowest among coastal counties. The mean significant wave height in the study area showed a decreasing trend along the coast from north to south. The coastal erosion vulnerability class based on the average significant wave height is shown in Figure 3B.
4.1.3 Storm surge height
In the study area, the storm surge height is between 0 and 5.26 m, with an average value of 1.52 m. In terms of counties, the average value of storm surge height in Xiangshui is 3.28 m, which is the largest among all counties. Secondly, in Binhai, the average storm surge height is 2.19 m. Generally, the storm surge height is higher in the north and lower in the south. The coastal erosion vulnerability class by Storm surge height is shown in Figure 3C.
4.2 Coastal morphology
4.2.1 Seawall elevation
The coasts in the study area were all built with seawalls, and the seawall elevations were mainly distributed between 4.0m and 9.2m. The overall coastal elevation showed a low distribution in the north and a high in the south. There was little relief in the area north of the mouth of the Sheyang River and relatively large changes in relief on the south side. Areas with more significant seawall elevations were mainly located in Xinyang Harbor-Chuandong Harbor, and smaller areas were located on both sides of Dafeng Harbor and in the area south of the mouth of the Chuandong Harbor-Fangtang River. In terms of counties, the average seawall elevation in Dongtai was 8.4 m, and the lowest seawall elevation in Sheyang was 5.68 m. Coastal erosion vulnerability based on coastal elevation is shown in Figure 3D.
4.2.2 Coastline change rate
The coastline of the Abandoned Yellow River coast was extracted based on Landsat images in 1997, 2002, 2007, 2012, and 2017, respectively. The coast was divided into sections with 100m intervals based on the DSAS model, and the coastline change rates were calculated using the LPR method. The results are shown in Figure 4A. The coastline change rates in the study area were distributed from -60.13m/yr to 504.33m/yr, in which the average value of R2 for all sections was 0.64. The average rate of coastline advancement to the sea was 140.55m/yr. The maximum rate of advancement and retreat appeared in section 1723 and section 560, respectively, with the maximum rate of advancement of 504.33m/yr, while the maximum retreat rate was - 60.13 m/yr (Figure 4C), the coast of the study area advances seaward in the south and retreats landward in the north, with the overall seaward advance dominating. From the administrative area, the seaward coastline advance rate was 273.97 m/yr in Dongtai, the highest among all counties.
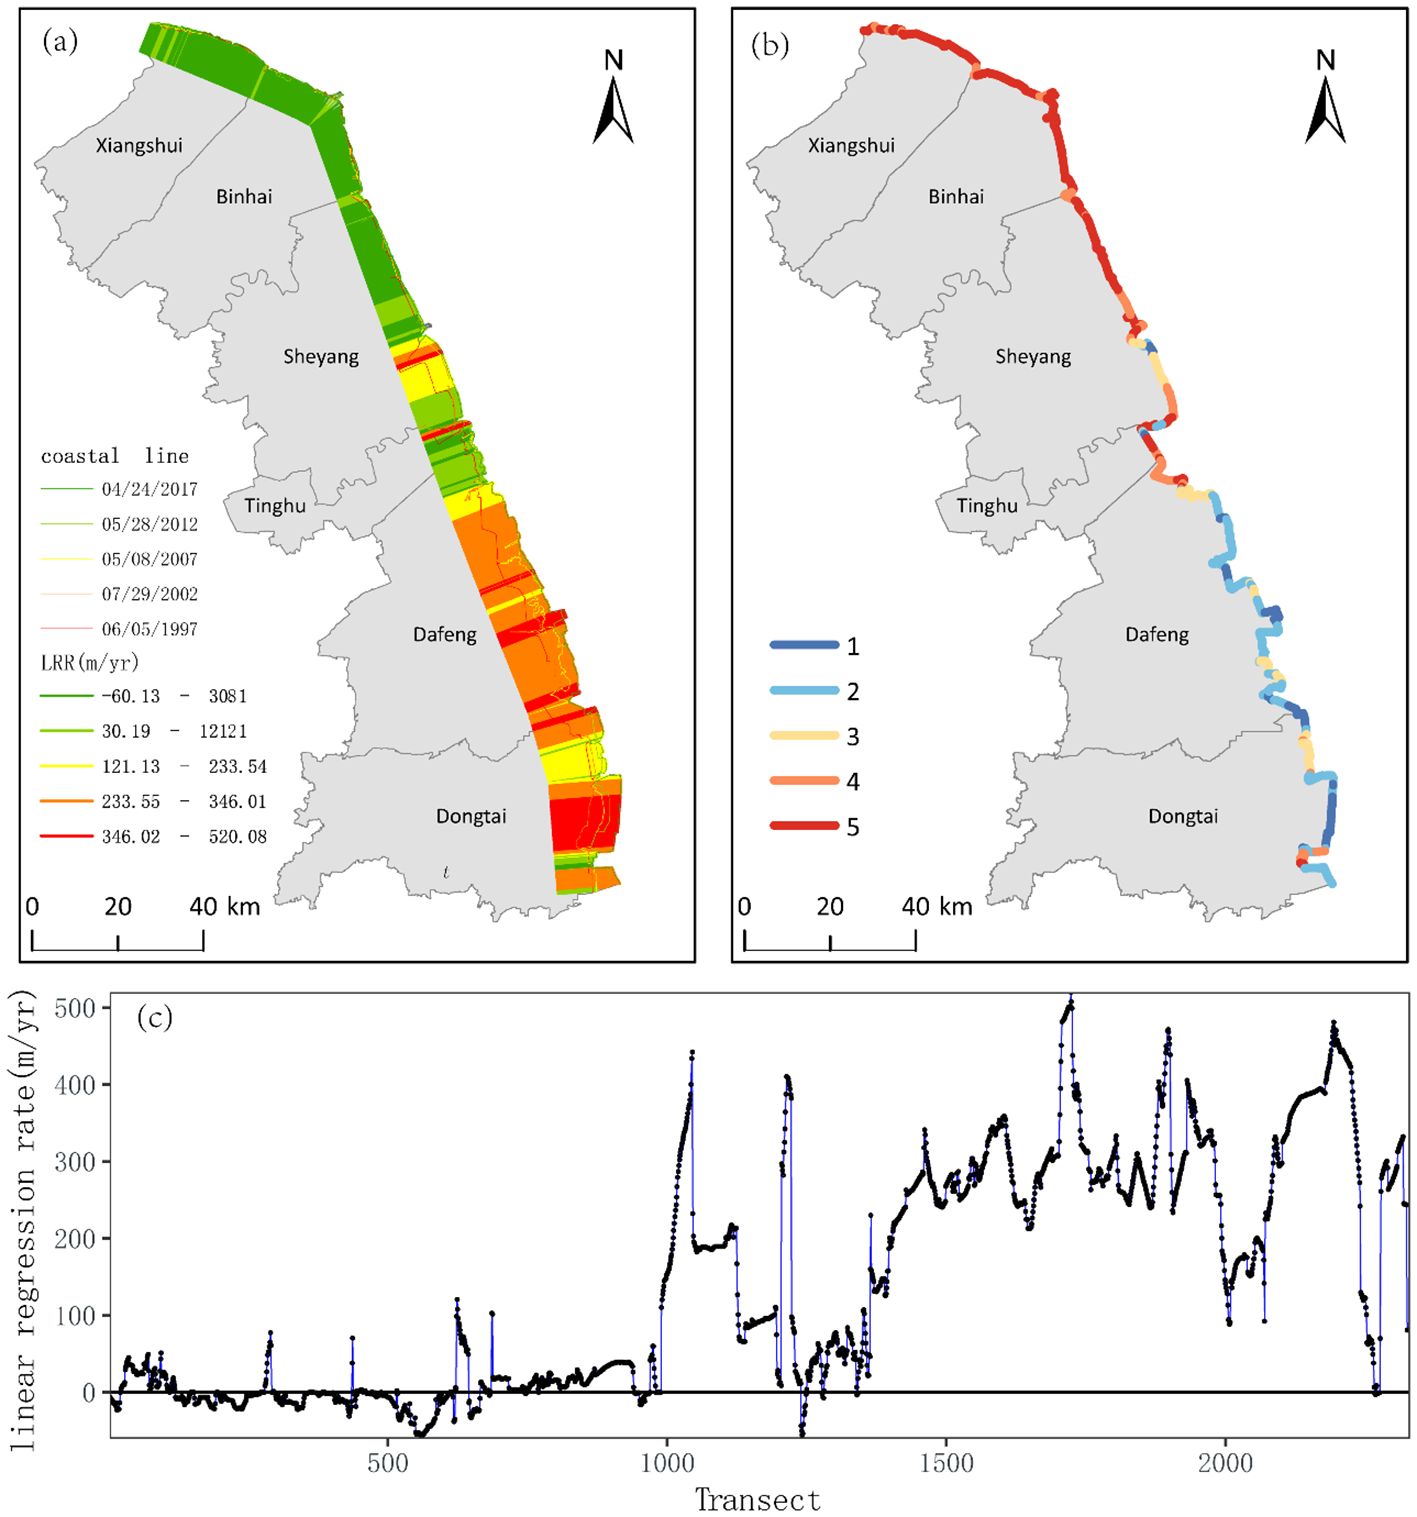
Figure 4. (A) Spatial pattern of accretion and erosion in the selected region (B) Spatial distribution of erosion vulnerability category of coastline change rate (C) Line graph shows the variations of positive and negative LRR along the coast.
In contrast, Binhai had the highest coastal erosion rate of -13.34 m/yr. In comparison, the advance rate of Xiangshui adjacent to Binhai was 2.60 m/yr, the seaward advance rate of the coast of Sheyang was 74.06 m/yr, and the seaward advance rate of Tinghu was 104.98 m/yr. The vulnerability level of coastal erosion, delineated based on the historical rate of coastline variability for 20 years, is shown in Figure 4B, with the very high and high vulnerable areas mainly located in the north.
4.2.3 Coastal slope
The degree of coastal erosion is closely related to the size of the slope. The more gentle the slope is, the greater the extent of inundation as waves approach the coast. The results showed that the coastal slope ranged from 0.0 to 22°, and the overall coastal topography was gentle, with an average slope of 1.83°.Areas with steeper slopes were located at the mouth of the Zhongshan River - Biantan Harbor. Those with gentler slopes were mainly distributed on the south side of the mouth of the Irrigation River - Abandoned Yellow River and the mouth of the Chuandong Harbor - Fangtang River. Regarding administrative areas, the average slope of Xiangshui was the largest of 2.27°, and the average slope of the coast of Dongtai was the smallest at 0.761°. Coastal erosion vulnerability based on the coastal slope is shown in Figure 3E.
4.2.4 Tidal flat width
The width of tidal flat in the study area is between 0 and 33.63 km, with an average width of 7.41 m. The distribution of tidal flat width is bounded by the Sheyang Estuary as a whole. The northern part decreases from Guanhe Estuary to the south, and the width of tidal flat in the south of Sheyang Estuary increases gradually. Regarding administrative units, the average width of tidal flats in Dongtai was 19.6km, the largest among all counties. In comparison, the average width of Binhai was only 2.31km, and the minimum value of tidal flats width in some sections of the bank was 0. The coastal erosion vulnerability according to the width of the tidal flats is shown in Figure 3F, of which the very high and high vulnerable areas were mainly located in the north of the mouth of the Sheyang River.
4.2.5 Rate of tidal flat erosion
Eleven sections were set up in the study area (Figure 1). In March 2022 and March 2023, respectively, tidal flats elevation measurements were conducted, and the annual elevation change rates of tidal flats were calculated. The results showed that the annual elevation change rates ranged from -53.35 to 14.28 cm/a; The section with the most significant decrease in elevation was T10 at -53.35 cm/a, and the section with the most significant increase in elevation was T12 at 14.28 cm/a (Figures 5A–L). 9 of the 11 sections were sedimentation sections, indicating that most of the tidal flats subsided downward. In contrast, the coastline change rates showed that the south side of the coast was dominated by seaward advancement, which made it challenging to reflect the actual condition of coastal erosion. According to the coastal subsidence, the coastal vulnerability class is shown in Figure 5M. The very high vulnerable areas were mainly in Sheyang, and the high vulnerable areas were primarily in Binhai and Xiangshui.
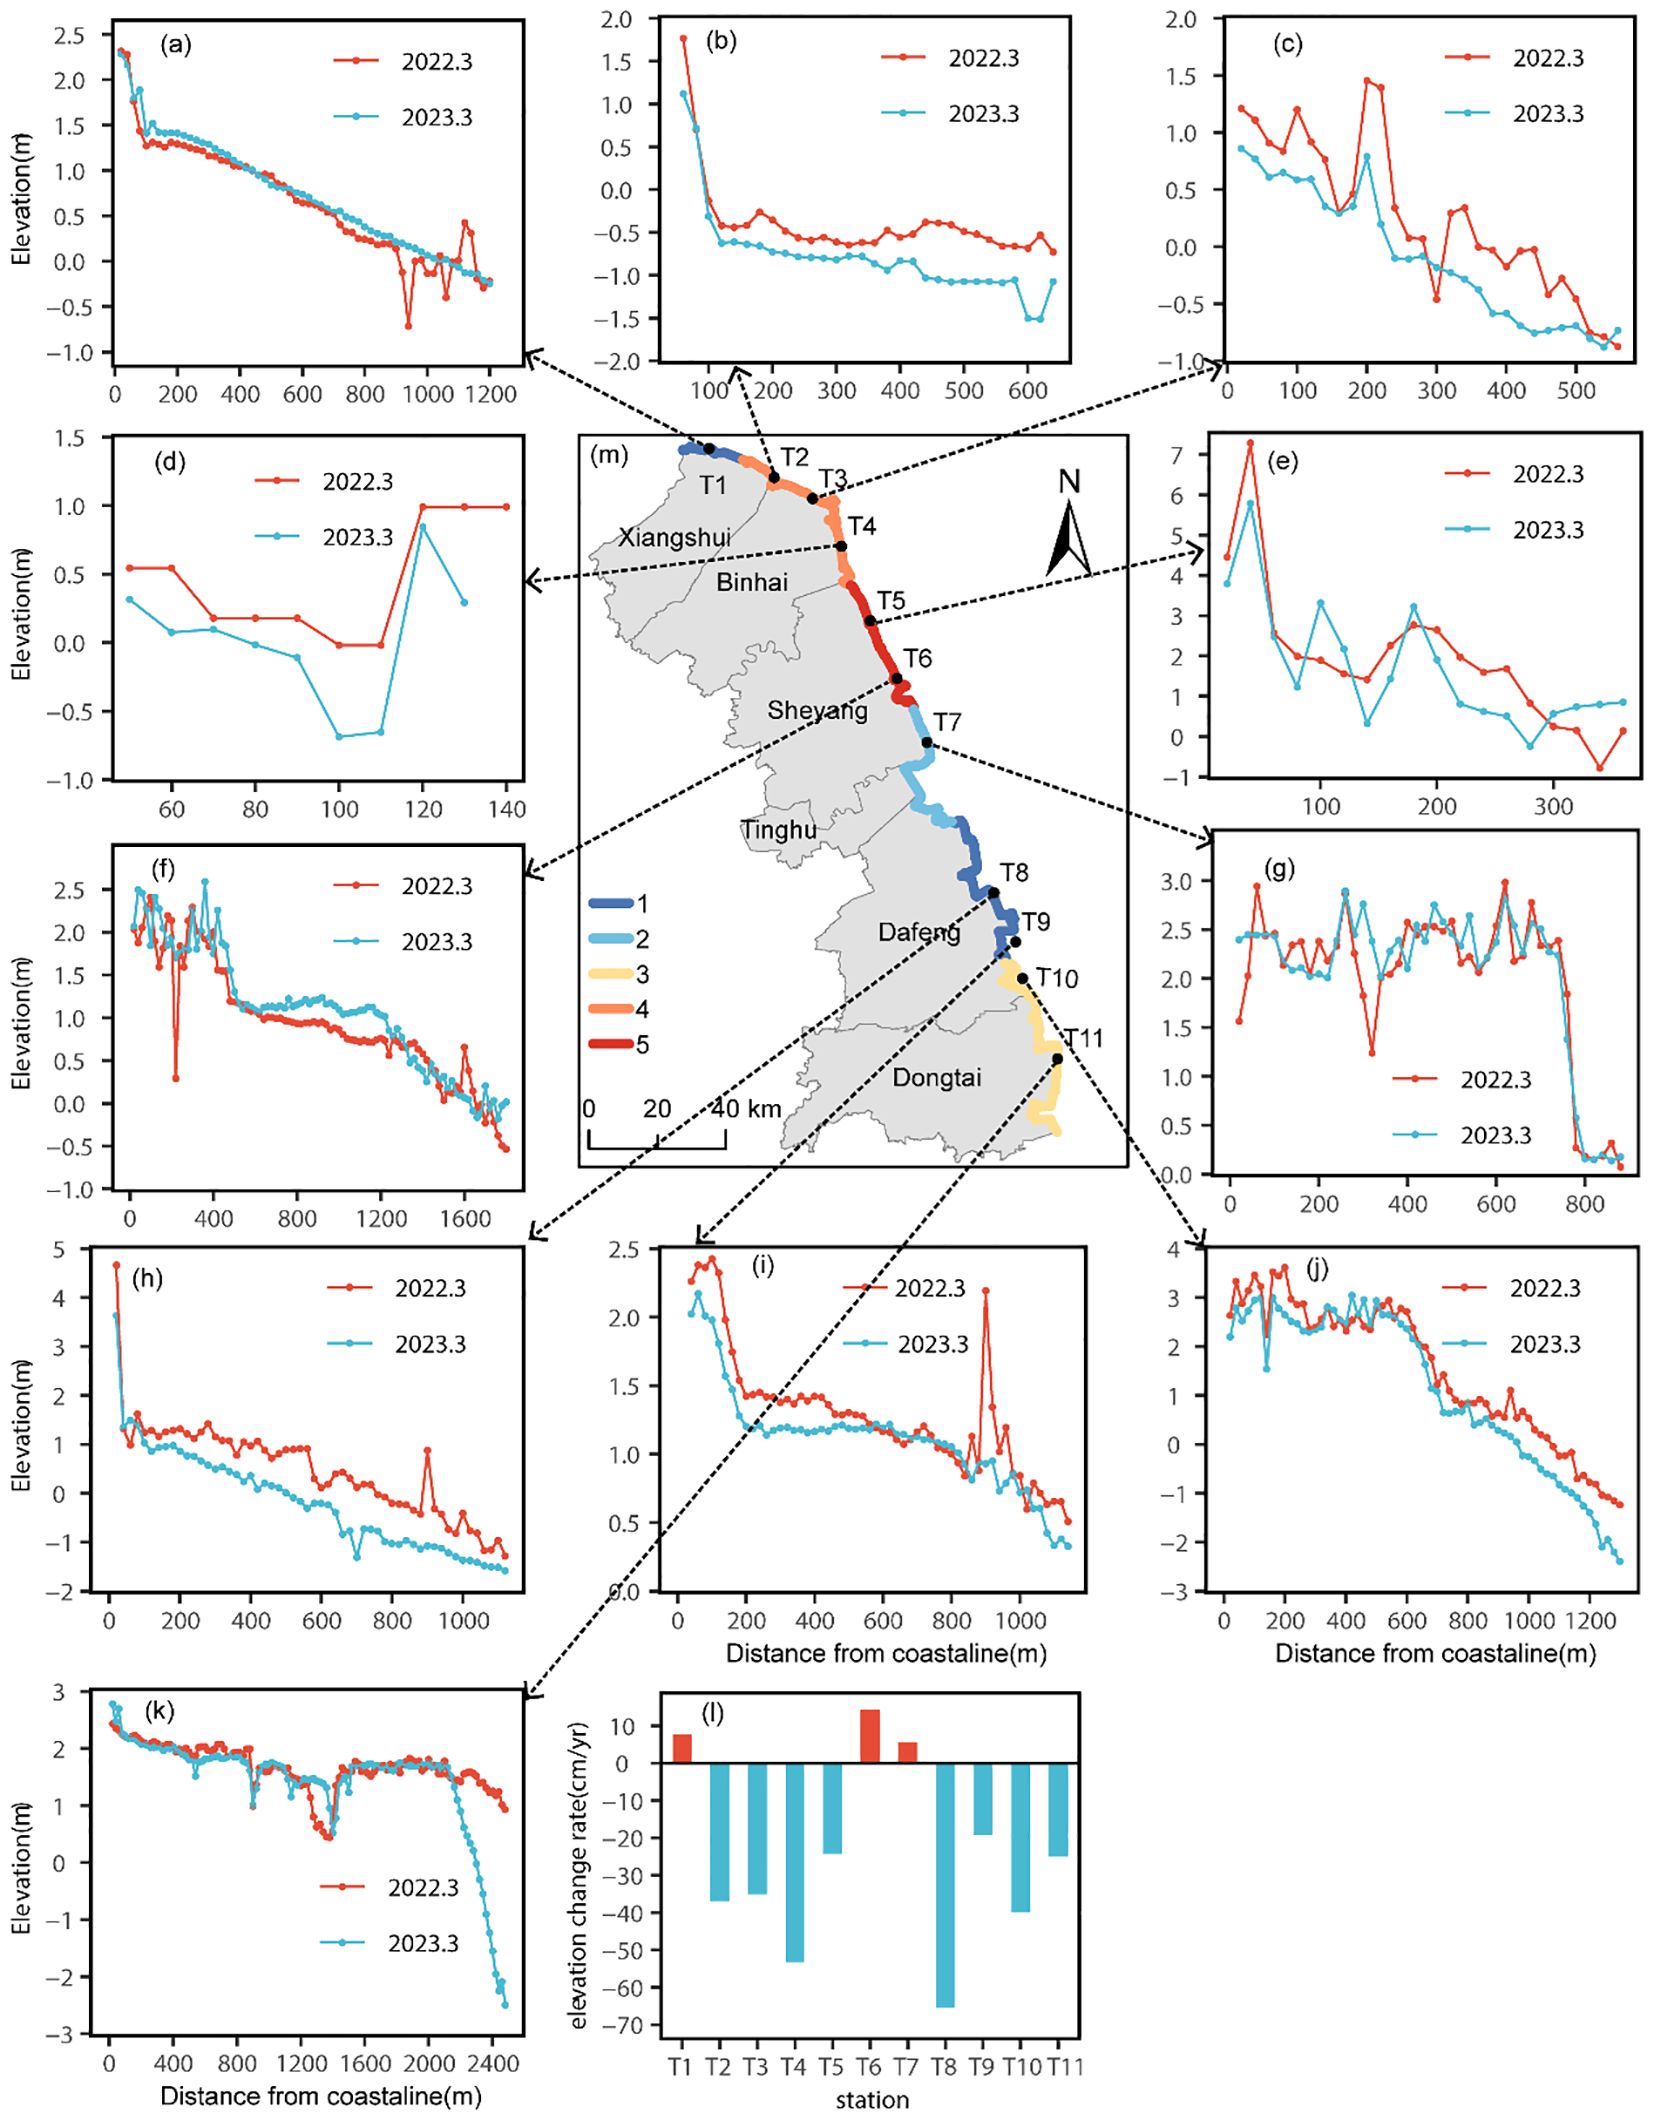
Figure 5. (A-K) graphs show the height measurement result from station T1 to T11 (L) Annual rate of change in elevation from station T1 to T11 (K) Spatial distribution of erosion vulnerability category of coastal subsidence (M).
4.3 Socio-economic
4.3.1 Population density
The greater the population density of an area, the greater the coastal erosion vulnerability. The population distribution in the study area was uneven, and the population density along the 374km coastline was low, with an average of 83 people per km2. The overall population density showed a pattern of high in the north and low in the south. The results of each county showed that the average population density of Binhai is the largest at 255 people per km2, and the average density of the neighboring Xiangshui was 101 people per km2. The coastal erosion vulnerability based on population density is shown in Figure 3G.
4.3.2 Land use
The statistics of land use and land cover area within the 200m grid divided along the coast showed that water bodies such as farm ponds were the main LUCC categories, accounting for 43.12% of the region’s area. In contrast, the area of cropland and salt marsh wetlands accounted for 22.61% and 16.38%, respectively, and farm ponds and cropland were the ones that were susceptible to coastal erosion hazards. The land use cover characteristics in each county showed that cropland was the main land cover category in Binhai; water bodies such as aquaculture ponds were the main land cover categories in Dafeng, Dongtai, Sheyang, and Tinghu; and artificial surfaces such as industrial, mining, and transportation facilities were the main land cover categories in Xiangshui. Due to the inconsistency between the grid scale and the resolution of the source data, the land use type with the largest area of the grid cell was used as the land use type of the grid. Then, the vulnerability level of the grid and the coastline was determined according to Table 2. The results showed that 9.11% of the coast belongs to the very high vulnerability category, mainly distributed in the built-up areas of the ports such as Binhai Harbor and Dafeng Harbor. In comparison, 71.18% of the coast belonged to the high vulnerability category, mainly distributed north of Bianchang Harbor (Figure 3H).
4.3.3 Roads
More roads are distributed around the neighboring coastline, such as expressways, urban primary roads, urban secondary roads, and urban side roads.
The findings regarding the distribution of the road network in each county indicated that within the 1km area around the grid, the coastal grid in Tinghu was completely covered by roads, representing the highest percentage among all counties. In contrast, only 26.75% of the coastal grid in Dongtai was covered by roads, which was the lowest percentage across all counties. Based on the distribution of roads around the grid, the classification of coastal erosion vulnerability is presented in Figure 3I, with the percentages of very high and high vulnerability areas being 55.4% and 13.91%, respectively.
4.3.4 Artificial protection
Along the Abandoned Yellow River Delta coast, the local government has taken a variety of coastal protection measures to prevent coastal erosion, including sea walls, submerged breakwaters and groins. The overlay analysis of the grid and artificial protection measures shows that 56.07% of the coastline is equipped with sea walls, while 38.83% of the coastline has no protection measures. According to the distribution of artificial protections around the grids, the coastal erosion vulnerability class is shown in Figure 3J, where the percentages of very high and medium areas are 38.83% and 56.07% respectively.
4.4 Composite coastal erosion vulnerability index
The vulnerability index was calculated for each grid cell using the product mean, and the length of the coastline covered by each grid cell was calculated by overlaying the coastline with the grid cells using ArcGIS 10.2. The results showed that the CFVI scores in the whole study area ranged from 1.00 to 5.77, the CCVI scores ranged from 1.55 to 25.00, and the CSVI scores ranged from 0.50 to 12.5, with the mean scores of CFVI, CCVI, and CSVI being 2.7, 9.43, and 3.0, respectively (Figures 6D–F). This indicated that the coastal morphology dominated the coastal erosion vulnerability of the Abandoned Yellow River Delta, and also showed that anthropogenic activities and sea waves had a significant impact on coastal erosion. The mean scores of CCVI and CSVI were 9.43 and 3.0, respectively, indicating that the morphological features of the coast dominate the vulnerability of coastal erosion in the Abandoned Yellow River Delta and that anthropogenic activities and wave hazards were more likely to cause damage to the coast. The coastal erosion vulnerability index (ICVI) of the whole coastal area of the Abandoned Yellow River Delta ranged from 1.49to 11.3, with a standard deviation of 2.47. Figure 6B showed the length of the coastal erosion vulnerability classes in the whole study area and the administrative units. Figure 6C described the proportion of each vulnerability class in the administrative districts in which they are located. A total of 377 km of the coastline, including 51.35 km and 72.8 km, belonged to the high vulnerability and above (Figure 6B). Coastal erosion vulnerability in Binhai and Xiangshui were above high vulnerability, and Sheyang had the most significant proportion of highly vulnerable areas. The coastal erosion vulnerability index showed a distribution pattern of high vulnerability in the north and low vulnerability in the south Figure 6A. Sheyang was a transitional area of erosion vulnerability.
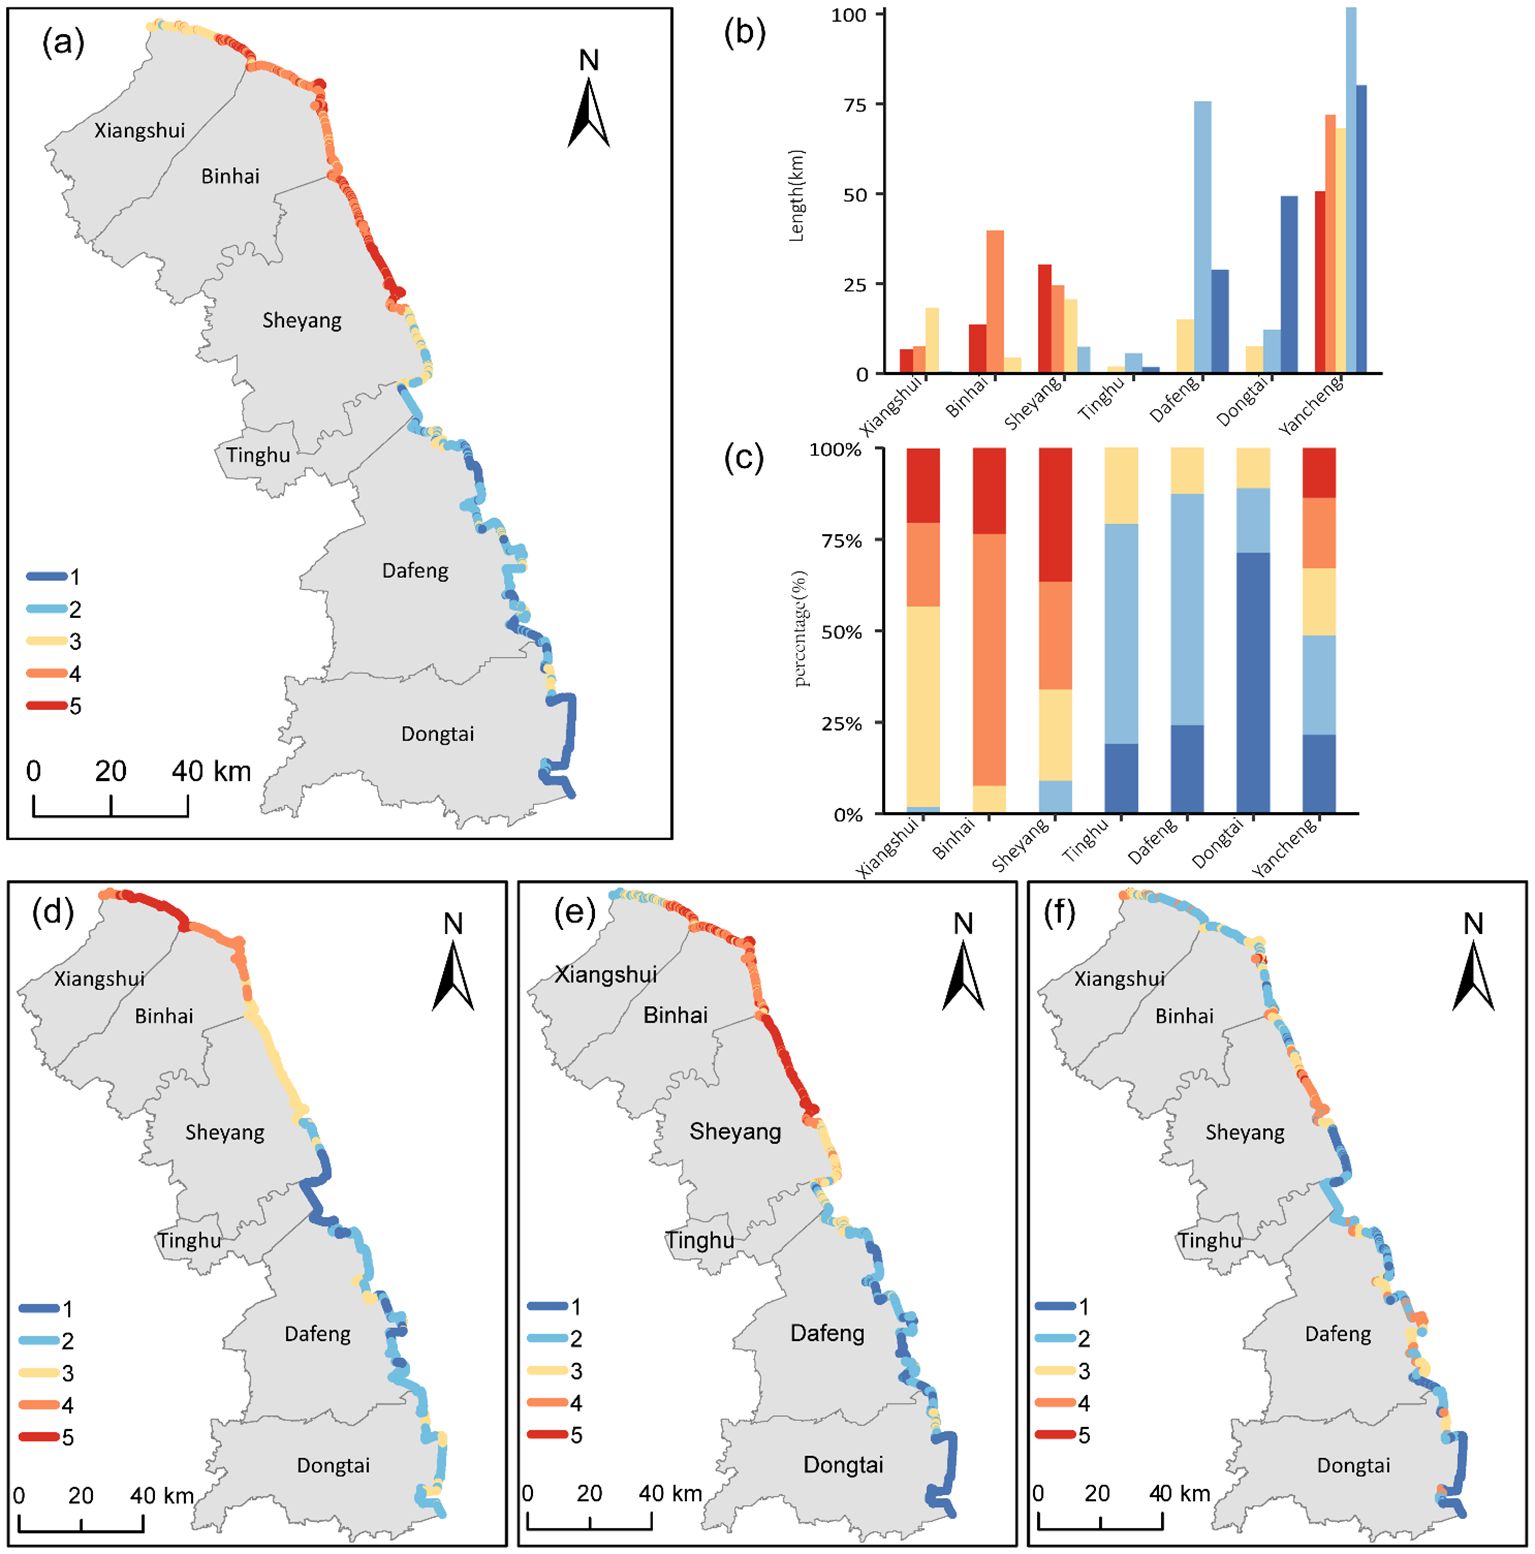
Figure 6. Spatial distribution of erosion vulnerability categories of different indexes such as (A) ICVI, (D) CFVI, (E) CCVI, (F) CSVI. Representation of the coastline length (B) and its relative percentage (C) under coastal erosion vulnerability levels in each coastal district of the study area.
4.5 Influence factors of spatial differentiation of coastal erosion vulnerability
The contribution of each indicator to the coastal erosion vulnerability was different. The geodetector was used to calculate the q value for each indicator. The results of calculating the q values of the indicators were shown in Figure 7. The q values of all indicators passed the significance test(P<0.005). According to the results, the q values of CU, SWH, and PD were 0.8399,0.7976 and 0.6104, respectively, which can explain 83.99%, 79.76%, and 61.04% of the spatial variation of coastal erosion vulnerability, indicating that these three indicators are the main factors of coastal erosion vulnerability, among which CU is the most important factor. The q values of the four indicators, AP, RN, LUCC, and CS, were less than 0.2, implying that these four indicators could hardly explain the spatial variation of coastal erosion vulnerability, indicating that the four indicators were not the main influencing factors for the spatial variation of coastal erosion vulnerability.
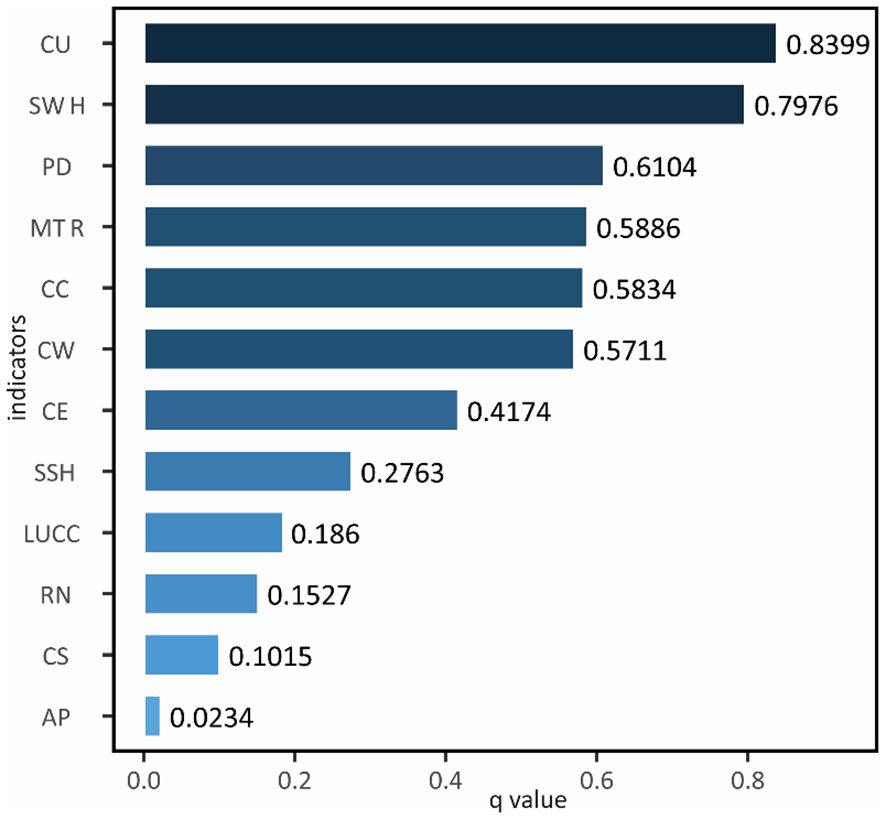
Figure 7. The q value distribution of coastal erosion vulnerability evaluation index.
Based on the geodetector, 66interactions between 12 indicators were carried out (Table 3). The results show that 98.5% of the indicators interactions are enhancement or nonlinear enhancement. The q value of the interaction between SHW and PD is the largest, reaching 0.8938, and the q value of the interaction between CU and PD reaches 0.8880,indicating that the distribution of population in the regions with stronger ocean dynamic action will lead to greater risks. In addition, the combined effect of dynamic conditions of mean significant wave height also further aggravates the risk of erosion, indicating that the spatial differentiation of coastal erosion vulnerability resulted from multiple factors.
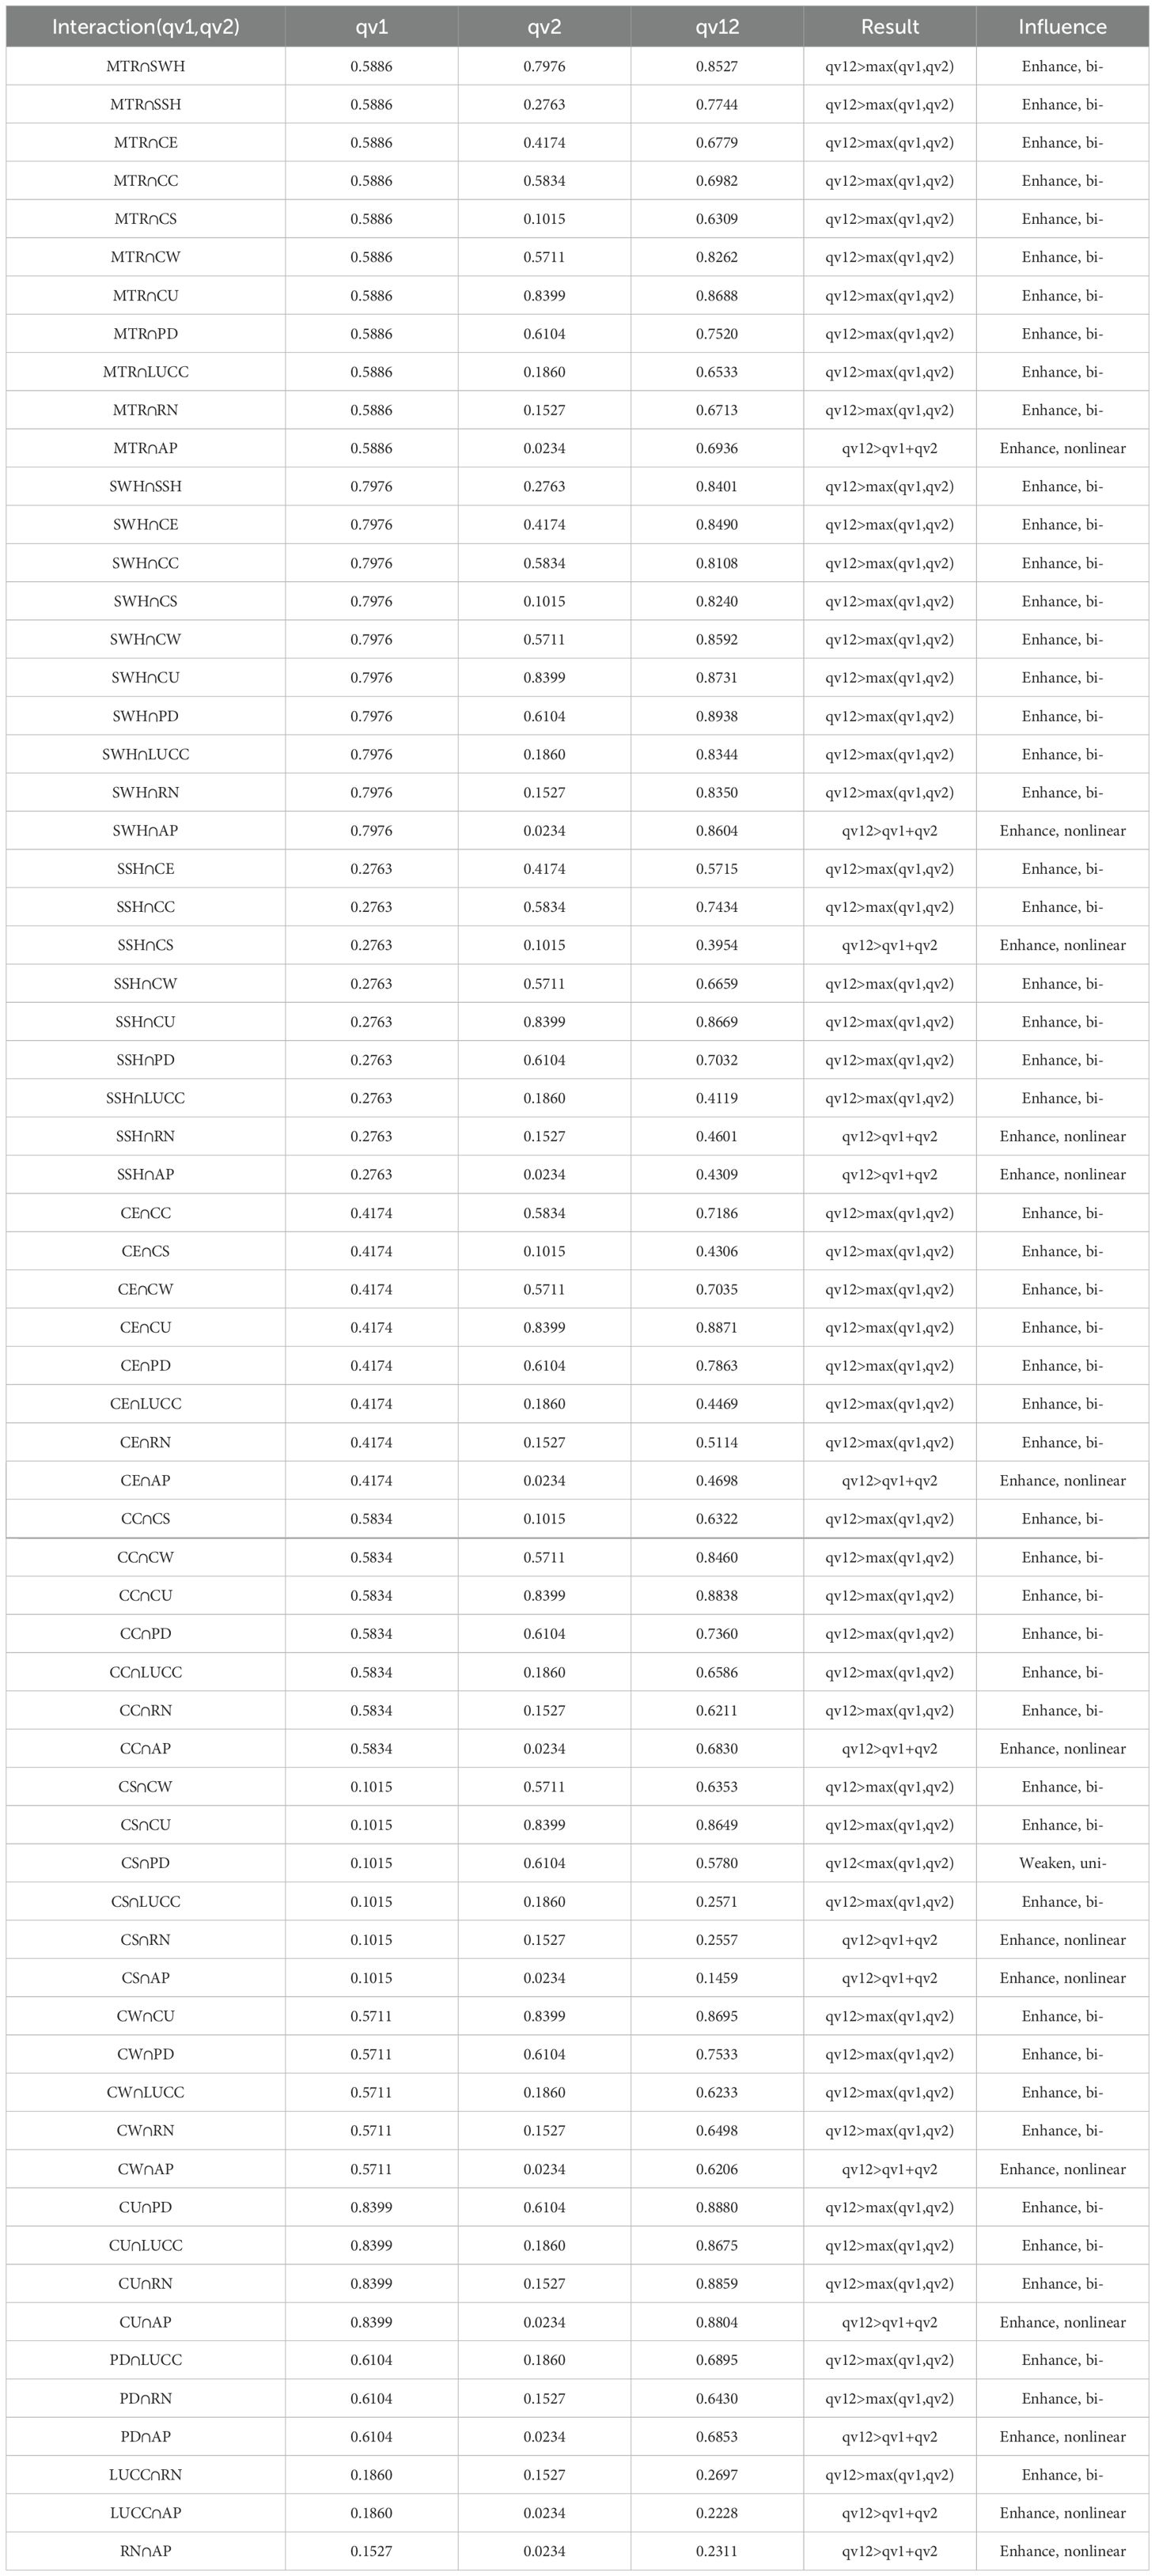
Table 3. Evaluation index interaction results.
5 Discussion
5.1 Selection of evaluation indicators and correlation analysis between indicators
With the gradual and frequent anthropogenic activities in the coastal zone, marine hazards represented by coastal erosion are increasingly threatening the human living environment. At the same time, human activities, in turn, affect the vulnerability of coastal erosion, manifested as a bidirectional feedback relationship, e.g., to prevent coastal erosion, the local government builds seawalls, plants, vegetation, and so on. Therefore, we believe coastal dynamics, morphology, and socio-economic indicators are equally important in coastal erosion vulnerability assessment. We selected ten vulnerability indicators including eight physical and four socio-economic indicators to assess coastal erosion vulnerability. For indicators selection, the coastal erosion vulnerability assessment system was further expanded by referring to a large amount of literature and targeting the coastal erosion characteristics of the Abandoned Yellow River Delta, which is a low-lying wasteland in China. Additionally the indicators of CU, CE, and CW were also included in the evaluation system to ensure that the evaluation results are more reasonable.
The indicator covariance is an essential aspect of coastal erosion vulnerability evaluation. Although many studies focus on selecting coastal vulnerability indicators, very few scholars carry out the covariance selection of indicators (Furlan et al., 2021). Correlation analysis between indicators was carried out to ensure the scientificity of indicator selection (Figure 8). It can be seen that the correlation between most of the indicators is not significant, indicating that there is not too much redundant information when analyzing indicator integration. It was also found that SWH and CC have a high correlation coefficient of 0.81, indicating a high correlation between the two indicators. However, these two indicators are widely used in coastal vulnerability assessment, suggesting that as wave height increases, ocean energy is enhanced, tidal flats sediments are more easily transported, and the coastline is vulnerable to erosion. In addition, the correlation values of MTR, SWH, and CE are high. This is because establishing seawall elevation is based on the comprehensive determination of tidal level and wave height, which leads to a certain correlation between these indicators. However, due to the fact that the elevation of the seawall is relatively fixed in a certain period of time, and the tide level and wave are always dynamic, it is necessary to consider these three indicators simultaneously to reflect the coastal erosion vulnerability.
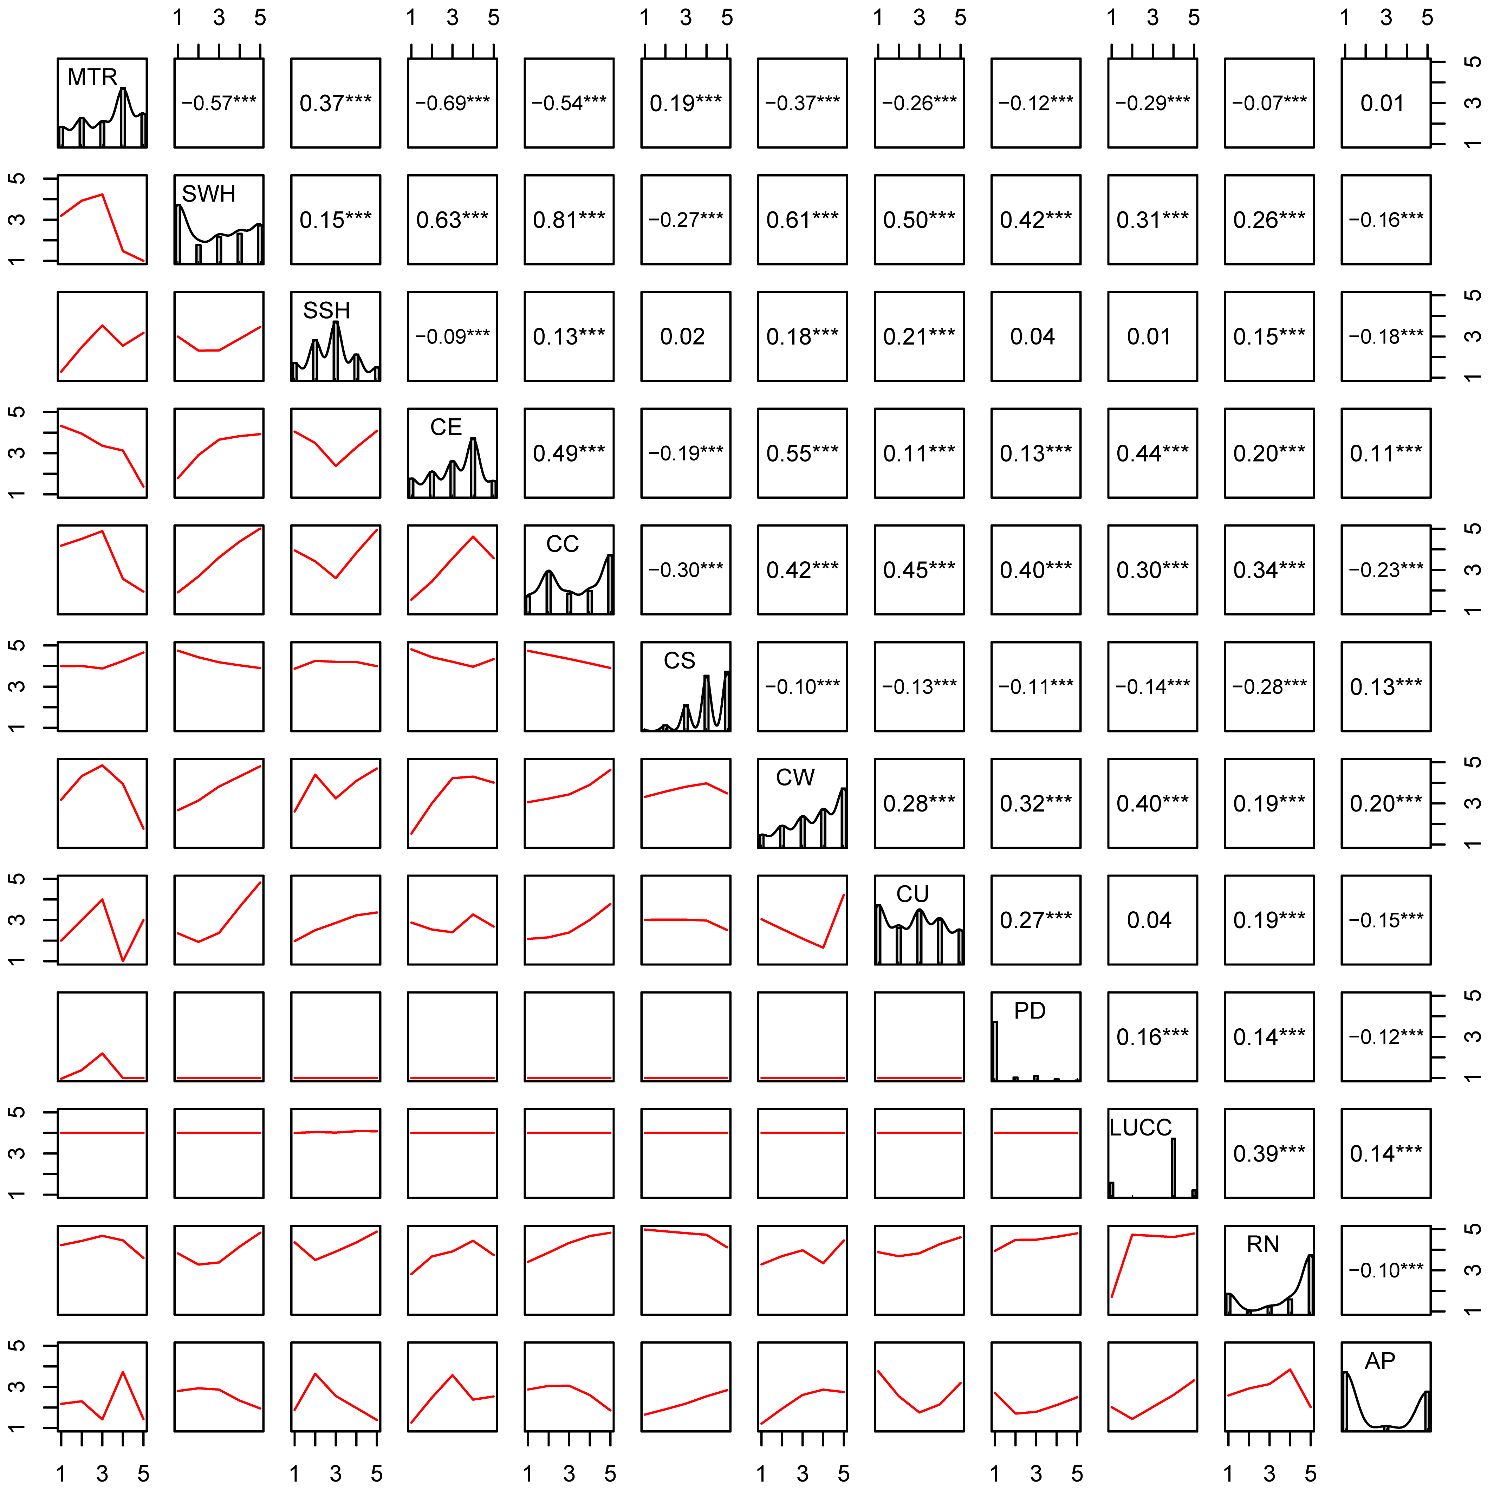
Figure 8. Correlation matrix showing correlation coefficients between indicators. The distribution of each indicator is shown on the diagonal of the matrix; on the lower part of the diagonal the bivariate scatter plots with a fitted line (in red) are displayed, while in the upper one the value of the correlation and the significance level as stars (*** denotes significant correlation at 0.001 level).
5.2 Coastal erosion vulnerability
Analyzing the factors that influence the spatial distribution of coastal erosion vulnerability helps to distinguish the sources of different factors and assess their risks. The proportions of very high, high, medium, low, and very low coastal erosion vulnerability in the Abandoned Yellow River Delta are 13.62%, 19.31%, 18.29%, 27.28%, and 21.5%, respectively. The coastal erosion vulnerability grade showed a distribution pattern high in the north and low in the south, with the boundary of the Sheyang estuary. Yin et al. (2012) studied the erosion vulnerability of China’s coastal zone. It concluded that all the coasts in central Jiangsu are high and very high vulnerability zones. Compared with their research results, our research scale is smaller. There are both very high and high vulnerability areas, as well as medium, low, and very low vulnerability areas. Our results are more refined and in line with local reality.
The average CFI of 5.33 in Xiangshui is the largest among all counties, and the coastline covered by the grid is rated as high vulnerable in terms of both the average effective wave height and the average tidal range, which indicates that coastal dynamics dominate the vulnerability of coastal erosion in this county. The mean ICVI score for Xiangshui was 6.49, all grids had road coverage within 1km, and all grid-covered coastlines were rated as very highly vulnerable regarding the distribution of roads around the grid and effective wave height. This makes 114.5km of the county’s coastline in the very high and high vulnerability classes, accounting for about 43.35% of the total length of the county’s coastline, indicating that the coastal erosion vulnerability of Xiangshui is high and susceptible to waves and flooding.
The CCVI and CSVI scores of Xiangshui are higher than the scores of all other counties. In terms of tidal flat width and rate of tidal flat erosion indicators, all grid-covered coastlines in Binhai are rated as highly vulnerable. In addition, the layout of Binhai Harbor on the north side of Binhai County and the density of roads around the coastal grid lead to a more extensive socio-economic vulnerability index.
Overall, excessive changes in coastal morphology under the dual factors of narrow tidal flats width and sub-tidal erosion, as well as frequent anthropogenic economic activities brought about by harbor construction, led to an increase in the ICVI score of the county, making 92.41% of the county’s coast fall into the highly to extremely vulnerable category.
The whole coast of Sheyang falls into the very high vulnerability category regarding coastline change rate. Nearly 80% of the county’s roads are within 270m of the current coastline, and the county’s land use type is dominated by built-up areas (accounting for 50%), followed by pond farming. This makes the county’s artificial facilities more vulnerable to the effects of coastal dynamics. In addition, nearly 36.58% and 29.51% of the country’s coasts are in very high and high vulnerability states, respectively, due to deteriorating natural conditions and increasing anthropogenic threats. The average ICVI score of Sheyang County is 7.20, second only to Binhai, indicating high vulnerability, and the farm ponds washed away along the coast also suggest that the region’s environment continues to be damaged by marine erosion.
The CFVI index of Tinghu has the lowest score among all counties, indicating that the coast is less affected by marine dynamic disasters. The land use pattern of the coast where the grid is located is predominantly an artificial surface, and this makes the district’s artificial facilities more susceptible to the effects of coastal forces. Roads are distributed within 1km around the grid, which puts the county’s coast in the very high vulnerability category in terms of both land cover and road indicators. Although the CFVI score is the lowest in all counties, the CSVI score is the 3rd highest among all the counties and cities, leading to its more extensive CVI index. At the same time, we found that the density of roads around eroding coasts, such as Tinghu and Binhai, is more significant. In contrast, the density of roads around silt-length coasts is relatively small, such as Dongtai. The greater coastal vulnerability of the region with intense erosion also suggests that the coastline’s retreat (rather than advancement) affects coastal road facilities and increases coastal erosion vulnerability.
The average vulnerability index of Dongtai (2.54) is the lowest among all counties. The county’s mean socioeconomic vulnerability score of 1.74 and mean coastal morphology vulnerability score of 3.56 are also the weakest among all counties. The county’s vulnerability level is reduced because the county’s vast tidal flats, and nearly 54% of the grid is dominated by rice grass as the dominant vegetation. The abundance of crab holes and fine-grained sediments on the tidal flats confirms the area’s favorable natural conditions and low vulnerability. More than 85% of the County’s coast falls into the very low to low vulnerability category due to relatively favorable natural conditions.
5.3 Influencing factors of coastal erosion vulnerability
Geodetector was utilized to explore the factors influencing coastal erosion vulnerability. It provides more convincing evidence than Principal Component Analysis (PCA). Consistency in the spatial distribution of two geographic variables is more difficult to obtain than linear correlation of two indicators. Therefore, geodetector provides a more robust statistic to reveal the causal relationship between the independent and dependent indicators than Pearson correlation analysis. We found that tidal flat elevation change, wave, and tidal difference played an essential role in the spatial variability of coastal erosion vulnerability, indicating that coastal erosion vulnerability was mainly affected by coastal ground subsidence and coastal dynamics conditions. The intense conditions of coastal dynamics altered the coastal sedimentation characteristics and thus led to coastal sediment loss and ground subsidence, further exacerbating coastal erosion. Wang et al. (2021) concluded that the width of tidal flats is the main factor influencing coastal erosion, and socioeconomic factors are not the main factors influencing the vulnerability of coastal erosion in the Yangtze River delta, which is consistent with the results of this paper.
The interaction indicator enhancement analysis results showed that the largest value after the interaction of SWH and PD indicators reached 0.8938. The interaction of CU and PD indicators reached 0.888,ranking 2 among all the interactions. The results showed that the combined effect of SWH and PD indicators further enhanced coastal erosion vulnerability (Table 3). Areas with strong wave and coastal topographic subsidence, combined with dense population will lead to greater disasters. The interaction of CE and CU indicators reached 0.8871. Therefore, when coastal erosion protection is carried out, coastal protection and tidal flat stability protection should be carried out simultaneously, that is, both tidal flat protection and seawall construction should be carried out at the same time. In addition, after the interaction of wave height and erosion of the tidal flats, the Q-value was also very large (0.7976), indicating that the strengthening of wave energy and tidal flats stabilization, solid waves, and unstable flats further exacerbated coastal erosion. The results showed that 98.5% of the indicator interactions are enhancement or nonlinear enhancement. It suggests that integrated coastal protection should be carried out to avoid coastal erosion and wave dissipation, and beach protection and coastal erosion protection should be implemented in multiple ways.
The coastal vulnerability index developed in the study can help decision-makers prioritize coastal erosion vulnerability in the Abandoned Yellow River Delta region for site-specific interventions, thus contributing to enhanced implementation of sustainable management strategies. In addition, favorable local socio-economic conditions buffer against coastal erosion impacts. These results suggest that vulnerability results from complex interactions between natural ecosystems and socio-economic environments. A combination of nature-based defenses and socio-economic factors is more conducive to reducing vulnerability in coastal areas. It was found that seawalls were constructed, and the coastline stopped retreating. However, the tidal flats topography continues to settle, which requires that more nature-based coastal erosion protection measures should be carried out as soon as possible, such as biodegradable dinghies, ecological submerged dykes, and vegetation planting.
It should be noted that the current study only focuses on the vulnerability of coastal erosion under a single time cross-section, lacks a comparative study of a long time series, and is insufficiently analyzed for the evolution of coastal erosion vulnerability under the dynamic perspective. Therefore, in the subsequent research, the spatial and temporal evolution characteristics of coastal erosion vulnerability and the analysis of future evolution trends need to be focused on.
6 Conclusion
The coastal erosion vulnerability evaluation index system was constructed from the three aspects of coastal dynamics, coastal morphology, and socio-economics, and the coastal erosion vulnerability index was calculated using the cross-section method. The coastal erosion vulnerability distribution of the Abandoned Yellow River Delta was obtained, and the main influencing factors of the coastal erosion vulnerability were analyzed based on the geo-detector. The conclusions are as follows.
The proportion of coastal erosion vulnerability in the Abandoned Yellow River Delta that is very high, high, medium, low, and very low is 13.62%, 19.31%, 18.29%, 27.28%, and 21.5%, respectively. The overall trend of the coastal erosion vulnerability grade shows a gradual decrease from north to south based on the spatial distribution of coastal erosion vulnerability. From the viewpoint of the factors affecting coastal erosion vulnerability.
Rate of tidal flat erosion, Mean Significant wave height, Population density, Mean tidal range, Shoreline change rate, and Tidal flat width are the dominant factors in the spatial variation of coastal erosion vulnerability, especially the Rate of tidal flat erosion has the most significant influence. Socio-economic factors, except for population density, are not the dominant factors in the variation of coastal erosion. The spatial variation of coastal erosion vulnerability results from the joint impact of coastal dynamics, coastal morphology, and socioeconomic factors. The effect of two-factor interaction on coastal erosion vulnerability is greater than that of a single factor, among which the interaction effect of tidal flats subsidence rate and coastline change index is the largest.
Data availability statement
The original contributions presented in the study are included in the article/Supplementary Material. Further inquiries can be directed to the corresponding author.
Author contributions
ZZ: Data curation, Investigation, Visualization, Writing – original draft, Conceptualization, Methodology, Validation. KZ: Funding acquisition, Project administration, Writing – review & editing, Data curation, Investigation. PC: Investigation, Visualization, Writing – review & editing.
Funding
The author(s) declare financial support was received for the research, authorship, and/or publication of this article. This research was funded by the Jiangsu Marine Science and Technology Innovation Project (Grant No.HY2017-2), the Science and Technology Project of Natural Resources in Jiangsu Province (Grant No. KJXM2019044). Open Fund of the East China Coastal Zone Field Scientific Observation and Research Station, Ministry of Natural Resources (Grant No.ORSECCZ2022103).
Acknowledgments
The authors would like to express their sincere thanks to Lanman Li and Yiyi Zhang who offered support.
Conflict of interest
The authors declare that the research was conducted in the absence of any commercial or financial relationships that could be construed as a potential conflict of interest.
Generative AI statement
The author(s) declare that no Generative AI was used in the creation of this manuscript.
Publisher’s note
All claims expressed in this article are solely those of the authors and do not necessarily represent those of their affiliated organizations, or those of the publisher, the editors and the reviewers. Any product that may be evaluated in this article, or claim that may be made by its manufacturer, is not guaranteed or endorsed by the publisher.
References
Addo K. A., Walkden M., Mills J. P. (2008). Detection, measurement and prediction of shoreline recession in Accra, Ghana. ISPRS J. Photogramm. Remote Sens. 63, 543–558. doi: 10.1016/j.isprsjprs.2008.04.001
Ahmed N., Howlader N., Hoque M. A.-A., Pradhan B. (2021). Coastal erosion vulnerability assessment along the eastern coast of Bangladesh using geospatial techniques. Ocean Coast. Manage. 199, 105408. doi: 10.1016/j.ocecoaman.2020.105408
Ahmed M. A., Sridharan B., Saha N., Sannasiraj S. A., Kuiry S. N. (2022). Assessment of coastal vulnerability for extreme events. International Journal of Disaster Risk Reduction 82, 103341. doi: 10.1016/j.ijdrr.2022.103341
Akash S. H., Sarkar S. K., Bindajam A. A., Kumari R., Talukdar S., Mallick J. (2023). Assessment of coastal vulnerability using integrated fuzzy analytical hierarchy process and geospatial technology for effective coastal management. Environ. Sci. pollut. Res. 31, 53749–53766. doi: 10.1007/s11356-023-28317-y
Angus S., Hansom J. D. (2021). Enhancing the resilience of high-vulnerability, low-elevation coastal zones. Ocean Coast. Manage. 200, 105414. doi: 10.1016/j.ocecoaman.2020.105414
Ariffin E. H., Mathew M. J., Roslee A., Ismailluddin A., Yun L. S., Putra A. B., et al. (2023). A multi-hazards coastal vulnerability index of the east coast of Peninsular Malaysia. Int. J. Disaster Risk Reduct. 84, 103484. doi: 10.1016/j.ijdrr.2022.103484
Arun Kumar A., Kunte P. D. (2012). Coastal vulnerability assessment for Chennai, east coast of India using geospatial techniques. Nat. Hazards 64, 853–872. doi: 10.1007/s11069-012-0276-4
Ashraful Islam Md., Mitra D., Dewan A., Akhter S. H. (2016). Coastal multi-hazard vulnerability assessment along the Ganges deltaic coast of Bangladesh–A geospatial approach. Ocean Coast. Manage. 127, 1–15. doi: 10.1016/j.ocecoaman.2016.03.012
Cai F., Cao C., Qi H., Su X., Lei G., Liu J., et al. (2022). Rapid migration of mainland China’s coastal erosion vulnerability due to anthropogenic changes. J. Environ. Manage. 319, 115632. doi: 10.1016/j.jenvman.2022.115632
Canul Turriza R. A., Fernández-Díaz V. Z., Cárdenas Rojas D. M., Tzuc Ó. M. (2024). Coastal vulnerability assessment with a hierarchical coastal segments approach. Ocean Coast. Manage. 249, 106989. doi: 10.1016/j.ocecoaman.2023.106989
Cao C., Cai F., Qi H., Liu J., Lei G., Zhu K., et al. (2022). Coastal erosion vulnerability in mainland China based on fuzzy evaluation of cloud models. Front. Mar. Sci. 8. doi: 10.3389/fmars.2021.790664
Charuka B., Angnuureng D. B., Brempong E. K., Agblorti S. K. M., Antwi Agyakwa K. T. (2023). Assessment of the integrated coastal vulnerability index of Ghana toward future coastal infrastructure investment plans. Ocean Coast. Manage. 244, 106804. doi: 10.1016/j.ocecoaman.2023.106804
Chen J., Yang S. T., Li H. W., Zhang B., Lv J. R. (2013). Research on geographical environment unit division based on the method of natural breaks (Jenks). Int. Arch. Photogramm. Remote Sens. Spat. Inf. Sci. XL-4/W3, 47–50. doi: 10.5194/isprsarchives-XL-4-W3-47-2013
Davidson-Arnott R., Bauer B., Houser C. (2019). Introduction to coastal processes and geomorphology (London: Cambridge University Press).
De Andrade T. S., Sousa P. H. G. D. O., Siegle E. (2019). Vulnerability to beach erosion based on a coastal processes approach. Appl. Geogr. 102, 12–19. doi: 10.1016/j.apgeog.2018.11.003
De Pippo T., Donadio C., Pennetta M., Petrosino C., Terlizzi F., Valente A. (2008). Coastal hazard assessment and mapping in Northern Campania, Italy. Geomorphology 97, 451–466. doi: 10.1016/j.geomorph.2007.08.015
Denner K., Phillips M., Jenkins R., Thomas T. (2015). A coastal vulnerability and environmental risk assessment of Loughor Estuary, South Wales. Ocean & Coastal Management 116, 478–490. doi: 10.1016/j.ocecoaman.2015.09.002
Dey J., Mazumder S. (2023). Development of an integrated coastal vulnerability index and its application to the low-lying Mandarmani–Dadanpatrabar coastal sector, India. Nat. Hazards 116, 3243–3273. doi: 10.1007/s11069-022-05805-x
Dike E. C., Amaechi C. V., Beddu S. B., Weje I. I., Ameme B. G., Efeovbokhan O., et al. (2024). Coastal Vulnerability Index sensitivity to shoreline position and coastal elevation parameters in the Niger Delta region, Nigeria. Sci. Total Environ. 919, 170830. doi: 10.1016/j.scitotenv.2024.170830
Dwarakish G. S. (2008). Integrated coastal zone management plan for Udupi coast using remote sensing, geographical information system and global position system. J. Appl. Remote Sens 2, 023515. doi: 10.1117/1.2919101
Fang R., Shen Y., Shi H. (2015). The changes of coastal wetland landscape pattern based on the characteristics of reclamation: a case study in coastal wetland of Yancheng,Jiangsu Province,China. Acta Ecol. Sin. 35, 641–651. doi: 10.5846/stxb201401040023
Fu G., Cao C., Fu K., Song Y., Yuan K., Wan X., et al. (2022). Characteristics and evaluation of coastal erosion vulnerability of typical coast on Hainan Island. Front. Mar. Sci. 9. doi: 10.3389/fmars.2022.1061769
Furlan E., Pozza P. D., Michetti M., Torresan S., Critto A., Marcomini A. (2021). Development of a Multi-Dimensional Coastal Vulnerability Index: Assessing vulnerability to inundation scenarios in the Italian coast. Sci. Total Environ. 772, 144650. doi: 10.1016/j.scitotenv.2020.144650
Ghaderi D., Rahbani M. (2024). Evaluating the shoreline vulnerability of eastern coast of Makran employing geomorphological and hydrodynamic parameters. J. Earth Syst. Sci. 133, 48. doi: 10.1007/s12040-024-02266-7
Ghosh M. K., Kumar L., Kibet Langat P. (2019). Geospatial modelling of the inundation levels in the Sundarbans mangrove forests due to the impact of sea level rise and identification of affected species and regions. Geomatics Natural Hazards Risk 10, 1028–1046. doi: 10.1080/19475705.2018.1564373
Gibbs A. E., Snyder A. G., Richmond B. M. (2019). National Assessment of Shoreline Change — Historical Shoreline Change Along the North Coast of Alaska, Icy Cape to Cape Prince of Wales(No. 2019-1146). US Geological Survey.
Gornitz V. (1990). Vulnerability of the East Coast, USA to future sea level rise. J. Coast. Res. 1, 201–237. doi: 10.1007/s10661-017-6282-y
Gornitz V. (1991). Global coastal hazards from future sea level rise. Palaeogeogr. Palaeoclimatol. Palaeoecol. 89, 379–398. doi: 10.1016/0031-0182(91)90173-O
Gornitz V. M., Danielst R. C., White T. W., Birdwellll K. R. (1994). The development of a coastal risk assessment database: vulnerability to sea-level rise in the u.s. southeast. Journal of Coastal Research, 327–338. Available online at: http://www.jstor.org/stable/25735608 (Accessed February 4, 2025).
Grandjean T. J., Weenink R., van der Wal D., Addink E. A., Hu Z., Liu S., et al. (2024). Critical turbidity thresholds for maintenance of estuarine tidal flats worldwide. Nat. Geosci. 17, 539–544. doi: 10.1038/s41561-024-01431-3
Hamid A. I. A., Din A. H. M., Abdullah N. M., Yusof N., Hamid M. R. A., Shah A. M. (2021). Exploring space geodetic technology for physical coastal vulnerability index and management strategies: A review. Ocean Coast. Manage. 214, 105916. doi: 10.1016/j.ocecoaman.2021.105916
Hossain S. A., Mondal I., Thakur S., Fadhil-Al-Quraishi A. M. (2022). Coastal vulnerability assessment of India’s Purba Medinipur-Balasore coastal stretch: A comparative study using empirical models. Int. J. Disaster Risk Reduct. 77, 103065. doi: 10.1016/j.ijdrr.2022.103065
Jisan M. A., Bao S., Pietrafesa L. J. (2018). Ensemble projection of the sea level rise impact on storm surge and inundation at the coast of Bangladesh. Nat. Hazards Earth Syst. Sci. 18, 351–364. doi: 10.5194/nhess-18-351-2018
Jonah F. E., Boateng I., Osman A., Shimba M. J., Mensah E. A., Adu-Boahen K., et al. (2016). Shoreline change analysis using end point rate and net shoreline movement statistics: An application to Elmina, Cape Coast and Moree section of Ghana’s coast. Reg. Stud. Mar. Sci. 7, 19–31. doi: 10.1016/j.rsma.2016.05.003
Kantamaneni K., Gallagher A., Du X. (2019). Assessing and mapping regional coastal vulnerability for port environments and coastal cities. J. Coast. Conserv. 23, 59–70. doi: 10.1007/s11852-018-0636-7
Kienberger S., Lang S., Zeil P. (2009). Spatial vulnerability units – expert-based spatial modelling of socio-economic vulnerability in the Salzach catchment, Austria. Nat. Hazards Earth Syst. Sci. 9, 767–778. doi: 10.5194/nhess-9-767-2009
Koroglu A., Ranasinghe R., Jiménez J. A., Dastgheib A. (2019). Comparison of coastal vulnerability index applications for Barcelona Province. Ocean Coast. Manage. 178, 104799. doi: 10.1016/j.ocecoaman.2019.05.001
Kunte P. D., Jauhari N., Mehrotra U., Kotha M., Hursthouse A. S., Gagnon A. S. (2014). Multi-hazards coastal vulnerability assessment of Goa, India, using geospatial techniques. Ocean Coast. Manage. 95, 264–281. doi: 10.1016/j.ocecoaman.2014.04.024
Li X., Zhou Y., Tian B., Kuang R., Wang L. (2015). GIS-based methodology for erosion risk assessment of the muddy coast in the Yangtze Delta. Ocean Coast. Manage. 108, 97–108. doi: 10.1016/j.ocecoaman.2014.09.028
Liu X., Chen S., Jiang C., Hu J., Zhang L. (2014). Vulnerability assessment of coastal erosion along the Abandoned Yellow River Delta of northern Jiangsu, China. Acta Geographica Sinica. 69, 607–618. doi: 10.11821/dlxb201405004
Mafi-Gholami D., Zenner E. K., Jaafari A., Riyahi Bakhtyari H. R., Tien Bui D. (2019). Multi-hazards vulnerability assessment of southern coasts of Iran. J. Environ. Manage. 252, 109628. doi: 10.1016/j.jenvman.2019.109628
Mahapatra M., Ramakrishnan R., Rajawat A. S. (2015). Coastal vulnerability assessment using analytical hierarchical process for South Gujarat coast, India. Nat. Hazards 76, 139–159. doi: 10.1007/s11069-014-1491-y
Mani Murali R., Ankita M., Amrita S., Vethamony P. (2013). Coastal vulnerability assessment of Puducherry coast, India, using the analytical hierarchical process. Nat. Hazards Earth Syst. Sci. 13, 3291–3311. doi: 10.5194/nhess-13-3291-2013
Marcy D., Brooks W., Draganov K., Hadley B., Haynes C., Herold N., et al. (2011). “New mapping tool and techniques for visualizing sea level rise and coastal flooding impacts,” in Solutions to Coastal Disasters 2011 (American Society of Civil Engineers, Anchorage, Alaska, United States), 474–490. doi: 10.1061/41185(417)42
Mclaughlin S., Cooper J. A. G. (2010). A multi-scale coastal vulnerability index: A tool for coastal managers? Environ. Hazards 9, 233–248. doi: 10.3763/ehaz.2010.0052
Miah J., Hossain K. T., Hossain M. A., Najia S. I. (2020). Assessing coastal vulnerability of Chittagong District, Bangladesh using geospatial techniques. J. Coast. Conserv. 24, 66. doi: 10.1007/s11852-020-00784-2
Mohamed S. A. (2020). Coastal vulnerability assessment using GIS-Based multicriteria analysis of Alexandria-northwestern Nile Delta, Egypt. J. Afr. Earth Sci. 163, 103751. doi: 10.1016/j.jafrearsci.2020.103751
Mohd F. A., Abdul Maulud K. N., Karim O. A., Begum R. A., Awang N. A., Ahmad A., et al. (2019). Comprehensive coastal vulnerability assessment and adaptation for Cherating-Pekan coast, Pahang, Malaysia. Ocean Coast. Manage. 182, 104948. doi: 10.1016/j.ocecoaman.2019.104948
Mullick Md. R. A., Tanim A. H., Islam S. M. S. (2019). Coastal vulnerability analysis of Bangladesh coast using fuzzy logic based geospatial techniques. Ocean Coast. Manage. 174, 154–169. doi: 10.1016/j.ocecoaman.2019.03.010
Nageswara Rao K., Subraelu P., Venkateswara Rao T., Hema Malini B., Ratheesh R., Bhattacharya S., et al. (2008). Sea-level rise and coastal vulnerability: an assessment of Andhra Pradesh coast, India through remote sensing and GIS. J. Coast. Conserv. 12, 195–207. doi: 10.1007/s11852-009-0042-2
Nicholls R. J., Cazenave A. (2010). Sea-level rise and its impact on coastal zones. Science 328, 1517–1520. doi: 10.1126/science.1185782
Özyurt G., Ergin A. (2010). Improving coastal vulnerability assessments to sea-level rise: A new indicator-based methodology for decision makers. J. Coast. Res. 262, 265–273. doi: 10.2112/08-1055.1
Pantusa D., D’Alessandro F., Riefolo L., Principato F., Tomasicchio G. (2018). Application of a coastal vulnerability index. A case study along the Apulian Coastline, Italy. Water 10, 1218. doi: 10.3390/w10091218
Parise C. K., Calliari L. J., Krusche N. (2009). Extreme storm surges in the south of Brazil: atmospheric conditions and shore erosion. Braz. J. Oceanogr. 57, 175–188. doi: 10.1590/S1679-87592009000300002
Parvin G. A., Takahashi F., Shaw R. (2008). Coastal hazards and community-coping methods in Bangladesh. J. Coast. Conserv. 12, 181–193. doi: 10.1007/s11852-009-0044-0
Priya Rajan S. M., Nellayaputhenpeedika M., Tiwari S. P., Vengadasalam R. (2020). Mapping and analysis of the physical vulnerability of coastal Tamil Nadu. Hum. Ecol. Risk Assess. Int. J. 26, 1879–1895. doi: 10.1080/10807039.2019.1602752
Ramieri E., Hartley A., Barbanti A., Santos F. D., Gomes A., Laihonen P., et al. (2011). Methods for assessing coastal vulnerability to climate change. ETC CCA technical paper, 1, 1–93.
Ren M. E. (1986). Coastal and tidal flat resources investigation of Jiangsu province (Peking, China: Maritime Press).
Roy D. C., Blaschke T. (2015). Spatial vulnerability assessment of floods in the coastal regions of Bangladesh. Geomat. Nat. Hazards Risk 6, 21–44. doi: 10.1080/19475705.2013.816785
Sahin O., Mohamed S. (2014). Coastal vulnerability to sea-level rise: a spatial–temporal assessment framework. Nat. Hazards 70, 395–414. doi: 10.1007/s11069-013-0818-4
Sahoo B. (2017). Multi-hazard risk assessment of coastal vulnerability from tropical cyclones–A GIS based approach for the Odisha coast. J. Environ. Manag. 206, 1166–1178. doi: 10.1016/j.jenvman.2017.10.075
Sajjad M., Li Y., Tang Z., Cao L., Liu X. (2018). Assessing hazard vulnerability, habitat conservation, and restoration for the enhancement of Mainland China’s coastal resilience. Earths Future 6, 326–338. doi: 10.1002/2017EF000676
Samanta S., Pal D. K., Palsamanta B. (2018). Flood susceptibility analysis through remote sensing, GIS and frequency ratio model. Appl. Water Sci. 8, 66. doi: 10.1007/s13201-018-0710-1
Satta A. (2014). An Index-based method to assess vulnerabilities and risks of Mediterranean coastal zones to multiple hazards. PhD Thesis. Department of Economics Ca'Foscari University of Venice, Italy.
Schober B., Hauer C., Habersack H. (2015). A novel assessment of the role of Danube floodplains in flood hazard reduction (FEM method). Nat. Hazards 75, 33–50. doi: 10.1007/s11069-013-0880-y
Sekovski I., Del Río L., Armaroli C. (2020). Development of a coastal vulnerability index using analytical hierarchy process and application to Ravenna province (Italy). Ocean Coast. Manage. 183, 104982. doi: 10.1016/j.ocecoaman.2019.104982
Serafim M. B., Siegle E., Corsi A. C., Bonetti J. (2019). Coastal vulnerability to wave impacts using a multi-criteria index: Santa Catarina (Brazil). J. Environ. Manage. 230, 21–32. doi: 10.1016/j.jenvman.2018.09.052
Sheik Mujabar P., Chandrasekar N. (2013). Coastal erosion hazard and vulnerability assessment for southern coastal Tamil Nadu of India by using remote sensing and GIS. Nat. Hazards 69, 1295–1314. doi: 10.1007/s11069-011-9962-x
Shi T., Hu Z., Shi Z., Guo L., Chen Y., Li Q., et al. (2018). Geo-detection of factors controlling spatial patterns of heavy metals in urban topsoil using multi-source data. Sci. Total Environ. 643, 451–459. doi: 10.1016/j.scitotenv.2018.06.224
Song Y., Wang J., Ge Y., Xu C. (2020). An optimal parameters-based geographical detector model enhances geographic characteristics of explanatory variables for spatial heterogeneity analysis: cases with different types of spatial data. GIScience Remote Sens. 57, 593–610. doi: 10.1080/15481603.2020.1760434
Tano R. A., Aman A., Kouadio K. Y., Toualy E., Ali K. E., Assamoi P. (2016). Assessment of the Ivorian coastal vulnerability. J. Coast. Res. 32, 1495. doi: 10.2112/JCOASTRES-D-15-00228.1
Taramelli A., Melelli L., Pasqui M., Sorichetta A. (2008). Estimating hurricane hazards using a GIS system. Nat. Hazards Earth Syst. Sci. 8, 839–854. doi: 10.5194/nhess-8-839-2008
Thieler E. R., Hammar-Klose E. S. (1999). National assessment of coastal vulnerability to sea-level rise: Preliminary results for the U.S. Atlantic Coast. USGS Open-File Report 99-593. Reston, Virginia: USGS. Available online at: https://pubs.usgs.gov/publication/ofr99593
Torresan S., Critto A., Rizzi J., Marcomini A. (2012). Assessment of coastal vulnerability to climate change hazards at the regional scale: the case study of the North Adriatic Sea. Nat. Hazards Earth Syst. Sci. 12, 2347–2368. doi: 10.5194/nhess-12-2347-2012
Torresan S., Zabeo A., Rizzi J., Critto A., Pizzol L. (2010). Risk assessment and decision support tools for the integrated evaluation of climate change impacts on coastal zones. In: Hood S. (Ed.). International Congress on Environmental Modelling and Software. Ottawa, Ontario, Canada: International Congress on Modelling and Simulation.
Torresan S., Furlan E., Critto A., Michetti M., Marcomini A. (2020). Egypt’s coastal vulnerability to sea-level rise and storm surge: present and future conditions. Integr. Environ. Assess. Manag. 16, 761–772. doi: 10.1002/ieam.4280
Wang Y. (2006). Study of variation features during coastal erosion processes on the Abandoned Huanghe River Delta and integrated protection measures (Nanjing: Nanjing Normal University).
Wang Y. P., Gao S., Jia J., Thompson C. E. L., Gao J., Yang Y. (2012). Sediment transport over an accretional intertidal flat with influences of reclamation, Jiangsu coast, China. Mar. Geol. 291, 147–161. doi: 10.1016/j.margeo.2011.01.004
Wang J., Li X., Christakos G., Liao Y., Zhang T., Gu X., et al. (2010). Geographical detectors-based health risk assessment and its application in the neural tube defects study of the Heshun Region, China. Int. J. Geogr. Inf. Sci. 24, 107–127. doi: 10.1080/13658810802443457
Wang X., Zhang W., Yin J., Wang J., Ge J., Wu J., et al. (2021). Assessment of coastal erosion vulnerability and socio-economic impact along the Yangtze River Delta. Ocean Coast. Manage. 215, 105953. doi: 10.1016/j.ocecoaman.2021.105953
Warrick R. A. (2009). From CLIMPACTS to SimCLIM: The development of an integrated model for assessing impacts and adaptation to climate change (London: Cambridge University Press).
Yasmeen A., Pumijumnong N., Arunrat N., Punwong P., Sereenonchai S., Chareonwong U. (2024). Nature-based solutions for coastal erosion protection in a changing climate: A cutting-edge analysis of contexts and prospects of the muddy coasts. Estuar. Coast. Shelf Sci. 298, 108632. doi: 10.1016/j.ecss.2024.108632
Yin J., Yin Z., Wang J., Xu S. (2012). National assessment of coastal vulnerability to sea-level rise for the Chinese coast. J. Coast. Conserv. 16, 123–133. doi: 10.1007/s11852-012-0180-9
Yin J., Yin Z., Xu S. (2013). Composite risk assessment of typhoon-induced disaster for China’s coastal area. Nat. Hazards 69, 1423–1434. doi: 10.1007/s11069-013-0755-2
Zhang R. (1992). Suspended sediment transport processes on tidal mud flat in Jiangsu Province, China. Estuar. Coast. Shelf Sci. 35, 225–233. doi: 10.1016/S0272-7714(05)80045-9
Zhang L., Chen S., Yi L. (2016). The sediment source and transport trends around the abandoned Yellow River Delta, China. Mar. Georesources Geotechnol. 34, 440–449. doi: 10.1080/1064119X.2015.1025928
Zhang Y., Wu T., Arkema K. K., Han B., Lu F., Ruckelshaus M., et al. (2021). Coastal vulnerability to climate change in China’s Bohai Economic Rim. Environ. Int. 147, 106359. doi: 10.1016/j.envint.2020.106359
Zhu S., Wei W., Zhu Q., Wan K., Xing F., Yan W., et al. (2024). Wave attenuation and transformation across a highly turbid muddy tidal flat-salt marsh system. Appl. Ocean Res. 147, 103980. doi: 10.1016/j.apor.2024.103980
Keywords: coastal erosion, vulnerability, coastal protection, geodetector, the Abandoned Yellow River Delta
Citation: Zhang Z, Zhou K and Chen P (2025) Muti-indicator integrated assessment of coastal erosion vulnerablity in the Abandoned Yellow River Delta using geospatial approaches. Front. Mar. Sci. 12:1540760. doi: 10.3389/fmars.2025.1540760
Received: 06 December 2024; Accepted: 22 January 2025;
Published: 12 February 2025.
Edited by:
Giandomenico Foti, Mediterranean University of Reggio Calabria, ItalyReviewed by:
Zhiqiang Li, Guangdong Ocean University, ChinaJose Eduardo Fuentes Delgado, University of the Valley, Colombia
Copyright © 2025 Zhang, Zhou and Chen. This is an open-access article distributed under the terms of the Creative Commons Attribution License (CC BY). The use, distribution or reproduction in other forums is permitted, provided the original author(s) and the copyright owner(s) are credited and that the original publication in this journal is cited, in accordance with accepted academic practice. No use, distribution or reproduction is permitted which does not comply with these terms.
*Correspondence: Zhi Zhang, aXp6Y2hpbmFAMTYzLmNvbQ==