 Haofeng Xia
 Shuai Tang1,2
- 1Naval Submarine Academy, Qingdao, Shandong, China
- 2Laoshan Laboratory, Qingdao, Shandong, China
- 3Qingdao Institute of Collaborative Innovation, Qingdao, Shandong, China
- 4School of Civil & Environmental Engineering and Geography Science, Ningbo University, Ningbo, Zhejiang, China
This study investigates the effects of wave coupling on the oceanic and atmospheric responses to Tropical Storm Choi-wan (2021) using a coupled ocean-atmosphere model. Modeled tropical cyclone metrics and ocean responses are compared with and without coupling ocean waves. A wave dependent surface roughness scheme is evaluated to understand the wave influence on tropical cyclone induced changes in sea surface temperature (SST), ocean currents, and wave fields. The results reveal that wave coupling significantly improves the representation of SST cooling and vertical ocean thermal structures. The wave dependent roughness scheme outperforms in capturing the cooling effect and ocean mixing processes induced by the storm. Wave-current coupling also impacts significant wave height distributions, particularly in storm-affected regions, where coupled simulations yield more realistic patterns compared to uncoupled runs. Furthermore, the inclusion of wave-current interactions enhances the accuracy of simulated ocean currents, reflecting the intensifications and directional changes caused by the storm. Overall, the wave dependent roughness parametrization demonstrated superior performance in reproducing storm-induced oceanic responses, emphasizing the critical role of wave coupling in simulating extreme weather events. This study underscores the importance of advanced coupled modeling systems in improving predictions of tropical cyclones and their impacts on the ocean and atmosphere.
1 Introduction
Tropical cyclones (TCs) represent one of the most destructive extreme weather events in the Western North Pacific (Peduzzi et al., 2012; Kim et al., 2015; Li et al., 2024). They occur at the dynamic interface of the atmosphere and ocean, characterized by catastrophic winds and hazardous ocean responses, such as storm surges and extreme waves. The influential extent of TCs can exceed 2,000 kilometers horizontally, causing significant damage to coastal communities (Magee et al., 2021; Lin et al., 2024). The terminology for TCs varies by regions with the system referred to as hurricanes the Atlantic and eastern North Pacific, typhoons in the Western North Pacific. The generation and propagation of TCs are governed by the large-scale climate system and modulated by local sea states. The interactive feedback between TCs and the ocean surface is critical. During the passage of a TC, substantial energy is extracted from the upper ocean, leading to notable changes in sea surface temperature, salinity, and ocean currents. Simultaneously, oceanic feedback mechanisms, predominantly governed by sea-air thermal exchanges, influence the trajectory, intensity, and structural evolution of TCs. These complex ocean-atmosphere interactions underscore the importance of understanding marine responses to enhance predictions of TC behavior and impacts.
Ocean waves play a pivotal role in air-sea interactions during TCs, influencing both TC characteristics and upper ocean dynamics. Previous efforts have been devoted to analyzing the feedback mechanisms between ocean waves and TC characteristics (Craik and Leibovich, 1976; McWilliams and Restrepo, 1999; McWilliams et al., 2000; Olabarrieta et al., 2012; Li et al., 2022; Hlywiak and Nolan, 2022; Zhuge et al., 2024). These investigations have highlighted the significant impact of ocean waves on upper ocean temperature variations, particularly during TC development and movement. It has been demonstrated that the thermal effects of ocean waves play a crucial role in sea-air heat fluxes and the temperature structure in the upper ocean, primarily through wave-current interactions and wave-atmosphere coupling. Moreover, sea surface roughness can be modified in presence of steep and young ocean waves (Shi et al., 2019, 2020), thus modifying the wind profiles near the air-sea interface. Furthermore, wave-current interactions have been demonstrated essential in driving mixing during TCs. Mechanisms such as three-dimensional wave radiation stress (alternatively described as the vortex force scheme), surface rollers, and wave-induced turbulence mixing are key components of this process (Qiao et al., 2004; Babanin and Haus, 2009; Uchiyama et al., 2009, 2010; Mellor, 2011; Zhang et al., 2022a, b). Additionally, wave-induced processes such as wave breaking, wave rollers, and droplet effects substantially influence the atmospheric boundary layer. In response to these complexities, several wave-dependent surface roughness parameterizations have been developed (Taylor and Yelland, 2001; Oost et al., 2002; Drennan et al., 2003; Veron et al., 2008; Mueller and Veron, 2010; Wan et al., 2017).
Recent advancements in ocean-atmosphere numerical models have integrated wave coupling effects, leading to more accurate predictions of extreme weather events such as tropical cyclones (Xie et al., 2001, 2008, 2015; Liu et al., 2011, 2012; Carniel et al., 2016). The atmosphere, ocean, and waves form a tightly interconnected system, where interactions between any two components invariably influence the third. Fully coupled atmosphere-ocean-wave models have shown remarkable success in simulating extreme tropical cyclones, such as hurricanes (Warner et al., 2012; Zambon et al., 2014; Kumar and Vimlesh, 2017; Yang et al., 2020; Kiran and Balaji, 2022; Zhang et al., 2022c), with wave coupling effects playing a crucial role in enhancing model performance. However, the effectiveness of wave coupling in less intense tropical cyclones remains uncertain, and the specific contributions of wave-induced processes in these scenarios have been understudied. Considering that mild or less intense TCs occur more frequently, understanding their dynamics is particularly important.
Therefore, this study aims to address this knowledge gap by investigating the role of wave coupling in shaping the behavior and evolution of mild tropical cyclones (TCs). Using an atmosphere-ocean-wave coupled model, this research focuses on Typhoon Choi-wan (2021) as a case study to evaluate the effects of wave coupling on TC simulation and dynamics. Impacts of wave-dependent surface roughness schemes are analyzed to evaluate their influence on air-sea interactions, including SST cooling, ocean currents, and wave dynamics under tropical storm conditions. The rest of the paper is organized as follows: Dataset and methodology are presented in Section 2. Section 3 describes the model results. Limitations and prospects are discussed in Section 4. Main findings are summarized in Section 5.
2 Methodology
2.1 Model description
The Coupled Ocean-Atmosphere-Wave-Sediment Transport (COAWST) modeling system, originally detailed by Warner et al. (2010), integrates multiple numerical models to consider interactions among various environmental processes (Figure 1). In this study, the latest version of the COAWST system is employed, comprising the following model components: 1) the Weather Research and Forecasting (WRF) model, a nonhydrostatic, quasi-compressible atmospheric model utilizing the Advanced Research WRF (ARW) core; 2) the Regional Ocean Modeling System (ROMS), a free-surface, terrain-following ocean model based on hydrostatic and Boussinesq approximations, and 3) the Simulating Waves Nearshore (SWAN) model, a spectral wave model that solves the wave spectral density evolution equation. The Model Coupling Toolkit (MCT), a fully parallelized coupler leveraging MPI, was employed to facilitate the exchange of state variables between each model component. In addition, while COAWST includes hydrological and sediment transport models, they were not activated in current study of TC Choi-wan (2021). Further detailed model descriptions can be referred to: http://woodshole.er.usgs.gov/operations/modeling/COAWST/index.html.
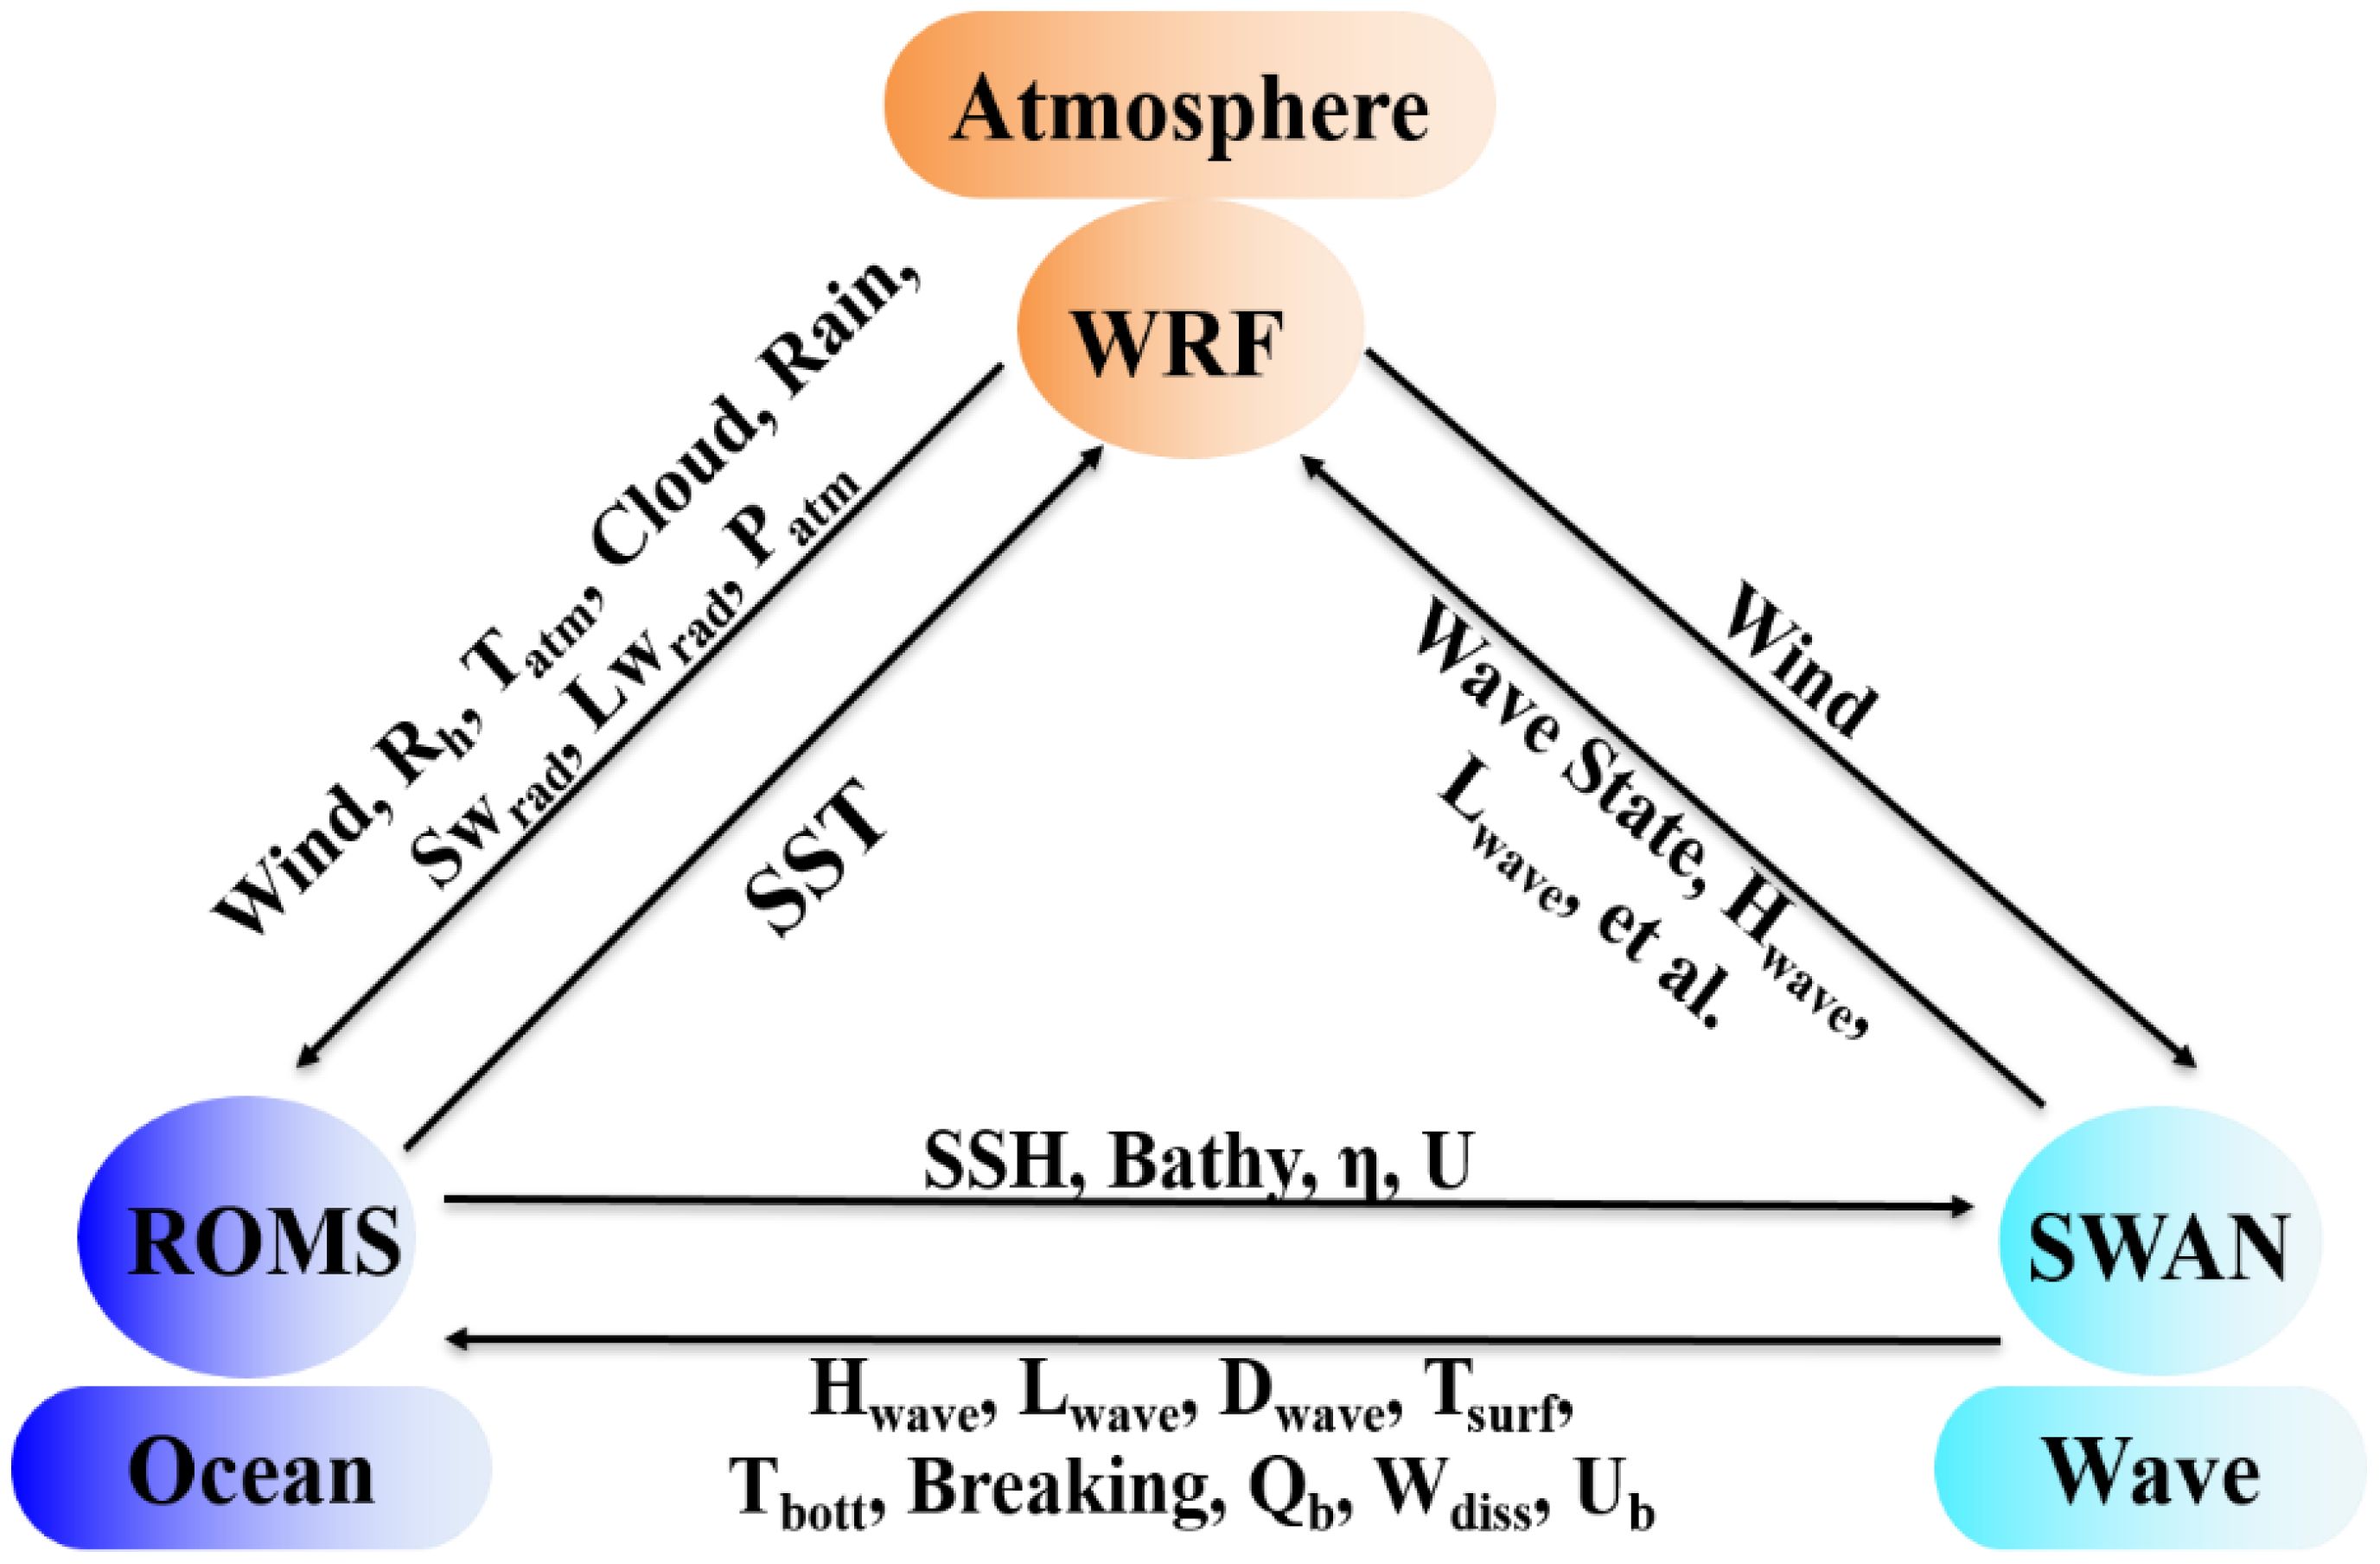
Figure 1. Data exchanged among models (Woods Hole Coastal and Marine Science Center).
2.2 Experimental design
This study carried out coupled numerical simulations of the Tropical Storm Choi-wan (2021) in the western North Pacific and the South China Sea (Figure 2A). It originated as a tropical depression on May 30, 2021, about 1,700 km east-southeast of Manila. The storm moved west northwestward, intensifying into a tropical storm by May 31, with maximum sustained winds of 75 km/h at its peak. Choi-wan crossed the Philippines, causing significant rainfall and flooding, before entering the South China Sea on June 2. Over the following days, it turned northward and gradually weakened, eventually transitioning into an extratropical cyclone near the Ryukyu Islands on June 5.
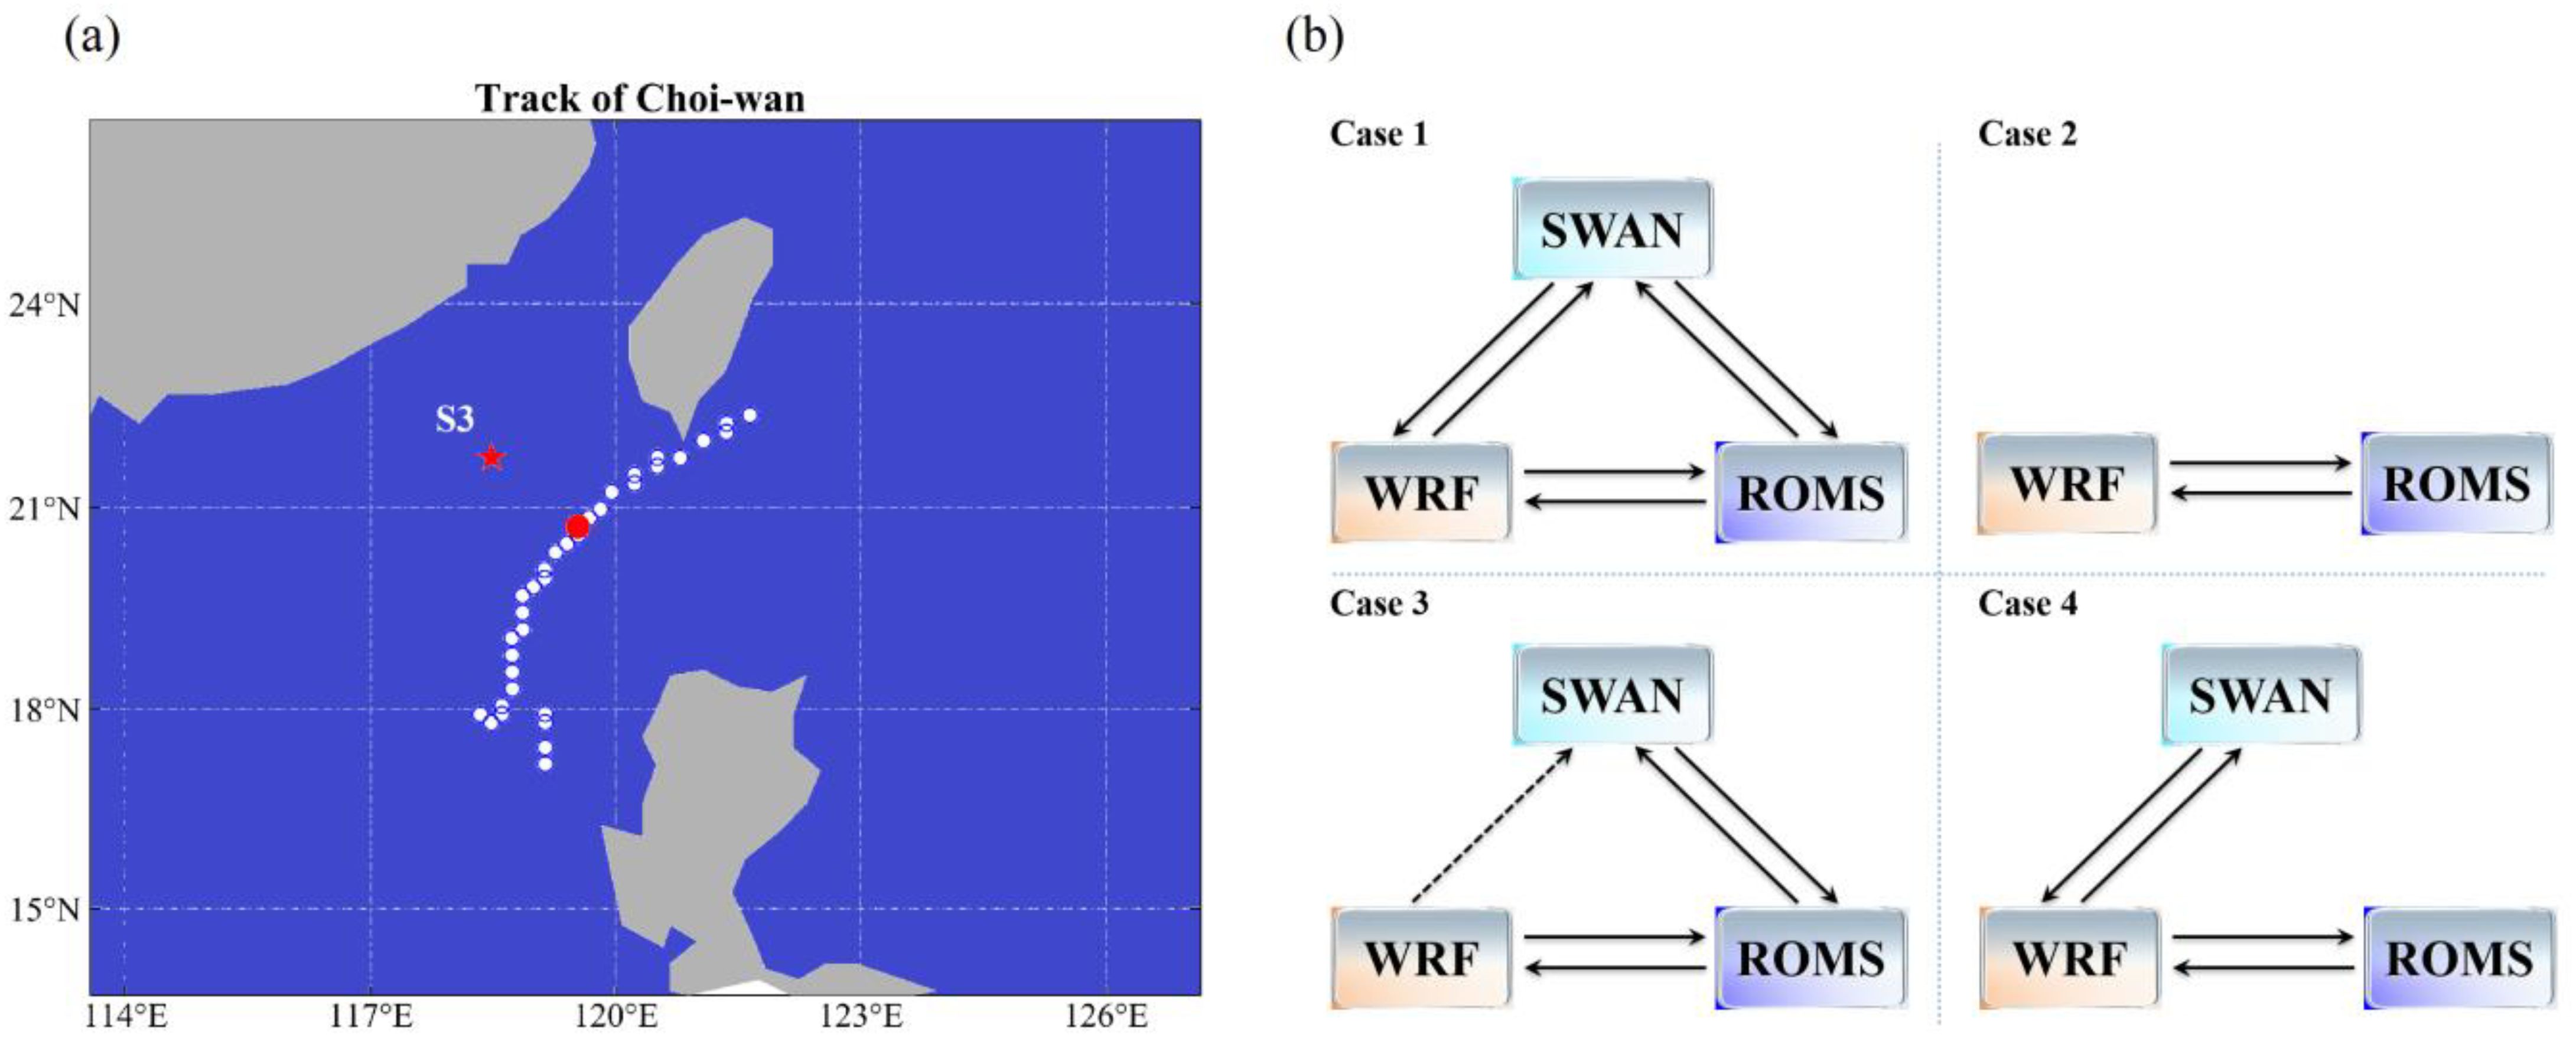
Figure 2. (A) Track of Tropical Storm Choi-wan with a time interval of 1 hour. Red star (S3) is the location of a CTD (Conductivity, Temperature, Depth) observation from an engineering moored subsurface buoy and red dot indicates the tropical storm at 00:00 on June 4. (B) Model experiments with varied coupling configurations (Case 1 to Case 4).
To investigate the effects of wave coupling during storm propagation, four experimental scenarios were designed. The fully coupled configuration (Case 1, Figure 2B) represents complete integration with two-way exchanges of model variables among WRF, ROMS, and SWAN. WRF provided hydrodynamic models with atmospheric forcing fields, including surface wind vectors (U10, V10), relative humidity (Rh), air temperature (Tair), cloud fraction, precipitation, atmospheric pressure (Patm), and radiative fluxes, enabling ROMS to calculate heat and momentum fluxes via the COARE algorithm. ROMS, in turn, supplied WRF with SST. SWAN simulated wave parameters, such as significant wave height (Hwave) and wave period (Tsurf), which were incorporated into WRF through a wave-dependent roughness scheme (e.g., Oost et al., 2002). The WRF-ROMS coupling (Case 2, Figure 2B) excluded SWAN to isolate atmospheric-oceanic interactions. In the WRFSWAN one-way coupling (Case 3, Figure 2B), wave fields simulated by SWAN were not fed back into WRF, with SWAN driven solely by WRF-generated winds to avoid inconsistencies in external wind data. The WRF-ROMS-SWAN coupling without wave-current feedback (Case 4, Figure 2B) included all three models but excluded exchanges between SWAN and ROMS. These configurations systematically evaluate wave coupling effects, providing critical insights into wave-atmosphere-ocean interactions in TC modeling.
Specifically, in all model scenarios, the WRF model was configured with a single grid at a spatial resolution of 15 km, featuring 50 vertical layers extending from the sea surface to 50 hPa. Initial and boundary conditions were sourced from the European Centre for Medium-Range Weather Forecasts (ECMWF) Reanalysis version 5 dataset (Hersbach et al., 2020). To resolve mesoscale physical processes, the Single-Moment 6-class scheme (Hong et al., 2006) was employed for microphysics, and the Kain-Fritsch scheme (Kain, 2004) was used for cumulus convection. The RRTM model (Mlawer et al., 1997) and the Dudhia model (Dudhia, 1989) were applied for longwave and shortwave radiation, respectively. For ocean responses, the ROMS and SWAN models utilized the same curvilinear grid, with a horizontal resolution of 2 km. Bathymetry was interpolated from a combination of the General Bathymetric Chart of the Oceans gridded bathymetry dataset (https://www.gebco.net/) and nautical charts provided by maritime authorities. To better resolve vertical mixing during tropical cyclones, ROMS employed 16 terrain-following vertical layers, with vertical mixing parameterized using the generic-length-scale turbulence closure model (Warner et al., 2005). In SWAN, the computational grid was discretized into 36 directional bins and 24 frequency bins spanning 0.04 Hz to 1.0 Hz. Wave growth due to wind was modeled using the exponential formulation of Komen et al. (1984). Bottom friction was parameterized with the Madsen et al. (1988) model, applying a friction coefficient of 0.035. White-capping dissipation was represented using the approach of Komen et al. (1984), with a dissipation rate of 2.36×10⁻⁵. Additionally, in scenarios incorporating wave coupling, surface wind stress was computed using two distinct parameterization schemes. The first, referred to as CHNK, is a wind-speed-dependent approach based on the Charnock relation (Charnock, 1955). The second, referred to as OOST, employs a wave-dependent surface roughness scheme as proposed by Oost et al. (2002).
3 Results
3.1 Model validations
The fully coupled model scenario incorporating the wave-dependent surface roughness scheme (Case 1) was evaluated against observational data. The simulated track of tropical storm Choi-wan was validated against the best-track data provided by the China Meteorological Administration (CMA, https://tcdata.typhoon.org.cn/en/zjljsjj.html), as illustrated in Figure 3A. Additionally, modeled wind speeds were compared with the Global Ocean Hourly Reprocessed Sea Surface Wind and Stress dataset from the European Centre for Medium-Range Weather Forecasts (ECMWF, https://data.marine.copernicus.eu/product/WIND_GLO_PHY_L4_MY_012_006/description), as shown in Figure 3B. A Pearson correlation coefficient (R) of 0.84 and a Root Mean Square Error (RMSE) of 2.06 m/s were obtained for the wind field. Similarly, the wave field simulations were validated using ECMWF’s Global Ocean Waves Reanalysis data (https://data.marine.copernicus.eu/product/GLOBAL_MULTIYEAR_WAV_001_032/description), as depicted in Figure 3C, yielding R and RMSE values of 0.79 and 0.35 m, respectively. Additionally, the modeled water level time series were compared with in-situ observations from the Currimao station in the Philippines (Figure 3D). During the initial 12 hours (00:00–12:00 on June 3), discrepancies in water levels were observed, potentially attributed to errors in the initial conditions during the model’s warming-up period. These inaccuracies can prevent the model from accurately capturing water level dynamics. Additionally, the atmospheric model’s difficulty in resolving the track of a mild vortex may lead to inaccuracies in the wind field, contributing to an underestimation of water levels. However, from 12:00 on June 3 to 12:00 on June 4, the model accurately reproduced the observed water levels. Overall, the modeled tropical cyclone characteristics and associated oceanic responses aligned well with observational data. Nonetheless, discrepancies were noted, particularly in the meteorological fields, which could stem from insufficient boundary value accuracy for a relatively weak tropical cyclone. Biases in the wave field may also be linked to errors in tracking the tropical cyclone’s trajectory.
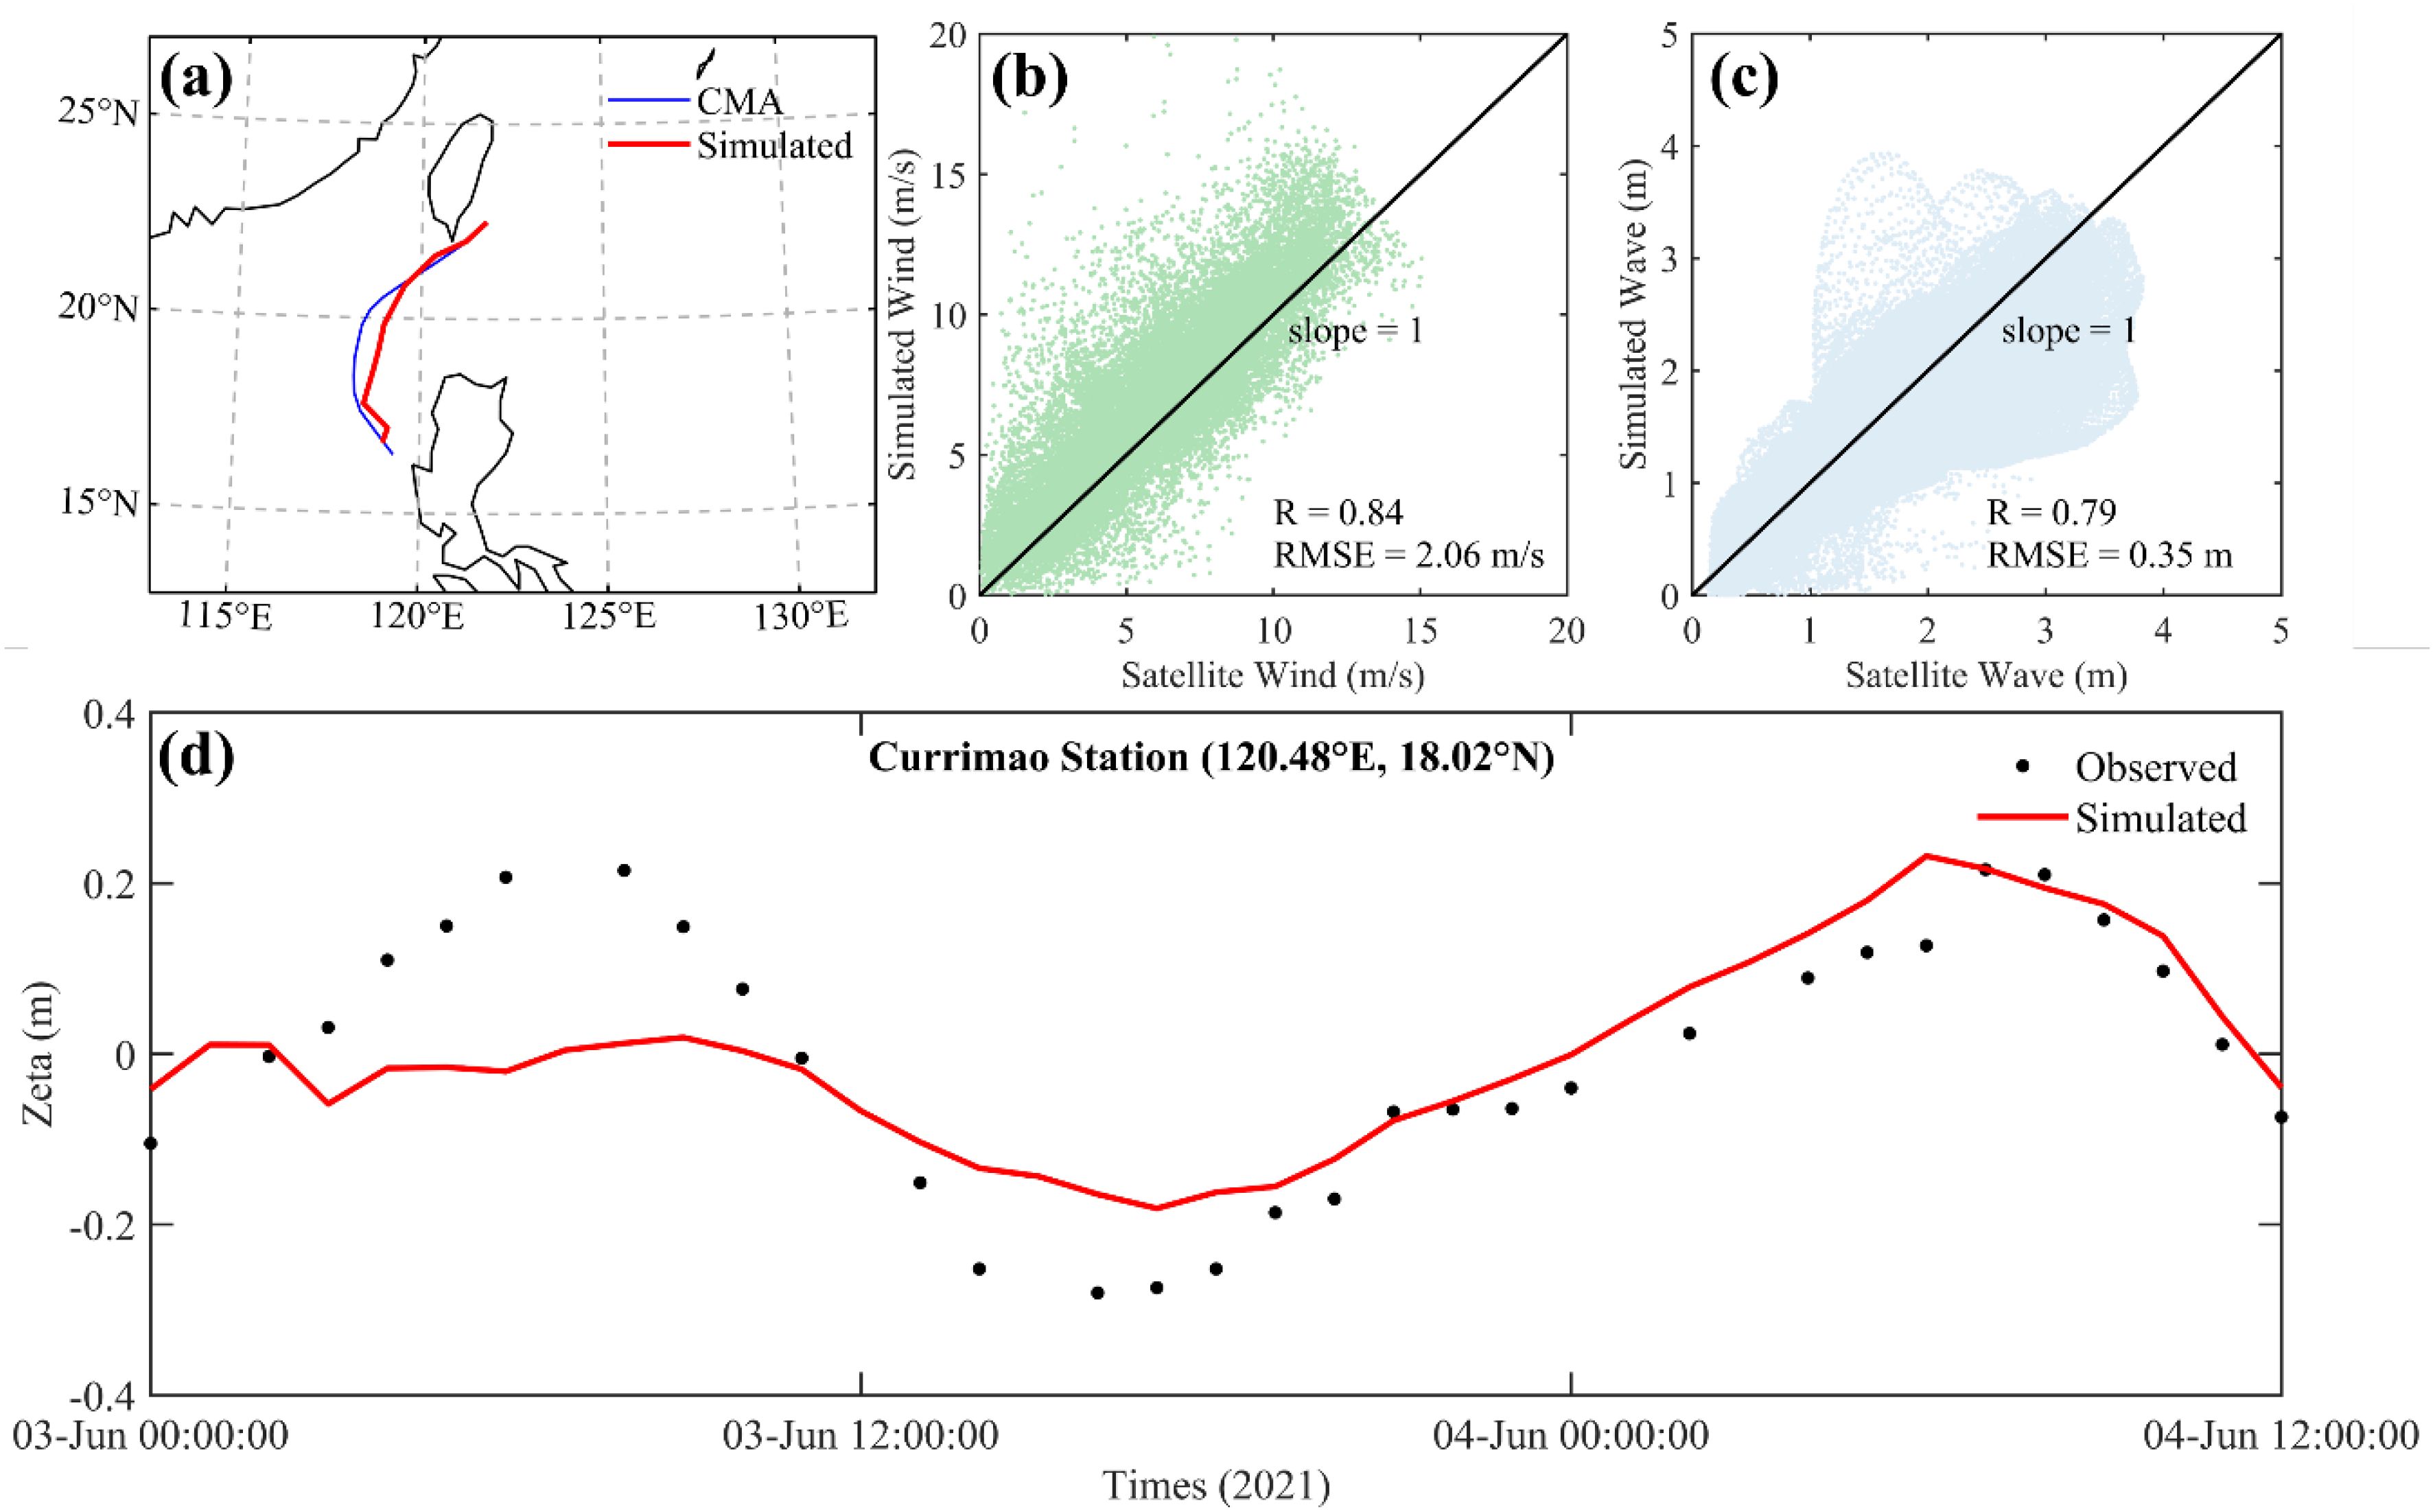
Figure 3. (A) Validations of simulated track (red line) with CMA best track data (blue line). (B) Wind field compared with satellite wind data. (C) Wave field data compared with satellite wave data. (D) Simulated water levels (red line) and in-situ observed data (black dots) at each hour.
3.2 Wave coupling effects indicated by comparisons with CTD observations
Modeled water temperature was compared with in-situ observations at point S3 (Figures 4B). Akima interpolation was employed to align the simulation data with observation times and depths. As shown in Figure 4A, the modeled temperatures during tropical storm Choi-wan were generally lower than the observations, with the average error across the seven experimental cases remaining below 0.3°C throughout the 36-hour simulation period. Despite the limitations of Akima interpolation, this accuracy underscores the reliability and stability of the simulations. The performance of the experiments was assessed by analyzing normalized temperature results during two distinct periods: before the tropical storm approached point S3 (Figure 4C) and at its closest proximity to S3 (Figure 4D). On average, the modeled sea temperatures were lower than the observations, indicating that higher modeled temperatures correspond to better performance. During the first period, Case 2 produced the highest sea temperatures, while during the second period, maximum temperatures were observed in Case 1. The results in Figure 4D also reveal that the OOST parameterization scheme outperformed the CHNK scheme across both coupling configurations (as described in Figure 2). Overall, the fully coupled OOST parameterization (Case 1-OOST) yielded the most accurate temperature results, effectively capturing observed SST variations. Conversely, simulations involving only wave-current coupling (Case 3) produced comparatively lower temperatures, highlighting the importance of fully coupled parameterizations in accurately representing tropical cyclone induced thermal responses.
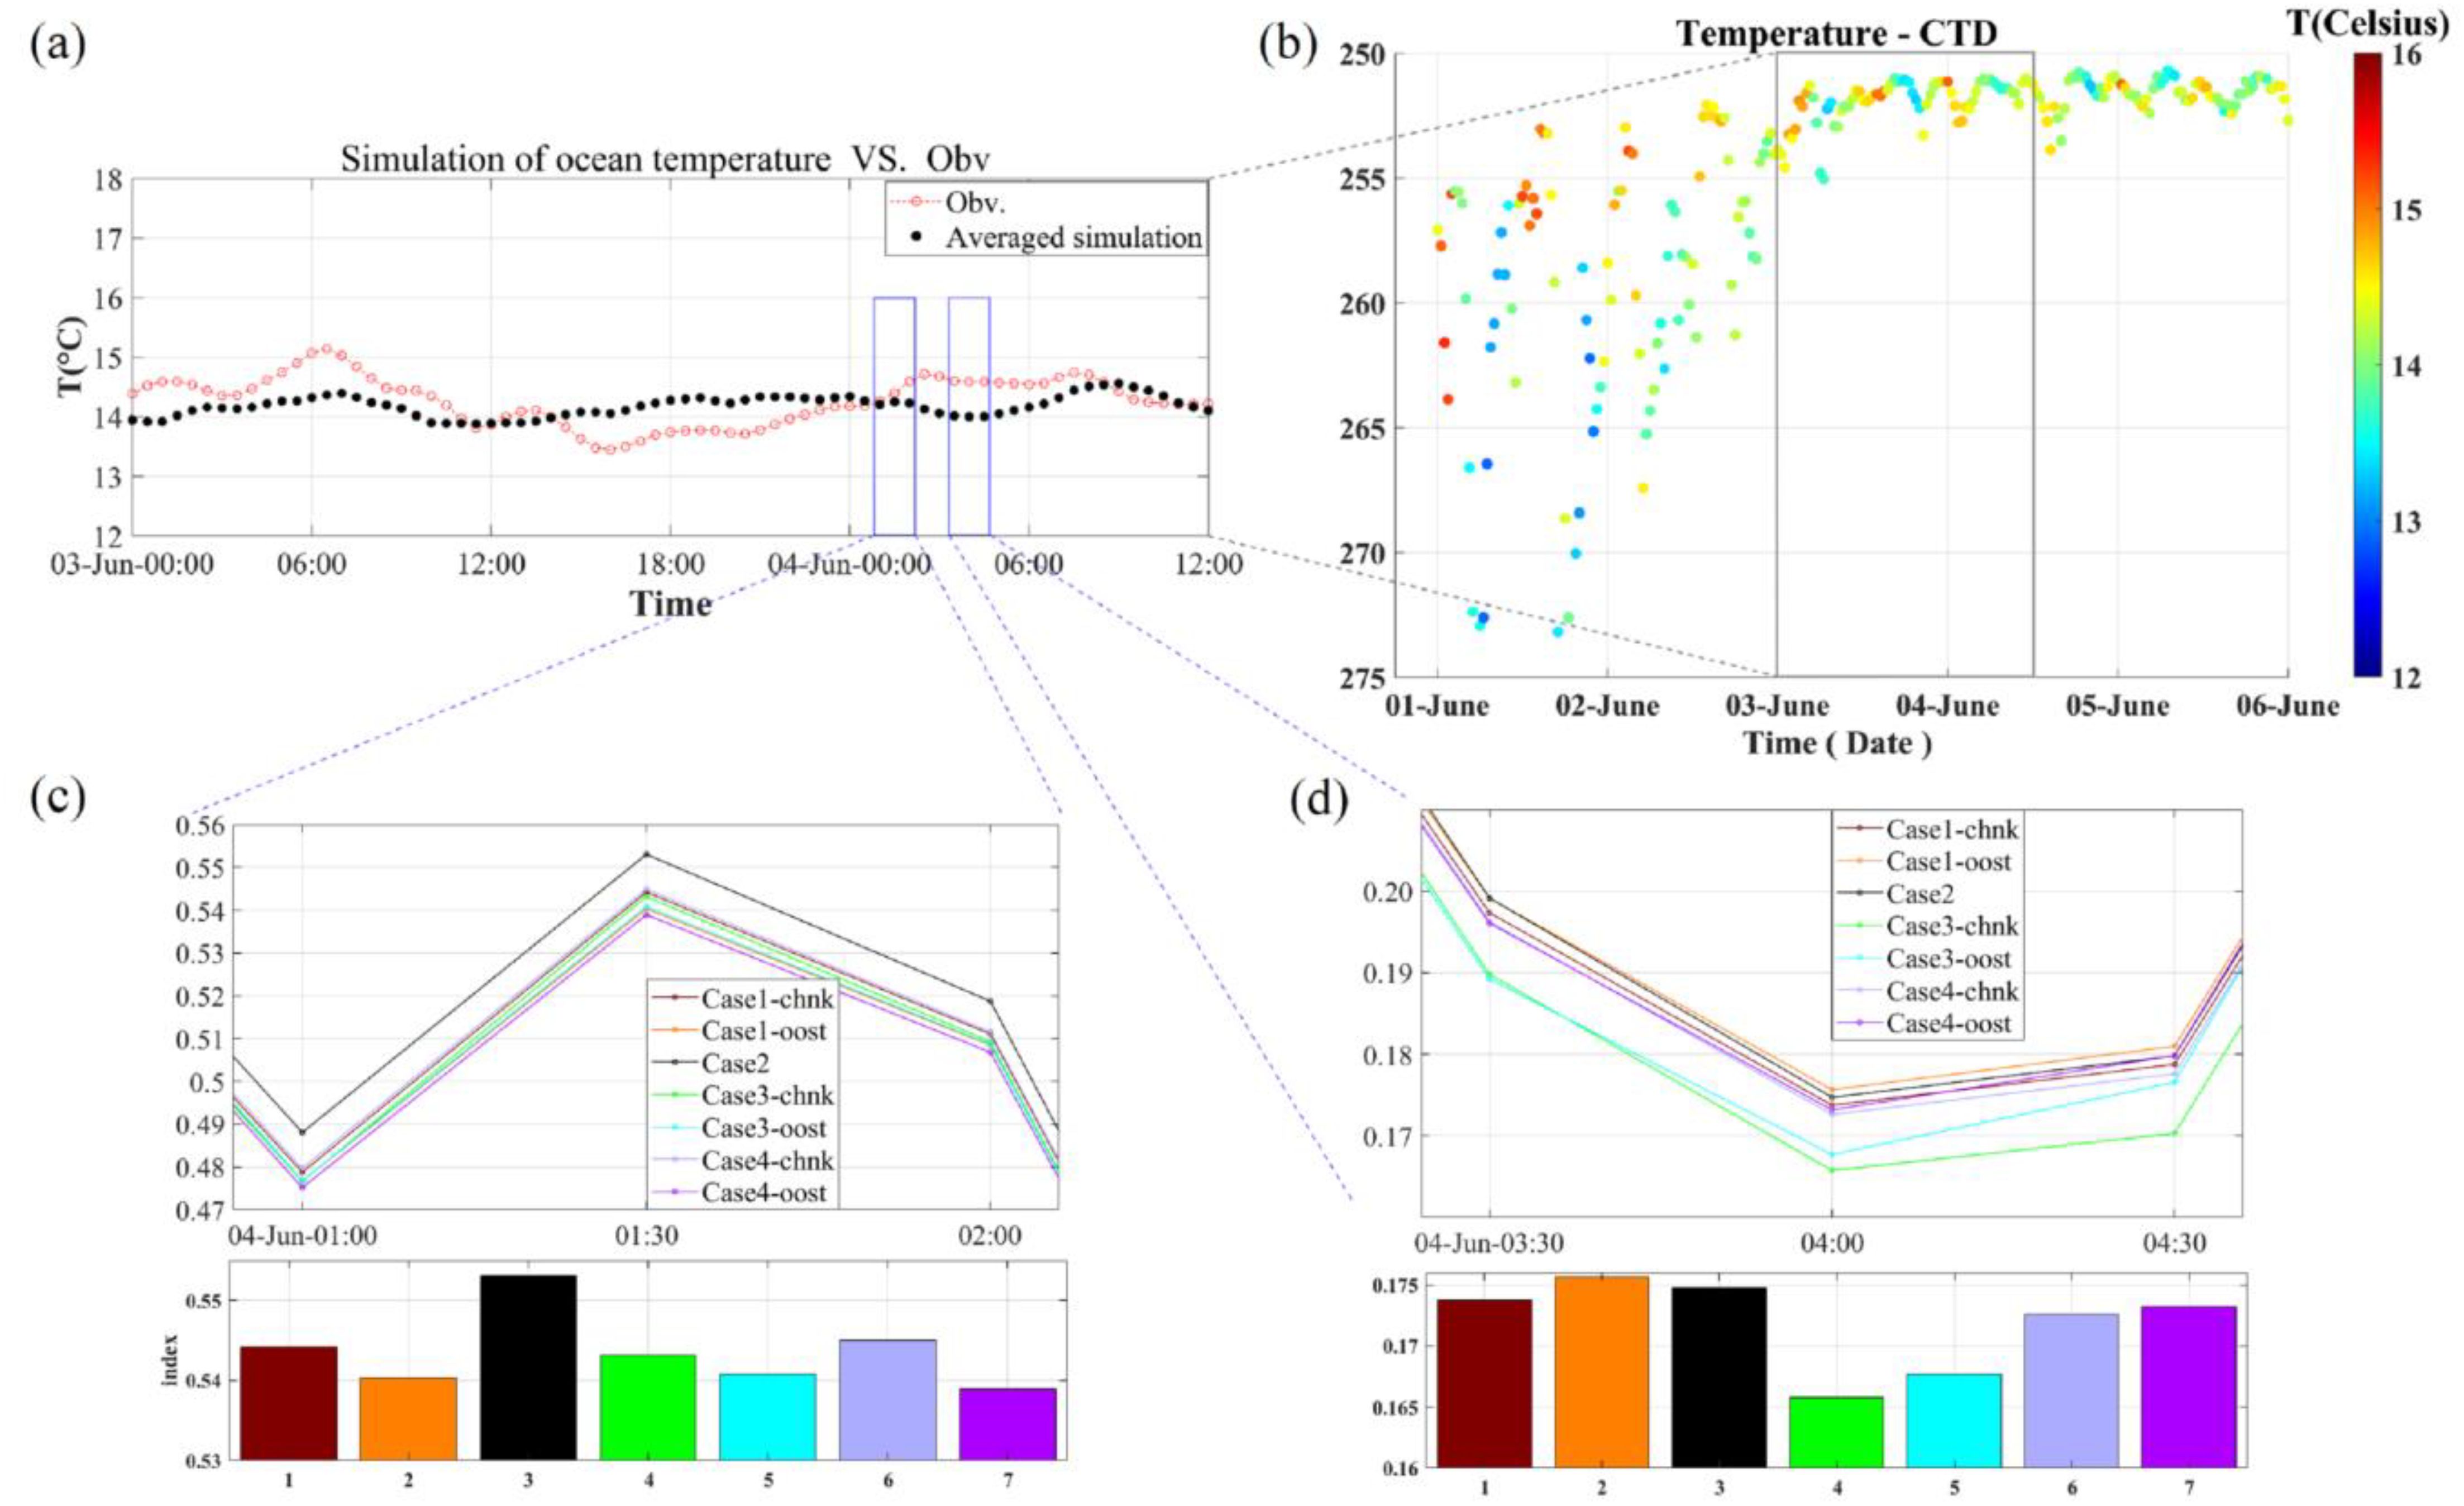
Figure 4. Comparison of model results with field observations (A) and raw data from point S3 (B). Normalized results for different model outputs: (C) the period before the tropical storm approaches S3 and (D) the period when the tropical storm is closest to S3.
Furthermore, Case 2, which excluded wave effects, served as the control group. Figure 5 illustrates the differences in normalized vertical sea temperature over time at point S3 during tropical storm Choi-wan (from 00:00 on June 3 to 12:00 on June 4) across all experimental groups compared to Case 2. When Choi-wan was closest to point S3 (03:00–04:00 on June 4, marked by the red dashed rectangular box), temperature differences were primarily concentrated in the upper layers, reflecting the strong wind-driven mixing that entrains cooler water from below the thermocline into the surface layer. Subsequently, bottom-layer temperatures consistently increased relative to Case 2, suggesting that wave effects enhanced vertical mixing and facilitated the downward transport of heat. Taking the TC lag effects into account, the OOST parameterization showed superior performance in promoting vertical mixing compared to the CHNK scheme, evidenced by larger temperature differences across all coupling configurations (Figures 5D-F). The wave-dependent surface roughness scheme in OOST effectively modified surface stress, enhancing momentum transfer into the water column and leading to more pronounced thermal adjustments. Moreover, in Case 3 with the OOST parameterization scheme (Figure 5E), stronger vertical mixing caused a noticeable temperature drop after the storm passage, with larger areas showing differences exceeding 0.01 relative to Case 1 in the middle and bottom layers. This implied the impacts of wave-induced turbulence in facilitating upwelling, which redistributed heat by cooling the surface while transporting it into deeper layers. Such processes are essential in shaping the post-storm thermal structure. However, neglecting wave effects (Case 2) underestimated vertical mixing and heat redistribution, leading to less accurate simulations of storm-induced cooling and recovery. Fully coupled models incorporating advanced wave parameterizations, such as OOST, demonstrated improved capabilities in capturing these dynamics. By accurately representing interactions between waves, currents, and atmospheric forcing, these models enhance predictions of SST changes during extreme events. These changes are critical for understanding tropical storm intensity, feedback mechanisms, and marine biogeochemical processes. The results underscore the necessity of coupling schemes that account for wave dynamics to accurately simulate the complex thermal responses of the ocean during tropical cyclones.
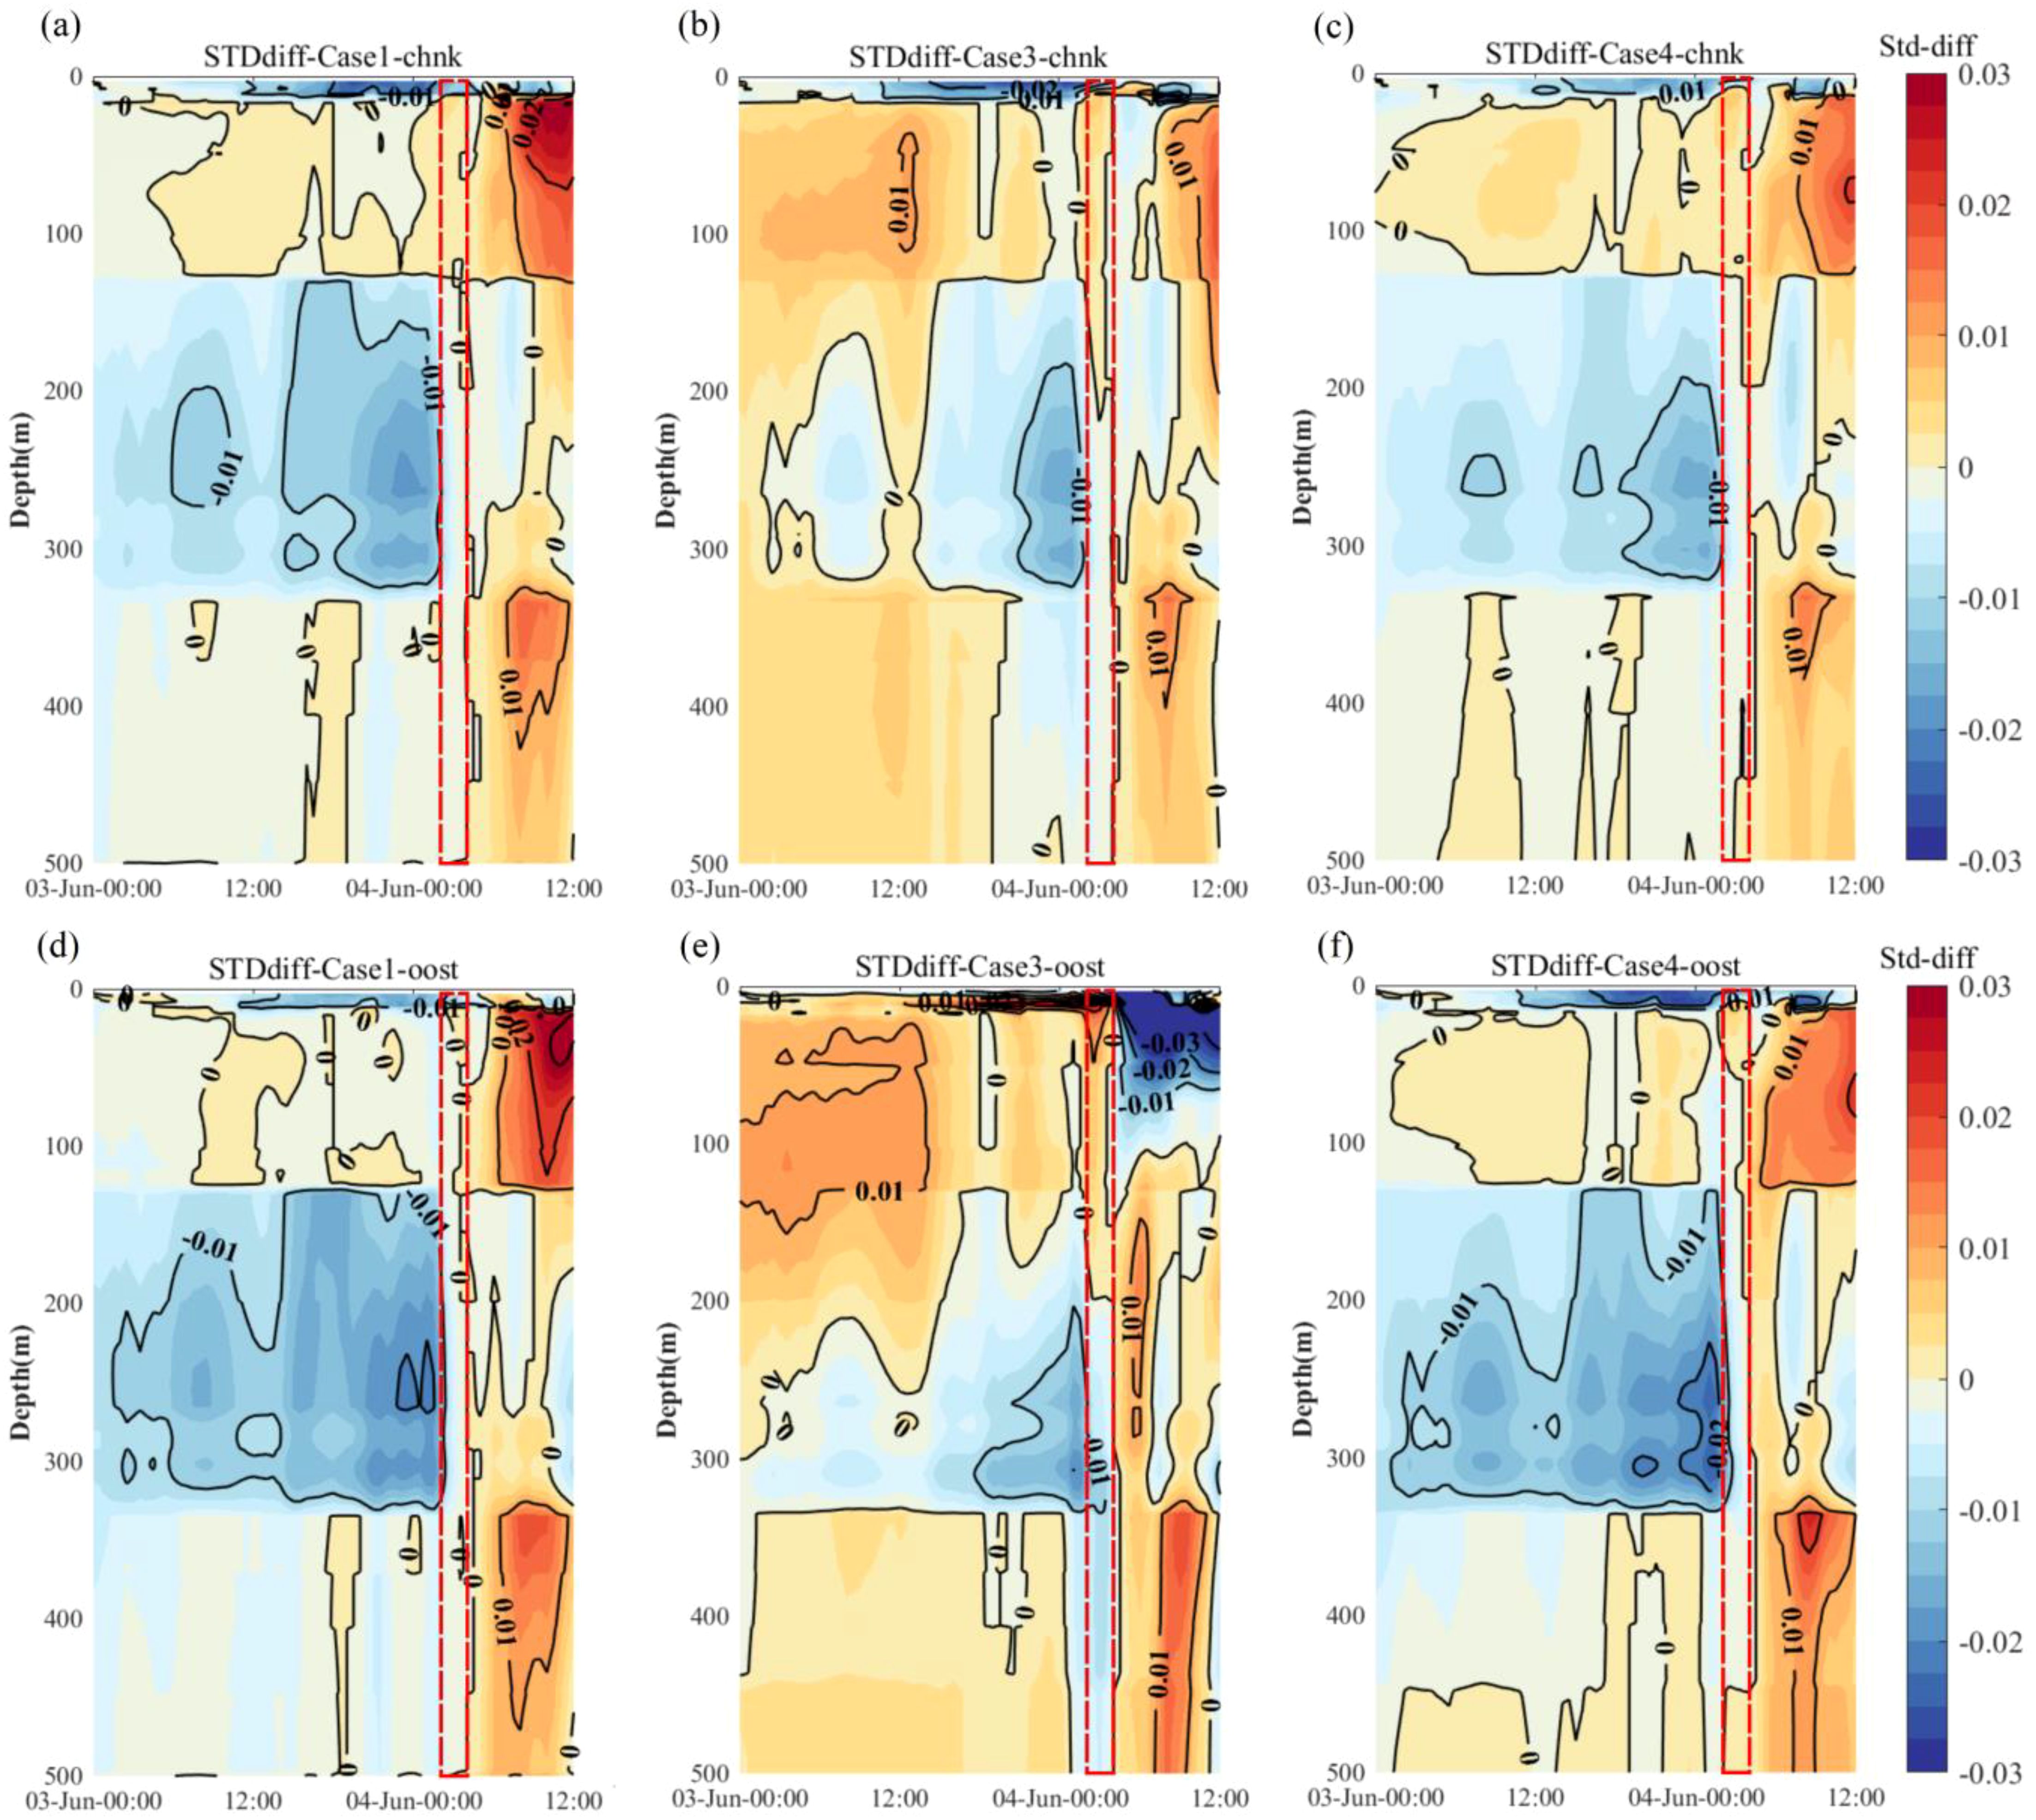
Figure 5. (A–F) Differences in the time-varying results of normalized vertical sea temperature at S3 point simulated by different coupling schemes and wave coupling effects parameterizations, compared to the results of Case 2 (no wave coupling). The three columns represent different coupling schemes; and upper panels: CHNK parameterization, lower panels: OOST parameterization. The red dashed lines represent the sea temperature change during 03:00-04:00 at 4-June when Typhon Choi-wan was closest to the S3 point.
3.3 Effects of wave coupling in ocean mixing along the storm track
To further explore the role of wave coupling in tropical cyclone simulations, the vertical temperature distribution of Case 2 along the tropical storm’s track (at 3-hour intervals, Figure 6A) is shown in Figure 6B. The results clearly demonstrate the effect of vertical mixing on sea temperature and highlight a lag in the oceanic response to tropical storm intensity. The deepest downward extension of the temperature anomaly occurred approximately 8 hours after the maximum wind speed at the tropical storm’s center began to decline. However, this depth persisted for only about 2 hours before gradually diminishing. This delay in the response underscores the complex interaction between atmospheric forcing and ocean dynamics, where momentum transfer and mixing processes continue to affect the thermal structure even after the storm’s peak intensity has passed.
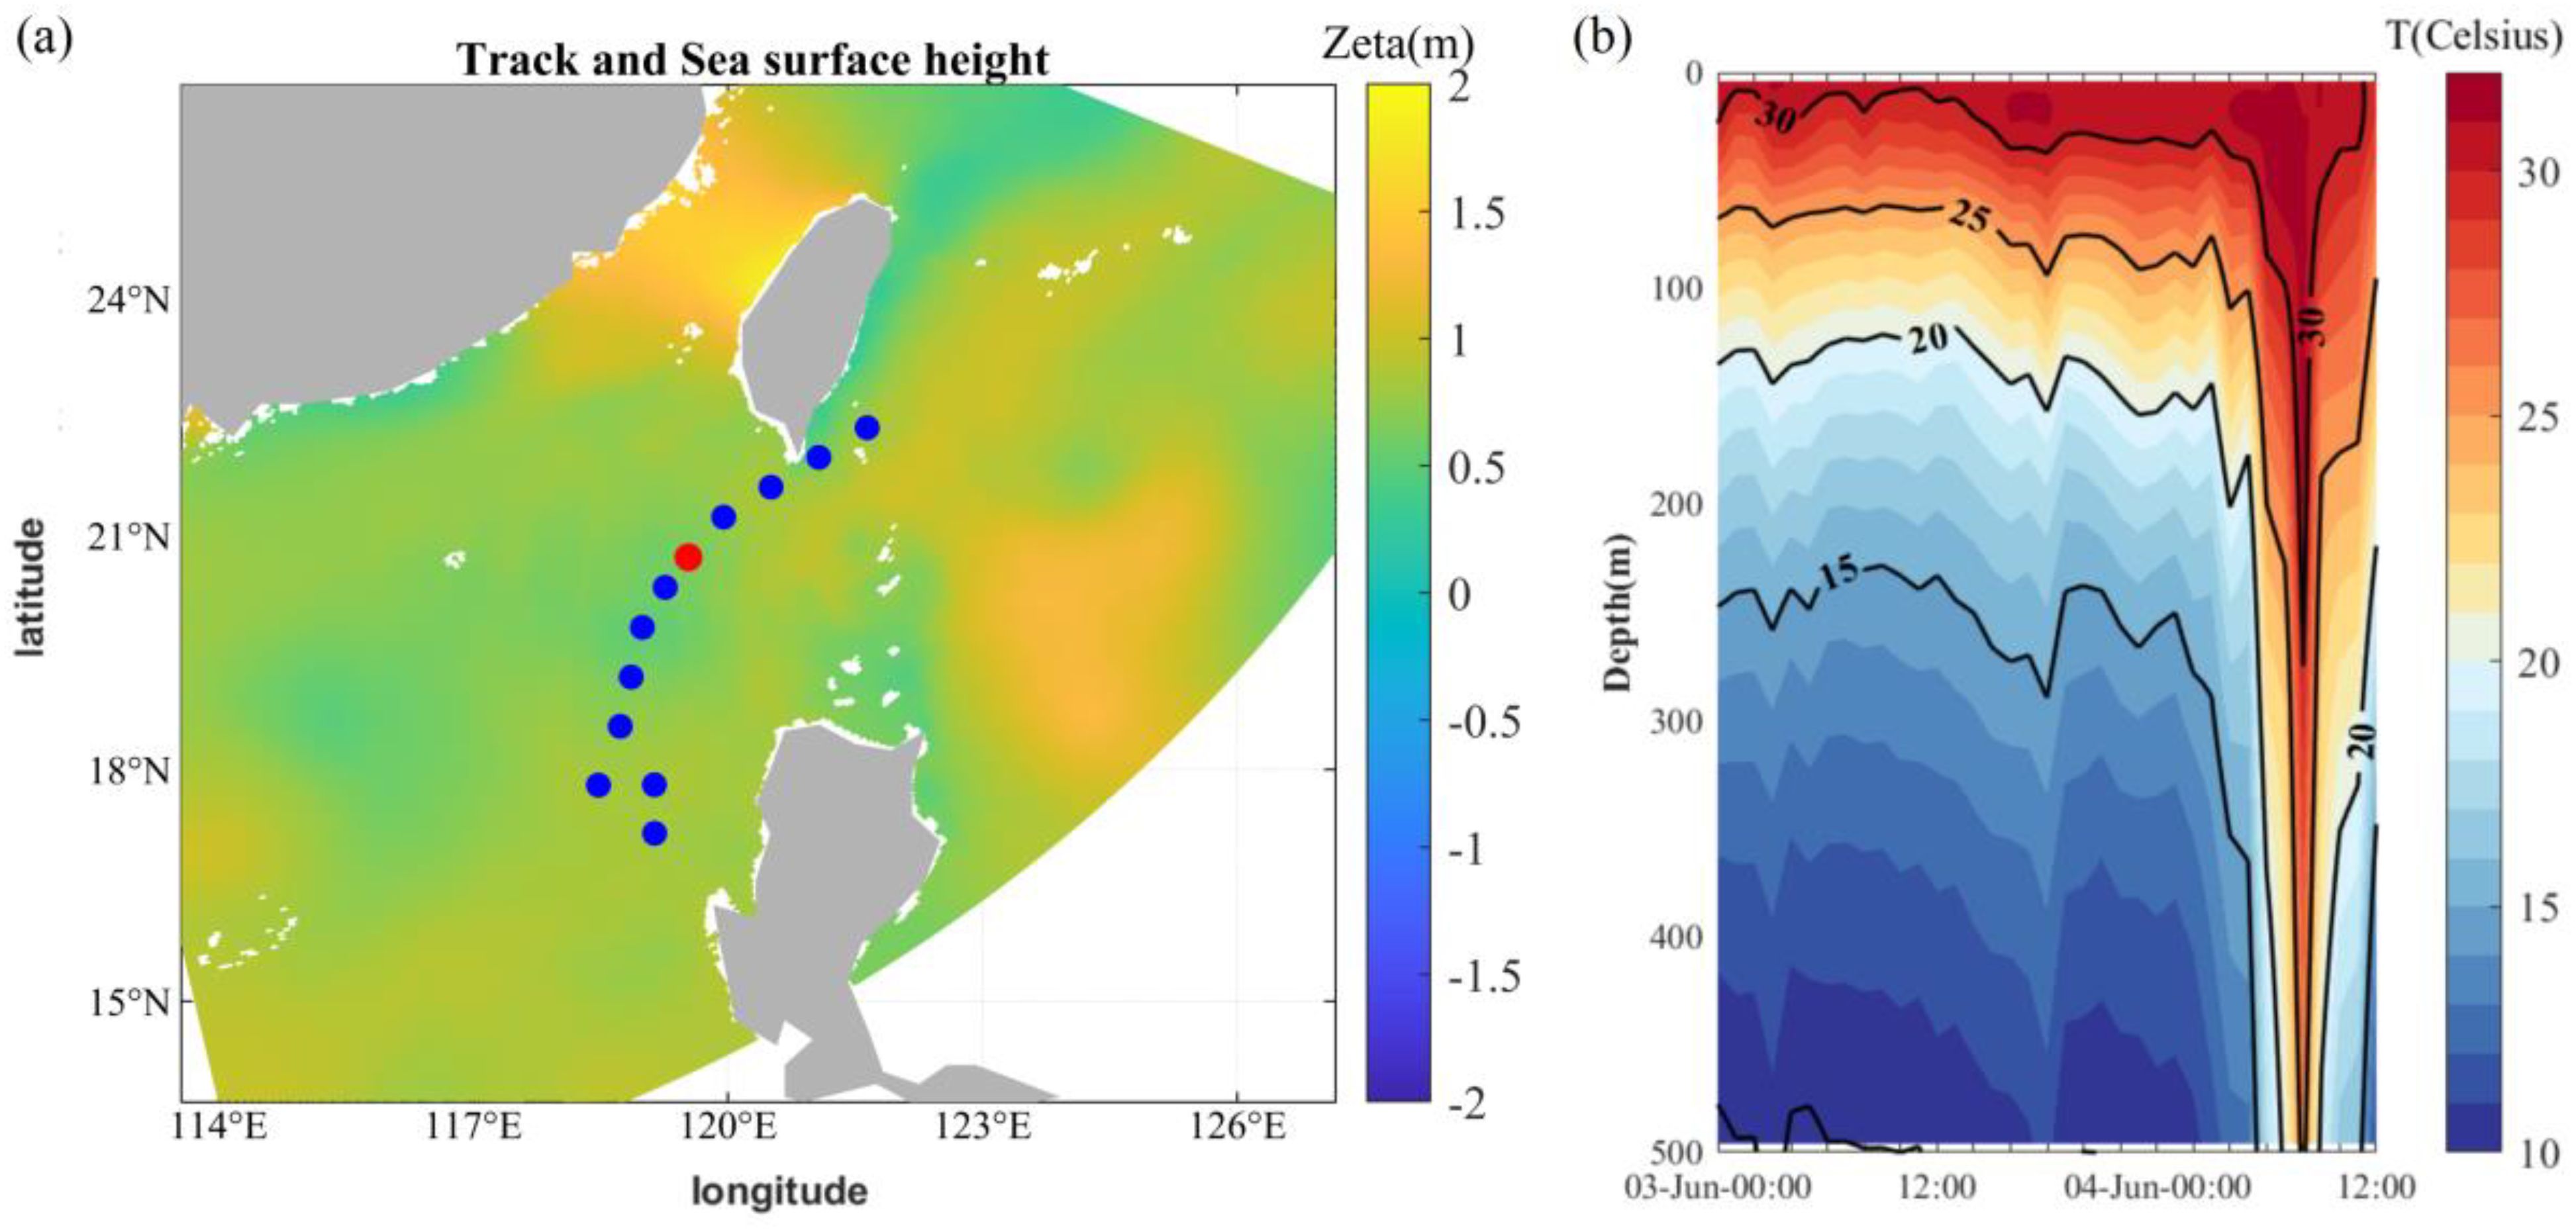
Figure 6. (A) Schematic diagram of the track and intensity of tropical storm Choi-wan with a time interval of 3 h Red dot indicates the tropical storm center at 00:00 on June 4. Contour indicates sea surface height at 00:00 on June 4. (B) Vertical sea temperature distribution with time under the center of the tropical storm.
Figure 7 presents the differences in vertical sea temperature distribution over time between the various experiments and Case 2. The results show that the impact of wave coupling on sea temperature was minimal when simulating a tropical storm of weak intensity. Temperature variations across all experiments and vertical levels were generally below 0.2°C, with most of the changes concentrated in the upper layers. However, the OOST parameterization (lower panel of Figure 7) consistently produced stronger vertical mixing compared to the CHNK parameterization scheme (upper panel of Figure 7). The temperature variations in the OOST configuration were more widely distributed both temporally and spatially, with higher values observed.
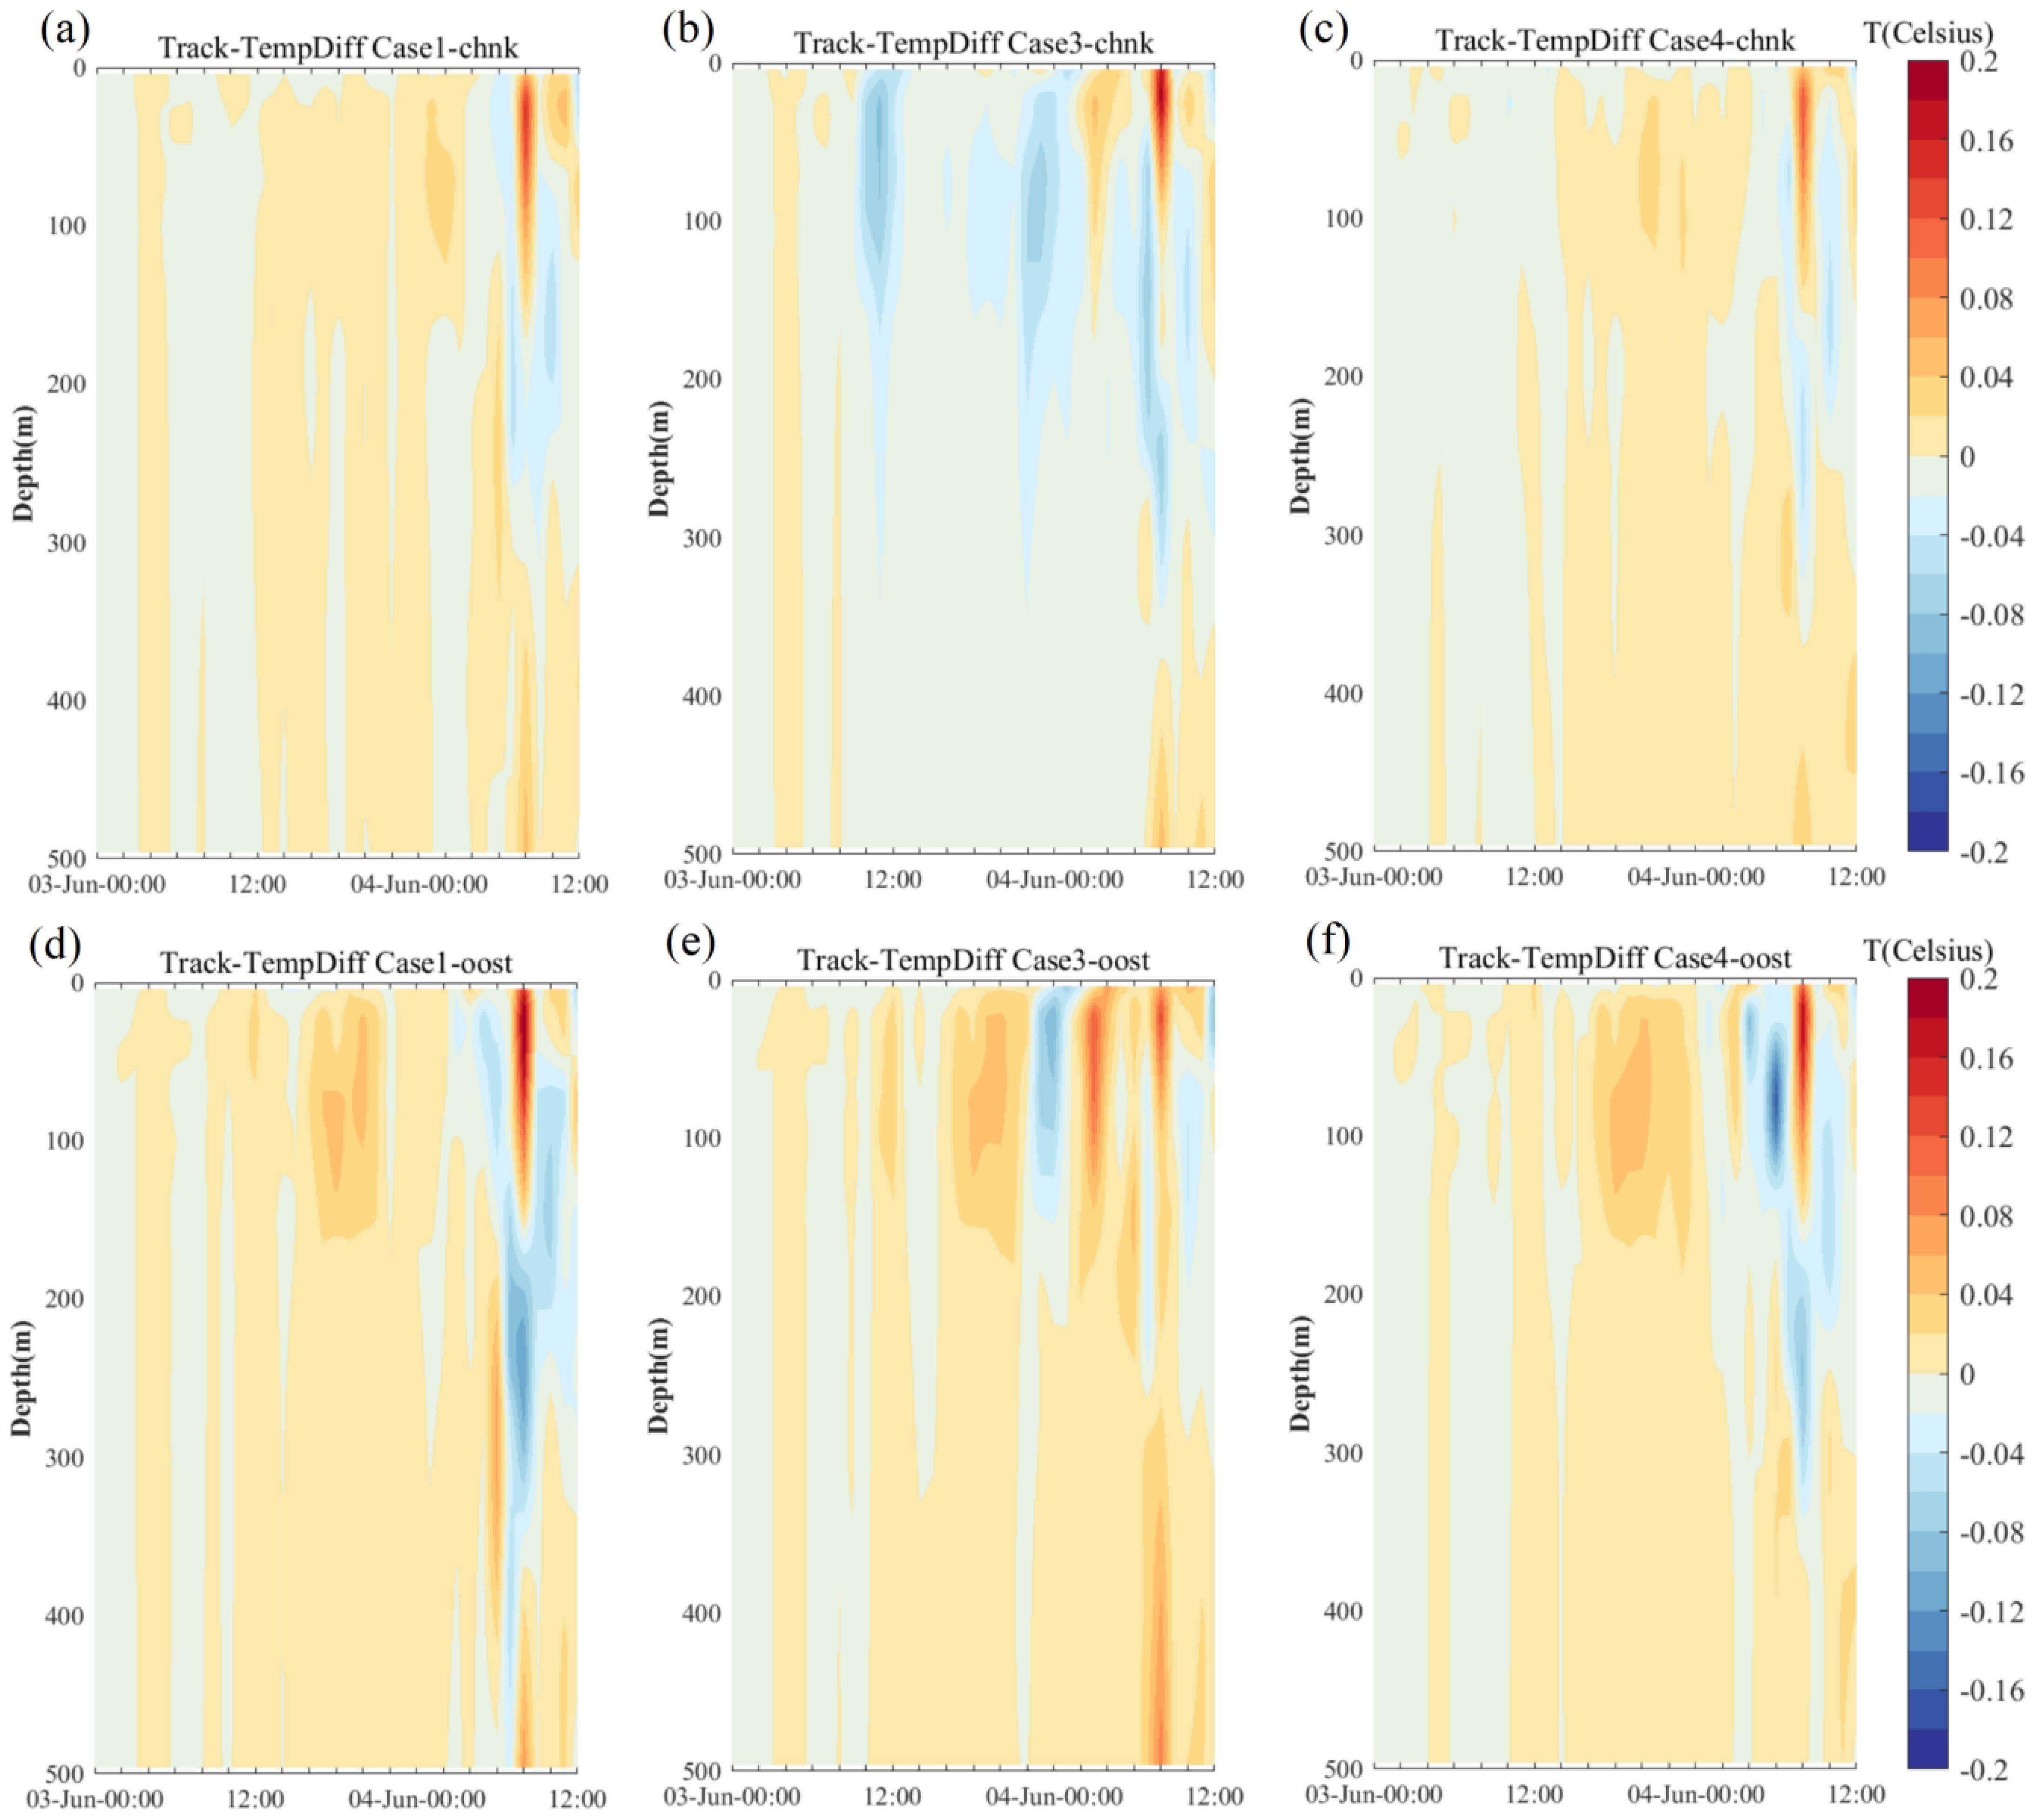
Figure 7. (A–F) Differences in the time-varying results of normalized vertical sea temperature under the tropical storm centers simulated by different coupling schemes and wave coupling effects parameterizations, compared to the results of Case 2 (no wave coupling). The three columns represent different coupling schemes; and upper panels: CHNK parameterization, lower panels: OOST parameterization.
In Case 1 and Case 4 (Figures 7A, D, 7C, F), the differences between the two parameterization schemes were primarily observed at the deepest temperature intrusions, with smaller temperature changes in the mid-layers due to OOST mixing. The most significant differences occurred in Case 3 (Figures 7B, E), where negative variations exceeding 0.04°C were observed in the CHNK parameterization at upper levels, while the OOST parameterization showed predominantly positive changes. As the tropical storm intensified, vertical mixing became more pronounced, enhancing the influence of wave coupling on the simulation results. Under these conditions, the advantages of the OOST parameterization became increasingly evident, implying its superior performance in capturing wave-induced vertical mixing during relatively intense cyclonic events.
3.4 Effects of wave coupling in modeling ocean surface fields
Comparisons of the experiments at point S3 and along the tropical storm’s track revealed positive outcomes of wave coupling, with the OOST parameterization exhibiting notable advantages. To evaluate model performance more comprehensively, the overall response of different schemes at a representative time step (03:00 on 4 June) was selected for comparison and analysis.
3.4.1 Alterations in surface winds and currents
Figure 8 shows minimal differences in the wind fields across the various experiments in storm-affected regions, with low variations in wind speeds near the tropical storm’s track and nearly identical wind speeds at S3. The largest deviations were observed in the relatively enclosed Beibu Gulf, located farther from the study area. A deviation exceeding 2.5 m/s near the tropical storm center was only seen in Case 3-CHNK (Figure 8B). This suggests that directly coupling waves with the atmosphere, or indirectly coupling them through currents, had a limited impact on the atmospheric response during the storm. The differences between the OOST and CHNK parameterizations were minor but exhibited spatial variability. Overall, the OOST scheme produced slightly lower high wind speed simulations compared to the CHNK scheme, especially in the open areas of the South China Sea and the Western Pacific Ocean. This indicates that the influence of wave coupling on atmospheric dynamics was relatively subdued in this mild tropical storm scenario, with only localized differences observed in specific regions.
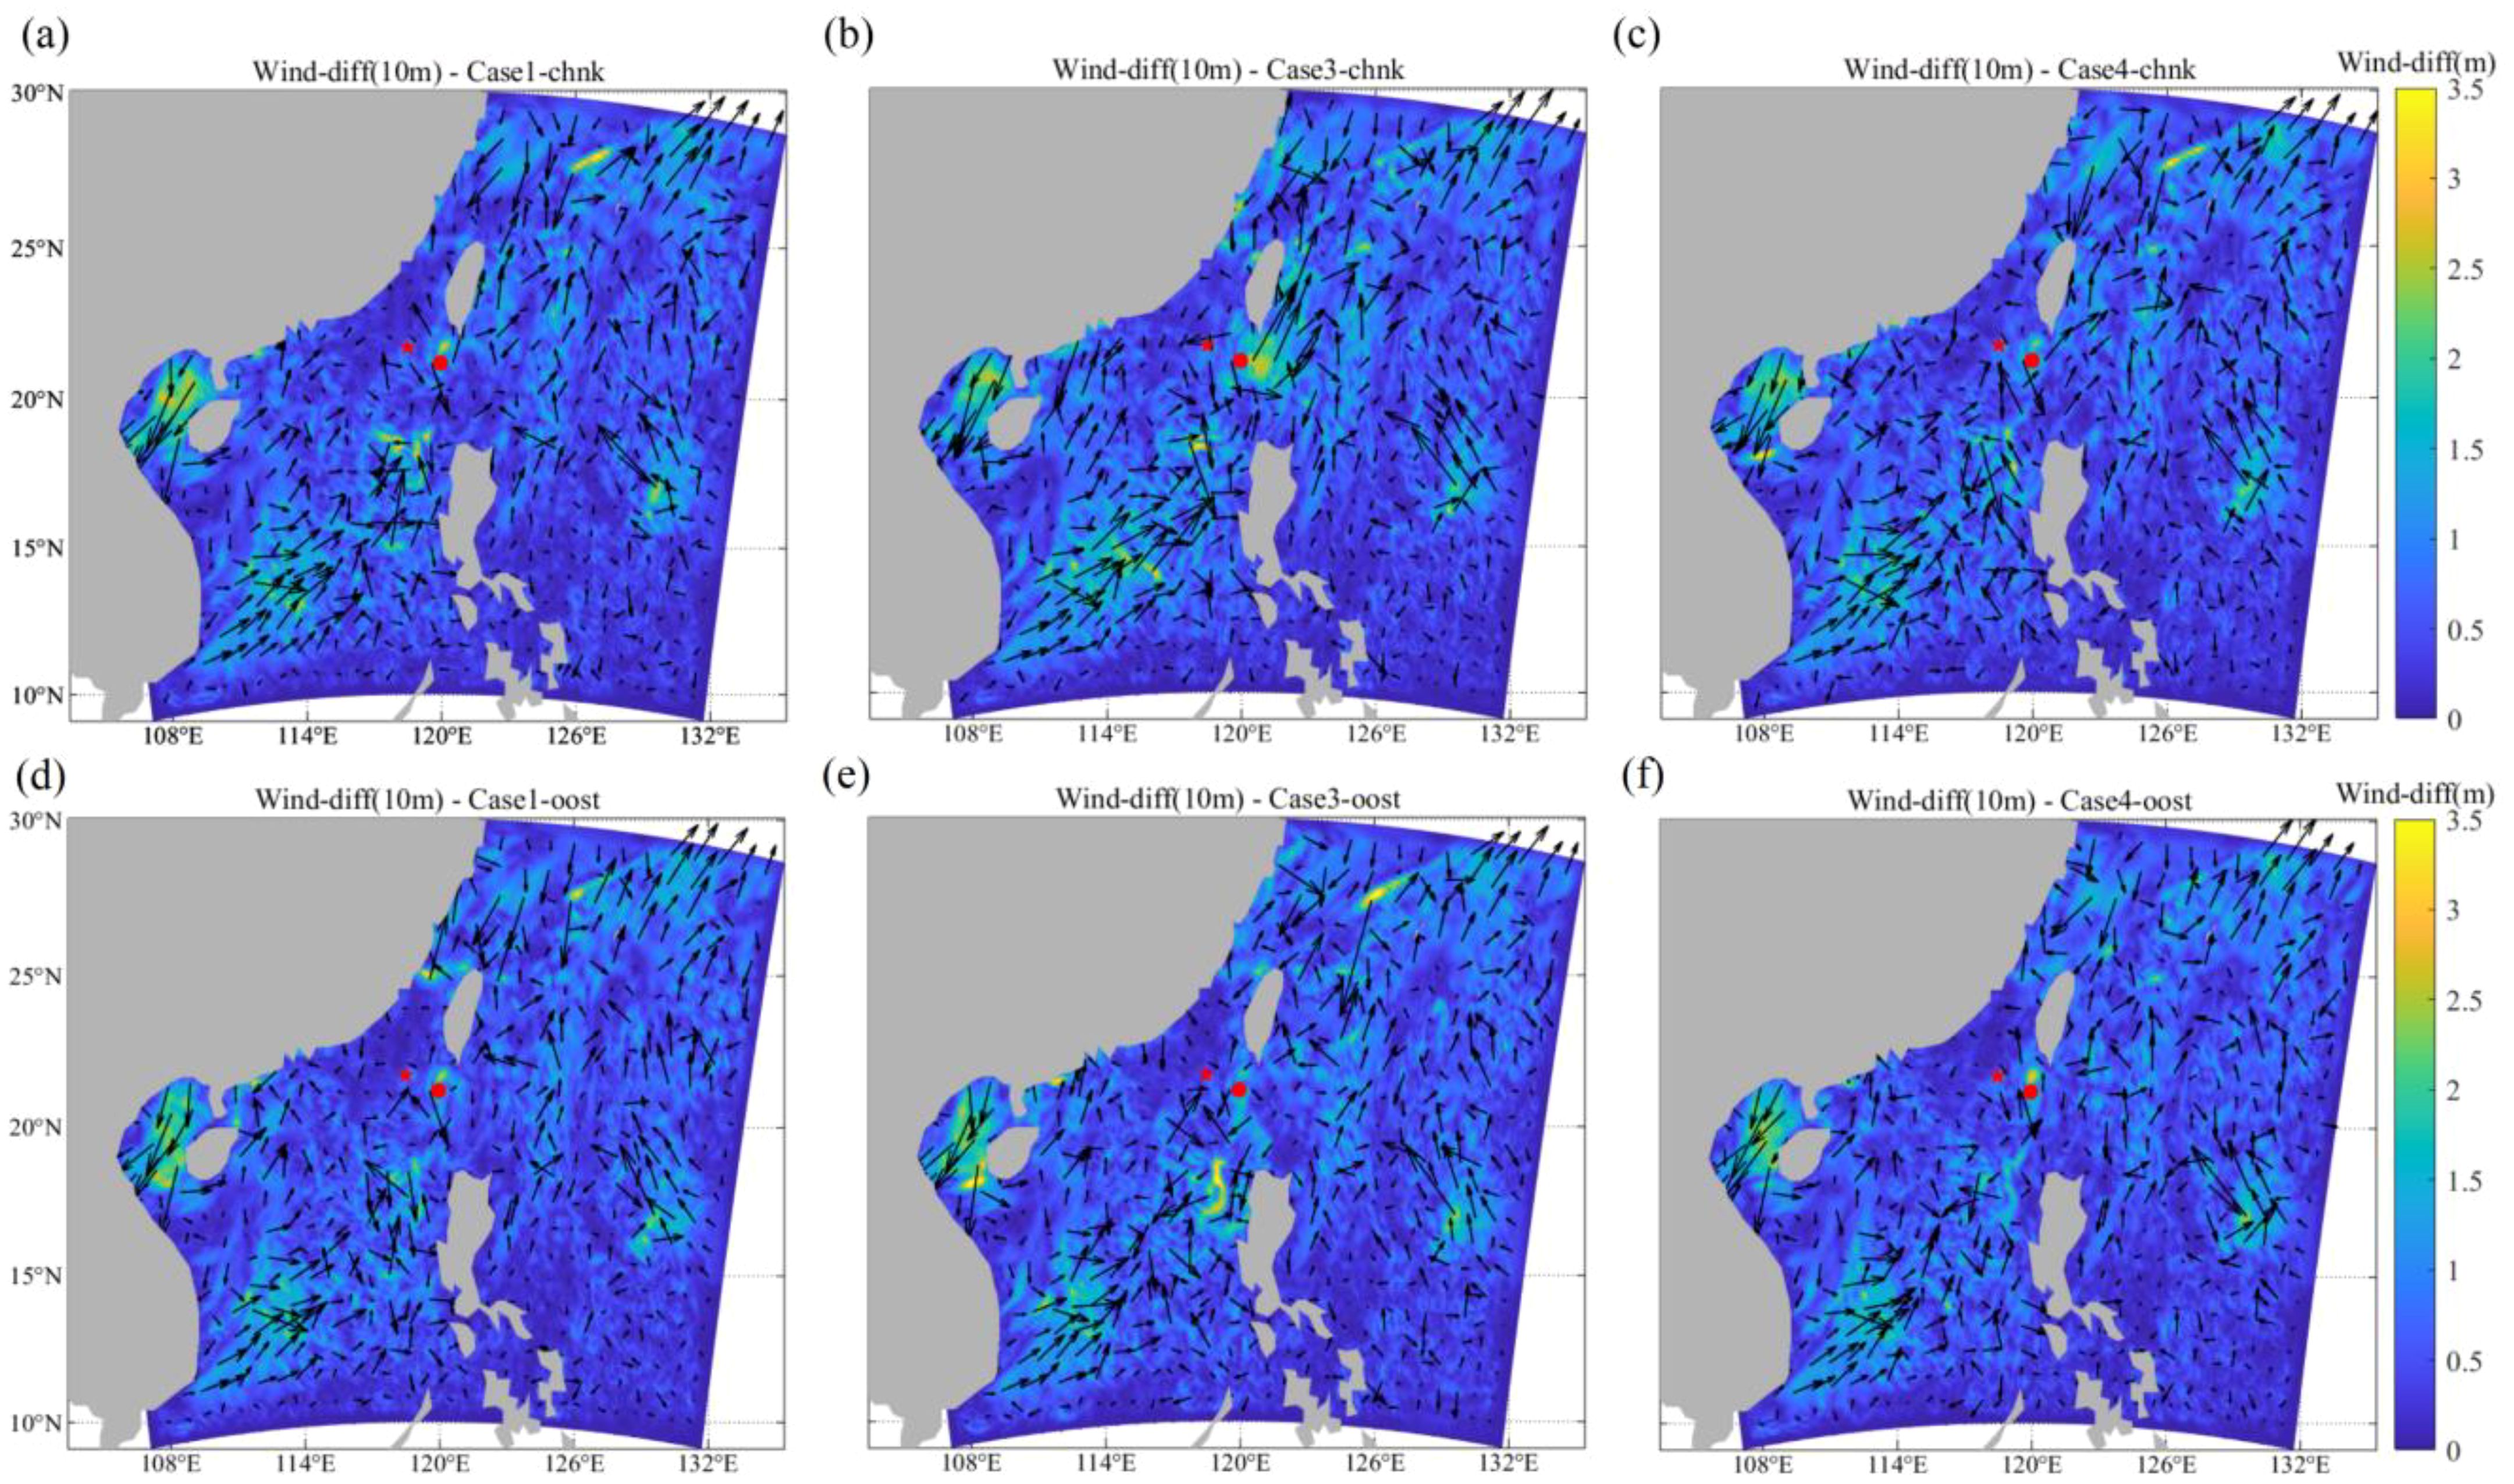
Figure 8. (A–F) Differences in the spatial results of wind speed and direction at 03:00 on June 4, simulated by different coupling schemes and wave coupling effects parameterizations, compared to the results of Case 2 (no wave coupling). The three columns represent different coupling schemes; and upper panels: CHNK parameterization, lower panels: OOST parameterization. The star and the dot represent the S3 point position and the tropical storm center position at that moment, respectively.
In contrast to the wind fields, differences in ocean currents across the cases were more pronounced and approached the TC center. The largest differences were observed in Case 3, particularly to the southeast of the tropical storm center (Figures 9B, E). However, Case 1 showed a similar difference to Case 4, suggesting that while waves significantly modulate ocean currents under storm conditions, this effect is not dominant in the fully coupled cases. This observation is further supported by the distinct temperature patterns shown in Figure 7, which indicate that wave coupling influences ocean currents but does not overwhelm other coupled processes. Moreover, the distribution of differences exhibited no consistent pattern in the modulation introduced by the CHNK parameterization across all coupling schemes (Figures 9A–C). In contrast, the OOST parameterization clearly captured the influence of strong wind-generated currents on the right side of the storm-affected areas, with varying magnitudes observed across the different schemes (Figures 9D–F). This highlighted the improved capability of the OOST parameterization to capture the dynamics of wind-driven currents, particularly in the high-wind quadrant of the TC. It also implied that wave-current interactions remained essential in modulating upper ocean circulation, event during weaker TCs.
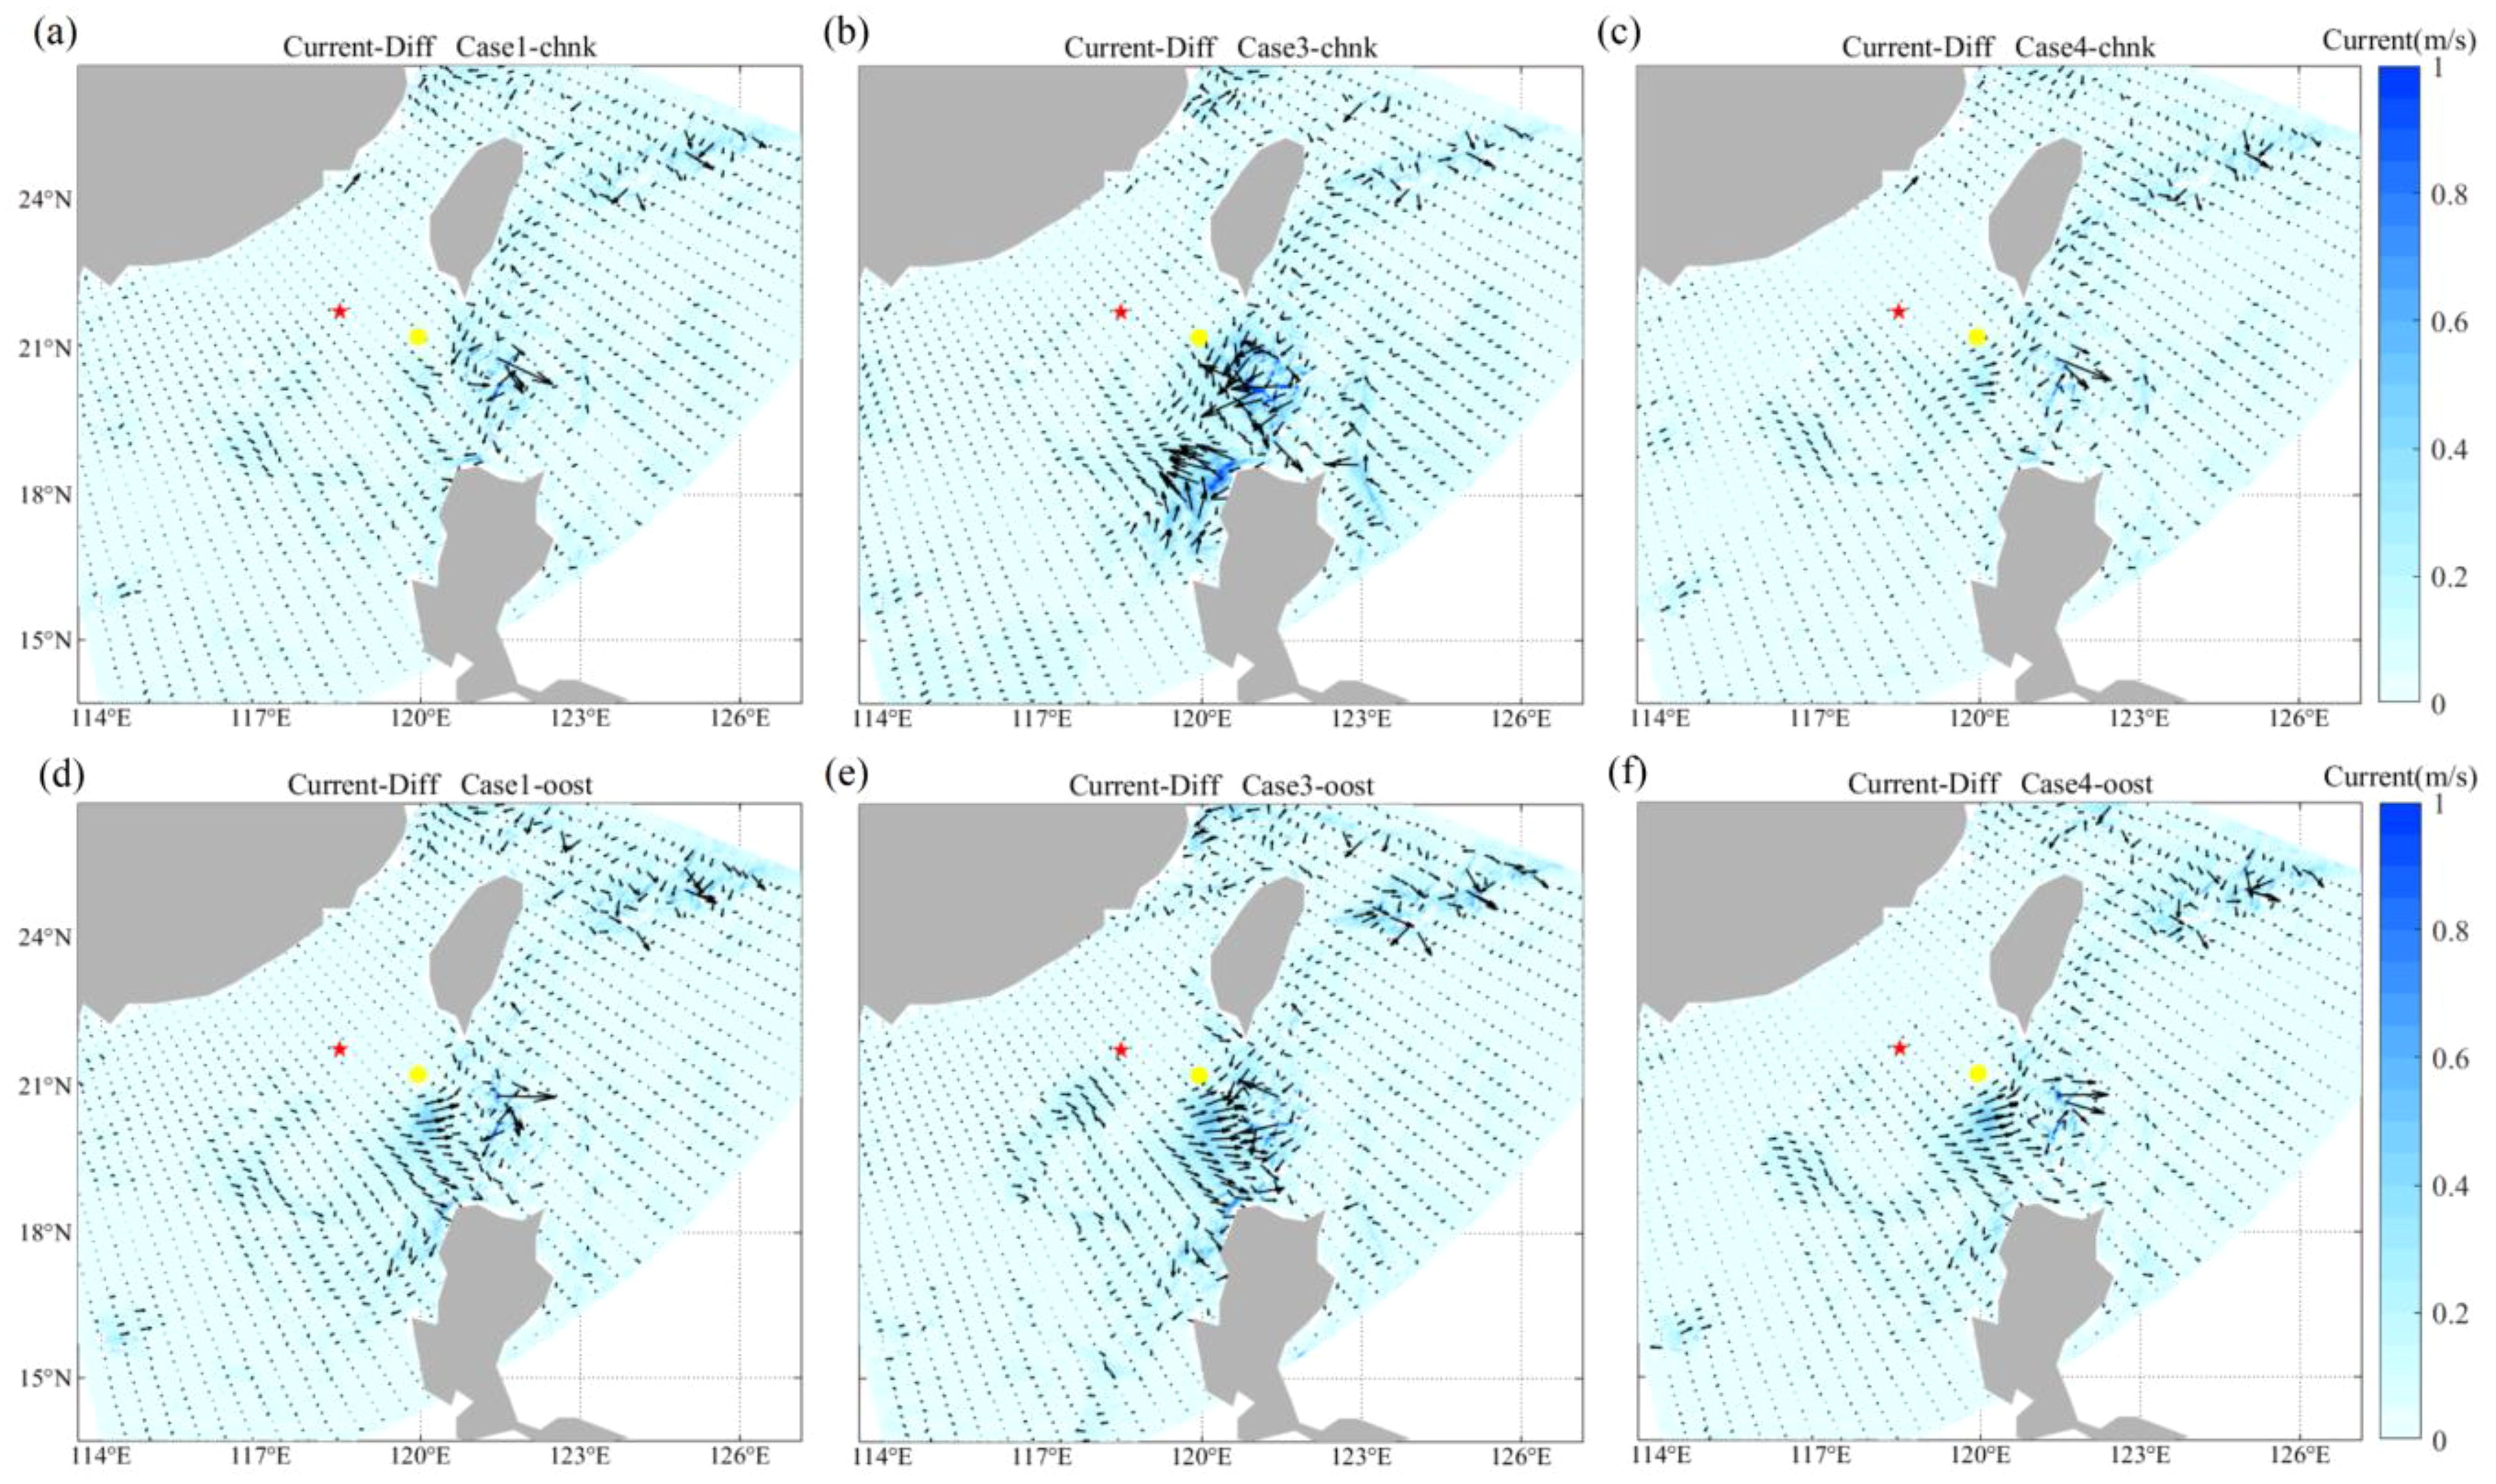
Figure 9. (A–F) Differences in the spatial results of currents at 03:00 on June 4, simulated by different coupling schemes and wave coupling effects parameterizations, compared to the results of Case 2 (without wave coupling). The three columns represent different coupling schemes; and upper panels: CHNK parameterization, lower panels: OOST parameterization. The star and the dot represent the S3 point position and the storm center position at that moment, respectively.
3.4.2 Modification of significant wave heights
Figure 10 illustrates that the model with only wave-atmosphere coupling (Case 4) failed to simulate the high wave heights generated by the tropical storm. In this case, wave heights near the tropical storm center showed minor differences. However, variations exceeding 3 m were recorded to the right of the tropical storm’s track in both Case 1 and Case 3. These two cases exhibited consistent spatial features, indicating the strong modulation of wave-current coupling on high wave heights. The CHNK parameterization under wave-current coupling provided the largest estimate of significant wave height (Figures 10A, B), while the OOST parameterization produced more moderate values (Figures 10D, E). Additionally, when atmosphere-wave coupling was disregarded, the wave heights under the CHNK cases were larger (Figure 10B), but no such difference was observed in the OOST cases. This finding was similar to the effects on currents shown in Figure 9. Notably, the modulation of wave-current coupling on significant wave height was the dominant factor in the simulation of mild storm-induced waves in the fully coupled models. Furthermore, Figures 5 and 7 demonstrated that the OOST parameterization enhanced the vertical mixing of seawater during the tropical storm. This contrasts with its simulation of relatively moderate significant wave heights compared to CHNK. This discrepancy suggests that the OOST parameterization offers a more rigorous and reliable representation of the coupled system, balancing vertical mixing and wave height simulations more effectively than CHNK.
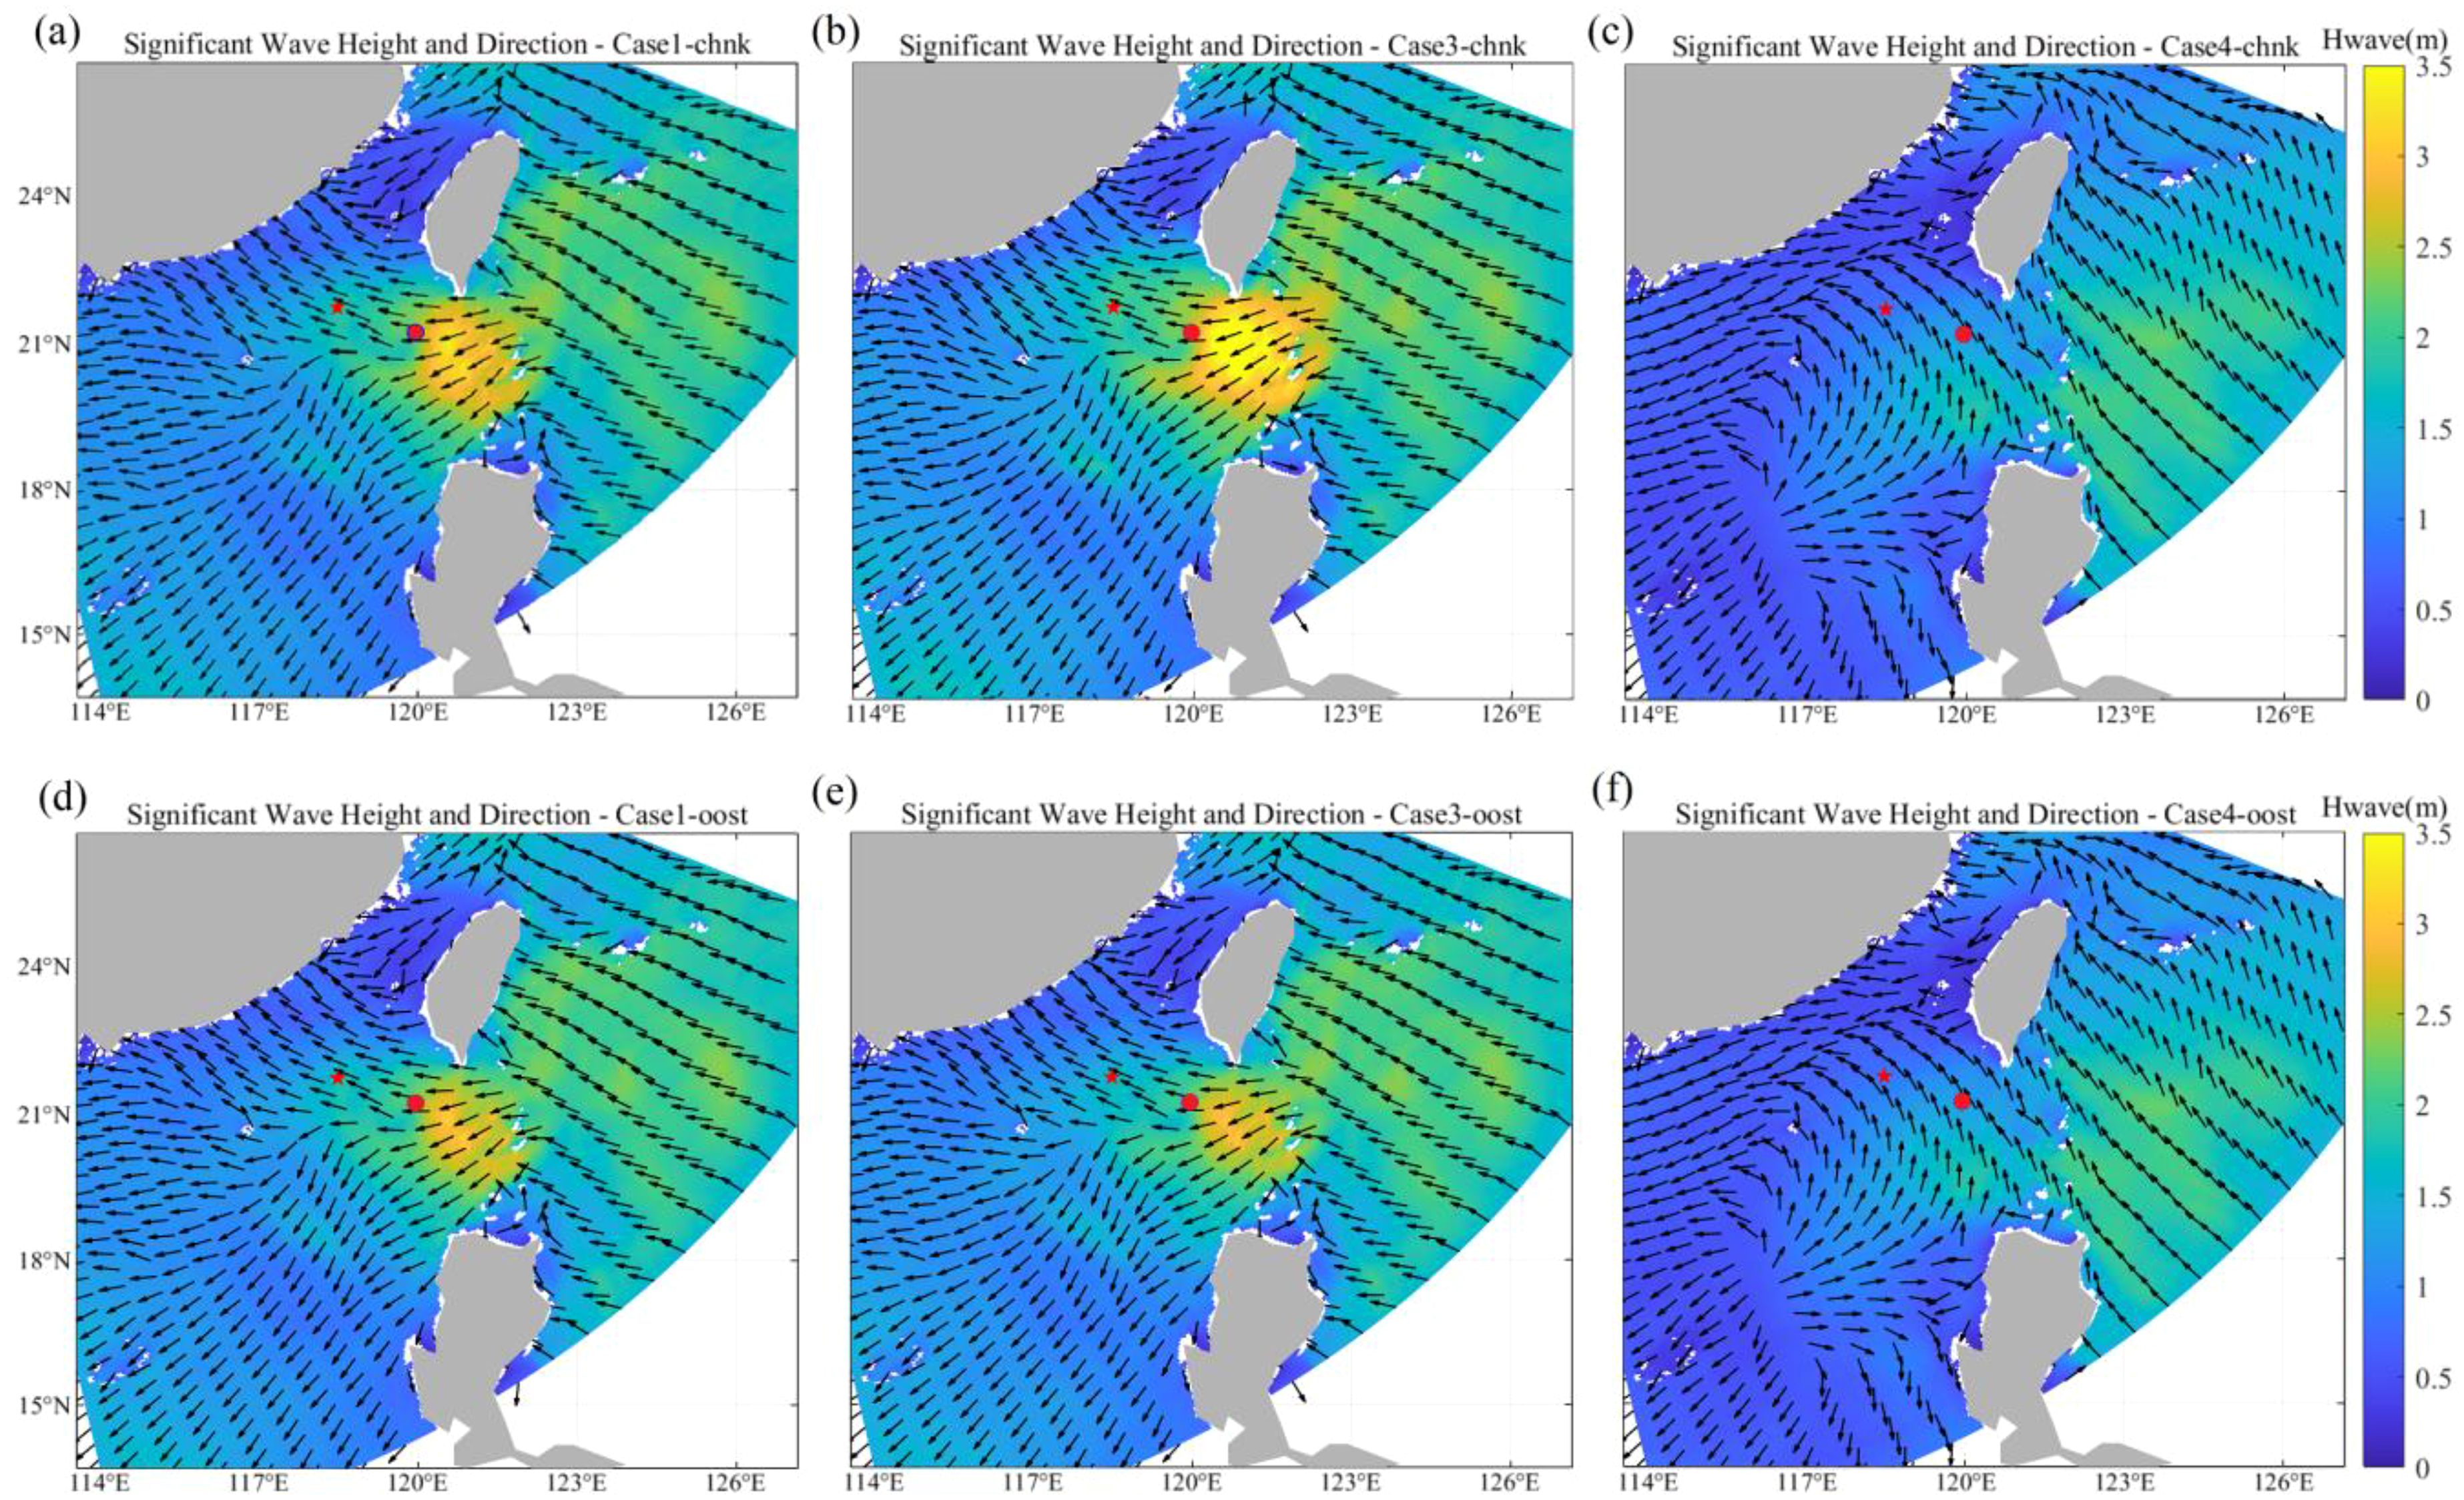
Figure 10. (A–F) The spatial results of significant wave heights and wave directions at 03:00 on June 4, simulated by different coupling schemes and wave coupling effects parameterizations. The three columns represent different coupling schemes; and upper panels: CHNK parameterization, lower panels: OOST parameterization. The star and the dot represent the S3 point position and the storm center position at that moment, respectively.
3.4.3 Changes in SST
The distributions of SST and sea surface height without wave coupling (Case 2) are shown in Figures 11A, B. A clear TC induced cold wake was observed on the right front of the tropical storm’s track, where the intensity was highest. However, due to the delayed response of SST changes to tropical storm impacts, no obvious SST decrease occurred near the current tropical storm center (Figure 11A). For the SST differences (Figure 12), the fully coupled model (Case 1, Figures 12A, D) exhibited results similar to those of the wave-atmosphere coupling model (Case 4, Figures 12C, F), but with smaller magnitude, highlighting the influence of wave effects and wave-current coupling on SST simulations. In Case 3, using the CHNK parameterization (Figure 12B), a “warmer” cold wake was observed compared to Case 1, suggesting that wave effects on the atmosphere enhance vertical mixing. On the other hand, the OOST parameterization (Figures 12D–F) showed more pronounced tropical storm cold wakes and uniform spatial patterns, with much lower SST values (compared to Case 2) on the right of the tropical storm’s track. This indicated that the OOST parameterization better characterized SST changes during tropical storms. The differences in wave fields driven by variations in energy fluxes between winds and waves, resulting from the two parameterization schemes, contributed to the disparities in SST between the schemes.
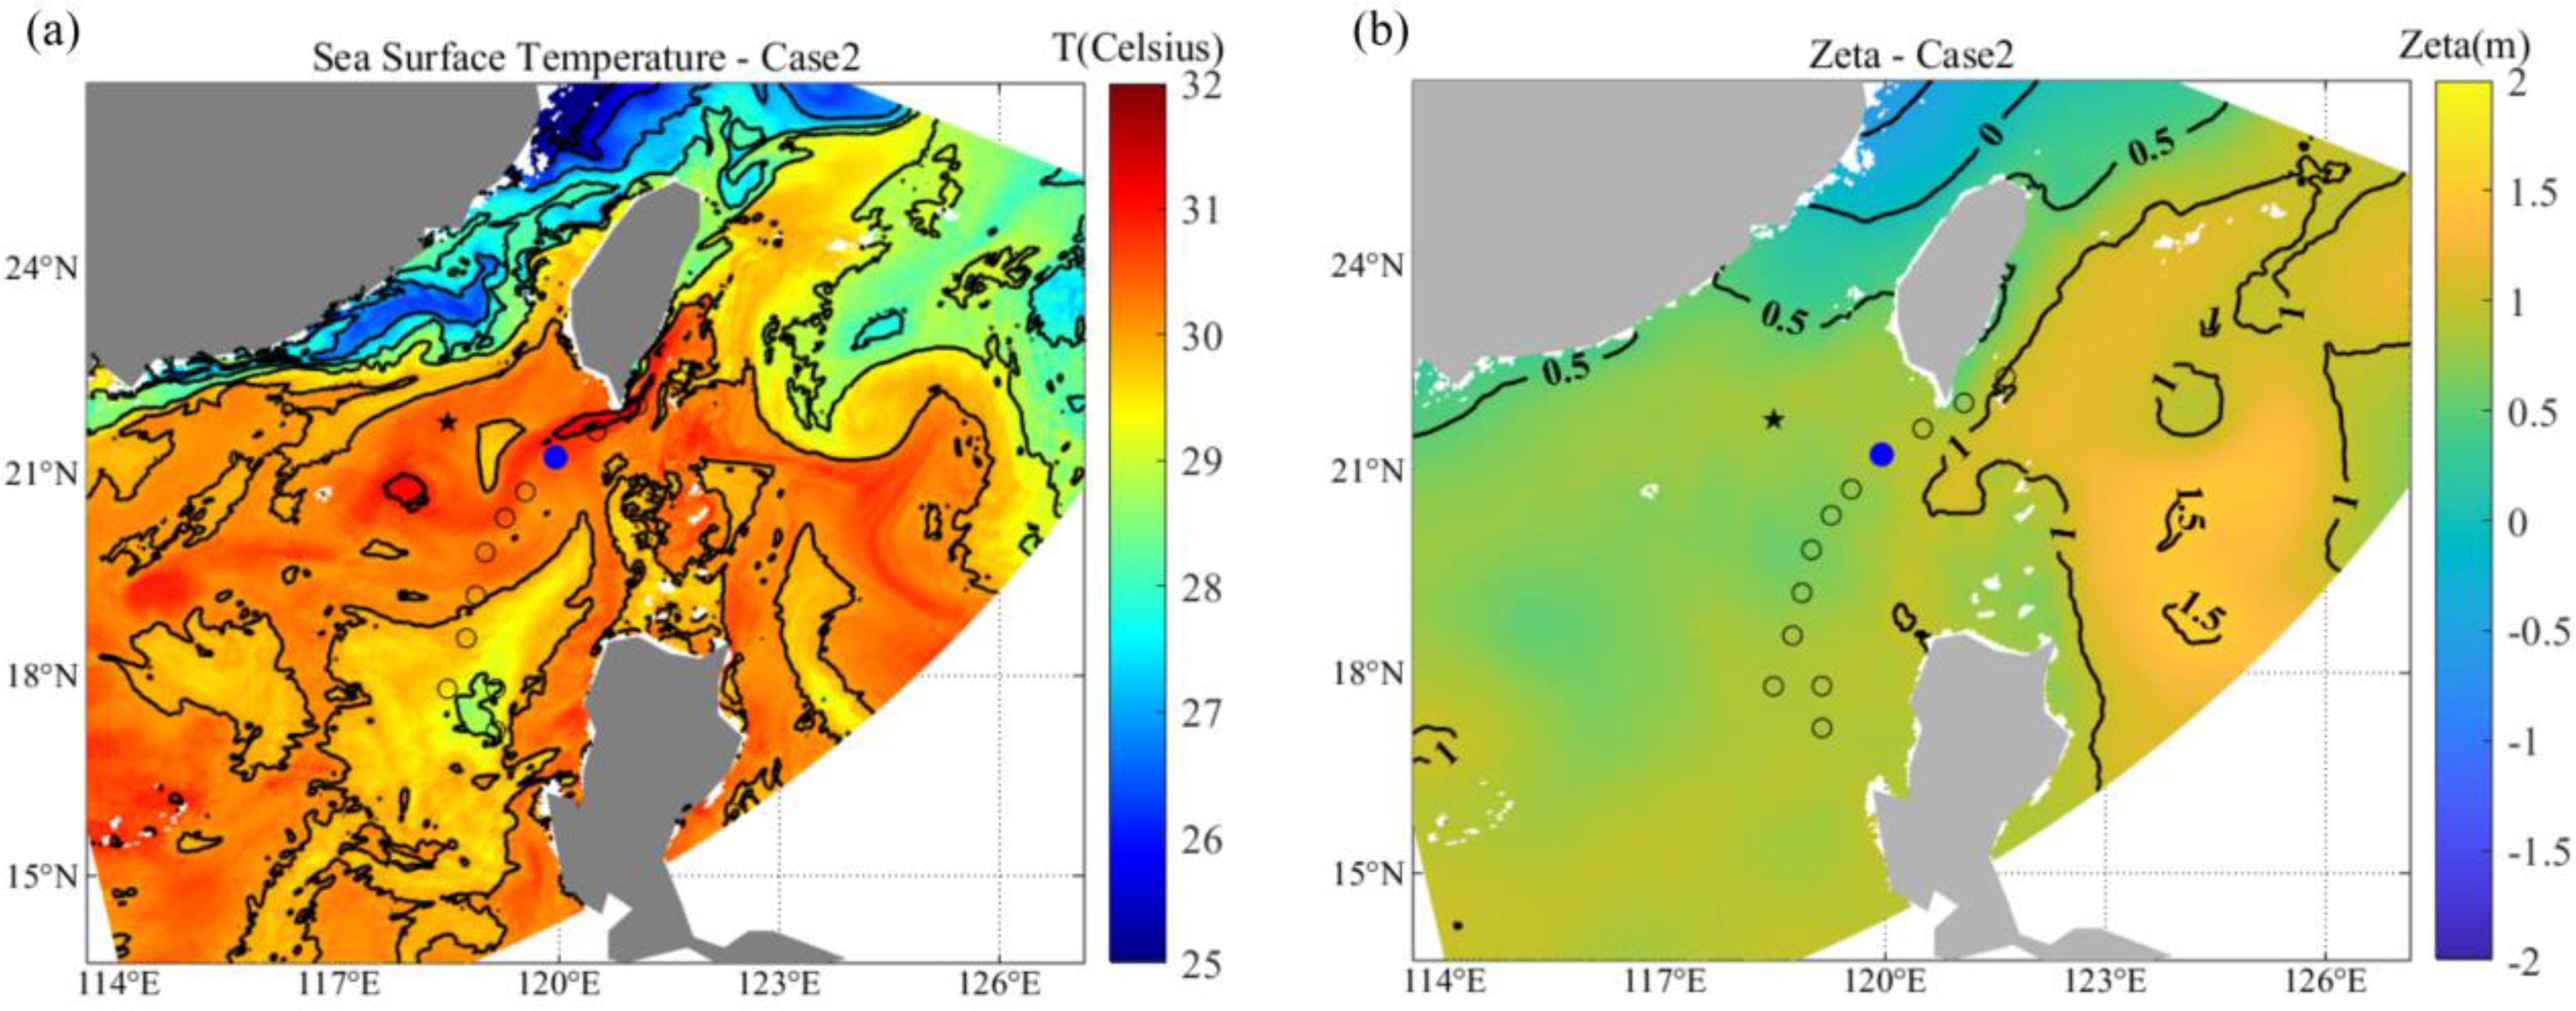
Figure 11. (A, B) The spatial distribution of SST and sea surface height (zeta) results from the no wave coupling model (Case 2) at 03:00 on June 4.
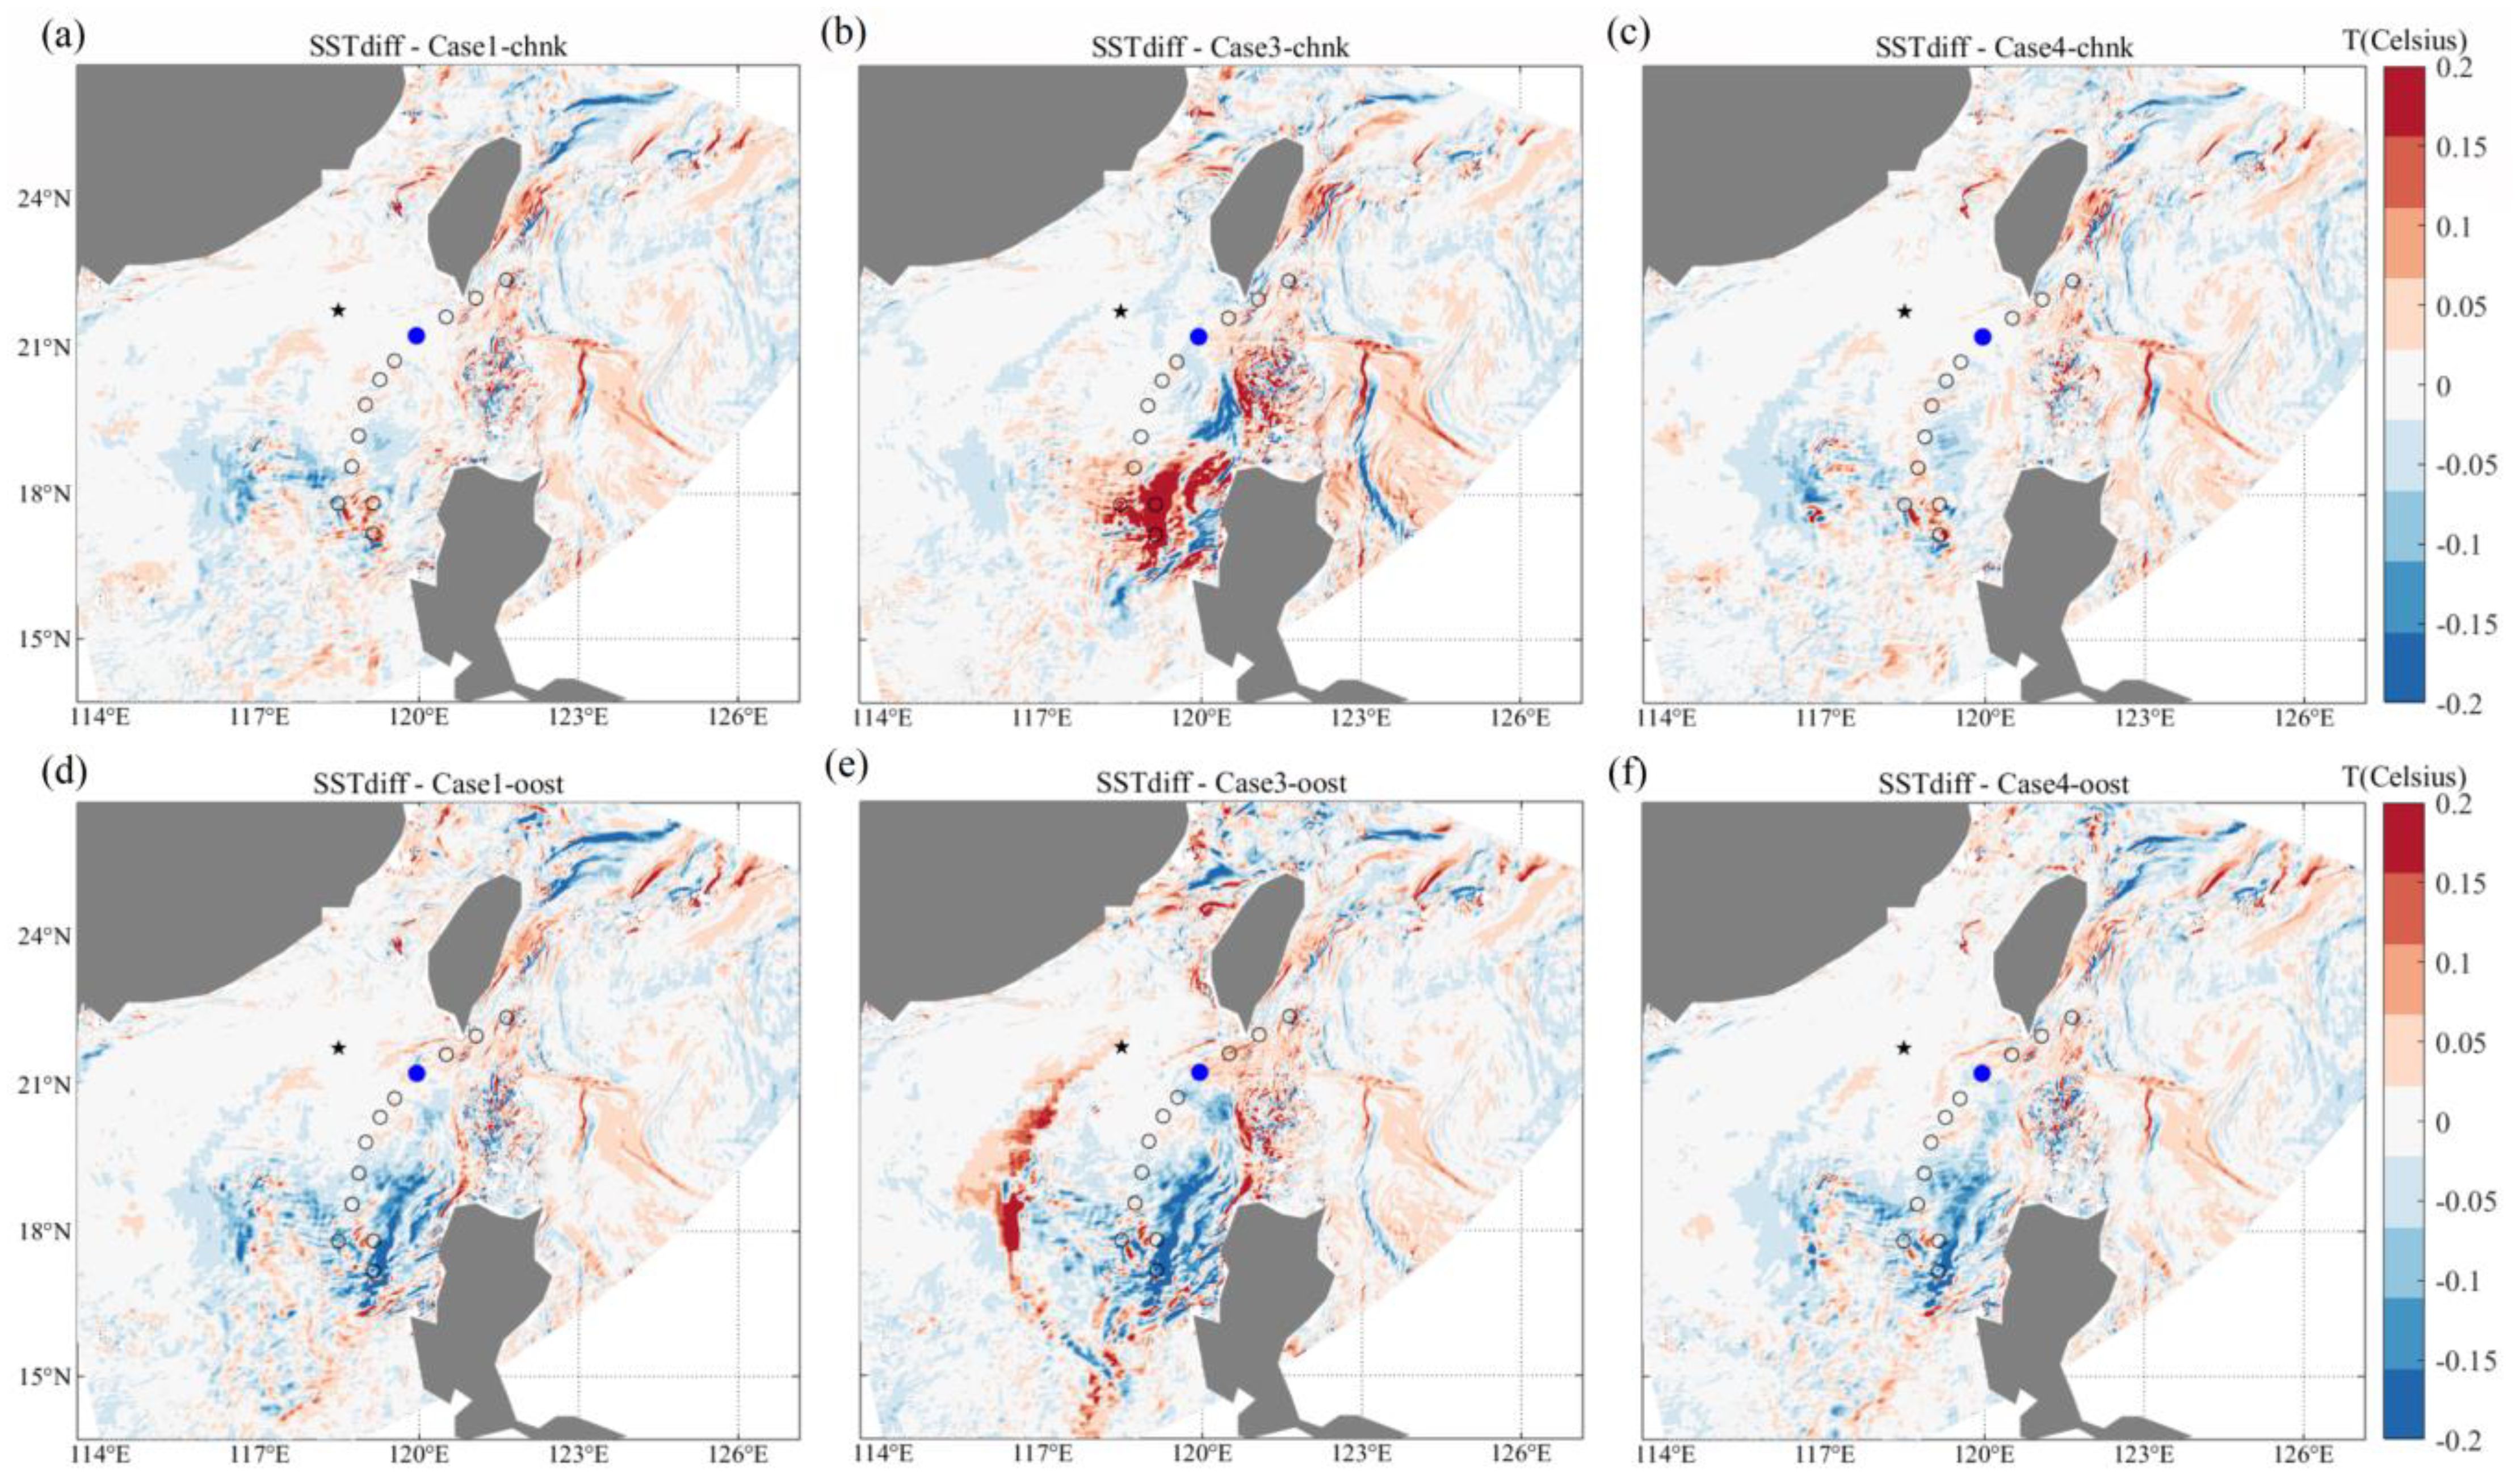
Figure 12. (A–F) Differences in the spatial results of SST at 03:00 on June 4, simulated by different coupling schemes and wave coupling effects parameterizations, compared to the results of Case 2 (no wave coupling). The three columns represent different coupling schemes; and upper panels: CHNK parameterization, lower panels: OOST parameterization. The star and the dot represent the S3 point position and the storm center position at that moment, respectively.
3.4.4 Sea surface elevation
Unlike the delayed response of SST, changes in sea surface height (ζ) reacted more quickly to tropical storm impacts, as shown in Figure 13. The wave-current coupling schemes (Case 1 and Case 3) exhibited similar spatial patterns, with smaller ζ values observed along the front-right path of the tropical storm (Figures 13A, B, D, E). In these areas, ζ values in Case 4 exceeded those in Case 2 by more than 3%, emphasizing the critical role of wave-current coupling in modulating water levels. Additionally, the OOST parameterization showed minimal differences in ζ compared to the CHNK scheme in Case 1 and Case 4 but had a stronger effect on ζ in the storm-affected regions in Case 2. However, the variations in ζ with the CHNK parameterization in Case 3 (Figure 13B) were opposite to the spatial features observed in the wave-current coupling experiments (Figures 13A, D, E), particularly near the Philippines and south of the tropical storm’s track. Overall, wave-current coupling reduced water levels in open ocean areas, and the OOST parameterization proved more effective in modeling water levels under different scenarios.
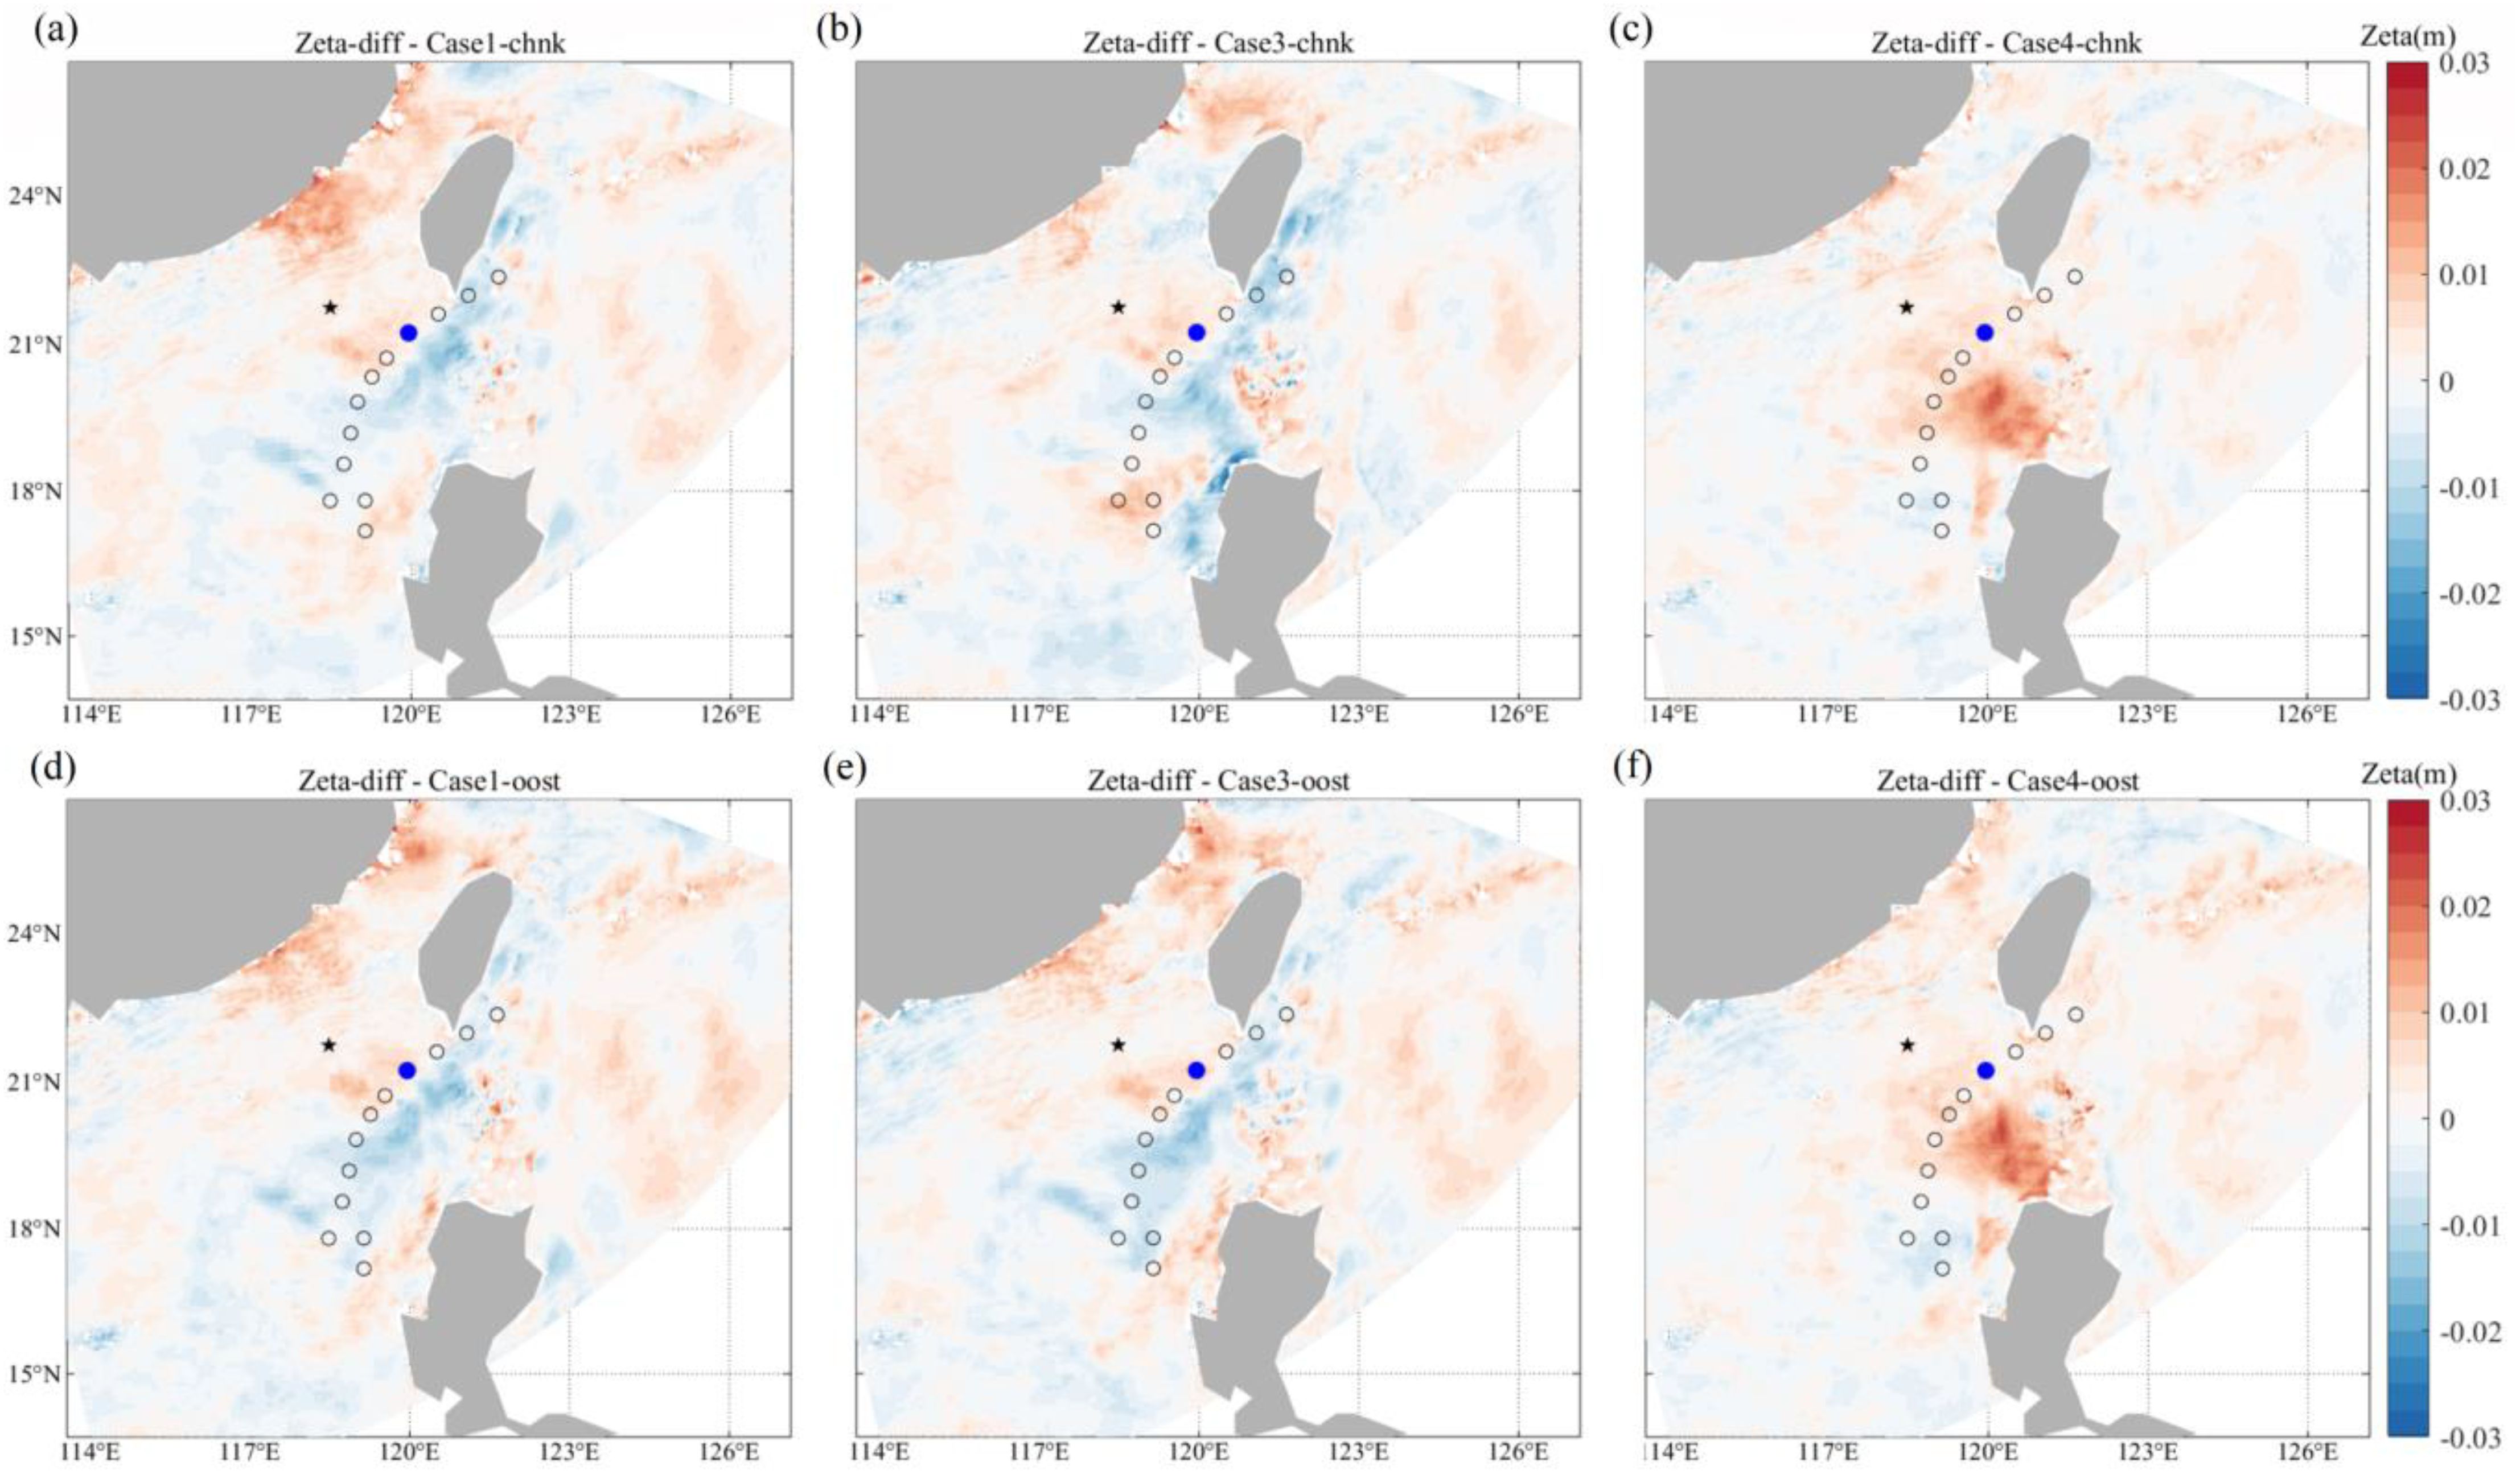
Figure 13. (A–F) Differences in the spatial results of sea surface height (zeta) at 03:00 on June 4, simulated by different coupling schemes and wave coupling effects parameterizations, compared to the results of Case 2 (no wave coupling). The three columns represent different coupling schemes; and upper panels: CHNK parameterization, lower panels: OOST parameterization. The star and the dot represent the S3 point position and the storm center position at that moment, respectively.
4 Discussion
This study designed four different coupling schemes to explore the impact of wave coupling effects on the COAWST model results under mild storm conditions. Differences compared to the results of Case 2 (no wave coupling) in the time-varying results of normalized vertical sea temperature at S3 and the storm center both indicate that, as the storm intensifies, vertical mixing increases, making the impact of coupling waves on the simulation results more pronounced. The advantages of the OOST parameterization become even more significant and the use of the OOST parameterization to account for wave effects in the atmosphere-wave process enhances the simulation of storm processes by the coupled model. The findings underscore the critical role of wave coupling in improving ocean-atmosphere models for tropical cyclone predictions. Such advancements are crucial for operational weather forecasting, disaster preparedness, and climate modeling, where precise predictions of tropical cyclone behavior and its oceanic effects can mitigate risks to coastal communities and marine ecosystems. Moreover, the study underscores the need for integrated coupled modeling systems, paving the way for further research on the feedback mechanisms between atmospheric and oceanic processes. The insights gained can inform better resource allocation during storm events and contribute to the development of resilient infrastructure in vulnerable coastal regions.
The results of wind speed fields suggests that hat wave coupling effects do not significantly impact the wind field results in the storm-affected area. The differences between the OOST and CHNK parameterizations are also minor. The fully coupled case does not follow the same pattern as the wave-current coupling case. This indicates that while waves have a significant modulating effect on ocean currents under storm conditions, this modulation is not dominant in the fully coupled cases. However, the influence of wave coupling on ocean currents is more pronounced, especially in cases with only wave-current coupling. This effect diminishes under full coupling, indicating that wave-atmosphere coupling plays a crucial role in modulating wave-current interactions. Differences in significant wave height between experiments further confirm the importance of wave-current interactions for wave simulation. For the typical mixing processes under storm conditions, characterized by the distribution and variation of sea temperature, both time series results at fixed points and spatial distribution results at any given time indicate that wave coupling effects improve the capacity of model simulations. Due to the mutual modulation and constraint of wave-current and wave-atmosphere coupling processes, the results from full coupling are more robust and reliable.
The configuration with only wave-atmosphere coupling is not able to simulate the high wave heights under the influence of the storm. Instead, the results from wave-current coupling alone are more consistent with those from the fully coupled model. The CHNK parameterization under wave-current coupling provides the largest estimate of significant wave height, while the results from the OOST parameterizations are more moderate. However, the modulation of significant wave height by wave-current coupling dominates the simulation of mild storm waves in the fully coupled model. This indicates that the vertical exchange of energy and heat in the OOST parameterization is more realistic. Higher wave heights would naturally lead to stronger vertical mixing, but this is not the truth with the CHNK parameterization.
For the two different wave coupling parameterization schemes, CHNK and OOST, the latter (OOST.) demonstrates greater consistency in representing wave-current interactions across various coupling configurations. The results of SST indicate that, the OOST parameterization scheme depicts a more pronounced storm cold wake, with a significant decrease in SST in the storm-affected area. In the only wave-current coupling experiment, this enhancement of the storm cold wake is even more notable. Due to the delayed response of SST changes to storm impacts. In terms of vertical sea temperature changes, the vertical mixing under the OOST parameterization is stronger, resulting in a more pronounced and realistic storm-induced cold wake. Theoretically, the high wind speeds during a tropical storm generate strong waves, which in turn enhance vertical mixing. This leads to a decrease in SST, an increase in subsurface temperature, and a downward transfer of energy, causing the significant wave height to decrease accordingly. The observed lower significant wave height and stronger vertical mixing with the OOST parameterizations align perfectly with this theoretical framework, whereas CHNK results diverge from this behavior. This seems to suggest that OOST parameterization is a more reasonable choice.
5 Summary
This study examines the impact of wave coupling on oceanic and atmospheric responses to Tropical storm Choi-wan, with a particular focus on the effects of different wave coupling schemes on the simulation of tropical cyclone characteristics. The research utilizes a coupled ocean-atmosphere model to assess the influence of wave coupling on wind fields, ocean currents, wave heights, and SST. Model validation was carried out using observational data from the China Meteorological Administration, ECMWF datasets, and in-situ measurements from the Philippines.
The results demonstrate that the inclusion of wave coupling significantly enhances the accuracy of simulated oceanic thermal responses. Specifically, the study found that incorporating wave coupling improved the simulation of SST cooling, with the fully coupled OOST parameterization scheme outperforming the CHNK scheme. The OOST scheme captured vertical sea temperature changes and ocean mixing more effectively, leading to more accurate storm-induced cooling in the model. In contrast, the CHNK scheme exhibited greater discrepancies in ocean thermal profiles and underrepresented the impact of the cyclone on ocean currents.
Additionally, wave-current coupling was shown to affect the distribution of significant wave heights, particularly in regions impacted by the tropical storm, with notable differences between coupled and uncoupled simulations. The inclusion of wave-current interactions in the coupled models led to improved simulations of ocean currents, with a more realistic representation of storm-induced current intensifications and directions. These improvements were particularly evident in the storm-affected regions where wave-current coupling played a crucial role in the distribution of energy.
The study concludes that wave coupling, particularly the OOST scheme, significantly enhances the accuracy of ocean and atmospheric simulations during tropical cyclones. The findings underline the importance of advanced coupled models in capturing the complex interactions between waves, ocean currents, and atmospheric dynamics, which are critical for improved prediction of extreme weather events like Tropical Storm Choi-wan.
Data availability statement
The original contributions presented in the study are included in the article/supplementary material. Further inquiries can be directed to the corresponding author.
Author contributions
HX: Conceptualization, Data curation, Formal Analysis, Investigation, Methodology, Software, Supervision, Validation, Visualization, Writing – original draft, Writing – review & editing. ST: Conceptualization, Supervision, Validation, Writing – review & editing. JC: Data curation, Visualization, Writing – review & editing. SD: Investigation, Validation, Writing – review & editing. WG: Funding acquisition, Project administration, Resources, Supervision, Writing – review & editing.
Funding
The author(s) declare financial support was received for the research, authorship, and/or publication of this article. This work was jointly supported by Innovation Zone Program (22-05-CXZX-04-04-25) and Mount Taishan Scholar Young Expert Project.
Acknowledgments
The authors would like to acknowledge the use of the COAWST model. We thank the European Centre for Medium-Range Weather Forecasts for providing the meteorological reanalysis dataset. We also extend our gratitude to the Copernicus Marine Service for the satellite products and to the China Meteorological Administration for the best-track dataset. We would like to acknowledge the NASA Shuttle Radar Topography Mission for offering the high-resolution topography dataset.
Conflict of interest
The authors declare that the research was conducted in the absence of any commercial or financial relationships that could be construed as a potential conflict of interest.
Generative AI statement
The author(s) declare that no Generative AI was used in the creation of this manuscript.
Publisher’s note
All claims expressed in this article are solely those of the authors and do not necessarily represent those of their affiliated organizations, or those of the publisher, the editors and the reviewers. Any product that may be evaluated in this article, or claim that may be made by its manufacturer, is not guaranteed or endorsed by the publisher.
References
Babanin A. V., Haus B. K. (2009). On the existence of water turbulence induced by nonbreaking surface waves. J. Phys. Oceanogr. 39, 2675–2679. doi: 10.1175/2009JPO4202.1
Carniel S., Benetazzo A., Bonaldo D., Falcieri F. M., Miglietta M. M., Ricchi A., et al. (2016). Scratching beneath the surface while coupling atmosphere, ocean and waves: analysis of a dense water formation event. Ocean Model. 101, 101–112. doi: 10.1016/j.ocemod.2016.03.007
Charnock H. (1955). Wind stress on a water surface. Quarterly Journal of the Royal Meteorological Society. 81(350). doi: 10.1002/qj.49708135027
Craik A., Leibovich S. (1976). A rational model for langmuir circulations. J. Fluid Mechan. 73, 401–426. doi: 10.1017/S0022112076001420
Drennan W. M., Graber H. C., Hauser D., Quentin C. (2003). On the wave age dependence of wind stress over pure wind seas. J. Geophys. Res. Atmos. 108, 1–13. doi: 10.1029/2000JC000715
Dudhia J. (1989). Numerical study of convection observed during the winter monsoon experiment using a mesoscale two-dimensional model. J. Atmos. Sci. 46, 3077–3107. doi: 10.1175/1520-0469(1989)046<3077:NSOCOD>2.0.CO;2
Hersbach H., Bell B., Berrisford P., Hirahara S., Horányi A., Muñoz-Sabater J., et al. (2020). The ERA5 global reanalysis. Q. J. R. Meteorol. Soc. 146, 1999–2049. doi: 10.1002/qj.3803
Hlywiak J., Nolan D. S. (2022). Targeted artificial ocean cooling to weaken tropical cyclones would be futile. Commun. Earth Environ. doi: 10.1038/s43247-022-00519-1
Hong S.-Y., Noh Y., Dudhia J. (2006). A new vertical diffusion package with an explicit treatment of entrainment processes. Month. Weather Rev. 134, 2318–2341. doi: 10.1175/MWR3199.1
Kain J. S. (2004). The kain–fritsch convective parameterization: an update. J. Appl. Meteorol. 43, 170–181. doi: 10.1175/1520-0450(2004)043<0170:TKCPAU>2.0.CO;2
Kim D., Jin C. S., Ho C. H., Kim J., Kim J. H. (2015). Climatological features of wrf-simulated tropical cyclones over the western north pacific. Climate Dynam. 44, 3223–3235. doi: 10.1007/s00382-014-2410-3
Kiran P. V., Balaji C. (2022). The future projection of cyclones in Bay of Bengal: a study using coupled ocean atmosphere model. Ocean dynam. 72, 641–660. doi: 10.1007/s10236-022-01522-y
Komen G. J., Hasselmann S., Hasselmann K. (1984). On the existence of a fully developed wind-sea spectrum. J. Phys. Oceanogr. 14, 1271–1285. doi: 10.1175/1520-0485(1984)014<1271:OTEOAF>2.0.CO;2
Kumar R. P., Vimlesh Pant. (2017). Upper oceanic response to tropical cyclone Phailin in the Bay of Bengal using a coupled atmosphere-ocean model. Ocean Dynamics. doi: 10.1007/s10236-016-1020-5
Li X., Lu R., Chen G., Chen R. (2024). Western north pacific tropical cyclones suppress maritime continent rainfall. NPJ Climate Atmos. Sci. 7, 1–8. doi: 10.1038/s41612-024-00810-2
Li Z., Tam C., Li Y., Lau N., Chen J., Chan S., et al. (2022). How does air-sea wave interaction affect tropical cyclone intensity? An atmosphere-wave-ocean coupled model study based on super typhoon Mangkhut (2018). Environmental Science, Physics. doi: 10.1002/essoar.10508846.1
Lin Q., Shi L., Liang B., Wu G., Wang Z., Zhang X., et al. (2024). Characterizing interactive compound flood drivers in the Pearl River Estuary: A case study of Typhoon Hato, (2017). J. Hydrol. 2024, 132270. doi: 10.1016/j.jhydrol.2024.132270
Liu B., Guan C., Xie L., Zhao D. (2012). An investigation of the effects of wave state and sea spray on an idealized typhoon using an air–sea coupled modeling system. Adv. Atmos. Sci. 29, 391–406. doi: 10.1007/s00376-011-1059-7
Liu B., Liu H., Xie L., Guan C., Zhao D. (2011). A coupled atmosphere-wave-ocean modeling system: simulation of the intensity of an idealized tropical cyclone. Month. Weather Rev. 139, 132–152. doi: 10.1175/2010MWR3396
Madsen S., Poon Y. K., Graber H. C. (1988). Spectral wave attenuation by bottom friction: theory. Coast. Eng. Proc. 34, 492–504. doi: 10.9753/icce.v21.34
Magee A., Kiem A., Chan J. (2021). Author correction: a new approach for location-specific seasonal outlooks of typhoon and super typhoon frequency across the western north pacific region. Sci. Rep. 11. doi: 10.1038/s41598-021-01074-z
McWilliams J. C., Restrepo J. M. (1999). The wave-driven ocean circulation. J. Phys. Oceanogr. 29, 2523–2540. doi: 10.1175/1520-0485(1999)0292.0.CO;2
McWilliams J. C., Sullivan P. P., Moeng C. H. (2000). Langmuir turbulence in the ocean. J. Fluid Mechan. 334, 1–30. doi: 10.1017/S0022112096004375
Mlawer E. J., Taubman S. J., Brown P. D., Iacono M. J., Clough S. A. (1997). Radiative transfer for inhomogeneous atmospheres: RRTM, a validated correlated-k model for the longwave. J. Geophys. Res.: Atmos. 102, 16663–16682. doi: 10.1029/97JD00237
Mueller J. A., Veron F. (2010). Bulk formulation of the heat and water vapor fluxes at the air-sea interface, including nonmolecular contributions. J. Atmos. Sci. 67, 234–224. doi: 10.1175/2009JAS3061.1
Olabarrieta M., Warner J. C., Armstrong B., Zambon J. B., He R. (2012). Ocean–atmosphere dynamics during hurricane Ida and Nor’Ida: an application of the coupled ocean–atmosphere–wave–sediment transport (coawst) modeling system. Ocean Model. 2012, 112–137. doi: 10.1016/j.ocemod.2011.12.008
Oost W. A., Komen G. J., Jacobs C. M. J., Oort C. V. (2002). New evidence for a relation between wind stress and wave age from measurements during asgamage. Bound. -Layer Meteor. 103, 409–438. doi: 10.1023/A:1014913624535
Peduzzi P., Chatenoux B., Dao H., De Bono A., Herold C., Kossin J., et al. (2012). Global trends in tropical cyclone risk. Nat. Climate Change 2, 289–294. doi: 10.1038/nclimate1410
Qiao F., Yuan Y., Yang Y., Zheng Q., Xia C., Ma J. (2004). Wave-induced mixing in the upper ocean: distribution and application to a global ocean circulation model. Geophys. Res. Lett. 31 (11). doi: 10.1029/2004GL019824
Shi L., Olabarrieta M., Nolan D. S., Warner J. C. (2020). Tropical cyclone rainbands can trigger meteotsunamis. Nat. Commun. 11 (1). doi: 10.1038/s41467-020-14423-9
Shi L., Olabarrieta M., Valle-Levinson A., Warner J. C. (2019). Relevance of wind stress and wave-dependent ocean surface roughness on the generation of winter meteotsunamis in the northern gulf of Mexico. Ocean Model. doi: 10.1016/j.ocemod.2019.101408
Taylor P. K., Yelland M. J. (2001). The dependence of sea surface roughness on the height and steepness of the waves. J. Phys. Oceanogr. 31, 572–590. doi: 10.1175/1520-0485(2001)0312.0.CO;2
Uchiyama Y., McWilliams J. C., Restrepo J. M. (2009). Wave current interaction in near shore shear instability analyzed with a vortex-force formalism. J. Geophys. Res. 114, C06021. doi: 10.1029/2008JC005135
Uchiyama Y., Mcwilliams J. C., Shchepetkin A. F. (2010). Wave–current interaction in an oceanic circulation model with a vortex-force formalism: application to the surf zone. Ocean Model. 34, 16–35. doi: 10.1016/j.ocemod.2010.04.002
Veron F., Melville W. K., Lenain L. (2008). Wave-coherent air sea heat flux. J. Phys. Oceanogr. 38, 788–802. doi: 10.1175/2007JPO3682.1
Wan Z. H., Zhu J. B., Sun K., Zhou K. (2017). An integrated turbulent simulation and parameter modeling study on sea-spray dynamics and fluxes. Ocean Eng. 130, 64–71. doi: 10.1016/j.oceaneng.2016.11.041
Warner J. C., Armstrong B., He R., Zambon J. B. (2010). Development of a coupled ocean–atmosphere–wave–sediment transport (COAWST) modeling system. Ocean Model. 35, 230–244. doi: 10.1016/j.ocemod.2010.07.010
Warner J. C., Armstrong B. N., He R., et al. (2012). Development and applications of a coupled-ocean-atmosphere-wave-sediment transport (COAWST) modeling system. AGUFM. doi: 10.1016/j.ocemod.2010.07.010
Warner J. C., Sherwood C. R., Arango H. G., Signell. R. P. (2005). Performance of four turbulence closure models implemented using a generic length scale method. Ocean Model. 8, 1–113. doi: 10.1016/j.ocemod.2003.12.003
Xie L., Liu B., Liu H., Guan C. (2015). Numerical simulation of tropical cyclone intensity using an air-sea-wave coupled prediction system. Adv. Geosci. 18.
Xie L., Liu H., Peng M. (2008). The effect of wave–current interactions on the storm surge and inundation in charleston harbor during hurricane hugo 1989. Ocean Model. 20, 252–269. doi: 10.1016/j.ocemod.2007.10.001
Xie L., Wu K., Pietrafesa L., Zhang C. (2001). A numerical study of wave-current interaction through surface and bottom stresses. 1. wind-driven circulation in the south Atlantic bight under uniform winds. J. Geophys. Res. Atmos. 106, 16841–16856. doi: 10.1029/2000JC000292
Yang L., Cheng X., Huang X., Fei J., Li X. (2020). Effects of air-sea interaction on the eyewall replacement cycle of typhoon sinlaku, (2008): verification of numerical simulation. Earth Space Sci. 7 (2). doi: 10.1029/2019EA000763
Zambon J. B., He R., Warner J. C. (2014). Investigation of hurricane Ivan using the coupled ocean–atmosphere–wave–sediment transport (COAWST) model. Ocean Dynam. 64, 1535–1554. doi: 10.1007/s10236-014-0777-7
Zhang W., Li R., Zhu D., Zhao D., Guan C (2022b). An investigation of impacts of surface waves-induced mixing on the upper ocean under typhoon Megi, (2010). Remote Sens. 15, 1862. doi: 10.3390/rs15071862
Zhang W., Zhang J., Liu Q., Sun J., Li R., Guan C. (2022c). Effects of surface wave-induced mixing and wave-affected exchange coefficients on tropical cyclones. Remote Sens. 15, 1594. doi: 10.3390/rs15061594
Zhang W., Zhao D., Sun G. J. (2022a). A numerical investigation of the effect of wave-induced mixing on tropical cyclones using a coupled ocean-atmosphere-wave model. J. Geophys. Res. D. Atmos.: JGR 127, e2021JD036290–1-e2021JD036290-23. doi: 10.1029/2021JD036290
Zhuge W., Wu G., Liang B., Yuan Z., Zheng P., Wang J., et al. (2024). A statistical method to quantify the tide-surge interaction effects with application in probabilistic prediction of extreme storm tides along the northern coasts of the south China sea. Ocean Eng. 2024, 298. doi: 10.1016/j.oceaneng.2024.117151
Keywords: tropical cyclone, coupled modeling, COAWST, wave dependent sea surface roughness, oceans response
Citation: Xia H, Tang S, Chen J, Du S and Guo W (2025) Role of wave coupling in the simulation of tropical storm Choi-wan (2021) using a coupled ocean-atmosphere model. Front. Mar. Sci. 12:1535781. doi: 10.3389/fmars.2025.1535781
Received: 27 November 2024; Accepted: 23 January 2025;
Published: 11 February 2025.
Edited by:
Kejian Wu, Ocean University of China, ChinaReviewed by:
Luming Shi, Ocean University of China, ChinaRui Li, The University of Melbourne, Australia
Copyright © 2025 Xia, Tang, Chen, Du and Guo. This is an open-access article distributed under the terms of the Creative Commons Attribution License (CC BY). The use, distribution or reproduction in other forums is permitted, provided the original author(s) and the copyright owner(s) are credited and that the original publication in this journal is cited, in accordance with accepted academic practice. No use, distribution or reproduction is permitted which does not comply with these terms.
*Correspondence: Wuhong Guo, ZzF3MmgzMTk4MEAxNjMuY29t