 Jiahui Liu
 Yaoqi Hou2†
 Fa Zheng
95% of researchers rate our articles as excellent or good
Learn more about the work of our research integrity team to safeguard the quality of each article we publish.
Find out more
ORIGINAL RESEARCH article
Front. Mar. Sci. , 21 February 2025
Sec. Marine Affairs and Policy
Volume 12 - 2025 | https://doi.org/10.3389/fmars.2025.1534508
Introduction: Land resources play a vital role in national economic and social development. Hainan Province faces the challenge of balancing land use with conservation while striving to develop a high-quality free trade port. This study aims to analyze land use changes and their driving factors to support sustainable land use policies.
Methods: This study utilised the GlobeLand30 dataset, along with data on temperature, precipitation, the digital elevation model (DEM), slope, soil, gross domestic product (GDP), and population, to apply the Patch-generating Land Use Simulation (PLUS) model. This model was used to analyse land use changes on Hainan Island from 2000 to 2020, to investigate the relationship between land use change and its driving factors.
Results: (1) During 2000~2020, forests and cultivated land were the predominant land use type, while wetlands and artificial surfaces increased by two times, and bare land remained stable; (2) Temperature significantly influenced cultivated land, forests, and grasslands, while GDP and population growth impacted water bodies and artificial surfaces; (3) The predicted land use map for 2020 achieved high accuracy (Kappa = 0.85); (4) By 2040, forests and cultivated land are expected to remain dominant, with grasslands and artificial surfaces decreasing, while wetlands and bare land are projected to increase.
Discussion: The study highlights the complex interactions between land use and its driving factors in Hainan. The findings provide valuable insights for sustainable land use policy development, balancing economic growth with ecological conservation in the region.
Land resources are essential means of production and material carriers upon which humanity depends for survival. With the rapid advancement of science and technology, along with the substantial development of the economy and society, the considerable expansion of the global population has significantly altered the methods and intensity of human exploitation of land resources. These changes have triggered a series of issues, including land degradation and vegetation destruction, thereby constraining the sustainable use of land resources (Fan et al., 2017). As early as the early 19th century, Turner was among the first scholars to articulate the concept of land use and analyse the mechanisms of land use change through hypothetical abstract theories (Kalkuhl and Edenhofer, 2017). In 1995, the International Geosphere Biosphere Programme (IGBP) and the International Human Dimensions Programme on Global Environmental (IHDP) identified the study of Land use and cover change (LUCC) principles, patterns, and models as one of the three major research priorities in the LUCC Science Plan (Turner et al., 1995). By 2002, the International Geographical Union (IGU) emphasised the driving mechanisms of LUCC and its interactions with the environment as key research areas.
Land use change in tropical regions, particularly tropical islands, has long been a focal point of research due to their unique ecological environments and geographical features. The rapid economic development in these areas often leads to severe deforestation (Kiat et al., 2020), resulting in significant changes in land use and land cover types (da Silva Cruz et al., 2022). For instance, the Land Use and Carbon Scenario Simulator (LUCAS) was used to model land changes on the Hawaiian Islands under various scenarios, including interactions between land use and climate change (Selmants et al., 2021). Similarly, studies in Kuala Lumpur, Malaysia; the island state of Singapore (Tso, 1996), and San Juan, Puerto Rico (Velazquez-Lozada et al., 2006) highlight the extreme impacts of urban heat islands in tropical regions driven by land use changes (Comarazamy et al., 2013). The Google Earth Engine (GEE) platform facilitated the analysis of spatiotemporal land cover changes on three tropical islands: Sri Lanka, Timor Island, and Palawan Island, as reported by (Fu et al., 2022). However, research on land use changes on Hainan Island, one of China’s tropical islands, remains limited.
As land use change simulation has become a research hotspot in contemporary academia, various models have been developed to address this issue. These models include the Cellular Automata (CA) model l (Tobler, 1979), the Conversion of Land Use and its Effects at Small Region Extent (CLUE-S) model (Verburg et al., 2002), and the Future Land Use Simulation (FLUS) model (Liu et al., 2017). However, most studies on these models focus on technical improvements to modelling procedures, model calibration, and rules, with limited attention to a more conceptual understanding of the underlying causes of LUCCs (Cao et al., 2015; Engelen et al., 2002). They also exhibit weaknesses in identifying the potential driving factors behind land use changes (Sohl and Claggett, 2013) and fail to capture the evolution of multiple land use patches across temporal and spatial scales (Meentemeyer et al., 2013; Yang et al., 2020). The latest Patch-generating Land Use Simulation (PLUS) model has effectively addressed these limitations. It is a patch-generating land use change simulation model developed by (Liang et al., 2021), which integrates the random forest algorithm with Cellular Automata. This model improves upon traditional transformation rule-mining strategies, addressing issues such as the complexity of defining transformation rules and parameters. It incorporates both land use driving and planning factors, resolving the lack of temporal concepts in pattern analysis strategies and enhancing the ability to explore the driving mechanisms behind land use changes. Zhai et al. explored the spatiotemporal patterns of LUCC under the urbanisation context in Wuhan, China, from 2000 to 2019, and predicted land allocation in Wuhan for 2029 based on this model (Zhai et al., 2021). Similarly, Li et al. utilised random forest sampling, the Markov chain model, and the PLUS model to simulate land use/cover changes in Rwanda over the next 30 years (Li et al., 2021). Compared to other coupled models, the PLUS model not only identifies the driving factors of land expansion and project landscape dynamics, but also better uncovers the causes of land use changes. Furthermore, it incorporates a multi-category random seed growth mechanism, enabling a more accurate simulation of changes at the land-use patch level in spatial terms.
The changes in land use patches are mostly driven by the combined influence of natural factors and socio-economic factors, making them the result of the integrated effects of multiple factors (Zhou et al., 2020). Among them, the natural factors mainly include the slope, digital elevation model (DEM), temperature, precipitation (Dang and Kawasaki, 2017) and climate (Tasser et al., 2017), and the socio-economic factors mainly include population growth and economic development (Li and Liu, 2017; Wang et al., 2012; Wu et al., 2018). Gong et al. analysed the spatial evolution characteristics of cultivated land in the Beijing–Tianjin-Hebei region from 1990 to 2015 and examined the driving factors of cultivated land. The results showed that changes in the quantity of such land are affected by both economic and demographic factors, changes in the pattern are affected by natural conditions, and the combination of these factors plays an important role in the system of driving mechanisms (Gong et al., 2020). Peng et al. quantitatively analysed the dynamic changes in ecological land use and its driving forces in Shenzhen, and they found that the slope is one of the most important factors determining these changes in the city (Peng et al., 2017).
Hainan Island is the second-largest island in China. It has a typical tropical island monsoon climate, in which November to April represent the dry season, the average temperature throughout the year is between 22.5 and 25.6 °C, and the average annual rainfall amounts to between 900 and 2500 mm (Luo et al., 2018). The latitude and longitude range of the study area was 108°37′–111°03′ E and 18°10′–20°10′ N, respectively, and the total area was 33,200 km2.
Based on the boundary map of Hainan Island, land use data for Hainan Island across different periods were extracted. Additionally, data on temperature, precipitation, DEM, slope, soil, GDP, and population were collected and used as driving factors, with detailed information provided in Table 1. All driving factor data were uniformly converted to the same coordinate system and resampled to 30m resolution to match the land use data.
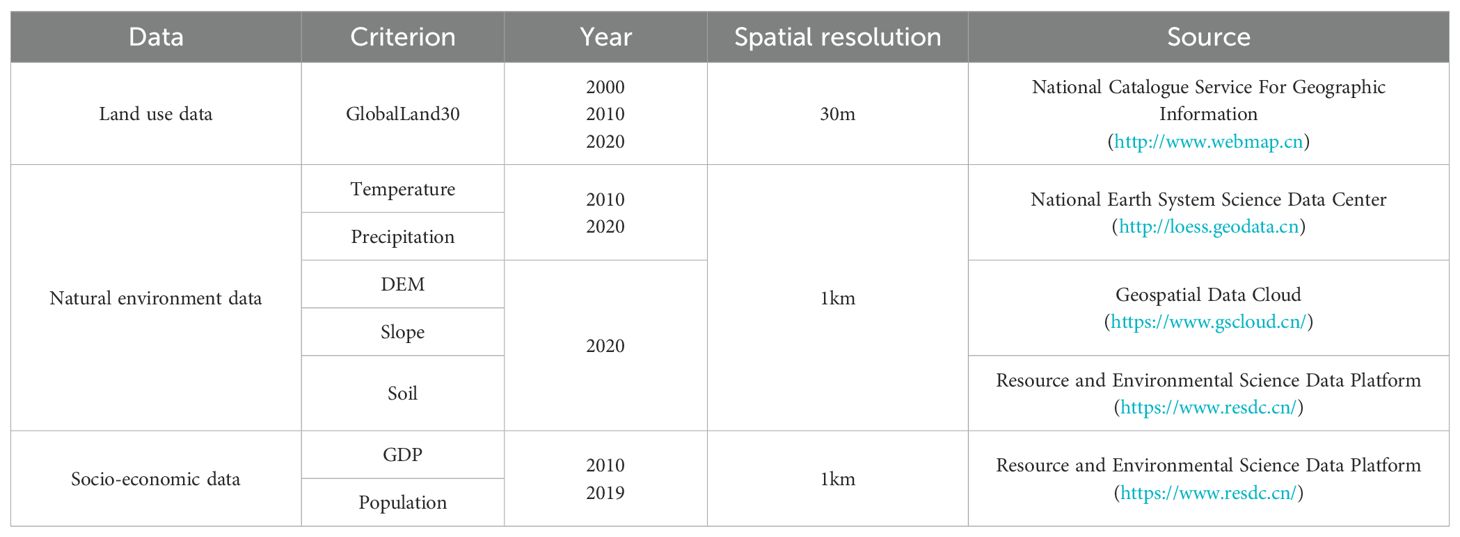
Table 1. Data sources.
The land use dataset used in this research was derived from GlobalLand30, a global land cover dataset with a 30-metre spatial resolution, developed by China, which contains land use data for the years 2000, 2010 and 2020. This dataset uses 30 m multispectral classified images, including Landsat images from the United States, HJ-1 images from China’s Environmental Disaster Reduction Satellite and Gaofen-1 images, and it includes ten class types, such as cultivated land, forested land and grassland, with an overall accuracy of more than 80% in its V2010 and V2020 versions.
The natural environmental data used in this study include temperature, precipitation, DEM, slope, and soil. Temperature and precipitation datasets were obtained from the National Earth System Science Data Center. These datasets were spatially downscaled in China using the Delta downscaling approach, based on the global 0.5°climate dataset published by CRU and the high-resolution global climate dataset released by World Clim. Data validation was conducted using observations from 496 independent meteorological stations (Liang et al., 2021). DEM data, sourced from the Geospatial Data Cloud, effectively reflect the surface characteristics of the study area. Slope data were derived from the DEM to better evaluate the spatial distribution of land use changes. Soil data were obtained from the Resources and Environment Science Data Center of the Chinese Academy of Sciences. Specifically, these data were digitised from the 1:1,000,000 Soil Map of the People’s Republic of China, compiled and published by the National Soil Survey Office in 1995. The dataset adopts the traditional “Soil Genesis Classification” system and comprehensively covers various soil types and their key attributes across the country.
The socio-economic data used in this study include GDP and population density data, sourced from the Resources and Environment Science Data Center. The selected data cover two periods, 2010 and 2019, capturing key socio-economic changes over the past decade. These datasets are used to directly reflect the intensity of human activity. Specifically, GDP data indicate the level of regional economic development and its potential impact on land use patterns, while population density data provide a critical basis for assessing the pressure of human activities on land resources. Integrating these datasets enables this study to comprehensively examine the socio-economic drivers of land use changes and to provide robust references for future scenario simulations.
The PLUS model is a patch-generating land use change simulation model. It improves the traditional transformation rule mining strategy, solves problems such as the complexity of the transformation rules and parameter determination, introduces a land expansion analysis strategy (LEAS), combines the CA model based on multi-type random patch seeds (CARS) with the random forest algorithm, considers land use drivers and planning factors and integrates the probability of metacellular conversion, land class unit interaction and overall development status in the calculation of the metacellular conversion probability (Liang et al., 2021). The principle of the LEAS module, as shown in Figure 1, is to overlay the land use data from two periods and extract the image elements where the state of the land use data has changed in the later period, i.e., the areas of change for each land use type. The result is divided into subsets according to the land use types and combined with the driving factors; then, each type of land expansion is mined and analysed separately to obtain the conversion rules for each land use type. Then, the random forest algorithm is used to explore the relationships between the growth of each land use type and multiple drivers, and an integrated classifier based on the decision tree of each training sample extracts random samples from the original training set, ultimately outputting the growth probability of unit i’s land use type k as in the following equation:
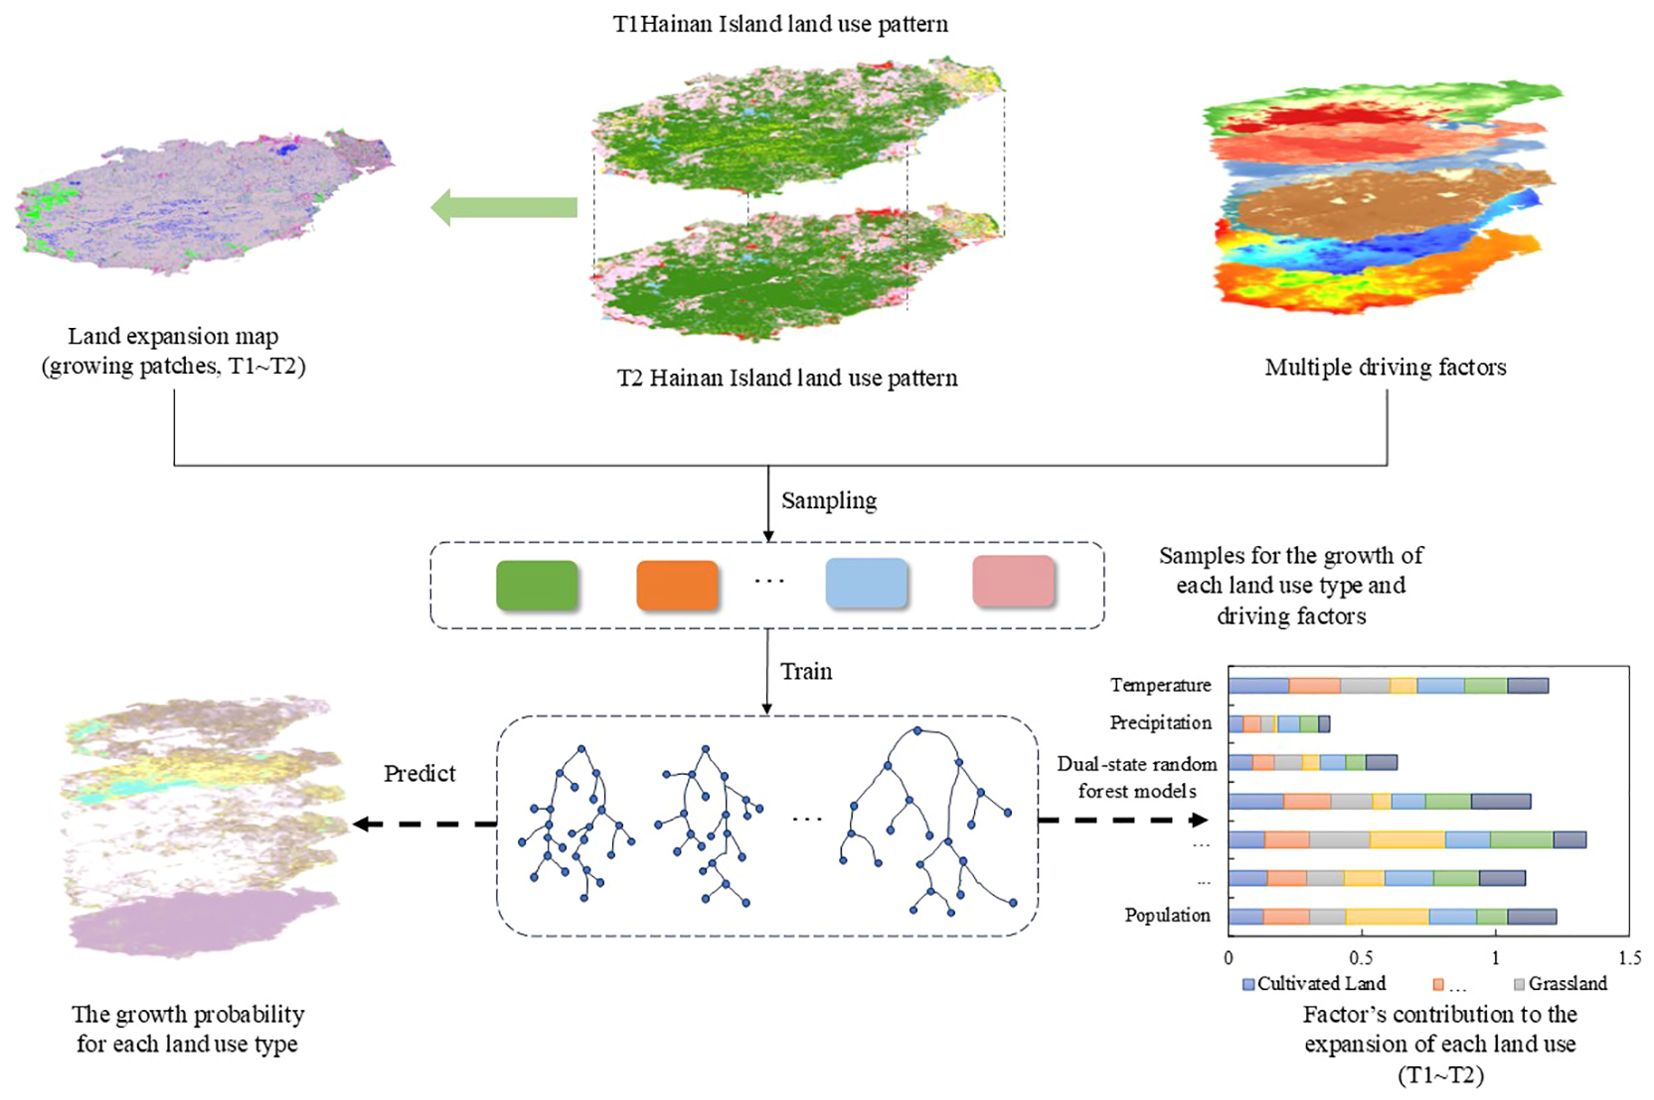
Figure 1. Random forest algorithm-based land expansion analysis strategy module.
where x denotes a vector of multiple drivers; d takes a value of 1 or 0, where 1 indicates a shift from other land use types to land use type k and 0 indicates the presence of other shifts; ℎ(x) denotes the nth prediction type of the x vector decision tree; I(·) denotes the indicator function of the set of decision numbers; and M is the total number of decision trees.
Next, the CARS model, based on multi-class random patch seeds, sets the neighbourhood range, neighbourhood weight factor, random patch seed probability and conversion cost. The principle of the CARS module, shown in Figure 2, is based on a metacellular automata model with multiple types of stochastic patch seeds. It combines stochastic seed generation and a threshold decrementing mechanism for the dynamic simulation of land class patches. In the simulation, the land use demand affects the local land use competition adaptive coefficients through a self-regulating mechanism that drives the area of land use to meet the future demand. The formula for the overall probability of land use type k is given below:
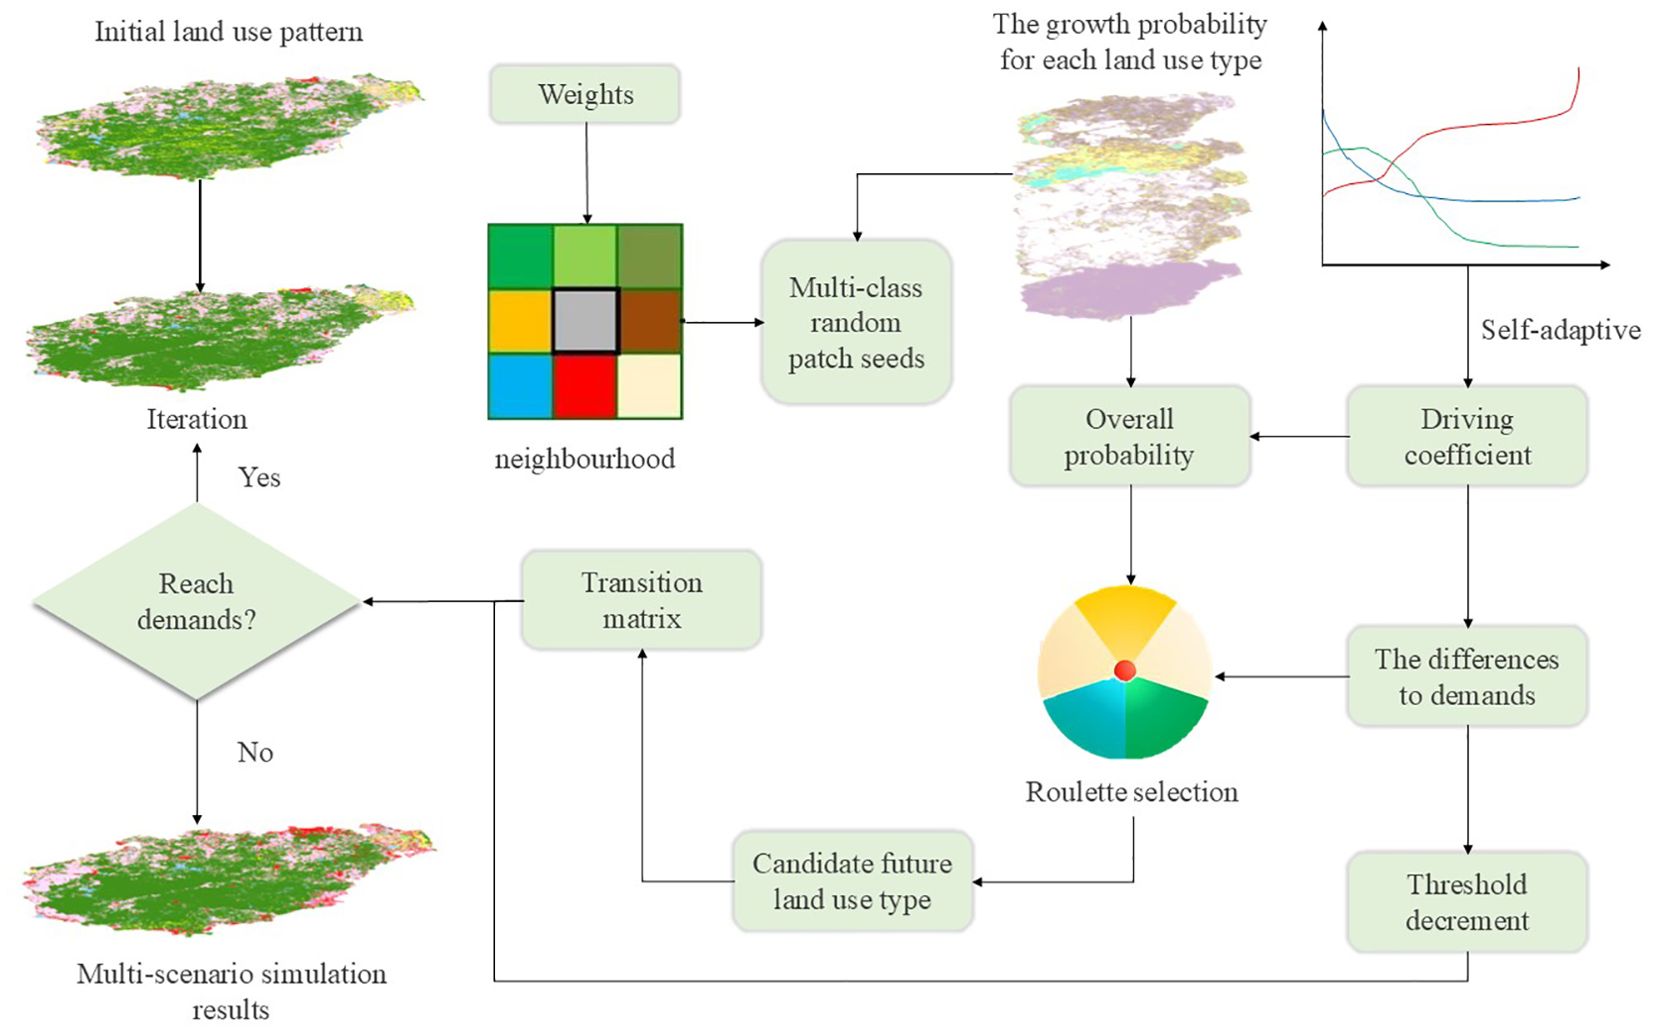
Figure 2. Cellular Automata model based on multi-class random patch seeding.
where is the growth probability of land type k in the cell; is the domain effect of the cell, which denotes the proportion of the land use type k that is covered in the neighbourhood; and is the adaptive driving coefficient, which affects the future of the land type k demand and is affected by the number of iterations t. This also indicates the gap between the current amount of land type k and its target demand. Finally, a roulette wheel is constructed based on the overall probability of all land use types and is used to select the land use state for the next iteration.
In order to predict the evolution of land use patches under different land use development scenarios, a multi-type random seeding mechanism based on threshold descent is used to determine the probability surface for each land use type using a Monte Carlo methodology when the neighbourhood influence on the land use type k is zero.
The expressions are as follows:
Where r is a random value in the range from 0 to 1, and is the threshold for the generation of new patches of land type k. In order to control the generation of multiple land use type patches, a threshold descent rule for the competitive process is proposed to constrain the organic and spontaneous growth of all land use types. In a competitive round, if the winner is a new land use type c, it is evaluated as a candidate using a decreasing threshold τ with the following results:
where is the step size of the PLUS model to fit the land use demand; is the transformation matrix that specifies whether the land class k can be transformed into the land use type c; δ is the decline threshold τ of the decay coefficient, δ∈[0,1]; l denotes the number of decay steps; and rl denotes a normally distributed random value with mean 1, rl∈[0,1]. CA models based on multi-class stochastic patch seeding are spatiotemporally consistent and allow new land use patches to develop freely, subject to the development probabilities.
Based on the land use maps of Hainan Island for 2000, 2010, and 2020 (Figure 3), the island’s land use is categorised into seven types: cultivated land, forest, grassland, wetland, water bodies, artificial surfaces, and bare land. Statistical analysis of the area changes for each land use type (Figure 4) reveals significant transformations in the land use patterns of Hainan Island between 2000 and 2020. Forest and cultivated land consistently dominated, accounting for over 60 and 20% of the total area, respectively. However, their trends were markedly different: cultivated land showed a declining trend followed by a subsequent increase, while forest initially expanded and later declined. Grassland, the third-largest land use type in 2000, experienced a consistent decrease throughout the study period. Wetland, despite accounting for a relatively small proportion of the total area and showing limited variation, demonstrated a steady upward trend. Water bodies, characterised by a spatially fragmented distribution, followed a “decline-then-recovery” trajectory. Notably, artificial surfaces expanded significantly, with their area in 2020 approximately tripling compared to 2000, surpassing grassland to become the third-largest land use type. Bare land, while consistently the smallest category, also exhibited a slight but steady increase. Overall (Figure 5), from 2000 to 2020, forest, wetland, water bodies, artificial surfaces, and bare land all increased in area. This expansion was primarily driven by reductions in cropland and grassland, reflecting substantial shifts in land use patterns influenced by both natural and anthropogenic factors.
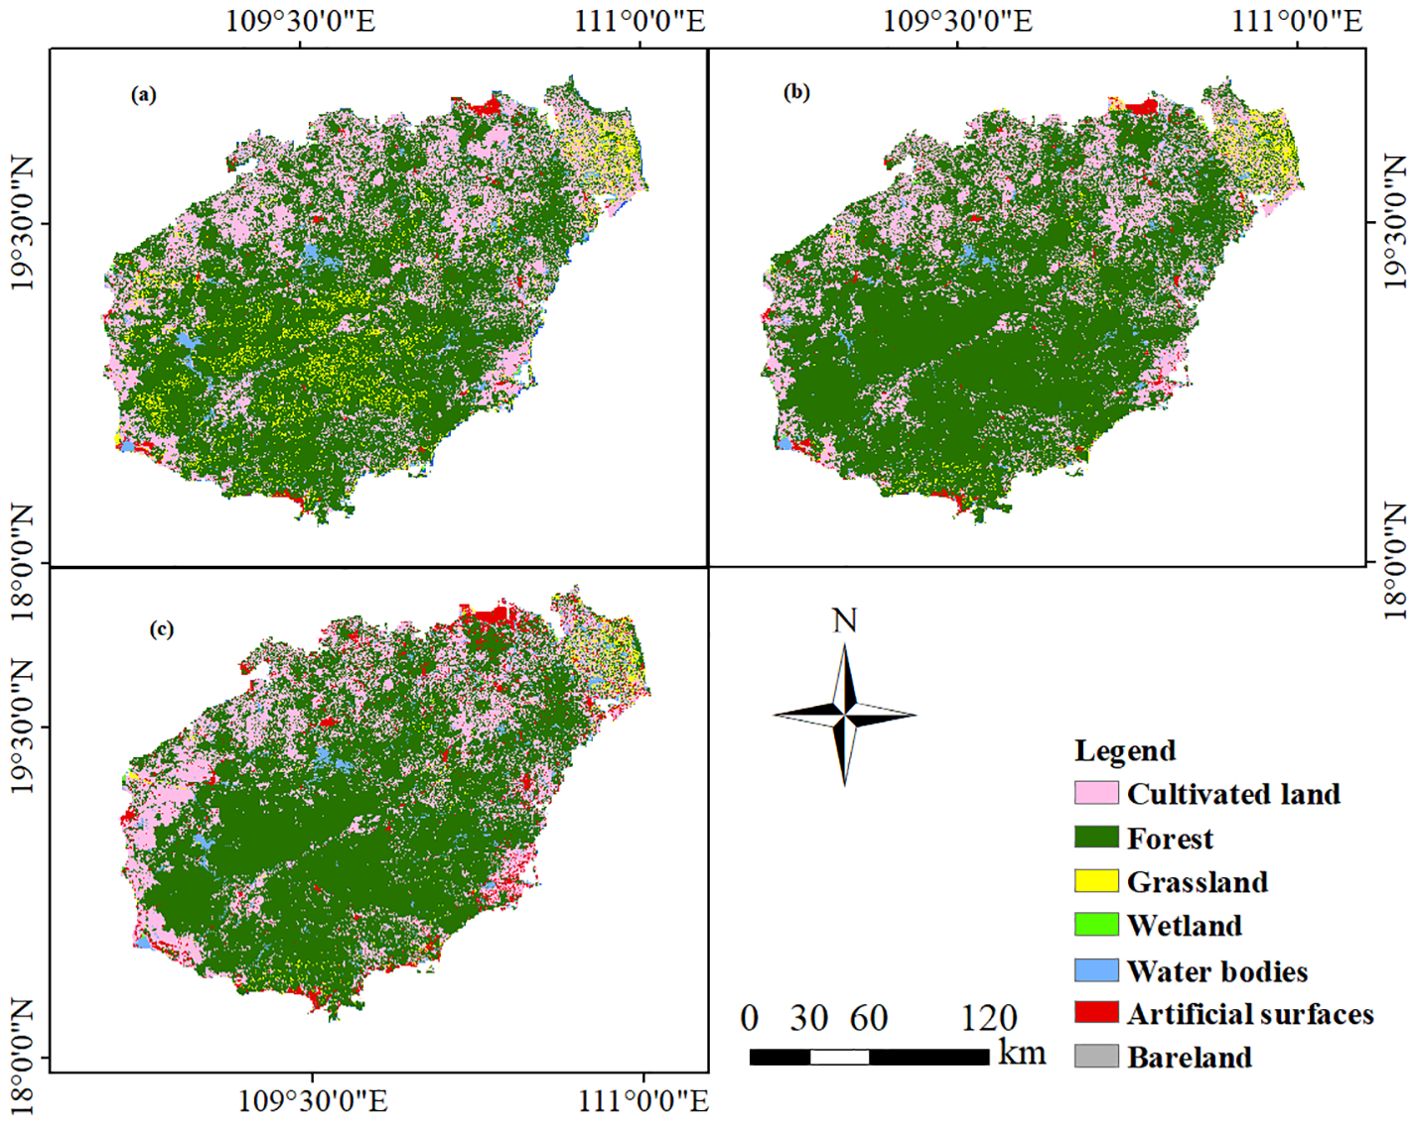
Figure 3. Land use types on Hainan Island, 2000–2020 (A: 2000; B: 2010; C: 2020).
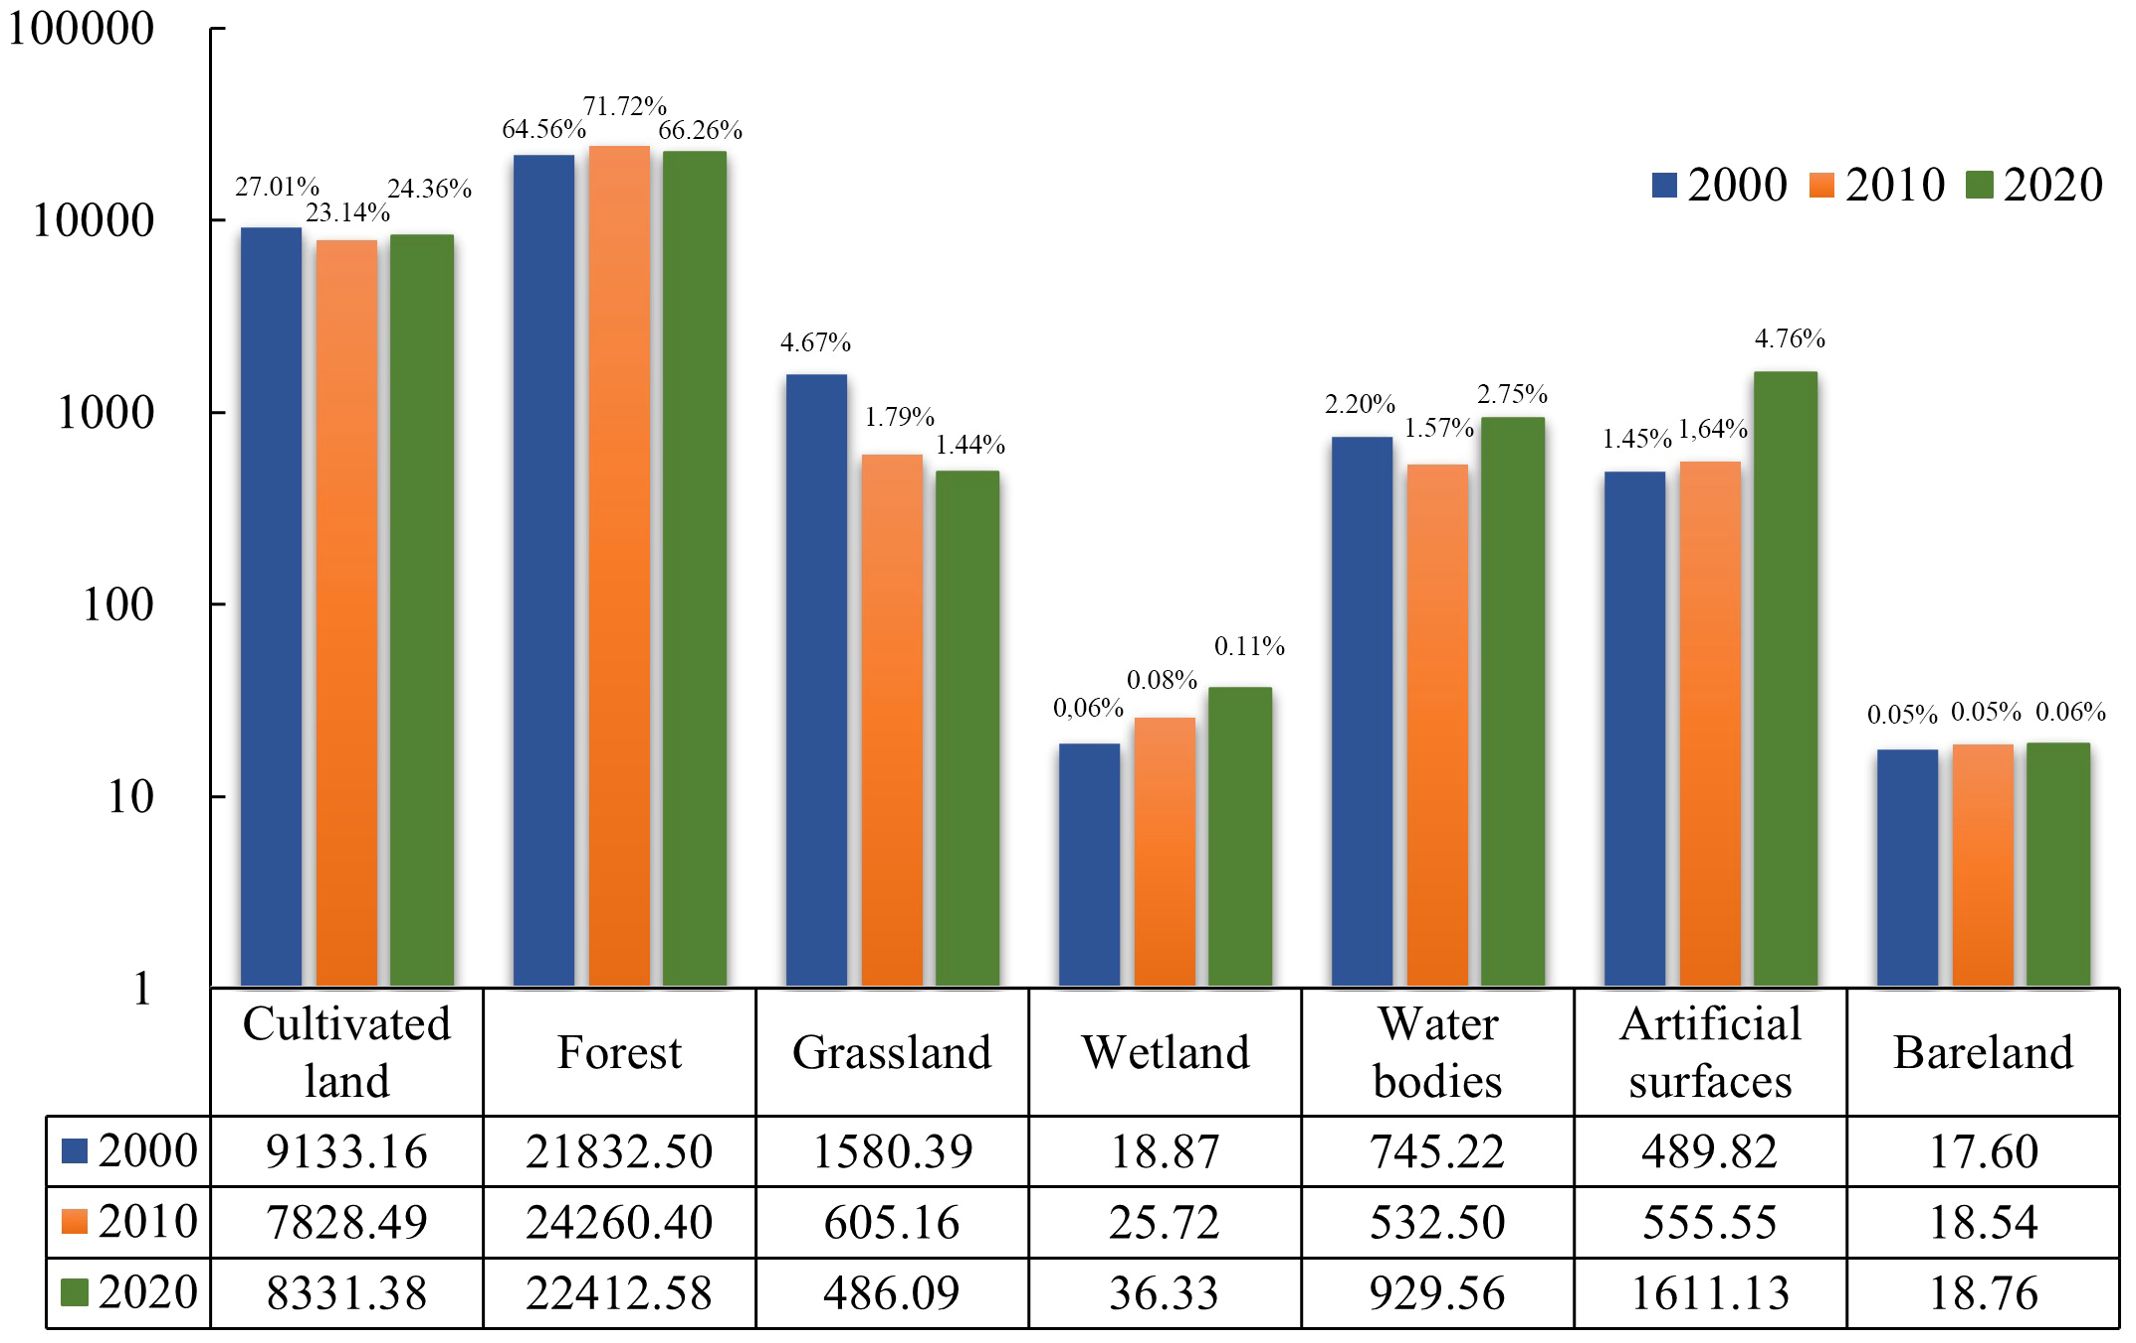
Figure 4. Land use area of Hainan Island, 2000–2020.
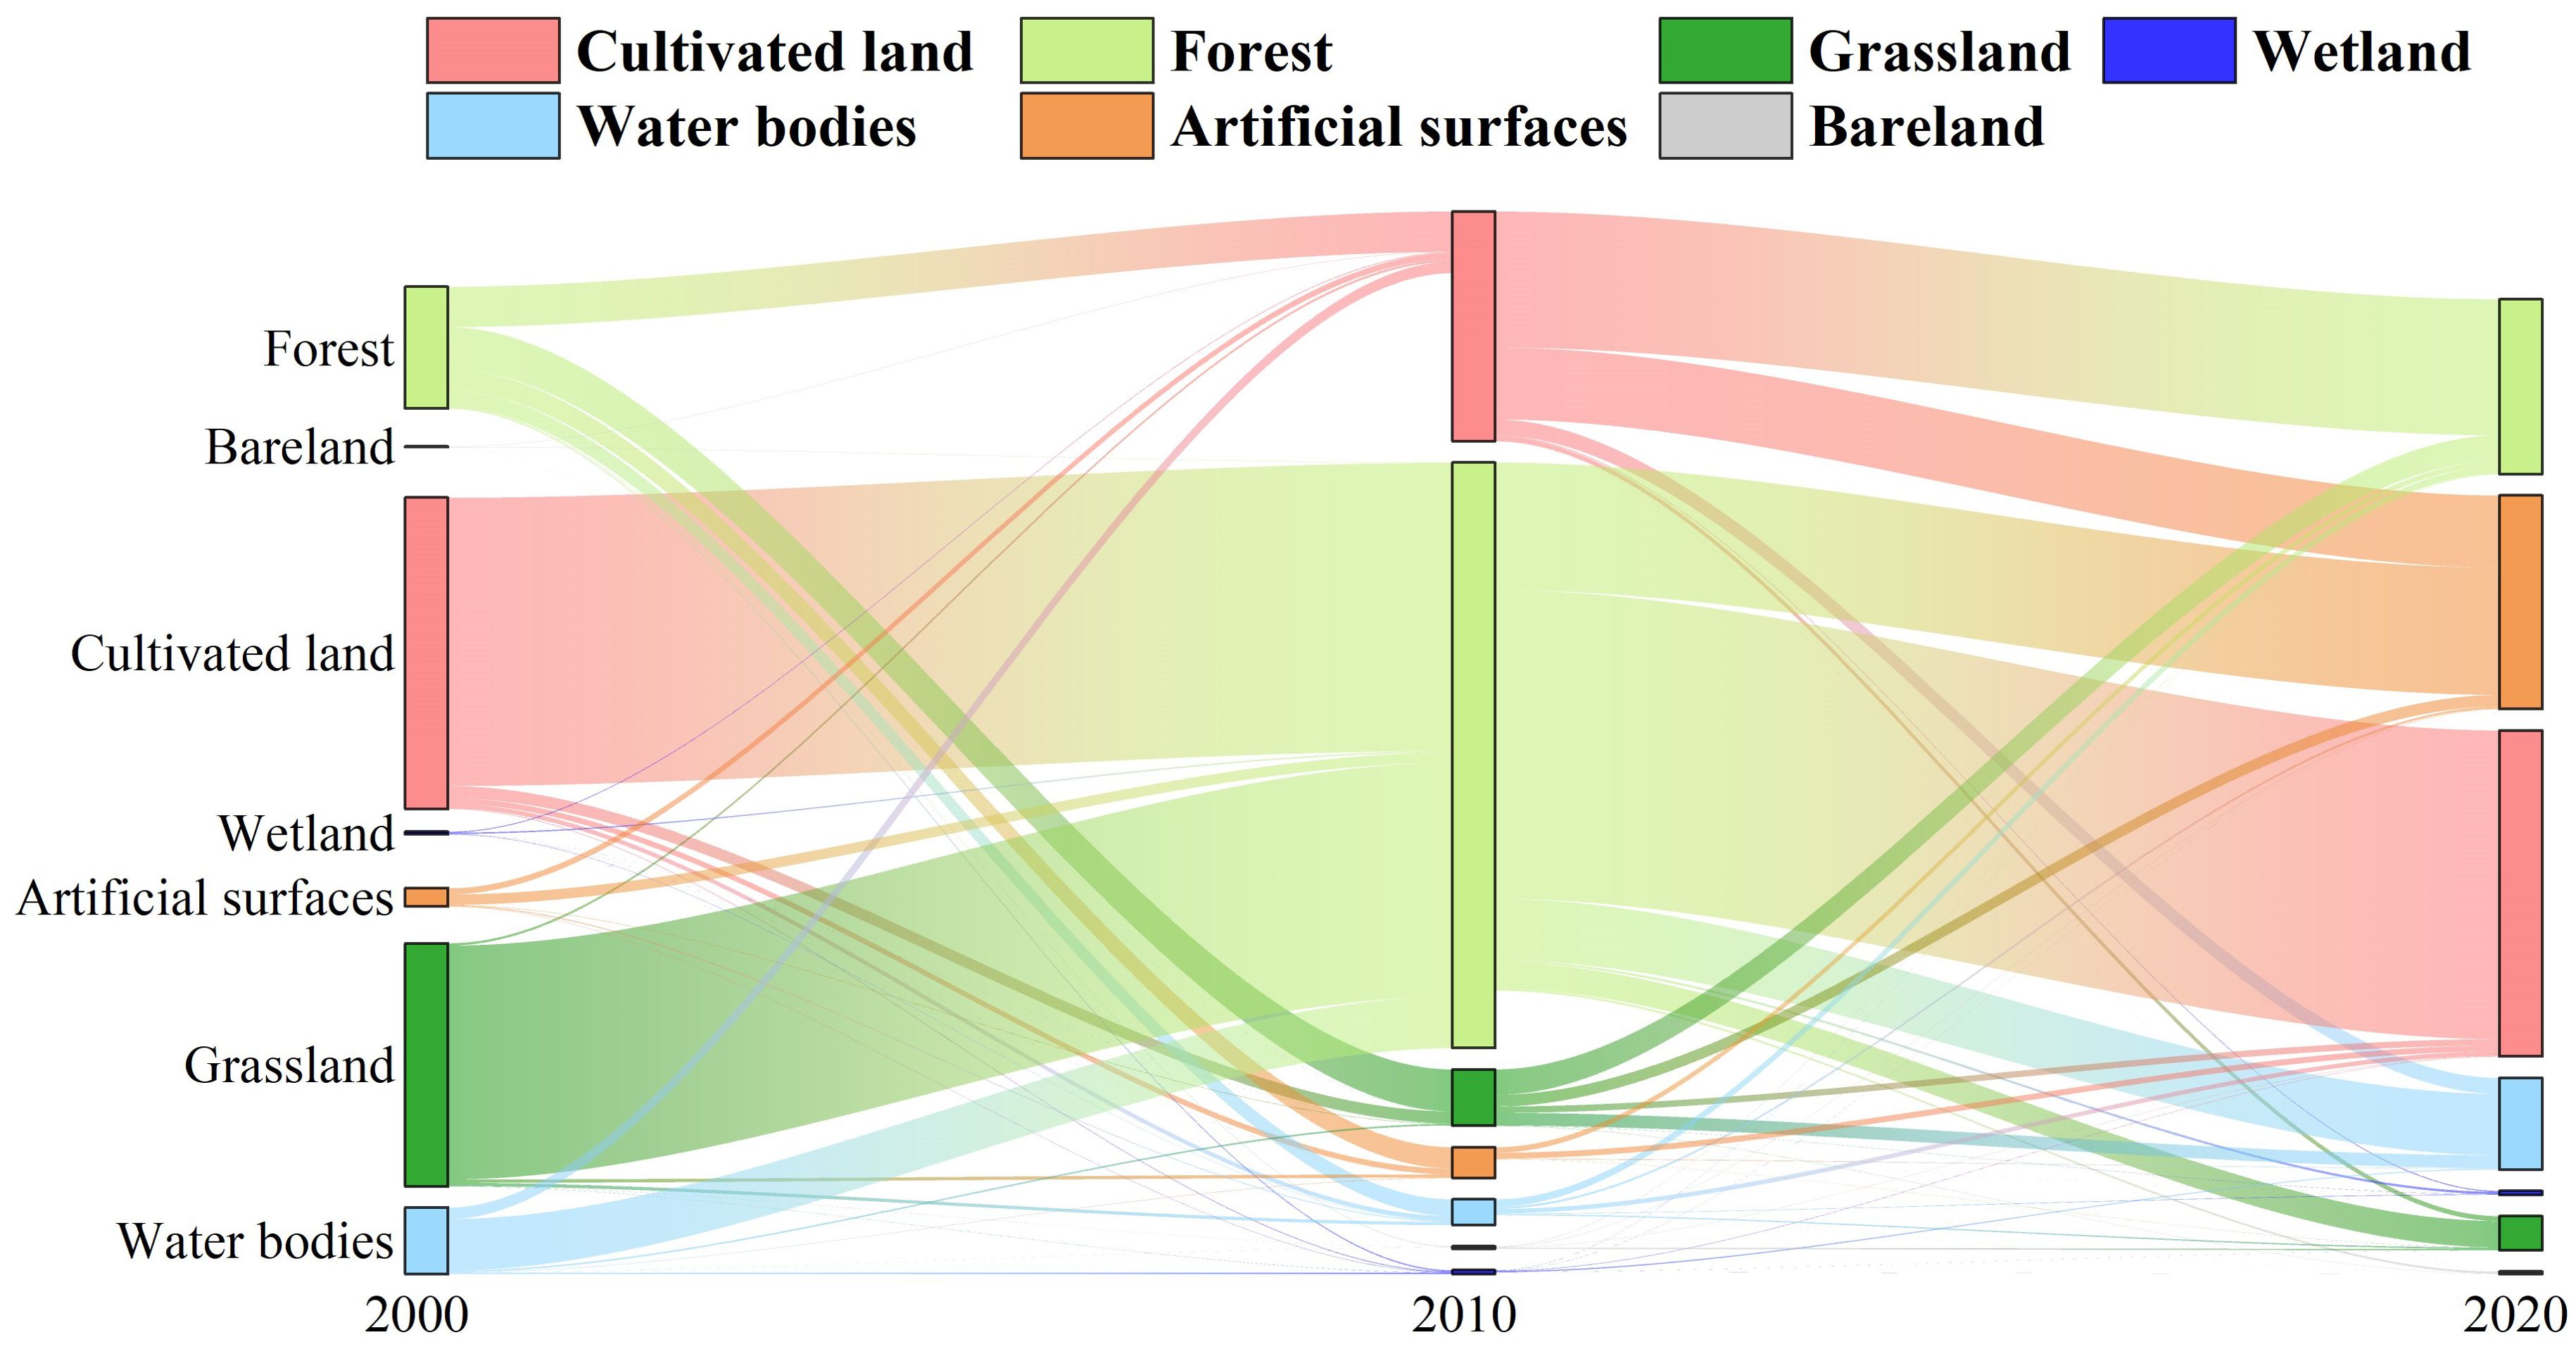
Figure 5. Land use types of transfer matrix.
By extracting the probability of land use development and the contributions of drivers on Hainan Island in the last 20 years, it was found that cultivated land, forests and grassland were mainly affected by temperature, the main driver for wetland was precipitation, the main driver for water bodies was GDP, the main driver affecting artificial surfaces was population and the largest contributor to bare land was the DEM. Land use data from 2000 and 2020 were selected, and the factors of expansion and the driving force of each land use type were mined one by one through LEAS using the random forest algorithm. Moreover, the development probability of each type of land use and the contributions of the driving factors to the expansion of each land use type in this time period were obtained (Figure 6). From Figure 6, it can be seen that the main drivers behind the change in the area of cultivated land were temperature and precipitation, with shares of 21.46 and 19.56%, respectively. Similarly, the main drivers affecting the forest area change were the temperature, precipitation and DEM, with 18.79, 17.30 and 16.94%, respectively. For grassland, as well as plants, the main drivers causing changes in their areas were temperature and DEM, with 21.04 and 19.52%, respectively. Wetlands on Hainan Island are dominated by natural wetlands, including rivers, marshes and coastal wetlands, and the main driver of their area change is precipitation, which accounts for 30.43% of the total. Unlike the other land classes, the drivers of changes in the water body area are closer in contribution, with the largest contributions found for GDP, population density, and the DEM, at 17.89, 17.69 and 16.95%, respectively. As the land use category most closely related to human mobility, the largest driver of changes in the area of artificial surfaces is population, which accounts for 22.55% of the total. By contrast, bare land, the most flexible and adaptable land category, is the most affected by changes in area due to the DEM and GDP, with shares of 31.49 and 28.53%, respectively.
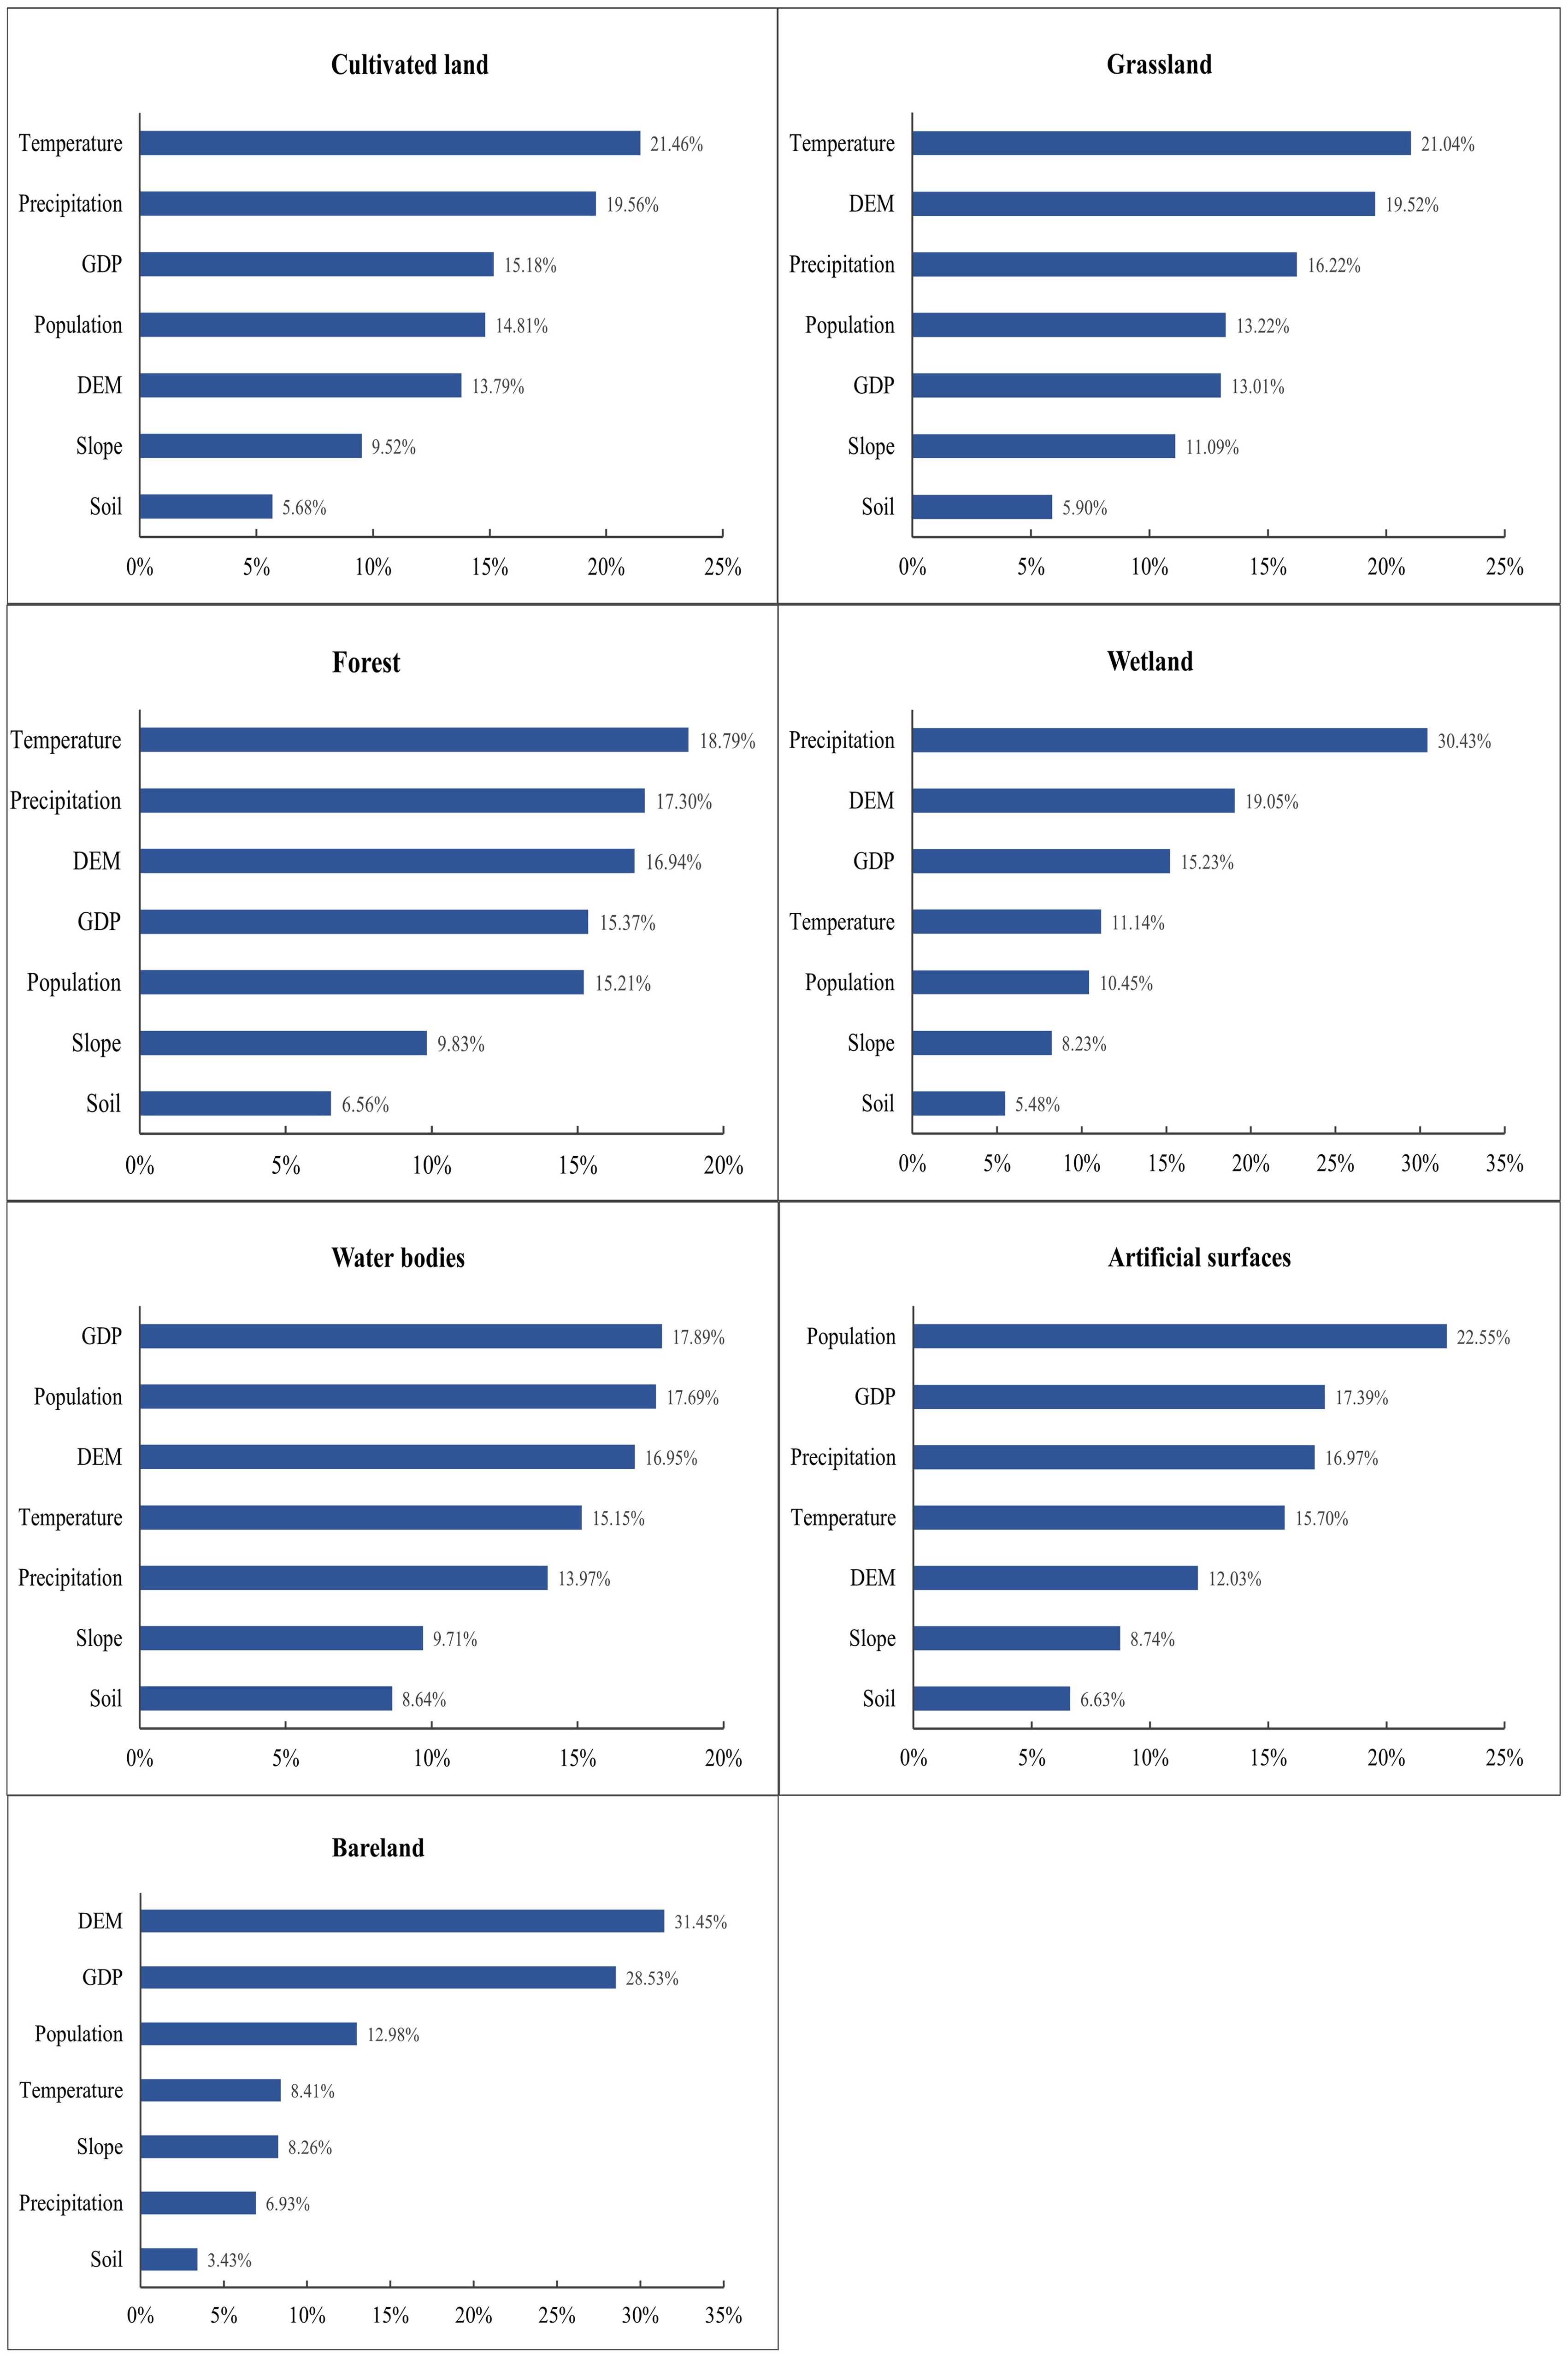
Figure 6. Contributions of drivers of area change by land type on Hainan Island (the X-axis shows the size of the contribution, the y-axis is the impact factor).
The results of the simulations using the PLUS model and the land cover data from GlobeLand30 to predict future land cover changes on Hainan Island are promising. Using land use data from 2000 to 2010, the PLUS model simulation generates spatiotemporal dynamic land simulation patches for 2020 based on the CARS model, combining stochastic seed generation and threshold decreasing mechanisms, with water bodies set as restricted areas under the constraint of the development probability. Figure 7 illustrates the comparison between the simulated map of 2020 and the actual map of 2020 generated by the PLUS model. Table 2 gives the simulation accuracy for the land classes, and it is found that the simulation accuracy for four land classes is higher than 85%. Among these, wetlands have the highest simulation accuracy, which reaches 93.04%, and the forests, which account for the largest area of the whole island, also have a simulation accuracy as high as 90.77%. The simulation accuracy for cultivated land and artificial surfaces is 87.85 and 86.54%, respectively. Although the simulation accuracy for water bodies and bare land is only 80.27 and 82.16%, respectively, the Kappa coefficient of the simulation is 0.85, which indicates that the model’s accuracy is high. The land cover data predicted for 2020 using the Globeland30 land cover data of Hainan Island from 2000 to 2010 and simulated using the PLUS model are convincing.
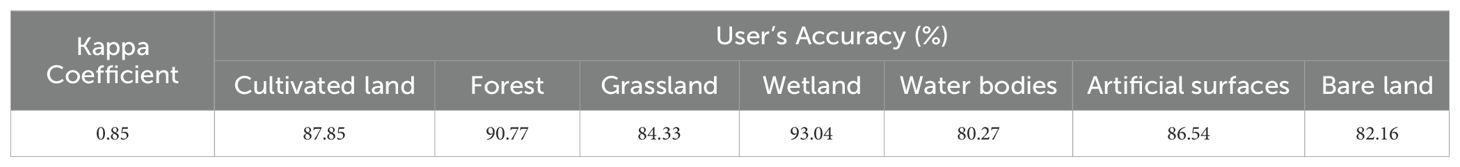
Table 2. Verification of simulation accuracy of land modelling and actual use simulation on Hainan Island in 2020.
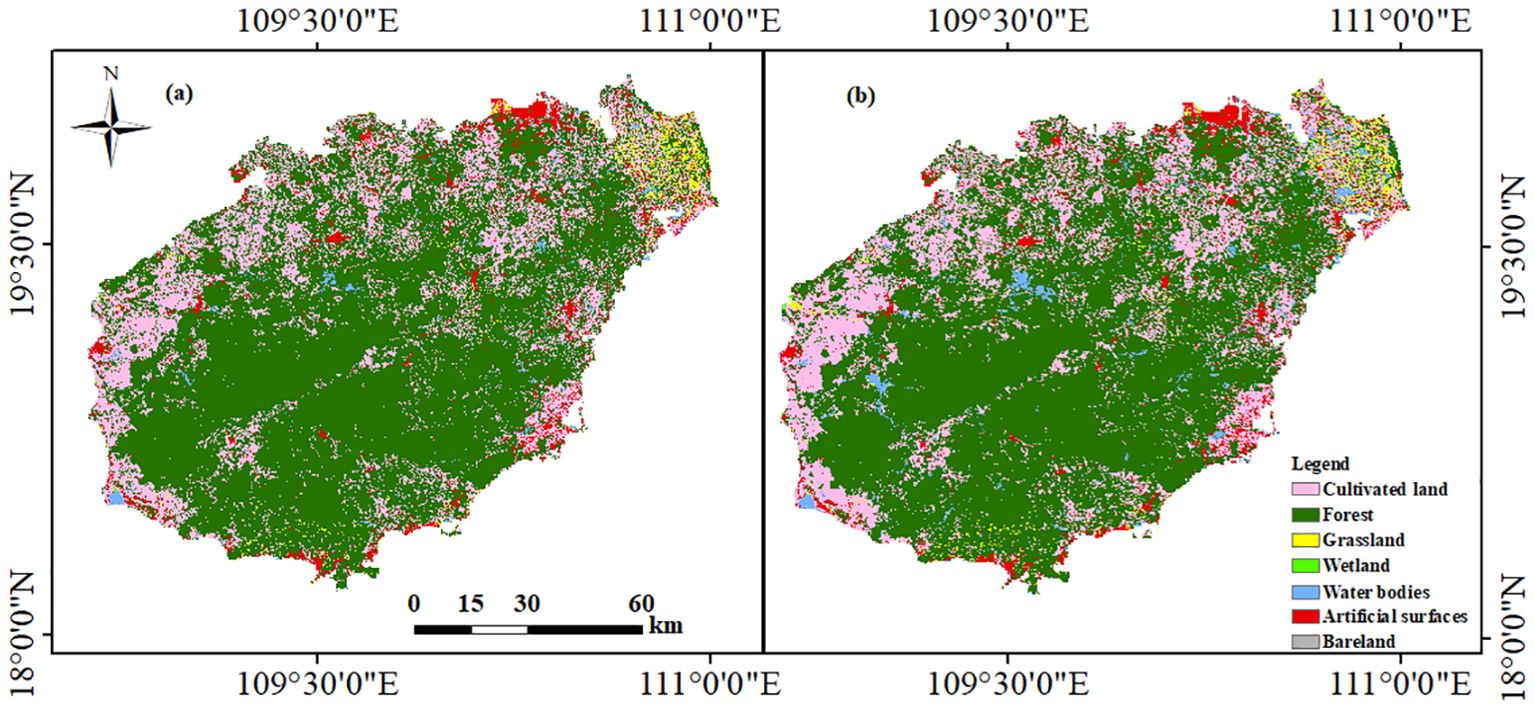
Figure 7. Land simulation and actual utilisation of Hainan Island in 2020 ((A) land simulation; (B) actual utilisation).
In 2040, land use on Hainan Island will continue to be dominated by cultivated land and forests, followed by man-made surfaces. The area of water bodies, as a restricted land category, will remain unchanged, but all other land categories will undergo different changes, with an increase in the areas of cultivated land, forests, wetlands and bare land and a decrease in the areas of grassland and artificial surfaces. Based on the land use data in 2020, using the probability map of the development of various types of land use on Hainan Island from 2000 to 2020, the CA model simulation was used to obtain a simulation map of the spatial distribution of land use on Hainan Island in 2040 (Figure 8), and the area of each category was calculated (Table 3). The cropland area increased by 177.29 km², which accounts for 25.15% of the total island area. This expansion primarily occurred in the northeastern part of Hainan Island, representing an extension of pre-existing cultivated land areas. Meanwhile, the forest area experienced the largest increase, expanding by 335.36 km², with most of the growth concentrated in the eastern part of Hainan Island. After the expansion, the total forest area reached 22,747.94 km², maintaining its status as the largest land use type on the island, accounting for 67.25% of the total area. Artificial surfaces, as the land category with the largest area of change, decreased by 466.53 km2, accounting for only 0.11% of the total area; however, with an area of 1144.60km2, it is still the third-largest land category, apart from forests and cultivated land. Similarly, there was a decrease in grassland, which decreased by 47.19km2, with a reduction of 1.30% in the area. The smallest changes in area were found for wetlands and bare land, which increased by 0.79 and 0.29km2, respectively, and they were also the land categories with the smallest percentages of the area, accounting for only 0.11 and 0.06%, respectively. Water bodies, as a geographic area of restricted development, remained unchanged in terms of their area in this simulation.
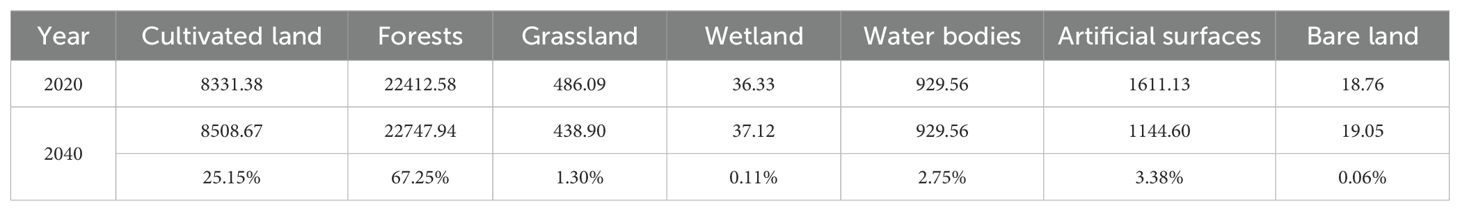
Table 3. Area of modelled land use types in 2020 and 2040 (km2).
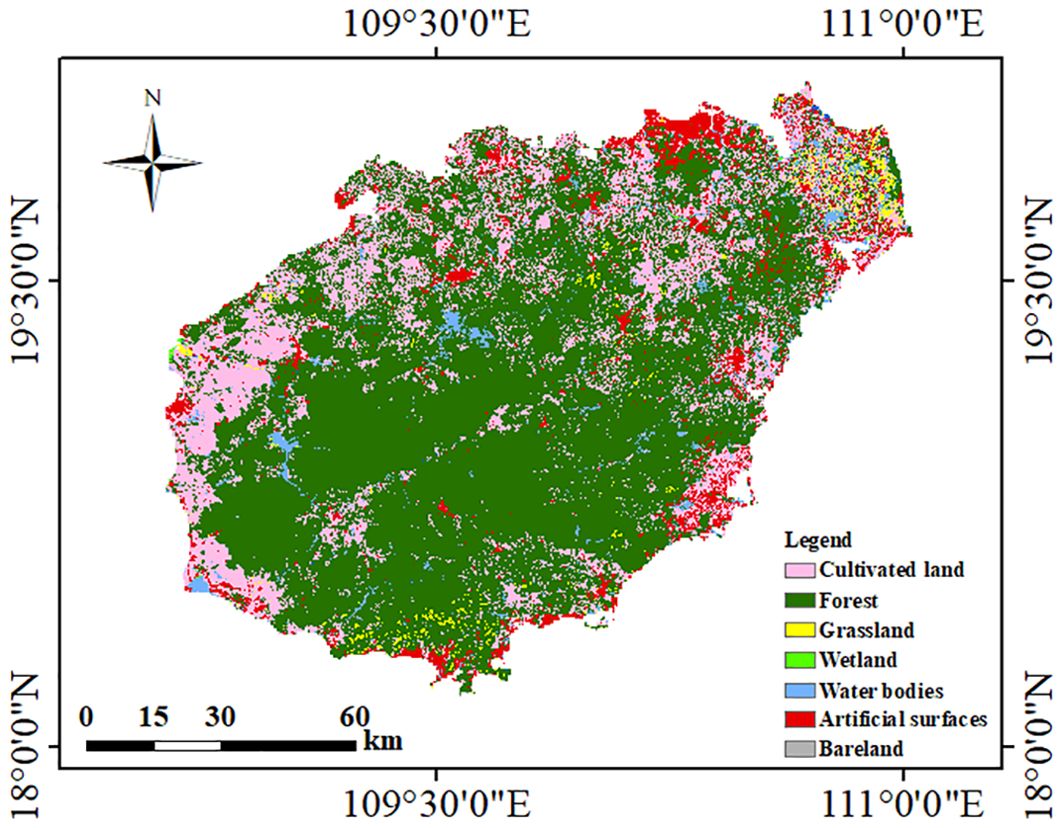
Figure 8. Simulation of spatial distribution of land use on Hainan Island in 2040.
This study found that forests and cultivated land consistently accounted for the largest share of the area on Hainan Island, but the trends in these two land categories were reversed. Meanwhile, artificial surfaces, which accounted for the second-largest share of the area, grew by 100% compared to the previous period. Hainan Island has a total area of approximately 4,400 square kilometres of national tropical rainforest; it is the largest, most concentrated, and well-preserved area of contiguous tropical rainforests, accounting for approximately one-seventh of the land area. In 2000-2020, the area of forests always accounted for the highest ratio, which may be because, in the 1990s, the local people began to realise the serious consequences of deforestation. Thus, many cities and counties have carried out scientific afforestation and forest resource management through the establishment of nature reserves (Lin et al., 2017; Zhai et al., 2015). In the projected data for 2040, forest is still the land category with the largest share of area on Hainan Island, and it is believed that the habitat quality of Hainan Island’s forest ecosystems will continue to rise under the protection of the ecological policies of the Hainan Tropical Rainforest National Park (Chen et al., 2021). Similar to forests, which have always accounted for a larger area, there is also cultivated land, but its area has declined in the last 20 years. At the beginning of the 21st century, the national policy of returning farmland to forest and planting trees on slopes with serious soil erosion restored the forest cover and promoted ecological balance. The implementation of this policy greatly reduced the area of cultivated land and promoted the conversion of sloping cultivated land into forest land (Han et al., 2024; Huang et al., 2022; Zhang et al., 2020). Thus, in 2022, the General Office of the Hainan Provincial People’s Government published a circular on several measures to further strengthen the protection of cultivated land, strengthen the supervision of cultivated land protection and strictly abide by the red line of cultivated land protection. It is believed that, with these strong initiatives, it will be possible to achieve the expansion of the cultivated land area by 2024, as projected in this study.
In addition, with the rapid growth of the Chinese economy and the acceleration of urbanisation, the urbanisation rate in Hainan Province has been increasing, leading to an increase in the urban population and urban expansion, with an increasing demand for urban construction and infrastructure development (Gu and Wall, 2007). In order to meet the demands of urban development, Hainan Province has continued to expand the scale of construction land and enacted a series of policies and measures aimed at promoting investment and economic development, including support and guidance for the real estate industry. However, the expansion of building land has caused the serious erosion of cultivated land resources, leading to a significant reduction in the area of cultivated land, especially in economically developed cities such as Haikou and Sanya (Lu et al., 2023; Pan et al., 2024; Shu et al., 2024), where the area of artificial surfaces has shown exponential growth over this 20-year period. Of course, many factors contribute to changes in the land type.
This study used the LEAS model to investigate in depth the drivers of land use change on Hainan Island, finding that natural factors are the dominant drivers. Of all climatic factors, temperature and precipitation are the two principal determinants of the geographical distribution of vegetation (Wang et al., 2019). Changes in temperature and precipitation have a direct impact on forest productivity and the suitability of cultivated land (Gao et al., 2024). This is consistent with Ahmad et al.’s observation that climate change has long-term effects on agricultural production (Ahmad et al., 2023). Additionally, some researchers have posited that rising temperatures have a deleterious impact on crop growth (Chen et al., 2018; Roshan et al., 2014). In tropical regions such as Hainan Island, alterations in temperature and humidity are anticipated to exert a bidirectional influence on crop growth cycles and yields. In examining the interactive effects of temperature and precipitation on vegetation on Hainan Island (Dou et al., 2023), Guo et al. also concluded that vegetation on the island is affected by both temperature and precipitation (Guo et al., 2021). Additionally, studies conducted in other regions of China have demonstrated that the response of vegetation activity to temperature is more pronounced as the temperature increases (Piao et al., 2011; Urban, 2015). Over the past two decades, global warming has persisted unabated (Masson-Delmotte et al., 2019), with elevated temperatures precipitating drought stress in grassland ecosystems. This has resulted in a continued reduction in plant productivity across diverse grassland ecosystems, leading to a decline in the extent of grassland areas, a phenomenon that has also been observed in other regions (Wu et al., 2021). The impact of climate change on wetlands represents a significant focus in the study of wetland area changes (Acreman et al., 2009; Jolly et al., 2008). Wetlands are known to be highly responsive to the hydrological cycle (Bullock and Acreman, 2003). Consequently, changes in the external recharge of wetlands under changing climatic conditions may be as important as changes in direct precipitation and evaporation from the wetland itself (Woo et al., 1993). Furthermore, the vegetation within wetlands responds dramatically to subtle changes in hydrology. The study conducted by Karen et al. revealed that even a slight reduction in precipitation levels can result in wetland seedlings establishing roots more rapidly on exposed mudflats. This heightened sensitivity to hydrological shifts may have significant implications for the long-term dynamics of wetland vegetation and could potentially accelerate the loss of open wetland habitats (Poiani et al., 1995). In addition to climatic factors, the topography of Hainan Island is also a contributing factor. The island has a low-lying area around the perimeter and high elevation in the centre. This unique topographic feature is probably responsible for the observed changes in the area of bare land.
It is evident that socio-economic factors exert a significant influence on the transformation of land use types. The population dynamics of any region and the urbanisation process are inextricably linked, with the two mutually reinforcing one another. Since the construction of the International Tourism Island in 2010, Hainan Island has undergone significant urbanisation. The rapid influx of the population has driven the urban system to pursue further infrastructure development and urban expansion (Avtar et al., 2019), which in turn has prompted the relocation of the population in search of new employment opportunities and access to superior medical and educational resources. This, in turn, leads to the establishment of housing systems and the development of industry to support this population growth, resulting in the expansion of artificial surface areas. Concurrently, an augmented population can enhance the labour supply and market demand, thereby stimulating GDP growth, with then GDP allows for the allocation of greater manpower, time and economic resources to the management of water environments. Since 2010, when the Chinese Ministry of Environmental Protection published its guidelines on water environment quality, the water quality of several key lakes and reservoirs has continuously improved (Meng et al., 2015). It is also possible that GDP growth may result in the industrialisation of certain regional watersheds, accompanied by the proliferation of industrial enterprises that fail to implement effective wastewater treatment measures. In their study, Ren et al. examined the impact of regional GDP growth on water quality from a statistical perspective. Their findings indicate that rapid urbanisation is accompanied by a rapid decline in water quality, which poses a significant threat to water bodies (Xie et al., 2011).
Since the establishment of the Special Economic Zone, Hainan Province has consistently ranked among the fastest-growing regions in China. Moreover, with the steady implementation of the Free Trade Pilot Zone policies (Meng et al., 2018), the province’s economy is projected to sustain stable growth in the future. However, while fostering economic progress, it is imperative to prioritise the sustainable utilisation and conservation of land resources. Land use management policies and planning should incorporate scientifically informed and balanced strategies to achieve a synergistic relationship between economic development and ecological preservation (Boardman, 2015). Future land planning should focus on the following aspects: (1) Integrating cropland protection with ecological conservation by scientifically designing agroforestry systems, fostering coordination between cropland preservation and vegetation restoration, optimising the structure of crop planting, and enhancing fertiliser management (Batjes, 2006). These strategies are essential to achieving sustainable agricultural development (Liu et al., 2020; Yu et al., 2021). (2) Prioritising the conservation of forested areas in ecologically sensitive regions, especially in low-altitude zones, as well as grasslands with high vegetation coverage, to increase carbon sequestration in terrestrial ecosystems and bolster their overall stability (Batjes, 2016; Li et al., 2017). (3) Encouraging the efficient and intens utilisation of land designated for construction to prevent the excessive exploitation and fragmentation of land resources, while optimising urban spatial layouts. To ensure that construction activities are consistent with ecological conservation objectives, large-scale infrastructure development should be strictly prohibited in ecologically sensitive areas (Romero-Blanco et al., 2023; Zarrinabadi et al., 2023). Moreover, as Hainan Island is surrounded by the sea, its land use is intrinsically linked to the development of marine resources. It is recommended to strengthen integrated terrestrial and marine ecosystem management, implement comprehensive coastal zone policies, and establish coastal wetland reserves to limit the unregulated expansion of artificial surfaces in coastal regions. Furthermore, proactive efforts should be directed towards promoting the blue economy, with priority given to eco-friendly industries such as marine tourism, fisheries, and renewable energy, thereby alleviating the pressure on terrestrial land resources. These strategies aim to facilitate the coordinated management of land and marine resources, offering scientific foundations for advancing the National Ecological Civilization Pilot Zone and the China Free Trade Port initiatives.
This study successfully employed the PLUS model to simulate the spatiotemporal dynamics of multiple land use types with a high degree of precision, providing valuable insights into the driving mechanisms behind land use changes. By integrating a multi-objective optimisation algorithm, this approach improved the robustness of the simulation results, offering robust scientific evidence to support planning and policy-making. However, this study does not adequately consider the interactions among driving factors in the analysis, which may limit a comprehensive understanding of the mechanisms underlying land use changes. As a result, this limitation may partially compromise the accuracy of the simulation results. Future research should further investigate the relative contributions and complex interdependencies of different driving factors during land use transformations, thereby advancing insights into the driving mechanisms. In addition, the parameter settings of the model are reliant to some extent on the researcher’s subjective judgement, which may introduce potential subjectivity or bias, thereby compromising the robustness and generalizability of the predictions. To address this limitation, future studies should incorporate multi-scenario simulation analyses and multi-model comparison approaches to further improve the accuracy and practical applicability of predictive outcomes. This will provide more robust theoretical support for land resource management.
From 2000 to 2020, the primary land use types in Hainan Island were forests and cultivated land, despite a decline in their total areas. Grassland areas continued to decrease, whereas wetlands, water bodies, and artificial surfaces showed significant growth. This study revealed that changes in cultivated land, forests, and grasslands were largely determined by temperature, wetlands were influenced by precipitation, water bodies were associated with GDP, the expansion of artificial surfaces was primarily attributed to population growth, and bare land was affected by the DEM. Based on PLUS model projections, by 2040, croplands and forests are projected to remain the dominant land use types on Hainan Island, with increases in artificial surfaces and wetlands, while grasslands are expected to continue declining. Considering the significant influence of policy on land use changes, it is recommended to strengthen the protection of croplands and forests, facilitate the restoration of grasslands and wetlands, optimise the management of construction land, and foster the sustainable development of the blue economy. These efforts are intended to achieve a balance between economic development and ecological conservation, supporting the establishment of the National Ecological Civilization Pilot Zone and the Free Trade Port.
The raw data supporting the conclusions of this article will be made available by the authors, without undue reservation.
JL: Methodology, Software, Writing – original draft. YH: Methodology, Validation, Writing – original draft. FL: Formal analysis, Validation, Writing – review & editing. BZ: Investigation, Resources, Writing – review & editing. ZC: Data curation, Writing – review & editing. FZ: Visualization, Writing – review & editing. XZ: Conceptualization, Supervision, Writing – review & editing. RY: Conceptualization, Writing – review & editing.
The author(s) declare financial support was received for the research, authorship, and/or publication of this article. This research was supported by the (1) Pilot Survey of Typical Coastal Zone Surface Substrate in Hainan(Grant No. DD20242618) and the (2) Hainan Provincial Natural Science Foundation of China(Grant No.424MS116).
Thanks for the reviewers for their valuable feedback on the manuscript.
The authors declare that the research was conducted in the absence of any commercial or financial relationships that could be construed as a potential conflict of interest.
The author(s) declare that no Generative AI was used in the creation of this manuscript.
All claims expressed in this article are solely those of the authors and do not necessarily represent those of their affiliated organizations, or those of the publisher, the editors and the reviewers. Any product that may be evaluated in this article, or claim that may be made by its manufacturer, is not guaranteed or endorsed by the publisher.
Acreman M., Blake J., Booker D., Harding R., Reynard N., Mountford J., et al. (2009). A simple framework for evaluating regional wetland ecohydrological response to climate change with case studies from great britain. Ecohydrology: Ecosystems Land Water Process Interactions Ecohydrogeomorphology. 2, 1–17. doi: 10.1002/eco.v2:1
Ahmad N., Younas F., Ahmad H. R., Sarfraz M., Ayub M. A., Maqsood M. A., et al. (2023). Soybean (glycine max) cropland suitability analysis in subtropical desert climate through gis-based multicriteria analysis and sentinel-2 multispectral imaging. Land 12, 2034. doi: 10.3390/land12112034
Avtar R., Tripathi S., Aggarwal A. K., Kumar P. (2019). Population–urbanization–energy nexus: A review. Resources 8, 136. doi: 10.3390/resources8030136
Batjes N. H. (2006). Soil carbon stocks of Jordan and projected changes upon improved management of croplands. Geoderma 132, 361–371. doi: 10.1016/j.geoderma.2005.05.013
Batjes N. H. (2016). Harmonized soil property values for broad-scale modelling (wise30sec) with estimates of global soil carbon stocks. Geoderma 269, 61–68. doi: 10.1016/j.geoderma.2016.01.034
Boardman J. (2015). Extreme rainfall and its impact on cultivated landscapes with particular reference to britain. Earth Surface Processes Landforms. 40, 2121–2130. doi: 10.1002/esp.v40.15
Bullock A., Acreman M. (2003). The role of wetlands in the hydrological cycle. Hydrology Earth System Sci. 7, 358–389. doi: 10.5194/hess-7-358-2003
Cao M., Tang Ga, Shen Q., Wang Y. (2015). A new discovery of transition rules for cellular automata by using cuckoo search algorithm. Int. J. Geographical Inf. Science. 29, 806–824. doi: 10.1080/13658816.2014.999245
Chen Z.-Z., Lei J.-R., Wu T.-T., Chen D.-X., Zhou Z., Li Y.-L., et al. (2021). Gross ecosystem product accounting of national park: Taking hainan tropical rainforest national park as an example. Ying Yong Sheng tai xue bao= J. Appl. Ecology. 32, 3883–3892. doi: 10.13287/j.1001-9332.202111.010
Chen Y., Zhang Z., Tao F., Palosuo T., Rötter R. P. (2018). Impacts of heat stress on leaf area index and growth duration of winter wheat in the north China plain. Field Crops Res. 222, 230–237. doi: 10.1016/j.fcr.2017.06.007
Comarazamy D. E., González J. E., Luvall J. C., Rickman D. L., Bornstein R. D. (2013). Climate impacts of land-cover and land-use changes in tropical islands under conditions of global climate change. J. Climate. 26, 1535–1550. doi: 10.1175/JCLI-D-12-00087.1
Dang A. N., Kawasaki A. (2017). Integrating biophysical and socio-economic factors for land-use and land-cover change projection in agricultural economic regions. Ecol. Modelling. 344, 29–37. doi: 10.1016/j.ecolmodel.2016.11.004
da Silva Cruz J., Blanco C. J. C., de Oliveira Júnior J. F. (2022). Modeling of land use and land cover change dynamics for future projection of the amazon number curve. Sci. total environment. 811, 152348. doi: 10.1016/j.scitotenv.2021.152348
Dou X., Guo H., Zhang L., Liang D., Zhu Q., Liu X., et al. (2023). Dynamic landscapes and the influence of human activities in the yellow river delta wetland region. Sci. Total Environment. 899, 166239. doi: 10.1016/j.scitotenv.2023.166239
Engelen G., White R., van der Meulen M., Hahn B. (2002). Sustainable developments of islands: A policy support framework for the integrated assessment of socioeconomic and environmental development. Sustain. Dev. island societies: Taiwan world. 251, 251–287.
Fan S., Cheng C., Liu Y., Zhang H., Yu R. (2017). Review and prospect on land use/cover research in China. Areal Res. Dev. 32, 94–101. doi: 10.3969/j.issn.1003-2363.2017.02.018
Fu T., Zhang L., Chen B., Yan M. (2022). Human disturbance on the land surface environment in tropical islands: A remote sensing perspective. Remote Sensing. 14, 2100. doi: 10.3390/rs14092100
Gao H., Gong J., Ye T., Maier M., Liu J. (2024). Constructing cropland ecological stability assessment method based on disturbance-resistance-response processes and classifying cropland ecological types. Sci. Total Environment. 930, 172673. doi: 10.1016/j.scitotenv.2024.172673
Gong Y., Li J., Li Y. (2020). Spatiotemporal characteristics and driving mechanisms of arable land in the beijing-tianjin-hebei region during 1990-2015. Socio-Economic Plann. Sci. 70, 100720. doi: 10.1016/j.seps.2019.06.005
Gu K., Wall G. (2007). Rapid urbanization in a transitional economy in China: The case of hainan island. Singapore J. Trop. Geography. 28, 158–170. doi: 10.1111/j.1467-9493.2007.00288.x
Guo P., Zhao X., Shi J., Huang J., Tang J., Zhang R., et al. (2021). The influence of temperature and precipitation on the vegetation dynamics of the tropical island of hainan. Theor. Appl. Climatology. 143, 429–445. doi: 10.1007/s00704-020-03430-x
Han N., Yu M., Jia P., Zhang Y., Hu K. (2024). Influence of human activity intensity on habitat quality in hainan tropical rainforest national park, China. Chin. Geographical Science. 34, 519–532. doi: 10.1007/s11769-024-1423-z
Huang X., Liu Y., Cong Y., Zhang Y., Zhao X., Huang L., et al. (2022). Soil moisture stability of rangeland is higher than that of woodland and cropland in the loess plateau, China. Ecol. Indicators. 144, 109543. doi: 10.1016/j.ecolind.2022.109543
Jolly I. D., McEwan K. L., Holland K. L. (2008). A review of groundwater–surface water interactions in arid/semi-arid wetlands and the consequences of salinity for wetland ecology. Ecohydrology: Ecosystems Land Water Process Interactions Ecohydrogeomorphology. 1, 43–58. doi: 10.1002/eco.v1:1
Kalkuhl M., Edenhofer O. (2017). Ramsey meets thünen: The impact of land taxes on economic development and land conservation. Int. Tax Public Finance. 24, 350–380. doi: 10.1007/s10797-016-9403-6
Kiat P. E., Malek M., Shamsuddin S. (2020). Net carbon stocks change in biomass from wood removal of tropical forests in sarawak, Malaysia. J. King Saud University-Science. 32, 1096–1099. doi: 10.1016/j.jksus.2019.09.012
Li Y., Liu G. (2017). Characterizing spatiotemporal pattern of land use change and its driving force based on gis and landscape analysis techniques in tianjin during 2000–2015. Sustainability 9, 894. doi: 10.3390/su9060894
Li Y., Shu B., Shi X., Zhu Y. (2017). Variation of land-expropriated farmers’ willingness: A perspective of employment and inhabitance. Sustainability 9, 1083. doi: 10.3390/su9071083
Li C., Yang M., Li Z., Wang B. (2021). How will Rwandan land use/land cover change under high population pressure and changing climate? Appl. Sci. 11 5376.
Liang X., Guan Q., Clarke K. C., Liu S., Wang B., Yao Y. (2021). Understanding the drivers of sustainable land expansion using a patch-generating land use simulation (plus) model: A case study in wuhan, China. Computers Environ. Urban Systems. 85, 101569. doi: 10.1016/j.compenvurbsys.2020.101569
Lin S., Jiang Y., He J., Ma G., Xu Y., Jiang H. (2017). Changes in the spatial and temporal pattern of natural forest cover on hainan island from the 1950s to the 2010s: Implications for natural forest conservation and management. PeerJ 5, e3320. doi: 10.7717/peerj.3320
Liu L., Di B., Zhang M. (2020). The tradeoff between ecological protection and economic growth in China’s county development: Evidence from the soil and water conservation projects during 2011–2015. Resources Conserv. Recycling. 156, 104745. doi: 10.1016/j.resconrec.2020.104745
Liu X., Liang X., Li X., Xu X., Ou J., Chen Y., et al. (2017). A future land use simulation model (flus) for simulating multiple land use scenarios by coupling human and natural effects. Landscape urban planning. 168, 94–116. doi: 10.1016/j.landurbplan.2017.09.019
Lu Y., He T., Yue W., Li M., Shan Z., Zhang M. (2023). Does cropland threaten urban land use efficiency in the peri-urban area? Evidence from metropolitan areas in China. Appl. Geography. 161, 103124. doi: 10.1016/j.apgeog.2023.103124
Luo H., Dai S., Liu E., Xie Z., Li M. (2018). Spatio⁃ temporal variable vegetation on hainan island during 2001-2014. Res. Soil Water Conserv. 25, 343–350. doi: CNKI:SUN:STBY.0.2018-05-055
Masson-Delmotte V., Zhai P., Pörtner H.-O., Roberts D., Skea J., Shukla P. R., et al. (2019). Global warming of 1.5 c. IPCC Special Rep. impacts Global warming of. 1, 93–174.
Meentemeyer R. K., Tang W., Dorning M. A., Vogler J. B., Cunniffe N. J., Shoemaker D. A. (2013). Futures: Multilevel simulations of emerging urban–rural landscape structure using a stochastic patch-growing algorithm. Ann. Assoc. Am. Geographers. 103, 785–807. doi: 10.1080/00045608.2012.707591
Meng G., Yang K., Zhu F., Mao Y., Zeng Z., Dong X. (2018). Hainan of China: The evolution from a special economic zone to a comprehensive and compound free trade port. Geographical Res. 37, 2363–2382. doi: 10.11821/dlyj201812001
Meng X., Zhang Y., Yu X., Zhan J., Chai Y., Critto A., et al. (2015). Analysis of the temporal and spatial distribution of lake and reservoir water quality in China and changes in its relationship with gdp from 2005 to 2010. Sustainability 7, 2000–2027. doi: 10.3390/su7022000
Pan S., Liang J., Chen W., Peng Y. (2024). Uphill or downhill? Cropland use change and its drivers from the perspective of slope spectrum. J. Mountain Science. 21, 484–499. doi: 10.1007/s11629-023-8184-5
Peng J., Zhao M., Guo X., Pan Y., Liu Y. (2017). Spatial-temporal dynamics and associated driving forces of urban ecological land: A case study in shenzhen city, China. Habitat Int. 60, 81–90. doi: 10.1016/j.habitatint.2016.12.005
Piao S., Wang X., Ciais P., Zhu B., Wang T., Liu J. (2011). Changes in satellite-derived vegetation growth trend in temperate and boreal eurasia from 1982 to 2006. Global Change Biol. 17, 3228–3239. doi: 10.1111/j.1365-2486.2011.02419.x
Poiani K. A., Johnson W. C., Kittel T. G. (1995). Sensitivity of a prairie wetland to increased temperature and seasonal precipitation changes 1. JAWRA J. Am. Water Resour. Assoc. 31, 283–294. doi: 10.1111/j.1752-1688.1995.tb03380.x
Romero-Blanco A., Castro-Díez P., Lázaro-Lobo A., Molina-Venegas R., Cruces P., Pyšek P. (2023). Searching for predictors of the variability of impacts caused by non-native trees on regulating ecosystem services worldwide. Sci. Total Environment. 877, 162961. doi: 10.1016/j.scitotenv.2023.162961
Roshan G., Oji R., Al-Yahyai S. (2014). Impact of climate change on the wheat-growing season over Iran. Arabian J. Geosciences. 7, 3217–3226. doi: 10.1007/s12517-013-0917-2
Selmants P. C., Sleeter B. M., Liu J., Wilson T. S., Trauernicht C., Frazier A. G., et al. (2021). Ecosystem carbon balance in the hawaiian islands under different scenarios of future climate and land use change. Environ. Res. Letters. 16, 104020. doi: 10.1088/1748-9326/ac2347
Shu R., Wang Z., Guo N., Wei M., Zou Y., Hou K. (2024). Multi-scenario land use optimization simulation and ecosystem service value estimation based on fine-scale land survey data. Land 13, 557. doi: 10.3390/land13040557
Sohl T. L., Claggett P. R. (2013). Clarity versus complexity: Land-use modeling as a practical tool for decision-makers. J. Environ. management. 129, 235–243. doi: 10.1016/j.jenvman.2013.07.027
Tasser E., Leitinger G., Tappeiner U. (2017). Climate change versus land-use change—what affects the mountain landscapes more? Land Use policy. 60, 60–72. doi: 10.1016/j.landusepol.2016.10.019
Tso C. (1996). A survey of urban heat island studies in two tropical cities. Atmospheric environment. 30, 507–519. doi: 10.1016/1352-2310(95)00083-6
Turner B. L., Skole D., Sanderson S., Fischer G., Fresco L., Leemans R. (1995). Land-use and land-cover change: Science/research plan. Sweden: Global Change Report. 43 (1995), 669–679. doi: 10.1177/001872679104401105
Urban M. C. (2015). Accelerating extinction risk from climate change. Science 348, 571–573. doi: 10.1126/science.aaa4984
Velazquez-Lozada A., Gonzalez J. E., Winter A. (2006). Urban heat island effect analysis for san juan, Puerto Rico. Atmospheric environment. 40, 1731–1741. doi: 10.1016/j.atmosenv.2005.09.074
Verburg P. H., Soepboer W., Veldkamp A., Limpiada R., Espaldon V., Mastura S. S. (2002). Modeling the spatial dynamics of regional land use: The clue-s model. Environ. management. 30, 391–405. doi: 10.1007/s00267-002-2630-x
Wang J., Chen Y., Shao X., Zhang Y., Cao Y. (2012). Land-use changes and policy dimension driving forces in China: Present, trend and future. Land Use policy. 29, 737–749. doi: 10.1016/j.landusepol.2011.11.010
Wang Z.-M., Ye W., Xing F.-W. (2019). Bryophyte diversity on a tropical continental island (hainan, China): Potential vulnerable species and environmental indicators. J. Bryology. 41, 350–360. doi: 10.1080/03736687.2019.1653557
Woo M.-K., Rowsell R. D., Clark R. G. (1993). “Hydrological classification of canadian prairie wetlands and prediction of wetland inundation in response to climatic variability,” in Hydrological classification of canadian prairie wetlands and prediction of wetland inundation in response to climatic variability (Canadian Wildlife Service, Ottawa).
Wu G. L., Cheng Z., Alatalo J. M., Zhao J., Liu Y. (2021). Climate warming consistently reduces grassland ecosystem productivity. Earth’s Future. 9, e2020EF001837. doi: 10.1029/2020EF001837
Wu X., Wang S., Fu B., Liu Y., Zhu Y. (2018). Land use optimization based on ecosystem service assessment: A case study in the yanhe watershed. Land Use policy. 72, 303–312. doi: 10.1016/j.landusepol.2018.01.003
Xie G., Zhang J., Tang X., Cai Y., Gao G. (2011). Spatio-temporal heterogeneity of water quality(2010-2011) and succession patterns in lake bosten during the past 50 years. J. lake Sci. 23, 837–846. doi: 10.18307/2011.0603
Yang J., Gong J., Tang W., Liu C. (2020). Patch-based cellular automata model of urban growth simulation: Integrating feedback between quantitative composition and spatial configuration. Computers Environ. Urban Systems. 79, 101402. doi: 10.1016/j.compenvurbsys.2019.101402
Yu S., Wang L., Zhao J., Shi Z. (2021). Using structural equation modelling to identify regional socio-economic driving forces of soil erosion: A case study of jiangxi province, southern China. J. Environ. Management. 279, 111616. doi: 10.1016/j.jenvman.2020.111616
Zarrinabadi E., Lobb D. A., Enanga E., Badiou P., Creed I. F. (2023). Agricultural activities lead to sediment infilling of wetlandscapes in the canadian prairies: Assessment of soil erosion and sedimentation fluxes. Geoderma 436, 116525. doi: 10.1016/j.geoderma.2023.116525
Zhai D.-L., Cannon C. H., Dai Z.-C., Zhang C.-P., Xu J.-C. (2015). Deforestation and fragmentation of natural forests in the upper changhua watershed, hainan, China: Implications for biodiversity conservation. Environ. Monit. assessment. 187, 1–12. doi: 10.1007/s10661-014-4137-3
Zhai H., Lv C., Liu W., Yang C., Fan D., Wang Z., et al. (2021). Understanding spatio-temporal patterns of land use/land cover change under urbanization in wuhan, China 2000–2019. Remote Sensing. 13, 3331. doi: 10.3390/rs13163331
Zhang Y., Yuan J., You C., Cao R., Tan B., Li H., et al. (2020). Contributions of national key forestry ecology projects to the forest vegetation carbon storage in China. For. Ecol. Management. 462, 117981. doi: 10.1016/j.foreco.2020.117981
Keywords: Hainan Island, land use change, natural factors, socio-economic factors, PLUS model
Citation: Liu J, Hou Y, Li F, Zheng B, Chen Z, Zheng F, Zhang X and Yu R (2025) Land use change projection and driving factors exploration in Hainan Island based on the PLUS model. Front. Mar. Sci. 12:1534508. doi: 10.3389/fmars.2025.1534508
Received: 26 November 2024; Accepted: 03 February 2025;
Published: 21 February 2025.
Edited by:
Dewen Liu, Nanjing University of Posts and Telecommunications, ChinaCopyright © 2025 Liu, Hou, Li, Zheng, Chen, Zheng, Zhang and Yu. This is an open-access article distributed under the terms of the Creative Commons Attribution License (CC BY). The use, distribution or reproduction in other forums is permitted, provided the original author(s) and the copyright owner(s) are credited and that the original publication in this journal is cited, in accordance with accepted academic practice. No use, distribution or reproduction is permitted which does not comply with these terms.
*Correspondence: Xiaohai Zhang, emhhbmd4aWFvaGFpQG1haWwuY2dzLmdvdi5jbg==; Rui Yu, eXVyQG91dGxvb2suY29t
†These authors share first authorship
Disclaimer: All claims expressed in this article are solely those of the authors and do not necessarily represent those of their affiliated organizations, or those of the publisher, the editors and the reviewers. Any product that may be evaluated in this article or claim that may be made by its manufacturer is not guaranteed or endorsed by the publisher.
Research integrity at Frontiers
Learn more about the work of our research integrity team to safeguard the quality of each article we publish.