 Yunfei Du
 Daidu Fan
 Jicai Zhang
95% of researchers rate our articles as excellent or good
Learn more about the work of our research integrity team to safeguard the quality of each article we publish.
Find out more
ORIGINAL RESEARCH article
Front. Mar. Sci. , 03 February 2025
Sec. Physical Oceanography
Volume 12 - 2025 | https://doi.org/10.3389/fmars.2025.1530555
The turbidity front is susceptible to rapid changes in ocean hydrodynamics. Understanding its variability is crucial for elucidating material transport on continental shelves in light of evolving land-ocean interactions. However, the long-term frontal variability and its controlling mechanism over the shelf sea scale still need further study. Using a decade of satellite observations, this study assesses the interannual variability of turbidity fronts in the Eastern China Seas and their responses to local processes and rapid ocean warming. A gradient-based front detection algorithm and frontal probability are used to identify the geographical locations of turbidity fronts and their variability at the interannual scale, respectively. Regional heterogeneities in interannual variations and controlling mechanisms of frontal activity are observed. Specifically, the significant (p<0.05) and strongest correlations show that wind wave, horizontal temperature gradient, and mixed layer depth are identified as the most important drivers of interannual variations in frontal activity in the Bohai, Yellow, and East China Seas, respectively. The El Niño-Southern Oscillation influences frontal anomalies through a delayed wind-response mechanism (>=4 months). Notably, the recent increase in frontal probability (+0.07%/year) in offshore areas of the Yellow and East China Seas is primarily attributed to an intensified horizontal temperature (density) gradient (+0.0005 °C/km/year) resulting from ocean warming. As ocean warming continues, the offshore transport of terrigenous materials is expected to increase, potentially enhancing ocean primary productivity and carbon sequestration, and altering ecosystem function and fisheries.
Turbidity fronts are prevalent in estuaries (Li et al., 2021), coastal waters (Kirches et al., 2016), and shallow shelf seas (Hu et al., 2016) because of strong hydrodynamic forces and adequate sediment supply therein. They have long been known to not only significantly change the physical, chemical, and biological properties of water bodies (Bowden, 1963; Kirby and Parker, 1982), but also influence marine ecosystems and fisheries by modulating the offshore transport and dispersion of terrigenous sediments, pollutants, and organic carbon (Liu et al., 2022). Turbidity fronts play an important role in regulating oceanic primary production and associated biogeochemical processes by aggregating particulate organic matter and/or phytoplankton (Acha et al., 2008; Pan et al., 2020), thus offering the potential for delineating the boundaries of large oceanic ecosystems (Acha et al., 2008; Ge et al., 2020; Liu et al., 2022). The presence of turbidity fronts has been demonstrated to affect the formation of fishing grounds (Grimes and Finucane, 1991; Hu et al., 2016; Wei et al., 2020) as well as the survival, reproduction, and abundance of fish communities (Acha et al., 2008; Derisio et al., 2014; Jaureguizar et al., 2003; Kingsford and Suthers, 1994). Therefore, a thorough investigation of the variability of turbidity fronts and their response to various driving factors is crucial for understanding and predicting future changes in the oceanic material cycle and primary productivity.
Turbidity fronts were first studied by field observations (Bowden, 1963; Kirby and Parker, 1982; Silverberg and Sundby, 1979; Wells and Huh, 1984), and then increasingly investigated by the remote sensing method (Du et al., 2023b; Framinan and Brown, 1996; Hu et al., 2016; Maciel et al., 2021; Miller, 2004; Shen et al., 2010). Satellite imagery offers the advantage of wide-coverage and long-term data, making it a powerful tool for studying the spatiotemporal variability of turbidity fronts. Early satellites such as Landsat were mainly used to qualitatively describe the spatial morphology of turbidity fronts or to guide the field sampling in the frontal region through visual interpretation (Lefevre et al., 1983). In the late 1990s, Framinan and Brown (1996) for the first time quantitatively described the spatial structure of the turbidity front in the Rio de la Plata Estuary by using daily AVHRR images from 1986 to 1990, and quantified seasonal and annual variations by calculating frontal density. Subsequently, Nagy et al. (2008) analyzed the relationship between turbidity front position changes and factors such as river discharge, wind field, and El Niño-Southern Oscillation (ENSO) in the estuary using daily SeaWiFS images from 2000 to 2003. In recent years, Maciel et al. (2021) further evaluated the turbidity front dynamics of this estuary by combining MODIS-Aqua remote sensing images with in-situ measurements and numerical simulations. Overall, the advancement of water-color satellites like GOCI and MODIS in the past two decades has greatly promoted the study of multiscale spatiotemporal variability of turbidity fronts (He et al., 2016; Kirches et al., 2016; Miller, 2004; Zhou et al., 2020). Meanwhile, a variety of frontal detection algorithms have been developed (e.g., gradient algorithms, histogram algorithms, and entropy algorithms), making the characterization of the spatial structure of turbidity fronts increasingly precise (Du et al., 2022; Hafeez et al., 2021; Hu et al., 2016; Miller, 2004). However, each algorithm has its own set of advantages and disadvantages. For example, the Sobel gradient method is simple to operate but highly sensitive to noise. The histogram-based method is well-suited for open sea applications but lacks completeness in extracting front information in nearshore waters. The gradient-based front detection algorithm, specifically, the Canny algorithm, is less sensitive to noise and excels at recognizing front information in coastal waters. Therefore, this algorithm is recommended to study coastal front processes (Du et al., 2022; Wall et al., 2008; Wang et al., 2021; Xing et al., 2023).
Satellite observations have revealed that turbidity fronts are widely distributed in high turbidity shelf seas (Kirches et al., 2016; Miller, 2004; Wells and Huh, 1984), as their formations require a sufficiently large background suspended sediment concentration (SSC) (Hu et al., 2016; Wei et al., 2020; Wells and Huh, 1984). They exhibit diverse spatial structures, such as linear, convex, V-shaped, Z-shaped, wavy, jagged, eddy, hammer, and finger-like patterns (Framinan and Brown, 1996; Yin and Huang, 2016), and display multi-level spatial distributions (Nagy et al., 2008; Zhou et al., 2020). Their locations, structures, and intensities show strong dynamic variability across various time scales, ranging from hourly (and even shorter timescales) to interannual, with driving mechanisms that also vary considerably (Maciel et al., 2021; Ramaswamy et al., 2004; Wang et al., 2023b; Yin and Huang, 2016). In particular, several region-specific case studies have shown that the interannual variability of turbidity fronts was influenced by large-scale climate events associated with ENSO, which could regulate river discharge, ocean temperature, wind field, and circulation (Du et al., 2023b; Maciel et al., 2021; Nagy et al., 2008; Romero-Rodriguez et al., 2020). In summary, the significant local differences in the variation processes of turbidity fronts greatly limit our understanding of their driving mechanisms and hinder the development of universal models for simulating and predicting turbidity front variations. Therefore, there is an urgent need to study the long-term changes of turbidity fronts in highly turbid sea areas under the combined influences of river inputs, ocean dynamics, and climatic events.
The Eastern China Seas, including the Bohai, Yellow, and East China Seas, are significant shelf sea areas characterized by the complex interplay of physical and ecological processes with global implications. The occurrence frequency of turbidity fronts is comparable to other ocean fronts like temperature fronts and chlorophyll fronts, although their locations are often inconsistent (Chen et al., 2020; Xia et al., 2021; Xing et al., 2023; Zhao et al., 2022). Several case studies have effectively investigated the strong seasonality and interannual anomalies of turbidity fronts and their underlying causes in localized areas of the Eastern China Seas (e.g., the Zhejiang-Fujian coast, the Yangtze Bank, and the coast of Shandong Peninsula) (Du et al., 2023b, 2022; Ge et al., 2020; Liu and Wang, 2019; Luo et al., 2017; Wu et al., 2016). However, the spatial scope of these studies is relatively limited, and all coastal waters surrounding the Eastern China Seas are not comprehensively covered. Consequently, there is a lack of systematic examination of the long-term variations of turbidity fronts at the shelf sea scale, which hampers adequate and consistent comparisons of regional heterogeneity. In particular, the characteristics and causes of long-term variability of turbidity fronts in historically under-sampled waters remain poorly understood. Moreover, compared to other shelf seas, the Eastern China Seas are experiencing a rapid warming of ocean temperatures (Wang et al., 2023a). For instance, it is one of the regions with the fastest sea surface temperature (SST) rise among 63 large ocean ecosystems in the world (Belkin, 2009) as well as one of three large ocean ecosystems with “super-fast” warming (Qi et al., 2022). This rapid ocean warming is accompanied by a series of unprecedented secondary ocean dynamic changes, such as increased temperature gradient (Shi et al., 2023b), rising sea level (Fang et al., 2020), and fluctuation in circulation strength (Chen et al., 2019). Notably, over the past two decades, climate warming has led to the continuous strengthening and warming of the Kuroshio Current and its branches (Chen et al., 2019), resulting in increased offshore material transport of material in the Yellow and East China Seas (Shi et al., 2023b). However, no studies have fully assessed the intrinsic links between ocean warming and interannual trends in frontal activity in the Eastern China Seas, nor have they revealed the underlying mechanisms. As a result, the specific impact of recent rapid ocean warming on the interannual variability and trends of turbidity fronts remains unclear, in particular due to a lack of quantified evidence. All of these uncertainties drive the motivation for this study.
To address this, we utilize a decade-long and consistent dataset from the GOCI satellite, which offers high spatiotemporal resolution (500 m, 1 hour), to investigate possible links of frontal activity to local processes and ocean warming quantitatively and objectively in the Eastern China Seas. The dataset spans from April 2011 to March 2021, encompassing a decade, and its validity has been affirmed in previous studies (Du et al., 2022; Yin and Huang, 2016). The main contributions of this study are as follows: (1) We employ a gradient-based front detection algorithm (Canny algorithm) to process 10 years of GOCI-derived SSC images, generating a fine-scale digital atlas of turbidity fronts in the Eastern China Seas; (2) Combined this dataset with other satellite observations and reanalysis data, we elucidate the interannual variation of turbidity front and the regional heterogeneity of its dynamic mechanism; (3) We establish an intrinsic link between the interannual intensification of frontal activity and rapid ocean warming in recent years. The identified long-term variability and trends in frontal activity will help predict how the ocean responds to future climate change.
To unravel the long-term variability of turbidity fronts and their response to local processes and ocean warming, pertinent satellite ocean color, reanalysis, and climate data were obtained and meticulously analyzed. Specifically, we utilized GOCI-derived Level-2 SSC data, released by the Korea Ocean Satellite Center, to extract turbidity fronts (http://kosc.kiost.ac.kr). Unless otherwise noted, the time coverage of the remaining datasets utilized in this study aligns with that of the SSC dataset. Wind speed, significant wave height, and net heat flux data were extracted from the monthly ECMWF ERA5 reanalysis data with a spatial resolution of 1/4°×1/4° (https://www.ecmwf.int). Daily SST data were sourced from the National Aeronautics and Space Administration Jet Propulsion Laboratory (https://podaac.jpl.nasa.gov). This dataset offers global gap-free gridded SST data with a spatial resolution of about 1 km, which is composed of multiple secondary satellite SST data collections (Chin et al., 2017). The SST data were further employed to calculate SST gradients. Monthly mean reanalysis products of mixing layer depth spanning April 2011-December 2020 were procured from the Copernicus Ocean Environmental Monitoring Service (https://data.ocean.copernicus.eu). This product has a spatial resolution of 1/12° and is vertically divided into 50 layers (Lellouche et al., 2018). Previous studies validated the applicability of this data product in the Eastern China Seas (Huang et al., 2016; Liu et al., 2023; Wu et al., 2019). Monthly water and sediment discharge data of the Changjiang River at Datong Station were derived from the China River Sediment Bulletin (http://www.mwr.gov.cn). Monthly averaged multivariate ENSO index (MEI) and Pacific decadal oscillation (PDO) index for April 2010-March 2022 were provided by the National Oceanic and Atmospheric Administration (https://psl.noaa.gov). Monthly sea surface partial pressure of CO2 (pCO2) from April 2011 to December 2019, with a spatial resolution of 4 km, was obtained from MODIS-Aqua satellite data. These data were derived by using a pCO2 algorithm combining semi-mechanical and machine-learning methods (https://doi.org/10.5281/zenodo.7701112). A detailed description of the pCO2 data and algorithm can be found in Yu et al. (2023). The bathymetry data were released by the British Oceanographic Data Center (https://www.gebco.net).
The geographic locations of turbidity fronts were determined using a gradient-based front detection algorithm. The execution of this algorithm was based on a programmed 4-step process, including data noise reduction, gradient calculation, non-maximum suppression, and tracking edges by hysteresis thresholds. Initially, the satellite-derived SSC image underwent a 3 × 3 pixel median filter process to eliminate noise interference. Subsequently, the amplitude of the SSC gradient was calculated. Following Du et al. (2022), the turbidity front was designated at the pixel level based on the SSC gradient. In brief, pixels exhibiting SSC gradient amplitudes surpassing a predefined threshold (T1 = 4.4 mg/L/km) were designated as frontal pixels. The algorithm then tracked the front crest, labeling pixels as frontal pixels until gradient amplitudes fell below a lower threshold (T2 = 2.2 mg/L/km) (Du et al., 2023b, 2022). The threshold can be defined by the user based on different satellite data sources. Their reasonable value depends on the noise level of the satellite sensor, different parameters, atmospheric correction and SSC inversion methods, etc.
We calculated frontal probability to explore the spatial pattern and statistical characteristics of frontal activity at monthly to interannual scales. For each pixel, frontal probability (FP) is defined as the ratio of the number of times that pixel is identified as a turbidity front (Nfront) to the number of times it is observed in the corresponding time window (NSSC). Grid pixels with less than three days of data (24 valid data) were excluded from the frontal probability calculation. The frontal probability was calculated as follows:
We also calculated the SST gradient and turbulent kinetic energy (TKERT) to analyze their relationship with the variability of frontal activity. The Sobel method was used to calculate the SST gradient amplitude (GM) in units of °C/km. Firstly, the gradients and for each grid pixel were calculated separately in the x and y directions. And then we got GM by vector synthesis:
TKERT is used to quantitatively characterize the stability of the water column, with higher TKERT indicating decreased water stability (Shi et al., 2017; Stramska, 2005). It was calculated as follows:
where MLD represents the mixed layer depth, H0 represents the net heat flux (downwards direction was regarded as positive), denotes the wind-induced friction velocity, represents the specific heat, g is the gravitational acceleration, is the water density, and is the coefficient of logarithmic expansion of as a function of sea temperature. Parameter values were given according to previous studies (Liu et al., 2023; Lv et al., 2022; Shi et al., 2017).
For each month, the monthly anomalies of frontal probability and environmental factors listed in Table 1 were calculated by subtracting the corresponding climatological monthly mean values from the actual monthly mean values, as follows:
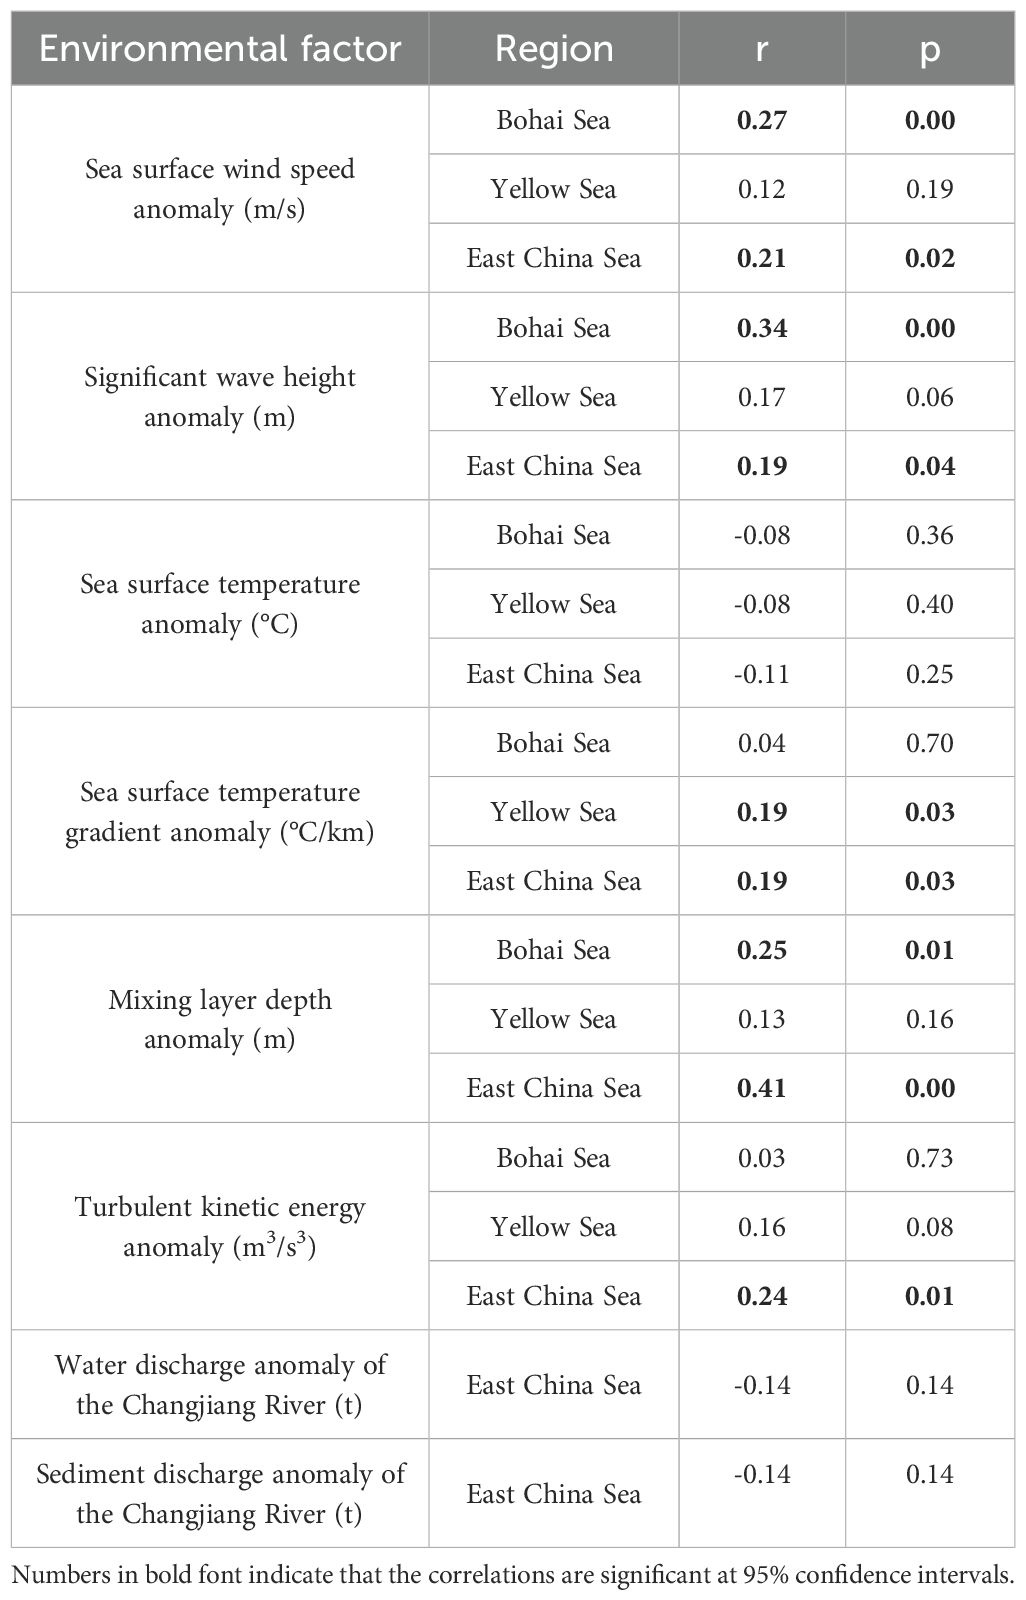
Table 1. Correlation coefficients between frontal probability anomalies and environmental factor anomalies in the Bohai, Yellow, and East China Seas.
where Xa(i) denotes the monthly anomalies of frontal probability and environmental factors for month i, Xm(i) indicates their climatological monthly mean values, and X(i) represents their monthly mean values for month i.
We used the MATLAB function “regress” to statistically analyze the interannual trends in frontal activity and environmental factors. Meanwhile, the MATLAB function “corrcoef” was used to calculate the Pearson correlation coefficient between frontal probability and these factors to reveal their influence on frontal activity.
Due to the strong influence of local dynamic processes (such as tide, wave, and river discharge), the Eastern China Seas are characterized by extremely high SSC and strong frontal activity (Figures 1A, B). Frontal activity can be observed almost all over the coastal areas and is generally consistent with the spatial distribution of SSC. The water depth with a frontal probability larger than 20% is less than 20 m, especially on the western coast (27°N-35°N and 120°E-123°E), the frontal probability follows the distribution of isobath very well. Further to the deep water to 40 m, the advection and re-suspension of sediment are weakened due to the decrease in tidal currents and wave actions (Wells and Huh, 1984), resulting in the value of frontal probability decreasing rapidly. When the water depth exceeds 60 m, frontal activity almost disappears. It is further observed that the distribution of frontal probability is not uniform. For example, stronger frontal activity has been found along the Zhejiang-Fujian coast, the Hangzhou Bay, the Changjiang River Estuary, the Jiangsu Shoal, the coast of Shandong Peninsula, and the entire Bohai Sea. In contrast, frontal activity is much weaker on the northern and eastern coasts of the Yellow Sea because these areas have less supply of terrigenous sediments. A more detailed monthly distribution of frontal probability shows strong seasonal variability in frontal activity (Figure 2). Frontal activity over most waters is strongest in winter (Figures 2A-B, L) and weakest in summer (Figures 2F–H), with similar intensities between spring (Figures 2C–E) and fall (Figures 2I–K). Notably, the seasonal variability of frontal activity is strongest in the Yangtze Bank and the central region of the Bohai Sea. The annual distribution of frontal probability shows a relatively stable pattern (Figure 3). Most turbidity fronts were found in offshore waters with depths of less than 60 m. Therefore, to highlight significant anomalies in frontal activity, the calculations for all-time series in this study only included data for waters shallower than 60 m. In addition, the frontal probability generally decreases with the increasing distance from the coast (Figures 1B, 2, 3), which results in a significant negative correlation between the water depth and frontal probability (r<-0.4, p<0.05) (Figure 1C). This indicates that shallow water is a necessary condition for the presence of turbidity fronts on the sea surface because more dynamic water column mixing in these shallow environments is conducive to frontogenesis (Lefevre et al., 1983; Pingree and Griffiths, 1978). The linear trends of frontal probability in the past 10 years were further calculated (Figure 1D). The frontal activity is significantly weakened in the Changjiang River Estuary, which may be related to the continuous reduction of sediment discharge (Luo et al., 2022). In most areas of the Yellow Sea, the Zhejiang-Fujian coast, and parts of the Bohai Sea, frontal probability showed a significant positive trend, especially in the five cross-shelf transport paths, but the underlying reasons are still unknown.
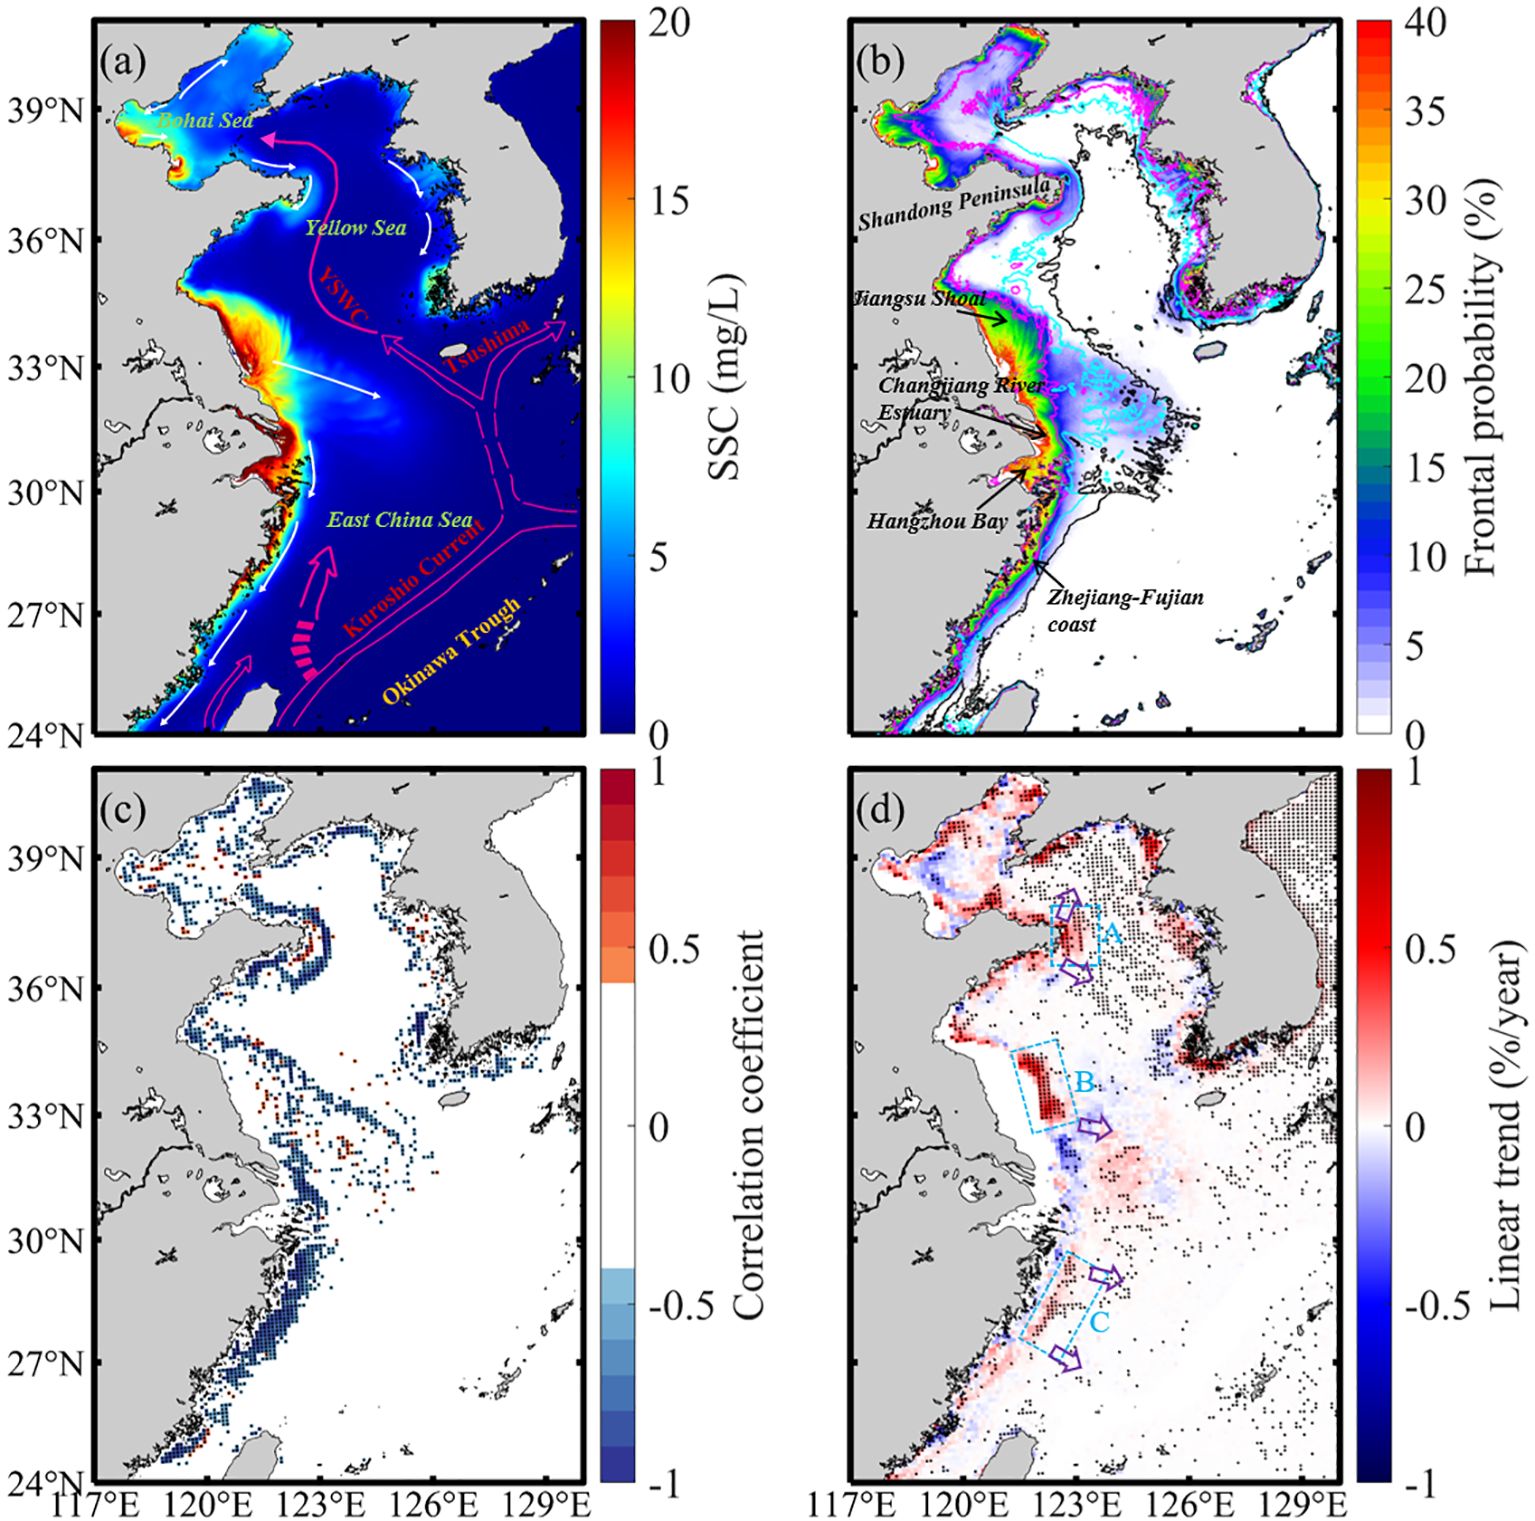
Figure 1. (A) The spatial distribution of the 10-year mean SSC. The white and magenta arrows represent the coastal currents and the Yellow Sea Warm Current (YSWC) in winter, respectively. (B) The distribution pattern of the 10-year mean frontal probability. The magenta, cyan, and black lines represent 20-, 40-, and 60-m isobaths, respectively. (C) The spatial pattern of correlation coefficients between the 10-year mean frontal probability and water depth. (D) The spatial distribution of long-term trends in frontal probability. The blue boxes represent three typical areas with interannual enhancements of frontal probability, including the coast of Shandong Peninsula (Area A), the Jiangsu Shoal (Area B), and the Zhejiang-Fujian coast (Area C). From north to south, the five purple arrows depict the cross-shelf transport pathways as follows: from the shear zone of the Lubei Coastal Current and the YSWC to the Western North Yellow Sea Mud; from the Shandong Peninsula coastal currents to the Central Yellow Sea Mud; southeasterly transport to southwestern Cheju Island by the Subei coastal current; easterly transport in northern Zhe-Min; and easterly transport in northern Taiwan (Liu et al., 2023; Ren et al., 2015; Yuan et al., 2005). The black dots in (C, D) indicate statistically significant correlations (p<0.05).
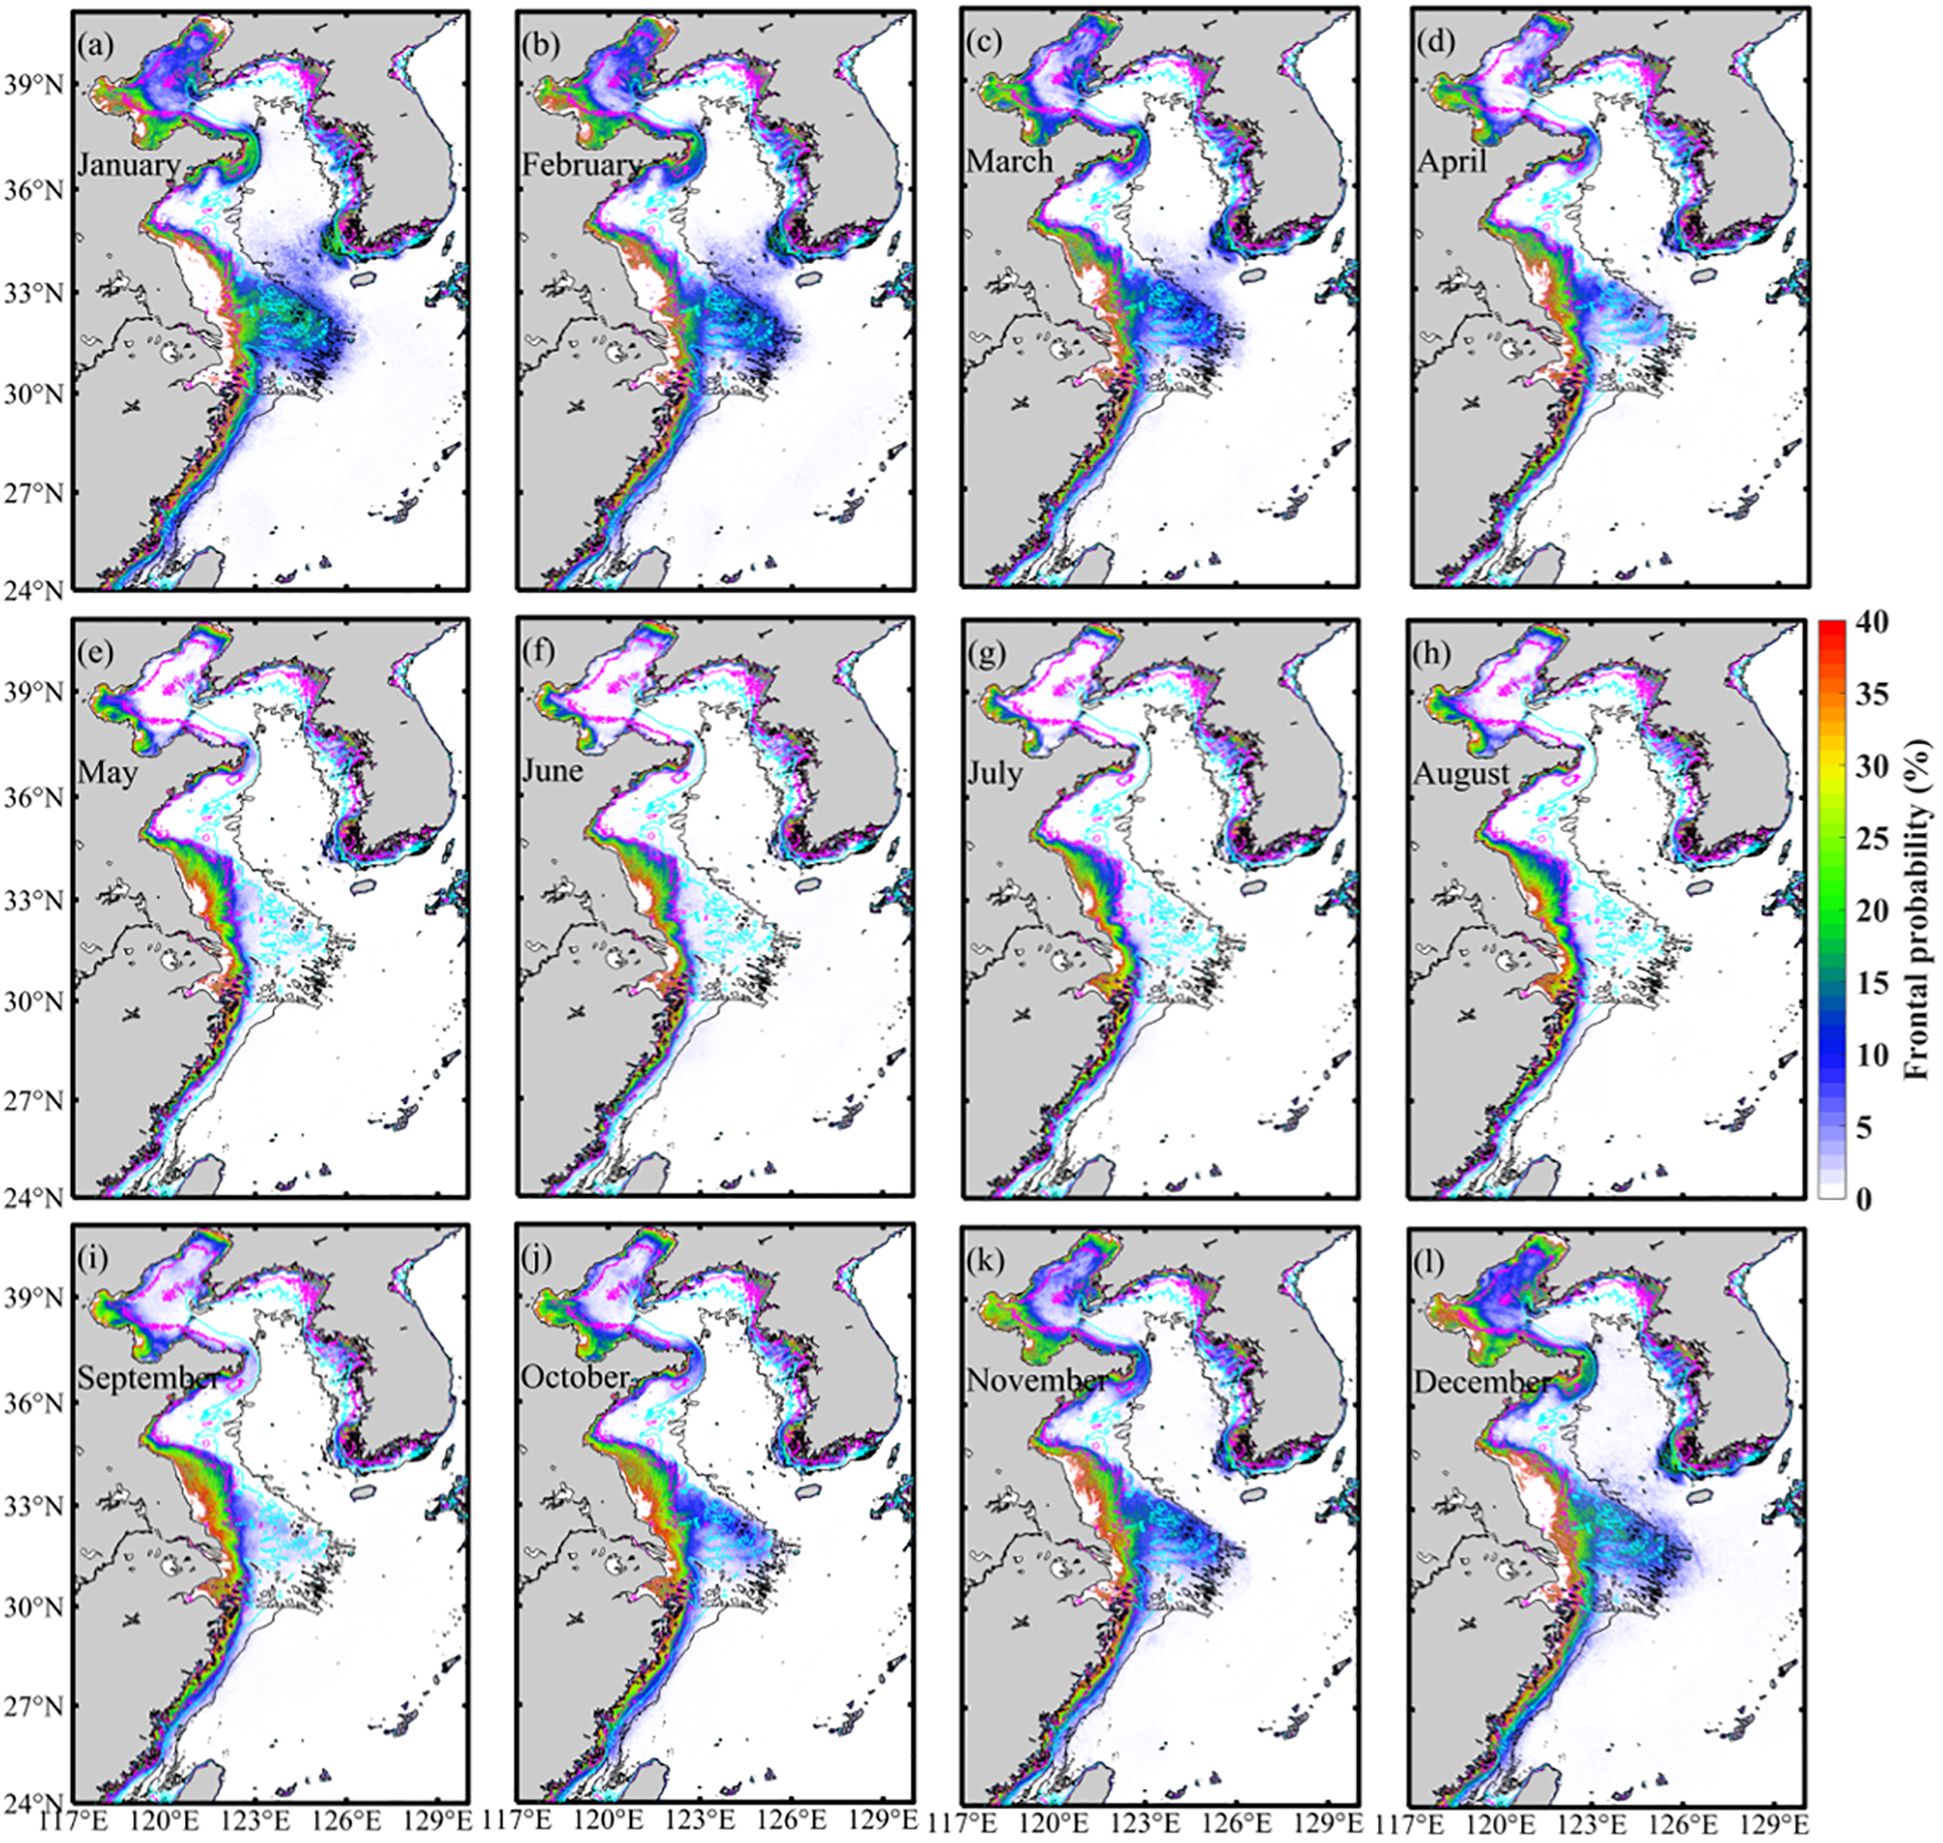
Figure 2. (A–L) Monthly distributions of frontal probability in the Eastern China Seas.
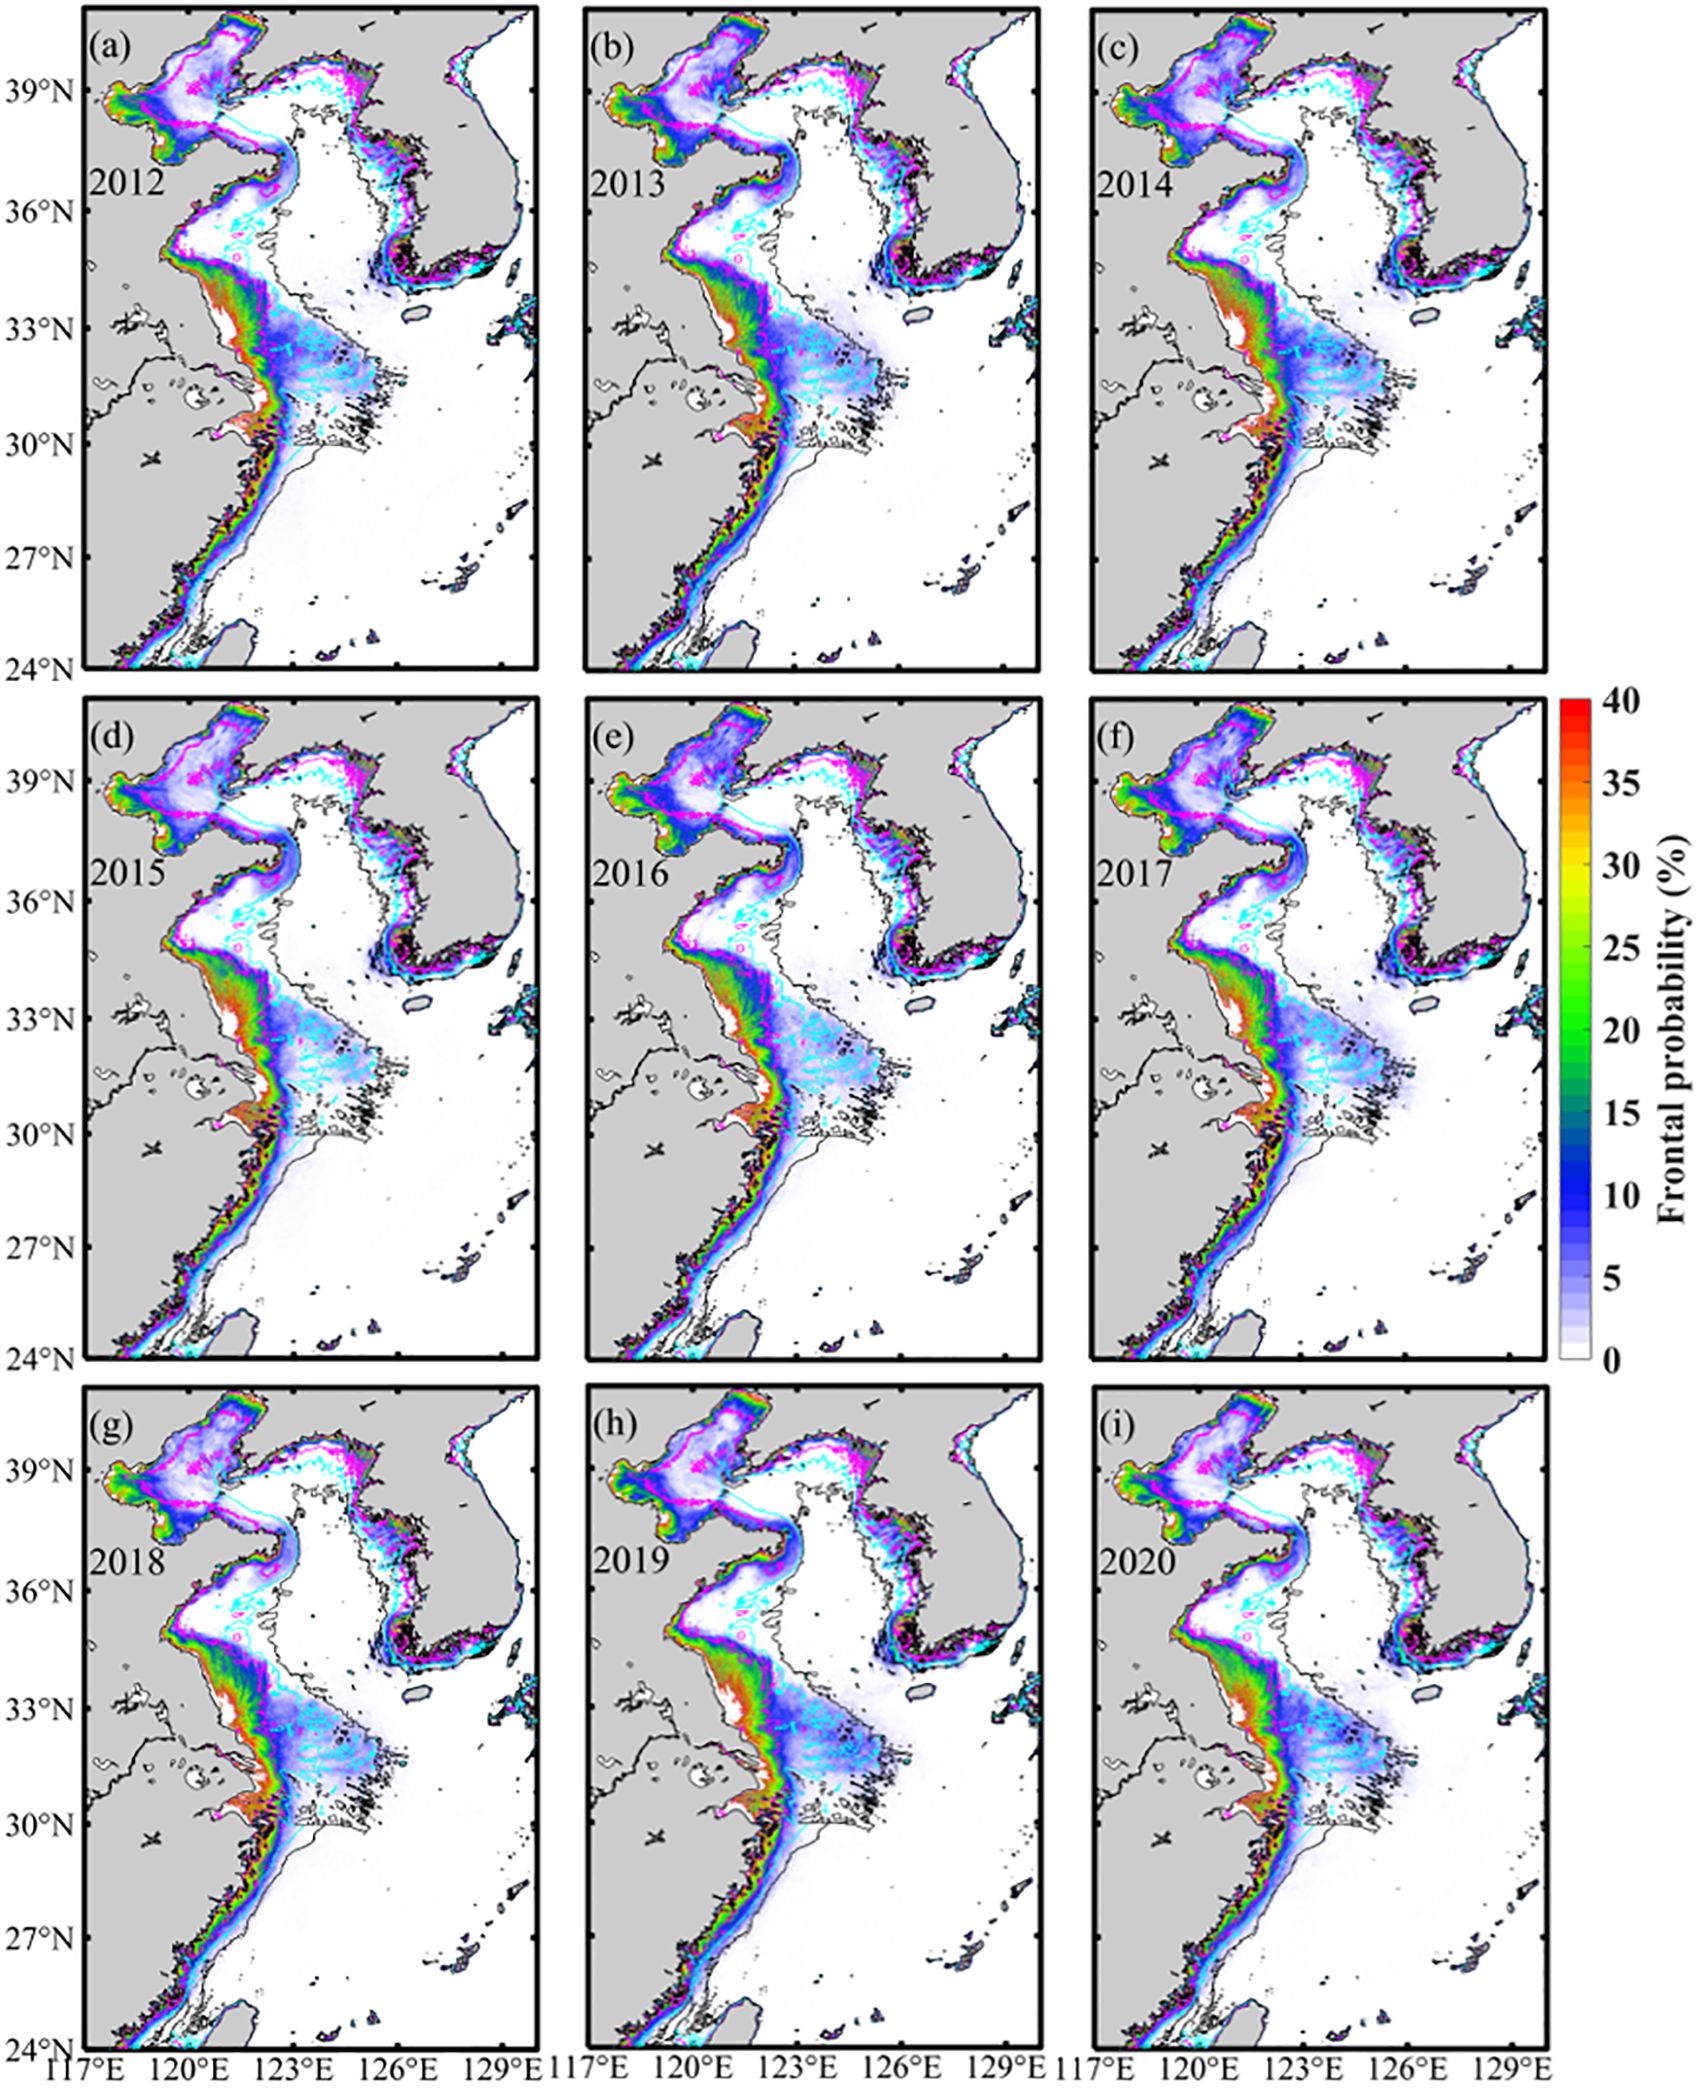
Figure 3. (A–I) Annual distributions of frontal probability in the Eastern China Seas.
To further clarify the temporal variation of frontal activity and its influencing factors, the regional mean frontal probability over the Bohai, Yellow, and East China Seas was extracted (Figure 4A). Similar to the uneven spatial distribution, the frontal probability in the three sea areas showed obvious seasonal and interannual variations, and the variation patterns showed regional heterogeneity. From Figure 4B, the maximum frontal probability in the three sea areas occurred in December. In addition, there was a secondary peak in the Bohai Sea in March and two secondary peaks in the Yellow Sea in April and October. The onset of spring phytoplankton blooms in the Yellow Sea occurs in March or April, and the peak value most often occurs in April (Lv et al., 2022), which is consistent with the peak value of frontal probability in April, revealing that the turbidity front appears to be a reliable indicator of the offshore spreading intensity of terrigenous nutrient. The month corresponding to the minimum frontal probability in the three sea areas was slightly different, appearing in July for the Bohai Sea, but in June for the Yellow and East China Seas. The months with the strongest frontal activity were mostly December and January, but the peak and trough months of annual frontal probability varied over different regions (Figure 4A and Supplementary Table S1). For example, in 2012, 2013, and 2018, the peak months in the Yellow Sea, East China Sea, and Bohai Sea were April, October, and March, respectively. On the contrary, the months with the weakest frontal activity were more stable in different years, with May-July being the most common. The years with the highest and lowest peak months in the three sea areas were 2018 (7 times) and 2015 (0 times) respectively. Then, the question arises whether different influencing factors dominate the long-term variations of frontal activity in the three sea areas.
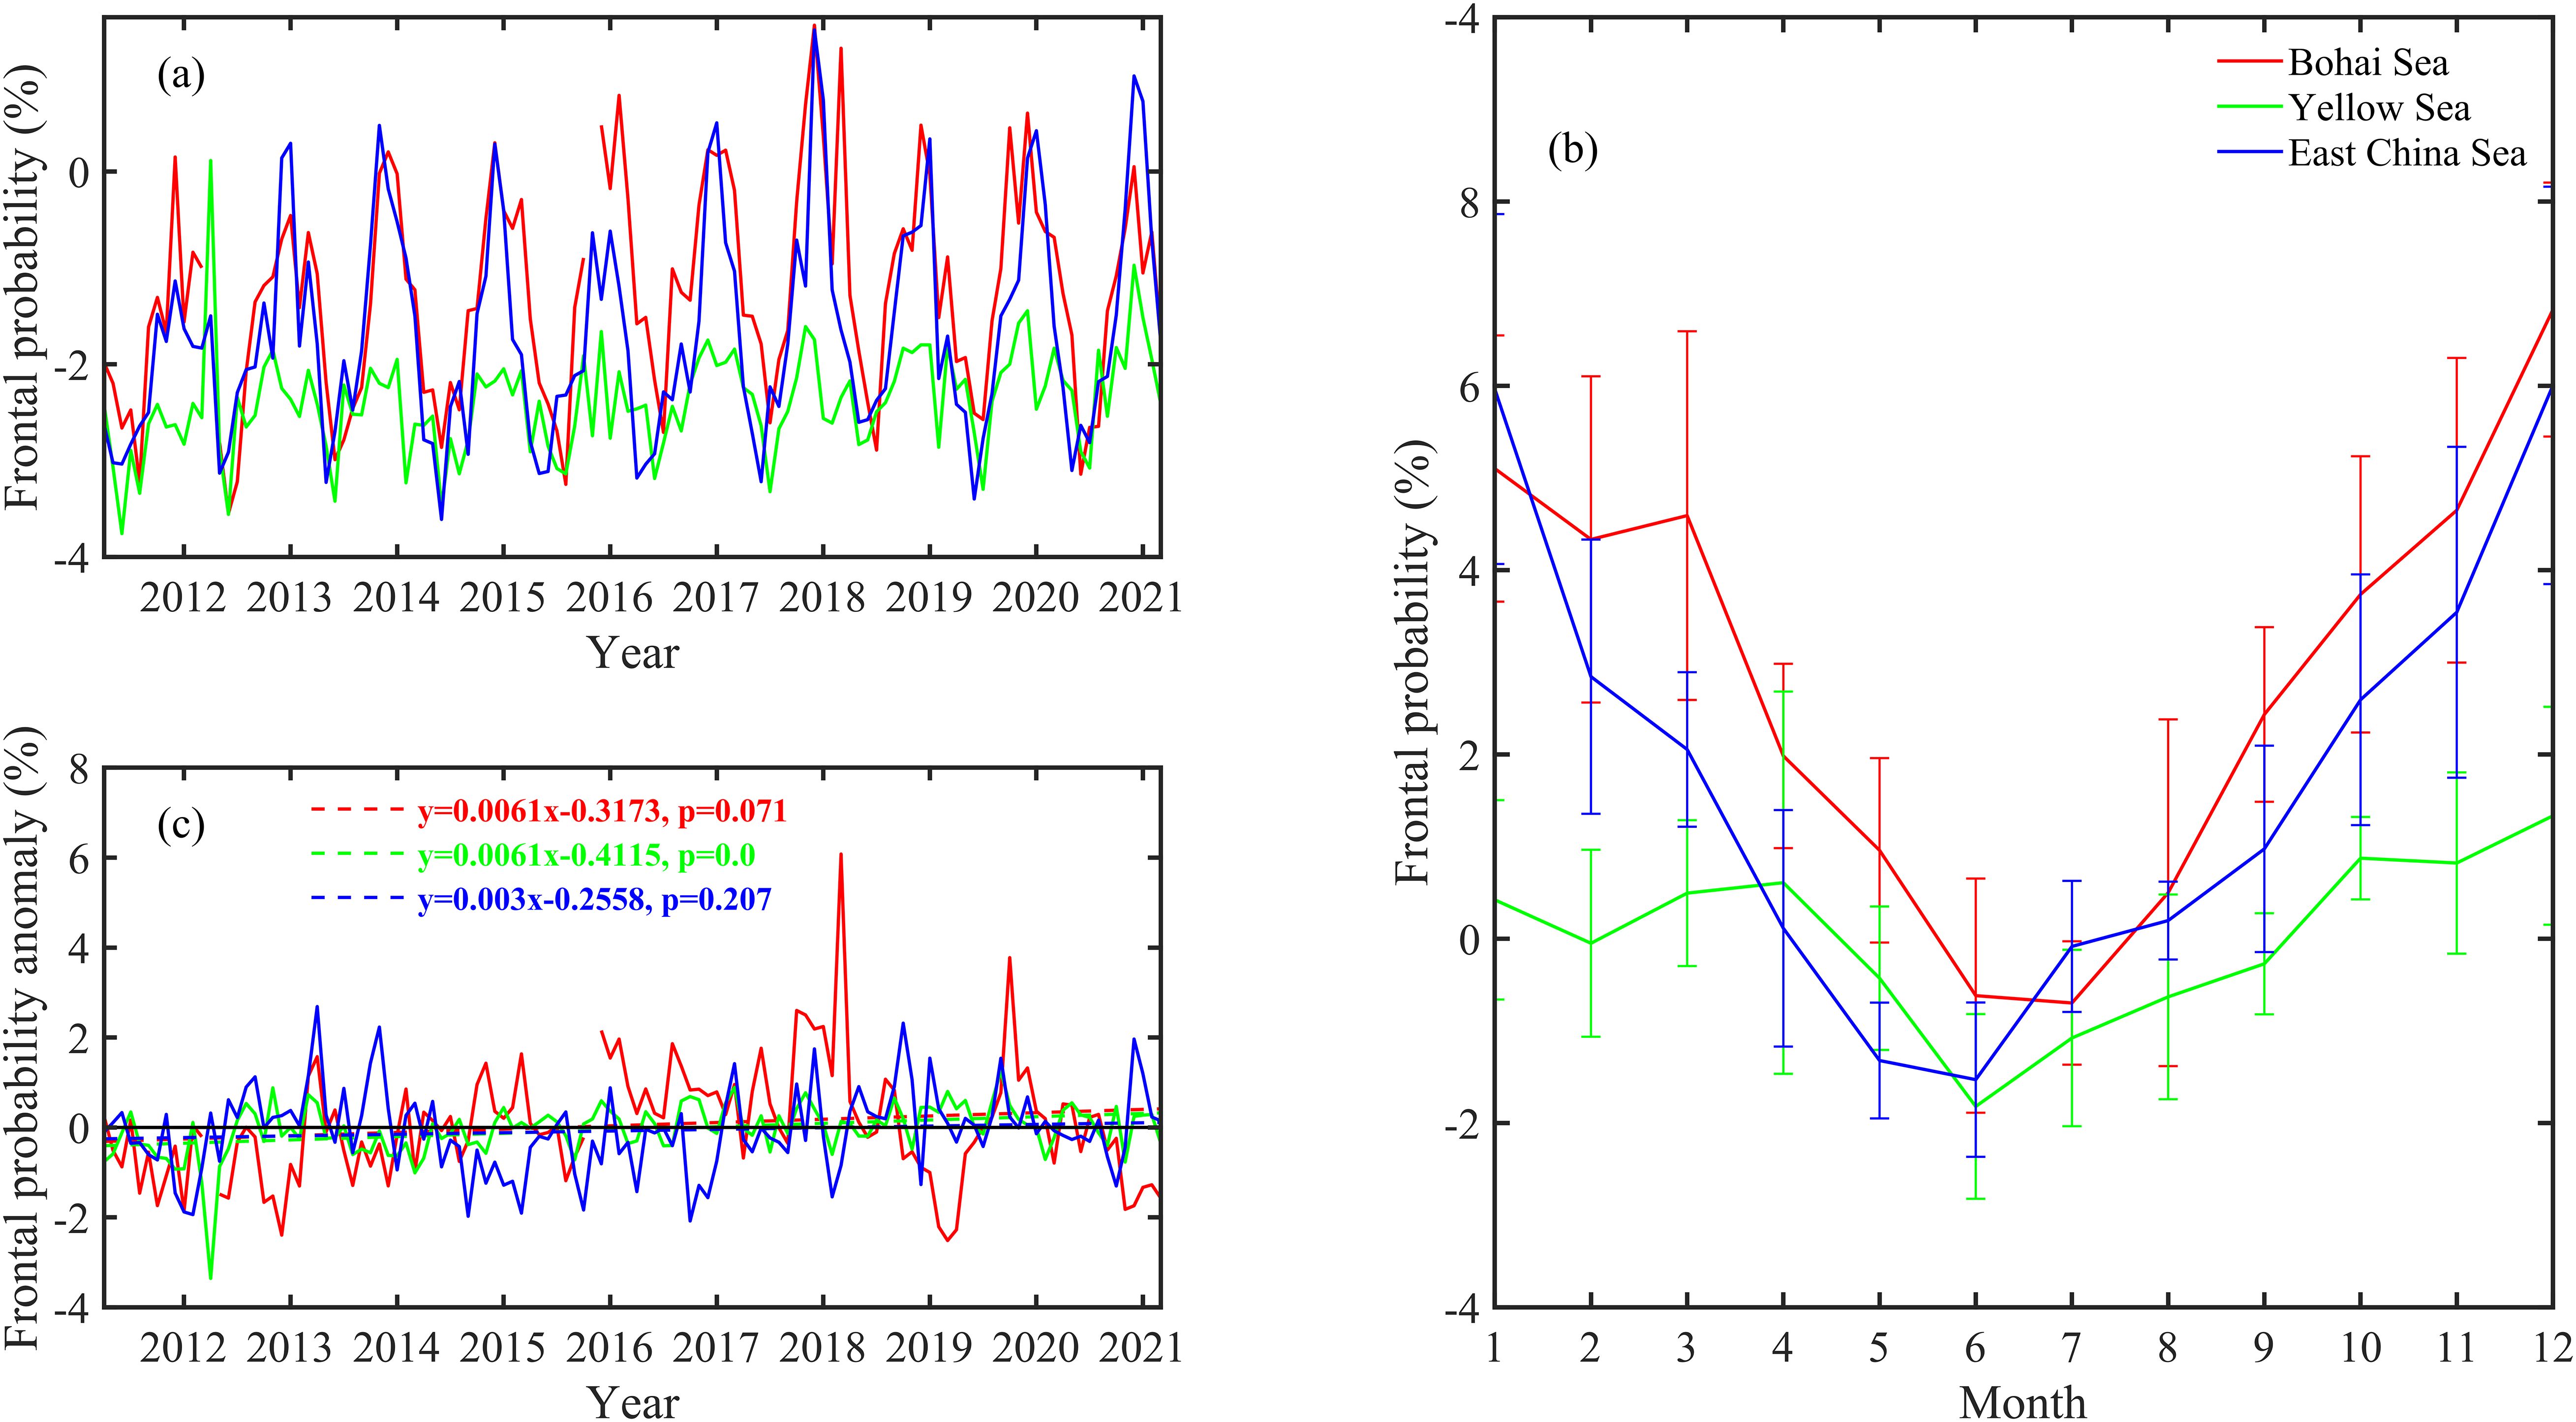
Figure 4. Time series of regional mean frontal probability (A), climatological monthly mean frontal probability (B), and regional mean frontal probability anomalies (solid lines) and their linear trends (dashed lines) (C) in the three sea areas.
Time series results further showed a statistically significant enhanced trend in frontal activity in the Yellow Sea during 2011-2021 compared to the Bohai and East China Seas (p<0.01), suggesting that more terrigenous material was potentially transported to the central Yellow Sea in recent years (Figure 4C). The observed frontal probability increased by 0.07%/year on average, exceeding 0.3%/year in local regions (Figure 1D). This was well consistent with increasing SST gradients (0.0005 °C/km/year) (Figure 5B, D) caused by ocean warming in this area during the same period, but their intrinsic correlation is still unclear. Meanwhile, the sea surface wind speed, significant wave height, mixing layer depth, and turbulent kinetic energy showed no significant trend (p>0.05) (Supplementary Table S2). Then, another question comes up whether ocean warming was the main controlling factor of the interannual enhancement of frontal activity in the Yellow Sea during this period. The two questions will be discussed in detail in the following section.
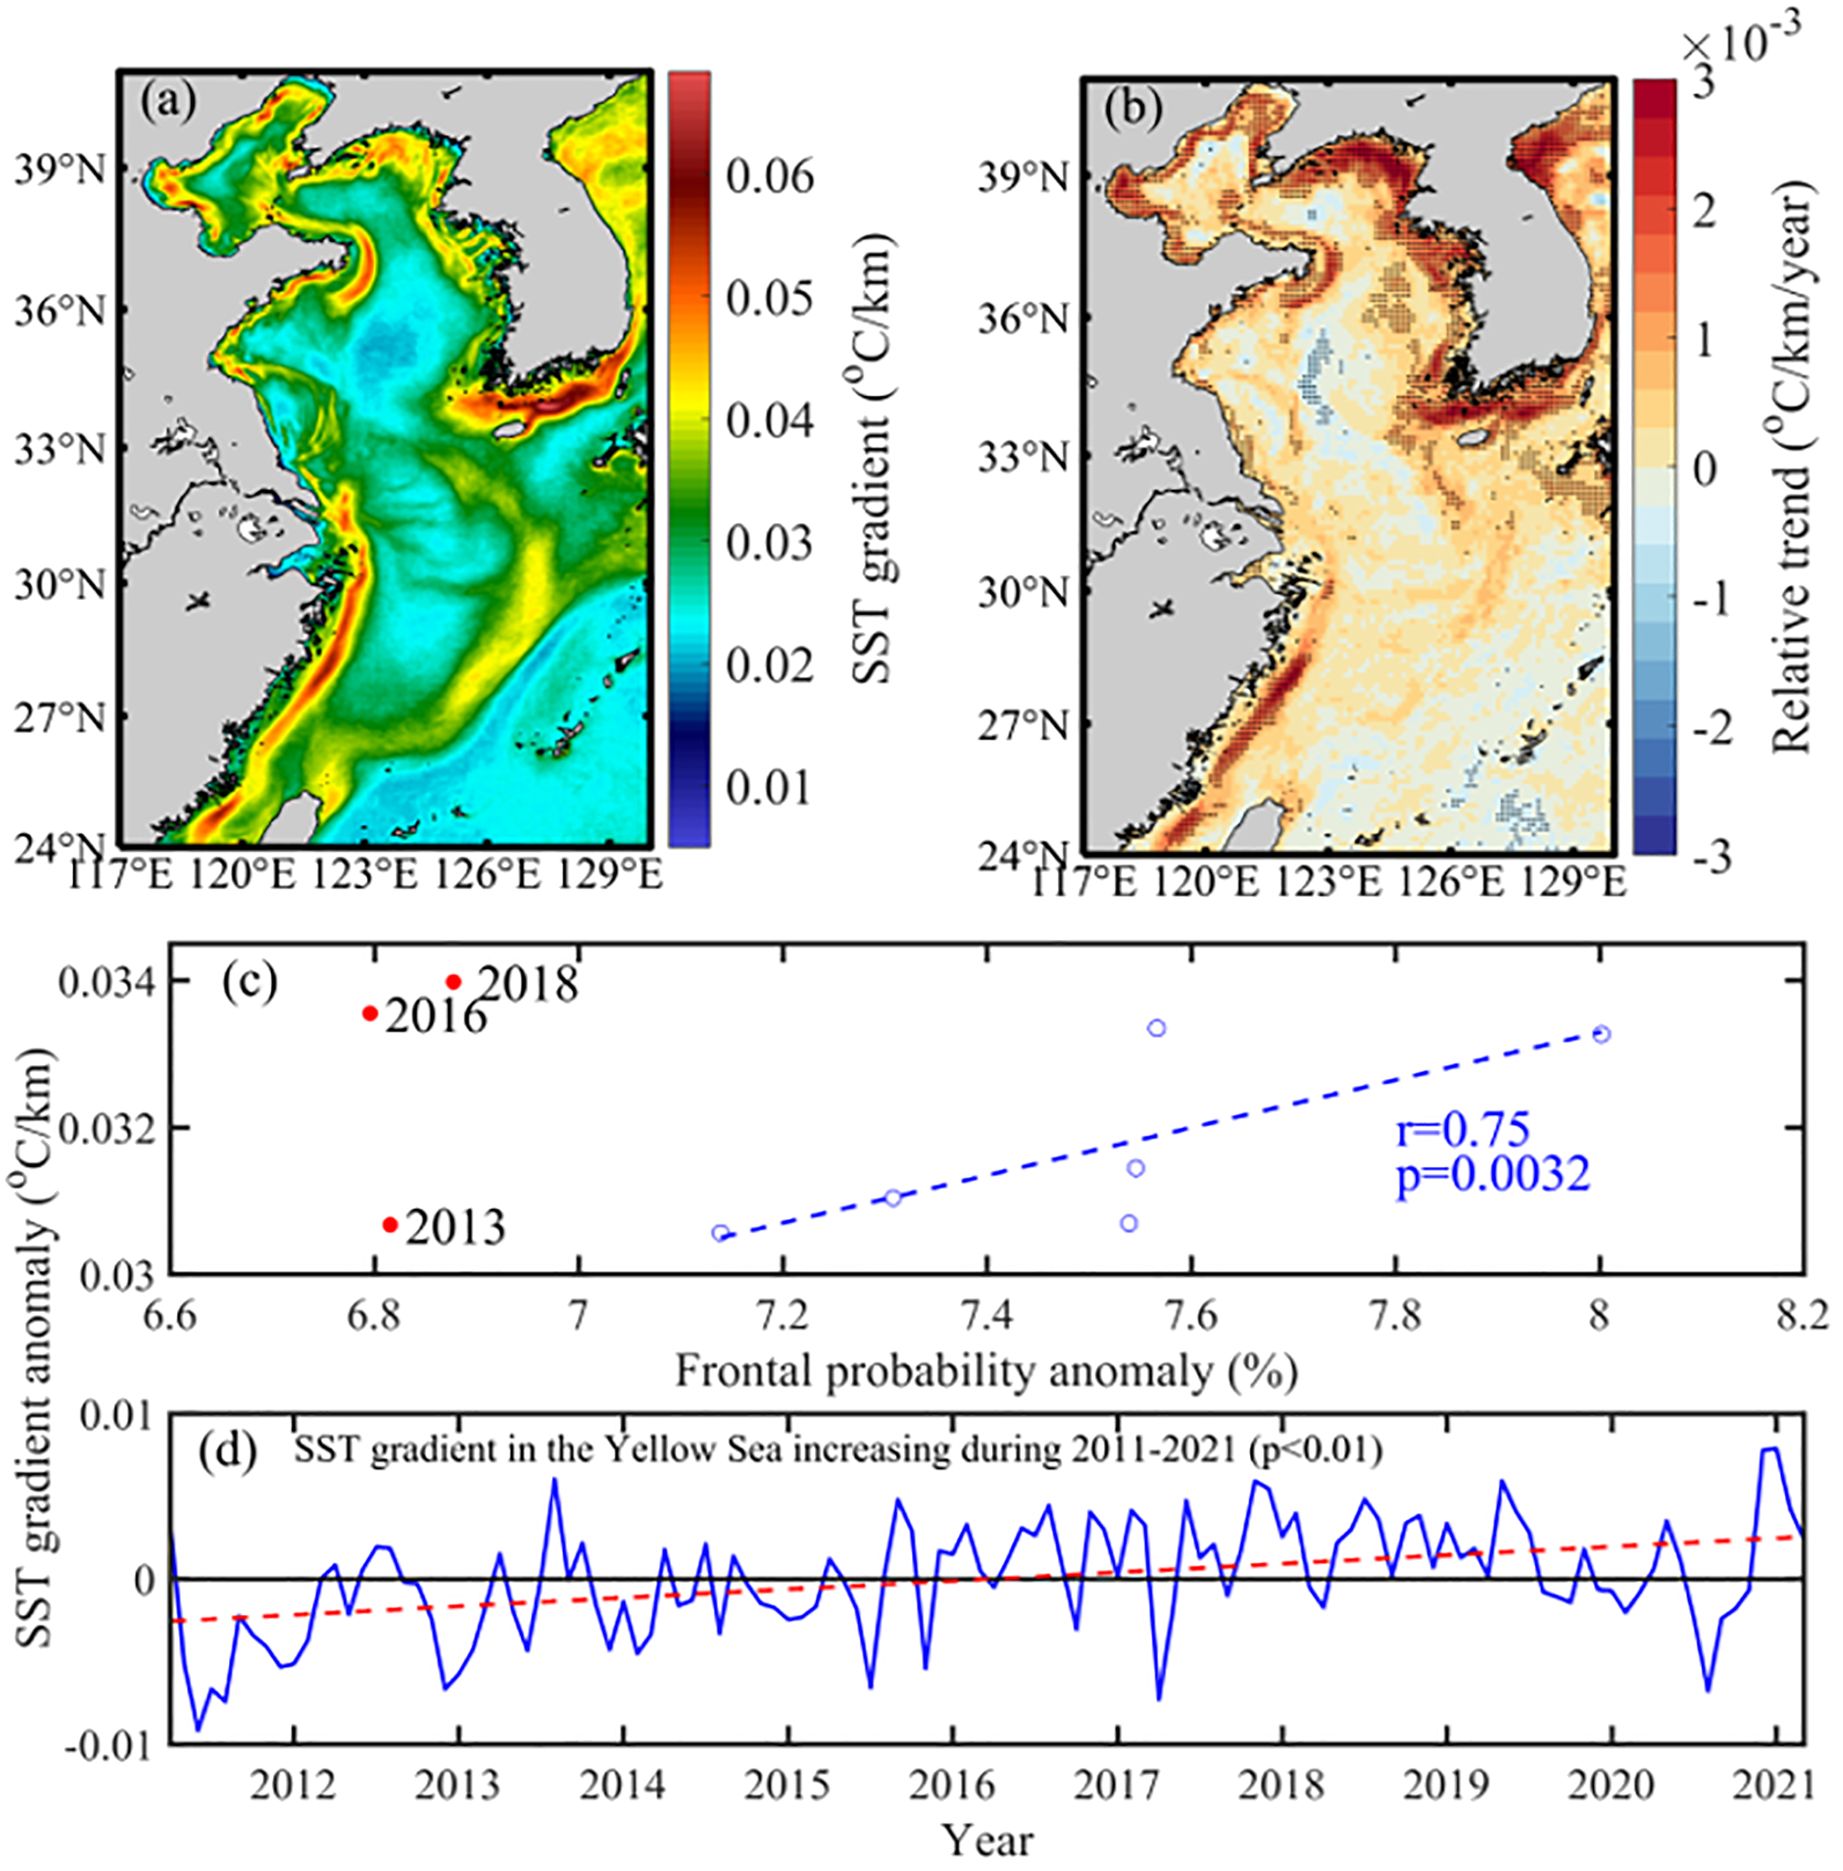
Figure 5. (A) The spatial distribution of the 10-year mean SST gradient. (B) The spatial distribution of interannual linear trends in SST gradients. (C) The relationship between annual frontal probability and SST gradient anomalies in the Yellow Sea. The three outlier years represented by the solid red dots were excluded from the correlation analysis. (D) Time series of SST gradient anomaly (solid blue line) and its linear trend (dashed red line) in the Yellow Sea.
The multiscale variations of turbidity fronts in coastal and estuarine waters are highly complex, being affected to different degrees by multiple factors (such as wind, wave, river discharge, mixing layer depth, etc.) (Du et al., 2023b; Framinan and Brown, 1996; Maciel et al., 2021; Wei et al., 2022). However, the influence of these factors on the interannual variation of turbidity front in the Eastern China Seas has not been well quantified. In this study, we further identified that certain factors play a more significant role than others across different regions (Table 1). Meanwhile, these factors were intercorrelated and each factor could explain the variability of frontal activity to some extent.
Specifically, the Bohai Sea is a semi-enclosed bay with relatively shallow water depths (18 m on average) compared to the other two sea areas, and it has an abundant supply of terrigenous sediments. For example, most terrestrial sediment (about 70%) from the Yellow River is deposited on the onshore delta within 15 km of the river mouth, and part of the remaining sediment is transported to the North Yellow Sea through the Bohai Strait (Bi et al., 2011; Li et al., 2022). Consequently, frontal activity in the Bohai Sea is strongest almost all year round due to shallow water and abundant sediment supply (Figure 4B). Meanwhile, the variability of frontal activity in the Bohai Sea is highly related to the wind-driven dynamic processes. The frontal probability anomaly is positively correlated with anomalies in wind speed, significant wave height, and mixing layer depth, with the strongest correlation observed with significant wave height anomaly (r=0.34, p<0.01). These correlations indicate that frontal dynamics are most sensitive to changes in wind wave intensity. The Bohai Sea suffers from cold waves and winter storms frequently (Mo et al., 2016; Wang et al., 2020), and the resulting strong wind waves can cause more vertical mixing and deepen the mixing layer depth. Consequently, drastic erosion and re-suspension of seabed sediment occur in most areas of the Bohai Sea, thus enhancing frontal activity (Du et al., 2023b; Wang et al., 2014).
For the East China Sea, the interannual variation of the frontal probability anomaly is mainly related to the mixing layer depth anomaly with the strongest correlation (r=0.41, p<0.01). It is also observed that the frontal probability anomaly is positively correlated with the anomalies of wind speed, significant wave height, SST gradient, and turbulent kinetic energy (p<0.05). These relationships indicate that the underlying mechanisms affecting the interannual variations of turbidity fronts in the East China Sea are more complex. First, the variation of mixing layer depth in this region is influenced not only by the wind field and sea temperature but also strongly influenced by the Changjiang diluted water (Wu et al., 2014). Their combined effect leads to the strongest response of frontal activity to the variation of mixing layer depth. Changes in the wind field will also stimulate the synchronous response of wave and turbulent kinetic energy (Liu et al., 2023). The enhanced (weakened) wind stress will increase (weaken) the turbulent kinetic energy and wave intensity (Dong et al., 2011), thus causing the fluctuation of frontal activity intensity by affecting the stability of the water column and vertical mixing. Meanwhile, the enhancement of the lateral buoyancy (temperature) gradient is conducive to triggering coastal frontal instability and mixed layer baroclinic instability (Shi et al., 2019; Yin and Huang, 2016), thereby controlling the offshore transport of coastal suspended sediment, resulting in a corresponding response in the activity intensity of offshore turbidity fronts. The coupling of shelf circulation and wind field variability also affects frontal activity. The strength and direction of coastal currents and shelf circulations in the Eastern China Seas are significantly modulated by monsoon. Under the action of winter storms, there are shelf circulations and coastal currents in Regions A, B, and C (as shown in Figure 1D) with opposite flow directions (Figure 1A). The resulting shear instability of ocean currents (Liu et al., 2018) is conducive to the formation of offshore turbidity front.
In the Yellow Sea, there is a significant positive correlation between the frontal probability anomalies and SST gradient anomalies (p<0.05), but not significant with other factors. This allows us to establish a link between the interannual variability of the two. This correlation shows that the increase of the horizontal SST gradient will promote the horizontal density gradient, and the resulting strong horizontal pressure gradient is more likely to cause frontal instability (Shi et al., 2023a, 2023b), thus enhancing the frontal activity. Vice versa, a decreased SST gradient appears with weakened frontal activity. For example, large temperature (and density) differences in Regions A and B (Figure 5A) lead to considerable baroclinic gradient forces (Li et al., 2019), which in turn enhance frontal activity by stimulating baroclinic instability. Increased frontal activity causes more terrigenous materials to converge offshore, which are then transported to the open sea by tides, waves, and ocean currents, stimulating plankton growth. In summary, these results reveal that the variation of frontal activity at the interannual scale in the Yellow Sea is dominated by density gradient changes resulting from horizontal temperature differences.
According to the ocean environmental conditions, if the horizontal temperature difference between cold coastal waters and warm offshore waters increases in winter and spring, the horizontal density gradient of the seawater will increase accordingly. Especially for the Yellow Sea, the variations in water density are mainly modulated by the changes in water temperature (Shi et al., 2023a). This is because nearshore waters are driven by a full-depth vertical mix of intense winter cooling and winter storms, and their SST is much lower than that of offshore waters. Under the influence of ocean warming, a larger horizontal gradient will stimulate stronger frontal instability, resulting in increased frontal activity in regions with enhanced SST gradients, and more terrigenous materials will be transported offshore. Recent studies have confirmed that climate warming has increased the horizontal temperature gradient in the coastal waters of the Yellow and East China Seas (Shi et al., 2023a, 2023b). Similar climate change-driven enhancements of temperature gradients have also been identified in other regions. For example, the cooling of the Malvinas Current near the Patagonian Shelf Break Front and the simultaneous warming of adjacent shelf waters led to a significant increase in the cross-shelf SST gradient along the slope (Franco et al., 2022). Then, can the long-term patterns or trends of turbidity fronts in the Yellow Sea be attributed to long-term changes in SST gradients?
To solve this problem, we further compared the long-term trend of frontal probability (Figure 1D), the 10-year mean SST gradient (Figure 5A), and the long-term trend of SST gradient (Figure 5B). First, the significant enhancement of frontal activity needs to occur in regions with sufficiently large horizontal pressure gradients, as demonstrated by the close agreement between the distributions of the high SST horizontal gradients (>0.04 °C/km) and the increasing trends of the frontal probability (>0.3%/year) (Figures 1D, 5A) since these regions are more likely to stimulate frontal instability. Linear trend analysis shows a statistically significant increase in frontal probability from 2011 to 2021 (p<0.05) (Figure 4C) and this trend is followed by the long-term pattern of SST gradients (Figure 5D), as also shown by the good coincidence of significantly increased regions of both frontal probability and SST gradients (e.g., Regions A and B) (Figures 1D, 5A). This indicates that the enhancement of the horizontal temperature gradient may dominate the expansion of frontal activity in the Yellow Sea. Meanwhile, we note that the frontal probability and SST gradient in the Zhejiang-Fujian coastal waters (Region C) have a statistically significant increasing trend (p<0.05) and their spatial distributions are well consistent, indicating that the influence mechanism of SST gradient on the long-term trend of frontal activity is also applicable to the Zhejiang-Fujian coast. Interestingly, the above three areas correspond to the five major cross-shelf transport paths (Liu et al., 2023; Ren et al., 2015; Shi et al., 2019; Zhang et al., 2019), which also appears to explain the enhanced cross-shelf transport and the resulting ecological effects in the Eastern China Seas, such as more terrigenous nutrient transport conducive to algal reproduction and sustained expansion (Liu et al., 2023; Qi et al., 2022). In conclusion, the distribution pattern of the interannual enhancement of the offshore frontal activity can be explained by baroclinic instability caused by the enhancement of the density gradient due to the horizontal temperature difference, which provides further evidence for the intrinsic correlation between frontal variability and ocean warming.
When calculating the annual frontal probability anomaly and SST gradient anomaly in the Yellow Sea, we found that the frontal probability anomaly in 2013, 2016, and 2018 appeared not to be dominated by the horizontal temperature gradient anomaly (Figure 5C). After the three years were excluded, the correlation was significant (r=0.75, p<0.01), suggesting that factors other than SST gradients may have dominated the interannual variations in frontal activity during the three anomalous years. This could explain the significant but weak correlation between the monthly frontal probability anomaly and the SST gradient anomaly. In fact, these factors may originate from the influence of large-scale climate signals such as ENSO. For example, the locations of turbidity fronts in the Rio de la Plata estuarine system shift by a greater distance in La Niña years than in El Niño years, primarily due to abnormal river outflow during ENSO events (Nagy et al., 2008). Saldias et al. (2016) found that turbidity plume events in south-central Chile tend to occur during the warm phase of the ENSO and PDO, along with the opposite phase of the Antarctic Oscillation when the storm tracks shift northward. In addition, ENSO can lead to interannual anomalies of turbidity fronts by causing wind field and SST anomalies (Du et al., 2023a). In El Niño years, weakened winter winds and the warmer SSTs in the Yellow and East China Seas strengthen stratification, greatly inhibiting frontal activity. In contrast, frontal activity increases significantly during La Niña years. Our further analysis revealed that ENSO events had occurred exactly before these three years (Figure 6A), suggesting that large-scale climate signals largely determined the frontal dynamics of these years. A significant positive correlation is found between the frontal probability anomaly and the significant wave height anomaly (Figure 7; r=0.52, p<0.01), revealing that the frontal activity anomaly during the anomalous year was mainly driven by the wave intensity anomaly dominated by ENSO events. The close relationship between sea surface wind speed anomalies and frontal probability anomalies further indicated that wave intensity anomaly was dominated by changes in sea surface wind speed (r=0.4, p=0.02) (Figure 7 and Supplementary Table S3).

Figure 6. (A) Time series of the monthly MEI and PDO index for 2010-2022. Shaded areas represent ENSO events. Green and purple shades indicate that the PDO and ENSO events are in phase and out of phase, respectively. (B, C) represent the lead-lag correlation between the frontal probability anomaly and MEI and PDO index. Solid dots indicate that the correlation is statistically significant (p<0.05). (D, E) represents the spatial distribution of the correlation coefficients between the frontal probability anomaly and the river discharge and sediment discharge anomalies of the Changjiang River, respectively. Statistically significant correlations are displayed in color (p<0.05). The arrows in (D) indicate the expansion paths of Changjiang diluted water (CDW).
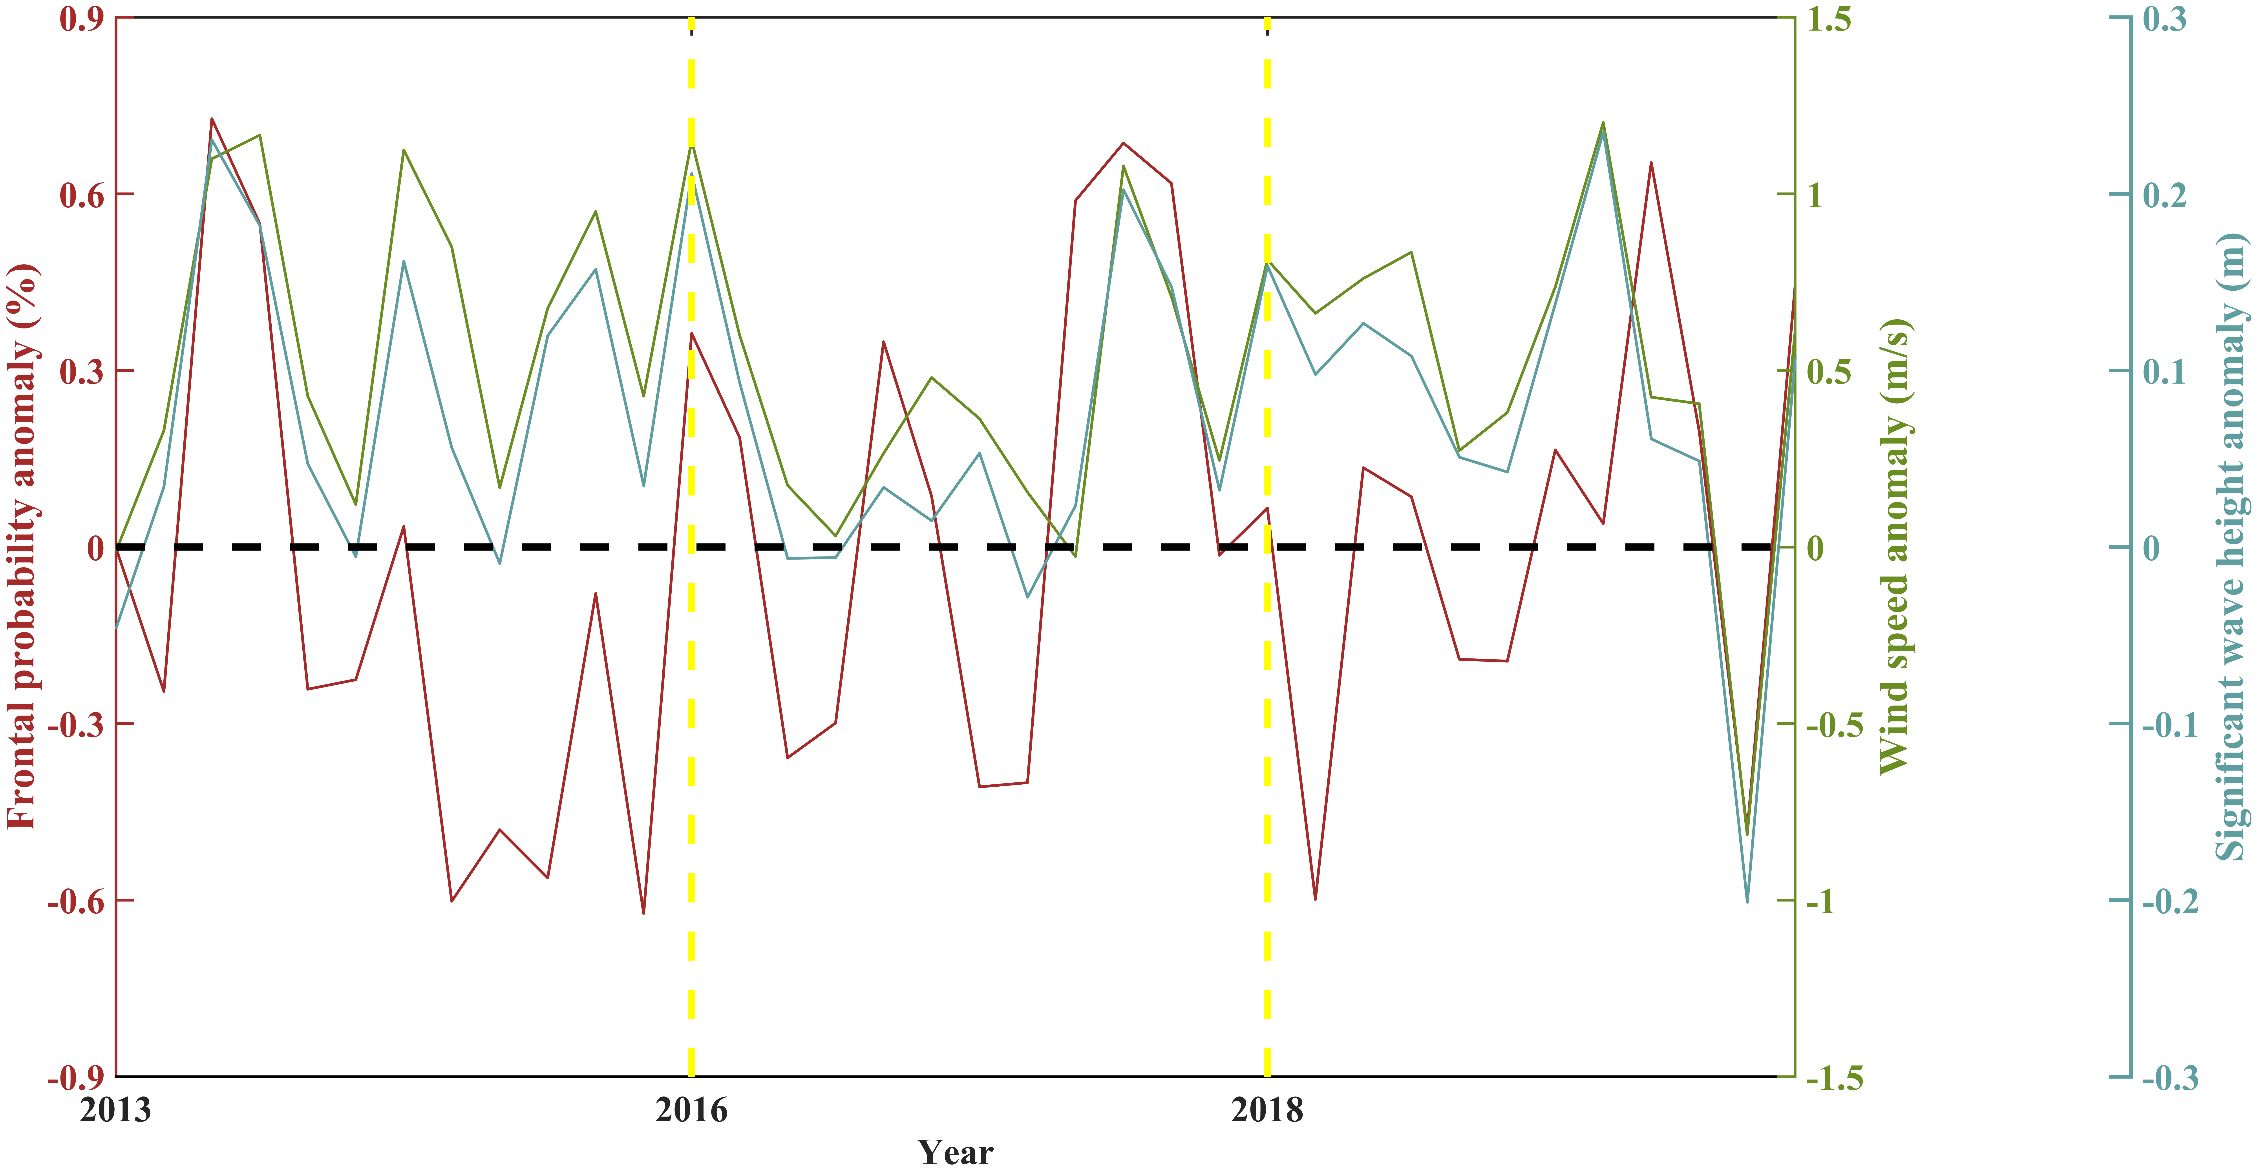
Figure 7. Time series of monthly frontal probability anomaly, wind speed anomaly, and significant wave height anomaly during 2013, 2016, and 2018. The yellow dotted lines separate the different years.
The lead-lag correlation between MEI and frontal probability anomalies was further calculated to evaluate the influence of large-scale climate events (Figure 6B). For the Yellow and the Bohai Seas, the maximum correlation between MEI and frontal probability anomalies was reached when the time lag was 6 months and 11 months, respectively. In the East China Sea, no significant correlation was found between MEI and frontal probability anomalies with a time lag of 0-12 months, mainly because the frontal activity was also affected by water stratification caused by river discharge (Li et al., 2021; Luo et al., 2017). This was supported by a significant negative correlation between frontal probability anomalies and river discharge anomalies over the expansion paths of Changjiang diluted water (p<0.05) (Figure 6D). However, no significant correlation was found between the frontal probability anomaly and the river sediment discharge anomaly (Figure 6E), because the river sediment usually settles rapidly in the estuary, and its direct impact is limited to waters inside the 30-m isobath (Du et al., 2023a; Li et al., 2021; Zhou et al., 2020). According to previous studies, when we only focused on this local area along the Zhejiang-Fujian coast, the interference of river discharge from the Changjiang River could be partially eliminated. At this time, a significant negative correlation is identified between the MEI and frontal probability with a time lag of 4 months showing the opposite correlation with the other two sea areas (Du et al., 2022), which was mainly related to the regional differences of wind speed anomalies driven by ENSO (Du et al., 2023b; Xu et al., 2022). Meanwhile, these correlations with different time delays were due to the delayed wind response to ENSO events, which had reached a general consensus in the East and South China Seas (Guo et al., 2023; Lu et al., 2022; Zhao et al., 2010). We also calculated the lead-lag correlation between the PDO index and frontal probability (Figure 6C). For the Yellow and Bohai Seas, the maximum correlation was reached when the time lag was 5 months and 11 months respectively. The length of the current time series is insufficient to explain in detail the causal relationship between the decadal variation of frontal activity and PDO. However, the in-phase combination of ENSO and PDO (Figure 6A) can induce more intense changes in monsoons (Kim et al., 2014), which in turn causes significant anomalies in frontal activity (Du et al., 2022).
Compared to previous studies, this study is distinguished by two key aspects. First, we expand the spatial scale of case studies to the continental shelf. This broader scope not only enhances our understanding of the long-term variability of turbidity fronts but also offers a unique perspective for observing and analyzing regional heterogeneity. By adopting this refined dataset, we conduct a comprehensive and consistent comparison, analyzing the characteristics of frontal changes across three sea areas. This approach can provide a baseline for revealing the degree and mechanisms of ecosystem responses to turbidity front changes in different regions. For example, what are the subsequent effects of abnormal frontal activity on local phytoplankton blooms, red tides, and hypoxia events? Future study is expected to address this issue by combining ecological simulation models and multi-source observation data. We further identify differences in the controlling mechanisms of turbidity front variations across various sea areas, which can provide a scientific basis for developing regional turbidity front simulation and prediction models. For example, optimal driver variable inputs can be provided for data-driven machine learning models. Secondly, this study establishes an intrinsic connection between recent rapid ocean warming and the interannual trends of turbidity fronts, detailing how frontal activity in different sea areas responds to ocean warming. This insight allows us to more effectively explain and predict how marine ecosystems respond to variations in turbidity fronts, and it is expected to provide scientific support for the formulation and implementation of relevant policies. Through such integrative and comparative research, we can better address potential environmental changes and ecological challenges that may arise in the future.
For example, quantifying the intensity of turbidity fronts and understanding their long-term variations are critical to predicting the response of the ocean carbon cycle to climate warming. Studies have shown that the fluxes of sinking organic carbon in oceanic frontal systems are roughly twice as large as those in surrounding waters or non-frontal conditions (Stukel et al., 2017). Therefore, the turbidity front has the great potential to regulate ocean carbon sequestration (Pan et al., 2020). We calculated the correlation coefficients between the monthly time series of frontal probability and pCO2 anomalies, and found that they showed significant positive correlations in most regions (p<0.05) (Figure 8A). This finding reveals that there is a strong coupling between frontal activity and pCO2 variability and that the interannual anomaly in pCO2 is largely modulated by offshore transport of terrigenous carbon controlled by turbidity fronts. In addition, the temperature gradient of the entire Eastern China Seas has shown an increasing trend in the last 10 years (Figure 5B), indicating that this phenomenon is a general process of the marginal sea driven by global warming. Consequently, enhanced frontal activity in the Yellow and East China Seas may have a positive impact on offshore carbon sequestration and ocean primary productivity. We find that the regions with significantly enhanced frontal probability in the offshore waters of the Eastern China Seas (especially the five cross-shelf transport paths) coincide well with the regions with significantly enhanced seawater pCO2 (Figures 1D, 8B), further supporting the large carbon sink potential of the Eastern China Seas (Yu et al., 2023). This consistency suggests that more CO2 may be transferred from shallow coastal seas to adjacent deep oceans in the future. Meanwhile, the release of subsurface carbon back into the atmosphere is expected to decrease due to increased water depth and reduced vertical mixing, thereby enhancing ocean carbon sequestration.
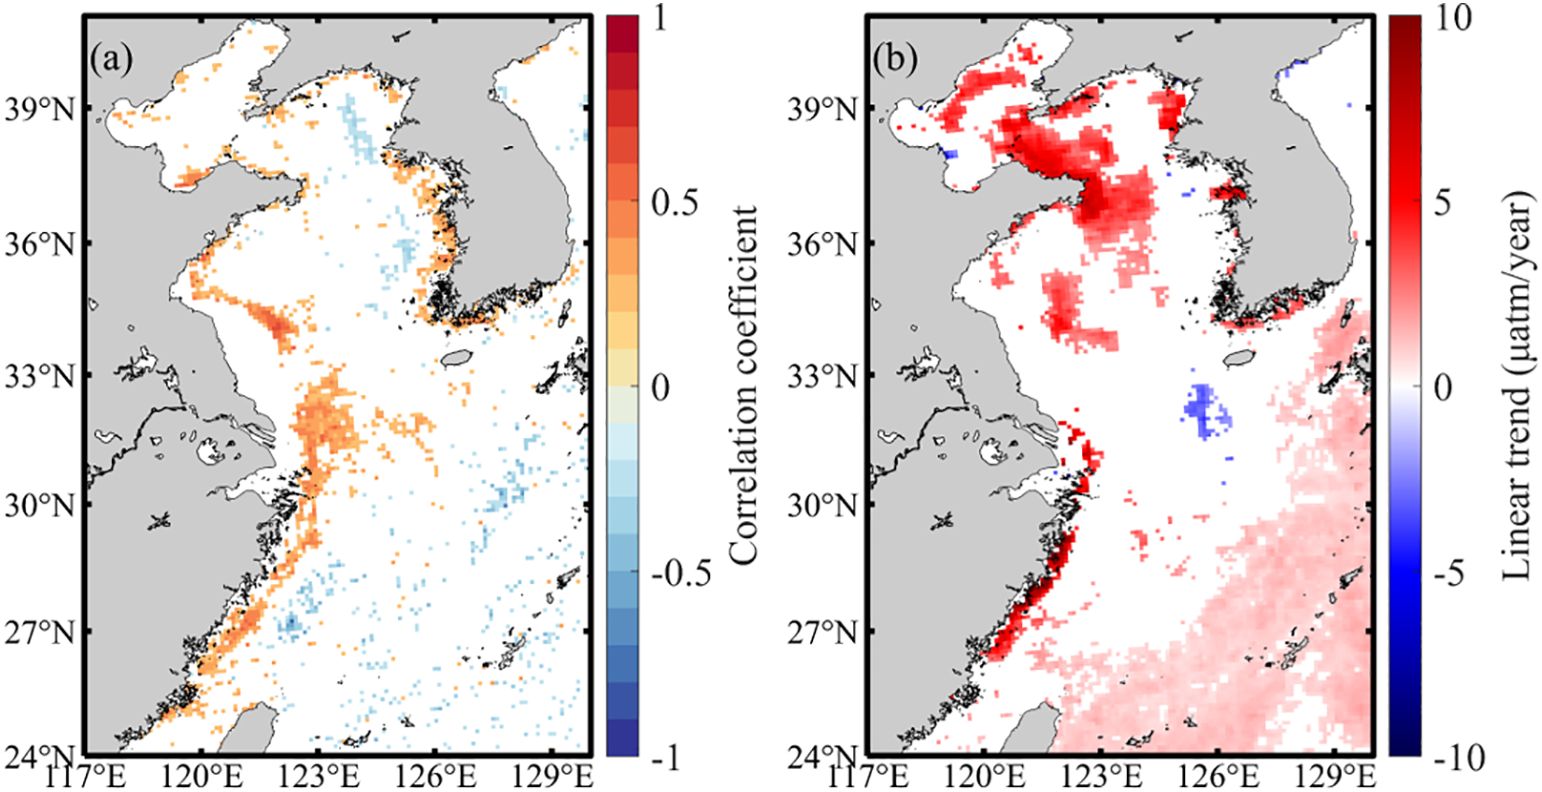
Figure 8. (A) The spatial distribution of the correlation coefficients between frontal probability and pCO2 anomaly. Statistically significant correlations are displayed in color (p<0.05). (B) The spatial distribution of long-term trends in pCO2. Locations with data missing and nonsignificant linear trends are plotted in white.
Ocean warming is a universal process, and the Eastern China Seas are particularly affected by it. According to the findings presented in our study, if this increasing trend of SST in the Yellow and East China Seas continues in the future, frontal activity on the continental shelf could be further enhanced, which could provide more terrestrial carbon sources for the ocean food web (Saldias et al., 2016). Additionally, ENSO events are anticipated to become more frequent and extreme in the 21st century due to global warming (Cai et al., 2018; Geng et al., 2023). Their impacts on ocean turbidity fronts may be even more pronounced on a global scale. If these trends persist as projected, the formation, separation, location, and displacement of turbidity fronts are expected to show more frequent and intense changes. What remains to be studied is how the frequencies and amplitudes of different ENSO types affect long-term trends of turbidity fronts in global marginal seas, and how PDO affects their decadal variability. This requires extending the time series and expanding the study target area by incorporating other high-resolution satellite products such as MODIS, GOCI-II, Himawari-8, etc. In addition, future studies should study the coupling of turbidity fronts with other physical, chemical, and biological fronts (such as temperature fronts, salinity fronts, and chlorophyll fronts), which is crucial for accurately locating enhanced bioproductivity and ecotones (Chen, 2009; Jamil et al., 2023; Kahru et al., 2018; Miller, 2004; Zhang and Hu, 2021). These should be the subjects of future studies.
The Eastern China Seas are one of the most dynamic and productive marginal seas in the world. but due to insufficient sampling efforts, the long-term variation of the turbidity fronts and its response mechanism to local processes and ocean warming remain poorly understood. In this study, a time series of frontal activity intensity index was constructed using satellite observations spanning the past decade (2011-2021), and the detailed spatial pattern and long-term change of turbidity front are given from the shelf sea scale. It is found that turbidity fronts are extensively observed in shallow coastal regions characterized by high sediment input and strong ocean dynamic processes. Further analyses reveal significant seasonal and interannual variations in turbidity fronts, with distinct drivers influencing region-scale frontal activity patterns. Specifically, wind waves, horizontal temperature gradients, and mixing layer depth are identified as dominant factors influencing frontal dynamics in the Bohai, Yellow, and East China Seas on an interannual scale, respectively. Moreover, long-term trends in front activity are closely linked to ocean warming. Increasing horizontal temperature gradients, driven by ocean warming, are found to contribute to rising trends in frontal activity in offshore regions of the Yellow Sea and along the Zhejiang-Fujian coast. In certain years, ENSO is suggested to play a significant role in driving frontal activity anomalies through a delayed wind-response mechanism.
Our satellite-derived frontal probability data are openly and freely shared at Zenodo (https://doi.org/10.5281/zenodo.14379390). These results are expected to provide detailed insight into the impacts of local processes and ocean warming on the transport of sediment and organic carbon from nearshore regions to open seas, improving our understanding of nutrient and pollutant dispersion on continental shelves.
The raw data supporting the conclusions of this article will be made available by the authors, without undue reservation.
YD: Conceptualization, Formal analysis, Funding acquisition, Investigation, Methodology, Validation, Visualization, Writing – original draft, Writing – review & editing. DF: Conceptualization, Funding acquisition, Resources, Supervision, Writing – review & editing. JZ: Data curation, Funding acquisition, Methodology, Writing – review & editing.
The author(s) declare financial support was received for the research, authorship, and/or publication of this article. This work was supported by the National Natural Science Foundation of China (42330411, 42406156), the National Grants for Postdoctoral Researchers Program (GZC20231936), the Shanghai Post-doctoral Excellence Program (2023564), the Postdoctoral Project of the State Key Laboratory of Marine Geology of Tongji University, and the Innovation Program of Shanghai Municipal Education Commission (2021-01-07-00-07-E00093). Data and samples were collected onboard of R/V Ke Xue San (Bo Hai Ke, Chuang Xin Yi) implementing the open research cruise NORC2023-03+NORC2023-302 supported by NSFC Shiptime Sharing Project (project number: 42249903).
The authors declare that the research was conducted in the absence of any commercial or financial relationships that could be construed as a potential conflict of interest.
The author(s) declare that no Generative AI was used in the creation of this manuscript.
All claims expressed in this article are solely those of the authors and do not necessarily represent those of their affiliated organizations, or those of the publisher, the editors and the reviewers. Any product that may be evaluated in this article, or claim that may be made by its manufacturer, is not guaranteed or endorsed by the publisher.
The Supplementary Material for this article can be found online at: https://www.frontiersin.org/articles/10.3389/fmars.2025.1530555/full#supplementary-material
Acha E. M., Mianzan H., Guerrero R., Carreto J., Giberto D., Montoya N., et al. (2008). An overview of physical and ecological processes in the Rio de la Plata Estuary. Continental Shelf Res. 28, 1579–1588. doi: 10.1016/j.csr.2007.01.031
Belkin I. M. (2009). Rapid warming of large marine ecosystems. Prog. Oceanography 81, 207–213. doi: 10.1016/j.pocean.2009.04.011
Bi N., Yang Z., Wang H., Fan D., Sun X., Lei K. (2011). Seasonal variation of suspended-sediment transport through the southern Bohai Strait. Estuar. Coast. Shelf Sci. 93, 239–247. doi: 10.1016/j.ecss.2011.03.007
Bowden K. F. (1963). The mixing processes in a tidal estuary. Air Water Pollut. 7, 343–356. doi: 10.1016/B978-1-4832-8391-3.50054-3
Cai W., Wang G., Dewitte B., Wu L., Santoso A., Takahashi K., et al. (2018). Increased variability of eastern Pacific El Nino under greenhouse warming. Nature 564, 201–20+. doi: 10.1038/s41586-018-0776-9
Chen C., Wang G., Xie S.-P., Liu W. (2019). Why does global warming weaken the gulf stream but intensify the kuroshio? J. Climate 32, 7437–7451. doi: 10.1175/JCLI-D-18-0895.1
Chen C.-T. A. (2009). Chemical and physical fronts in the Bohai, Yellow and East China seas. J. Mar. Syst. 78, 394–410. doi: 10.1016/j.jmarsys.2008.11.016
Chen L., Dong C., Wang G. (2020). GOCI-observed chlorophyll belts associated with sea-surface fronts in the east China sea. IEEE Geosci. Remote Sens. Lett. 17, 1299–1302. doi: 10.1109/LGRS.8859
Chin T. M., Vazquez-Cuervo J., Armstrong E. M. (2017). A multi-scale high-resolution analysis of global sea surface temperature. Remote Sens. Environ. 200, 154–169. doi: 10.1016/j.rse.2017.07.029
Derisio C., Braverman M., Gaitan E., Hozbor C., Ramirez F., Carreto J., et al. (2014). The turbidity front as a habitat for Acartia tonsa (Copepoda) in the Rio de la Plata, Argentina-Uruguay. J. Sea Res. 85, 197–204. doi: 10.1016/j.seares.2013.04.019
Dong L. X., Guan W. B., Chen Q., Li X. H., Liu X. H., Zeng X. M. (2011). Sediment transport in the yellow sea and east China sea. Estuar. Coast. Shelf Sci. 93, 248–258. doi: 10.1016/j.ecss.2011.04.003
Du Y., Qin Y., Chu D., He S., Zhang J., Wang G., et al. (2023a). Spatial and temporal variability of suspended sediment fronts over the Yangtze Bank in the Yellow and East China Seas. Estuar. Coast. Shelf Sci. 288, 108361. doi: 10.1016/j.ecss.2023.108361
Du Y., Zhang J., Bian C., Fang X., Cheng J., Wang G., et al. (2023b). Multiscale spatio-temporal variations of suspended sediment fronts in the semi-enclosed bohai sea, China. J. Geophysical Research: Oceans 128. doi: 10.1029/2023JC019773
Du Y., Zhang J., Wei Z., Yin W., Wu H., Yuan Y., et al. (2022). Spatio-temporal variability of suspended sediment fronts (SSFs) on the inner shelf of the east China sea: the contribution of multiple factors. J. Geophysical Research: Oceans 127, 1–25. doi: 10.1029/2021JC018392
Fang J., Lincke D., Brown S., Nicholls R. J., Wolff C., Merkens J.-L., et al. (2020). Coastal flood risks in China through the 21st century - An application of DIVA. Sci. Total Environ. 704, 135311. doi: 10.1016/j.scitotenv.2019.135311
Framinan M. B., Brown O. B. (1996). Study of the Rio de la Plata turbidity front.1. Spatial temporal distribution. Continental Shelf Res. 16, 1259–1267. doi: 10.1016/0278-4343(95)00071-2
Franco B. C., Ruiz-Etcheverry L. A., Marrari M., Piola A. R., Matano R. P. (2022). Climate change impacts on the patagonian shelf break front. Geophysical Res. Lett. 49. doi: 10.1029/2021GL096513
Ge J., Torres R., Chen C., Liu J., Xu Y., Bellerby R., et al. (2020). Influence of suspended sediment front on nutrients and phytoplankton dynamics off the Changjiang Estuary: A FVCOM-ERSEM coupled model experiment. J. Mar. Syst. 204, 103292. doi: 10.1016/j.jmarsys.2019.103292
Geng T., Jia F., Cai W., Wu L., Gan B., Jing Z., et al. (2023). Increased occurrences of consecutive La Nina events under global warming. Nature 619, 774–77+. doi: 10.1038/s41586-023-06236-9
Grimes C., Finucane J. (1991). Spatial distribution and abundance of larval and juvenile fish, chlorophyll and macrozooplankton around the Mississippi River discharge plume, and the role of the plume in fish recruitment. Mar. Ecol. Prog. 75, 109–119. doi: 10.3354/meps075109
Guo J., Pan H., Cao R., Wang J., Lv X. (2023). Multiple timescale variations in water transparency in the eastern China seas over the period 1997-2019. J. Geophysical Research-Oceans 128. doi: 10.1029/2022JC019170
Hafeez S., Wong M. S., Abbas S., Jiang G. (2021). Assessing the potential of geostationary himawari-8 for mapping surface total suspended solids and its diurnal changes. Remote Sens. 13, 336. doi: 10.3390/rs13030336
He S., Huang D., Zeng D. (2016). Double SST fronts observed from MODIS data in the East China Sea off the Zhejiang-Fujian coast, China. J. Mar. Syst. 154, 93–102. doi: 10.1016/j.jmarsys.2015.02.009
Hu Z., Pan D., He X., Bai Y. (2016). Diurnal variability of turbidity fronts observed by geostationary satellite ocean color remote sensing. Remote Sens. 8, 147. doi: 10.3390/rs8020147
Huang D., Zeng D., Ni X., Zhang T., Xuan J., Zhou F., et al. (2016). Alongshore and cross-shore circulations and their response to winter monsoon in the western East China Sea. Deep-Sea Res. Part Ii-Topical Stud. Oceanography 124, 6–18. doi: 10.1016/j.dsr2.2015.01.001
Jamil A. L., Kavanaugh M. T., Spitz Y. H. (2023). Drivers of physical and biological frontal variability in the northern california current system. J. Geophysical Research-Oceans 128. doi: 10.1029/2022JC019408
Jaureguizar A. J., Bava J., Carozza C. R., Lasta C. A. (2003). Distribution of whitemouth croaker Micropogonias furnieri in relation to environmental factors at the Rio de la Plata estuary, South America. Mar. Ecol. Prog. Ser. 255, 271–282. doi: 10.3354/meps255271
Kahru M., Jacox M. G., Ohman M. D. (2018). CCE1: Decrease in the frequency of oceanic fronts and surface chlorophyll concentration in the California Current System during the 2014-2016 northeast Pacific warm anomalies. Deep-Sea Res. Part I-Oceanographic Res. Papers 140, 4–13. doi: 10.1016/j.dsr.2018.04.007
Kim J.-W., Yeh S.-W., Chang E.-C. (2014). Combined effect of El Nino-Southern Oscillation and Pacific Decadal Oscillation on the East Asian winter monsoon. Climate Dynamics 42, 957–971. doi: 10.1007/s00382-013-1730-z
Kingsford M. J., Suthers I. M. (1994). DYNAMIC ESTUARINE PLUMES AND FRONTS - IMPORTANCE TO SMALL FISH AND PLANKTON IN COASTAL WATERS OF NSW, AUSTRALIA. Continental Shelf Res. 14, 655–672. doi: 10.1016/0278-4343(94)90111-2
Kirby R., Parker W. R. (1982). A suspended sediment front in the Severn Estuary. Nature 295, 396–399. doi: 10.1038/295396a0
Kirches G., Paperin M., Klein H., Brockmann C., Stelzer K. (2016). GRADHIST - A method for detection and analysis of oceanic fronts from remote sensing data. Remote Sens. Environ. 181, 264–280. doi: 10.1016/j.rse.2016.04.009
Lefevre J., Viollier M., Lecorre P., Dupouy C., Grall J. R. (1983). Remote-sensing observations of biological-material by landsat along A tidal thermal front and their relevancy to the available field data. Estuar. Coast. Shelf Sci. 16, 37. doi: 10.1016/0272-7714(83)90093-8
Lellouche J.-M., Greiner E., Le Galloudec O., Garric G., Regnier C., Drevillon M., et al. (2018). Recent updates to the Copernicus Marine Service global ocean monitoring and forecasting real-time 1/12° high-resolution system. Ocean Sci. 14, 1093–1126. doi: 10.5194/os-14-1093-2018
Li P., Chen S., Ke Y., Ji H., Li P., Fan Y. (2022). Spatiotemporal dynamics of suspended particulate matter in the Bohai Sea, China over the past decade from the space perspective. Sci. Total Environ. 851, 158210. doi: 10.1016/j.scitotenv.2022.158210
Li W., Ge J., Ding P., Ma J., Glibert P. M., Liu D. (2021). Effects of dual fronts on the spatial pattern of chlorophyll-a concentrations in and off the changjiang river estuary. Estuaries Coasts 44, 1408–1418. doi: 10.1007/s12237-020-00893-z
Li W., Wang Z., Huang H. (2019). Relationship between the southern Yellow Sea Cold Water Mass and the distribution and composition of suspended particulate matter in summer and autumn seasons. J. Sea Res. 154, 101812–101827. doi: 10.1016/j.seares.2019.101812
Liu D., Lu T., Lin L., Wei Q. (2022). Review of fronts and its ecological effects in the shelf sea of China. Adv. Mar. Sci. 40, 725–741. doi: 10.12362/j.issn.1671-6647.20220719001
Liu S. D., Qiao L. L., Li G. X., Shi J. H., Huang L. L., Yao Z. G., et al. (2018). Variation in the current shear front and its potential effect on sediment transport over the inner shelf of the east China sea in winter. J. Geophysical Research-Oceans 123, 8264–8283. doi: 10.1029/2018JC014241
Liu T., Shi Y., Xu X., Liu S., Lyu J., Zhang S., et al. (2023). Winter storms drive offshore transport and modulate phytoplankton blooms in Northern Taiwan, China. J. Hydrology 627, 130391. doi: 10.1016/j.jhydrol.2023.130391
Liu L., Wang Z. (2019). Temporal and spatial distributions and formation mechanism of suspended sediment in the coastal area of the Shandong Peninsula. Mar. Sci. 43, 11. doi: 10.11759/hykx20190312004
Lu H., Chen Z., Xu K., Liu Z., Wang C., Xu J., et al. (2022). Interannual variability of near-inertial energy in the south China sea and western north pacific. Geophysical Res. Lett. 49. doi: 10.1029/2022GL100984
Luo W., Shen F., He Q., Cao F., Zhao H., Li M. (2022). Changes in suspended sediments in the Yangtze River Estuary from 1984 to 2020: Responses to basin and estuarine engineering constructions. Sci. Total Environ. 805, 150381. doi: 10.1016/j.scitotenv.2021.150381
Luo Z., Zhu J., Wu H., Li X. (2017). Dynamics of the sediment plume over the yangtze bank in the yellow and east China seas. J. Geophysical Research-Oceans 122, 10073–10090. doi: 10.1002/2017JC013215
Lv T., Liu D., Zhou P., Lin L., Wang Y., Wang Y. (2022). The coastal front modulates the timing and magnitude of spring phytoplankton bloom in the Yellow Sea. Water Res. 220, 118669. doi: 10.1016/j.watres.2022.118669
Maciel F. P., Santoro P. E., Pedocchi F. (2021). Spatio-temporal dynamics of the Rıo de la Plata turbidity front; combining remote sensing with in-situ measurements and numerical modeling. Continental Shelf Res. 213, 104301. doi: 10.1016/j.csr.2020.104301
Miller P. (2004). Multi-spectral front maps for automatic detection of ocean colour features from SeaWiFS. Int. J. Remote Sens. 25, 1437–1442. doi: 10.1080/01431160310001592409
Mo D., Hou Y., Li J., Liu Y. (2016). Study on the storm surges induced by cold waves in the Northern East China Sea. J. Mar. Syst. 160, 26–39. doi: 10.1016/j.jmarsys.2016.04.002
Nagy G. J., Severov D. N., Pshennikov V. A., De los Santos M., Lagomarsino J. J., Sans K., et al. (2008). Rio de la Plata estuarine system: Relationship between river flow and frontal variability. Adv. Space Res. 41, 1876–1881. doi: 10.1016/j.asr.2007.11.027
Pan D., Wang Z., Zhan Q., Saito Y., Wu H., Yang S., et al. (2020). Organic geochemical evidence of past changes in hydro- and sediment-dynamic processes at river mouths: A case study of Holocene sedimentary records in the Changjiang River delta, China. Continental Shelf Res. 204, 104189. doi: 10.1016/j.csr.2020.104189
Pingree R. D., Griffiths D. K. (1978). Tidal fronts on shelf seas around british-isles. J. Geophysical Research-Oceans 83, 4615–4622. doi: 10.1029/JC083iC09p04615
Qi L., Hu C., Barnes B. B., Lapointe B. E., Chen Y., Xie Y., et al. (2022). Climate and anthropogenic controls of seaweed expansions in the east China sea and yellow sea. Geophysical Res. Lett. 49. doi: 10.1029/2022GL098185
Ramaswamy V., Rao P. S., Rao K. H., Thwin S., Rao N. S., Raiker V. (2004). Tidal influence on suspended sediment distribution and dispersal in the northern Andaman Sea and Gulf of Martaban. Mar. Geology 208, 33–42. doi: 10.1016/j.margeo.2004.04.019
Ren J.-L., Xuan J.-L., Wang Z.-W., Huang D., Zhang J. (2015). Cross-shelf transport of terrestrial Al enhanced by the transition of northeasterly to southwesterly monsoon wind over the East China Sea. J. Geophysical Research-Oceans 120, 5054–5073. doi: 10.1002/2014JC010655
Romero-Rodriguez D. A., Soto-Mardones L. A., Cepeda-Morales J., Rivera-Caicedo J. P., Inda-Diaz E. A. (2020). Satellite-derived turbidity in front of small rivers mouths in the Eastern Tropical Pacific coast of Mexico. Adv. Space Res. 66, 2349–2364. doi: 10.1016/j.asr.2020.08.007
Saldias G. S., Largier J. L., Mendes R., Perez-Santos I., Vargas C. A., Sobarzo M. (2016). Satellite-measured interannual variability of turbid river plumes off central-southern Chile: Spatial patterns and the influence of climate variability. Prog. Oceanography 146, 212–222. doi: 10.1016/j.pocean.2016.07.007
Shen F., Zhou Y.-X., Li D.-J., Zhu W.-J., Salama M. S. (2010). Medium resolution imaging spectrometer (MERIS) estimation of chlorophyll-a concentration in the turbid sediment-laden waters of the Changjiang (Yangtze) Estuary. Int. J. Remote Sens. 31, 4635–4650. doi: 10.1080/01431161.2010.485216
Shi Y., Du J., Xu X., Sheng H., Lyu J., Zhang S., et al. (2023a). Possible mechanism underlying the millennial scale variation of offshore suspended sediment transport in the North Yellow Sea. Mar. Geology 463, 107123. doi: 10.1016/j.margeo.2023.107123
Shi Y., Gao J. H., Sheng H., Du J., Jia J. J., Wang Y. P., et al. (2019). Cross-front sediment transport induced by quick oscillation of the yellow sea warm current: evidence from the sedimentary record. Geophysical Res. Lett. 46, 226–234. doi: 10.1029/2018GL080751
Shi J., Liu Y., Mao X., Guo X., Wei H., Gao H. (2017). Interannual variation of spring phytoplankton bloom and response to turbulent energy generated by atmospheric forcing in the central Southern Yellow Sea of China: Satellite observations and numerical model study. Continental Shelf Res. 143, 257–270. doi: 10.1016/j.csr.2016.06.008
Shi Y., Zhang M., Xu X., He M., Liu Y., Du J., et al. (2023b). Ecological effects of offshore transport in the shelf sea and its response to climate warming. Global Planetary Change 229, 104240. doi: 10.1016/j.gloplacha.2023.104240
Silverberg N., Sundby B. (1979). Observations in the turbidity maximum of the St. Lawrence Estuary. Can. J. Earth Sci. 16, 939–950. doi: 10.1139/e79-080
Stramska M. (2005). Interannual variability of seasonal phytoplankton blooms in the north polar Atlantic in response to atmospheric forcing. J. Geophysical Research-Oceans 110. doi: 10.1029/2004JC002457
Stukel M. R., Aluwihare L. I., Barbeau K. A., Chekalyuk A. M., Goericke R., Miller A. J., et al. (2017). Mesoscale ocean fronts enhance carbon export due to gravitational sinking and subduction. Proc. Natl. Acad. Sci. United States America 114, 1252–1257. doi: 10.1073/pnas.1609435114
Wall C. C., Muller-Karger F. E., Roffer M. A., Hu C., Yao W., Luther M. E. (2008). Satellite remote sensing of surface oceanic fronts in coastal waters off west-central Florida. Remote Sens. Environ. 112, 2963–2976. doi: 10.1016/j.rse.2008.02.007
Wang F., Li X., Tang X., Sun X., Zhang J., Yang D., et al. (2023a). The seas around China in a warming climate. Nat. Rev. Earth Environ. 4, 535–551. doi: 10.1038/s43017-023-00453-6
Wang C., Liu Z., Harris C. K., Wu X., Wang H., Bian C., et al. (2020). The impact of winter storms on sediment transport through a narrow strait, bohai, China. J. Geophysical Research-Oceans 125. doi: 10.1029/2020JC016069
Wang Y., Liu J., Liu H., Lin P., Yuan Y., Chai F. (2021). Seasonal and interannual variability in the sea surface temperature front in the eastern pacific ocean. J. Geophysical Research-Oceans 126. doi: 10.1029/2020JC016356
Wang H., Wang A., Bi N., Zeng X., Xiao H. (2014). Seasonal distribution of suspended sediment in the Bohai Sea, China. Continental Shelf Res. 90, 17–32. doi: 10.1016/j.csr.2014.03.006
Wang Y., Xu M., Feng Z., Zhang F., Cao F., Wu H. (2023b). Tidal variability of phytoplankton distribution in the highly turbid changjiang river estuary: mechanisms and implications. J. Geophysical Research-Oceans 128. doi: 10.1029/2023JC020090
Wei Q., Fu M., Li X. S., Sun J., Wang B. D., Yu Z. (2022). “Front-driven physical–biogeochemical–ecological interactions in the yellow sea large marine ecosystem,” in Belkin I. M.ed. Chemical oceanography of frontal zones, Handbook of environmental chemistry series, this volume. (Berlin: Springer-Verlag GmbH Germany). doi: 10.1007/698_2021_832
Wei Q., Fu M., Sun J., Yao Q., Wang B., Liu X., et al. (2020). Seasonal physical fronts and associated biogeochemical-ecological effects off the Jiangsu shoal in the western yellow sea, China. J. Geophysical Research-Oceans 125. doi: 10.1029/2020JC016304
Wells J. T., Huh O. K. (1984). Fall-season patterns of turbidity and sediment transport in the korea strait and southeastern yellow sea - scienceDirect. Elsevier Oceanography Ser. 39, 387–397. doi: 10.1016/S0422-9894(08)70314-3
Wu H., Shen J., Zhu J., Zhang J., Li L. (2014). Characteristics of the Changjiang plume and its extension along the Jiangsu Coast. Continental Shelf Res. 76, 108–123. doi: 10.1016/j.csr.2014.01.007
Wu X., Wu H., Wang H., Bi N., Duan H., Wang C., et al. (2019). Novel, repeated surveys reveal new insights on sediment flux through a narrow strait, bohai, China. J. Geophysical Research-Oceans 124, 6927–6941. doi: 10.1029/2019JC015293
Wu J., Zhang T., Hu J. (2016). Temporal and spatial distribution of suspended sediment fronts in yangtze river estuary and adjacent waters based on GOCI satellite data. Trans. Oceanology Limnology 2, 1–7. doi: CNKI:SUN:HYFB.0.2016-02-001
Xia L., Liu H., Lin L., Wang Y. (2021). Surface chlorophyll-A fronts in the yellow and bohai seas based on satellite data. J. Mar. Sci. Eng. 9, 1301. doi: 10.3390/jmse9111301
Xing Q., Yu H., Wang H., Ito S.-I. (2023). An improved algorithm for detecting mesoscale ocean fronts from satellite observations: Detailed mapping of persistent fronts around the China Seas and their long-term trends. Remote Sens. Environ. 294, 113627. doi: 10.1016/j.rse.2023.113627
Xu Q., Li Y., Cheng Y., Ye X., Zhang Z. (2022). Impacts of climate oscillation on offshore wind resources in China seas. Remote Sens. 14, 1879. doi: 10.3390/rs14081879
Yin W., Huang D. (2016). Evolution of submesoscale coastal frontal waves in the East China Sea based on geostationary ocean color imager observational data. Geophysical Res. Lett. 43, 9801–9809. doi: 10.1002/2016GL070232
Yu S., Song Z., Bai Y., Guo X., He X., Zhai W., et al. (2023). Satellite-estimated air-sea CO2 fluxes in the Bohai Sea, Yellow Sea, and East China Sea: Patterns and variations during 2003-2019. Sci. Total Environ. 904, 166804. doi: 10.1016/j.scitotenv.2023.166804
Yuan D. L., Qiao F. L., Su J. (2005). Cross-shelf penetrating fronts off the southeast coast of China observed by MODIS. Geophysical Res. Lett. 32. doi: 10.1029/2005GL023815
Zhang Y., Hu C. (2021). Ocean temperature and color frontal zones in the gulf of Mexico: where, when, and why. J. Geophysical Research: Oceans 126, e2021JC017544. doi: 10.1029/2021JC017544
Zhang K., Li A., Huang P., Lu J., Liu X., Zhang J. (2019). Sedimentary responses to the cross-shelf transport of terrigenous material on the East China Sea continental shelf. Sedimentary Geology 384, 50–59. doi: 10.1016/j.sedgeo.2019.03.006
Zhao X., Hou Y., Qi P. (2010). Interpretation of sea surface wind interannual vector EOFs over the China seas. Chin. J. Oceanology Limnology 28, 340–343. doi: 10.1007/s00343-010-9253-5
Zhao L., Yang D., Zhong R., Yin X. (2022). Interannual, seasonal, and monthly variability of sea surface temperature fronts in offshore China from 1982-2021. Remote Sens. 14, 5336. doi: 10.3390/rs14215336
Keywords: turbidity fronts, interannual variability, The Eastern China Seas, local processes, ocean warming, El Niño-Southern oscillation
Citation: Du Y, Fan D and Zhang J (2025) Linking interannual variability of turbidity fronts in the Eastern China Seas to local processes and ocean warming. Front. Mar. Sci. 12:1530555. doi: 10.3389/fmars.2025.1530555
Received: 19 November 2024; Accepted: 14 January 2025;
Published: 03 February 2025.
Edited by:
Chunyan Li, ouisiana State University, United StatesReviewed by:
Tien Anh Tran, Seoul National University, Republic of KoreaCopyright © 2025 Du, Fan and Zhang. This is an open-access article distributed under the terms of the Creative Commons Attribution License (CC BY). The use, distribution or reproduction in other forums is permitted, provided the original author(s) and the copyright owner(s) are credited and that the original publication in this journal is cited, in accordance with accepted academic practice. No use, distribution or reproduction is permitted which does not comply with these terms.
*Correspondence: Daidu Fan, ZGRmYW5AdG9uZ2ppLmVkdS5jbg==
Disclaimer: All claims expressed in this article are solely those of the authors and do not necessarily represent those of their affiliated organizations, or those of the publisher, the editors and the reviewers. Any product that may be evaluated in this article or claim that may be made by its manufacturer is not guaranteed or endorsed by the publisher.
Research integrity at Frontiers
Learn more about the work of our research integrity team to safeguard the quality of each article we publish.