 Dongrong Zhang
 Hengtao Xu1,2*†
 Xin Fang
 Youzheng Zhang
 Jian Qian
- 1Key Laboratory of Engineering Oceanography, Second Institute of Oceanography, Ministry of Natural Resources (MNR), Hangzhou, China
- 2Key Laboratory of Nearshore Engineering Environment and Ecological Security of Zhejiang Province, Hangzhou, China
- 3Key Laboratory of Marine Ecosystem Dynamics, Second Institute of Oceanography, MNR, Hangzhou, China
Fish play a crucial role in the estuarine ecosystem due to their ecological and commercial significance. Consequently, it is essential to study the characteristics of fish communities and their impacts within the estuary. In this study, we employed a single-boat bottom trawl to conduct four fishery resource surveys in April (spring), August (summer), October (autumn), and December (winter) of 2020 at ten sampling sites along the south bank of the Yangtze River Estuary (SBYRE). The primary objective was to assess the influence of water masses and environmental variables on the spatial and temporal distribution and diversity of fish communities in the SBYRE. The results indicated that fish biomass and abundance during summer were significantly higher than those observed in the other three seasons. High-value areas were predominantly located on the nearshore of the SBYRE and the north bank of Hangzhou Bay, a finding also corroborated by the cluster heat map results. Furthermore, the environmental variables in summer differed significantly from those in the other seasons, suggesting that the temporal and spatial distribution of fish was substantially influenced by these variables during the summer months. Mantel test and redundancy analysis demonstrated a positive correlation between the biomass and abundance of fish in summer and the factors of temperature and salinity. The seasonal alternation of dominant fish species contributes significantly to the heterogeneity observed in the temporal and spatial distribution of their communities. The reduced biomass and abundance of fish in spring were attributed to the lower influx of freshwater from the upstream. Seasonal variations in the fronts created by the confluence of multiple water masses in the study area, which play a crucial role in influencing the temporal and spatial distribution of fish communities. Furthermore, the presence of these fronts provides suitable habitats for spawning, feeding, and fattening for various fish species, making them ideal environments for numerous migratory fish. This study enhances our understanding of the temporal and spatial heterogeneity of fish communities in estuarine ecosystems and the factors influencing them, offering valuable insights for the protection and restoration of estuarine marine ecosystems.
1 Introduction
Estuarine regions, as the confluence of ocean and river systems, are characterized by complex and dynamic environments, high biodiversity and productivity, as well as significant levels of human disturbance (Hossain et al., 2012; Merigot et al., 2017). These ecosystems are distinctive due to their unique geographic location and favorable ecological conditions (Day et al., 2012). The interplay of upstream freshwater runoff and the intrusion of tidal water masses results in nutrient enrichment within estuaries, creating a pronounced edge effect in these ecosystems (Day et al., 2012; O’Meara et al., 2017). This exceptional ecological environment facilitates the seasonal migration of numerous economically important fish species to the coastal waters near estuaries for spawning, feeding, and fattening (Barletta et al., 2003; Kamrani et al., 2015; Islam et al., 2017). Fish within estuarine ecosystems play a critical role in maintaining ecological balance, enhancing biodiversity, and supporting the sustainable development of fisheries, as they are integral components of the food chain or food web (Craven et al., 2018; McLean et al., 2019). The community structure of fish in coastal waters adjacent to estuaries is often influenced by both natural factors (e.g., temperature, salinity, water mass) and anthropogenic factors (e.g., DIN and DIP inputs from runoff), leading to a concerning trend of declining fishery resources and species diversity (Cheung et al., 2013; 2016; Frelat et al., 2018). Therefore, it is imperative to investigate the temporal and spatial heterogeneity of fish communities in the coastal waters near estuaries, as well as the factors that influence them.
The Yangtze River Estuary (YRE) is the largest estuary in China, situated in the Yangtze River Delta region where the Yellow Sea and the East China Sea converge (Quan et al., 2009; Shan et al., 2010; Chen et al., 2022). Throughout the year, the estuary and its adjacent waters are abundant in water and sediment, with an average annual discharge of 9.3 × 10¹¹ m³ and an average sediment load of 4.8 × 10⁸ tons (Liu et al., 2018). This estuary serves as a crucial transition area for material exchange between terrestrial and marine ecosystems, characterized by abundant fish resources and biodiversity (Zeng et al., 2022). Influenced by multiple water masses—including the Yangtze River Runoff (YRR), the Yellow Sea Coastal Current (YSCC), and the East China Sea Current (ECSC)—the estuary and its adjacent waters exhibit high productivity and an exceptionally rich array of food resources. These conditions provide a vital habitat for fish to spawn, feed, and grow (Yang et al., 2012; Wang et al., 2021), rendering the YRE and its adjacent waters a distinctive estuarine ecosystem characterized by unique structure and function (Quan et al., 2009; Chen et al., 2022). Consequently, the favorable habitat, feeding, and breeding conditions have established the YRE and its surrounding waters as the largest estuarine fishery in China, known as the Yangtze estuarine fishery (Shan et al., 2010; Chen et al., 2022). As a result, the YRE has become one of the primary sources for China’s fishing industry (Shan et al., 2010; Chen et al., 2022). However, in recent years, the estuary and its surrounding waters have faced significant anthropogenic environmental pressures. Large discharges of municipal and industrial wastewater have led to excessive nutrient levels, including inorganic carbon and reactive phosphates. The intensification of eutrophication has resulted in frequent red tides (Cheung et al., 2013; Frelat et al., 2018), which have severely impacted the spawning and migratory activities of fish and contributed to a notable decline in fish catches (Shan et al., 2010; Chen et al., 2022). Furthermore, human engineering activities, such as channel regulation and coastal engineering projects like mudflat reclamation, have altered the hydrodynamic conditions of the estuary, leading to habitat destruction or loss (Chen et al., 2022). Human activities have significantly altered the ecological environment of the YRE, which will inevitably impact the community characteristics and diversity levels of fish (Wang et al., 2021; Chen et al., 2022). Recent studies have indicated that the fishery resources in the YRE and its surrounding waters are facing substantial threats, exhibiting clear signs of resource decline, including decreased biodiversity, reduced individual catch, and diminished fishery resource production (Quan et al., 2009; Shan et al., 2010; Zhuang, 2018; Chen et al., 2022). Consequently, there is an urgent need for ecological protection, restoration, and biodiversity recovery in the estuary (Zhuang, 2018; Wang et al., 2020). Previous research on fish in the YRE has concentrated on aspects such as individual size relationships, species composition, and biodiversity (Zhang et al., 2007; Quan et al., 2009; Shan et al., 2010; Che et al., 2022). However, investigations into the factors influencing fish communities remain relatively limited. For instance, Kindong et al. (2020) employed multivariate techniques to analyze the diversity and distribution patterns of fish species in the YRE, underscoring the significance of estuarine conditions for the growth and development of most species. Additionally, Yu and Xian (2009) examined the fish community structure in the YRE and adjacent waters using historical fish abundance data, revealing that interannual variations in environmental factors significantly contribute to fish community succession. Nonetheless, current research on the seasonal and spatial changes of fish communities in the YRE, particularly in the waters off the south bank, remains inadequate, especially regarding the combined effects of water masses and environmental variables.
This study focuses on the marine area near the SBYRE, situated at the confluence of the YRE and the Hangzhou Bay Estuary (Figure 1). This region is a critical component of the YRE ecosystem, primarily influenced by the mixing of various water masses, including the YRR, the Qiantang River Runoff (QTRR), the YSCC, and the ECSC (Yang et al., 2012; Wang et al., 2021; Zhang et al., 2022). The favorable environmental conditions present in the estuary provide essential habitats for the spawning, feeding, and growth of migratory fish (Yang et al., 2012; Wang et al., 2021). However, the unique hydrological environment, coupled with the impact of environmental variables, has resulted in significant uncertainty regarding the temporal and spatial distribution of fish communities in this area (Day et al., 2012). In recent years, fish resources in the SBYRE have shown signs of serious decline due to multiple factors, including overfishing, water pollution, dyke shoreline construction, and dredging for port shipping (Cornwall and Eddy, 2015; Gobler and Baumann, 2016; Chen et al., 2022). Consequently, we pose 2 questions: 1) Is there a seasonal difference in the spatiotemporal distribution of fish communities? 2) How do water masses and environmental variables influence the spatiotemporal distribution of fish communities? Through these questions, we aim to evaluate the heterogeneity of fish resource distribution in this typical estuarine sea, with the expectation of elucidating the mechanisms by which water masses and environmental changes regulate the patterns and structures of fish communities. This research seeks to provide a reliable scientific basis for the future protection and assessment of biodiversity restoration within the YRE ecosystem.
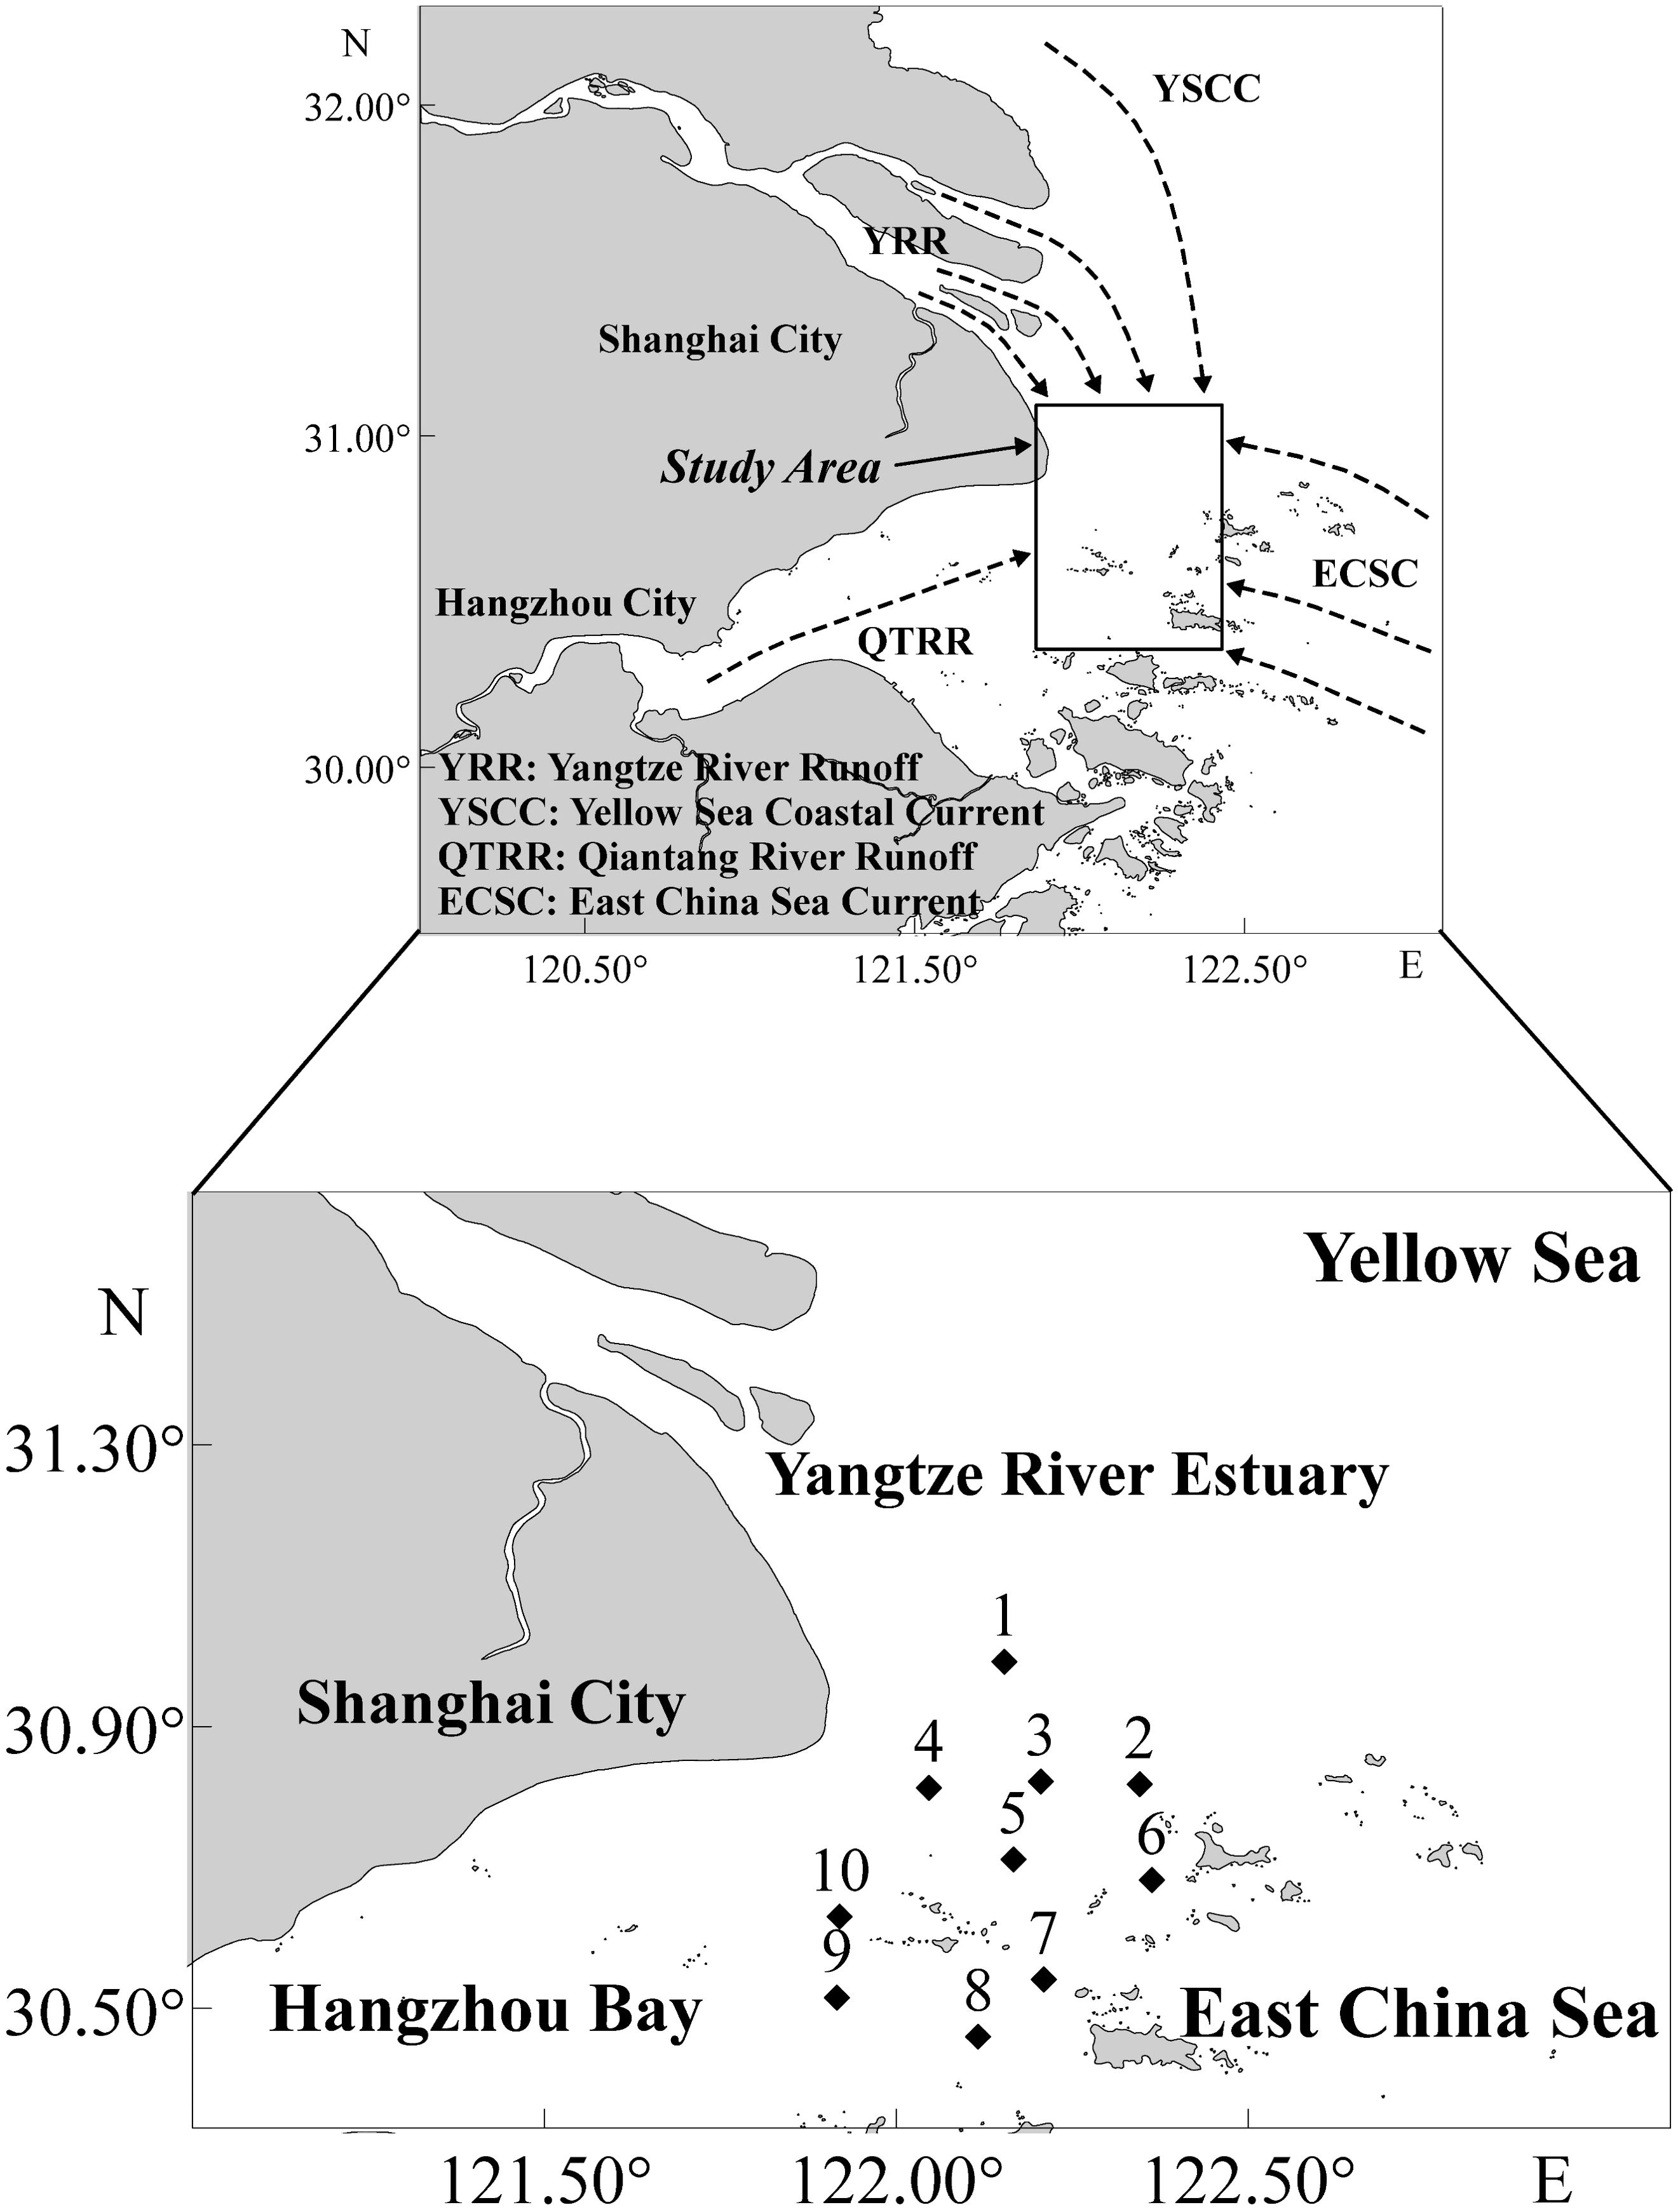
Figure 1. Study area and sampling sites in the south bank of Yangtze River Estuary (SBYRE), China.
2 Materials and methods
2.1 Study area and sample collection
The SBYRE coincides with the mud belt formed by the deposition of sediments transported by the Yangtze River’s freshwater (Wu and Wu, 2018). This area is influenced by the northeastward freshwater input from the Yangtze River, the intrusion of coastal water masses from the Yellow Sea to the north, the runoff from the Qiantang River to the west, and the incursion of offshore water masses from the East China Sea to the east (Figure 1; Yang et al., 2012; Wang et al., 2021; Zhang et al., 2022). The mixing of these various water masses significantly affects the distribution and fluctuations of physical and chemical environmental factors in the SBYRE.
In April (spring), August (summer), October (autumn), and December (winter) 2020, we conducted four seasonal fishery resource surveys in the SBYRE, encompassing 10 sampling sites (Figure 1). We utilized a single boat bottom trawl with a cod-end mesh ranged from 20 mm to 40 mm and a 10 m mouth width towing the net from the surface to the bottom for 30 minutes at an average speed of 3.4 knots to collect fish samples. Following the trawling, the fish in the catch (or a representative sample if the catch was abundant) were frozen and transported to the laboratory for biological identification, classification, and quantification. Fish sampling and analysis adhered to the national standards of the People’s Republic of China (GB/T12763.6-2007, 2007). The fish names and classifications were based on Nelson’s classification system (Nelson, 2006) with reference to the FAO fish database (Froese and Pauly, 2013).
2.2 Environmental variables collection and analysis
We investigated environmental variables in accordance with the national standards of the People’s Republic of China (GB/T12763.6-2007, 2007; GB 17378.4-2007, 2008), including surface temperature, surface salinity, water depth, transparency, suspended particulate matter (SPM), dissolved oxygen (DO), chemical oxygen demand (COD), dissolved inorganic nitrogen (DIN), dissolved inorganic phosphorus (DIP), and chlorophyll a (Chl-a). Surface salinity, temperature, and depth were measured using a conductivity-temperature-depth probe, while water transparency was assessed with a Secchi disk. For SPM analysis, samples were filtered through preweighed filters (Whatman GF/C), dried to a constant mass at 105°C, and subsequently weighed. The dry mass of particulate material trapped on each filter was calculated by subtracting the mass of the filter from the dry mass. Water samples were collected at a depth of 0.5 m using a Rossette bottle; DO was determined by the iodine method, COD by the alkaline potassium permanganate method, and DIN and DIP by colorimetry. To measure the concentration of Chl-a, a 250 mL water sample was gently filtered through a 0.45 μm cellulose filter. The filtered sample was then extracted in 90% acetone for 24 hours at 0°C in the dark. The mean Chl-a concentration was subsequently determined before and after acidification using fluorescence measurements conducted with a Unic Design 7200 AU fluorometer (Parsons et al., 1984).
2.3 Data analysis
Prior to statistical analysis, all data—including environmental variables, fish abundance, fish biomass, and the Shannon-Wiener diversity index (H’)—were tested for normality and homogeneity of variance using the Kolmogorov-Smirnov test in SPSS 21.0. If the data met the criteria for normality and homogeneity of variance, one-way analysis of variance, followed by Tukey’s post hoc test, was employed to conduct pairwise comparisons of significantly different parameters (P< 0.05). Conversely, in cases of non-normality or unequal variance, the non-parametric Kruskal-Wallis H test was utilized to assess differences, followed by the Mann-Whitney U test with an adjusted P value for pairwise comparisons (Keselman et al., 1979; Zhang et al., 2022).
The original fish survey data were standardized prior to analysis. The formula for estimating fish density was using the standardized swept area method, as follows (Zhan, 1995):
where D represents the fish density (kg/km² or ind/km²), C denotes the average trawl catch per hour (kg/h or ind/h), and a indicates the area covered by the trawl per hour (km²/h). The area is calculated as the horizontal trawl width (km) multiplied by the tow distance (km), with the trawl width in this study being 1.0 × 10-² km. The average trawling speed (km/h) is multiplied by the actual trawling time (h) to determine the trawling distance, and q is the catch rate of the trawl, set at 0.5 in this study (Li et al., 2017; Jiang et al., 2018).
Dominant species are identified using the Index of Relative Importance (IRI), defined as (Pinkas et al., 1971):
Here, W represents the percentage of biomass of a species in relation to the total biomass, N denotes the percentage of abundance of a species compared to the total abundance, and F indicates the frequency of occurrence of a species in all sampling sites. Species with an IRI ≥ 100, which includes important species (100 ≤ IRI< 1000) and dominant species (IRI ≥ 1000), are classified as the main species within the fish community (Wang et al., 2010; Lin et al., 2012). The Shannon-Wiener diversity index (H’) is employed to analyze fish species diversity and is defined as follows (Shannon and Weaver, 1963):
In this context, Pi refers to the ratio of the number or weight of individuals of species i to the total number of individuals or total biomass of fish, while S is the number of species recorded at each sampling site during each sampling period. For the seasonal alternate index (AI) of dominant fish species, the following formula is applied (Liu, 1992):
In this formula, C represents the number of species that have either increased or decreased between the two seasons, and S denotes the number of species that remain consistent across both seasons. AI facilitates the comparison of species alternated from the previous season, such as spring compared to winter. The alternate index provides insight into the rhythm of community stability in relation to species alternating; a higher AI indicates lower community stability.
We employed similarity percentage analysis (SIMPER) using PRIMER V5.0 software to examine the contributions of fish species to community structure across different seasons (Ramos et al., 2017). Concurrently, we utilized single-factor similarity analysis (ANOSIM) to assess the significance of differences in species composition and abundance of fish communities across seasons (Zhai et al., 2015). To examine the relationship between fish community structure and environmental variables, we initially utilized the “linkET” package in R 4.0.2 software (Huang, 2021) to conduct a Mantel correlation analysis assessing the correlation among fish biomass, abundance, the Shannon-Wiener diversity index (H’), and environmental variables.
To analyze the relationship between the biomass and abundance of main fish species (both important and dominant species) and environmental variables, we utilized Canoco V5.0 software to conduct a correspondence analysis (DCA) on the biomass and abundance data of fish. Subsequently, we employed a redundancy analysis (RDA) model (Ter Braak and Šmilauer, 2002) and analyzed the results using a Monte Carlo permutation test (P<0.05). The RDA sequence diagram effectively illustrates the relationships between fish and environmental factors.
Maps of the study area and sampling sites, as well as distributions of fish biomass and abundance, were generated using Surfer V15.0 software. Additionally, biomass and abundance maps, cluster heat maps, the Shannon-Wiener diversity index (H’), and seasonal variations in dominant species were created using Origin 2024b software.
3 Results
3.1 Environmental variables
Seasonal variations in environmental variables were significant in the SBYRE (Table 1). Notable differences were observed in surface water temperature between spring and summer, summer and winter, and autumn and winter (P=0.001, P<0.001, P=0.001). Surface salinity in summer significantly differed from both spring and winter (P<0.001, P<0.001); water transparency in summer was also significantly different from both autumn and winter (P<0.001, P<0.001). Additionally, SPM was significantly different across the three seasons of spring, autumn, and winter (P=0.05, P=0.005, P<0.001). DIP in summer significantly varied from those in spring, autumn, and winter (P=0.001, P=0.03, P=0.015), while Chl-a concentration in summer were significantly different from those in spring and autumn (P=0.006, P=0.003). Furthermore, DO in winter was significantly different from those in the other three seasons (P=0.005, P<0.001, P=0.006). Significant differences were also found between spring COD and those in both summer and autumn (P<0.001, P=0.02). Finally, DIN in autumn and winter were significantly different from those in spring and summer (P=0.027, P=0.003, P<0.001, P<0.001).
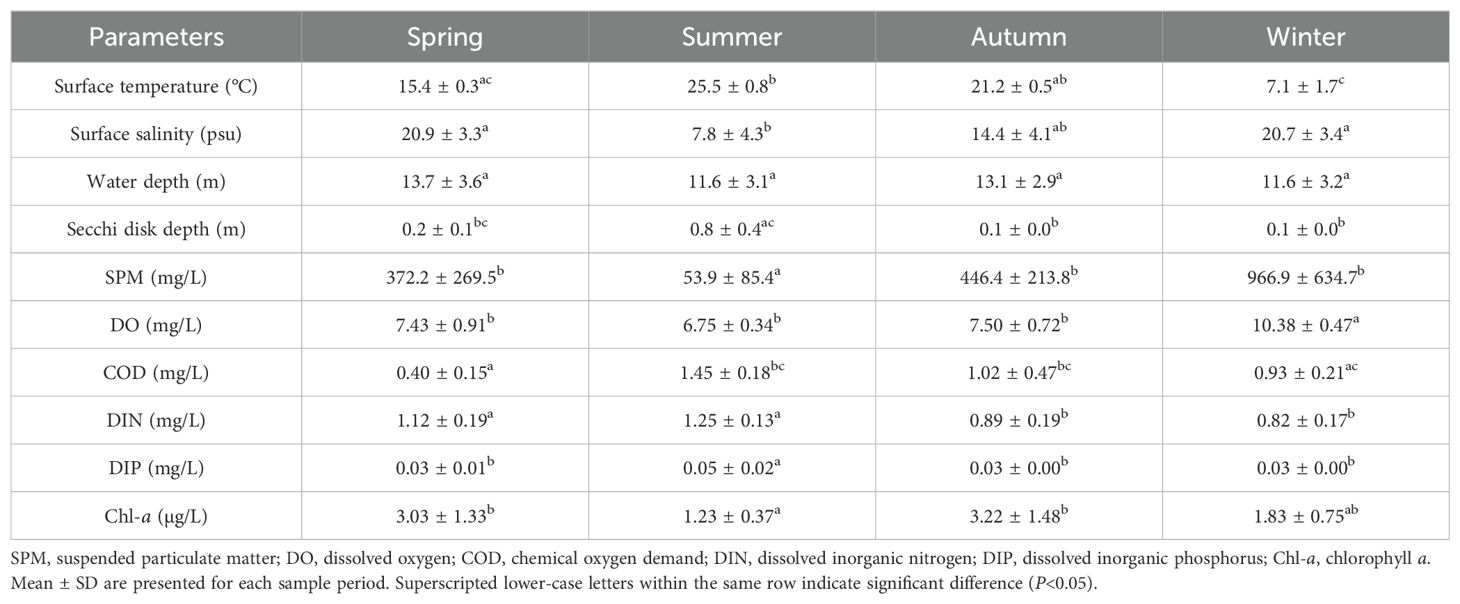
Table 1. Comparison of environmental variables in different seasons in the SBYRE.
3.2 Fish community
The mean biomass of fish was significantly lower in spring (69.20 ± 59.88 kg/km²) compared to the other three seasons, with a significant difference noted between spring and summer (P=0.022); the mean biomass was highest in summer (878.53 ± 782.77 kg/km²). Similarly, the mean fish abundance was lowest in spring (3.49 ± 3.95 ×10³ ind./km²) and highest in summer (141.24 ± 175.65 ×10³ ind./km²), with winter showing the next highest abundance (64.94 ± 113.86 ×10³ ind./km²). Significant differences in fish abundance were observed between spring-summer and spring-winter (P<0.001; P=0.006) (Figure 2A). ANOSIM and SIMPER analyses also indicated significant seasonal differences in fish abundance between spring and summer, as well as between spring and winter. The primary contributing species included Collichthys lucidus, Miichthys miiuy, Harpodon nehereus, Coilia nasus, and Coilia mystus (Supplementary Table S1). The spatiotemporal distribution of fish biomass (Figure 3) indicated that areas of high biomass values were present in spring and summer along the nearshore side of the SBYRE and the north coast of Hangzhou Bay, while in autumn and winter, areas with high biomass were observed near the islands. High abundance areas were also noted in summer and autumn along the nearshore side of the SBYRE and the north coast of Hangzhou Bay, as well as in winter and spring in the eastern part of the surveyed area and the nearshore side of the SBYRE.
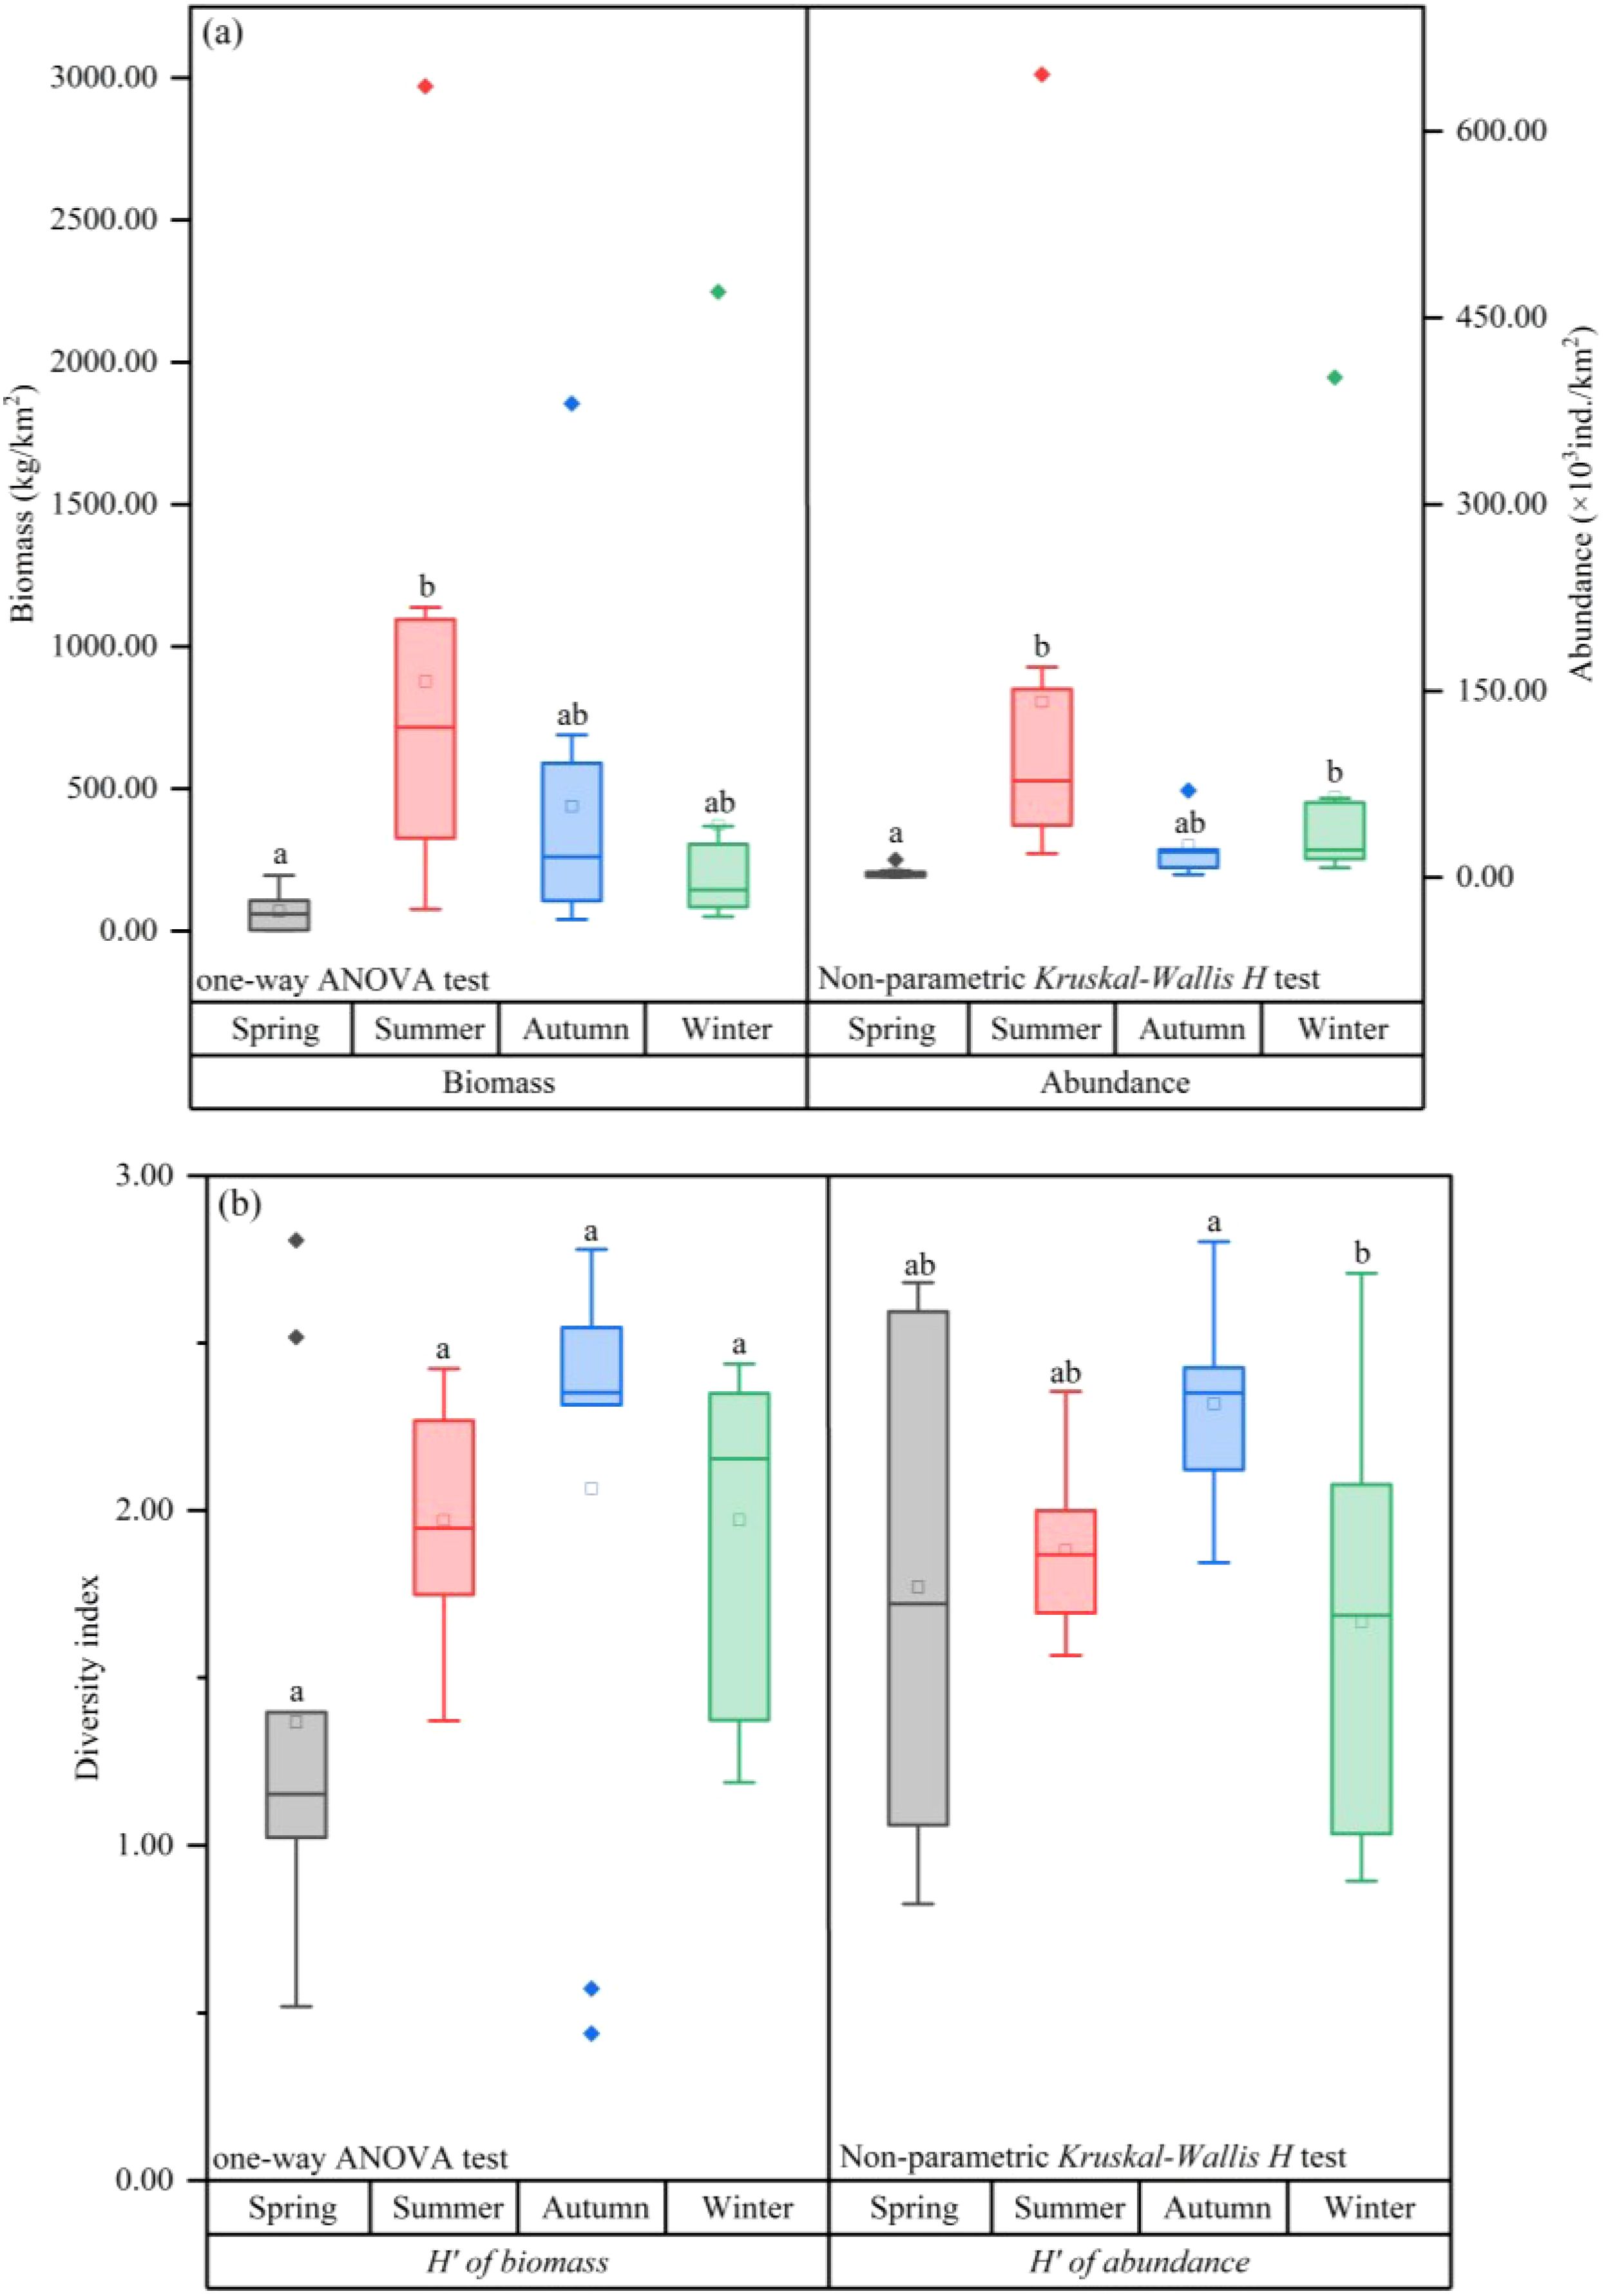
Figure 2. (A) Differences in fish biomass and abundance between seasons; (B) differences in biomass and abundance diversity index (H') between seasons. Lowercase letters added at the top of the boxplots are used to indicate groups significant differences between groups, words with the same letters indicate no significant differences between groups, and different letters indicate significant differences.
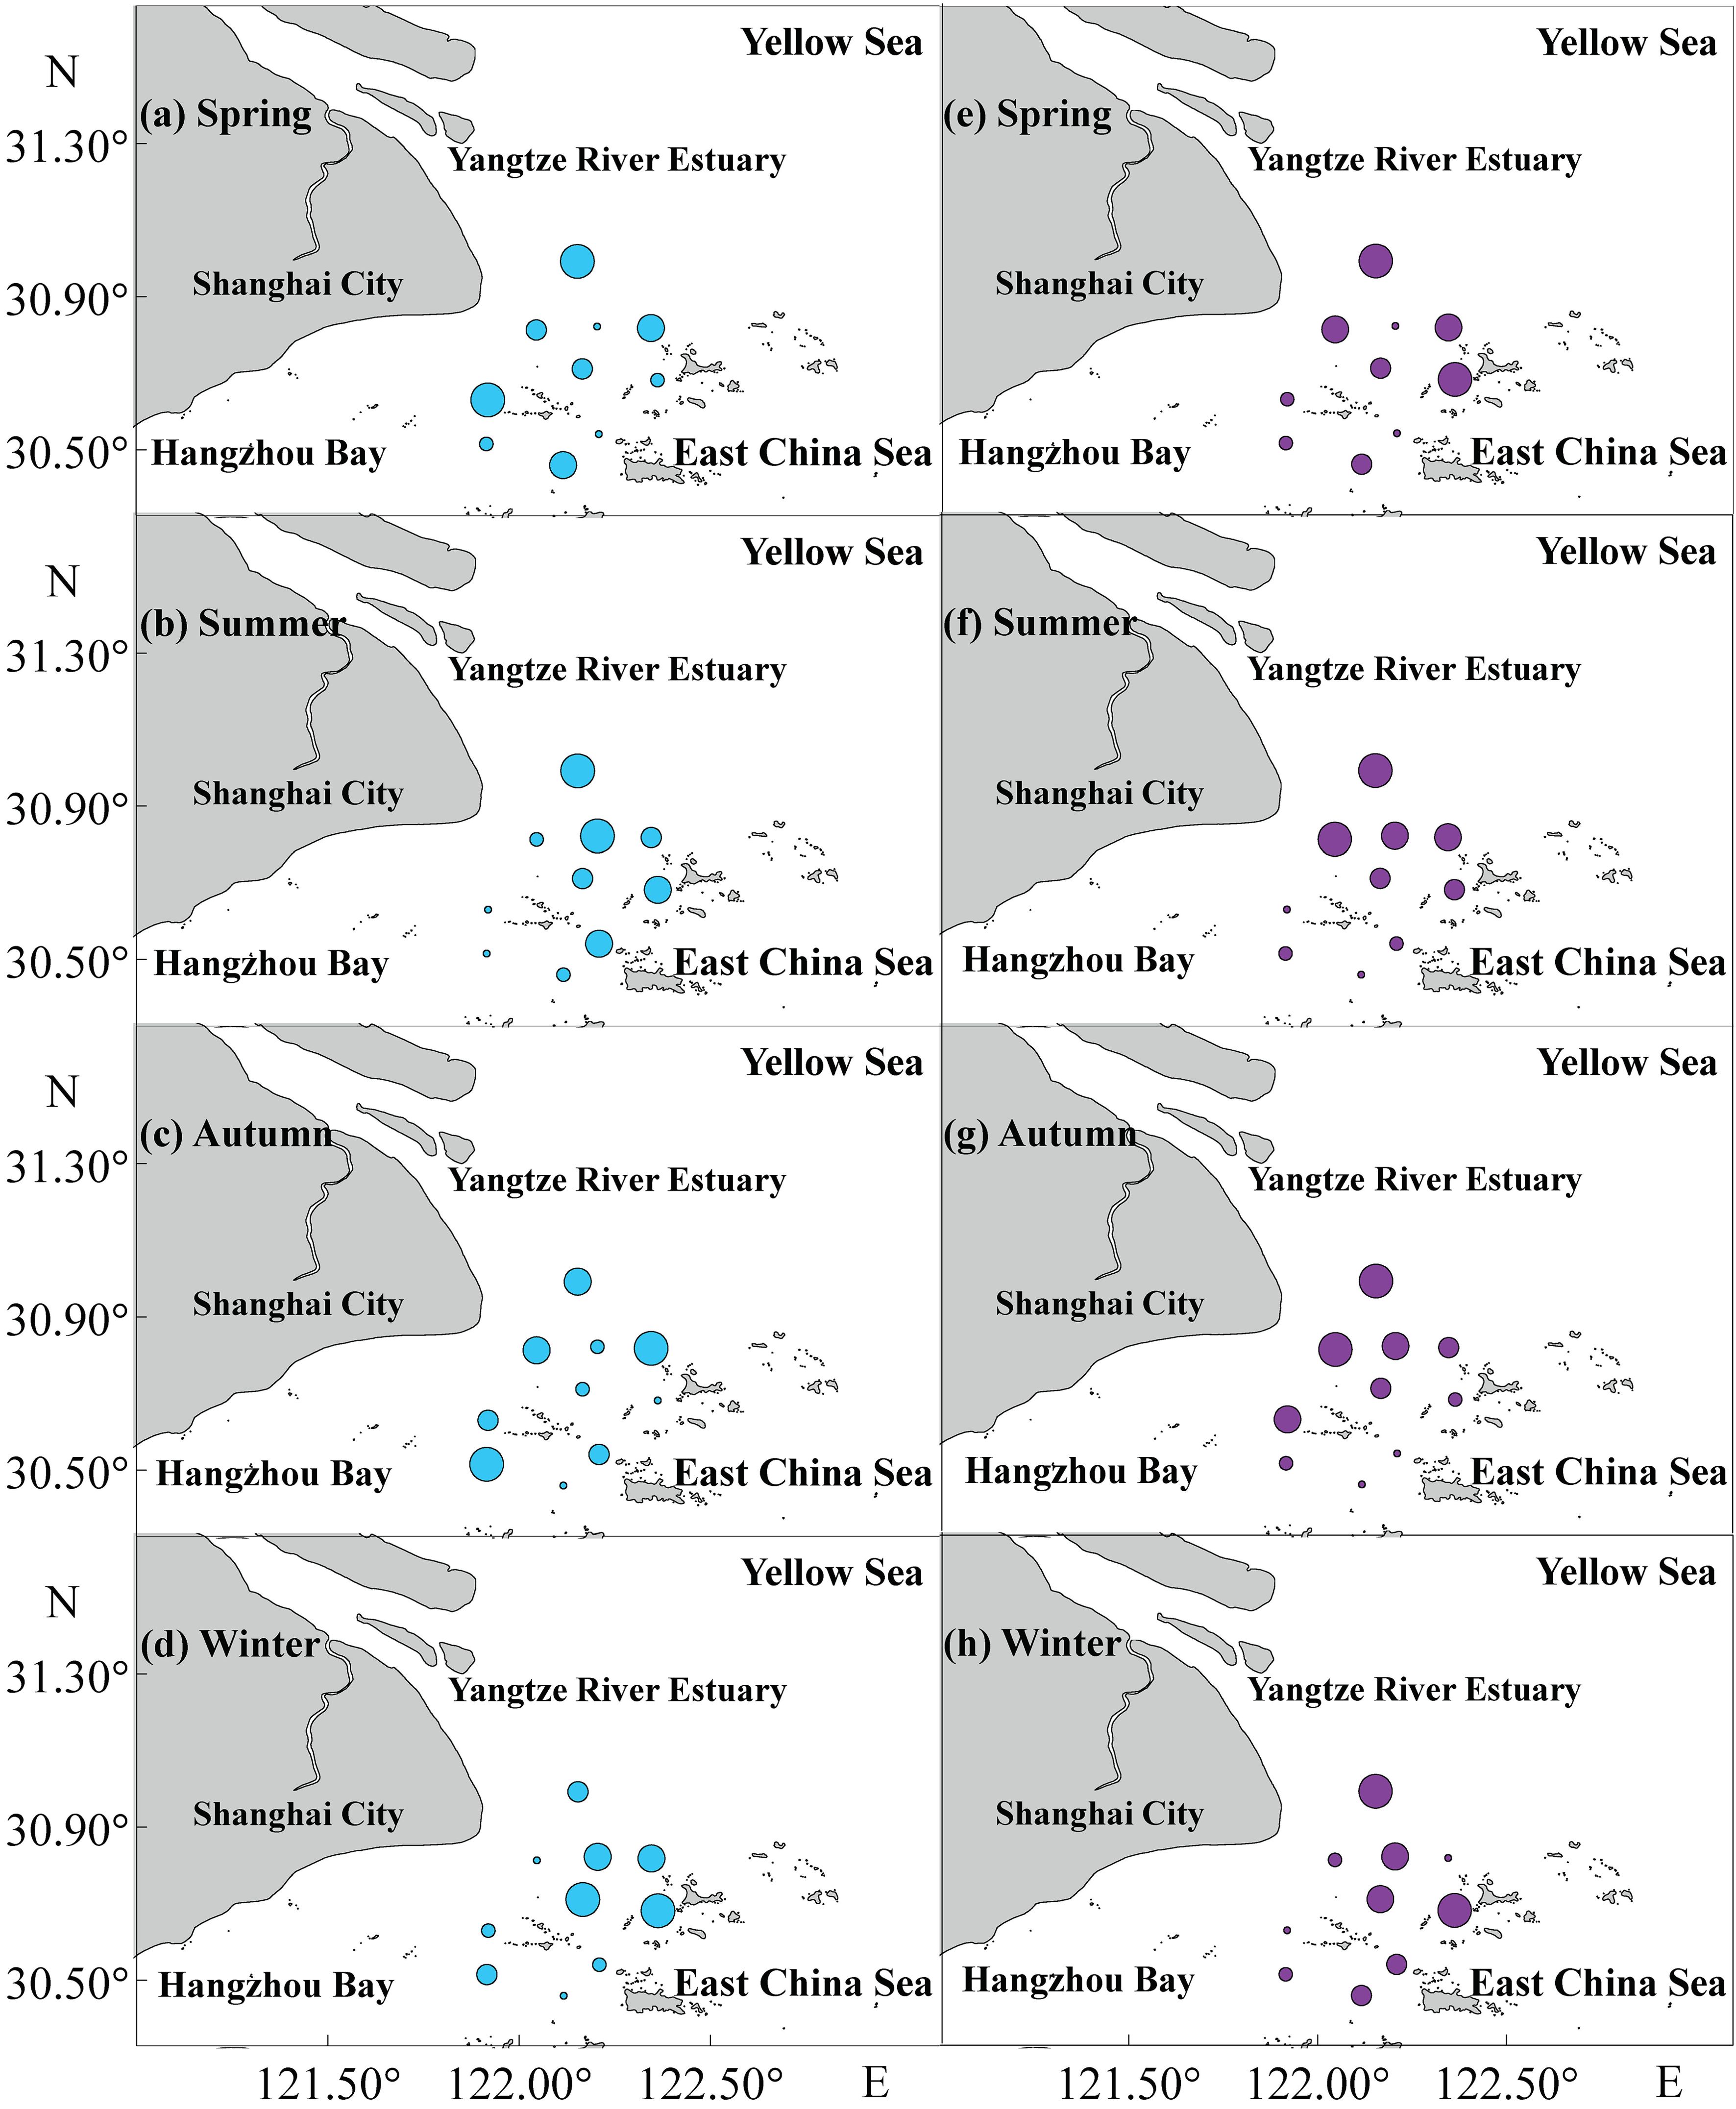
Figure 3. Spatial distribution of fish biomass (kg/km2) and abundance (×103 ind./km2) in the SBYRE throughout four seasons. (A–D) represents fish biomass with different sizes of sky-blue bubble; (E–H) represents fish abundance with different sizes of purple bubble.
M. miiuy and C. mystus emerged as the dominant species (IRI > 1000) with very high resource density across all four seasons. Cynoglossus joyneri was identified as a common species throughout the seasons (100 ≤ IRI< 1000). Notably, there was an alternation in dominant species between seasons, with the AI of 33.33%, 44.44%, 45.45%, and 36.36%. For instance, C. lucidus was a common species in winter and spring but became a dominant species in summer and autumn. Similarly, C. nasus was common species in spring and autumn while being dominant species in summer and winter. H. nehereus was dominant species in summer and autumn, common species in winter, and neither dominant nor common species in spring (Figure 4). Furthermore, the fish diversity index exhibited significant seasonal variations. The biomass diversity index was highest in autumn (2.07 ± 0.79) and lowest in spring (1.37 ± 0.69). The diversity index of abundance was also highest in autumn (2.32 ± 0.28) and lowest in winter (1.67 ± 0.57), with a significant difference observed between autumn and winter (P=0.041) (Figure 2B).
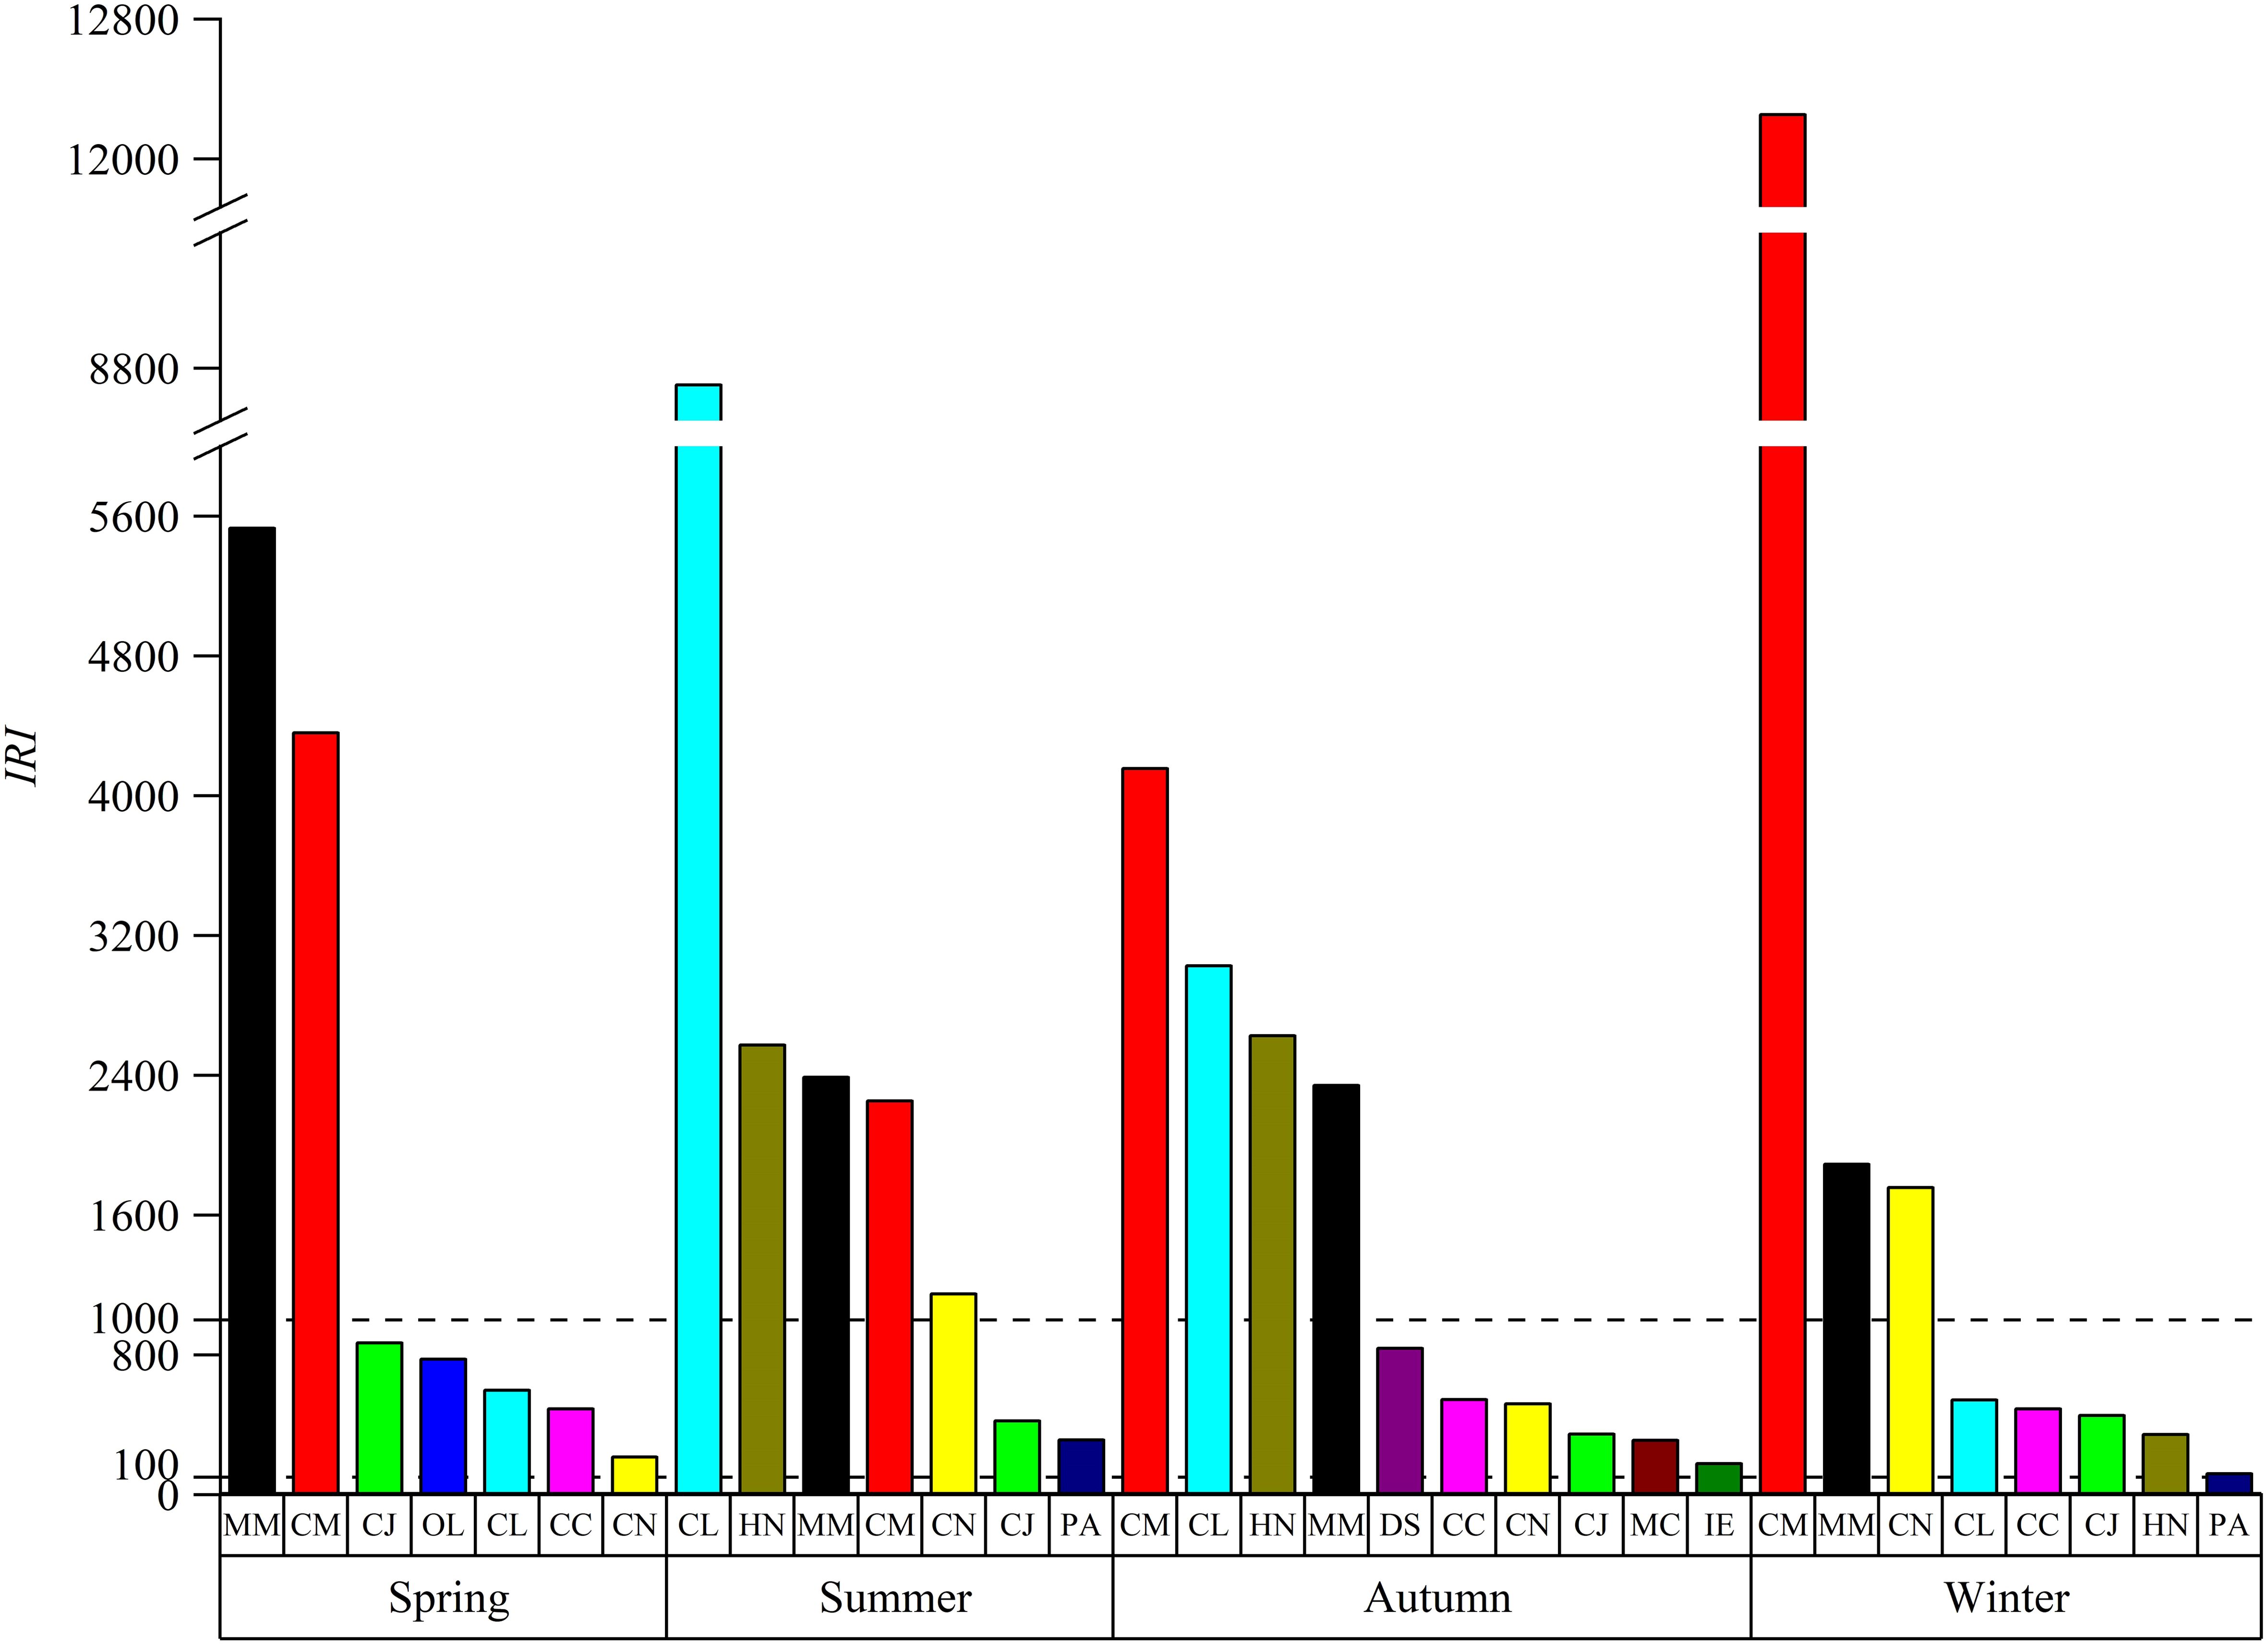
Figure 4. Characteristics of dominant and important species dominance in the SBYRE throughout four seasons (important species [100 ≤ IRI< 1,000]; dominant species [IRI ≥ 1,000]). MM, Miichthys miiuy; CM, Coilia mystus; CJ, Cynoglossus joyneri; OL, Odontamblyopus lacepedii; CL, Collichthys lucidus; CC, Ctenotrypauchen chinensis; CN, Coilia nasus; HN, Harpodon nehereus; PA, Pampus argenteus; DS, Dasyatis sinensis; MC, Muraenesox cinereus; IE, Ilisha elongata.
Cluster analysis was conducted on fish from the SBYRE, resulting in the generation of biomass and abundance heat maps (Figure 5). From the perspective of biomass and abundance clustering, the sample clustering results from different sites all showed that sampling sites 3 and 7 were most similar in spring, while sampling site 1 exhibited the most distinct species composition in comparison to sites 3 and 7. In terms of species clustering, Lophius litulon and Setipinna taty clustered together initially and showed relatively high biomass and abundance at sampling site 6. In summer, the clustering results for biomass and abundance revealed that sampling sites 8 and 9 were most similar, whereas sampling site 1 was the least similar. Based on biomass data, from a species clustering perspective, Taenioides anguillaris and Chrysochir aureus clustered together first, showing relatively high biomass at sampling site 1, with a similar distribution across sites. Conversely, abundance data indicated that T. anguillaris and C. nasus clustered together initially, exhibiting relatively high abundance at sampling site 1, with a similar distribution across sites. The biomass and abundance heat maps for autumn displayed inconsistent clustering results. Similar to spring, sampling sites 3 and 7 were the most similar based on biomass data, while sampling site 2 was the least similar. Regarding species clustering, Dasyatis sinensis and S. taty clustered together first, showing relatively high biomass at sampling site 9, with similar distributions across different sites. Sampling sites 6 and 7 were most similar based on abundance data, while C. mystus and C. nasus clustered together initially, exhibiting similar distributions across various locations. The winter biomass and abundance heat maps reveal inconsistent clustering results. Based on biomass data, sampling sites 9 and 10 exhibited the greatest similarity during winter, while sampling site 6 demonstrated the least similarity. In terms of species clustering, H. nehereus and S. taty clustered together first, followed by C. mystus and C. nasus, all of which displayed relatively high biomass at sampling site 6. The distribution patterns of the four species across different sites were also notably similar. Regarding abundance data, sampling sites 3 and 4 were found to be the most similar in winter, whereas sampling site 6 showed the least similarity. From the perspective of species clustering, Arius sinensis and H. nehereus clustered together initially, exhibiting relatively high abundance at sampling site 6, with distribution patterns across different sites also being very similar.
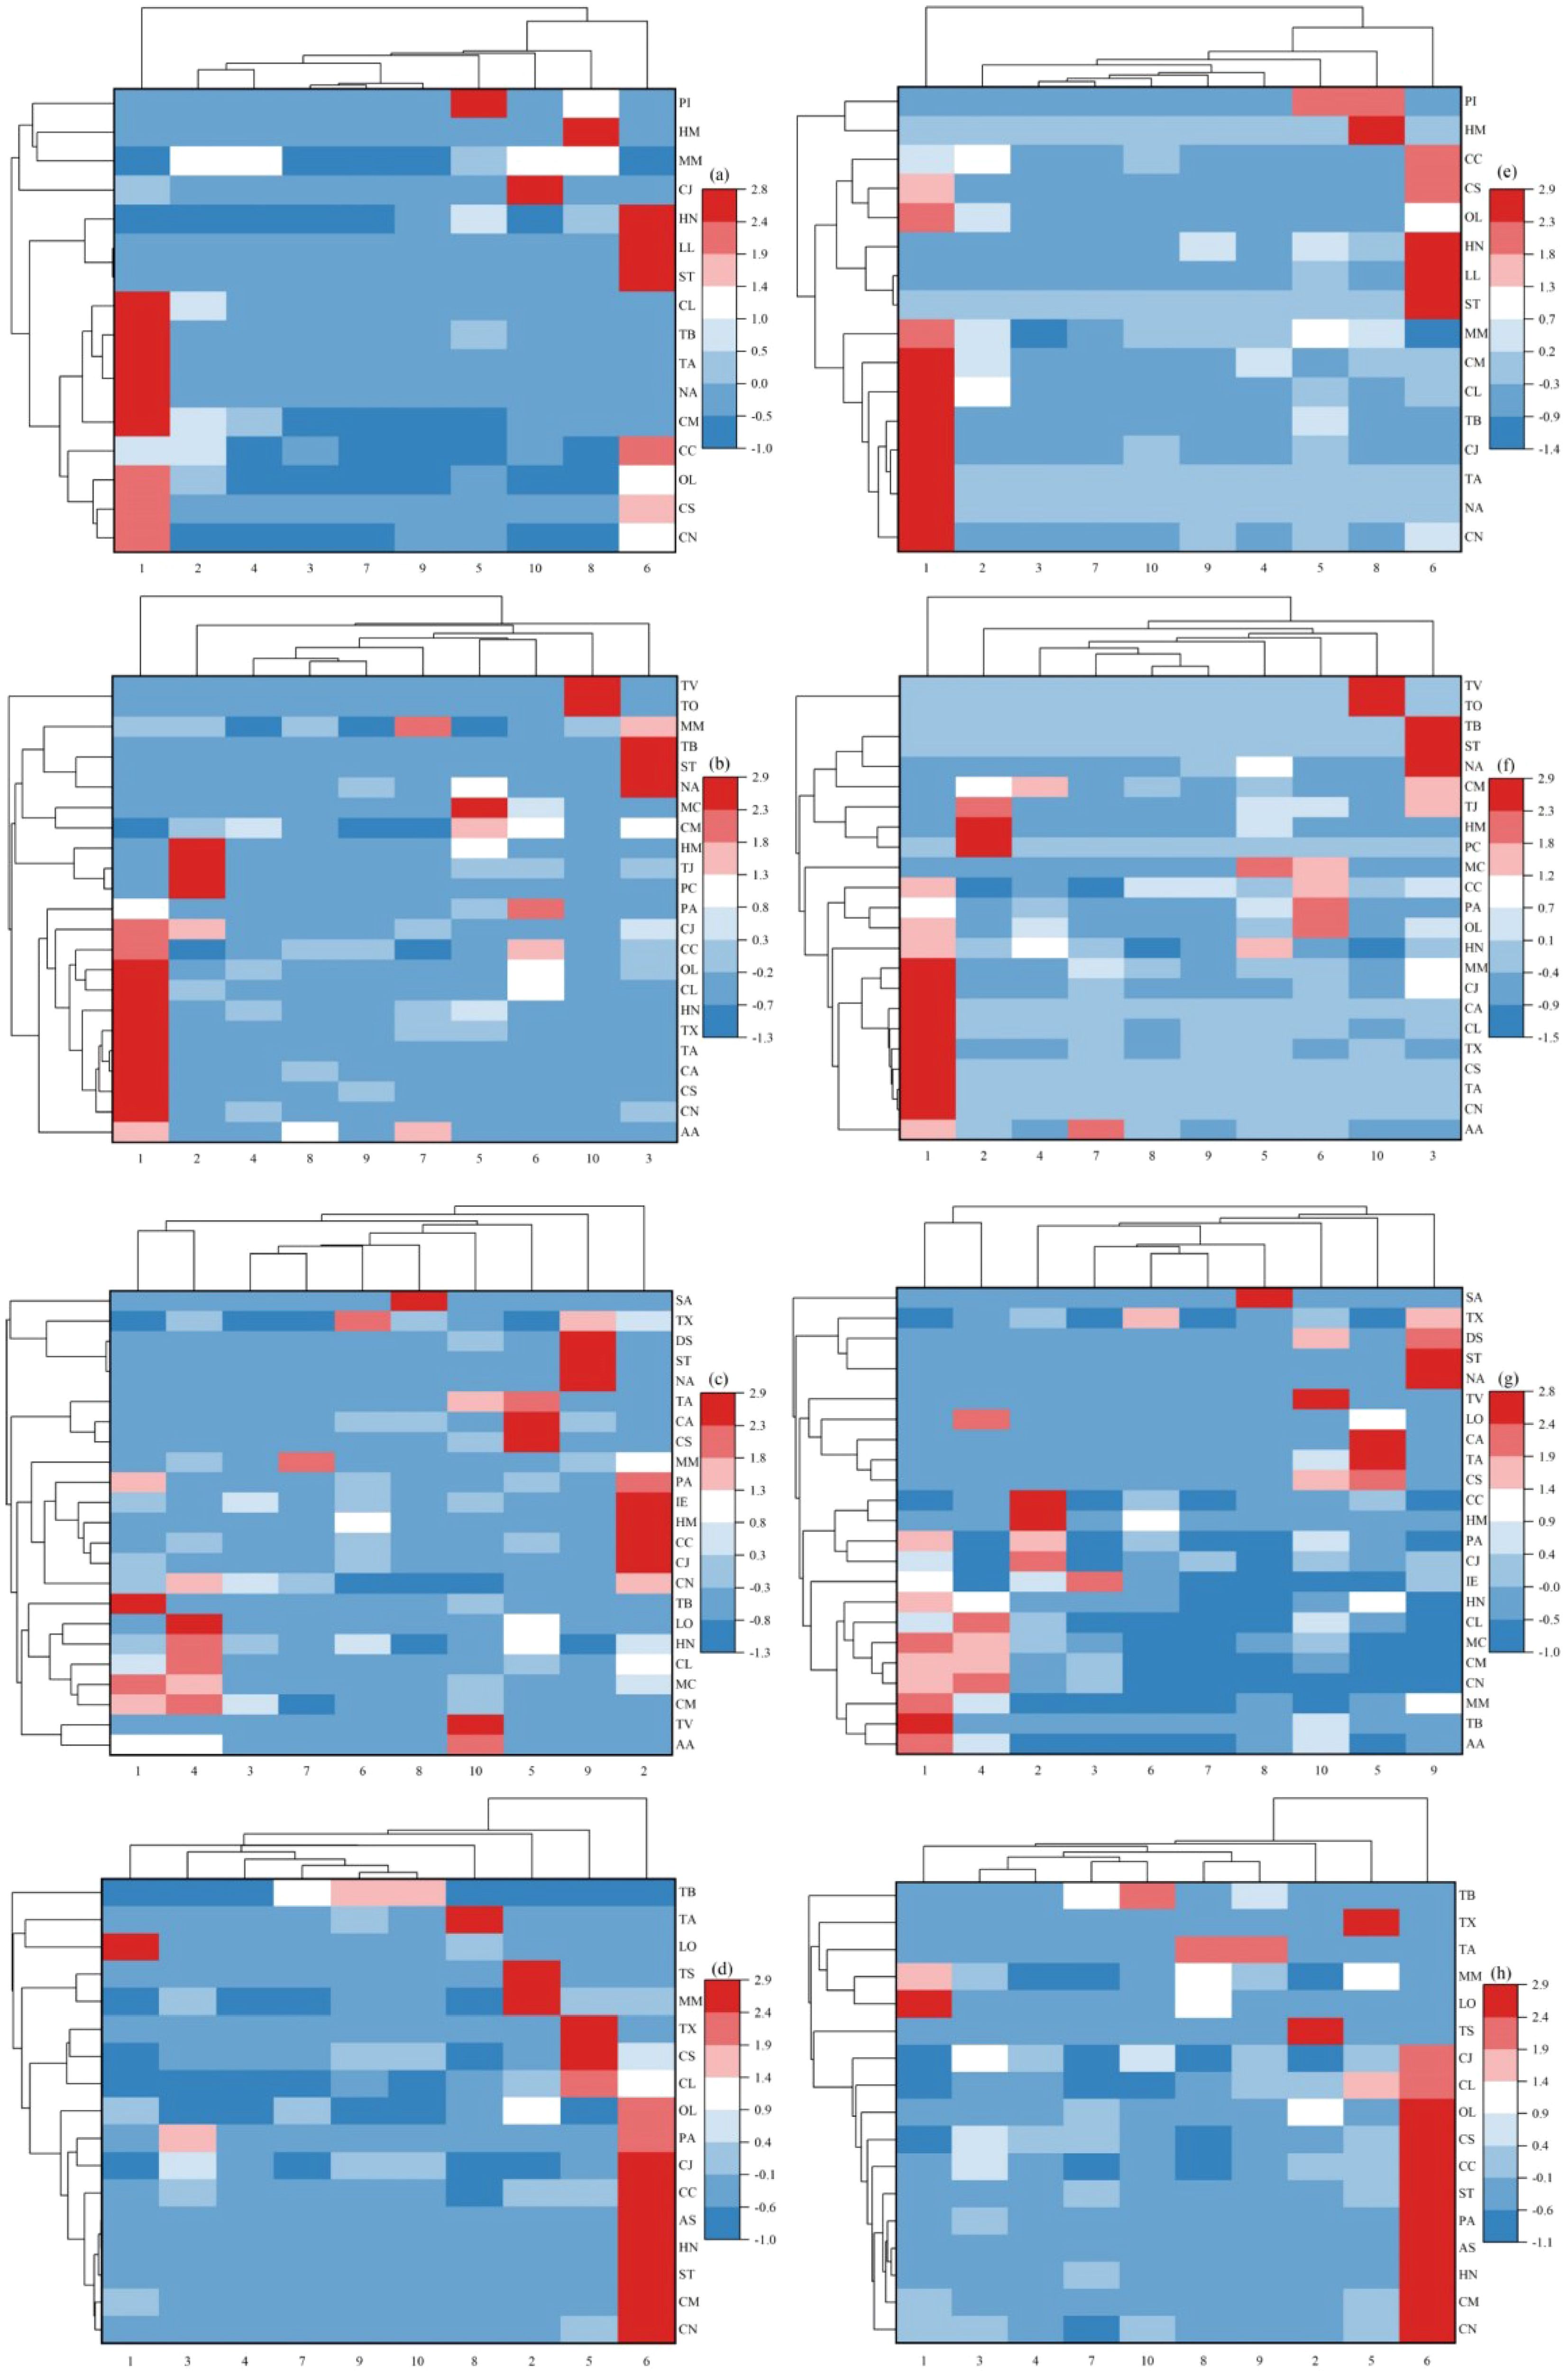
Figure 5. Interactive heatmap of fish composition in the SBYRE throughout four seasons based on biomass [(A): Spring; (B): Summer; (B): Autumn; (D): Winter] and abundance [(E): Spring; (F): Summer; (G): Autumn; (H): Winter]. AA, Argyrosomus argentatus; AS, Arius sinensis; CA, Chrysochir aureus; CS, Chaeturichthys stigmatias; HM, Hapalogenys mucronatus; LL, Lophius litulon; LO, Lophiogobius ocellicauda; NA, Nibea albiflora; PC, Protosalanx chinensis; PI, Platycephalus indicus; SA, Syngnathus acus; ST, Setipinna taty; TA, Taenioides anguillaris; TB, Tridentiger barbatus; TJ, Trichiurus japonicus; TO, Takifugu oblongus; TS, Takifugu obscurus; TV, Thryssa vitrirostris; TX, Takifugu xanthopterus. Remaining species abbreviations are annotated in Figure 4.
3.3 Relationship between fish community and environmental variables
Mantel test analysis (Figure 6) revealed that summer fish biomass exhibited a significant positive correlation with temperature (R=0.423; P=0.013) and salinity (R=0.308; P=0.041). Additionally, fish abundance demonstrated a highly significant positive correlation with salinity (R=0.576; P=0.003). Furthermore, abundance diversity index showed highly significant positive correlation with water depth (R=0.541; P=0.01) and transparency (R=0.713; P=0.002). The biomass diversity index of autumn fishes indicated a highly significant positive correlation with DIN (R=0.714; P=0.001), while the abundance diversity index also displayed a highly significant positive correlation with temperature (R=0.483; P=0.006). In winter, fish biomass had a highly significant positive correlation with DIN (R=0.531; P=0.004), and abundance was positively correlated with salinity (R=0.592; P=0.022), water depth (R=0.465; P=0.025), and Chl-a (R=0.352; P=0.028). Lastly, the abundance diversity index exhibited a significant positive correlation with salinity (R=0.374; P=0.013).
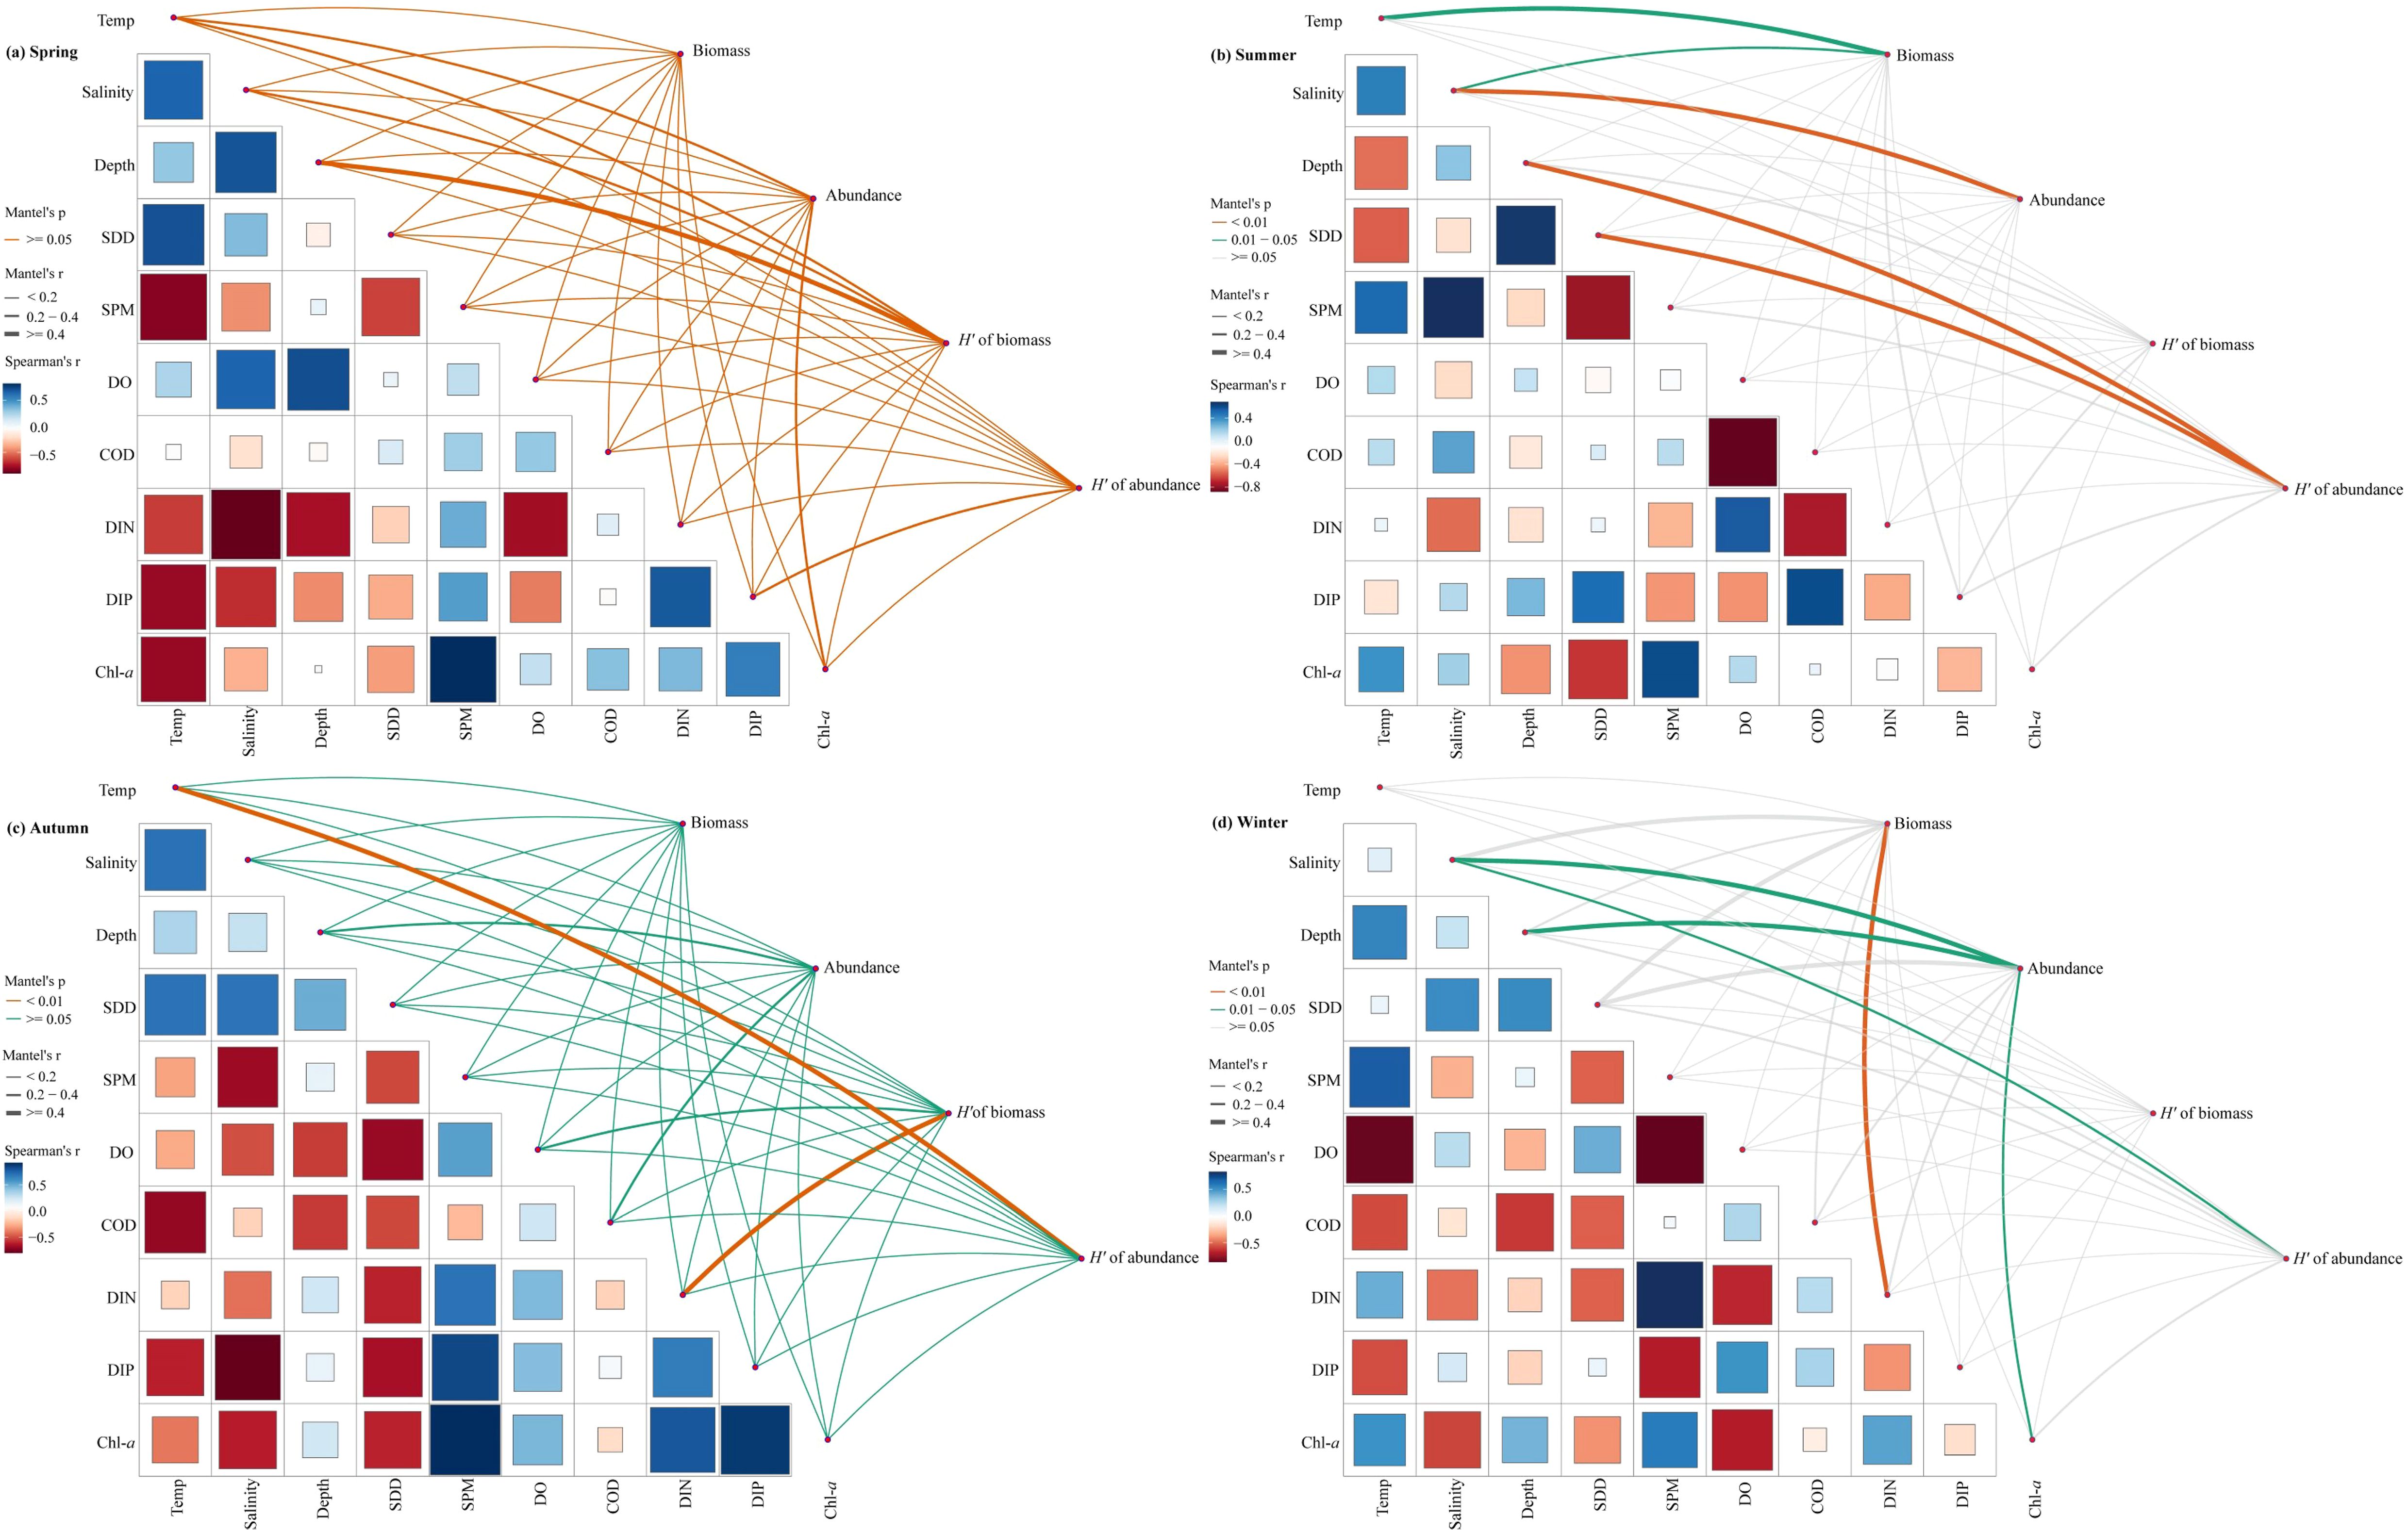
Figure 6. Environmental variables drive fish biomass, abundance and Shannon–Wiener diversity index (H′) in the SBYRE throughout four seasons. Temp, Surface temperature; SDD, Secchi disk depth; SPM, suspended particulate matter; DO, dissolved oxygen; COD, chemical oxygen demand; DIN, dissolved inorganic nitrogen; DIP, dissolved inorganic phosphorus; Chl-a, chlorophyll a.
RDA analysis indicated (Figure 7) that dominant fish biomass was significantly correlated with Chl-a in spring (P=0.026) and showed a highly significant correlation with salinity in summer (P=0.002). In autumn, a significant correlation was observed with both DIN and temperature (P=0.01; P=0.046), while in winter, there was a highly significant correlation with both DIN and transparency (P=0.004; P=0.002). Furthermore, the abundance of dominant fish species in spring was significantly correlated with DO, temperature, SPM, DIN, and water depth (P=0.03; P=0.008; P=0.024; P=0.042; P=0.048). A highly significant correlation was noted with summer salinity (P=0.002) and significant correlations were found with COD, DIN, and DIP in autumn (P=0.002; P=0.05; P=0.02). In winter, significant correlations were observed with DIN, transparency, and water depth (P=0.008; P=0.008; P=0.008; P=0.002; P=0.036).
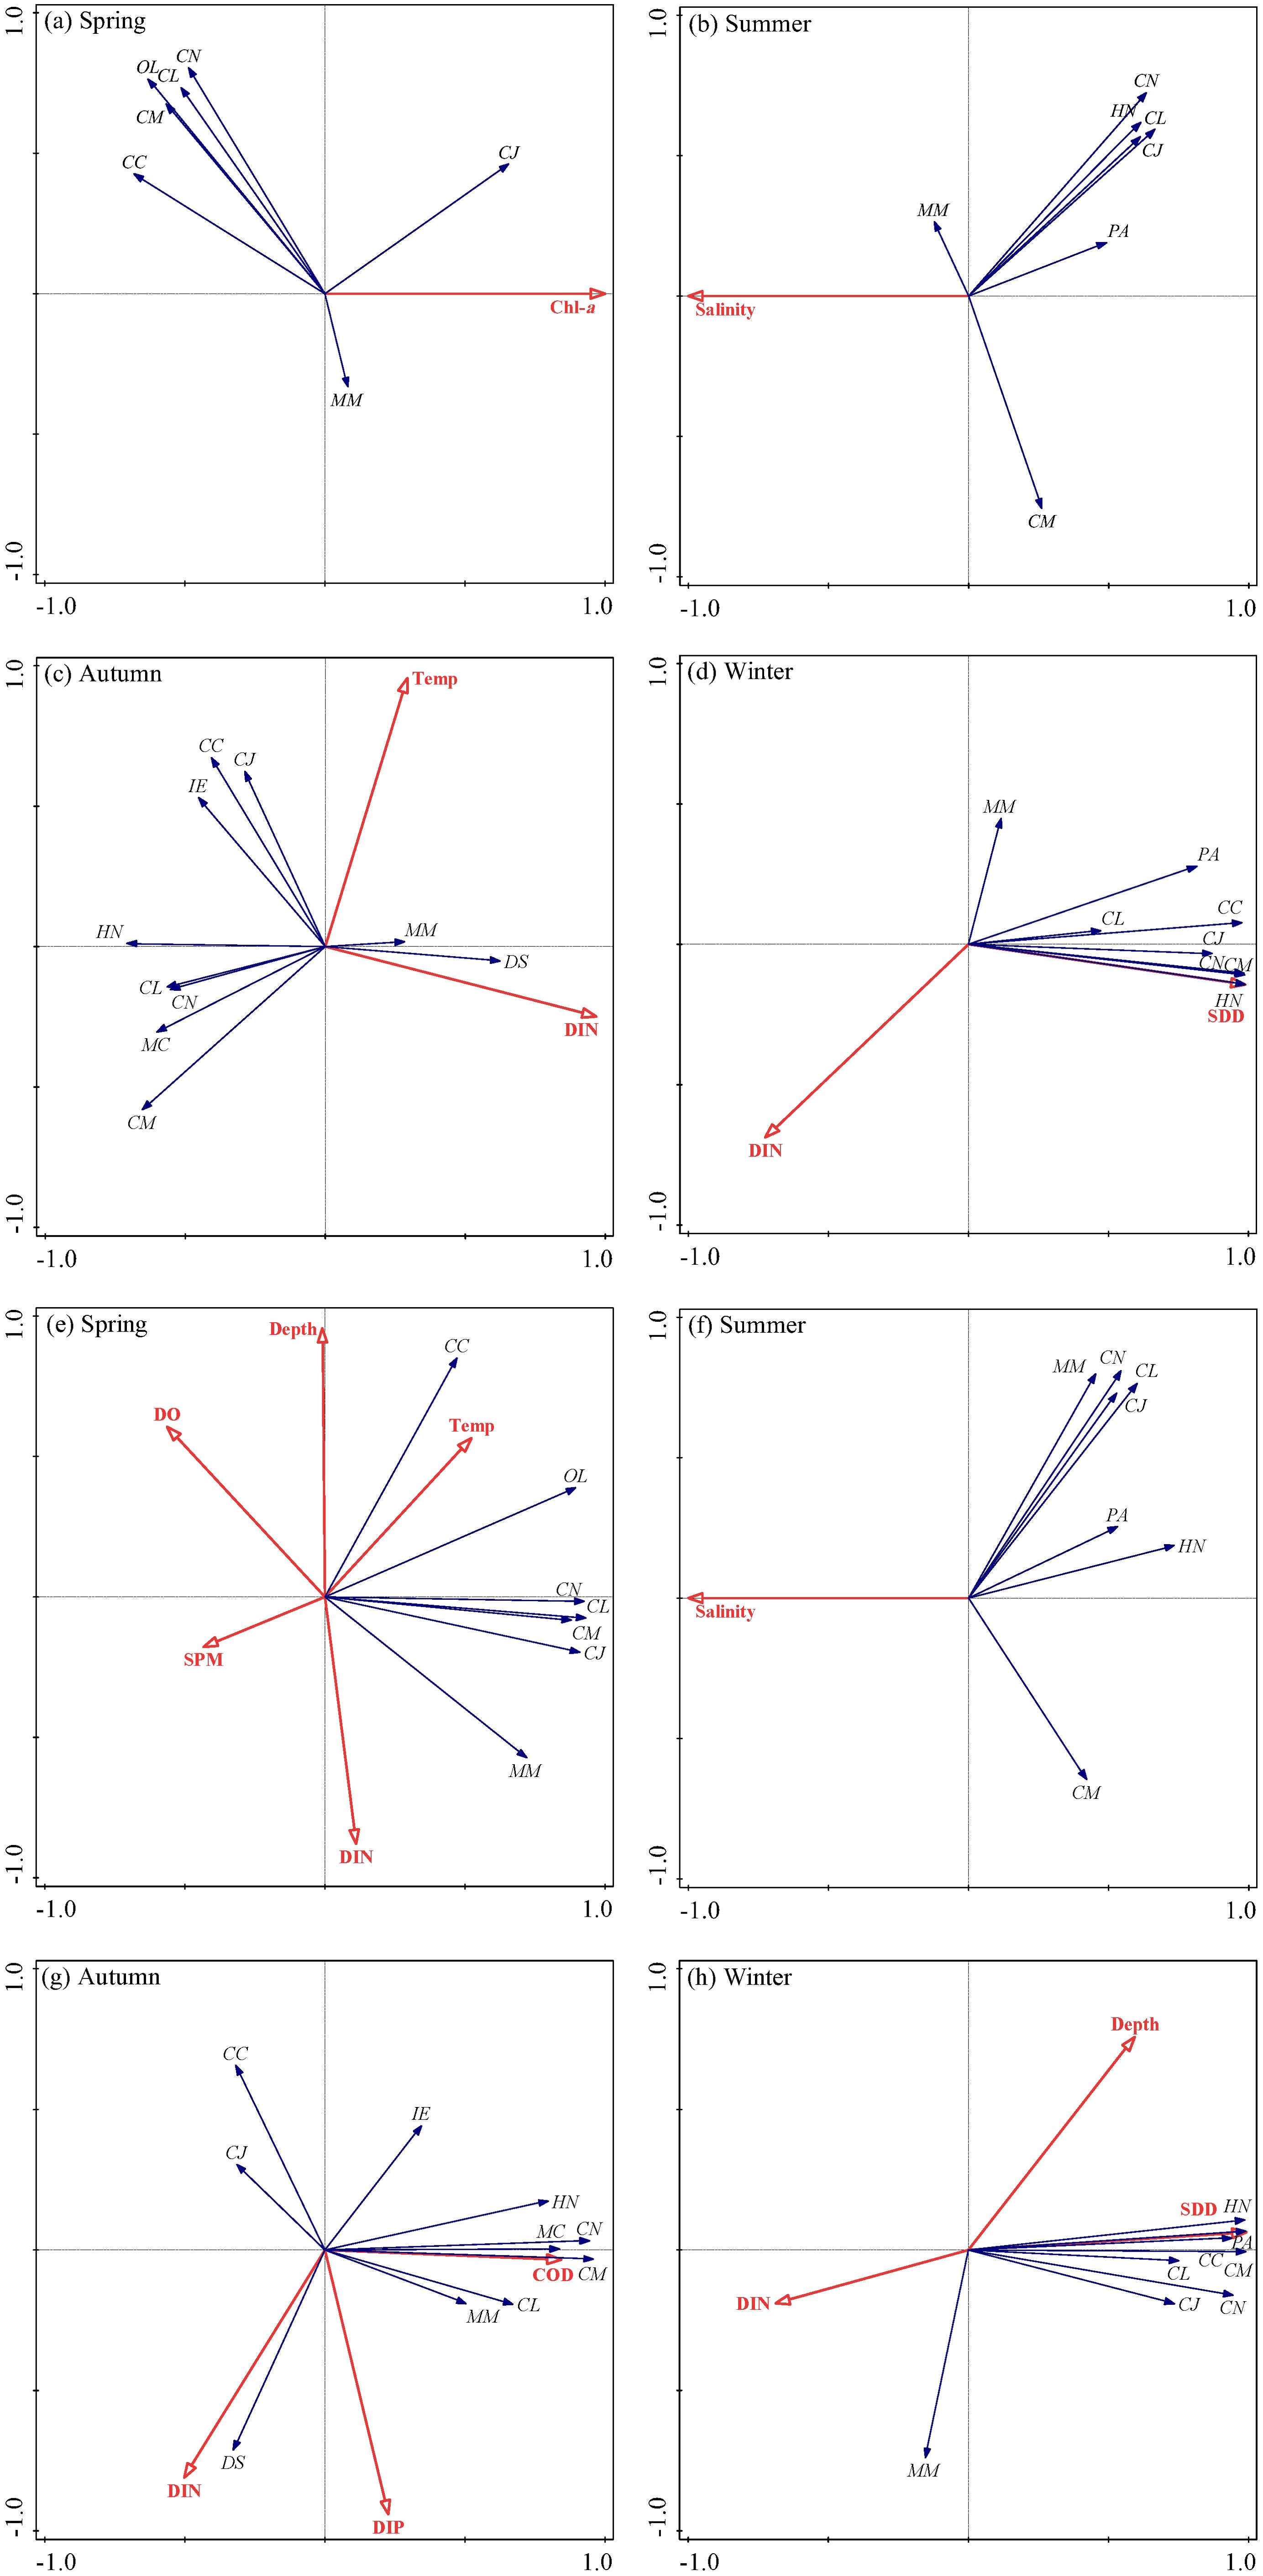
Figure 7. RDA-based double-sequence plots of biomass (A–D), abundance (E–H) and environmental variables for dominant fish species in the SBYRE throughout four seasons. Abbreviations of species and environmental variables are annotated in Figures 4, 6.
4 Discussion
4.1 Spatiotemporal distribution of fish community
The hydrological and ecological factors in the SBYRE are complex and variable, exhibiting distinct seasonal characteristics (Yu and Xian, 2009; Wang et al., 2021). This unique environmental feature renders the area an important habitat for fish (Yu and Xian, 2009; Kindong et al., 2020), with both biomass and abundance demonstrating clear seasonal patterns (Yu and Xian, 2009; Kindong et al., 2020). Notably, fish biomass and abundance were significantly higher in summer compared to spring, with high-value areas primarily located along the nearshore of the SBYRE and the north bank of Hangzhou Bay. This observation suggests that the increase in temperature and runoff during periods of abundant water leads to the accumulation of nutrients near these high-value areas, promoting the reproduction and growth of plankton, which in turn attracts a greater number of prey organisms fish feed on (Quan et al., 2009; Chen et al., 2022). Additionally, environmental conditions such as water temperature and salinity are influenced by multiple water masses, creating favorable conditions for migratory fish to move anadromously to the salt-freshwater interface for spawning, bait solicitation, and fattening activities (Day et al., 2012; Chen et al., 2022). Furthermore, clustered heat map results indicate that in the waters near sampling site 1 (i.e., the nearshore of SBYRE and the north bank of Hangzhou Bay), fish species such as T. anguillaris, C. aureus, and C. nasus exhibited high biomass and abundance, showing significant dissimilarity to the biomass and abundance observed at sampling sites 8 and 9, located in the southern part of the study area (Day et al., 2012; Chen et al., 2022). This phenomenon indicates that the distribution of fish stocks near the mouth of the YRE significantly differs from that in other regions. Additionally, the notably higher fish biomass and abundance observed in summer, which is associated with fish reproduction, is also significantly influenced by the long-term implementation of China’s marine seasonal fishing moratorium policy (Ministry of Agriculture and Rural Affairs of the People’s Republic of China, 2024). This policy provides favorable conditions for fish spawning, baiting, and fattening. In contrast to summer, the lower water temperatures and reduced runoff in spring—resulting from diminished freshwater input from the Yangtze River and less runoff from the Qiantang River during the dry season, which leads to higher salinity—are not conducive to plankton thriving and reproducing under these environmental conditions (Day et al., 2012; Trombetta et al., 2019; Zhang et al., 2022). The scarcity of available bait resources and unfavorable migratory hydrological conditions compel fish to inhabit waters farther offshore (Day et al., 2012; Chen, 2022; Zhang et al., 2022). The clustered heat map illustrates this characteristic, showing that the species represented by L. litulon and S. taty exhibit relatively high biomass and abundance at sampling site 6. As fall approaches, although water temperatures remain higher than in spring, they decrease significantly compared to summer (Table 1). Species such as C. mystus and C. nasus begin to aggregate in offshore waters, particularly near sampling sites 3, 6, and 7, corroborating the observation that areas of high fish biomass in the autumn are located close to the islands. In winter, as temperatures continue to drop, fish migrate from shallow nearshore waters to deeper areas (Elliott et al., 1990; Hoffman et al., 2008; Day et al., 2012). Therefore, the areas of high fish biomass and abundance during the autumn and winter were predominantly located in the sea near the islands in the eastern portion of the surveyed area. Additionally, the results from the clustered heat map indicated that the species H. nehereus, S. taty, C. mystus, C. nasus, and A. sinensis exhibited greater biomass and abundance at sampling site 6, which corresponds to the sea near these eastern islands.
4.2 Impacts of water masses and environmental variables on fish community
In general, dominant species play a crucial functional role in fish communities. They influence, and in some cases control, the structure and function of these communities through their numerical dominance and competition for food resources (Jin and Tang, 1996; Marsh-Matthews and Matthews, 2000; Day et al., 2012). Based on this premise, we employed RDA analysis to examine how multiple environmental variables affect fish during the spring, focusing on the biomass and abundance of dominant fish species. Our findings indicated that, in addition to Chl-a and temperature, DIN and SPM also impacted fish communities. This is attributed to the spring conditions, wherein the easterly and southeasterly monsoons influence freshwater influx from the Yangtze River and runoff from the Qiantang River, resulting in a northeast-southwest (NE-SW) temperature front near the SBYRE, formed under the top pressure of the invading East China Sea Current (Cao et al., 2021; Supplementary Figure S2). The SPM carried by this freshwater was rich in nutrients such as DIN and DIP, which created favorable conditions for the growth of Chl-a and phytoplankton. Our study corroborates this finding, as we observed higher Chl-a levels in spring, which in turn provides abundant food resources for the reproduction of fish forage organisms. Furthermore, dominant fish species, particularly migratory species such as C. lucidus, C. nasus, and M. miiuy migrated upstream to the YRE in spring for spawning and foraging (Yu and Xian, 2009; Shi et al., 2011). As summer approaches and the southeast monsoon prevails, the offshore water mass of the East China Sea continues to encroach upon the waters near the SBYRE due to tidal actions (Wu and Wu, 2018; Cao et al., 2021; Supplementary Figures S1, S2). Coupled with the onset of the flood season, salinity emerged as a critical factor influencing the dominant species and fish communities, alongside temperature. The high salinity environment created by the intrusion of East China Sea Current compelled most marine species, particularly the Sciaenidae, to migrated into the brackish waters of the Yangtze River Delta in search of food resources (Kindong et al., 2020). Furthermore, this unique habitat encourages spawning, foraging, and fattening, contributing to the increased catch during the summer months. For instance, the dominant species C. lucidus exhibited a high proportion of larvae. Consequently, salinity played a pivotal role in shaping the community structure of estuarine fish, influencing not only their growth, development, and reproduction but also the temporal and spatial distribution of juvenile fish communities (Zhang et al., 2015). However, in many instances, the salinity levels at which most fish are typically found are considerably narrower than their tolerance ranges. Additionally, in the context of global warming, rising sea temperatures have led to an advancement in the spawning behaviors of fish. Estuarine fish are exhibiting trends toward earlier sexual maturity and small adult sizes, exacerbated by the compounded effects of excessive human fishing (Pankhurst and Munday, 2011).
The community structure of fish is characterized not only by the dominant species and their quantitative distribution but also by the species diversity index, which is closely related to it (Jin and Tang, 1996; Bianchi et al., 2000). The species diversity index, a fundamental concept in ecology, plays a significant role in representing ecosystems and communities (DeJong, 1975; Kamrani et al., 2015). The Shannon-Weaver diversity index (H′) obtained during the autumn of this study indicates that the biodiversity of the SBYRE is at a medium level, as the value recorded is neither particularly high nor low (Figure 2; Kamrani et al., 2015). Furthermore, the relatively high number of dominant and common species suggests a rich community composition in autumn, significantly surpassing that of the other three seasons. As autumn approaches, the summer monsoon gradually yields to the winter monsoon, with northeast winds becoming more prevalent. The intrusion of the East China Sea Current diminishes; however, the resulting temperature front remains a crucial factor influencing the dominant species and species diversity (Cao et al., 2021; Supplementary Figure S2). Additionally, nutrients such as DIN and DIP transported by the Yangtze River’s freshwater and the Qiantang River’s runoff continue to provide essential support for the growth and reproduction of fish in the sea near the SBYRE, influenced by multiple water masses (Su and Wang, 1989; Wu and Wu, 2018; Supplementary Figure S1). This finding is further corroborated by the positive correlation observed between the autumn fish biomass diversity index and DIN, as well as between the abundance diversity index and temperature. In winter, as temperatures decrease and freshwater runoff weakens, the bottom salinity front of the YRE expands toward the nearshore waters of the southern bank (Wu and Wu, 2018; Supplementary Figure S1). Concurrently, the temperature front in this area shifts further outward to the southern sea (Cao et al., 2021; Supplementary Figure S2). Positive correlations observed between the dominant fish species, abundance and environmental variables such as water depth, transparency, and salinity, suggest that dominant species, including M. miiuy, C. nasus and C. mystus migrate to deeper waters with relatively clearer transparency for overwintering.
In addition to the dominant species that significantly impact the fish community, our research also identified the important role of rare species in the community structure along the SBYRE (Whitfield, 1999; Zhang et al., 2015; 2016). For instance, cluster analysis of biomass and abundance heat maps revealed that rare species such as L. litulon and S. taty exhibited relatively high biomass and abundance at sampling site 6 during spring, while T. anguillaris and C. aureus demonstrated high biomass at sampling site 1 in summer. Notably, sampling site 1 is situated in the estuarine waters of the YRE, where the biomass and abundance observed in spring and summer are significantly higher than at other sampling sites. This suggests that the substantial nutrient input into the YRE during spring and summer may be preferentially utilized by fish migrating upstream to spawn in the sea near sampling site 1, resulting in a clustering effect (Zhang et al., 2015; 2016). Furthermore, this may indicate that the vicinity of this sampling site is likely a spawning ground for fish in the YRE. Nutrients from runoff accumulate here due to the influence of multiple water masses, creating suitable environmental conditions for spawning and feeding, which attract migratory fish to congregate and thrive (Yu and Xian, 2009; Shi et al., 2011). Consequently, sampling site 1 exhibits a distinct clustering phenomenon compared to the other sampling sites. Changes in the habitat of fish communities, species interactions, and succession processes significantly impact the abundance and dynamics of dominant species (Kushlan, 1976; Skud, 1982; Day et al., 2012). The seasonal variation in dominant species observed in this study corroborates these findings. For instance, H. nehereus was a dominant species during summer and autumn, commonly found in winter, but neither dominant nor common in spring. This species primarily feeds on small fish. During summer and autumn, the density of fish resources, particularly small fish, is relatively high in the SBYRE, making it an ideal feeding ground for H. nehereus. In contrast, as water temperatures decrease and fish resource density declines in winter and spring, H. nehereus migrates to deeper waters in search of food. Furthermore, the replacement of dominant species indirectly influences the community structure and composition of fish in the SBYRE, leading to seasonal changes in community composition (Jin and Tang, 1996; Marsh-Matthews and Matthews, 2000).
5 Conclusions
Through the investigation of fishery resources and the concurrent acquisition of environmental variables during four seasonal voyages, we have enhanced our understanding of the relationship between fish communities, environmental variables, and water masses in the SBYRE sea area. The results indicated that seasonal changes in water masses, driven by monsoonal influences, can lead to alterations in environmental variables such as temperature, salinity, and nutrient levels. These changes, in turn, affect the temporal and spatial distribution of fish biomass and abundance in the SBYRE, revealing significant seasonal differences. Notably, sampling site 1 in the spring and summer, located near the mouth of the YRE, exhibits a higher density of both adult and juvenile fish, suggesting that this area may serve as an important spawning ground within the YRE ecosystem. Temperature, salinity, and DIN have emerged as key environmental factors influencing fish communities in the SBYRE. However, as this study primarily focused on the SBYRE sea area and was conducted over a relatively short period, the conclusions drawn have certain limitations. Therefore, follow-up studies are necessary to explore the spatiotemporal evolution of fish communities in the YRE to examine the coupling relationship between environmental variables and water masses at a larger spatial scale and over an extended investigation period.
Data availability statement
The raw data supporting the conclusions of this article will be made available by the authors, without undue reservation.
Ethics statement
The studies involving animals were reviewed and approved by the Ethics Committee of Zhejiang Provincial People’s Hospital (Approval No.: 20200320004), which was commissioned by the Second Institute of Oceanography of the Ministry of Natural Resources, China.
Author contributions
DZ: Conceptualization, Data curation, Formal analysis, Investigation, Visualization, Writing – original draft. HX: Funding acquisition, Investigation, Writing – review & editing. XF: Formal analysis, Software, Writing – review & editing. WH: Conceptualization, Funding acquisition, Writing – review & editing. YZ: Data curation, Methodology, Visualization, Writing – review & editing. JQ: Data curation, Validation, Writing – review & editing.
Funding
The author(s) declare financial support was received for the research, authorship, and/or publication of this article. This work was supported by the National Key R & D Program of China (2022YFF0802203).
Conflict of interest
The authors declare that the research was conducted in the absence of any commercial or financial relationships that could be construed as a potential conflict of interest.
Generative AI statement
The author(s) declare that no Generative AI was used in the creation of this manuscript.
Publisher’s note
All claims expressed in this article are solely those of the authors and do not necessarily represent those of their affiliated organizations, or those of the publisher, the editors and the reviewers. Any product that may be evaluated in this article, or claim that may be made by its manufacturer, is not guaranteed or endorsed by the publisher.
Supplementary material
The Supplementary Material for this article can be found online at: https://www.frontiersin.org/articles/10.3389/fmars.2025.1530410/full#supplementary-material
References
Barletta M., Barletta-Bergan A., Saint-Paul U., Hubold G. (2003). Seasonal changes in density, biomass, and diversity of estuarine fishes in tidal mangrove creeks of the lower Caete Estuary (northern Brazilian coast, east Amazon). Mar. Ecol. Prog. Ser. 256, 217–228. doi: 10.3354/MEPS256217
Bianchi G., Gislason H., Graham K., Hill L., Jin X., Koranteng K., et al. (2000). Impact of fishing on size composition and diversity of demersal fish communities. ICES. J. Mar. Sci. 57, 558–571. doi: 10.1006/jmsc.2000.0727
Cao L., Tang R., Huang W., Wang Y. T. (2021). Seasonal variability and dynamics of coastal sea surface temperature fronts in the East China Sea. Ocean. Dynamics. 71, 237–249. doi: 10.1007/s10236-020-01427-8
Che Y., Ma J., Chen J. (2022). Length–weight relationships of three fish species from the Yangtze River Estuary. J. Appl. Ichthyol. 38, 561–563. doi: 10.1111/jai
Chen X. (2022). “Shoaling and migration of fish and their relationships with environment,” in Theory and Method of Fisheries Forecasting. Ed. Chen X. (Springer, Singapore). doi: 10.1007/978-981-19-2956-4_3
Chen Z. M., Ren Q. Q., Liu C. L., Xian W. W. (2022). Seasonal and spatial variations in fish assemblage in the Yangtze Estuary and adjacent waters and their relationship with environmental factors. J. Mar. Sci. Eng. 10, 1679. doi: 10.3390/jmse10111679
Cheung W. W. L., Reygondeau G., Frölicher T. L. (2016). Large benefits to marine fisheries of meeting the 1.5°c global warming target. Science 354, 1591–1594. doi: 10.1126/science.aag2331
Cheung W. W., Watson R., Pauly D. (2013). Signature of ocean warming in global fisheries catch. Nature 497, 365–368. doi: 10.1038/nature12156
Cornwall C. E., Eddy T. D. (2015). Effects of near-future ocean acidification, fishing, and marine protection on a temperate coastal ecosystem. Conserv. Biol. 29, 207–215. doi: 10.1111/cobi.12394
Craven D., Eisenhauer N., Pearse W. D., Hautier Y., Isbell F., Roscher C., et al. (2018). Multiple facets of biodiversity drive the diversity-stability relationship. Nat. Ecol. Evol. 2, 1579–1587. doi: 10.1038/s41559-018-0647-7
Day J. W., Crump B. C., Kemp W. M., Arancibia A. Y. (2012). Estuarine Ecology (New Jersey: Wiley-Blackwell).
DeJong T. (1975). A comparison of three diversity indices based on their components of richness and evenness. Oikos 26, 222–227. doi: 10.2307/3543712
Elliott M., O’Reilly M. G., Taylor C. J. L. (1990). The forth estuary: A nursery and overwintering area for North Sea fishes. Hydrobiologia 195, 89–103. doi: 10.1007/BF00026816
Frelat R., Orio A., Casini M., Lehmann A., Merigot B., Otto S. A., et al. (2018). A three-dimensional view on biodiversity changes: spatial, temporal, and functional perspectives on fish communities in the baltic sea. ICES. J. Mar. Sci. 75, 2463–2475. doi: 10.1093/icesjms/fsy027
Froese R., Pauly D. (2013). FishBase. Available online at: http://www.fishbase.org (Accessed October 15, 2022).
GB/T12763.6-2007. (2007). The Specification for Marine Monitoring Part 6: Marine Biological Survey (Beijing: Standards Press of China), 56–62.
GB 17378.4-2007. (2008). The Specification for Marine Monitoring Part 4: Seawater Analysis (Beijing: Standards Press of China), 76–122.
Gobler C. J., Baumann H. (2016). Hypoxia and acidification in ocean ecosystems: coupled dynamics and effects on marine life. Biol. Lett. 12, 20150976. doi: 10.1098/rsbl.2015.0976
Hoffman J. C., Limburg K. E., Bronk D. A., Olney J. E. (2008). Overwintering habitats of migratory juvenile American shad in Chesapeake Bay. Environ. Biol. Fishes. 81, 329–345. doi: 10.1007/s10641-007-9204-y
Hossain M. S., Das N. G., Sarker S., Rahaman M. Z. (2012). Fish diversity and habitat relationship with environmental variables at Meghna river estuary, Bangladesh. Egyp. J. Aqua Res. 38, 213–226. doi: 10.1016/j.ejar.2012.12.006
Huang H. Y. (2021). linkET: Everything is Linkable. R package version 0.0.3. Available at: https://cran.r-project.org/package=linkET.
Islam M. R., Mia M. J., Lithi U. J. (2017). Spatial and temporal disparity of fish assemblage relationship with hydrological factors in two rivers Tangon and Kulik, Thakurgaon, Bangladesh. Turk. J. Fish. Aqua Sci. 17, 1209–1218. doi: 10.4194/1303-2712-v17_6_14
Jiang C. P., Xu Z. L., Chen J. J. (2018). Spatial differences of fish community distribution in the adjacent sea areas of thermal discharge from Qinshan Nuclear Power Plant. J. Fish. China. 42, 1229–1240. doi: 10.11964/jfc.20160110267
Jin X., Tang Q. (1996). Changes in fish species diversity and dominant species composition in the Yellow Sea. Fish. Res. 26, 337–352. doi: 10.1016/0165-7836(95)00422-X
Kamrani E., Sharifinia M., Hashemi S. H. (2015). Analyses of fish community structure changes in three subtropical estuaries from the Iranian coastal waters. Mar. Biodivers. 46, 561–577. doi: 10.1007/s12526-015-0398-5
Keselman H. J., Gaines P. A., Clinch J. J. (1979). Tests for homogeneity of variance. Commun. Stat. Simul. Comput. 8 (2), 113–129.
Kindong R., Wu J. H., Gao C. C., Dai L. B., Tian S. Q., Dai X. J., et al. (2020). Seasonal changes in fish diversity, density, biomass, and assemblage alongside environmental variables in the Yangtze River Estuary. Environ. Sci. pollut. Res. 27, 25461–25474. doi: 10.1007/s11356-020-08674-8
Kushlan J. A. (1976). Environmental stability and fish community diversity. Ecology 57, 821–825. doi: 10.2307/1936196
Li J. S., Jiang Y. Z., Jin Y. (2017). The inter-decadal variations of species composition and diversity of nekton community in Yangtze Estuary fishing grounds in winter. J. Nat. Res. 32, 507–516. doi: 10.11849/zrzyxb.20160318
Lin L. S., Zhao G. G., Li Y., Gao T. X., Zhang J. (2012). Diversity of nekton in Dongshan Bay and adjacent areas. Acta Hydrobiol. Sin. 36, 1119–1127. doi: 10.3724/SP.J.1035.2012.01119
Liu J., Liu J. H., He X. Q., Pan D. L., Bai Y., Zhu F., et al. (2018). Diurnal dynamics and seasonal variations of total suspended particulate matter in highly turbid Hangzhou Bay waters based on the geostationary ocean color imager. IEEE J-STARS. 11, 2170–2180. doi: 10.1109/JSTARS.2018.283033
Marsh-Matthews E., Matthews W. (2000). Spatial variation in relative abundance of a widespread, numerically dominant fish species and its effect on fish assemblage structure. Oecologia 125, 283–292. doi: 10.1007/s004420000452
McLean M., Auber A., Graham N. A. J., Houk P., Villeger S., Violle C., et al. (2019). Trait structure and redundancy determine sensitivity to disturbance in marine fish communities. Glob. Change Biol. 25, 3424–3437. doi: 10.1111/gcb.14662
Merigot B., Lucena-Fredou F., Viana A. P., Ferreira B. P., Junior E. D. N. C., da Silva Júnior C. B., et al. (2017). Fish assemblages in tropical estuaries of northeast Brazil: a multi-component diversity approach. Oce. Coast. Manage. 143, 175–183. doi: 10.1016/j.ocecoaman.2016.08.004
Ministry of Agriculture and Rural Affairs of the People’s Republic of China (2024). Policy document on agricultural and rural affairs. Available online at: https://www.gov.cn/zhengce/zhengceku/202404/content_6947450.htm (Accessed August 15, 2024).
O’Meara T. A., Hillman J. R., Thrush S. F. (2017). Rising tides, cumulative impacts and cascading changes to estuarine ecosystem functions. Sci. Rep. 7, 10218. doi: 10.1038/s41598-017-11058-7
Pankhurst N. W., Munday P. L. (2011). Effects of climate change on fish reproduction and early life history stages. Mar. Freshw. Res. 62, 1015–1026. doi: 10.1071/MF10269
Parsons T. R., Maita Y., Lalli C. M. (1984). A manual of chemical and biological methods for seawater analysis (Oxford: Pergamon Press).
Pinkas L., Oliphant M. S., Iverson I. L. K. (1971). Food habits of albacore, bluefin tuna, and bonito in California waters. Fish. Bull. 152, 1–105.
Quan W. M., Ni Y., Shi L. Y., Chen Y. Q. (2009). Composition of fish communities in an intertidal salt marsh creek in the Yangtze River estuary, China. Chin. J. Oceano. Limno. 27, 806–815. doi: 10.1007/s00343-009-9186-z
Ramos S., Paris C. B., Angélico M. M. (2017). Larval fish dispersal along an estuarine-ocean gradient. Can. J. Fish. Aquat. Sci. 74, 1462–1473. doi: 10.1139/cjfas-2016-0325
Shan X. J., Jin X. S., Yuan W. (2010). Fish assemblage structure in the hypoxic zone in the Yangtze (Yangtze River) estuary and its adjacent waters. Chin. J. Oceano. Limno. 28, 59–469. doi: 10.1007/s00343-010-9102-6
Shannon C. E., Weaver W. (1963). The mathematical theory of communications (Urbana, IL: University of Illinois Press).
Shi Y. R., Chao M., Quan W. M., Tang F. H., Shen X. Q., Yuan Q., et al. (2011). Spatial variation in fish community of Yangtze River estuary in spring. J. Fishery. Sci. China 18, 1141–1151. doi: 10.3724/SP.J.1118.2011.01141
Skud B. E. (1982). Dominance in fishes: The relation between environment and abundance. Science 216, 144–149. doi: 10.1126/science.216.4542.144
Su J. L., Wang K. S. (1989). Changjiang river plume and suspended sediment transport in Hangzhou Bay. Continental. Shelf. Res. 9, 93–111. doi: 10.1016/0278-4343(89)90085-X
Ter Braak C. F. J., Šmilauer P. (2002). CANOCO reference manual and canodraw for windows user’s guide: software for canonical community ordination (version 4.5) (Ithaca, New York: Microcomputer Power).
Trombetta T., Vidussi F., Mas S., Parin D., Simier M., Mostajir B. (2019). Water temperature drives phytoplankton blooms in coastal waters. PloS One 14, e0214933. doi: 10.1371/journal.pone.0214933
Wang X. H., Du F. Y., Qiu Y. S., Li C. H., Sun D. R., Jia X. P. (2010). Variations of fish species diversity, faunal assemblage, and abundances in Daya Bay in 1980–2007. Chin. J. Appl. Ecol. 21, 2403–2410.
Wang Y., Liang C., Chen Z., Liu S., Zhang H., Xian W. (2021). Spring ichthyoplankton assemblage structure in the Yangtze Estuary under environmental factors. Front. Mar. Sci. 8. doi: 10.3389/fmars.2021.806096
Wang X. C., Xie P. F., Li Q., Zhang J. Y., Li H. J. (2020). Ecological environment of the Yangtze Estuary and protection countermeasures. Res. Environ. Sci. 33, 1197–1205. doi: 10.13198/j.issn.1001-6929.2020.03.29
Whitfield A. K. (1999). Ichthyofaunal assemblages in estuaries: A South African case study. Rev. Fish. Biol. Fish. 9, 15186. doi: 10.1023/A:1008994405375
Wu T., Wu H. (2018). Tidal mixing sustains a bottom-trapped river plume and buoyant coastal current on an energetic continental shelf. J. Geophys. Res.: Oceans. 123, 8026–8051. doi: 10.1029/2018JC014105
Yang D. Z., Yin B. S., Liu Z. L., Bai T., Qi J. F., Chen H. Y. (2012). Numerical study on the pattern and origins of Kuroshio branches in the bottom water of southern East China Sea in summer. J. Geophys. Res. Ocean. 117, C02014. doi: 10.1029/2011JC007528
Yu H. C., Xian W. W. (2009). The environment effect on fish assemblage structure in waters adjacent to the Yangtze (Yangtze) River estuary, (1998–2001). Chin. J. Oceano. Limno. 27, 443–456. doi: 10.1007/s00343-009-9155-6
Zeng Z., Cheung W. W., Lai H., Yi H., Bi S., Li H., et al. (2022). Species and functional dynamics of the demersal fish community and responses to disturbances in the Pearl River estuary. Front. Mar. Sci. 9. doi: 10.3389/fmars.2022.921595
Zhai L., Xu B. D., Ji Y. P. (2015). Spatial pattern of fish assemblage and the relationship with environmental factors in Yellow River Estuary and its adjacent waters in summer. Chin. J. Appl. Ecol. 26, 2852–2858.
Zhang H., He W. S., Tong C. F., Lu J. J. (2007). Species composition and biodiversity of the intertidal fishes in Chongxi Wetland in winter in Changjiang Estuary. Resour. Environ. Yangtze. Basin. 16, 308–313.
Zhang D. R., Jia G. D., Chen L. H., Jin H. Y., Wang Z. F., Feng W. H., et al. (2022). Seasonal succession and spatial heterogeneity of the nekton community associated with environmental factors in Hangzhou Bay, China. Reg. Stud. Mar. Sci. 49, 102108. doi: 10.1016/j.rsma.2021.102108
Zhang H., Xian W. W., Liu S. D. (2015). Ichthyoplankton assemblage structure of springs in the Yangtze Estuary revealed by biological and environmental visions. PeerJ 3, e1186. doi: 10.7717/peerj.1186
Zhang H., Xian W. W., Liu S. D. (2016). Autumn ichthyoplankton assemblage in the Yangtze estuary shaped by environmental factors. PeerJ 4, e1992. doi: 10.7717/peerj.1922
Keywords: fish community, Yangtze River Estuary, water mass, environmental variable, spatiotemporal distribution
Citation: Zhang D, Xu H, Fang X, Huang W, Zhang Y and Qian J (2025) Influence of water masses and environmental variables on fish community in the south bank of Yangtze River Estuary, China. Front. Mar. Sci. 12:1530410. doi: 10.3389/fmars.2025.1530410
Received: 18 November 2024; Accepted: 09 January 2025;
Published: 27 January 2025.
Edited by:
Xiaoxia Sun, Chinese Academy of Sciences (CAS), ChinaReviewed by:
Gang Hou, Guangdong Ocean University, ChinaSikai Wang, Chinese Academy of Fishery Sciences, China
Copyright © 2025 Zhang, Xu, Fang, Huang, Zhang and Qian. This is an open-access article distributed under the terms of the Creative Commons Attribution License (CC BY). The use, distribution or reproduction in other forums is permitted, provided the original author(s) and the copyright owner(s) are credited and that the original publication in this journal is cited, in accordance with accepted academic practice. No use, distribution or reproduction is permitted which does not comply with these terms.
*Correspondence: Dongrong Zhang, emhhbmdkb25ncm9uZ0BzaW8ub3JnLmNu; Hengtao Xu, eHVodEBzaW8ub3JnLmNu
†These authors share first authorship