 Neil Hammerschlag
 Yakira Herskowitz
 Chris Fallows
 Thiago B. A. Couto
- 1Rosenstiel School of Marine, Earth, and Atmospheric Science, University of Miami, Miami, FL, United States
- 2Apex Shark Expeditions, Cape Town, South Africa
- 3Lancaster Environment Centre, Lancaster University, Lancaster, United Kingdom
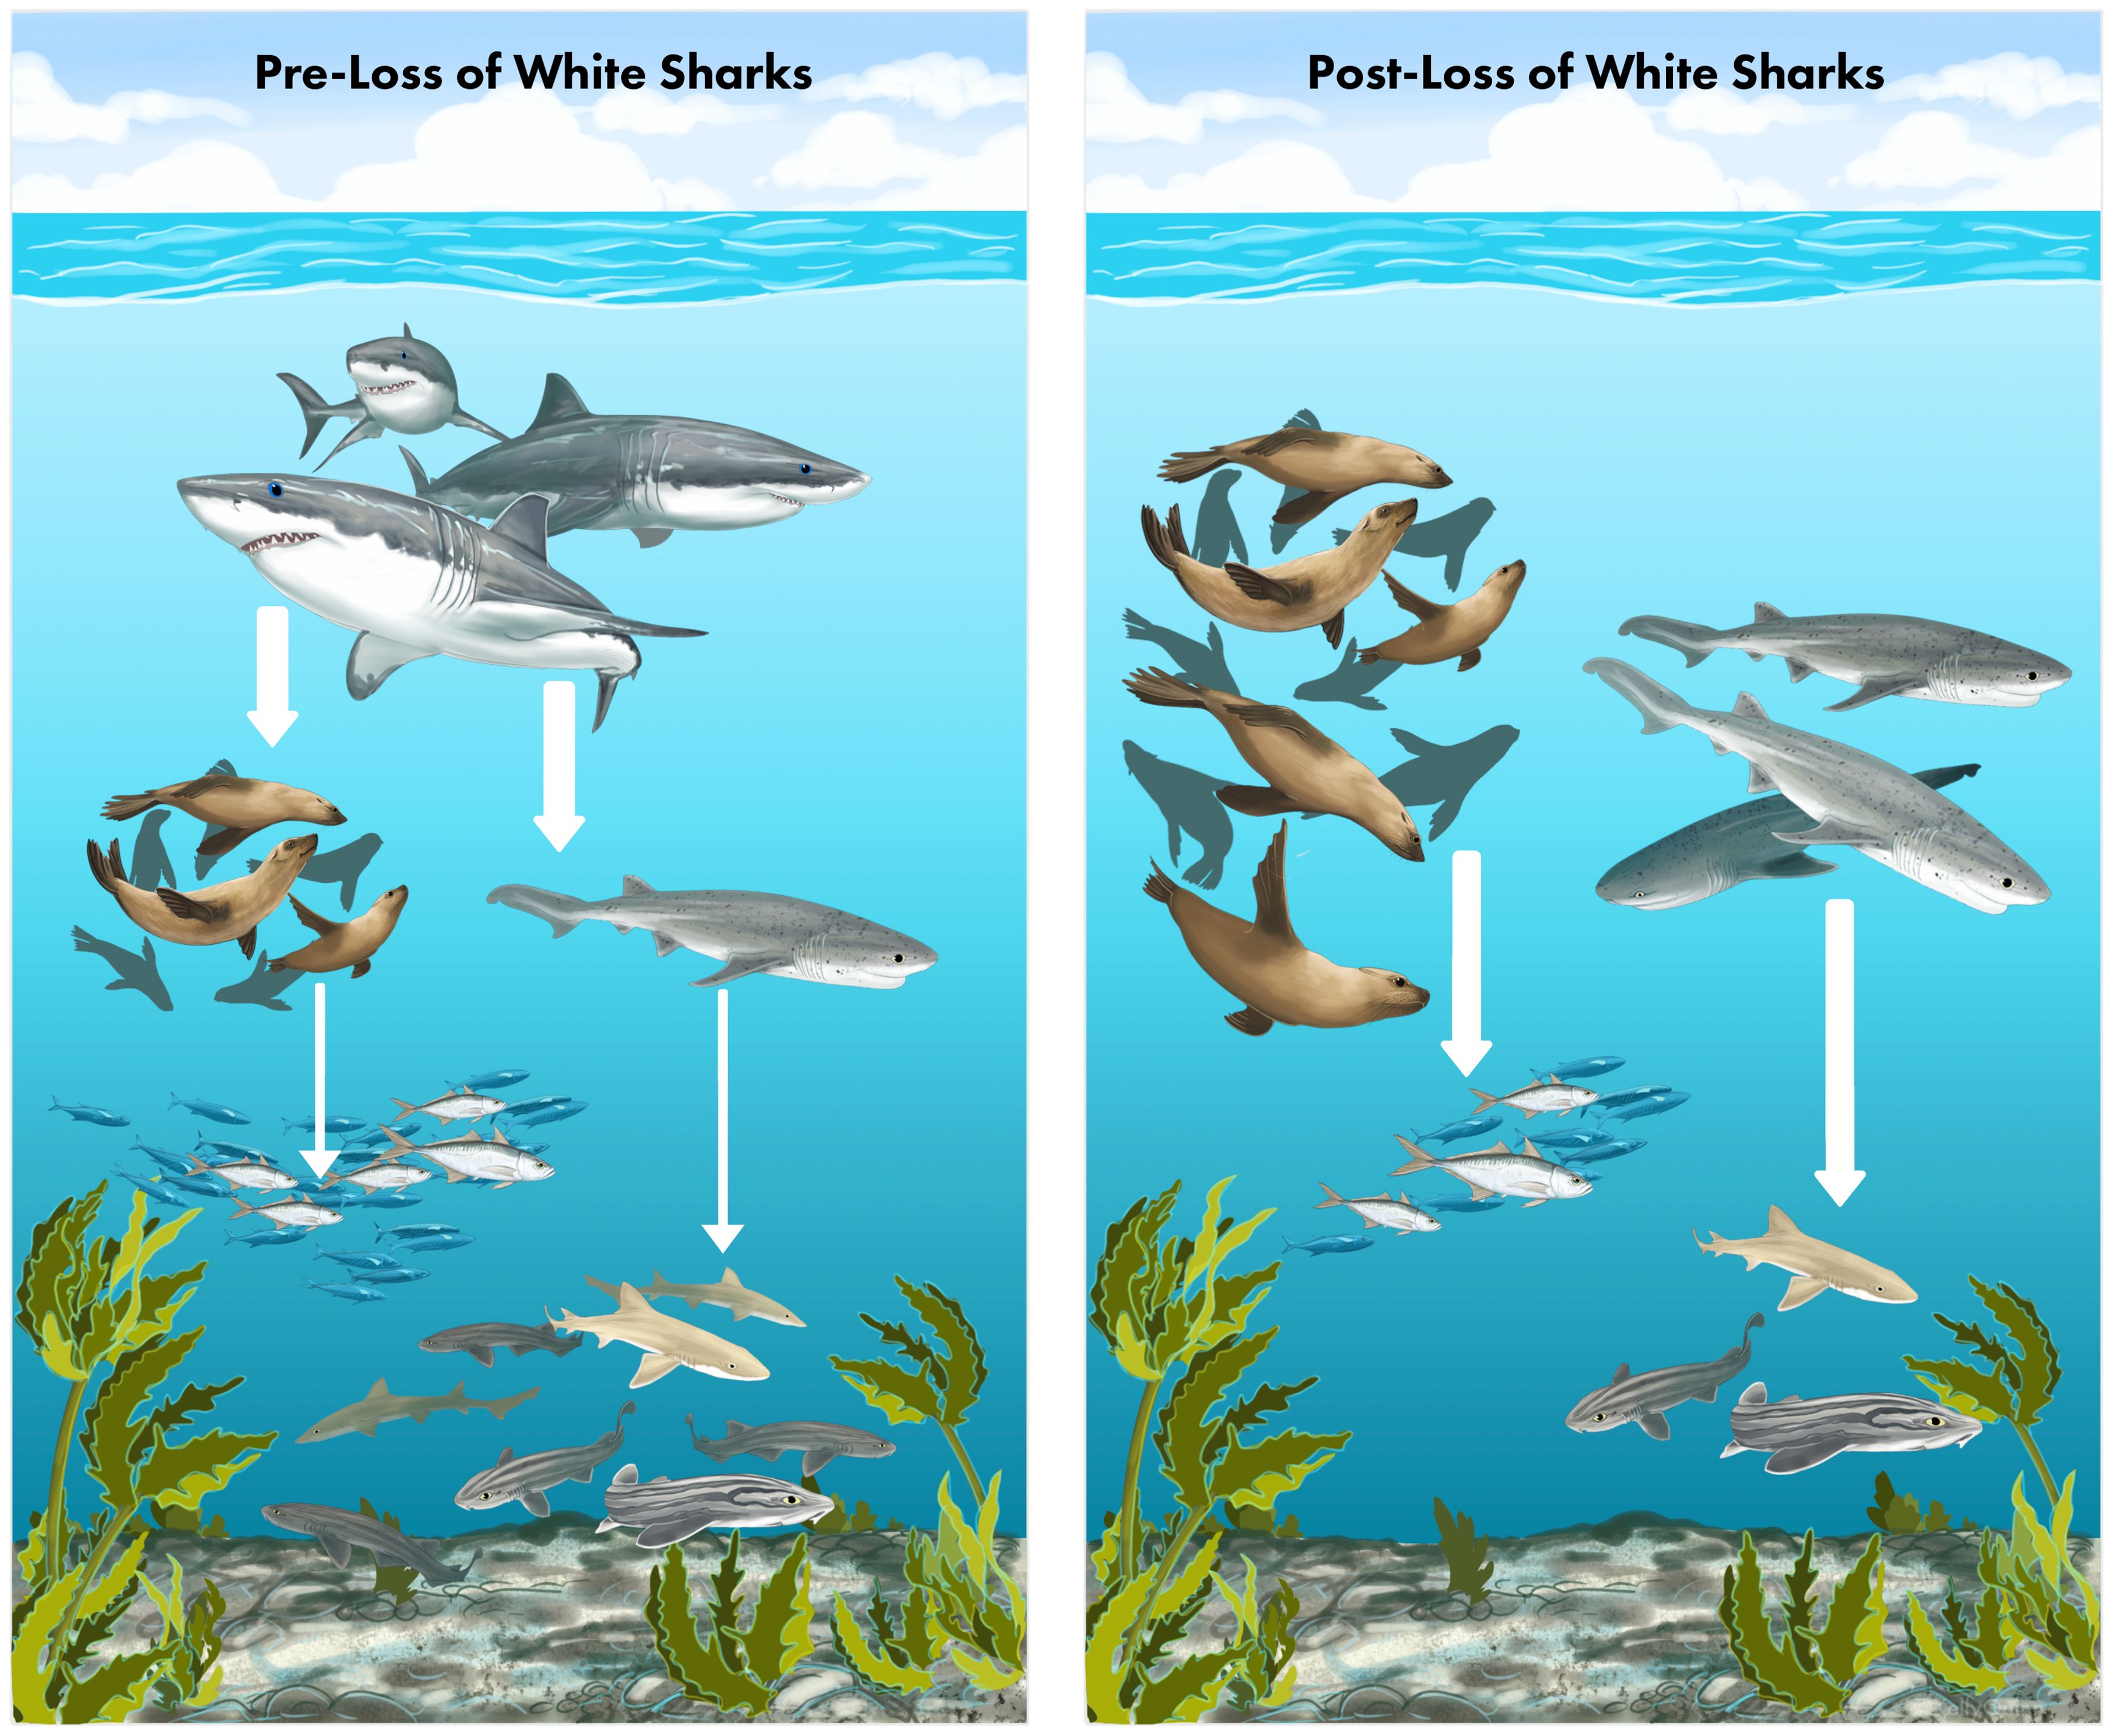
Graphical Abstract. This study provides empirical evidence of a trophic cascade following the loss of white sharks (Carcharodon carcharias) from False Bay, South Africa. Arrow thickness represents the relative strength of top-down predation effects (thicker arrows indicate stronger effects, thinner arrows indicate weaker effects). Left Panel: Historically, white sharks occupied the apex of the food web, preying on Cape fur seals (Arctocephalus pusillus pusillus) and both competing with and feeding on sevengill sharks (Notorynchus cepedianus). Seals primarily preyed on schooling fishes, while sevengill sharks primarily preyed on benthic sharks. Right Panel: Following the decline and eventual disappearance of white sharks from False Bay, both seals and sevengill sharks have increased in relative abundance, coinciding with declines in small fish that seals feed on and smaller sharks that sevengills prey upon. Illustration by Kelly Quinn / Canvas of the Wild.
Introduction
Top predators can affect the density (Creel and Winnie, 2005), physiology (Leach and Taylor, 1977; Woodley and Peterson, 2003), and behavior (Werner et al., 1983) of prey. Such direct impacts on prey may indirectly impact multiple trophic levels (Ripple et al., 2001; Croll et al., 2005; Hammerschlag et al., 2019). Apex predators are among the most threatened species globally, experiencing widespread global population declines (Ripple et al., 2014). Accordingly, this has led to a growing concern for and need to understand the associated ecological consequences of apex predator loss on food webs (Estes et al., 2011).
Sharks are upper-level predators in virtually all marine environments (Cortes, 1999). Research has shown that spatial and temporal variations in shark presence has the potential to alter the abundance and behavior of their prey, indirectly impacting habitat structure (reviewed by Dedman et al., 2024). For example, on a Fijian coral reef, Rasher et al. (2017) found that differences in topography and tidal state created patches of reef that varied spatially and temporally in shark presence. At locations and times where shark encounter rates were high, herbivorous fish reduced grazing activity. This predator-driven alteration to fish behavior created spatial refuges for seaweed from grazing, resulting in higher seaweed biomass (Rasher et al., 2017). In light of global shark population declines from overfishing, understanding and predicting the consequences of shark loss on ecosystems been identified as a research priority (Jorgensen et al., 2022; Dedman et al., 2024). However, empirical evidence of the ecological impacts of large shark declines on prey populations in the wild are limited (Ruppert et al., 2013; Barley et al, 2017a; Barley et al., 2017b, Hammerschlag et al., 2018, Hammerschlag et al., 2019, Hammerschlag et al., 2022) and may be context-dependent (Sandin et al., 2022). For example, on the great barrier reef, Desbiens et al. (2021) did not find an impact of shark density on either density or biomass of teleost mesopredators and prey; instead, many functional groups, including sharks, were more associated with environmental drivers. Moreover, evidence for indirect cascading ecosystem effects of shark removals across multiple trophic levels is scarce (Ferretti et al., 2010; Myers et al., 2007). These knowledge gaps likely stem from the methodological, logistical, and financial challenges of conducting experimental research on large, highly mobile predators in vast marine environments (Hammerschlag, 2019).
Here we evaluated a unique dataset collected as part of a 20+ year monitoring program from False Bay, South Africa, which documented the decline and ultimate disappearance of white sharks (Carcharodon carcharias) from the system (Hammerschlag et al., 2019, Hammerschlag et al., 2022). While the exact reason behind the loss of white sharks from False Bay is unclear (Gennari et al., 2024), known removals of white sharks by the KwaZulu-Natal Sharks Board’s lethal shark control program are high enough to drive regional population declines (Bowlby et al., 2022). Although not yet recorded from False Bay, instances of white shark mortality due to specialized shark-eating orcas (Orcinus orca) have been documented elsewhere along the coastline (Towner et al., 2022), likely contributing to the decline (Gennari et al., 2024).
In False Bay, standardized boat-based surveys of white shark sightings at Seal Island occurred between 2000-2020 providing a metric of relative abundance over time based on the number of individual white sharks sighted per hour of observational effort (Skubel et al., 2018; Hammerschlag et al., 2019). The overall trend in the relative abundance of white sharks was relatively stable in the first fifteen years of monitoring; however, their relative abundance began to precipitously decline after 2015, leading to a complete disappearance of white sharks from the standardized surveys since mid-2018 (Hammerschlag et al., 2022). This rapid decline and subsequent loss of white sharks from False Bay coincided with rapid behavioral and physiological response in their prey, Cape fur seals (Arctocephalus pusillus pusillus), including reductions in seal stress levels and increasing seal rafting distances from Seal Island, a behavior that would have rendered seals vulnerable to shark attack (Hammerschlag et al., 2022). The loss of white sharks from False Bay also coincided with the novel emergence of sevengill sharks (Notorynchus cepedianus) in boat-based surveys at Seal Island (Hammerschlag et al., 2019). Historically, this large-bodied shark would have been an important prey of and competitor with white sharks in False Bay.
Based on ecological theory, here we investigated for potential trophic cascades resulting from the rapid decline and loss of white sharks in the system. Given established predator-prey dynamics in False Bay, we hypothesized that the loss of white sharks in the system would coincide with increases in the relative abundances of Cape fur seals and sevengill sharks, which in turn would be associated with decreases in the relative abundances of their prey, such as small pelagic fishes in the case of seals and smaller benthic sharks in the case of sevengill sharks.
Methods
Study site
Located off South Africa, False Bay is nearly 1000 km2 (Pfaff et al., 2019; Figure 1). Historically, white sharks could be found year-round in False Bay, spending more time within inshore areas during warmer months, while during colder months spending relatively more time patrolling the waters surrounding Seal Island, a rocky outcrop situated 10 km off the Bay’s northern shoreline (Kock et al., 2013). Seal Island may be inhabited by as many as 60,000 Cape fur seals that were targeted prey of white sharks during colder months, whereas white sharks more time within inshore areas during warmer months (Kock et al., 2013), presumably to increase foraging on large teleosts and elasmobranchs, such as sevengill sharks (Martin et al., 2005; Kock et al., 2013).
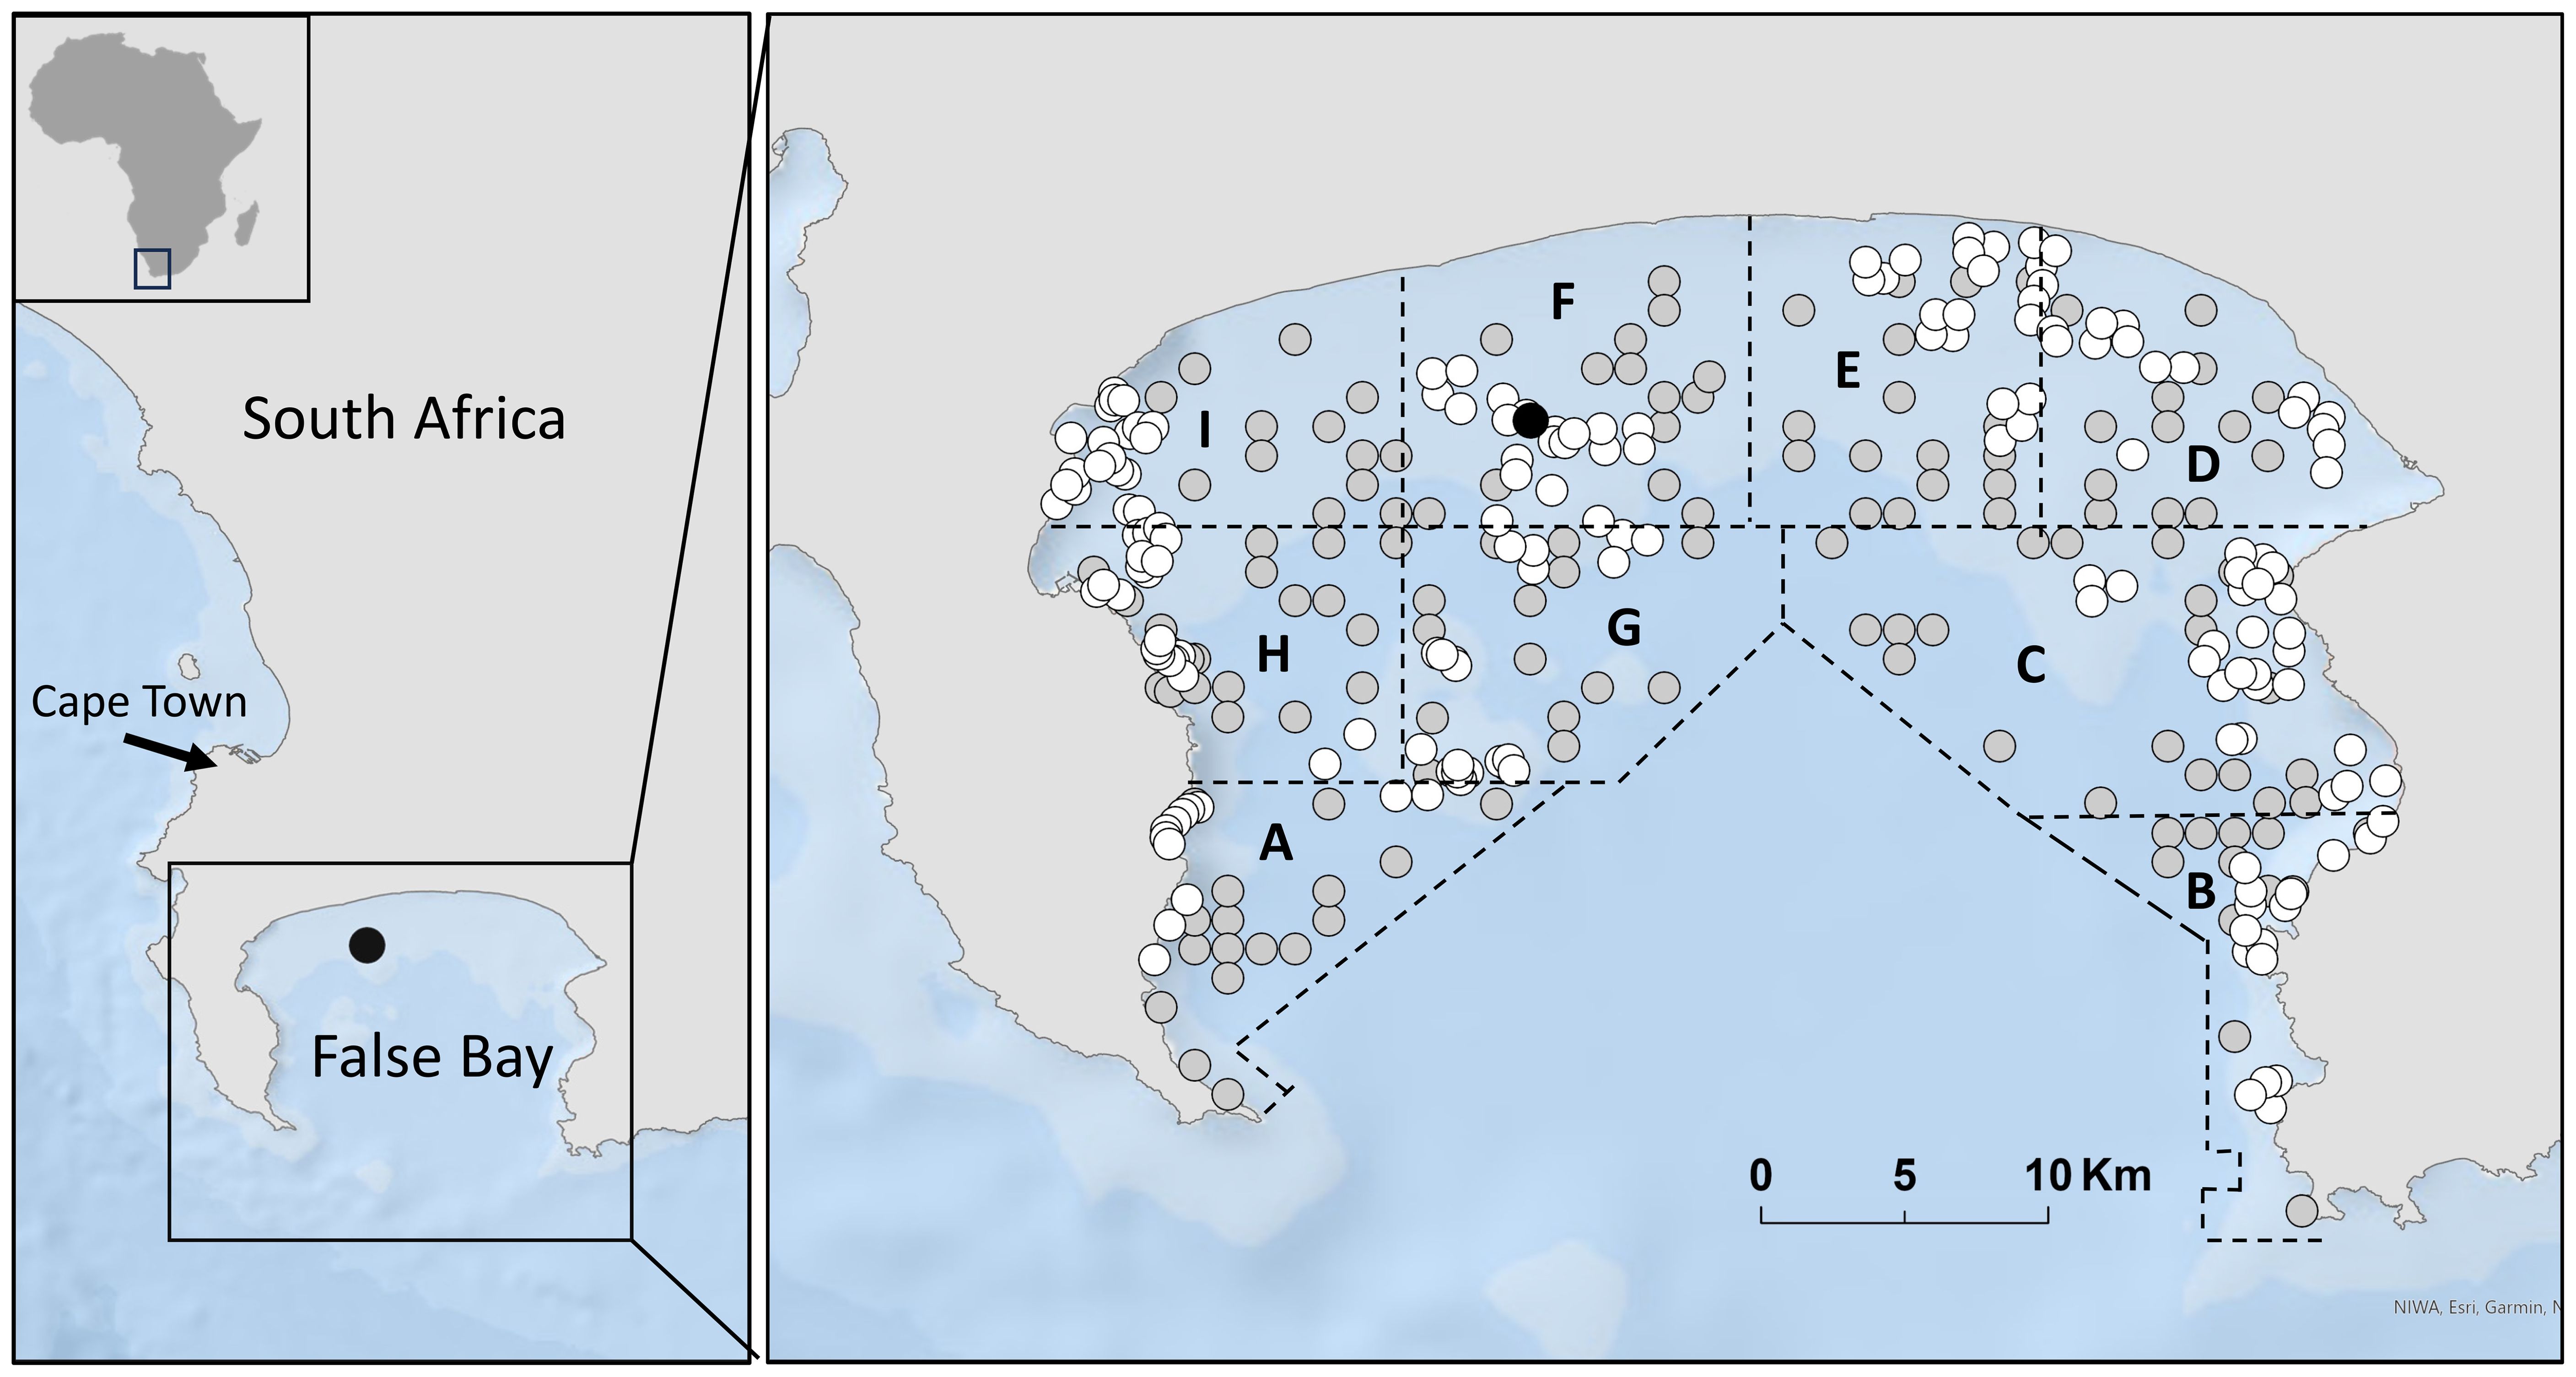
Figure 1. False Bay, South Africa. Seal Island is located with a black circle; white and grey circles represent Baited Remote Video Station (BRUVS) sampling sites in the pre-loss (white circles; 2012) and post-loss (grey circles; 2020/21) periods. Sampling zones are labelled (A–I).
Boat-based surveys at Seal Island
Between 2000 and 2020, shark relative abundance at Seal Island was monitored from standardized boat-based observation surveys (details in Hammerschlag et al., 2019). While surveys occurred year-round, most observations occurred during colder months (May through September) (Hammerschlag et al., 2006; Fallows et al., 2012). During boat-based surveys, sharks were attracted to the boat using a line baited with fish and/or a seal decoy. Individual sharks were identified based on a combination of visual makers, including unique scarring, presence/absence of claspers, and individual variation in pigmentation patterns on the gill flaps, pelvic fins, and caudal fins. The duration of each baited survey was recorded, along with the number of different individual sharks observed during this period. Using these data, the number of different individual sharks observed per hour of baited survey was calculated as a metric of shark relative abundance (Hammerschlag et al., 2019). We used these data to calculate annual means of shark relative abundance at Seal Island, as well as overall means in the period prior to and following the decline of white sharks from False Bay (2000-2015 vs 2016-2020, i.e. pre-loss vs post-loss period).
Seal sightings
Sightings data of Cape fur seals in False Bay were derived from the Global Biodiversity Information Facility (GBIF) database (Telenius, 2011). Only geo-referenced occurrences deriving from ‘Human Observation’ and those occurring within or along the coastline of False Bay were selected, producing reports on Cape fur seal sightings by location and date. The majority of these GBIF data were derived from the iNaturalist citizen science application. Because few reports included the number of individual seals observed at a given time, we focused our analysis on the number of reports of seal sightings, rather than the number of seals observed across reports. The number of visitors to False Bay are likely to influence the number of seal sightings reported to iNaturalist and GBIF (i.e., more visitors equates to more reports). To address this, we obtained data on the number of visitors to the Cape Point Nature Reserve, which spans the western shoreline of False Bay. These data were derived from Wesgro Research (http://www.wesgro.co.za/) sourced from South African Tourism and Table Mountain National Park. While visitor data from the Cape Point Nature Reserve may underestimate the total number of visitors to False Bay, it serves as a reliable relative proxy as the number of visitors to the Cape Point Nature Reserve will scale with the number of visitors to False Bay. It also stands to reason that individuals visiting a nature reserve would be more likely to report natural observations of wildlife to citizen science databases, such as those used here. Thus, to evaluate if sightings of seals have increased over time, we calculated the annual number of seal reports to GBIF divided by the number of annual visitors to the Cape Point Nature Reserve as a standardized proxy of relative seal occurrence in False Bay over time and space. Visitor data were only available beginning 2009, therefore we focused on data from 2009 to 2022. To also evaluate if the spatial distribution of seal sightings has changed across the width of False Bay over time, we calculated the annual longitudinal range in reported seal sightings by subtracting the minimum and maximum longitudinal value of reported seal sightings by year. We then plotted the longitudinal degree range of seal sightings annually, from 2009 to 2022.
Baited remote underwater video stations
BRUVS were deployed in False Bay in both the pre-loss and post-loss period using the same methods and equipment of De Vos et al. (2015a). Each BRUVS consisted of a GoPro HD camera fixed to a metal base, facing a perforated PVC bait canister (130 mm × 110 mm with 10 mm perforations). The bait-facing camera was positioned 1 m away from the bait canister, which was filled with 1 kg of chopped sardine (Sardinops sagax). For deployments, BRUVS were lowered to the seafloor via a retrievable float line and left for at least 65 minutes. The footage retained for analysis was standardized to 60 minutes, starting from the moment the BRUVS settled on the seafloor (De Vos et al., 2015a).
As outlined in De Vos et al. (2015a) False Bay was divided into nine sampling zones, each encompassing a range of depths and habitats to facilitate deployment of BRUVS (Figure 1). BRUVS were deployed in depths of 5 to 50 m, as visibility was compromised in shallower depths due to turbulence and insufficient light at deeper depths. Deployment site selection followed a random stratified design to ensure that each zone, depth range, and habitat type was sampled during winter and summer of both periods. The number of deployments chosen for each zone was proportional to the size of the zone, with fifty percent of deployments within each zone allocated to reef and sand, respectively (see De Vos et al., 2015a for more details). The minimum distance between daily sampling sites was restricted to a minimum of 250 m, but averaged 500 m, to permit statistical independence of deployments (Cappo et al., 2001, Cappo et al., 2003) and to reduce the chance of overlapping bait plumes (Bernard and Götz, 2012).
Between June and December of 2012, 173 BRUVS were deployed in False Bay (summer = 85, winter=88), comprising pre-loss period sampling (Figure 1). Between July 2020 and February 2021, 150 BRUVS were deployed (summer=82, winter=68), comprising post-loss period sampling (Figure 1). Videos from each deployment were analyzed for MaxN, which is the maximum number of individuals of the given species in any single frame for the duration of the 60-minute video at a site (Albano et al., 2021). This provided a value of MaxN per hour for each deployment that was then averaged across samples, providing a metric of relative abundance (Cappo et al., 2001, Cappo et al., 2003).
While BRUVS tend to under-sample larger-bodied shark species (Santana-Garcon et al., 2014; Albano et al., 2021), possibly due to the type and amount of bait used (1 kg of sardines), any white sharks or sevengill sharks recorded on the BRUVS were analyzed for MaxN as a means of independently corroborating patterns found in the boat-based surveys. We primarily used BRUVS data to examine for changes in relative abundance of important prey for seals and sevengill sharks. Based on David (1987) and Huisamen et al. (2012), important prey for seals that were also detected on our BRUVS was Cape horse mackerel (Trachurus capensis). Based on Ebert (1991) important prey for sevengill sharks in the region that were also detected in our BRUVS were pyjama catsharks (Poraderma africanum) and smoothound sharks (Mustelus mustelus).
For these focal prey species, we tested for potential differences between periods in MaxN by fitting a zero-inflated Generalized Linear Mixed Model (GLMM) using the R package ‘glmmTMB’ (Brooks et al., 2017). Since previous work in False Bay by De Vos et al (2015a) revealed differences in the seasonal occurrence of these lower-trophic level species (Cape horse mackerel and smoothound shark = summer; pyjama catshark = winter) as well as habitat preferences for two of the species (smoothound sharks = sand, pyjama catsharks = reef), we modelled individual counts in the form of MaxN as a function of the period (pre-loss vs post-loss of white sharks), sampling season (summer vs winter) and sampling habitat (reef vs sand), including an interaction between period and season. We incorporated sampling zone as a random effect in our models to account for any potential spatial effects and variability on occurrences of the focal prey species. See the Supplementary File 1 for additional details about the GLMMs.
Additionally, from each sampling method (boat-based surveys, seal sightings, BRUVS), we calculated percent change and percent difference in average metric values between periods using the following formulas:
where Vi and V2 are the average value of relative abundance for given species in the pre-loss versus post-loss period. Analyses, calculations, and plots were completed using R Version 4.2.2 (R Core Team, 2024).
Results and discussion
Between 2000 and 2015 (hereafter the pre-loss period), white shark relative abundance in boat-based surveys averaged 1.64 ± 0.03 (mean ± se) shark sightings per hour, whereas between 2016 to 2020 (hereafter as the post-loss period), white shark relative abundance declined to 0.3 ± 0.02 per hour (Figures 2, 3), representing a 82% decrease and -138% difference between periods (Figure 4). No white sharks were sighted in False Bay since August 2018. While BRUVS likely under sampled white sharks, results from our deployments throughout False Bay mirrored those from the boat-based surveys at Seal Island (Figure 3). Specifically, while only three white sharks were detected on 323 BRUVS, these only occurred in the pre-loss period (2012), with no detections of white sharks on BRUVS deployment in the post-loss period (2020/21; Figure 3).
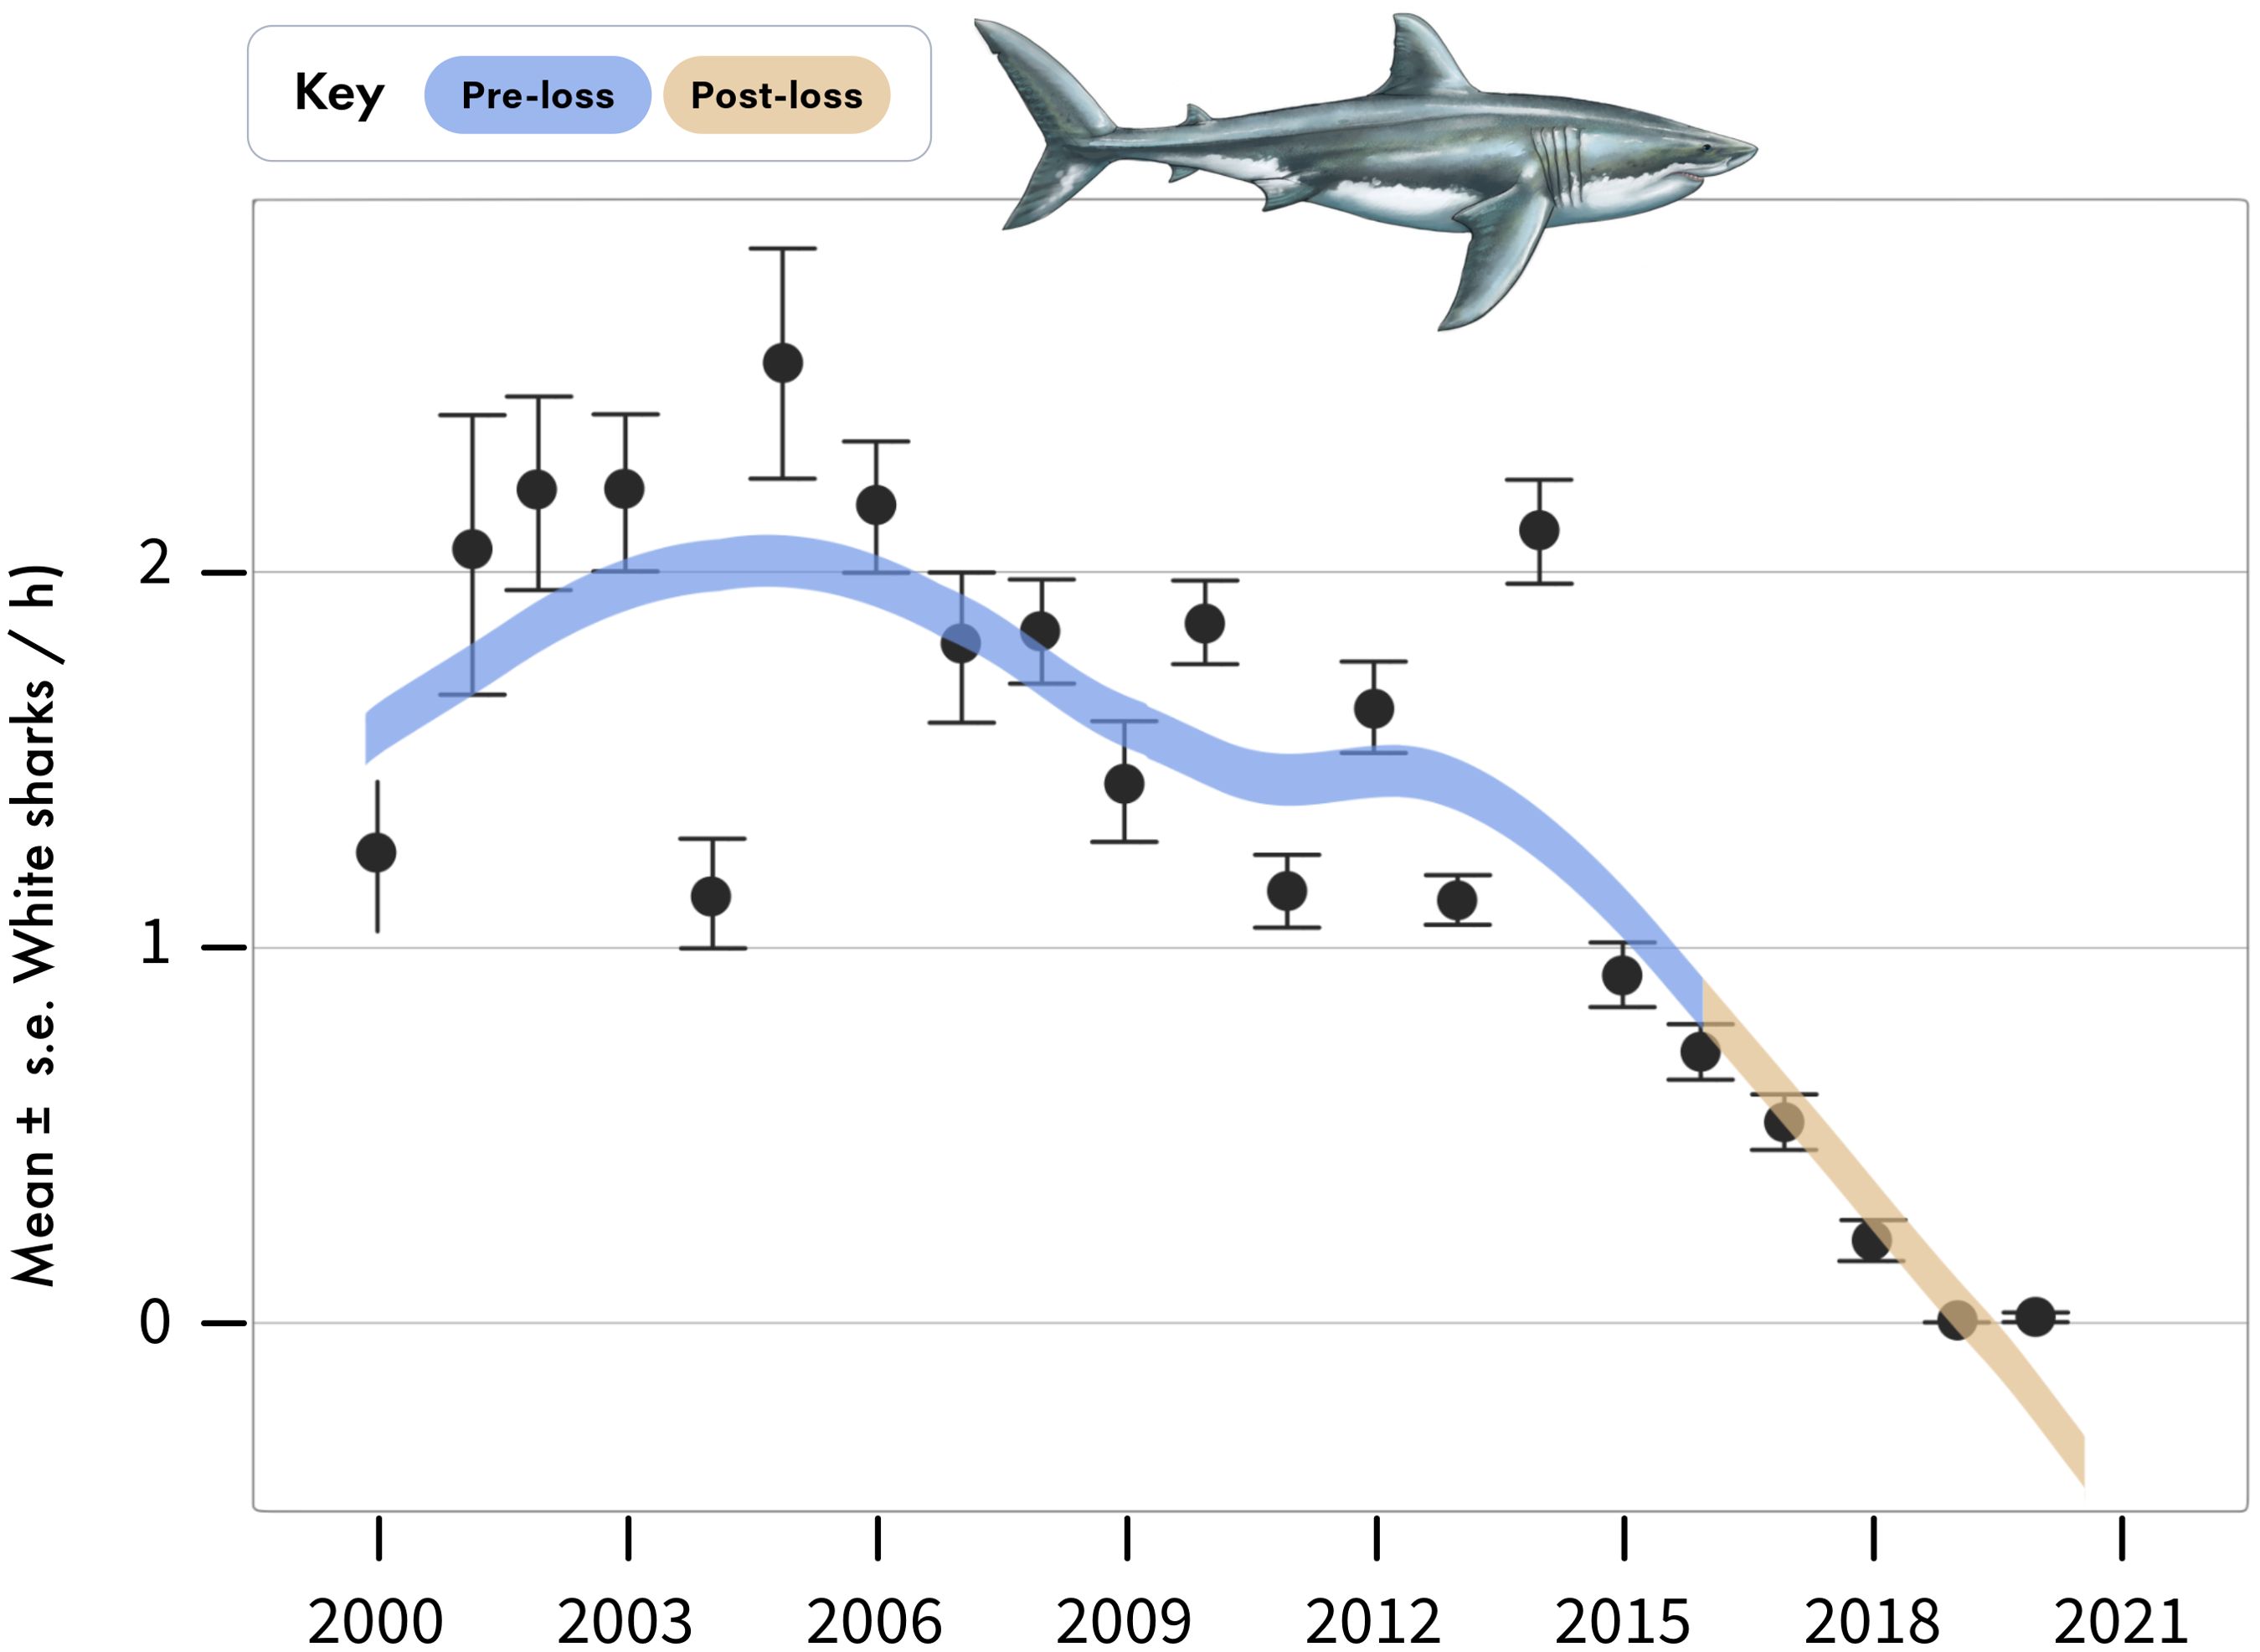
Figure 2. Annual sightings of white sharks during standardized boat-based surveys at Seal Island, in False Bay. Data are mean ± standard error of white shark sightings per hour averaged across sampling days for each year.
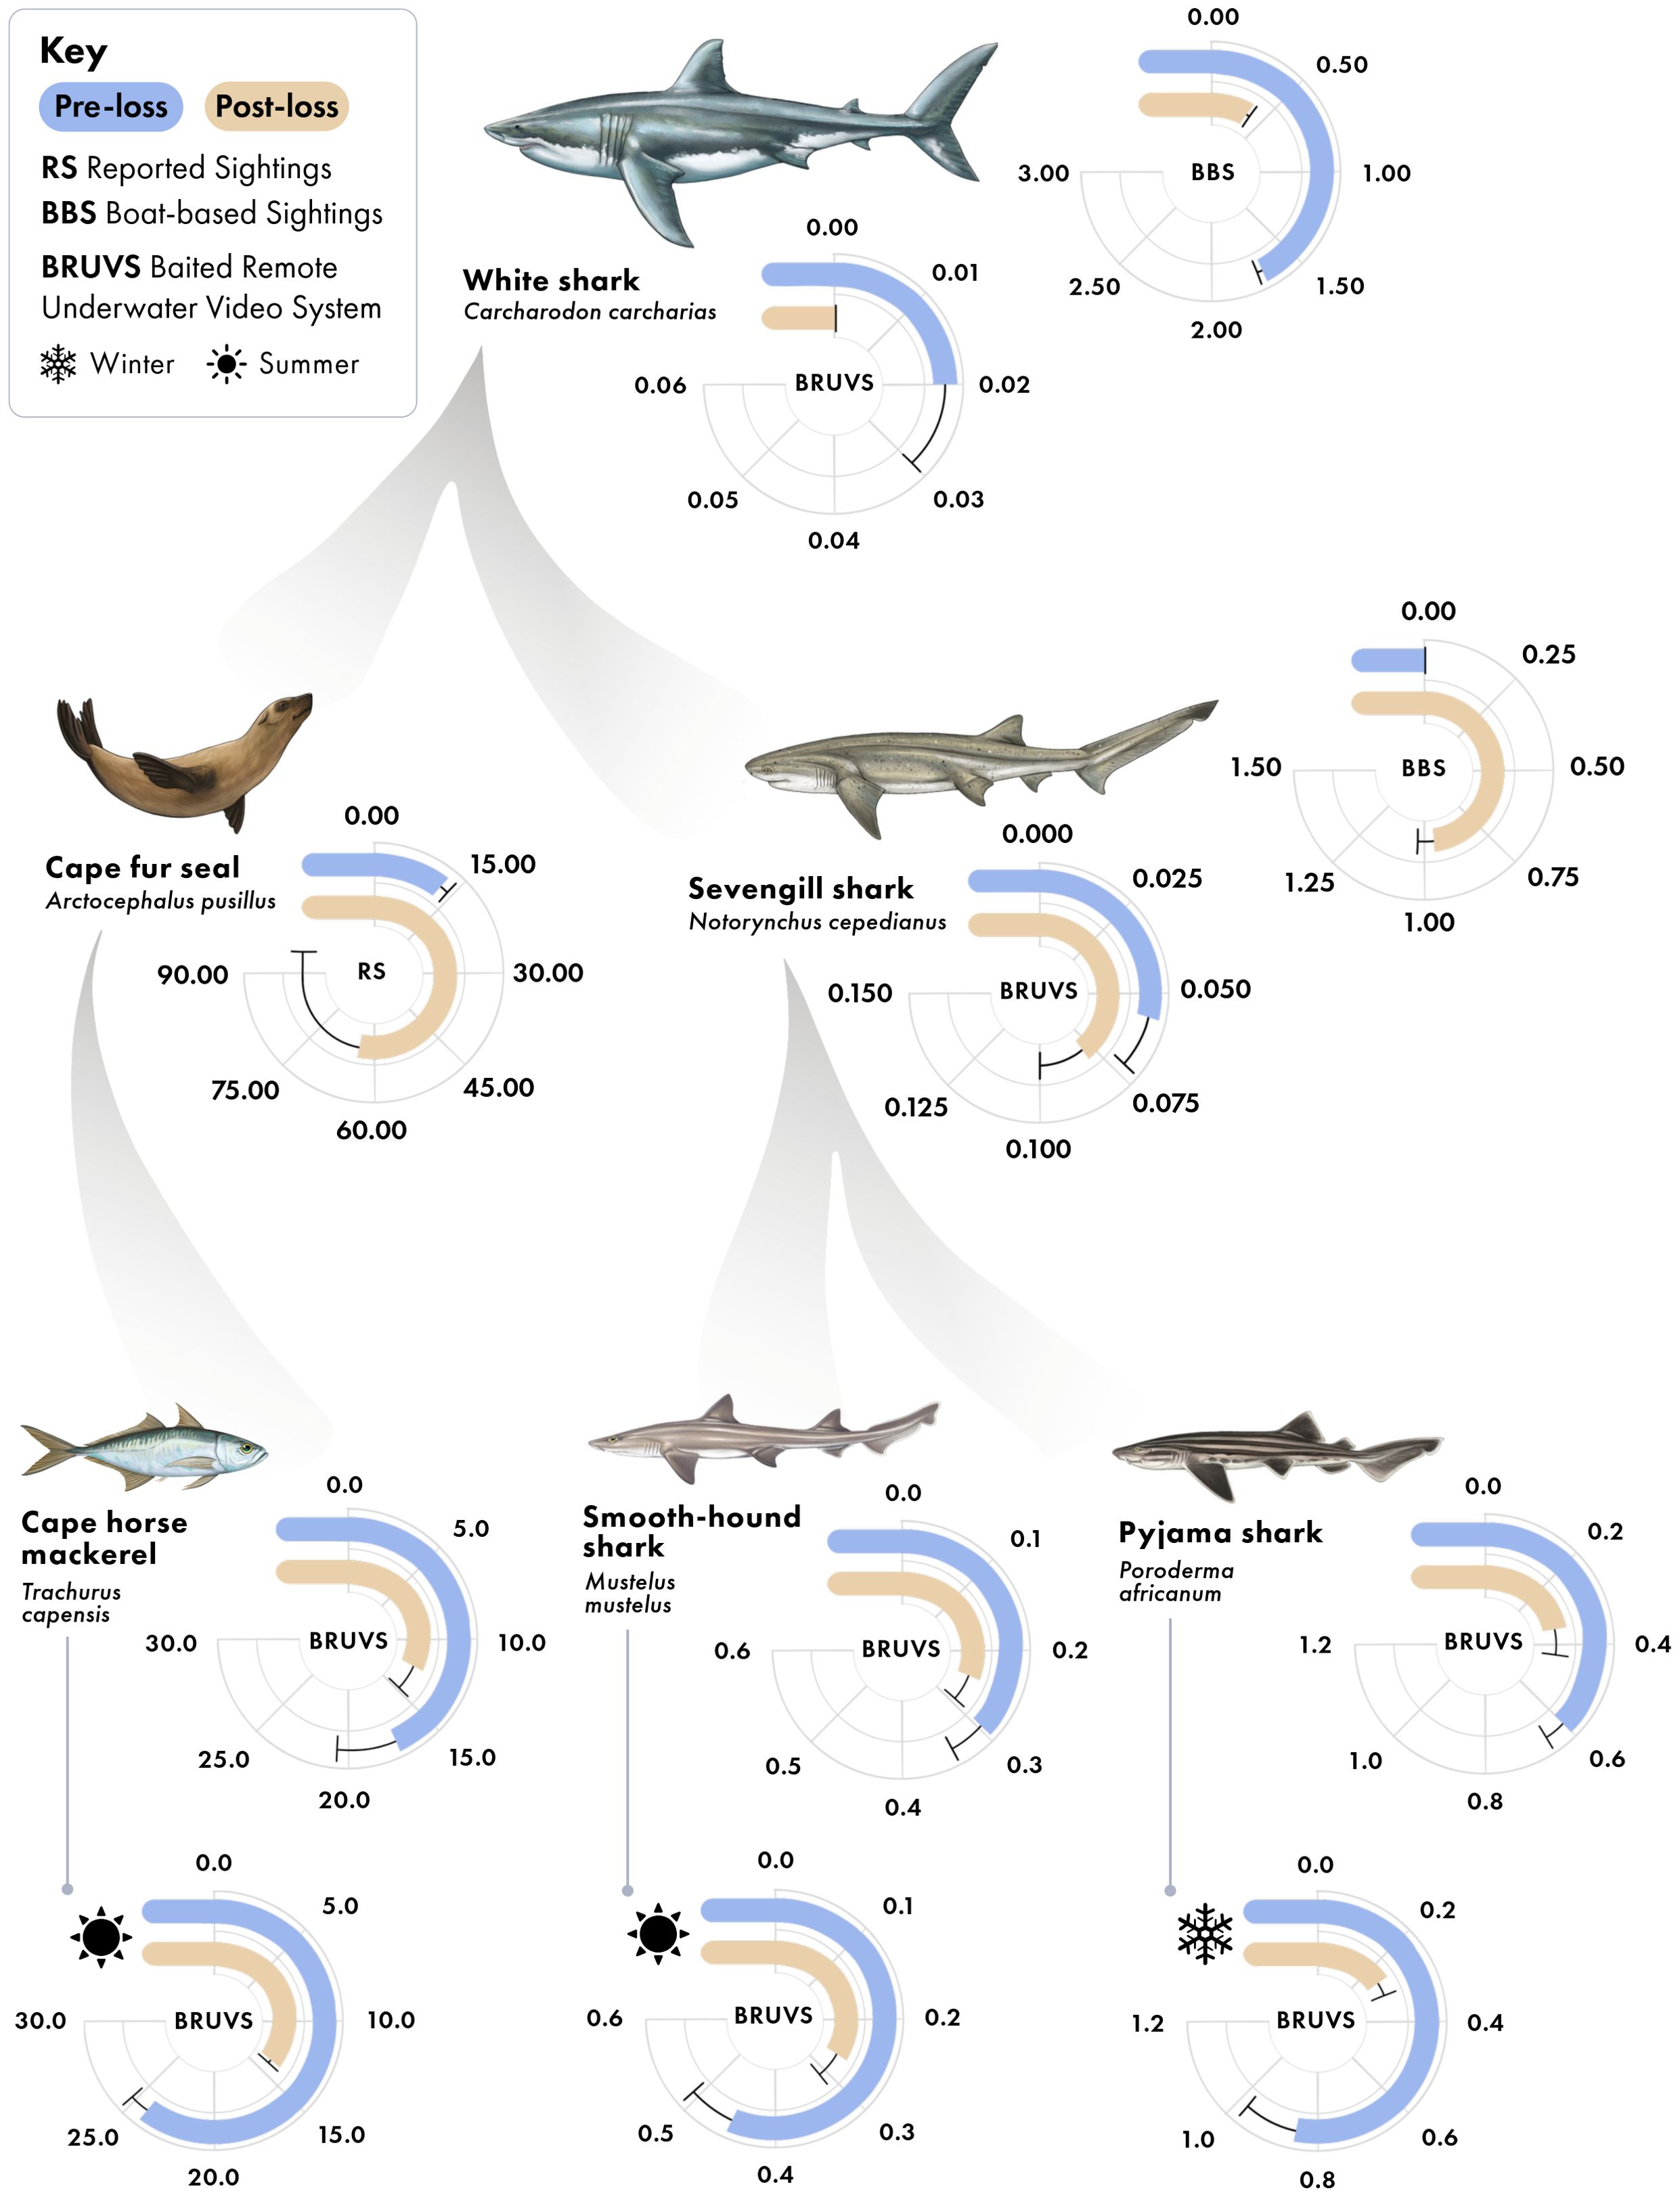
Figure 3. Predator-prey interactions in False Bay, South Africa, with average specie-specific relative abundance values between periods (pre-loss and post-loss of white sharks). Sampling methods producing each radial plot are indicated. Values in radial plots are mean ± standard error; for RS, data are the annual number of Cape fur seal sightings reported in False Bay, per million visitors to the Cape Point Nature Reserve; for BBS, data are the number of individual sharks observed per hour of baited survey; for BRUVS, data are the average MaxN (maximum number of individuals of the given species in any one frame for the duration of the 60-minute sampling video). For Cape horse mackerel, pyjama catsharks, and smoothhound sharks, overall data are provided, along with data for the specific season in which each species is prevalent, denoted by icons.

Figure 4. Percent difference between pre- and post-loss period for known predator-prey interactions. Darker blue bars are based on baited remote underwater video stations (BRUVS) and lighter blue bars are based on standardized sightings data. Horizontal dashed lines separate trophic levels. For Cape horse mackerel, pyjama catsharks, and smoothhound sharks, overall data are provided, along with data for the specific season in which each species is prevalent, denoted by icons.
Coinciding with the decline of white sharks, seal observations reported from False Bay have increased over the same period (Figure 5), growing from a mean of 10.52 ± 2.27 reported seal sightings per million visitors to the area during the pre-loss period to 65.21 ± 32.55 in the post-loss period (Figure 5), representing a 520% increase and a 144% difference between periods (Figure 4). Of note, both visitor numbers at the Cape Point Nature Reserve and reported seal sightings dipped in 2020, likely due to Covid-19 lock-downs and associated restrictions on movement, which would likely curtail outdoor activities (Supplementary File 2, Supplementary Figure S1). However, in 2021, despite continued low visitation to the nature reserve, reported seal sightings reached a peak (Supplementary File 2, Supplementary Figure S1). This discrepancy may be explained by a relaxation of lockdown restrictions, which enabled more localized outdoor activities and associated wildlife observations, while few people still avoided public spaces, like the Cape Point Nature Reserve (Supplementary File 2, Supplementary Figure S1). In addition to increases in the frequency of reported seal sightings in the post-loss period, the spatial extent of reported seal sightings has expanded across the width of False Bay (Figure 5). For example, all reported seal sightings spanned only 0.045 degrees of longitude (4.14 km) in 2016, but increased to 0.426 degrees of longitude (39.18 km) in 2019, an increase of 846%. Notably, both the number of reported seal sightings and the spatial extent of these sightings were consistently relatively low for years, until the documented onset of white shark decline, after which values began to rapidly increase (Figure 5, Supplementary File 2, Supplementary Figure S1).
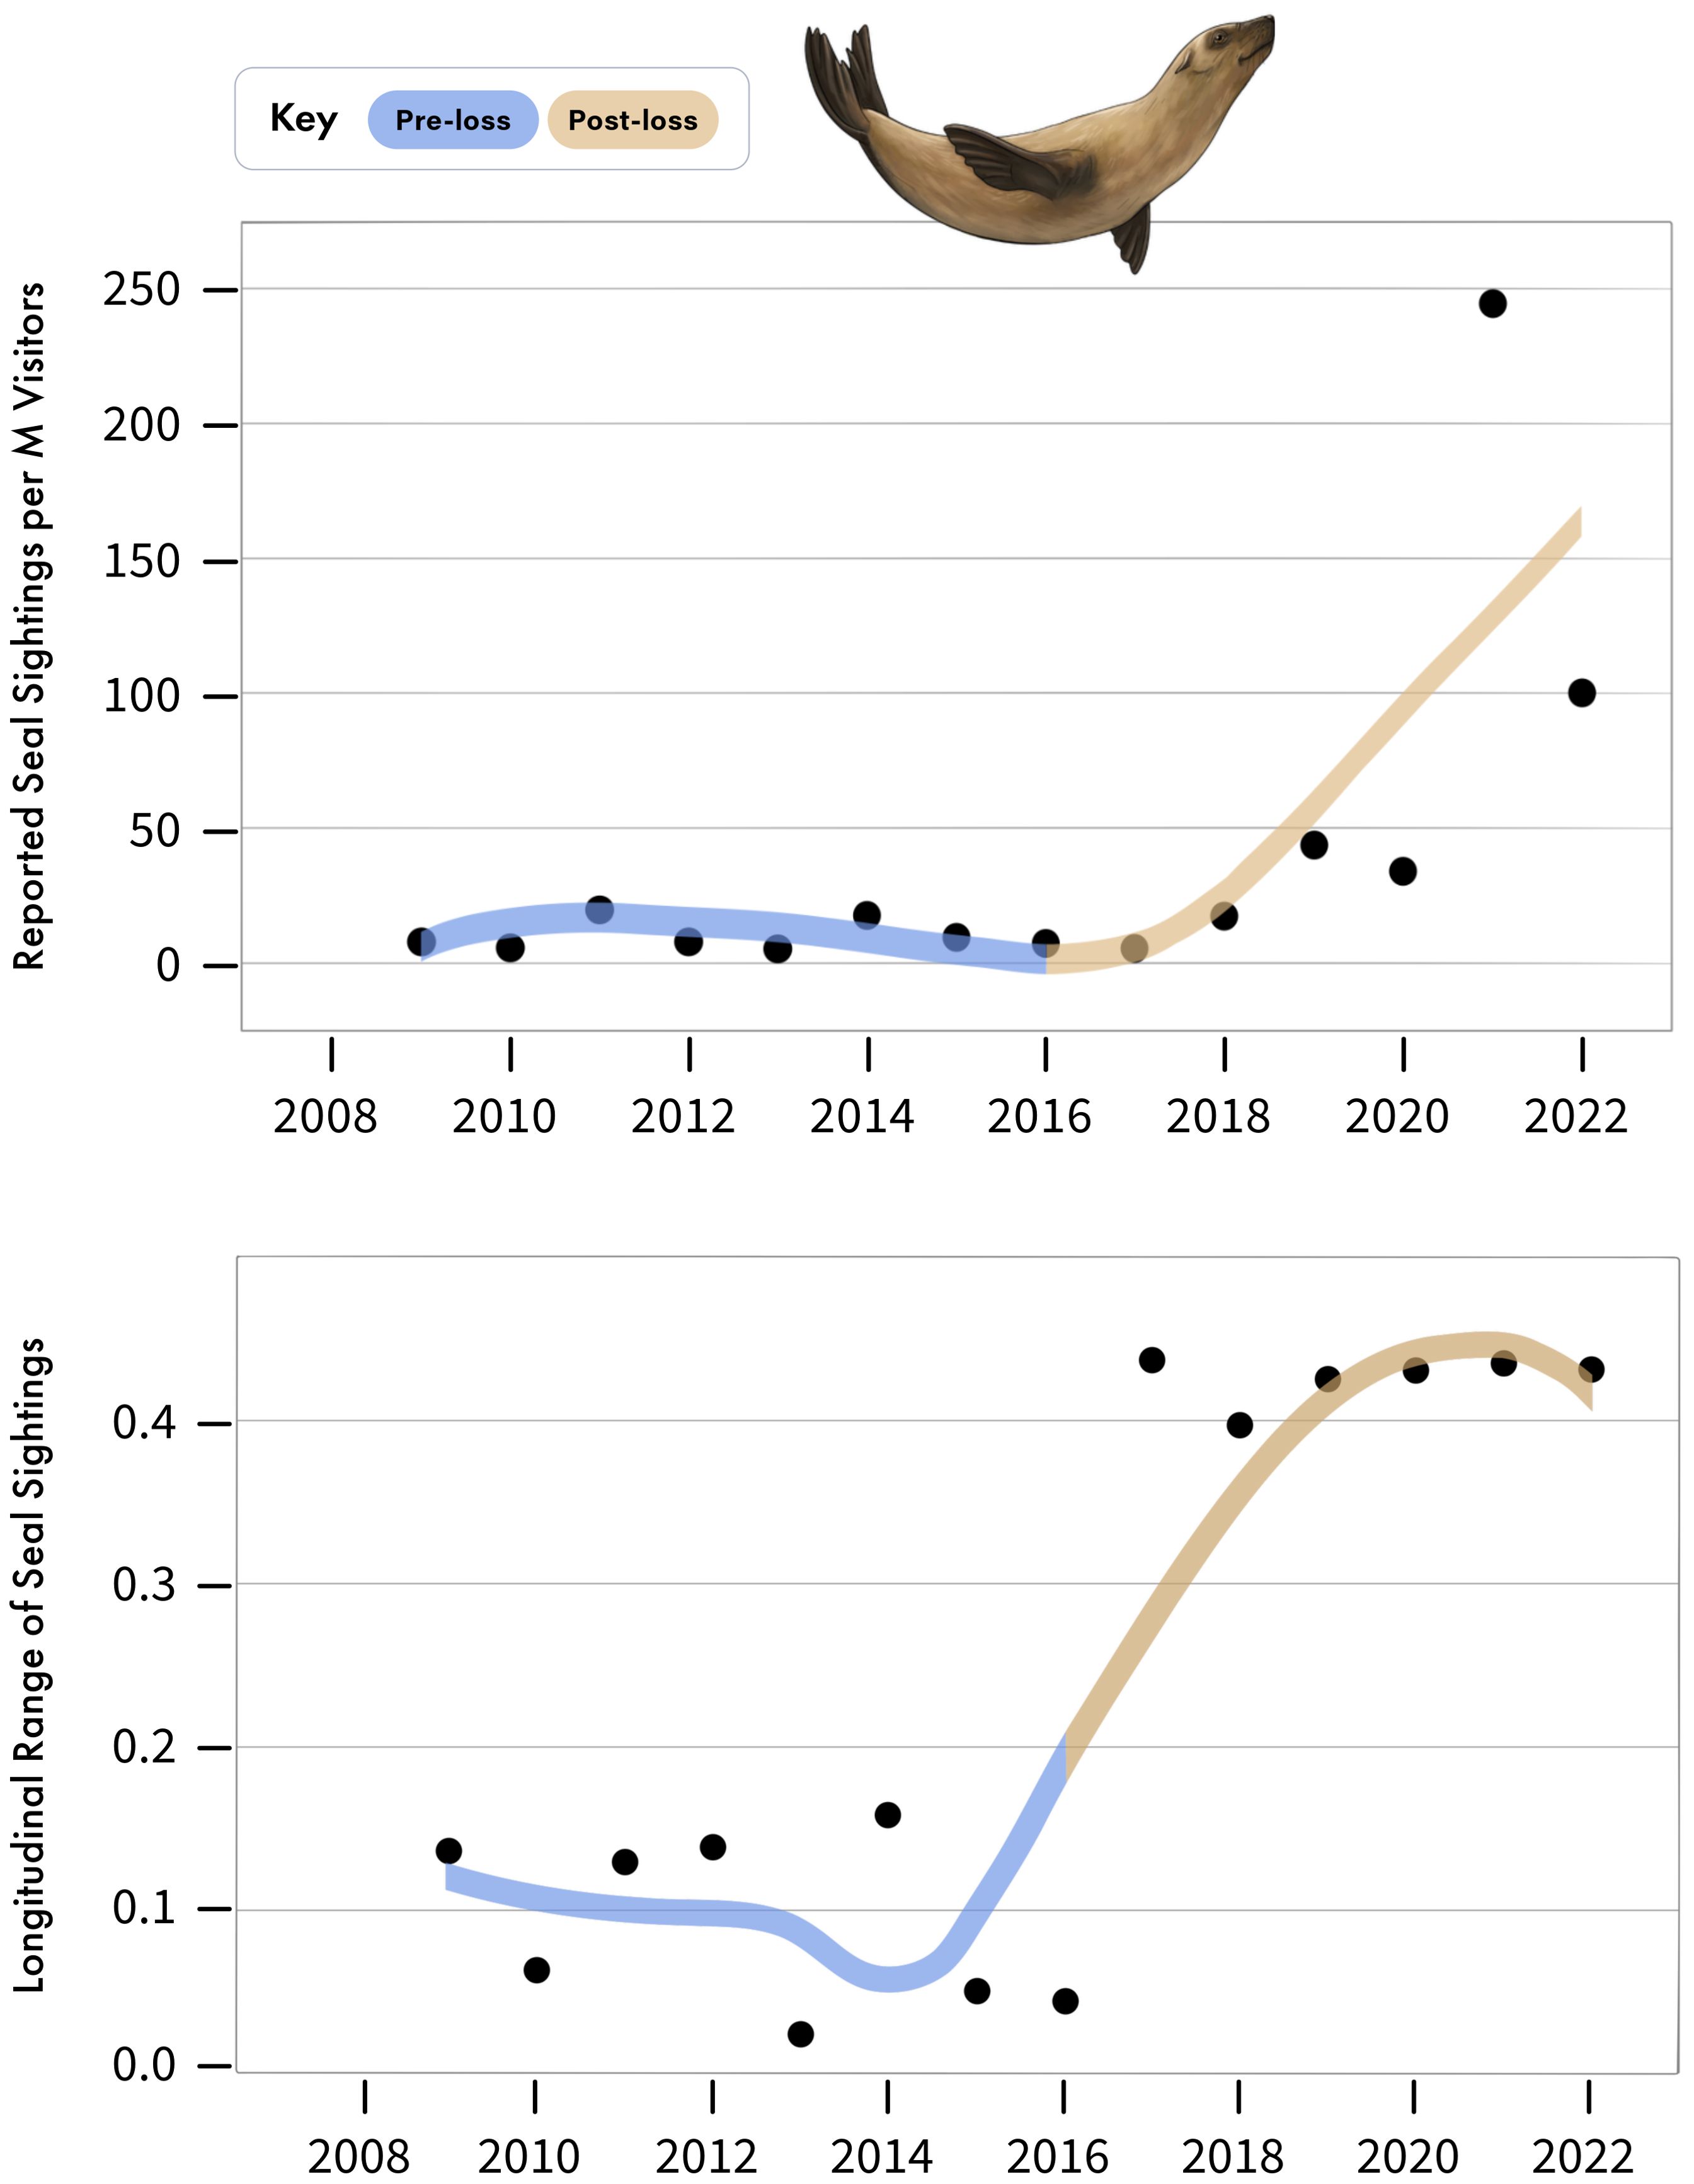
Figure 5. (Above) Annual number of Cape fur seal sightings reported in False Bay in GBIF, per million visitors to the Cape Point Nature Reserve. (Below) Longitudinal range, in degrees, of seal sightings reported annually to GBIF. Note that 0.1 degrees longitude is equivalent to approximately 9.2 km.
Cape fur seals in the region primarily feed on small pelagic fishes, such as anchovies (Engraulis encrasicolus) and to a lesser extent Cape horse mackerel. While anchovies were not detected in our BRUVS, Cape horse mackerel were. Cape horse mackerel have been found to be among the most abundant fish species detected in BRUVS studies within our study region (e.g. Roberson et al., 2015). Coinciding with changes in seal sightings between periods, we detected a reduction in the relative abundance of Cape horse mackerel on our BRUVS (Figure 3), a 22% decrease and -33% difference between the pre- and post-loss periods (Figure 4). This reduction occurred primarily in the summer, when Cape horse mackerel were historically most abundant in False Bay (De Vos, 2021). Their summer relative abundance declined from a mean MaxN of 24.62 ± 0.54 in the pre-loss period to 13.05 ± 0.4 during the post-lost period, representing a 44% decline and -61% difference (Figure 3, 4). This decline emerged as statistically significant in the zero-inflated GLMM (Supplementary Table S1, Supplementary Table S2, Supplementary Table S3), where a strong interaction between period and season was detected (Wald X2 = 8.71, p = 0.003). As Cape horse mackerel are prey of seals in False Bay (David, 1987), these findings are consistent with a trophic cascade arising from predation release on seals due to the loss of white sharks; a pattern in agreement with previously demonstrated changes in seal behaviors and reductions in seal physiological stress levels associated with the declines of white sharks in False Bay (Hammerschlag et al., 2022).
Sevengill sharks were not observed in boat-based surveys at Seal Island in the pre-loss period, but averaged 0.96 ± 0.03 sightings per hour following the decline of white sharks from the system (Figure 6). Similarly, the relative abundance of sevengill sharks detected on BRUVS was consistent with the findings from the boat-based data (Figure 3). For two important prey species of sevengill sharks detected in our BRUVS (pyjama catsharks and smoothound sharks), we found reductions in relative abundance that fell by 40% and 21%, respectively, between periods, a -50% and -23% difference (Figures 3, 4). Similar to the findings for Cape horse mackerel, declines for both species primarily occurred in one particular season: winter for pyjama catshark and summer for smoothound. For pyjama catsharks, winter relative abundance declined from 0.86 ± 0.10 in the pre-loss period to a mean of 0.24 ± 0.06 during the post-lost period (Figure 3), representing a 72% decline and -113% difference between periods (Figure 4). This decline also emerged as statistically significant in the GLMM (Supplementary Table S1, Supplementary Table S2, Supplementary Table S3), where a strong interaction between period and season was detected (Wald X2 = 9.70, p = 0.002). For smoothound sharks, their summer relative abundance declined from 0.45 ± 0.07 in the pre-loss period to 0.26 ± 0.06 during the post-lost period (Figure 3), representing a 42% decline and -54% difference between periods (Figure 4). The interaction between period and season did not emerge as statistically significant in the GLMM for smoothound (Wald X2 = 2.01, p = 0.156), although contrast analysis indicates a potentially relevant change for the species during the summer (Supplementary Table S1, Supplementary Table S2, Supplementary Table S3).
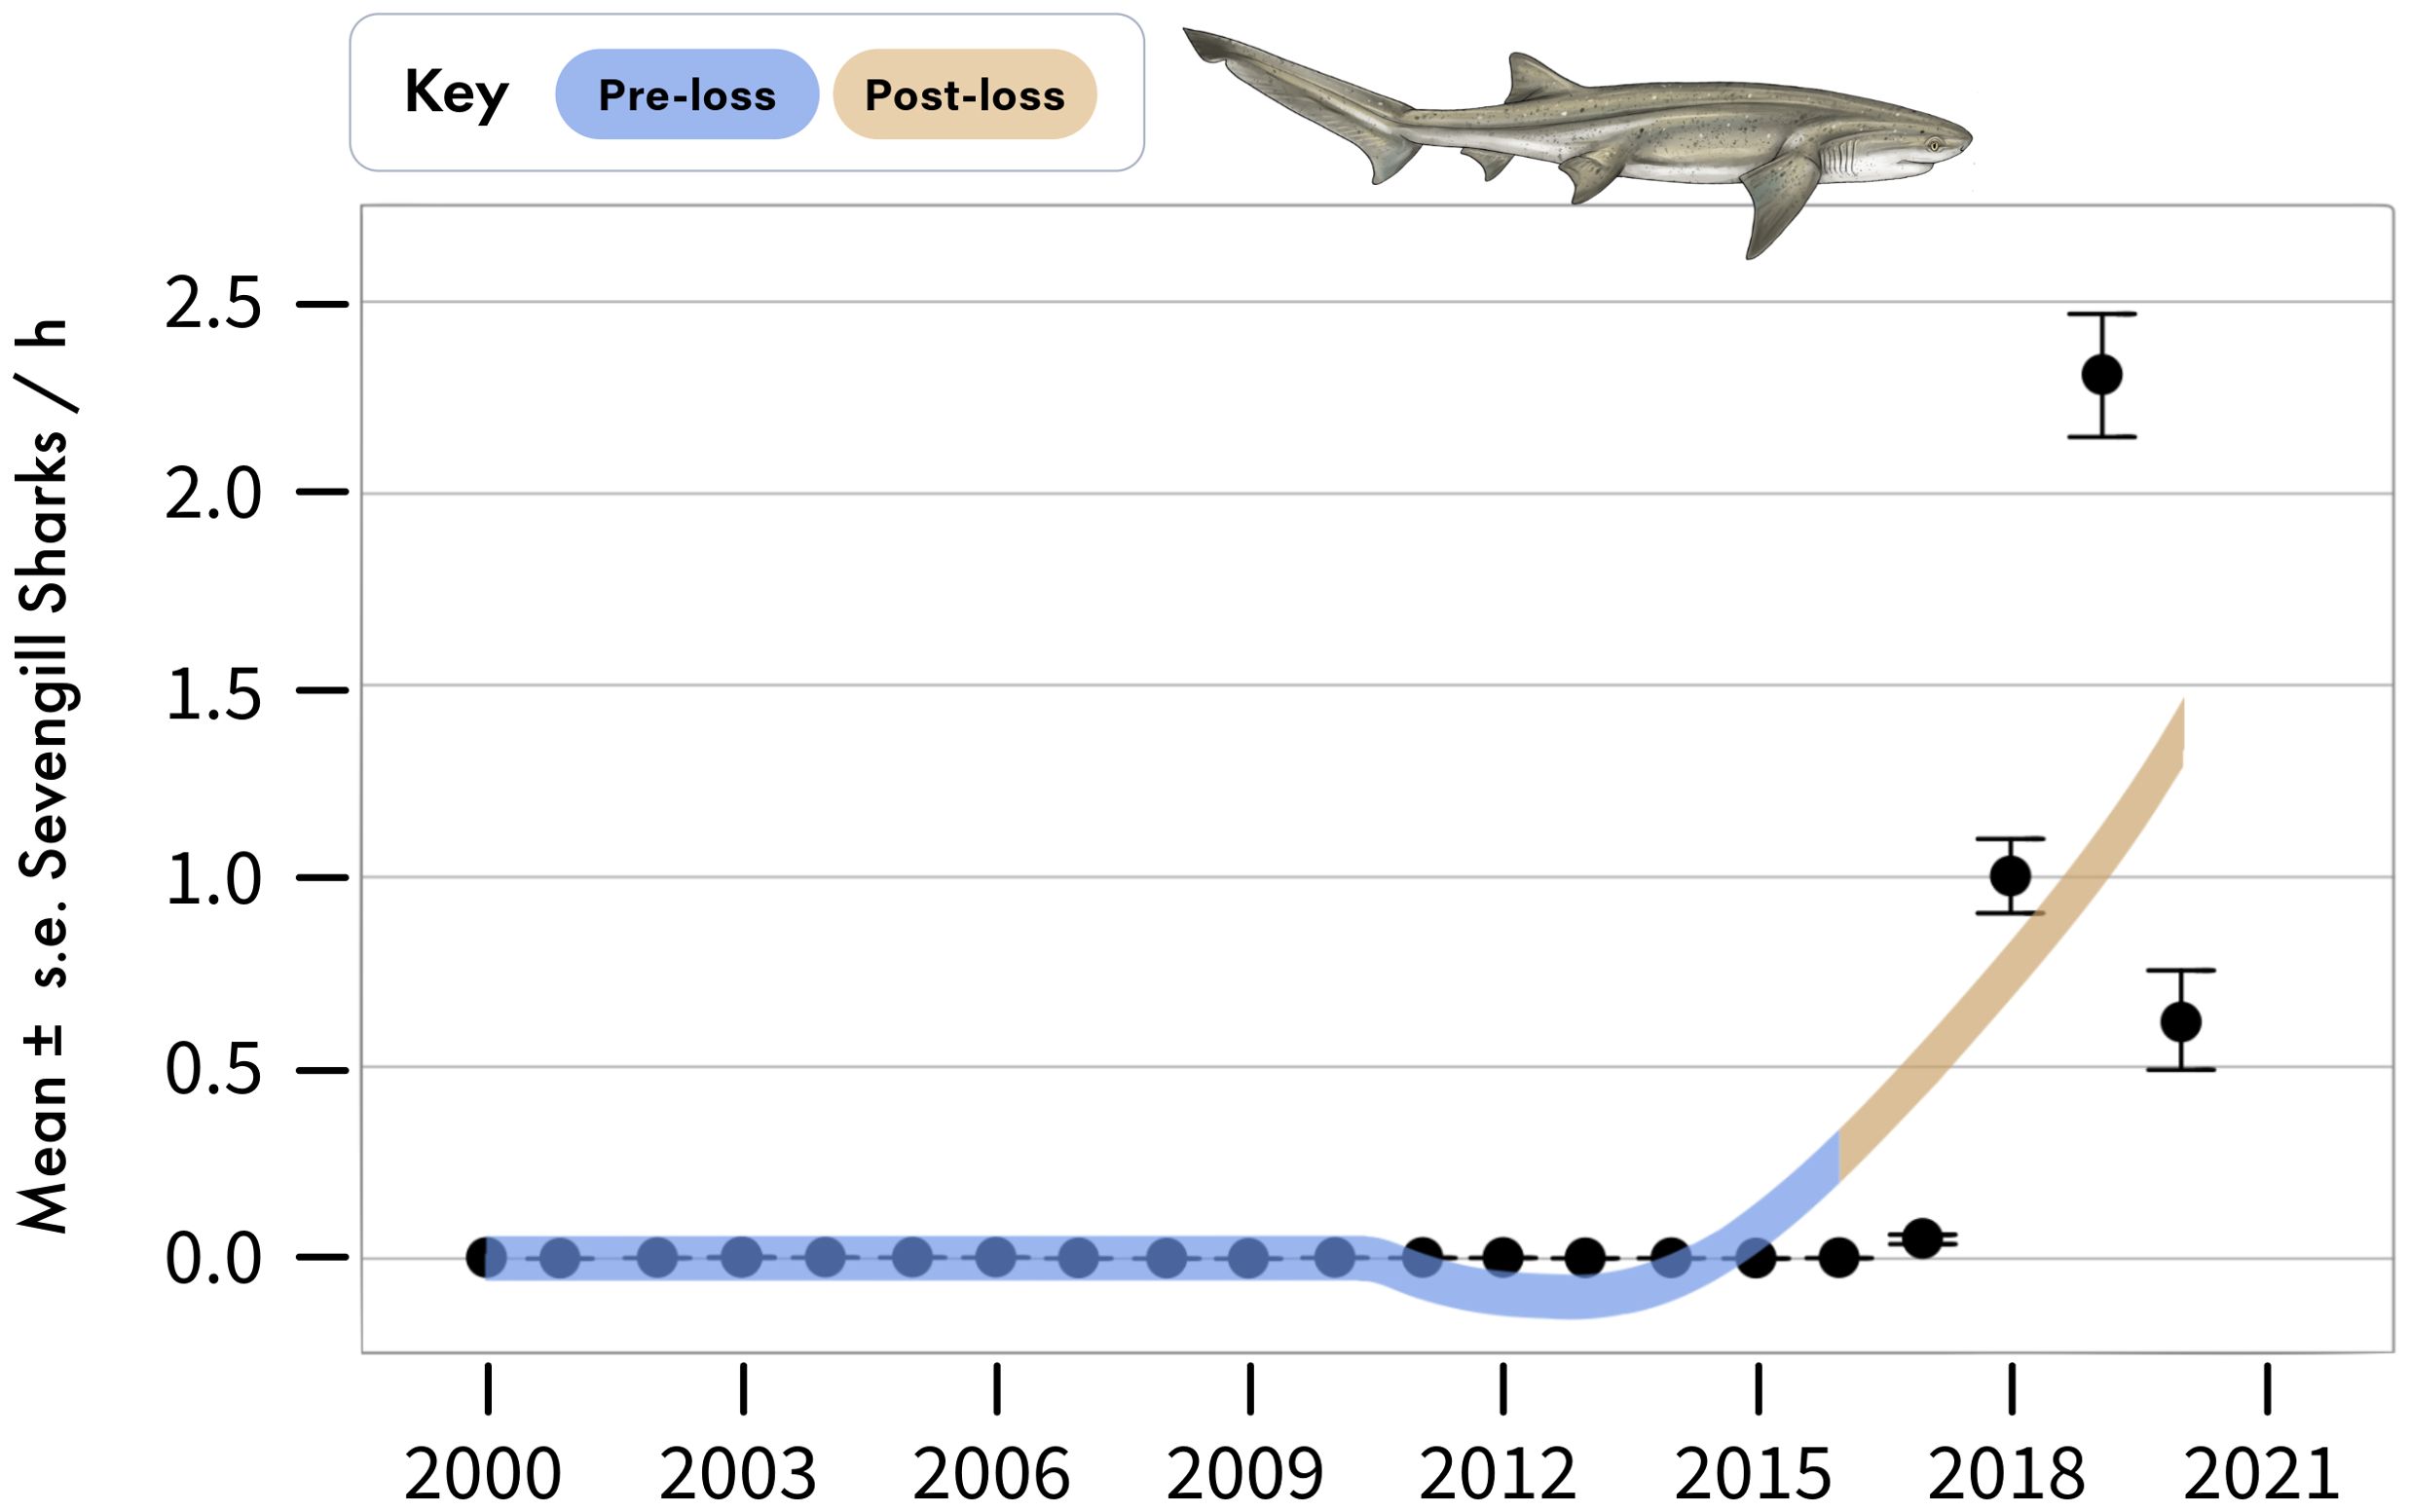
Figure 6. Annual sightings of sevengill sharks during standardized boat-based surveys at Seal Island, in False Bay. Data are mean ± standard error of sevengill shark sightings per hour averaged across sampling days for each year.
The three prey species – Cape horse mackerel, pyjama catsharks, and smoothounds – are known to exhibit seasonal differences in their occupancy of False Bay (De Vos et al., 2015a; De Vos, 2021). Interestingly, we primarily detected declines between periods in the seasons in which these species were historically more abundant in False Bay. It is thus possible that their predators (seals and sevengill sharks) are primarily targeting these prey species during the seasons in which their prey are most abundant. Accordingly, predation pressure would vary seasonally as would be the expected responses by prey, which would explain our results. Such patterns have been found in other predator-prey systems. For example, experiments with predatory birds and artificial lizards in tropical savanna woodlands have revealed higher predation by birds during the wet season driven by increased prey availability, not by increased predators (Nordberg and Schwarzkopf, 2019). Moreover, observations of big cats in Kenya showed that seasonal changes in prey abundance influenced predation; lion (Panthera leo) and cheetah (Acinonyx jubatus) switched their hunting focus to wildebeest (Connochaetes taurinus) during seasons of increased wildebeest abundance (Vettorazzi et al., 2022).
We note that changes in species relative abundance found here following the loss of white sharks are likely not exclusively or primarily due to alterations in consumer-induced mortality; but rather, are also a result of behavioral adjustments associated with alterations to predation risk. Prey will typically reduce risk of predation by increasing refuge use and/or reducing conspicuous foraging behavior (Werner et al., 1983) as has been documented in the case of white sharks and seals (e.g. De Vos et al., 2015b; De Vos et al., 2015c). According, we suspect that increases in species relative abundance patterns are also driven by increased foraging behavior and/or decreased refuging in the post-loss period associated with predation release. We suspect that given the relatively short time span over which white sharks were lost from False Bay, the observed changes across trophic levels are likely driven more by changes in antipredatory behavior.
The trophic cascade hypothesis posits that the magnitude of top-down effects of predators are strongest at trophic levels immediately below them; but, diminish successively down the food web (Shurin et al., 2002; Ripple and Beschta, 2004; Borer et al., 2005). Our findings were consistent with this ecological pattern (Figure 4), with the largest magnitude in relative differences between pre- and post-loss periods recorded in seals and sevengill sharks, with a relatively lesser magnitude in relative differences seen in lower trophic levels.
Limitations and alternative hypotheses
A limitation of any correlative study in the wild is that our results could be driven by confounding factors including fishing, pollution, invasive species, climate change, and natural stochastic processes. However, for the species evaluated here, we found patterns that were inconsistent with long-term population trajectories in the region that we believe would otherwise confound our results. For example, we documented a marked increase in the frequency and spatial scale of seal sightings in the post-loss period, despite the seal population in False Bay having been on a declining trajectory since the late 1990s (Kirman et al., 2013). We realize that seal sightings data are dependent on reporting via citizen science applications, like iNaturalist, that have likely become more accessible due to smartphones in more recent decades. However, the number of smartphone users have steadily increased since 2009 (Sandesara et al., 2022), which is inconsistent with the patterns of reported seal sightings documented here, which only began to rapidly increase following the loss of white shark from False Bay after 2017.
While we documented a concurrent decrease in the relative abundance of Cape horse mackerel during the post-loss period, a recent assessment indicated that the stock status of this species for the South African coastline is optimal and that spawning biomass are well above Maximum Sustainable Yield, with commercial catch per unit effort index of abundance in 2018 at its highest on record in South Africa (DEFF, 2020), a pattern inconsistent with the decrease documented in our BRUVS in the post-loss period. A comprehensive study of fisheries data from False Bay, reported no clear temporal trends in relative abundance for sevengills or pyjama catsharks between 1897 and 2011, whereas significant increases were found for smoothhounds (Best et al., 2013). Although these time series precede our study, those reported long-term trends differ considerably in magnitude and direction from the changes between periods found for these species in the present study. That said, for smoothhound sharks, fisheries data suggest a regional population decline (da Silva et al., 2019). So, local declines due to increased predation are likely exacerbated by regional population declines from overfishing.
While False Bay has experienced significant coastal development over the past 30 years with associated increases in pollution that has likely had lethal and sublethal impacts on varying species (Pfaff et al., 2019), this is unlikely to have caused the observed inverse patterns in relative abundance and frequency at successively lower trophic levels. Since the 1980s, False Bay has also experienced increased upwelling and cooling, which has led to nutrient enrichment of the bay and subsequent increases in kelp, rock lobsters, seabirds, pelagic fish, and several invasive species (Pfaff et al., 2019). While these changes have likely had bottom-up ecosystem impacts in False Bay, these impacts predate our study by several decades and would likely have already largely stabilized prior to the study period.
Temperature is a major driver of fish behavior and could contribute in some way to changes in the relative abundance of the observed species. However, changes in temperature between the periods would not be expected to drive the observed inverse patterns in relative abundance of predators and prey at successively lower trophic levels. While study results are most parsimoniously explained by the loss of white sharks from False Bay, a major limitation of this study is that for species evaluated using BRUVS, we only have two sampling periods, and cannot account for potential changes in detection probabilities. While confidence in our results was strengthened by incorporating multiple datasets for some species (e.g. sevengill sharks), the availability of other fisheries-dependent or independent data that would corroborate patterns for other species (e.g. horse mackerel) are currently unavailable. Accordingly, future work would benefit from additional sampling over time.
Summary
The decline in white sharks that occurred in False Bay within a long-term monitoring program has provided an unparalleled opportunity to gain preliminary insights into ecological changes in the wild due to the loss of a marine apex predator. The documented changes in relative abundance patterns between periods matched with expectations of a trophic cascade caused by the loss of top-down predation from white sharks. This has included increases in species that were historically important prey of white sharks and in turn, decreases in abundances of their prey. Future work at this site would benefit from understanding if and how community structure and function may have been altered and the extent to which they will continue to change through time. While impacts of apex predator declines are difficult to detect in the wild, especially in marine environments, they are likely more widespread than recognized given the pace and extent of apex predator declines globally.
Data availability statement
The raw data supporting the conclusions of this article will be made available by the authors, without undue reservation.
Ethics statement
The animal study was approved by University of Miami Institutional Care and Animal Use Committee. The study was conducted in accordance with the local legislation and institutional requirements.
Author contributions
NH: Conceptualization, Data curation, Formal analysis, Funding acquisition, Investigation, Methodology, Project administration, Resources, Supervision, Visualization, Writing – original draft, Writing – review & editing. YH: Data curation, Formal analysis, Investigation, Writing – review & editing. CF: Data curation, Investigation, Methodology, Project administration, Resources, Supervision, Writing – review & editing. TC: Formal analysis, Supervision, Writing – review & editing.
Funding
The author(s) declare financial support was received for the research, authorship, and/or publication of this article. Funding for this project was provided in part by the Isermann Family Foundation.
Acknowledgments
We are thankful to Lauren De Vos who supported this project with historical BRUVS data, equipment, and her comments that improved the manuscript. Thanks to Anthony Bernard and Colin Attwood who provided technical support associated with baited remote underwater sampling. We are thankful to the staff and crew of Apex Shark Expeditions, notably Ryan Miller, Lunga Makunga, Bongani Makati, Talishia Langenhoven, and Karyn Cooper, who helped with data collection. We would also like to thank the reviewers of our manuscript, whose comments helped strengthen the paper. Special thanks to Kelly Quinn of Canvas of the Wild for her beautiful illustrations and artwork. Funding for this research was provided in part by the Isermann Family Foundation. This work was conducted under permits from the Table Mountain Nature Reserve and South African Department of Forestry Fisheries and Environment.
Conflict of interest
The authors declare that the research was conducted in the absence of any commercial or financial relationships that could be construed as a potential conflict of interest.
Generative AI statement
The author(s) declare that no Generative AI was used in the creation of this manuscript.
Publisher’s note
All claims expressed in this article are solely those of the authors and do not necessarily represent those of their affiliated organizations, or those of the publisher, the editors and the reviewers. Any product that may be evaluated in this article, or claim that may be made by its manufacturer, is not guaranteed or endorsed by the publisher.
Supplementary material
The Supplementary Material for this article can be found online at: https://www.frontiersin.org/articles/10.3389/fmars.2025.1530362/full#supplementary-material
References
Albano P. S., Fallows C., Fallows M., Schuitema O., Bernard A. T., Sedgwick O., et al. (2021). Successful parks for sharks: No-take marine reserve provides conservation benefits to endemic and threatened sharks off South Africa. Biol. Conserv. 261, 109302. doi: 10.1016/j.biocon.2021.109302
Barley S. C., Meekan M. G., Meeuwig J. J. (2017a). Diet and condition of mesopredators on coral reefs in relation to shark abundance. PloS One 12, e0165113. doi: 10.1371/journal.pone.0165113
Barley S. C., Meekan M. G., Meeuwig J. J. (2017b). Species diversity, abundance, biomass, size, and trophic structure of fish on coral reefs in relation to shark abundance. Mar. Ecol. Prog. Ser. 565, 163–179. doi: 10.3354/meps11981
Bernard A. T. F., Götz A. (2012). Bait increases the precision in count data from remote underwater video for most subtidal reef fish in the warm-temperate Agulhas bioregion. Mar. Ecol. Prog. Ser. 471, 235–252. doi: 10.3354/meps10039
Best L. N., Attwood C. G., da Silva C., Lamberth S. J. (2013). Chondrichthyan occurrence and abundance trends in False Bay, South Africa, spanning a century of catch and survey records. Afr. Zoology 48, 201–227. doi: 10.1080/15627020.2013.11407587
Borer E. T., Seabloom E. W., Shurin J. B., Anderson K. E., Blanchette C. A., Broitman B., et al. (2005). What determines the strength of a trophic cascade? Ecology 86, 528–537. doi: 10.1890/03-0816
Bowlby H.D., Hammerschlag N., Irion D.T., Gennari E. (2022). How continuing mortality affects recovery potential for prohibited sharks: The case of white sharks in South Africa. Frontiers in Conservation Science 3, 988693. https://www.frontiersin.org/journals/conservation-science/articles/10.3389/fcosc.2022.988693/full.
Brooks M. E., Kristensen K., Van Benthem K. J., Magnusson A., Berg C. W., Nielsen A., et al. (2017). glmmTMB balances speed and flexibility among packages for zero-inflated generalized linear mixed modeling. R J. 9, 378–400. doi: 10.32614/RJ-2017-066
Cappo M., Harvey E., Malcolm H., Speare P., Beumer J. P., Grant A., et al. (2003). “Aquatic Protected Areas-what works best and how do we know?,” in Proceedings of the world congress on protected areas, cairns, Australia, august 2002, 455–464. (Cairns, Australia: Australian Society of Fish Biology).
Cappo M., Speare P., Wassenberg T., Harvey E., Rees M., Heyward A., et al. (2001). “The use of baited remote underwater video stations (BRUVS) to survey demersal fish stocks-how deep and meaningful,” in Video sensing of the size and abundance of target and non-target fauna in Australian fisheries: a national workshop (Fisheries Research Development Corporation, Canberra, Australia), 63–71.
Cortes E. (1999). Standardized diet compositions and trophic levels of sharks. ICES J. Mar. Sci. 56, 707–717. doi: 10.1006/jmsc.1999.0489
Creel S., Winnie J. A. (2005). Responses of elk herd size to fine-scale spatial and temporal variation in the risk of predation by wolves. Anim. Behav. 69, 1181–1189. doi: 10.1016/j.anbehav.2004.07.022
Croll D. A., Maron J. L., Estes J. A., Danner E. M., Byrd G. V. (2005). Introduced predators transform subarctic islands from grassland to tundra. Science 307, 1959–1961. doi: 10.1126/science.1108485
da Silva C., Winker H., Parker D., Kerwath S. (2019). “Assessment of smoothhound shark Mustelus mustelus in South Africa,” in Report no.: DEFF/FISHERIES/LSWG/AUG 2019, 1–29. (Cape Town, South Africa: Department of Environment, Forestry and Fisheries).
David J. H. M. (1987). Diet of the South African fur sea (1974-1985) and an assessment of competition with fisheries in southern Africa. South Afr. J. Mar. Sci. 5, 693–713. doi: 10.2989/025776187784522568
Dedman S., Moxley J. H., Papastamatiou Y. P., Braccini M., Caselle J. E., Chapman D. D., et al. (2024). Ecological roles and importance of sharks in the Anthropocene Ocean. Science 385, adl2362. doi: 10.1126/science.adl2362
DEFF (Department of Environment, Forestry and Fisheries) (2020). Status of the South African marine fishery resources 2020 (Cape Town, South Africa: DEFF).
Desbiens A. A., Roff G., Robbins W. D., Taylor B. M., Castro-Sanguino C., Dempsey A., et al. (2021). Revisiting the paradigm of shark-driven trophic cascades in coral reef ecosystems. Ecology 102, e03303. doi: 10.1002/ecy.v102.4
De Vos L. (2021). Biodiversity patterns in False Bay: an assessment using underwater cameras (Cape Town, South Africa: Faculty of Science, Department of Biological Sciences). Available at: http://hdl.handle.net/11427/33695 (Accessed January 5, 2025).
De Vos A., Justin O’Riain M., Meyer M. A., Kotze P. G., Kock A. A. (2015c). Behavior of Cape fur seals (Arctocephalus pusillus pusillus) in relation to temporal variation in predation risk by white sharks (Carcharodon carcharias) around a seal rookery in False Bay, South Africa. Mar. Mammal Sci. 31, 1118–1131. doi: 10.1111/mms.12208
De Vos A., Justin O’Riain M., Meÿyer M. A., Kotze P. G. H., Kock A. A. (2015b). Behavior of Cape fur seals (Arctocephalus pusillus pusillus) in response to spatial variation in white shark (Carcharodon carcharias) predation risk. Mar. Mammal Sci. 31, 1234–1251. doi: 10.1111/mms.12215
De Vos L., Watson R. G. A., Götz A., Attwood C. G. (2015a). Baited remote underwater video system (BRUVs) survey of chondrichthyan diversity in False Bay, South Africa. Afr. J. Mar. Sci. 37, 209–218. doi: 10.2989/1814232X.2015.1036119
Ebert D. A. (1991). Diet of the sevengill shark N. cepedianus in the temperate coastal waters of Southern Africa. South Afr. J. Mar. Sci. 11, 565–572. doi: 10.2989/025776191784287547
Estes J. A., Terborgh J., Brashares J. S., Power M. E., Berger J., Bond W. J., et al. (2011). Trophic downgrading of planet Earth. Science 333, 301–306. doi: 10.1126/science.1205106
Fallows C., Martin R. A., Hammerschlag N. (2012). “Comparisons between white shark-pinniped interactions at Seal Island (South Africa) with other sites in California,” in Global perspectives on the biology and life history of the white shark. Ed. Domeier M. L. (Boca Raton, Florida: CRC Press), 105–117.
Ferretti F., Worm B., Britten G. L., Heithaus M. R., Lotze H. K. (2010). Patterns and ecosystem consequences of shark declines in the ocean. Ecol. Lett. 13, 1055–1071. doi: 10.1111/j.1461-0248.2010.01489.x
Global Biodiversity Information Facility (GBIF). GBIF occurrence download.10.15468/dl.bb5edh (Accessed September 19, 2023).
Gennari E., Hammerschlag N., Andreotti S., Fallows C., Fallows M., Braccini M. (2024). Uncertainty remains for white sharks in South Africa, as population stability and redistribution cannot be concluded by Bowlby et al, 2013): “Decline or shifting distribution? A first regional trend assessment for white sharks (Carcharodon carcharias) in South Africa. Ecol. Indic. 160, 111810. doi: 10.1016/j.ecolind.2024.111810
Hammerschlag N. (2019). Quantifying shark predation effects on prey: dietary data limitations and study approaches. Endangered Species Res. 38, 147–151. doi: 10.3354/esr00950
Hammerschlag N., Barley S. C., Irschick D. J., Meeuwig J. J., Nelson E. R., Meekan M. G. (2018). Predator declines and morphological changes in prey: evidence from coral reefs depleted of sharks. Mar. Ecol. Prog. Ser. 586, 127–139. doi: 10.3354/meps12426
Hammerschlag N., Fallows C., Meÿyer M., Seakamela S. M., Orndorff S., Kirkman S., et al. (2022). Loss of an apex predator in the wild induces physiological and behavioural changes in prey. Biol. Lett. 18, 20210476. doi: 10.1098/rsbl.2021.0476
Hammerschlag N., Martin R. A., Fallows C. (2006). Effects of environmental conditions on predator-prey interactions between white sharks (Carcharodon carcharias) and Cape fur seals (Arctocephalus pusillus pusillus) at Seal Island, South Africa. Environ. Biol. Fishes 76, 341–350. doi: 10.1007/s10641-006-9038-z
Hammerschlag N., Williams L., Fallows M., Fallows C. (2019). Disappearance of white sharks leads to the novel emergence of an allopatric apex predator, the sevengill shark. Sci. Rep. 9, 1908. doi: 10.1038/s41598-018-37576-6
Huisamen J., Kirkman S. P., van der Lingen C. D., Watson L. H., Cockcroft V. G., Jewell R., et al. (2012). Diet of the Cape fur seal Arctocephalus pusillus pusillus at the Robberg Peninsula, Plettenberg Bay, and implications for local fisheries. Afr. J. Mar. Sci. 34 (3), 431–441. doi: 10.2989/1814232X.2012.725524
Jorgensen S. J., Micheli F., White T. D., Van Houtan K. S., Alfaro-Shigueto J., Andrzejaczek S., et al. (2022). Emergent research and priorities for shark and ray conservation. Endangered Species Res. 47, 171–203. doi: 10.3354/esr01169
Kock A., O’Riain M. J., Mauff K., Meÿyer M., Kotze D., Griffiths C. (2013). Residency, habitat use and sexual segregation of white sharks, Carcharodon carcharias in False Bay, South Africa. PloS One 8, e55048. doi: 10.1371/journal.pone.0055048
Leach G. J., Taylor M. H. (1977). Seasonal measurements of serum glucose and serum cortisol in a natural population of Fundulus heteroclitus L. Comp. Biochem. Physiol. Part A: Physiol. 56, 217–223. doi: 10.1016/0300-9629(77)90188-8
Martin R. A., Hammerschlag N., Collier R. S., Fallows C. (2005). Predatory behaviour of white sharks (Carcharodon carcharias) at Seal Island, South Africa. J. Mar. Biol. Assoc. United Kingdom 85, 1121–1136. doi: 10.1017/S002531540501218X
Myers R. A., Baum J. K., Shepherd T. D., Powers S. P., Peterson C. H. (2007). Cascading effects of the loss of apex predatory sharks from a coastal ocean. Science 315, 1846–1850. doi: 10.1126/science.1138657
Nordberg E. J., Schwarzkopf L. (2019). Predation risk is a function of alternative prey availability rather than predator abundance in a tropical savanna woodland ecosystem. Sci. Rep. 9, 7718. doi: 10.1038/s41598-019-44159-6
Pfaff M. C., Logston R. C., Raemaekers S. J., Hermes J. C., Blamey L. K., Cawthra H. C., et al. (2019). A synthesis of three decades of socio-ecological change in False Bay, South Africa: setting the scene for multidisciplinary research and management. Elementa: Sci. Anthropocene 7, 32. doi: 10.1525/elementa.367
Rasher D. B., Hoey A. S., Hay M. E. (2017). Cascading predator effects in a Fijian coral reef ecosystem. Sci. Rep. 7, 15684. doi: 10.1038/s41598-017-15679-w
R Core Team. (2024). R: A language and environment for statistical computing (Vienna, Austria: R Foundation for Statistical Computing). Available at: https://www.R-project.org/ (Accessed November 1, 2024).
Ripple W. J., Beschta R. L. (2004). Wolves and the ecology of fear: can predation risk structure ecosystems? BioScience 54, 755–766. doi: 10.1641/0006-3568(2004)054[0755:WATEOF]2.0.CO;2
Ripple W. J., Estes J. A., Beschta R. L., Wilmers C. C., Ritchie E. G., Hebblewhite M., et al. (2014). Status and ecological effects of the world’s largest carnivores. Science 343, 1241484. doi: 10.1126/science.1241484
Ripple W. J., Larsen E. J., Renkin R. A., Smith D. W. (2001). Trophic cascades among wolves, elk and aspen on Yellowstone National Park’s northern range. Biol. Conserv. 102, 227–234. doi: 10.1016/S0006-3207(01)00107-0
Roberson L., Winker H., Attwood C., De Vos L., Sanguinetti C., Götz A. (2015). First survey of fishes in the Betty’s Bay Marine Protected Area along South Africa’s temperate south-west coast. Afr. J. Mar. Sci. 37, 543–556. doi: 10.2989/1814232X.2015.1110045
Ruppert J. L., Travers M. J., Smith L. L., Fortin M. J., Meekan M. G. (2013). Caught in the middle: combined impacts of shark removal and coral loss on the fish communities of coral reefs. PloS One 8, e74648. doi: 10.1371/journal.pone.0074648
Sandesara M., Bodkhe U., Tanwar S., Alshehri M.D., Sharma R., Neagu B.C., et al. (2022). Design and experience of mobile applications: a pilot survey. Mathematics 10 (14), 2380.
Sandin S. A., French B. J., Zgliczynski B. J. (2022). Emerging insights on effects of sharks and other top predators on coral reefs. Emerging topics Life Sci. 6, 57–65. doi: 10.1042/ETLS20210238
Santana-Garcon J., Braccini M., Langlois T. J., Newman S. J., McAuley R. B., Harvey E. S. (2014). Calibration of pelagic stereo-BRUVs and scientific longline surveys for sampling sharks. Methods Ecol. Evol. 5, 824–833. doi: 10.1111/2041-210X.12216
Shurin J. B., Borer E. T., Seabloom E. W., Anderson K., Blanchette C. A., Broitman B., et al. (2002). A cross-ecosystem comparison of the strength of trophic cascades. Ecol. Lett. 5, 785–791. doi: 10.1046/j.1461-0248.2002.00381.x
Skubel R. A., Kirtman B. P., Fallows C., Hammerschlag N. (2018). Patterns of long-term climate variability and predation rates by a marine apex predator, the white shark Carcharodon carcharias. Mar. Ecol. Prog. Ser. 587, 129–139. doi: 10.3354/meps12424
Telenius A. (2011). Biodiversity information goes public: GBIF at your service. Nordic J. Bot. 29, 378–381. doi: 10.1111/j.1756-1051.2011.01167.x
Towner A. V., Watson R. G. A., Kock A. A., Papastamatiou Y., Sturup M., Gennari E., et al. (2022). Fear at the top: killer whale predation drives white shark absence at South Africa’s largest aggregation site. Afr. J. Mar. Sci. 44, 139–152. doi: 10.2989/1814232X.2022.2066723
Vettorazzi M., Mogensen N., Kaelo B., Broekhuis F. (2022). Understanding the effects of seasonal variation in prey availability on prey switching by large carnivores. J. Zoology 318, 218–227. doi: 10.1111/jzo.13013
Werner E. E., Gilliam J. F., Hall D. J., Mittelbach G. G. (1983). ). An experimental test of the effects of predation risk on habitat use in fish. Ecology 64, 1540–1548. doi: 10.2307/1937508
Keywords: predation, ecosystem function, predation risk, trophic downgrading, sharks
Citation: Hammerschlag N, Herskowitz Y, Fallows C and Couto TBA (2025) Evidence of cascading ecosystem effects following the loss of white sharks from False Bay, South Africa. Front. Mar. Sci. 12:1530362. doi: 10.3389/fmars.2025.1530362
Received: 18 November 2024; Accepted: 04 February 2025;
Published: 25 March 2025.
Edited by:
Brendan Shea, Beneath the Waves, Inc., United StatesReviewed by:
Yannis Peter Papastamatiou, Florida International University, United StatesSimon Dedman, Florida International University, United States
Copyright © 2025 Hammerschlag, Herskowitz, Fallows and Couto. This is an open-access article distributed under the terms of the Creative Commons Attribution License (CC BY). The use, distribution or reproduction in other forums is permitted, provided the original author(s) and the copyright owner(s) are credited and that the original publication in this journal is cited, in accordance with accepted academic practice. No use, distribution or reproduction is permitted which does not comply with these terms.
*Correspondence: Neil Hammerschlag, bmVpbGhhbW1lcnNjaGxhZ0BnbWFpbC5jb20=
†Present address: Neil Hammerschlag, Shark Research Foundation Inc, Boutiliers Point, Nova Scotia, Canada