- 1School of Electronic Engineering, Jiangsu Ocean University, Lianyungang, China
- 2Jiangsu Institute of Marine Resources Development, Jiangsu Ocean University, Lianyungang, China
- 3The State Key Laboratory of Marine Environmental Science, College of Ocean and Earth Sciences, Xiamen University, Xiamen, China
- 4Lianyungang Sea area use protection dynamic management center, Lianyungang, China
- 5School of Marine Technology and Geomatics, Jiangsu Ocean University, Lianyungang, China
- 6Marine College, Shandong University, Weihai, China
- 7Istituto di Scienze Marine del Consiglio Nazionale delle Ricerche (CNR-ISMAR), Venezia, Italy
- 8Department of Civil, Building and Environmental Engineering, Sapienza Università di Roma, Rome, Italy
The ecological impacts of expanding nearshore aquaculture demand accurate monitoring and a mechanistic understanding of underlying drivers. This study employed Landsat remote sensing images spanning 2000 to 2023 and a U-Net deep learning model to extract spatiotemporal patterns of laver aquaculture in Haizhou Bay, China, while also investigating the natural, technological, and socioeconomic factors influencing its growth. Key findings include: The U-Net model achieved an overall accuracy of approximately 98.9% and an F1 score of around 0.887, significantly outperforming traditional classification methods (MLE, SVM, NN) by effectively reducing spectral confusion. The aquaculture area followed a “growth-peak-decline” pattern, peaking in 2018 at 10,872.45 hm², with a strong correlation to local government data. Among natural factors, only the 2-meter temperature showed a significant positive correlation with aquaculture expansion, while other factors like sea surface temperature and wind speed had minimal impact, suggesting that the region’s environmental stability supports large-scale production. Technological advancements, such as deep-sea farming and shellfish-algae intercropping, contributed to industry growth, while policy changes after 2019 resulted in a reduction of aquaculture area. Economic and policy interactions played a central role in spatial restructuring, with GDP positively correlating with aquaculture expansion during the growth phase (2000-2018), but negatively decoupling during the policy adjustment phase (2019-2023). This research provides a comprehensive framework for the sustainable management of coastal aquaculture by integrating remote sensing data with an analysis of multiple driving forces.
1 Introduction
China’s coastal aquaculture industry, with its high stocking densities, plays a crucial role in the marine economy, economic development, and in meeting the public’s demand for high-quality seafood, especially fine protein (Cheng et al., 2022). However, along with its economic benefits, aquaculture development poses significant challenges to marine ecological environments, including water pollution and waste discharge, which threaten the stability of marine ecosystems (Boyd et al., 2020; Gao et al., 2022). Effective monitoring of marine aquaculture is crucial for protecting the marine ecological environment, encouraging sustainable resource utilization, and fostering green development initiatives.
In recent years, research on the spatiotemporal dynamics and influencing factors of coastal ecosystem aquaculture regions has received increasing attention (Chen et al., 2024; Ying et al., 2020). Although beneficial, traditional field survey techniques are frequently constrained by their labor intensiveness, length of time, and inefficiency, especially when used for large-scale monitoring projects (Hou et al., 2022). Consequently, remote sensing technology has emerged as an effective mean of offering extensive spatial coverage, shorter revisit cycles, and greater cost-effectiveness (Zhang et al., 2020a). Various remote sensing methods have been applied in marine aquaculture research, including visual interpretation, spectral characteristic-based, and object-oriented methods.
Earlier studies, such as those by Wu et al. (2006), utilized visual interpretation methods for mariculture areas analysis in Hainan Province, highlighting the simplicity of the approach but also its significant limitations, including time-consuming and poor generalizability (Pan et al., 2020). Using data from the Advanced Spaceborne Thermal Emission and Reflection Radiometer (ASTER), Ma et al. (2010) identified the marine region adjacent to Yantai City in Shandong Province as the research area. Drawing on these spectral properties, they developed a water body index and spectral band operation algorithm that successfully mitigated the impact of deep-sea areas on the recognition of coastal aquaculture zones. This approach offers a novel perspective for accurately delineating the boundaries of the aquaculture areas. Lu et al. (2015) utilized Rapideye multispectral images to establish characteristic spectral indices for detecting nearshore aquaculture areas, resulting in the high-precision automated extraction of such areas. Spectral characteristic-based methods can be used to extract offshore aquaculture areas; however, these methods have low accuracy and data redundancy (Hu et al., 2022; Zhu et al., 2019). Nguyen et al. (2013) combined remote sensing imagery and geographic information systems to extract the aquaculture areas of Phu Quoc Island in Vietnam using an object-oriented approach. Xue et al. (2010) utilized an object-oriented approach to extract aquaculture areas and overcome the interference of “ salt-and-pepper noise,” thereby achieving a good classification effect. The object-oriented extraction method can reduce the impact of “salt and pepper noise” that is difficult to solve in traditional image extraction methods. However, in the extraction process, the subjectivity of the segmentation scale and “spectral similarity of foreign objects” of some pixels may lead to a decrease accuracy (Zheng et al., 2018).
In recent years, the field of deep learning has made significant advancements, offering new opportunities for remote sensing data interpretation. Deep learning models, such as U-Net, have proven particularly effective for the classification and semantic segmentation of remote sensing imagery by leveraging both spectral and textural features, reducing the need for manual intervention (Cui et al., 2019; Lu et al., 2021; Su et al., 2022a). U-Net’s architecture, known for its high accuracy and ability to handle complex spatial features, has become a preferred method in remote sensing applications, including aquaculture monitoring.
This study specifically focuses on the laver aquaculture areas in Haizhou Bay, Lianyungang City, utilizing Landsat remote sensing images from 2000 to 2023 to extract and analyze the spatiotemporal distribution of these areas. While previous studies have applied U-Net to aquaculture monitoring, this research introduces several key innovations. First, it evaluates U-Net’s performance across long-term remote sensing images with different spatial resolutions (Landsat, GF-1, Sentinel-2), which has not been extensively explored in the context of aquaculture monitoring. Additionally, this study investigates the driving forces behind the expansion of laver aquaculture areas, incorporating natural environmental conditions, technological advancements, and economic-social-policy. By doing so, it not only contributes to more accurate remote sensing-based monitoring of aquaculture areas but also provides insights into the sustainable management of laver aquaculture in Haizhou Bay, with implications for the broader marine environment.
2 Materials and methods
2.1 Study area
The study area, situated with in Haizhou Bay at the convergence of Jiangsu and Shandong provinces, spanning between 119°10′ E and 119°40′ E longitude and 34°30′ N to 35°10′ N latitude, represents a vast bay adjoining the Yellow Sea (Sun et al., 2020), as shown in Figure 1. Extending approximately 42 km in width with a coastline stretching over 87 km, the Haizhou Bay covers an expansive area of 876 km2 (Su et al., 2020). Nestled within a transitional climate zone from warm temperate to northern subtropical, it enjoys a coastal and shallow marine environment characterized by regular semidiurnal tides (Wang et al., 2021). The average annual temperature is approximately 14.3°C, with annual precipitation exceeding 920 mm (Wang et al., 2017). These favorable natural conditions provide an ideal growth environment for laver aquaculture in Haizhou Bay and are key factors driving the thriving development of the laver industry in this area (Ai et al., 2023).
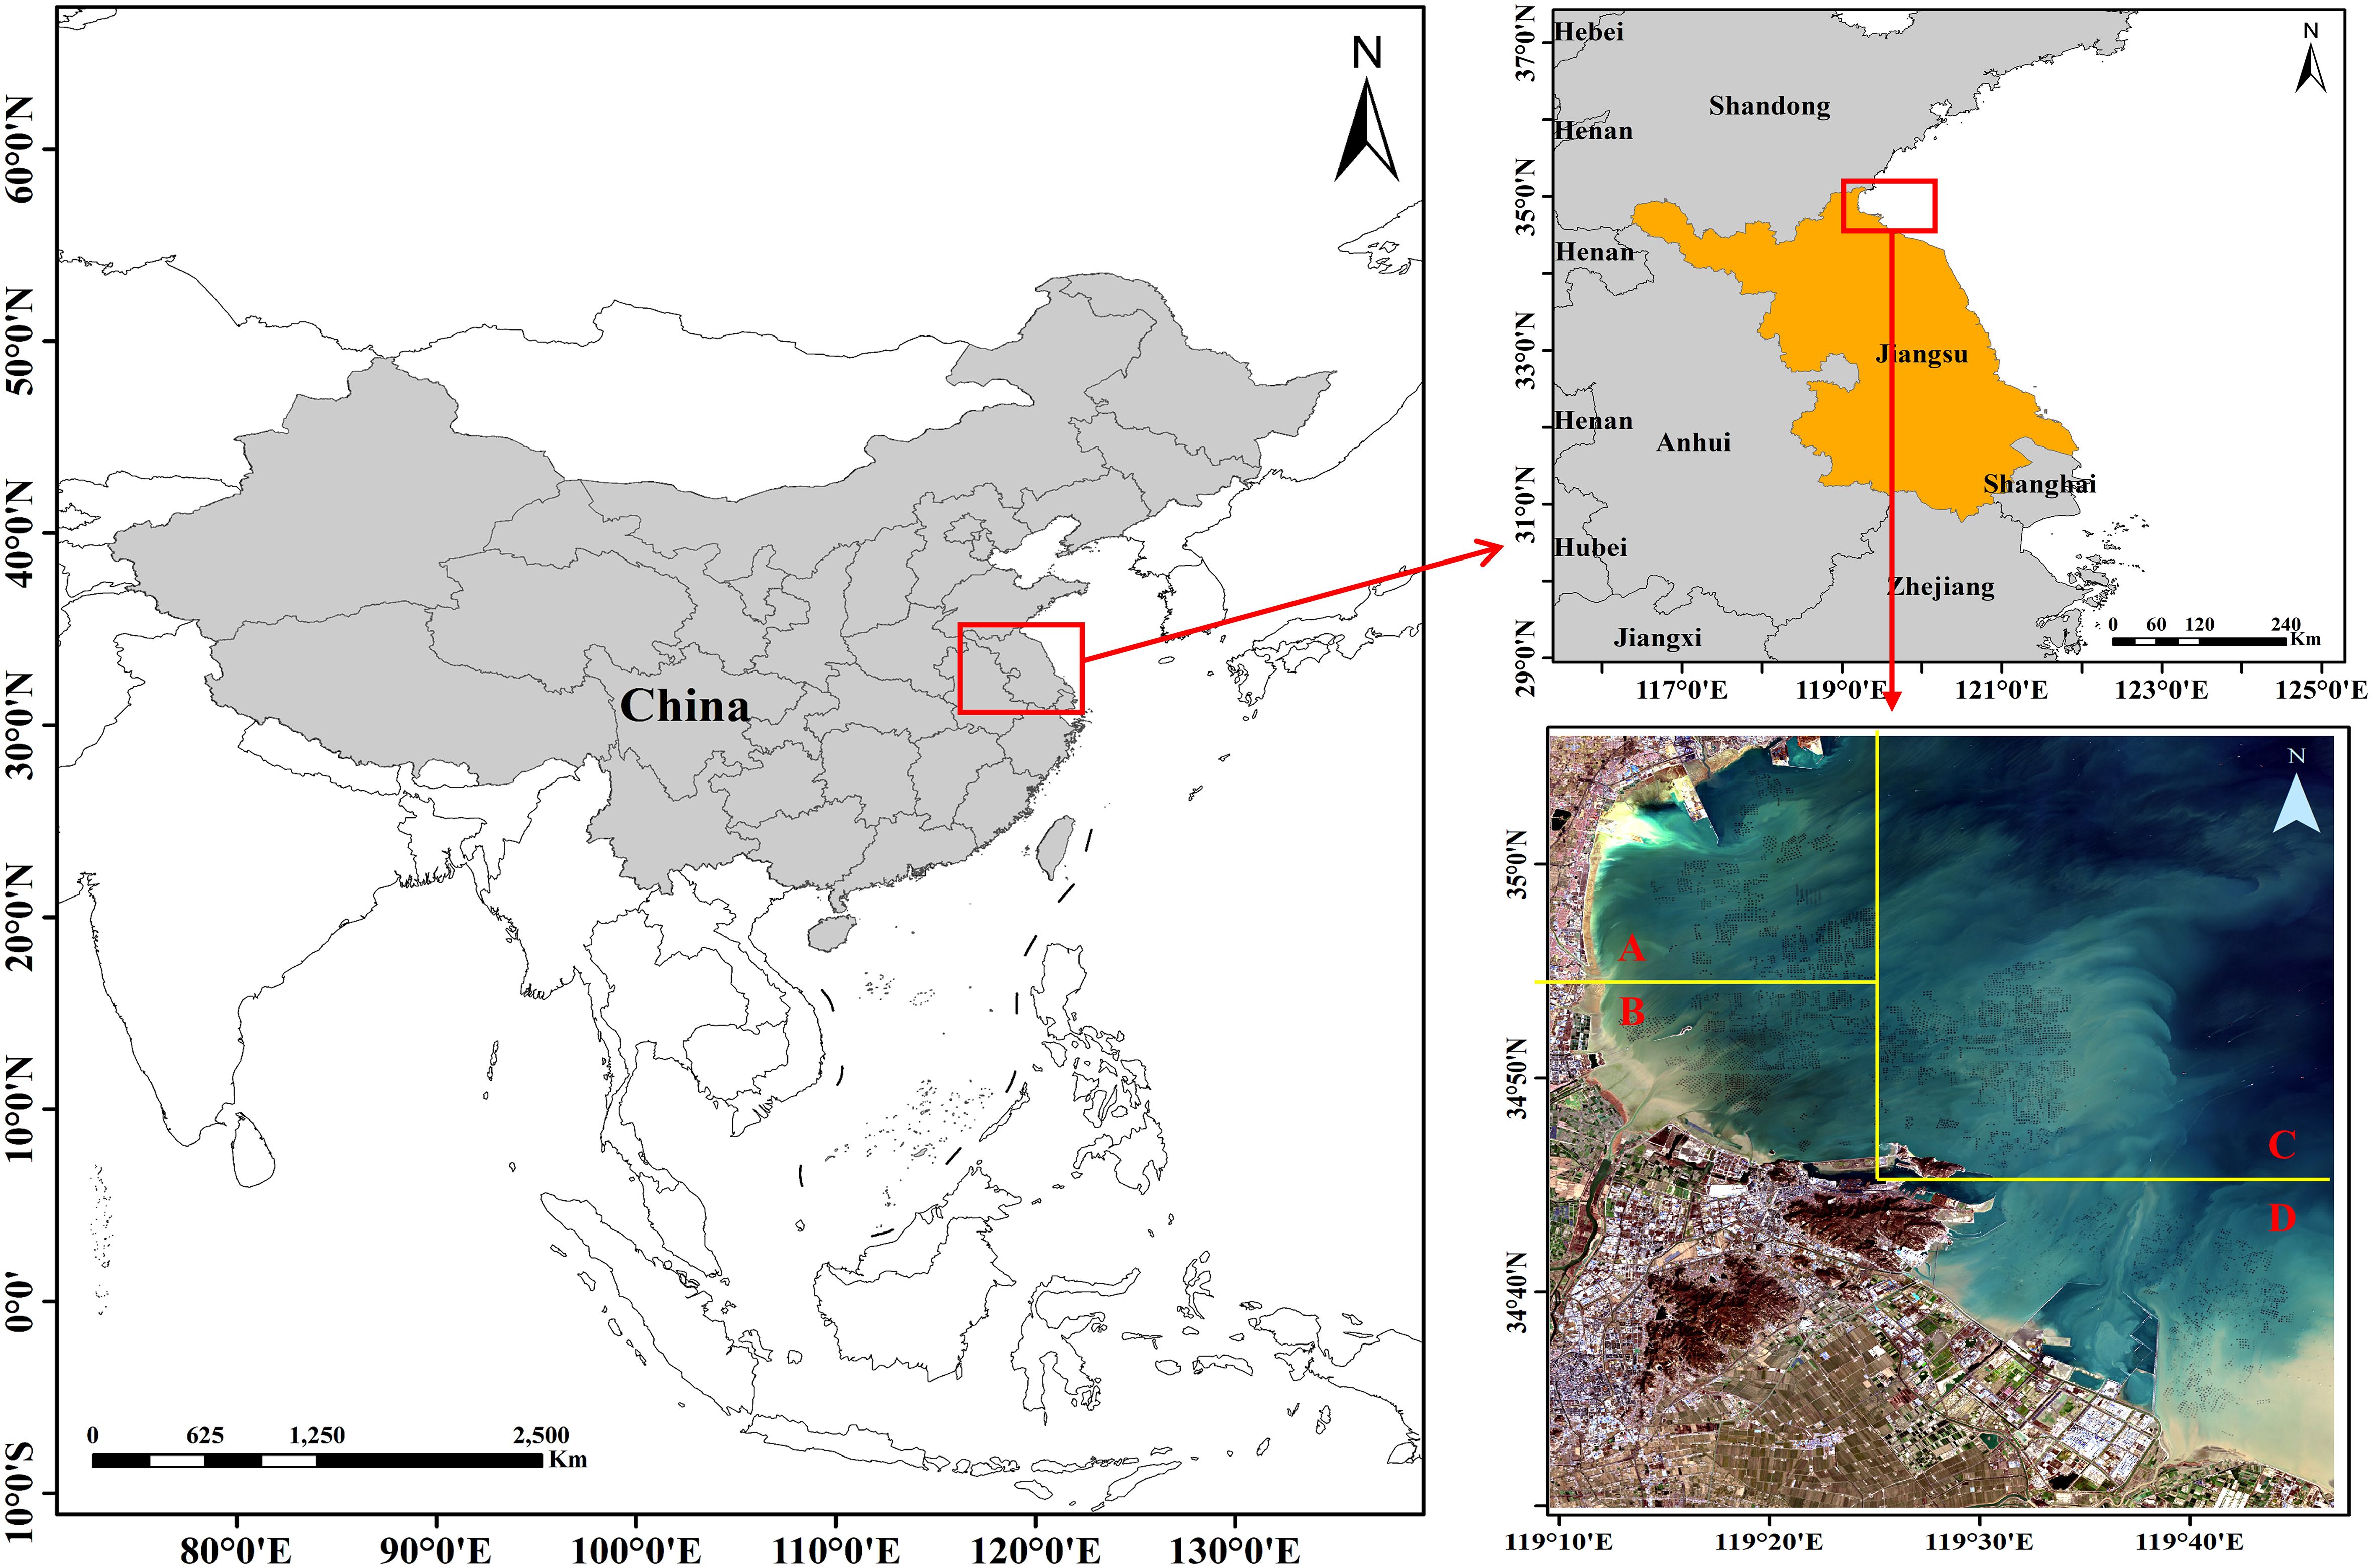
Figure 1. Marine aquaculture area of Haizhou Bay in Jiangsu province, China. (Four interest zones are labeled as (A–D), respectively.).
2.2 Data source and preprocessing
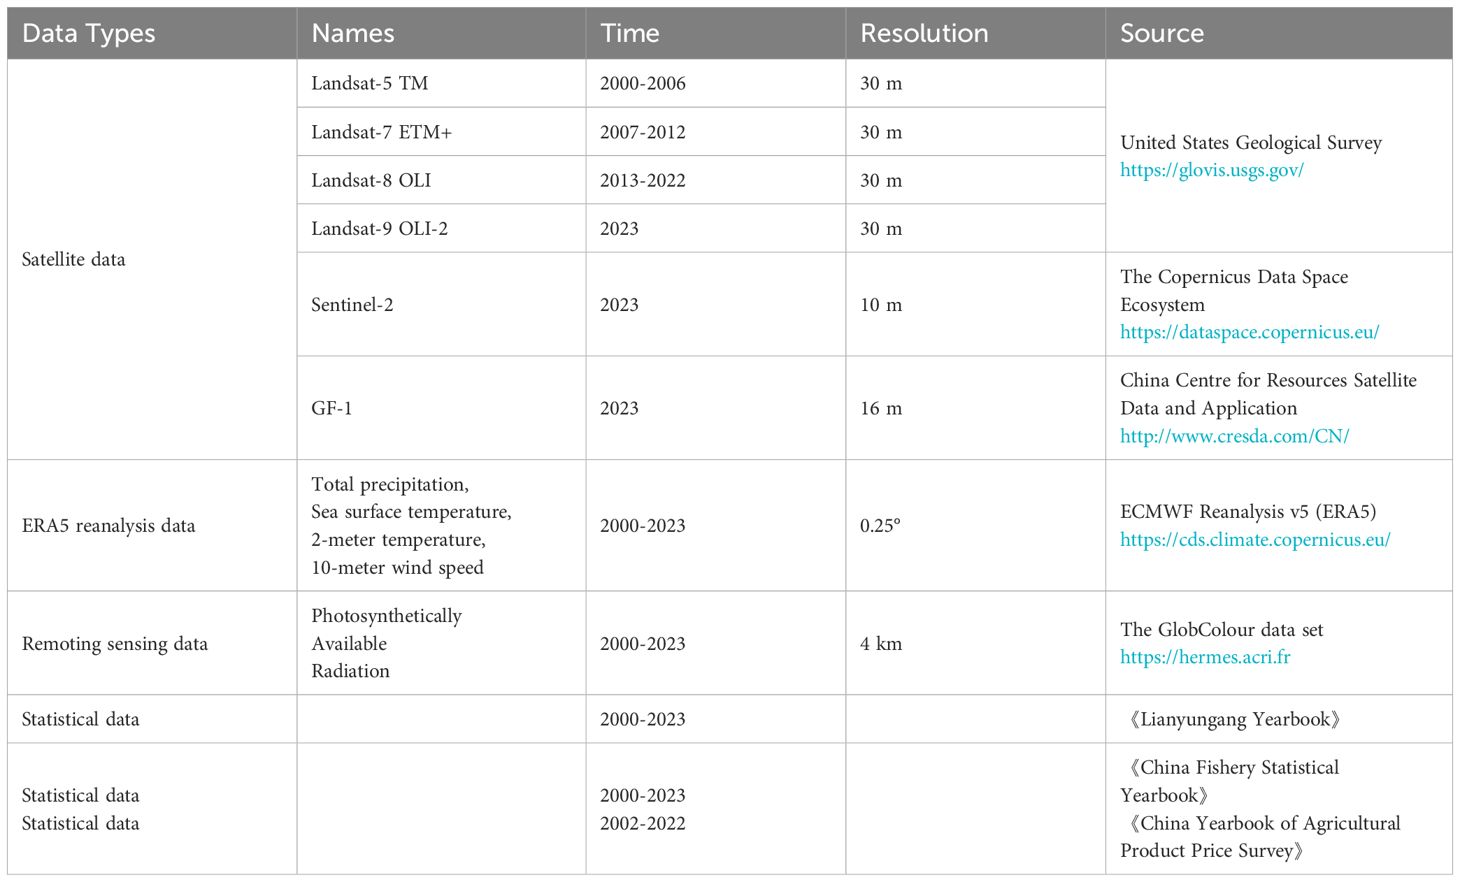
The data employed in this study comprised multispectral remote sensing imagery from Landsat-5 TM, Landsat-7 ETM+, Landsat-8 OLI, and Landsat-9 OLI-2, sourced from the United States Geological Survey (USGS). Additionally, information from Sentinel-2, retrieved from the Copernicus Data Space Ecosystem, and GF-2, supplied by the China Centre for Resources Satellite Data and Application, were employed. These datasets were complemented by the ECMWF Reanalysis v5 (ERA5) analysis, which included total precipitation, sea surface temperature, 2-m temperature, and wind speed. Photosynthetically Available Radiation (PAR) data were obtained from the GlobColor dataset. Furthermore, area data for laver aquaculture in Jiangsu Province were sourced from the China Fishery Statistical Yearbook, and for aquaculture in Haizhou Bay from the Lianyungang Yearbook. The Producer Price Indices were retrieved from the China Yearbook of Agricultural Product Price Survey. All data were acquired through website downloads or literature references, as listed in Table 1.
In Haizhou Bay, aquaculture primarily employs raft culture, with laver being the main crop. The period of vigorous laver growth is from November each year to March of the following year (Cui et al., 2023). During this period, laver aquaculture areas were distinctly visible in remote sensing imagery. Therefore, Landsat images from the Haizhou Bay were selected for each year between 2000 and 2023, one image per year, from strip number 120, row number 36, and cloud cover of less than 10%. Additionally, the downloaded Sentinel-2 and GF-1 images for this region had less than 10% cloud cover and were captured on the same day as the 2023 Landsat images.
It was essential to preprocess the remote sensing images appropriately before starting the experiment. The quality, accuracy, and utility of images may be greatly enhanced by a sequence of processing and corrections, thus offering a trustworthy database for subsequent research (Bunting, 2017). The 26 images, including Landsat, Sentinel-2, and GF-1, were initially processed using the remote sensing image processing software ENVI 5.7 for radiometric calibration and FLAASH atmospheric correction to mitigate various distortions in the radiometric brightness of the image data. For Landsat-7 ETM+ images, band gap filling was required before radiometric calibration, and for GF-1 images, orthorectification was required after FLAASH atmospheric correction. Subsequently, the images were cropped to cover the experimental area and satisfy the experimental requirements. Finally, image normalization was performed to ensure that the preprocessed data were confined within a certain range, thereby eliminating the adverse effects caused by outlier data.
2.3 Methodology
This study utilized the U-Net model as an extraction tool to identify the laver aquaculture area in Haizhou Bay. Initially, samples from the laver aquaculture area were selected based on visual interpretation of high-resolution remote sensing images and field survey data to form a sample dataset. Subsequently, the U-Net model, integrated into the deep learning module, was employed to train and classify the interpretation model for the seawater aquaculture area. Finally, post-processing tasks were conducted on the classified data, encompassing accuracy verification and data format conversion, to derive recognition results for the seawater aquaculture area. These results were then compared horizontally with the supervised classification outcomes.
2.3.1 U-net
In recent years, the field of image segmentation has witnessed the emergence of numerous advanced convolutional neural network (CNN) models. However, several of these models suffer from drawbacks, such as slow execution speed, redundancy in information, and limitations in positional information (Cui et al., 2019; Chen et al., 2024). In contrast, the U-Net architecture has garnered widespread adoption because of its superior accuracy and low parameter count (Qin et al., 2021). Introduced by Ronneberger et al. (2015), the U-Net model, characterized by its U’-shaped structure (Hou et al., 2021), features a symmetrical network comprising a left-sided encoder, right-sided decoder, and intermediary skip connections (Su et al., 2022b).
The left-side encoder is composed of convolutional layers, followed by activation functions and downsampling operations. Specifically, the encoder employs two 3 × 3 convolutions, followed by ReLU activation and max-pooling operations with a stride of two. Following each downsampling step, the size of the output feature maps is halved while doubling the number of feature channels. Through a series of four convolutions and pooling, five preliminary effective feature layers are obtained. Conversely, the right-side decoder involves upsampling and 2 × 2 transposed convolutions to double the size of the output feature maps while halving the number of feature channels. The decoded feature maps are then concatenated with the corresponding feature maps from the encoder via skip connections, followed by two convolutional operations. In addition, the 1 × 1 convolutional layer after the final convolutional layer produces feature maps with the same number of channels as the target classes, and then performs pixel by pixel classification through an activation function (Ibtehaz and Rahman, 2020; Liu et al., 2019; Zhang et al., 2020b).
The utilization of skip connections facilitates the transmission of the encoder feature information to the decoder. By integrating the features obtained by the decoder with the reconstructed images (Mulliqi et al., 2020), skip connections aid in recovering spatial information lost during pooling operations, thereby enhancing the precision of the model. Overall, the innovative design of the U-Net architecture, along with its effective integration of skip connections, has significantly contributed to its widespread adoption and exceptional performance in various image segmentation tasks.
2.3.2 Interpretation process
The recognition process of the U-Net model in this study relies on the Deep Learning Toolbox within geographic information system software. This model utilizes multiple layers in a neural network to detect features within images. The interpretation workflow can be divided into three stages: creating and importing sample datasets, training the deep-learning model, and classifying features using the deep-learning model.
First, sample datasets were created by selecting four images from Landsat remote sensing data corresponding to 2006, 2013, 2015, and 2017. These images were manually annotated for aquaculture areas based on the visual interpretation of results. Efforts have been made to magnify the remote sensing images during the annotation process of aquaculture areas to minimize unnecessary errors in labeling, thereby improving the accuracy of sample annotation. Aquaculture areas were labeled 1, whereas background and non-aquaculture areas were labeled 0. After annotation, the images and corresponding label images were sliced into 256 × 256 pixels, with a stride of 128 pixels. To augment the dataset and enhance the generalization capability of the model, the images and label images were horizontally and vertically flipped and rotated (90°, 180°, and 270°) during the slicing process, thereby achieving the purpose of data augmentation. Therefore, a training dataset was prepared for the model. Next, the training dataset was imported and the aquaculture area interpretation model was trained. Finally, a deep learning model was used for the interpretation. This involved running the trained aquaculture area interpretation model to generate raster classifications of aquaculture areas and producing aquaculture area classification patches.
2.3.3 Supervised classification
Supervised classification, also known as training classification, is a process in which users identify unknown classes of pixels by utilizing the pixels of the confirmed classes (Han et al., 2023). Prior to the classification, several sample areas with known classes were manually selected from the images. Different classifiers or algorithms have been chosen to classify other areas into different samples (Li et al., 2017). Supervised classification typically involves three steps: selecting training samples, extracting statistical information, and selecting the appropriate classification algorithms. In this study, we employed ENVI 5.7 software for the supervised classification of remote sensing imagery. We chose three classifiers: Maximum Likelihood Estimation (MLE), Support Vector Machine (SVM), and neural networks (NN).
2.4 Evaluation metrics
In this study, Landsat image pixels were used as the basic sampling units, with a total of approximately 4,220,000 pixels in the study area. To avoid potential sampling bias that could lead to distortion, we did not employ the more commonly used random sampling method (Olofsson et al., 2014). Instead, we utilized all pixels within the study area to construct the confusion matrix. Specifically, pixels belonging to the aquaculture area were treated as target points, while all other non-aquaculture pixels were treated as background points. This approach allowed for a comprehensive evaluation of the classification results across the entire image, ensuring robust and unbiased accuracy assessment.
The confusion matrix, also known as the error matrix, is a widely used standard for evaluating the accuracy of classification models (Zhang et al., 2021). It provides a structured, tabular representation of a model performance by categorizing predictions into four distinct groups based on their agreement with the true labels: true positives (TP), true negatives (TN), false positives (FP), and false negatives (FN). By leveraging the confusion matrix, various evaluation metrics can be computed to assess classification accuracy and effectiveness.
One of the key metrics derived from the confusion matrix is precision (P), which measures the proportion of correctly predicted positive samples out of all samples classified as positive. It is defined as follows (see Equation 1):
Another essential metric is recall (R), which quantifies the proportion of actual positive samples that have been correctly identified by the model. It is calculated as (see Equation 2):
In classification tasks, precision and recall often exhibit a trade-off: increasing one typically leads to a decrease in the other. To balance these two metrics, the score is introduced as their weighted harmonic mean, providing a single measure of a model’s overall effectiveness. A higher score indicates superior model performance, as it reflects both high precision and high recall. It is defined as (see Equation 3):
Additionally, Overall Accuracy (OA) is used to evaluate the model’s general performance. It represents the proportion of correctly classified samples across all categories and is calculated as follows (see Equation 4):
These metrics collectively offer a comprehensive assessment of a classification model’s performance, enabling a more detailed comparison between different methodologies.
3 Results
3.1 Experiments and accuracy evaluation
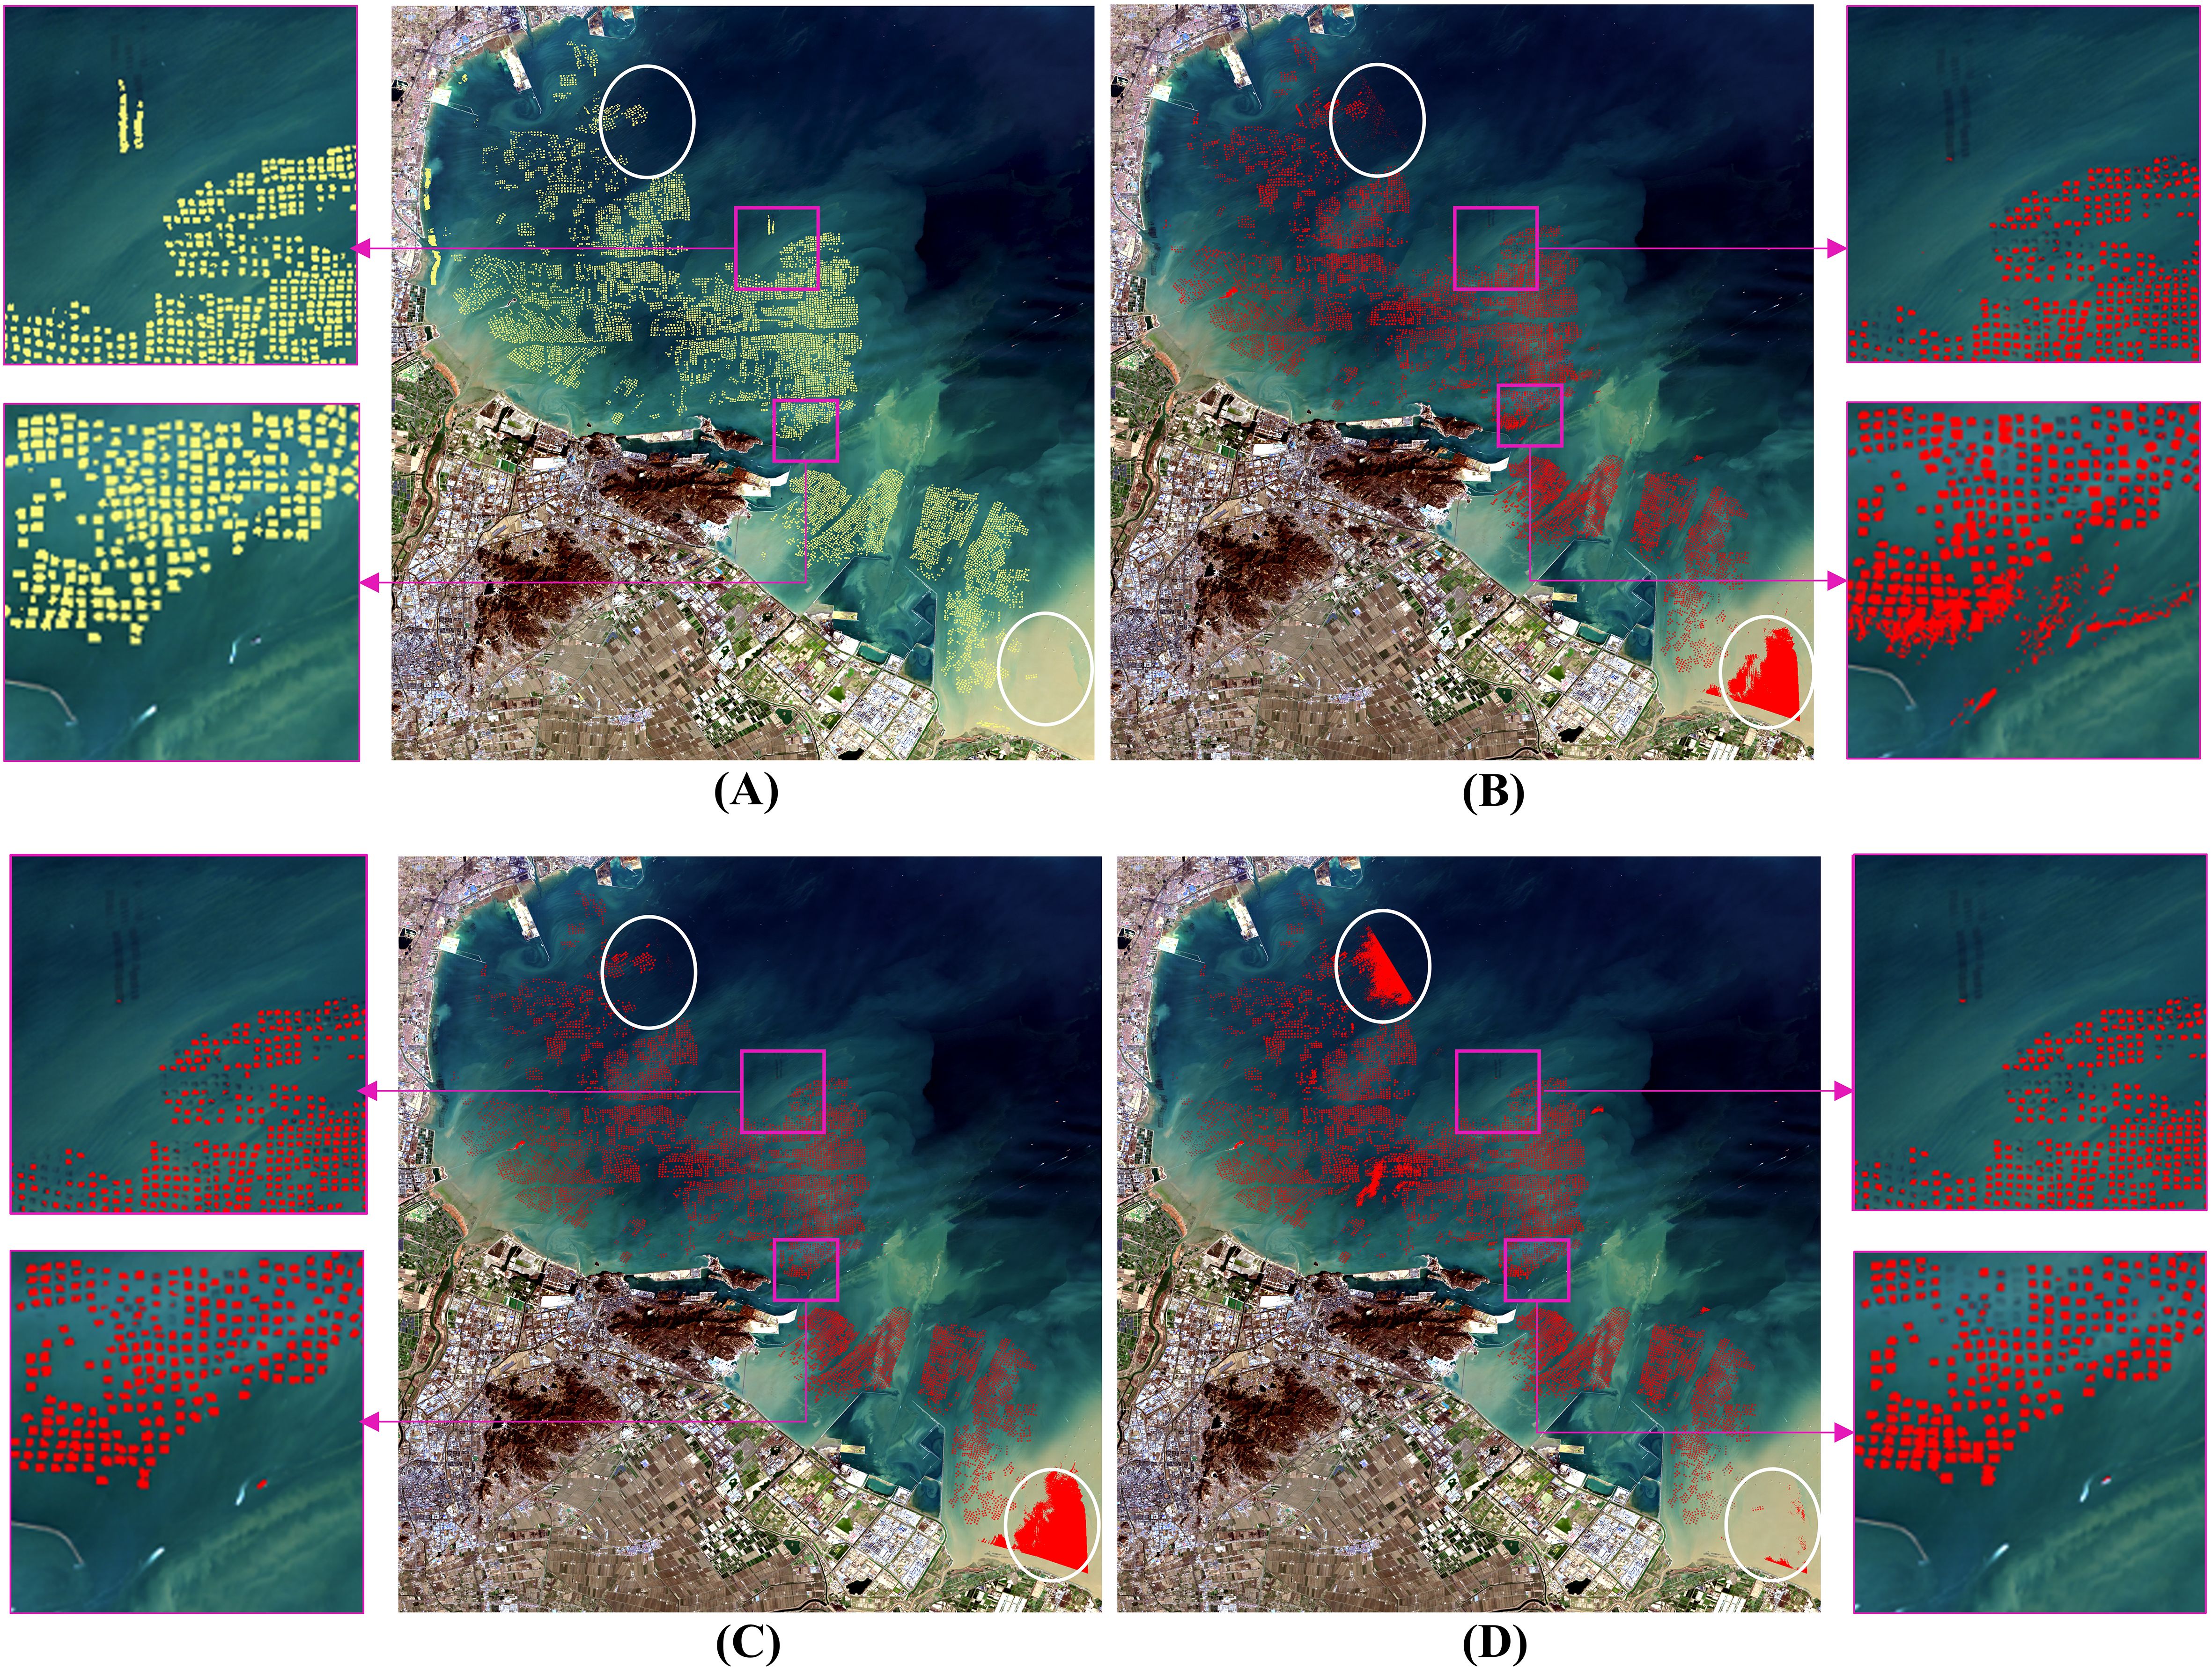
To identify the optimal extraction method for the Haizhou Bay laver aquaculture area, this study employed various techniques, including U-Net, Maximum Likelihood Estimation (MLE), Support Vector Machine (SVM), and Neural Network (NN), to extract features from Landsat images captured in 2022. The classification results are shown in Figure 2. Upon examination, the recognition results show that, despite some limitations, all four methods can identify the approximate outlines of laver aquaculture areas. Initially, an examination of the white-circled areas in the four images of Figure 2 reveals that, in comparison to the U-Net extraction results depicted in Figure 2A, the three supervised methods shown in Figures 2B-D all exhibit varying degrees of ‘same-spectrum foreign object’ phenomena. Specifically, these supervised methods mistakenly classify seawater regions with spectral characteristics similar to those of aquaculture areas as actual aquaculture zones, leading to misidentifications and reduced classification accuracy. This highlights a common challenge in remote sensing image classification, where spectral similarity can lead to misclassification. In contrast, the U-Net model effectively handles spectral similarity, resulting in fewer false positives and more accurate delineation of aquaculture areas. Furthermore, the images within the purple frames in the four figures were magnified. Compared with Figure 2A, the magnified details corresponding to Figures 2B-D exhibit significant instances of missed detection, no detection, and adhesion. For example, the three supervised classification methods fail to detect small-scale laver aquaculture areas (missed detection), and the results obtained using the Maximum Likelihood Estimation (MLE) method show that aquaculture areas are not clearly separated from the background (adhesion). These issues underscore the limitations of these supervised methods in accurately delineating the boundaries of laver aquaculture areas. In contrast, the U-Net model demonstrates superior performance in boundary delineation, clearly distinguishing between aquaculture and non-aquaculture areas even in challenging conditions.
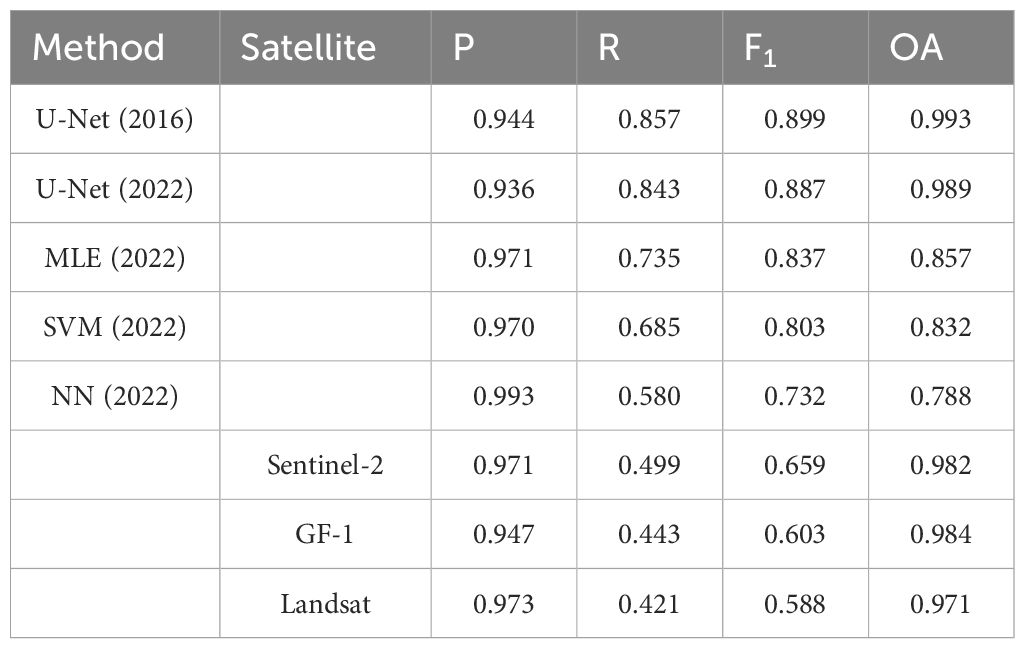
To verify the effectiveness of the four classification methods in identifying laver aquaculture areas, confusion matrices were employed to calculate the Overall Accuracy (OA) and F1 score for each method, with the evaluation results presented in Table 2. Additionally, to minimize the randomness in the identification results of the U-Net model, repeat experiments were conducted using Landsat remote sensing imagery from 2016. The results demonstrate that the U-Net identification method achieved the highest values in both OA and F1 score. Specifically, the U-Net model achieved an Overall Accuracy of 0.989 and an F1 score of 0.887 for the 2022 Landsat remote sensing imagery. In the repeat experiments using the 2016 imagery, the Overall Accuracy further increased to 0.993, with an F1 score of 0.899. In contrast, the Maximum Likelihood Estimation (MLE), Support Vector Machine (SVM), and Neural Network (NN) methods achieved OA of 0.857, 0.832, and 0.788, respectively, with F1 scores significantly lower than those of the U-Net model. These metrics objectively demonstrate the U-Net model’s significant superiority in terms of overall accuracy and robustness in eliminating the influence of spectrally similar objects on the experimental outcomes. U The-Net model’s ability to effectively distinguish between aquaculture areas and non-aquaculture areas, even in the presence of similar spectral characteristics, highlights its superior performance in this context. In conclusion, the U-Net identification method outperforms the three supervised classification methods and is well-suited for the extraction of laver aquaculture areas in Haizhou Bay. Therefore, this study selected the U-Net network model to extract laver aquaculture areas in Haizhou Bay from 2000 to 2023.
3.2 Laver aquaculture dynamics and policy adjustments
By utilizing remote sensing images from 2000 to 2023 and employing the U-Net deep learning network model, the area of laver aquaculture in Haizhou Bay was extracted. According to the area information, the laver aquaculture area showed fluctuating growth from 2000 to 2011, a sharp increase from 2012 to 2018, and a decrease from 2019 to 2023, as shown in Figure 3A. The extracted laver aquaculture area data were subjected to correlation analysis with the data obtained from the “Lianyungang Yearbook”. The analysis yielded a high correlation coefficient of approximately 0.92 (Figure 3B), indicating a strong agreement between the U-Net-derived data and authoritative records. It is reasonable to expect that other classification methods might also yield relatively high correlation coefficients when compared with the Lianyungang Yearbook. However, U-Net was selected in this study as the most effective method based on its superior accuracy, robustness against spectral confusion, and ability to delineate aquaculture boundaries more precisely compared to traditional supervised classification methods such as MLE, SVM, and NN. The fact that the U-Net results align so closely with ‘Lianyungang Yearbook’ data further reinforces the reliability and superiority of this approach in accurately mapping and monitoring laver aquaculture areas in Haizhou Bay over an extended time period. in Haizhou Bay.
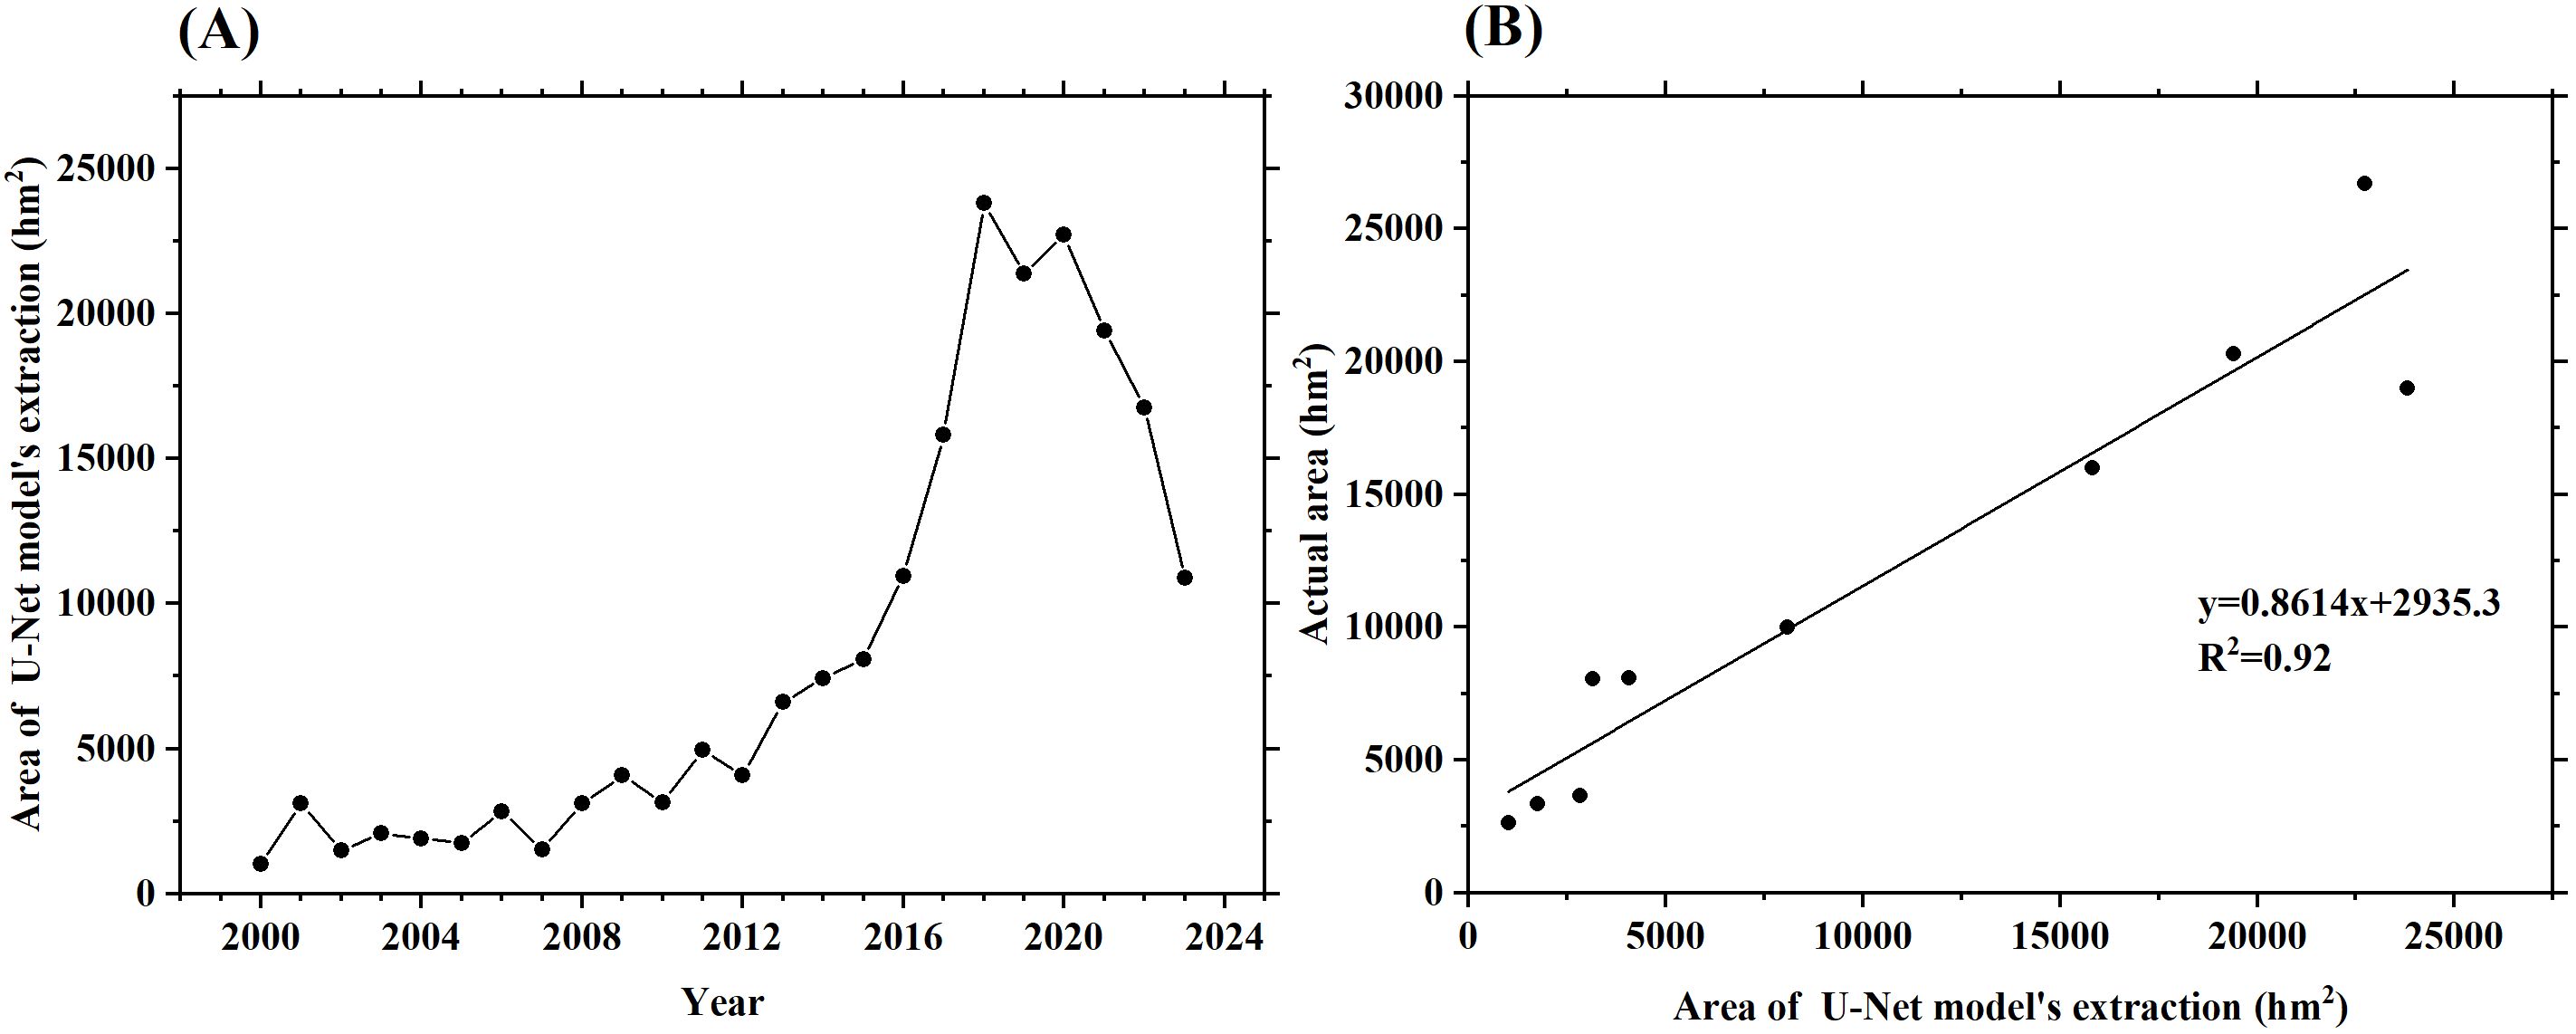
Figure 3. (A) Area of laver aquaculture based on U-Net model in Haizhou Bay from 2000 to 2023; (B) Correlation between the actual area and area of U-Net model’s extraction.
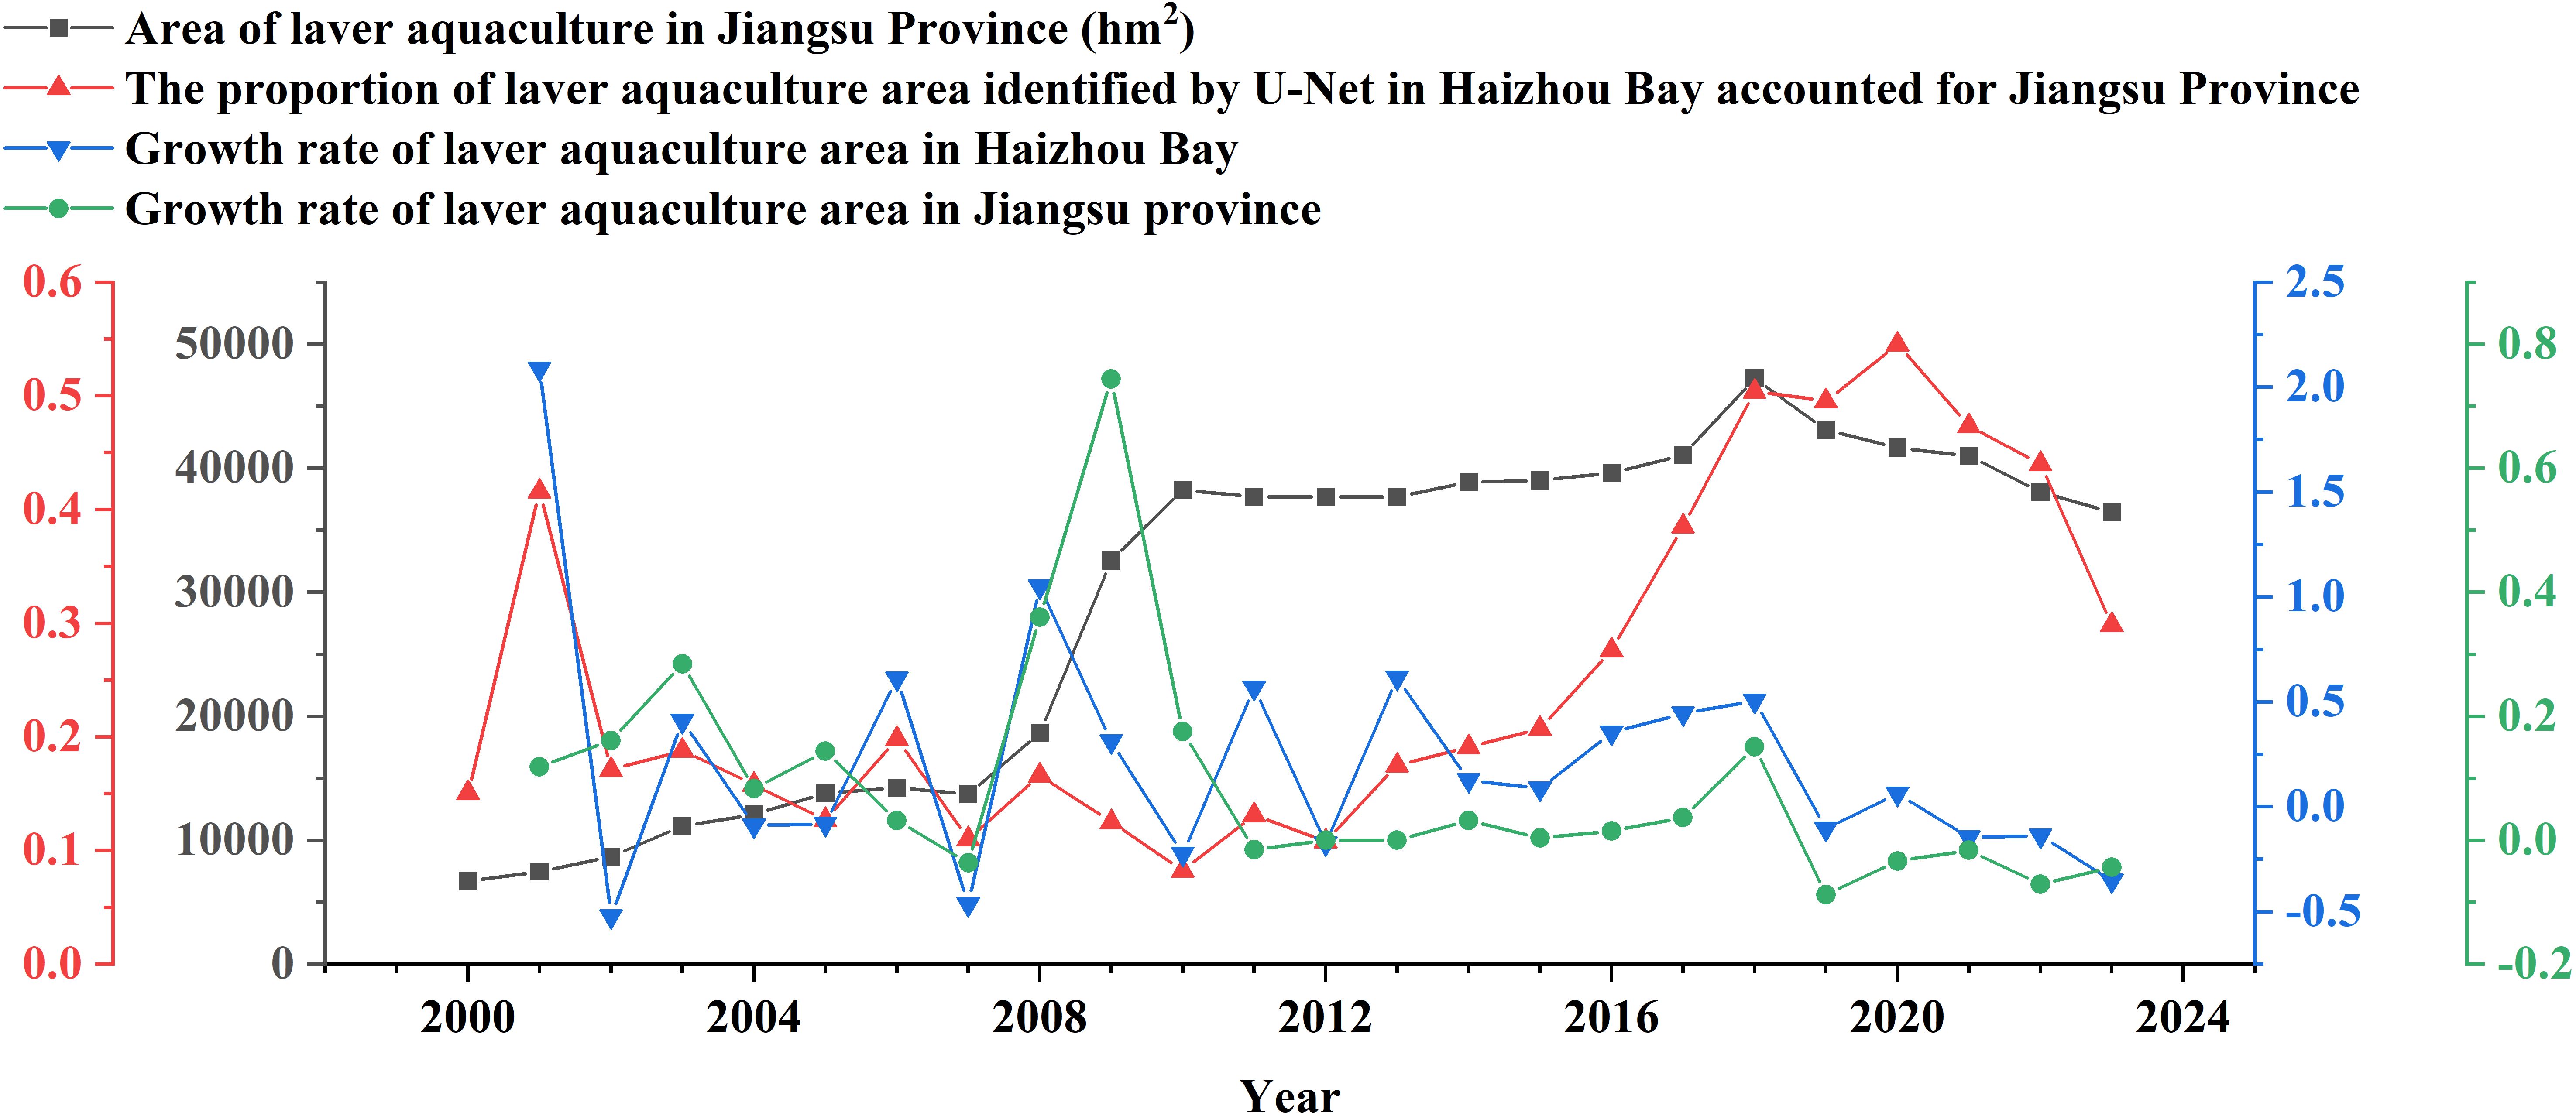
Figure 4 illustrates four-line charts with four Y-axes, representing the laver aquaculture area of Jiangsu Province, the proportion of laver aquaculture area in Haizhou Bay to the total area of Jiangsu Province, the growth rate of laver aquaculture area in Haizhou Bay, and the growth rate of laver aquaculture area in Jiangsu Province. Analysis of the data from the charts revealed a significant and consistent trend in the growth rate of the laver aquaculture area in Haizhou Bay compared with the overall growth rate of the laver aquaculture area in Jiangsu Province since 2012. This finding reflects the significant role that the Haizhou Bay has played in the laver aquaculture industry in Jiangsu Province since 2012. The data from the U-Net model indicates that the proportion of laver aquaculture area in Haizhou Bay within Jiangsu Province has grown significantly since 2012. Initially, accounting for approximately 11% of the provincial total, this figure expanded year by year, reaching approximately 50% by 2018. This substantial increase not only underscores the significance of the Haizhou Bay in the aquaculture of laver in Jiangsu Province, but also reflects the rapid expansion of aquaculture scale in this region and its substantial contribution to the overall growth of the provincial aquaculture area. The trend of the green line in the chart intuitively reveals the dynamic changes in the growth rate of the laver aquaculture area in Jiangsu Province. From 2011 to 2017, the growth rate remained close to zero, indicating that the laver aquaculture area in Jiangsu Province was nearly stagnant. This suggests that during this period, the total area of laver aquaculture in Jiangsu Province did not undergo significant expansion or reduction but remained relatively stable. Since 2019, the area of laver aquaculture in Jiangsu Province and the proportion of laver aquaculture area in Haizhou Bay have been decreasing. The growth rates of the laver aquaculture area in Haizhou Bay and Jiangsu Province are both negative, indicating a declining trend in the laver aquaculture area in Haizhou Bay and Jiangsu Province. The main reasons for this decline are the economic downturn caused by the epidemic outbreak at the end of 2019 and the deterioration of laver quality due to marine pollution (Yang and Xu, 2024).
Based on the data presented in Figure 3A, the laver aquaculture area in Haizhou Bay exhibits an initial increase, followed by a decrease from 2000 to 2023. Consequently, we divided the period from 2000 to 2023 into four stages of laver development based on the trend in aquaculture areas: the slow development stage (2000-2007), exponential growth stage (2008-2012), plateau stage (2013-2018), and policy adjustment stage (2019-2023). A representative year from each of these four stages was selected to generate a trend chart illustrating the expansion of laver aquaculture area, as shown in Figure 5. During the slow development stage, laver aquaculture in Haizhou Bay was primarily nearshore and distributed in a band-like pattern along the coastline, mainly around Qianshan and Dongxi Lian Islands (Su et al., 2020). Beginning in 2008, the laver aquaculture industry entered an exponential growth stage, with aquaculture areas continuously expanding and gradually extending into broader sea areas. In the plateau stage, the laver aquaculture area around Qinshan Island and the East and West Linked Islands developed on a larger scale. The laver aquaculture areas exhibited an irregular patchy distribution in the sea and showed a trend of extending towards deeper waters (Lu et al., 2018). Since 2019, with the maturity of aquaculture technologies such as fiberglass support poles, laver aquaculture in Haizhou Bay area of Lianyungang has moved towards deeper waters. The aquaculture area continued to expand, but the overall aquaculture area began to decrease, marking the beginning of the policy-adjustment stage (Lin et al., 2021). By averaging the growth rates across the four periods, we obtained average growth rates of 97.42%, 212.81%, and 50.44% for the respective periods. These data strongly indicated that the laver aquaculture area in Haizhou Bay showed an overall positive growth trend. Notably, the growth rate peaked during the transition from the second to third period, highlighting the rapid development of the laver aquaculture industry.
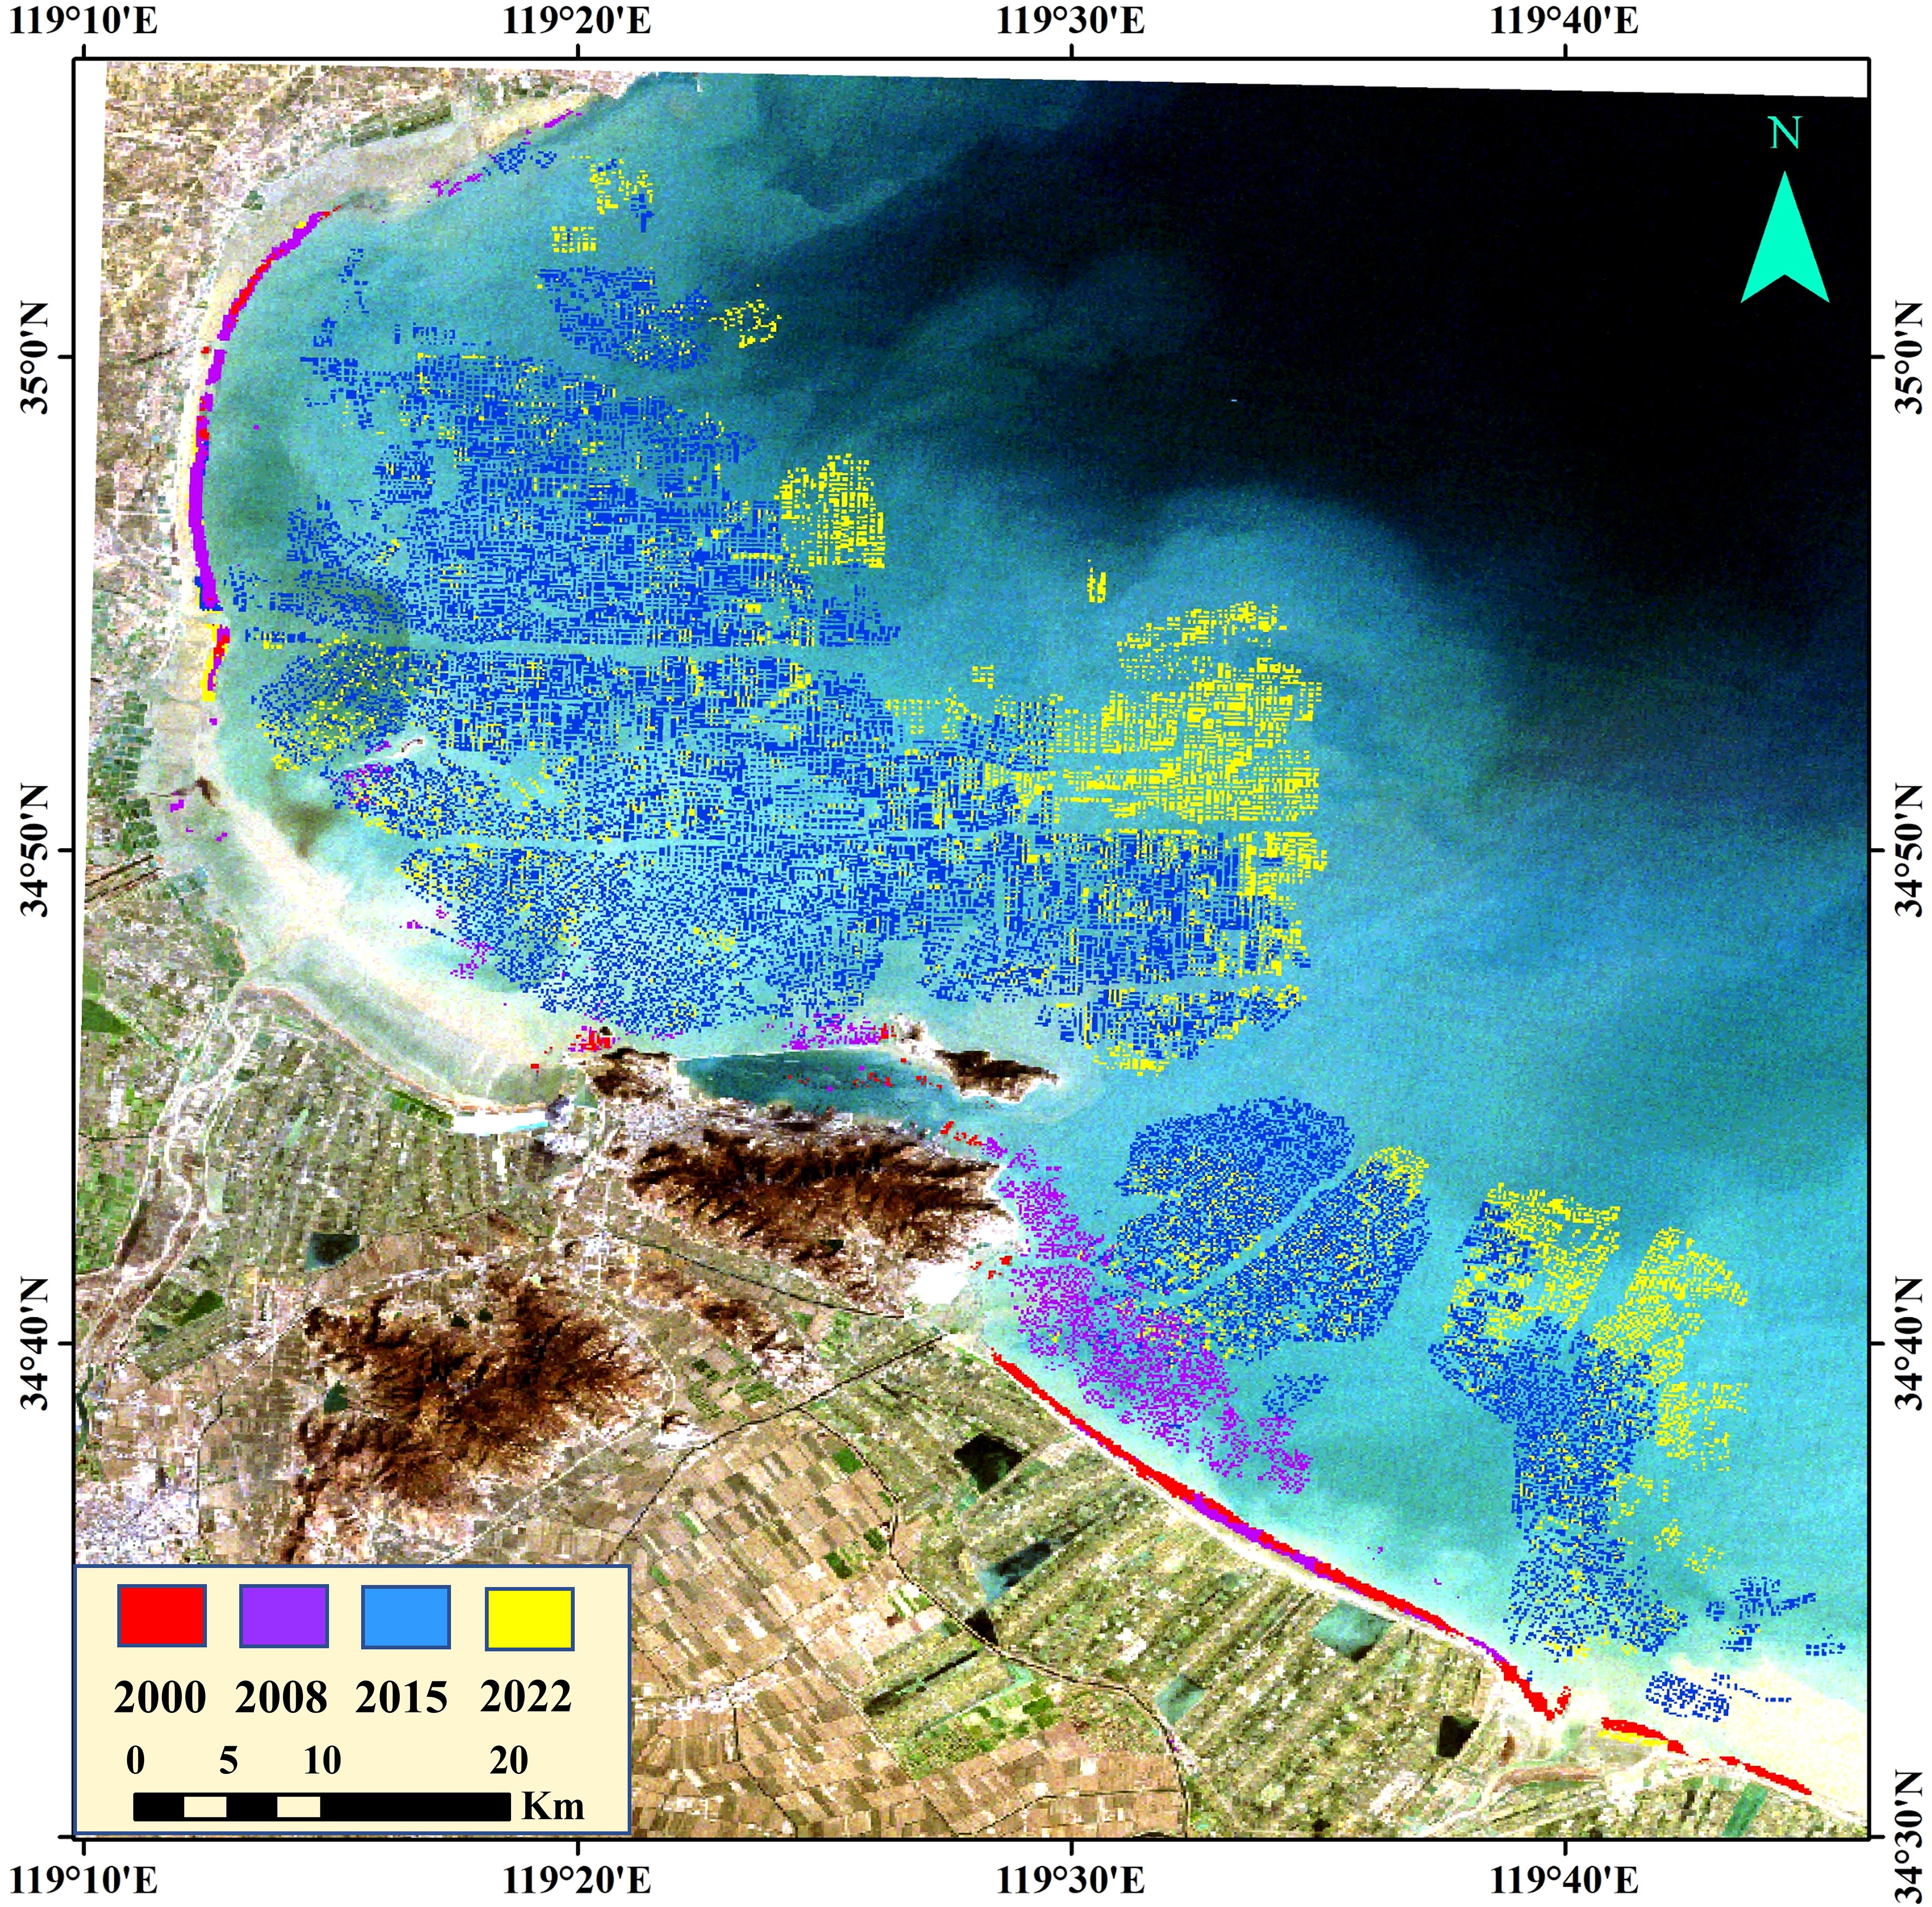
Figure 5. Distribution map of laver aquaculture area in 2000 (red), 2008 (purple), 2015 (bule) and 2022 (yellow).
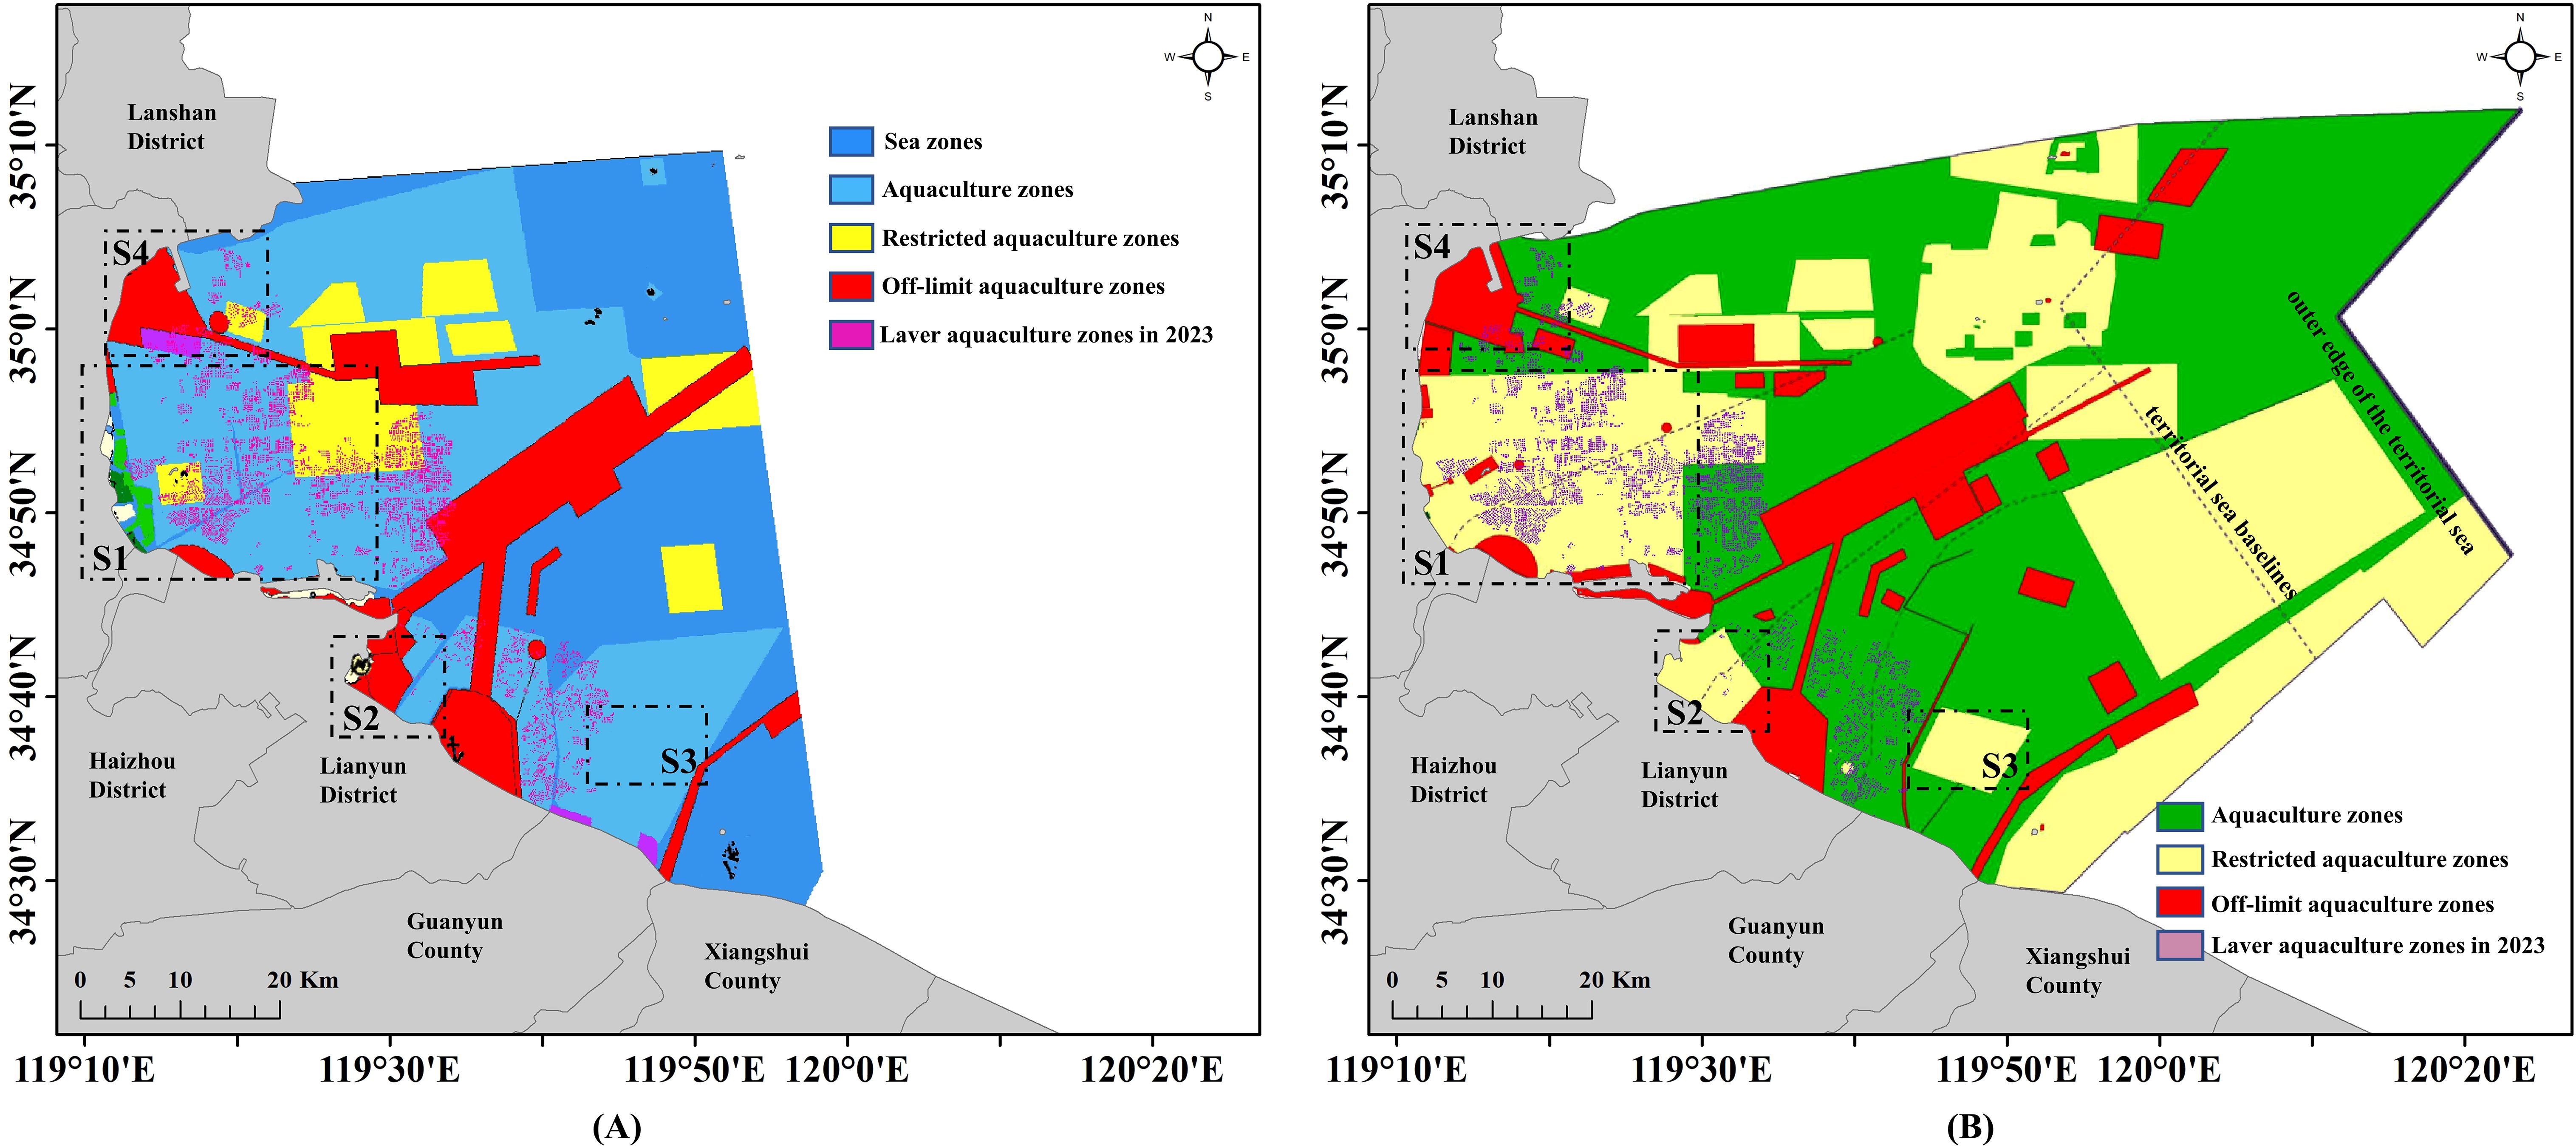
According to the “Lianyungang City Waters and Tidal Flat Planning”, the sea area of the Haizhou Bay is divided into three categories: aquaculture zones, restricted aquaculture zones, and prohibited aquaculture zones. As shown in Figure 6, by comparing the aquaculture waters and tidal flat planning maps in 2017 and 2023, and combining them with the in-depth analysis of the aquaculture area data obtained from U-Net recognition technology for 2023, we can observe significant changes in the aquaculture area planning. Specifically, aquaculture zones in 2017 were confined to the territorial baseline. By 2023, these zones had expanded to the marginal waters of the territorial sea. However, large-scale aquaculture activities have not yet extended beyond territorial baselines, possibly because of limitations in aquaculture technology and other factors. Within the territorial baseline, the prohibited aquaculture zones have remained relatively stable from 2017 to 2023; however, the boundaries of the aquaculture zones and restricted aquaculture zones have undergone significant adjustments. Notably, the coastal and nearshore areas within Haizhou Bay (area S1), which were designated as aquaculture zones in 2017, were reclassified as restricted aquaculture zones by 2023, potentially contributing to the reduction in the aquaculture area. The aquaculture policy in region b underwent significant adjustments. Previously designated prohibited and allowed aquaculture zones were uniformly reclassified as restricted zones. Additionally, minor adjustments were made in the downstream area (area S3), where a small, newly restricted aquaculture zone was added. With the expansion of the Tianwan Nuclear Power Plant and the increase in thermal discharge, the spatial distribution of laver aquaculture zones has shifted noticeably offshore. This change is likely due to the environmental impact of nuclear plant operations, necessitating the re-planning of aquaculture zones to adapt to new ecological conditions (Lu et al., 2018). Based on the identification results for the 2023 aquaculture area, we performed an overlay comparison of these two planning maps. According to the overlay comparison results of the two maps, it was found that area S2 (nuclear power special utilization area) and area S4 (port area) both had laver aquacultures. These areas do not conform to the spatial distribution requirements of the Lianyungang Marine Functional Zoning Plan.
3.3 Analysis of laver aquaculture area in Haizhou Bay
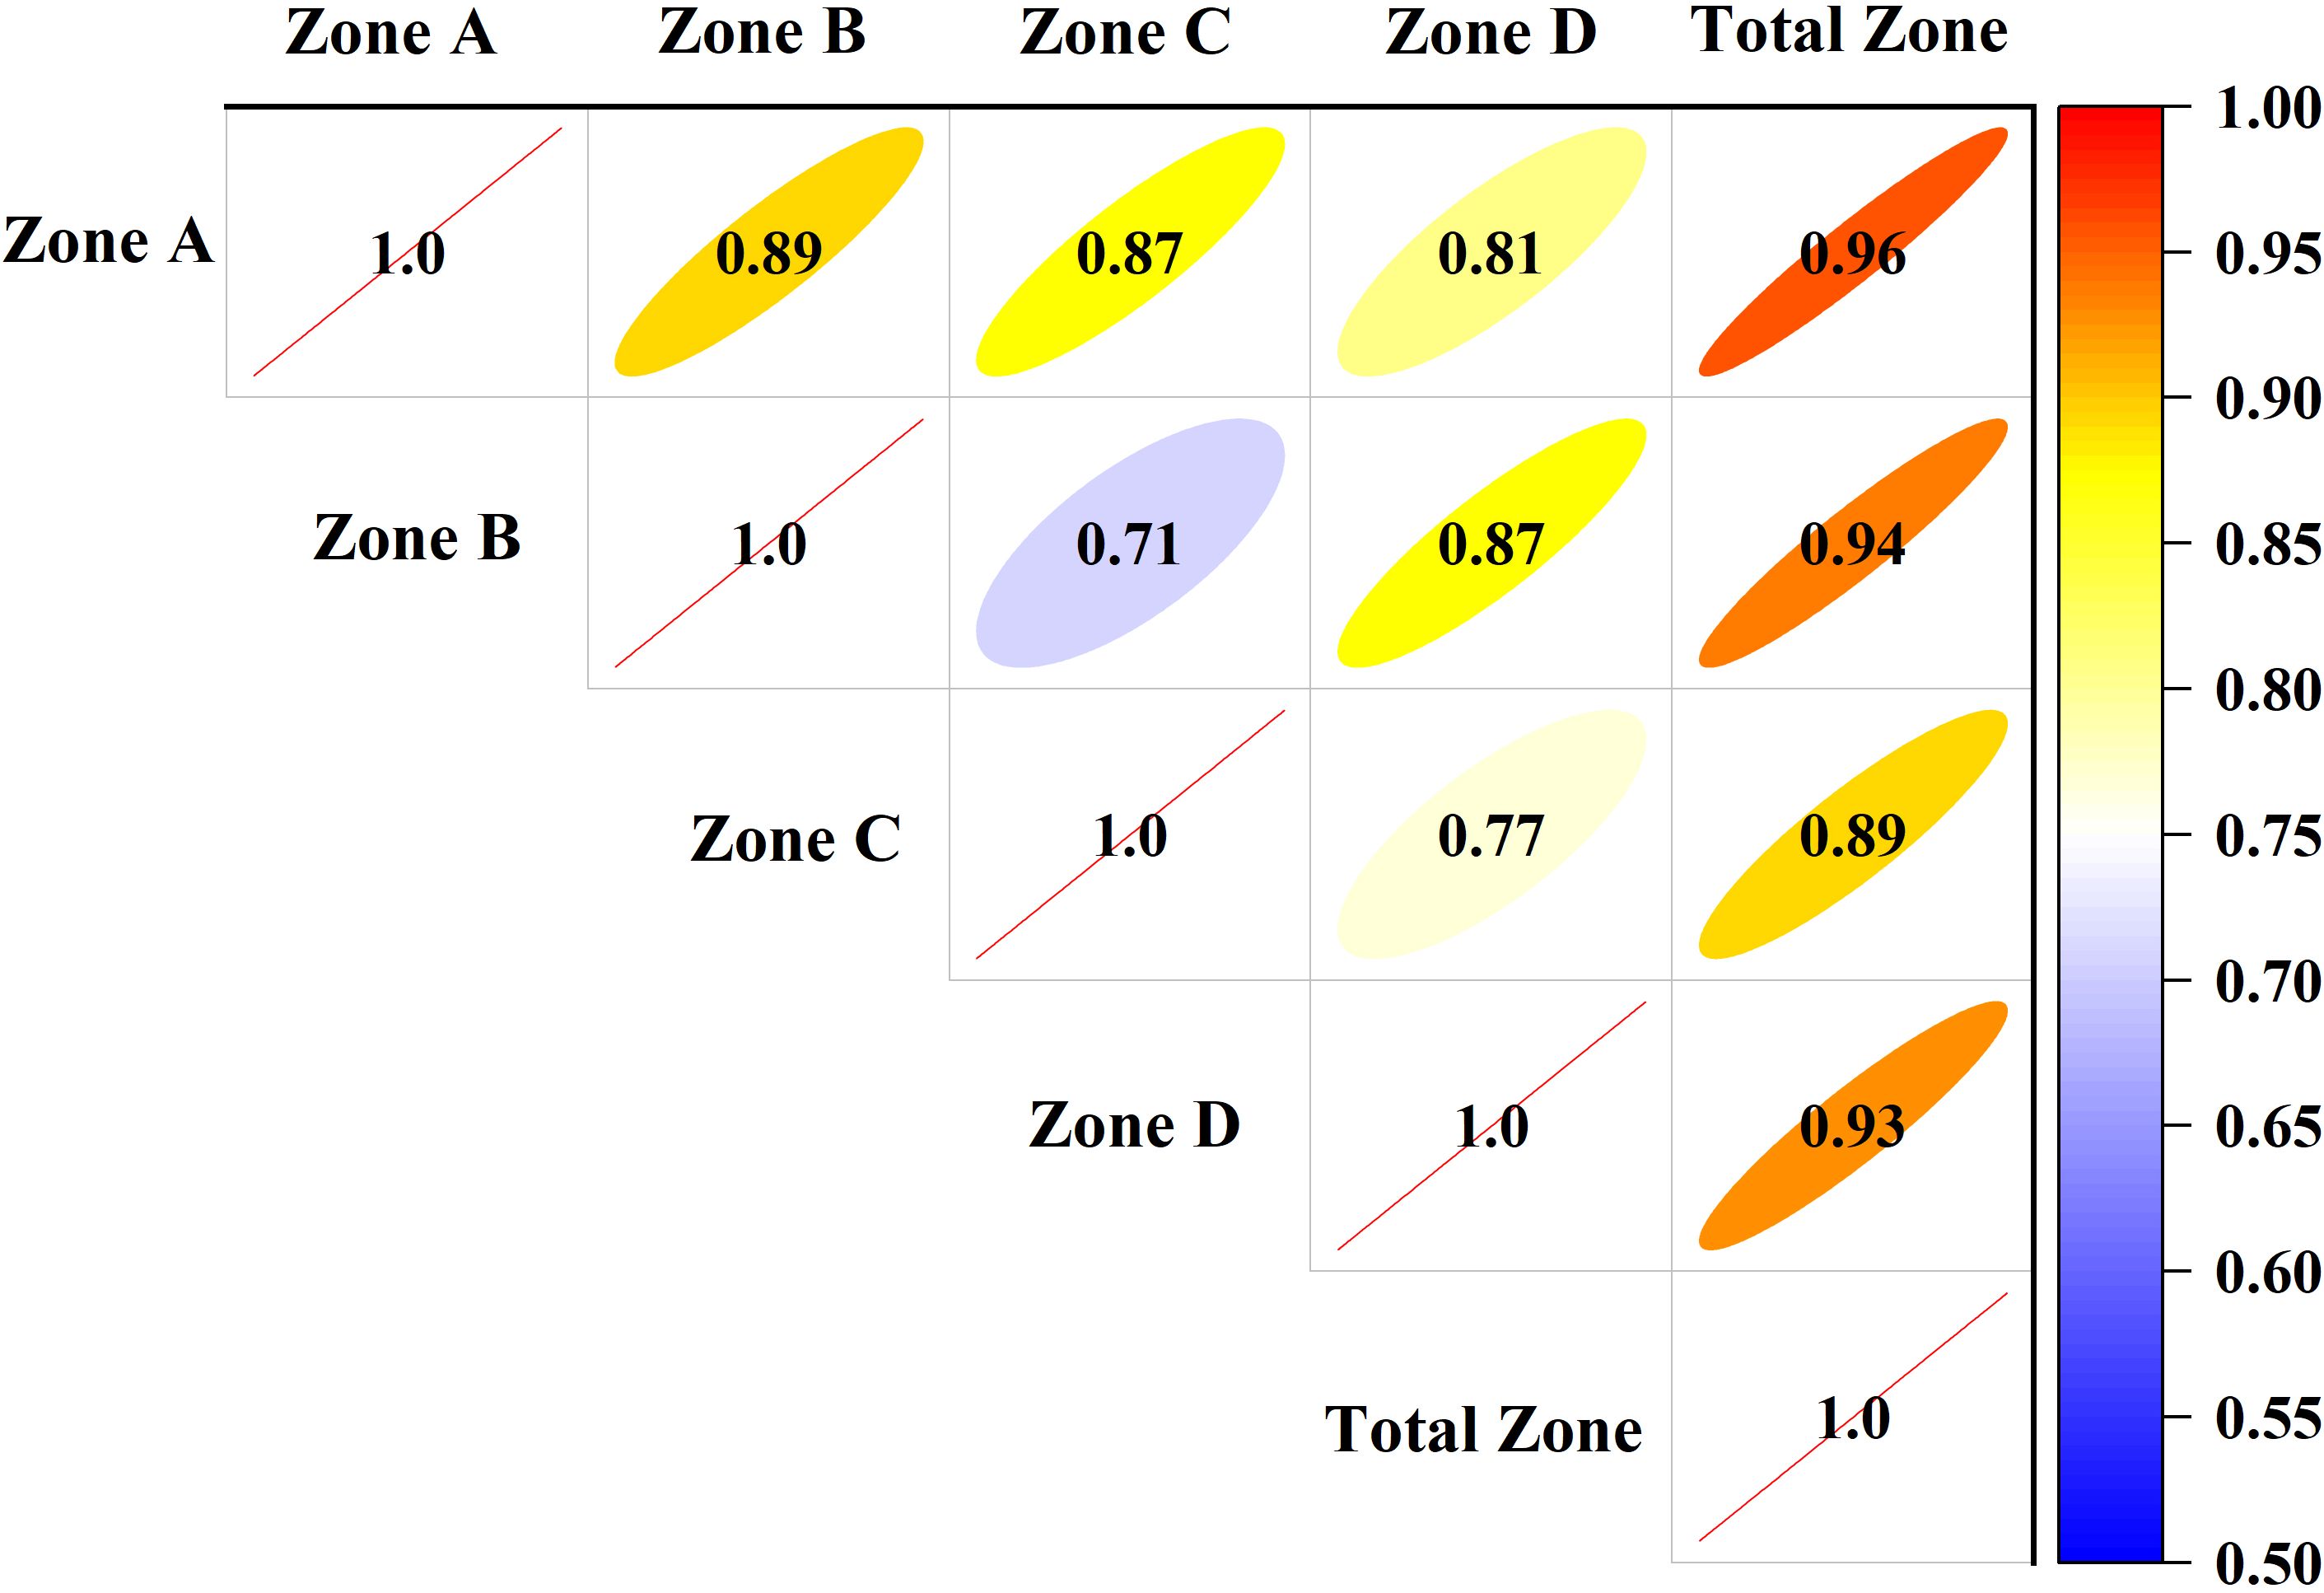
Building on the detailed division of the sea area in Haizhou Bay, this study conducted an in-depth analysis of four different zones with respect to the proportion of aquaculture area to their respective sea areas: Zone A (north of the Haizhou Bay), Zone B (south of the Haizhou Bay), Zone C (outer bay area), and Zone D (nuclear power plant influence area) (Figure 1). The heatmap Figure 7 shows the correlation coefficients among the laver coverage rates in four distinct aquaculture regions within Haizhou Bay as well as the correlation with the total aquaculture area. Each cell within the heatmap represents the degree of correlation between the coverage rates of the two regions, with red shading indicating a more similar pattern of change. Zones C and D exhibited relatively low correlation compared with the others, which suggests that policies and the construction of nuclear power plants had an impact on the aquaculture areas of laver.
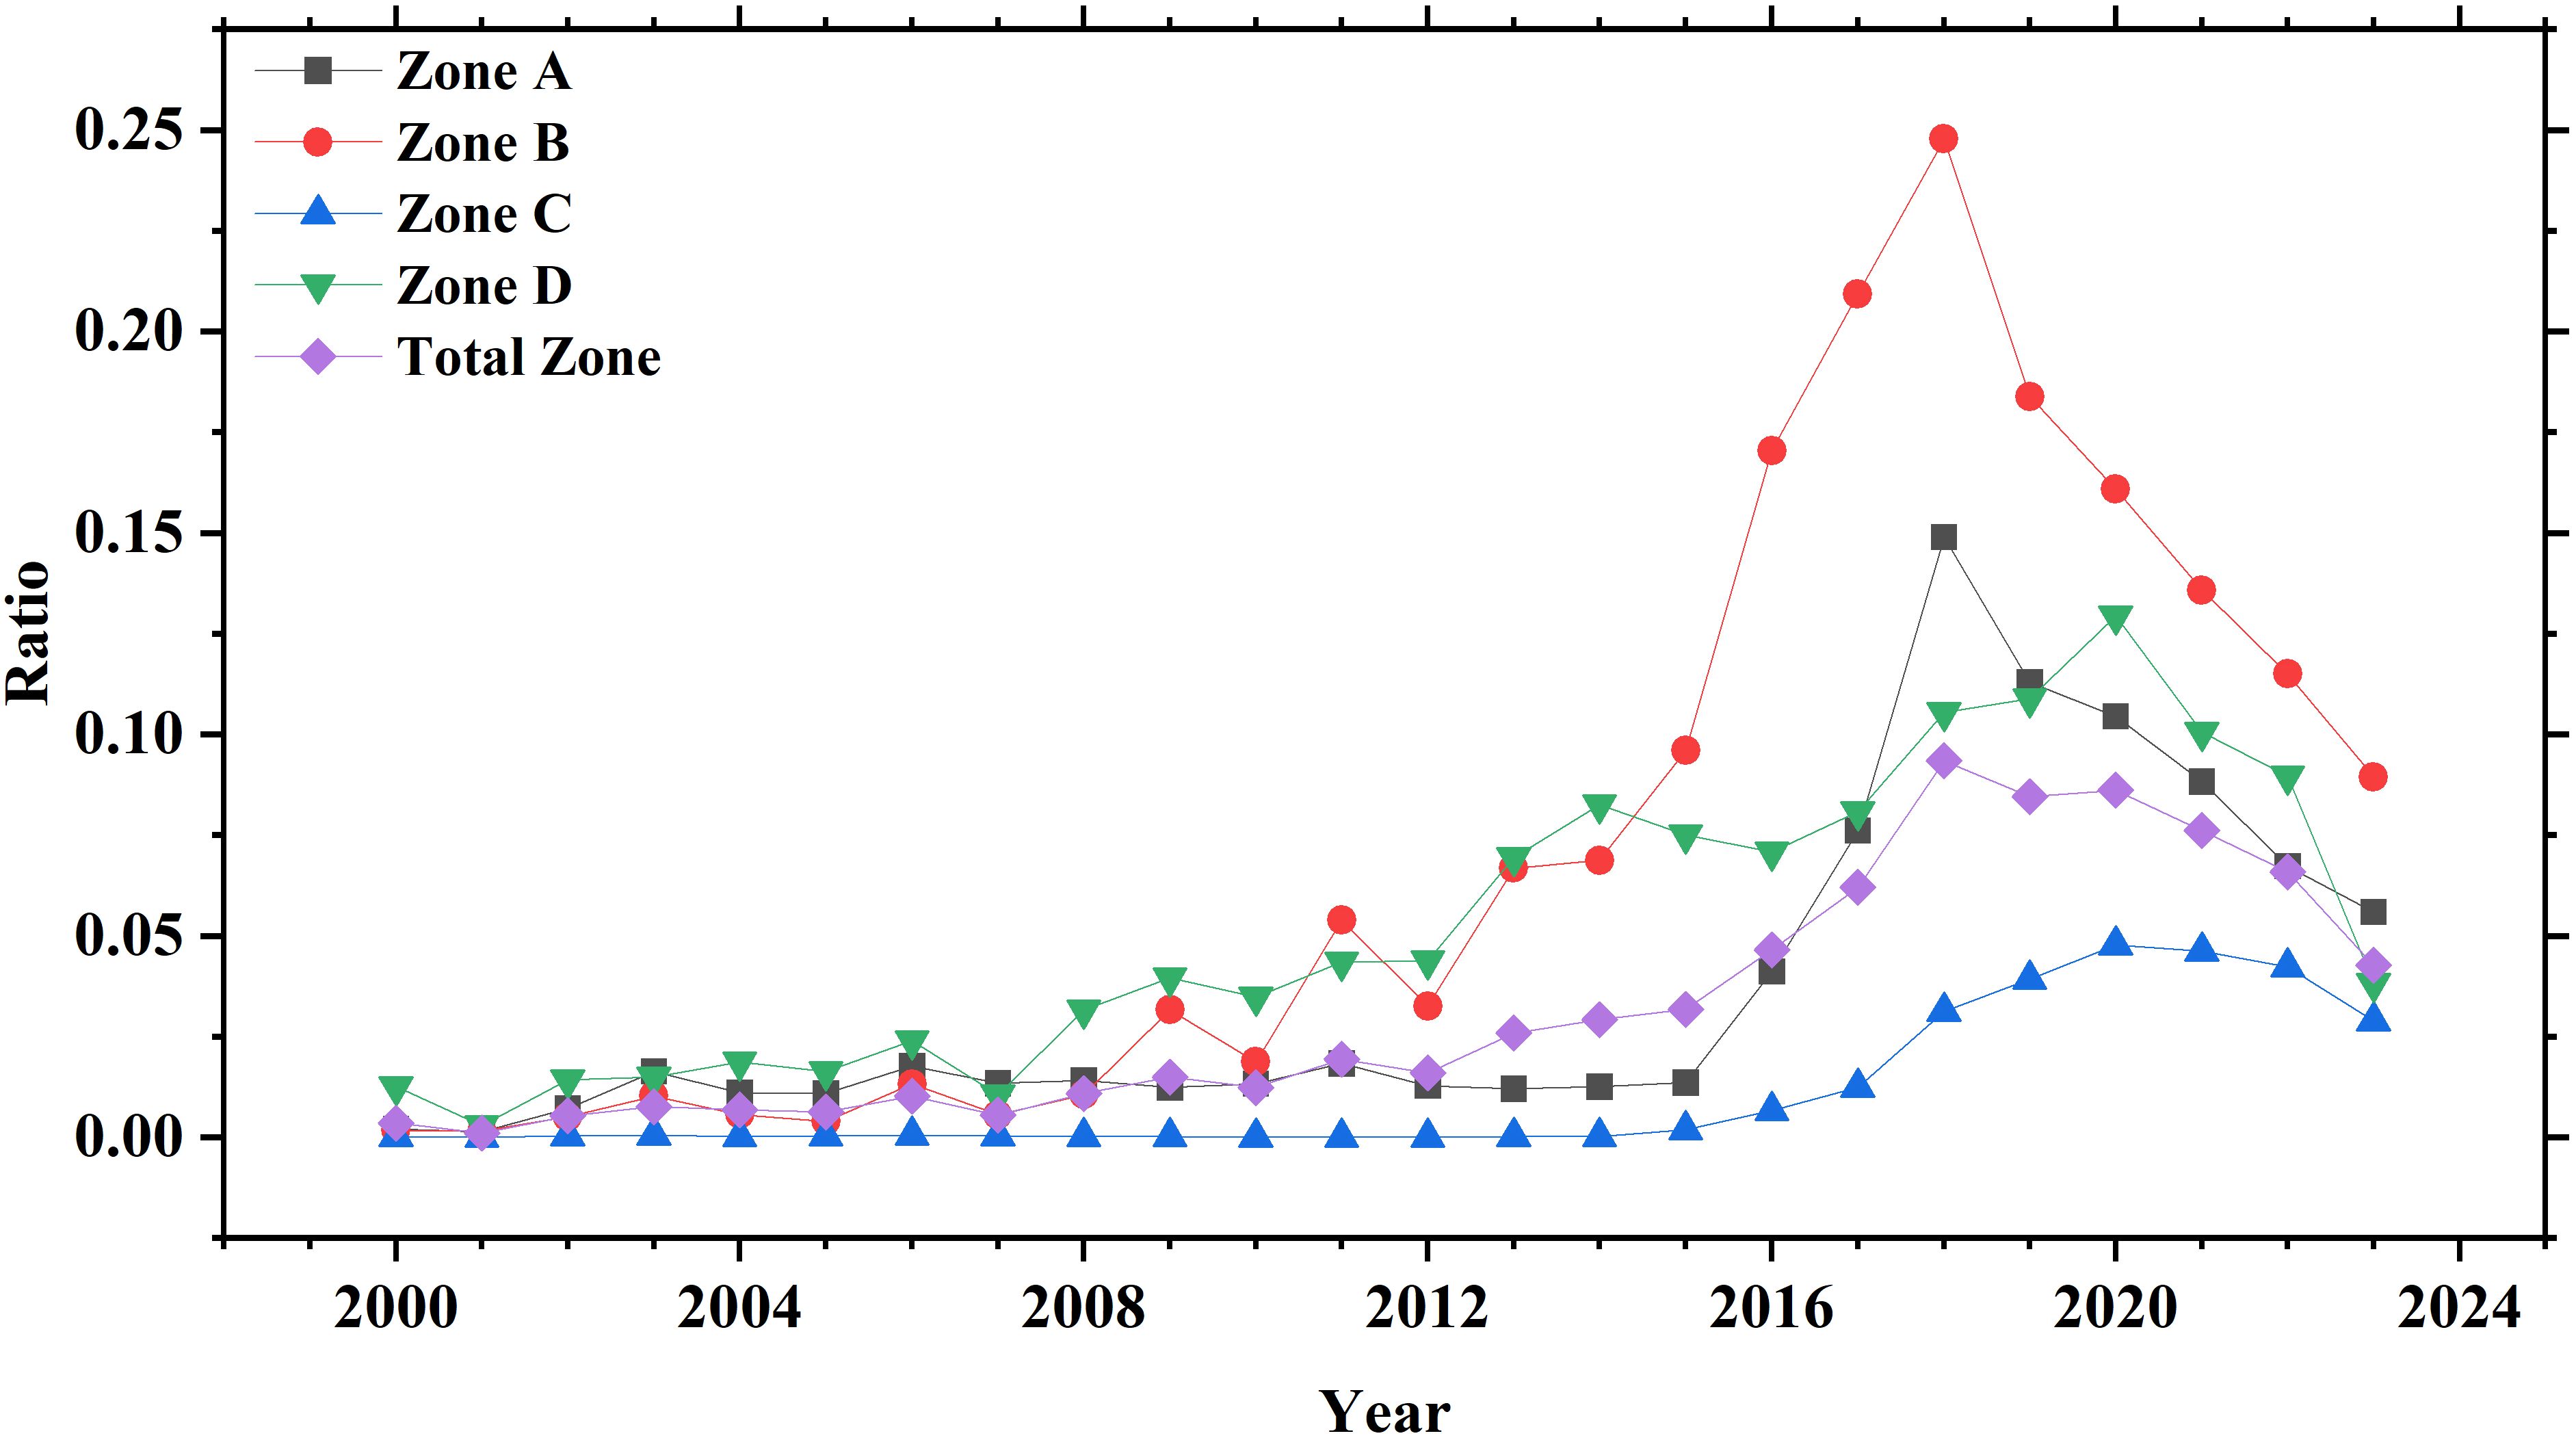
The trend of data change in the four regions is visually presented by multi-series line charts (Figure 8). Of particular note is the proportion of laver aquaculture area in Zone C, the offshore area, represented by the blue line. This proportion was negligible between the years 2000 and 2014. However, in 2015, with the leapfrog development of aquaculture technology and the proposal of a strategy for the development of the deep sea and far sea, the scale of aquaculture in this area expanded significantly. Nevertheless, this growth trend did not continue for a long time, and by 2021, owing to policies and the impact of the COVID-19 pandemic (Tang et al., 2025), the proportion of aquaculture area began to decline in Zone C (Figures 6, 8). The black and red lines depict changes in the proportion of laver aquaculture areas in Zones A and B, respectively. From 2000 to 2023, the increasing and decreasing trends of these two lines showed a high degree of consistency, with an R2 value of 0.89 for high correlation (Figure 7). This not only indicates the similarity in aquaculture conditions and market environments between the north and south of the Haizhou Bay but also reflects the possibility that similar strategies and methods may have been adopted in aquaculture practices in these two regions.
The proportion of laver aquaculture area in the nuclear power plant influence area, represented by the green line (Figure 8), experienced a decline in 2007 compared to the surrounding years. This phenomenon may be associated with the official commercial operations of Units 1 and 2 of the Tianwan Nuclear Power Station in 2007. As an important achievement of Sino-Russian technological cooperation, the Tianwan Nuclear Power Station has milestone significance in the energy field and profound effects on the ecological environment and economic activities in the surrounding marine areas. At the beginning of the operation of a nuclear power station, there may have been concerns and uncertainties regarding the surrounding environment. These factors may have led to a reduction in the aquaculture area. For example, residents and aquaculture farmers may be concerned about the safety of the nuclear power station and its potential environmental impacts, thereby affecting their willingness and scale of laver aquaculture within the influence area. Additionally, the construction and operation of nuclear power stations may bring about changes in the marine environment, such as changes in water temperature, flow, and quality, which may adversely affect laver aquaculture. However, as time passed and nuclear power stations operated safely and steadily, public understanding and acceptance of nuclear power stations gradually increased. Furthermore, the government and relevant departments may have implemented a series of environmental protection and ecological compensation measures to help alleviate the initial concerns and negative impacts. Therefore, despite the decrease in aquaculture area in 2007, in subsequent years, with the gradual optimization and adjustment of various factors, the proportion of laver aquaculture area gradually recovered and showed new development trends (Figures 5, 8).
4 Discussion
4.1 Practicality verification of models
The core focus of this study was the application of the U-Net deep learning model for the interpretation of long-term series Landsat satellite images to extract laver aquaculture areas. The model demonstrated outstanding performance and achieved satisfactory results during the extraction process. In this section, we further explored the applicability and effectiveness of the U-Net model trained with Landsat images when processing images from sensors with different resolutions. To gain a deeper understanding of this issue, we selected satellite images with three different resolutions: 30-meter resolution Landsat images, 16-meter resolution GF-1 images, and 10-meter resolution Sentinel-2 images. The selected raw images were all from the same region and were captured on the same day, and they underwent identical preprocessing. Subsequently, we performed FLAASH atmospheric correction on these preprocessed images, resulting in three atmospherically corrected images, as shown in Figure 9 and Table 2. The comparative analysis results indicate that under the conditions of this experiment, the U-Net deep learning model trained with Landsat remote sensing images can be successfully applied to remote sensing images from sensors with different resolutions.
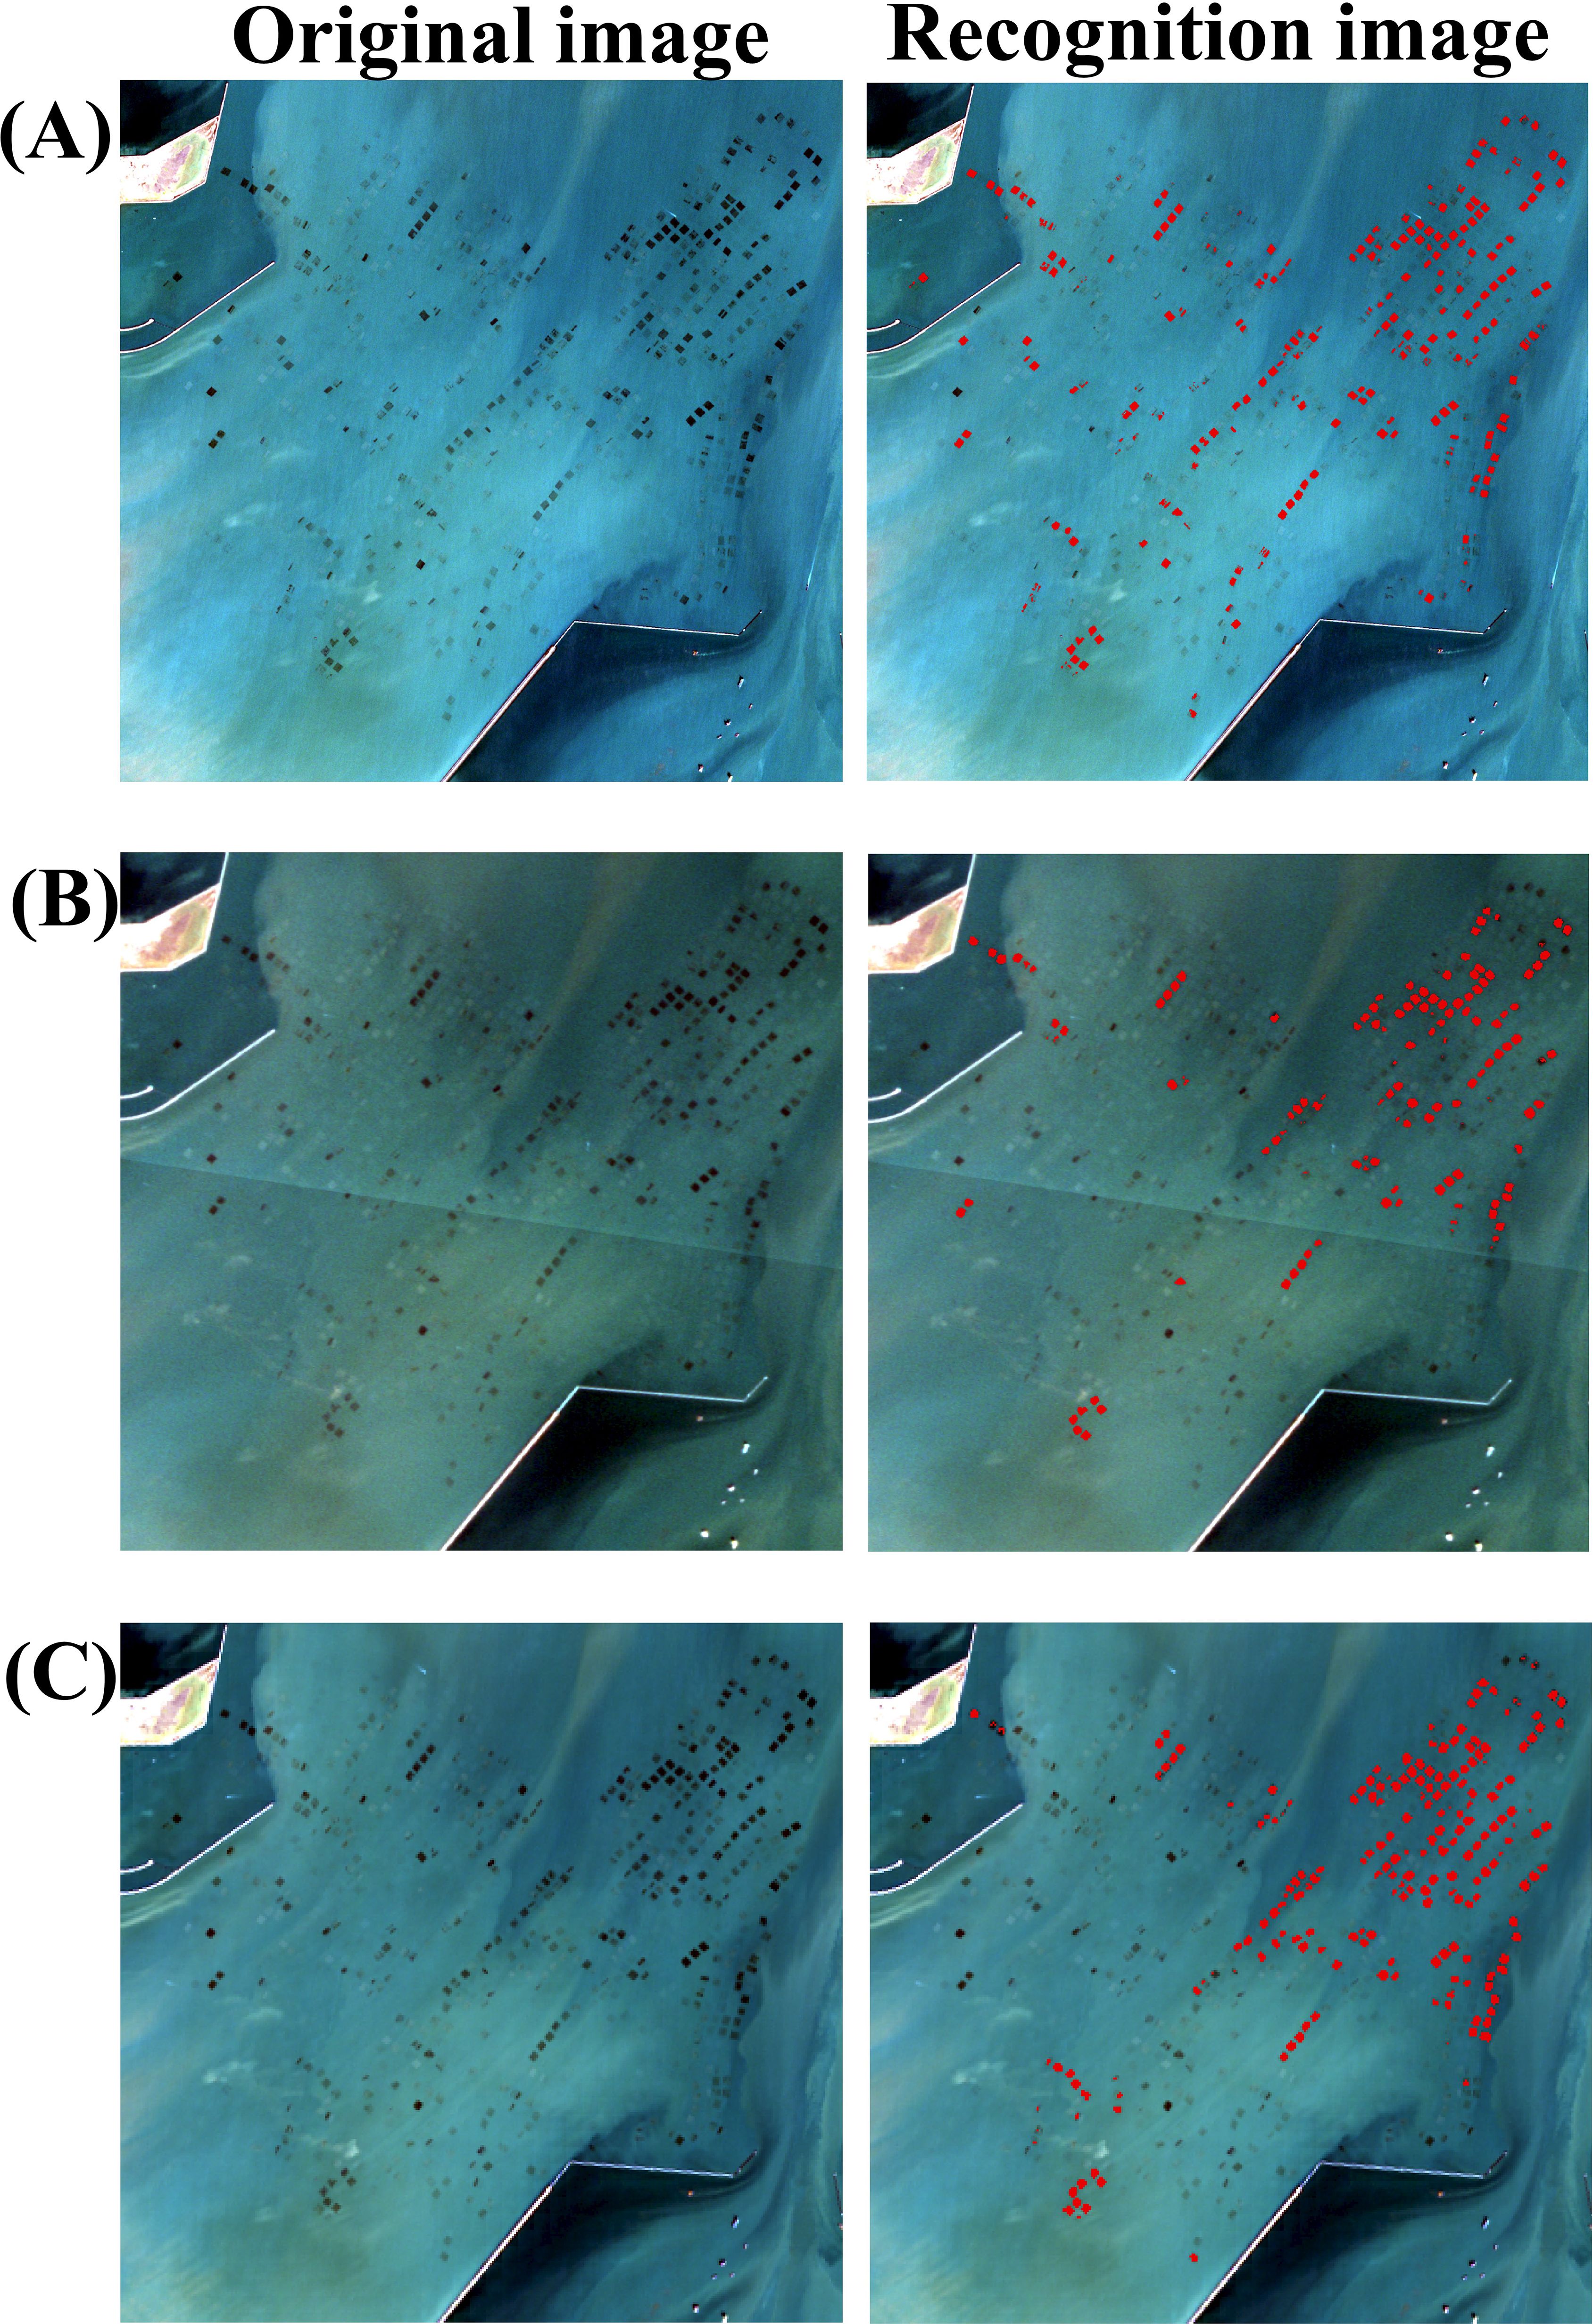
Figure 9. Identification results of satellite images with atmospheric correction. (A) Sentinel-2; (B) GF-2; (C) Landsat-9.
The ability of the U-Net model to generalize across different image resolutions within a certain range highlights its potential for broader remote sensing applications. However, this capability is contingent on the resolution being sufficient to distinguish the smallest unit of the laver aquaculture areas. This capability can reduce the need for extensive retraining and calibration when the model is applied to various satellite datasets. These findings underscore the versatility and practicality of the U-Net model in remote sensing applications, particularly agricultural monitoring and resource management (Chen et al., 2021; Wu, 2023). Future research should explore the performance of the model across a wider range of environmental conditions and resolutions to further validate its generalizability and robustness.
4.2 Analysis of driving force for laver aquaculture
4.2.1 Natural factors
From 2000 to 2023, the rapid development of laver aquaculture in Hai Zhou Bay witnessed a substantial increase in aquaculture area from 1006.74 hm2 in 2000 to 10872.45 hm2 in 2023, as observed from the U-Net model’s extraction results. Regression analysis revealed distinct environmental drivers of this expansion: 2-m temperature showed the strongest positive correlation with aquaculture area (R²=0.26, p<0.05), while other factors like wind speed (R²=0.04, p>0.05) and sea surface temperature (R²=0.11, p>0.05) demonstrated statistically insignificant relationships (Supplementary Figure S1). These findings indicate that natural factors played a limited role in driving the expansion of laver aquaculture, suggesting that the environmental conditions in Hai Zhou Bay are relatively stable and inherently suitable for laver aquaculture.
Among these, seawater temperature plays a crucial role. Laver, a cold-water seaweed, thrives best within an optimal temperature range of 0.5 and 18°C (Kim, 2013), with deviations from this range—either too high or too low—adversely affecting its growth rate and quality. The significant positive correlation between 2-m temperature and aquaculture expansion (Supplementary Figure S1A, R² = 0.26, p<0.05) suggests that subtle warming within the optimal range may have enhanced aquaculture suitability. As the growth cycle of laver typically spans November to March of the following year (Ai et al., 2023), it is important to note that the 2-m temperature and sea surface temperature in Hai Zhou Bay remained within the optimal range for laver growth throughout the aquaculture period, as shown in Figures 10A, B. Despite the lack of statistical significance in sea surface temperature trends (Supplementary Figure S1B, R²=0.11, p>0.05), their sustained stability within the 0.5-18°C window likely provided essential thermal stability for large-scale aquaculture.
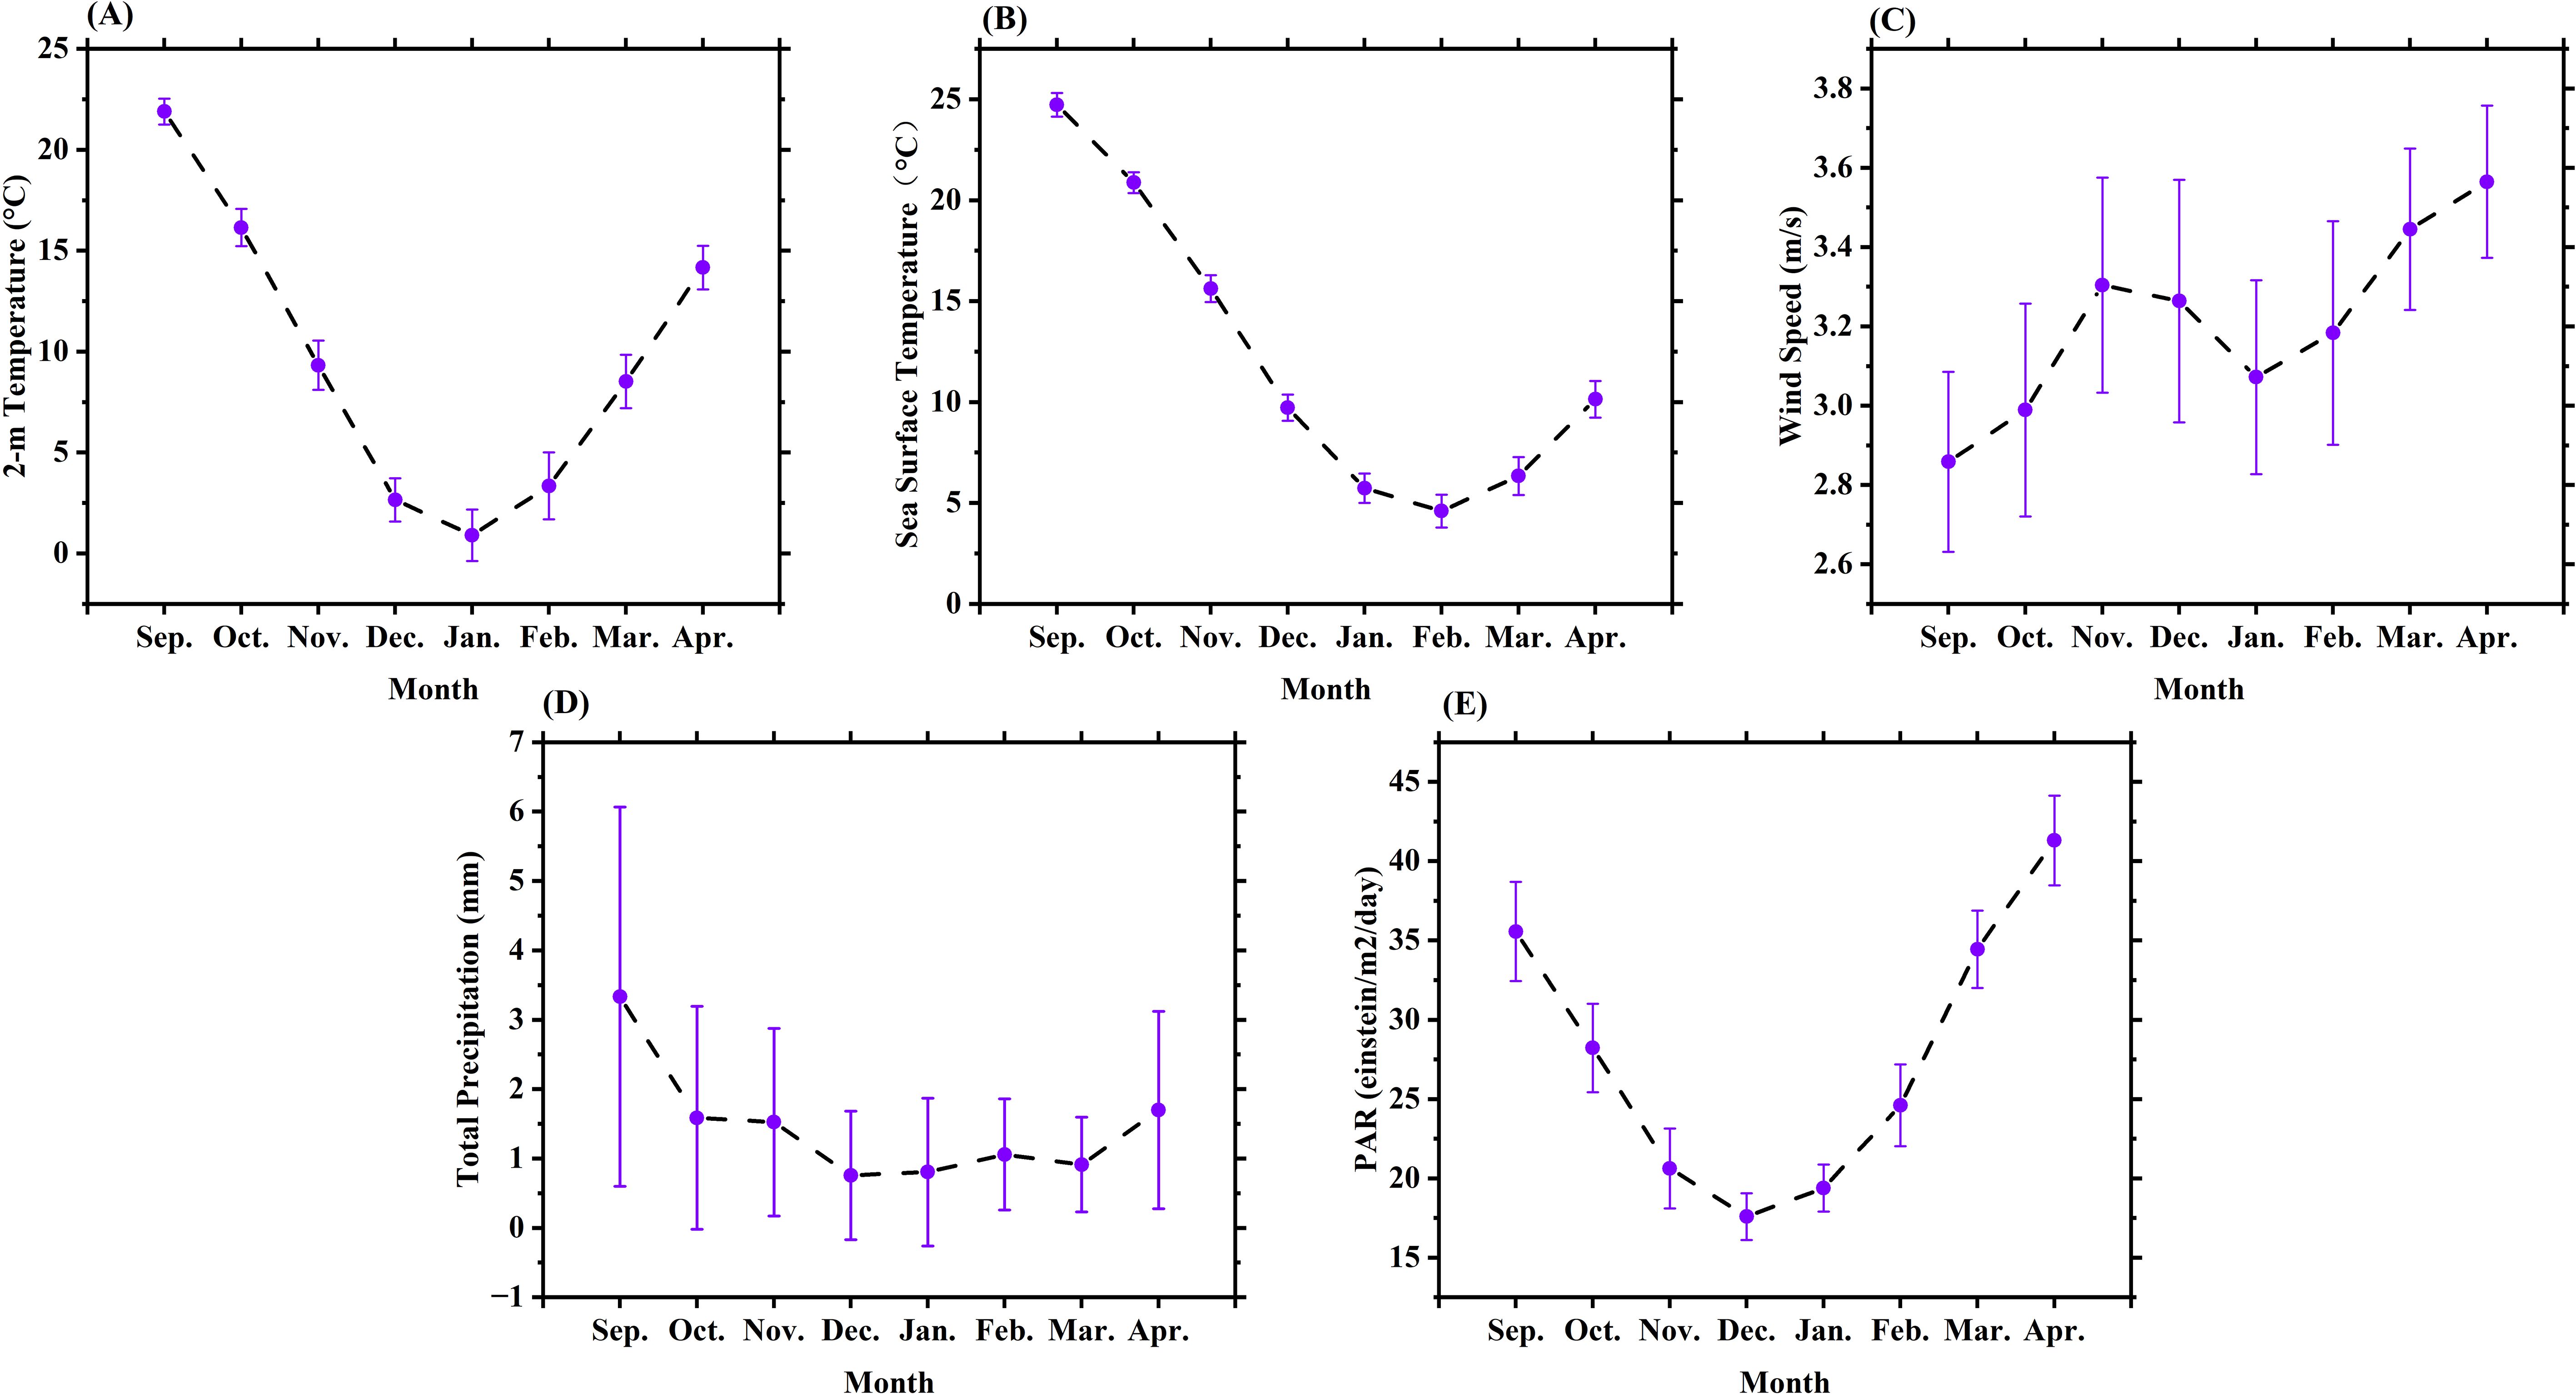
Figure 10. Monthly average variations of natural factors from 2000 to 2023. (A) 2-m Temperature; (B) Sea Surface Temperature; (C) Wind Speed; (D) Total Precipitation; (E) PAR.
Wind speed is another crucial natural factor affecting laver aquaculture in Haizhou Bay. As depicted in Figure 10C, the monthly average wind speeds in Haizhou Bay from 2000 to 2023 fluctuated between 3 and 3.5 m/s. Notably, regression analysis showed minimal correlation between wind speed and aquaculture area (R²=0.04, p>0.05), indicating that interannual wind variations played a secondary role in driving spatial expansion compared to thermal factors (Supplementary Figure S1C). Adequate wind speeds contribute to sufficient oxygen supply and vertical mixing of seawater, which is essential for providing the necessary nutrients to the laver. However, excessively high wind speeds may lead to increased wave action, which may disrupt the growth environment and cause physical damage to aquaculture facilities. Additionally, sustained strong winds may alter the direction of seawater, affecting the attachment and growth of laver spores (Chen, 2021).
Figure 10D illustrates the monthly average total precipitation in Haizhou Bay from 2000 to 2023, ranging from 20 to 100 mm within the laver growth period. The precipitation showed the weakest correlation with aquaculture area (Supplementary Figure S1D; R²=0.002, p>0.05), despite its theoretical importance for nutrient dynamics. Precipitation is an important factor influencing the water quality and nutrient availability for laver aquaculture. Adequate rainfall helps provide freshwater and nutrients to the aquaculture areas, promoting laver growth. However, excessive precipitation may reduce seawater salinity, negatively affecting laver adaptability to its environment, ultimately impairing photosynthesis and growth (Ren et al., 2020). Heavy precipitation may also introduce land-based pollutants into the sea, increasing suspended solids and affecting the water quality in the aquaculture zones (Lian et al., 2020).
Photosynthetically Active Radiation (PAR) refers to solar radiation that plants can use for photosynthesis. PAR is another key environmental factor that directly influences laver growth in Haizhou Bay. As shown in Figure 10E, the monthly average PAR in Haizhou Bay fluctuated between 17-35 einstein/m2/day during the laver growth period. The weak negative correlation between PAR and aquaculture area (Supplementary Figure S1E; R²=0.02, p>0.05) challenges conventional assumptions. Adequate PAR is crucial for leaf photosynthesis, which in turn supports growth and biomass accumulation. However, variations in cloud cover, seasonal changes, and water depth can reduce the intensity of PAR reaching the seabed, which can affect laver growth. In Haizhou Bay, laver aquaculture predominantly takes place in the winter months, when daylight hours are shorter; however, a relatively stable PAR level during this period is conducive to consistent laver growth. If PAR is too low, it may limit photosynthesis, thereby affecting growth and yield. Seasonal and daily variations in PAR also affect the laver aquaculture cycle, requiring adaptive management in aquaculture practices (Xue et al., 2023).
4.2.2 Modern technological breakthroughs
With the continuous advancement of technology, significant progress has been made in various aspects of laver aquaculture, including seedling collection, breeding, cultivation, and processing (Lu et al., 2018). The continuous improvement of aquaculture technology has brought about revolutionary changes in the laver industry, enabling the comprehensive upgrading of traditional aquaculture methods.
Traditional laver aquaculture is mostly concentrated in nearshore intertidal zones, while the application of modern aquaculture technology has expanded laver aquaculture into the vast blue realms of the deep sea. For example, in Jiangsu Lianyungang, the successful experiment of the full-floating laver aquaculture research test area has expanded the traditional aquaculture sea area. This deep-sea aquaculture method, like the full - floating type using foam instead of bamboo poles, not only effectively avoids environmental pressures in nearshore areas, such as pollution and disease invasion, but also maximizes the utilization of broader marine resources, further expanding the scale of aquaculture (Wei et al., 2018).
The widespread application of modern biotechnology has injected continuous vitality into the laver industry, making laver varieties more diverse, with stronger resistance, and higher yields. Breakthroughs in laver genetic breeding, as evidenced by research from relevant scholars, have injected strong momentum into industrial development, providing reliable guarantees to produce high-quality laver products (Ding and Yan, 2019). In addition, new aquaculture models have emerged. In Xishu Village, Lianyungang, a new model of intercropping shellfish and algae has been adopted, with half of the original laver-aquaculture sea area now used for laver cultivation and the other half for shellfish aquaculture, mainly including triploid Pacific oysters, as well as some two-headed razor clams, American red clams, and blue mussels. This new model can not only make full use of sea area resources and increase the yield per unit area of laver and oysters, promoting the increase of fishermen’s income, but also effectively prevent the eutrophication of the breeding sea area and the explosive diseases of shellfish, achieving sustainable development. Each year, the income from this new model in the area has increased significantly, with the average income per mu of oyster aquaculture reaching 1000-2000 RMB, and the income from laver has also increased due to the improvement of the ecological environment.
The continuous development of new aquaculture facilities and materials has provided strong support for the sustainable development of laver aquaculture. For example, the application of antifouling coating technology has effectively improved the durability and efficiency of aquaculture equipment, making production more efficient and stable (Tang et al., 2022). In addition, in the face of the problem of green algae affecting laver cultivation, the acid - treatment technology for green tide algae has been developed. After two-year in-situ tests in the sea area, it has been verified that applying the acid- treatment solution for 1 minute can remove more than 90% of the attached green algae on the laver raft cables and nets, and has no obvious impact on the growth of laver and the sea area environment. Through this technology, the impact of green algae on laver grade and yield is reduced, and the aging laver bodies are also reduced to a certain extent, improving the quality and yield of laver. Cooperating with enterprises to use mixed - acid reagents to kill Enteromorpha prolifera, the average value - added per mu of laver can reach 540 RMB, achieving a win-win situation of economic and ecological benefits.
Simultaneously, the application of ecological three-dimensional control technology has provided new ideas and effective means for environmental protection in laver aquaculture areas, ensuring the harmonious coexistence of aquaculture activities and the surrounding ecological environment. These technological innovations not only collectively promote the optimization of laver aquaculture spatial distribution but also open broad prospects for the sustainable development of laver (Wang et al., 2021). While meeting the market demand for high - quality laver products, these innovations also contribute positively to safeguarding the sustainable development of the marine ecological environment.
4.2.3 Economic-social-policy factors
The thriving development of laver aquaculture in Haizhou Bay can be attributed to the combined impetus of economic, social, and policy factors. First, the rapid economic growth in Lianyungang City provided a solid market foundation and capital support for the laver aquaculture industry. The city’s GDP increased from 29.319 billion RMB in 2000 to 436.4 billion RMB in 2023, reflecting nearly a fifteen-fold growth, indicative of the city’s economic diversification and industrial expansion, thereby promoting the development of laver aquaculture.
From 2000 to 2018, the area of laver aquaculture reached its peak in Haizhou Bay, with a significant relationship observed between GDP and laver cultivation area (Figure 11A, R² = 0.84, P<0.05). This trend can be divided into two periods: the development phase (comprising a slow development stage from 2000 to 2007, exponential growth stage from 2008 to 2012, and a plateau stage from 2013 to 2018) and a subsequent phase focusing on high-quality development marked by policy adjustments.
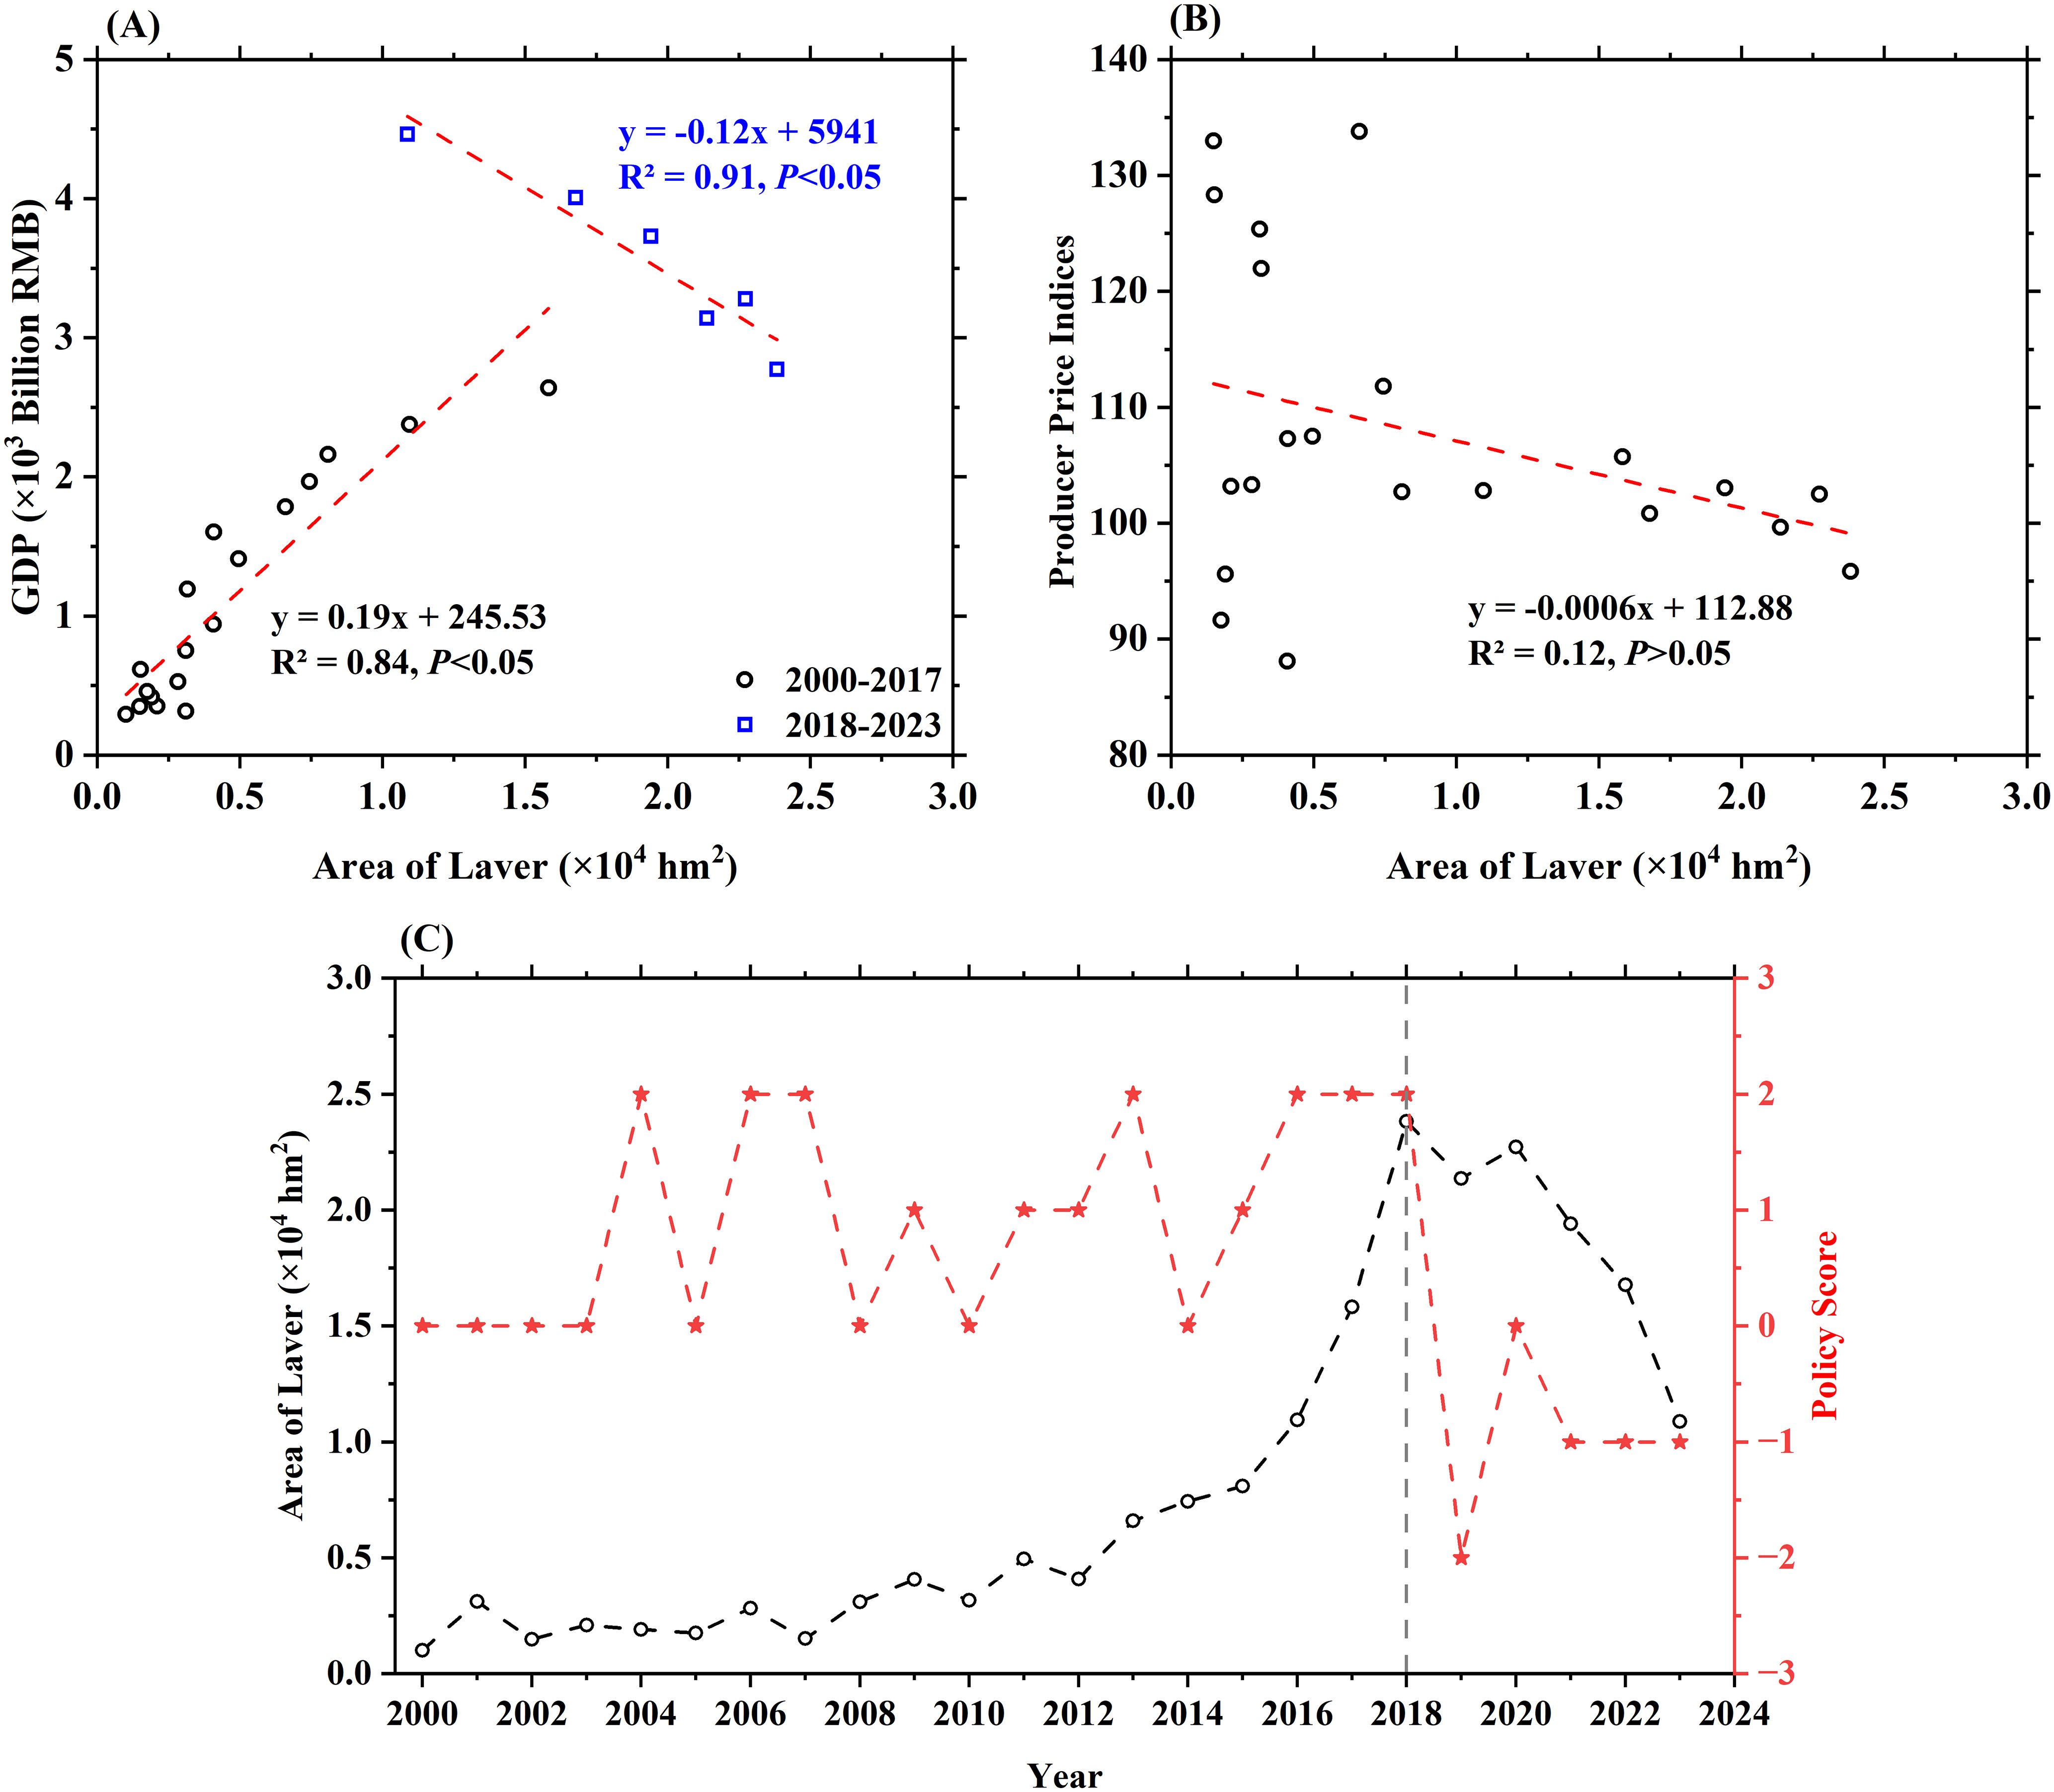
Figure 11. The correlation between area of laver aquaculture and (A) GDP, (B) Producer Price Indices, and (C) Policy Score, respectively.
Growing market demand is also crucial; people’s increasing focus on healthy foods has made laver a favored choice, significantly benefiting the aquaculture industry. Furthermore, the relationship between the Producer Price Index and laver cultivation area showed no significant impact (Figure 11B, R² = 0.12, P>0.05), indicating that social price trends have not substantially influenced the scale of laver aquaculture, which remained relatively stable over the years.
Additionally, laver aquaculture has provided numerous employment opportunities in the Haizhou Bay area, particularly for farmers and fishermen in coastal regions. It has become an important economic resource for improving the living standards of residents (Lu et al., 2018). The tradition of laver aquaculture has fostered local community identity and cohesion, enhanced social consensus and promoted a spirit of cooperation that drives stable industrial development.
From the analysis of policy impacts, a scoring system was introduced to evaluate the impact of policies. Specifically, policies supporting the industry (e.g., subsidies, technological incentives) were assigned a score of +1, while policies aiming to optimize or reduce over-expansion (e.g., environmental regulations) were assigned a score of -1. This scoring system allowed us to systematically incorporate policy effects into our framework. The details for the policies and scores are shown in Supplementary Table S1. It is evident that from 2000 to 2018, policies were predominantly supportive, encouraging and endorsing the development of the laver aquaculture industry, which peaked in 2018 (Figure 11C). However, from 2019 onward, the government implemented policies aimed at optimizing and adjusting the industry, transitioning towards high-quality development by promoting technological transformation and upgrading. This shift has led to a reduction in laver cultivation scale, with a gradual move away from nearshore intertidal farms to offshore deep-sea areas (Figure 5), reflecting the policy-driven nature of the industry. Such policy measures, which include subsidies and technical guidance, serve as robust guarantees for industrial growth while emphasizing ecological protection and the rational use of marine resources. These policies have become vital in shaping the spatial distribution of laver aquaculture (Su et al., 2020).
Ultimately, these economic, social, and policy factors interact and mutually reinforce each other, collectively promoting the healthy development of laver aquaculture in Haizhou Bay. Under this comprehensive influence, laver aquaculture continues to flourish, significantly contributing to the overall progress of the local economy and society.
4.3 Model applicability, scalability, and future exploration
The U-Net model, validated for the Haizhou Bay region, demonstrates significant potential for aquaculture monitoring. However, its applicability to other regions with varying environmental and spectral characteristics remains uncertain. Environmental factors such as water temperature, salinity, turbidity, and species-specific spectral properties can differ significantly across geographic locations, potentially impacting the model’s performance (Ronneberger et al., 2015). Future research is needed to assess U-Net’s generalizability to regions with different climatic conditions, species, or environmental challenges, such as tropical aquaculture or deep-sea aquaculture, where spectral signatures and environmental dynamics may vary considerably.
Despite these uncertainties, the methodology and findings of this study offer valuable insights for global aquaculture management. The integration of long-term remote sensing data and environmental parameters like sea temperature, wind speed, and photosynthetically active radiation (PAR) can be adapted for monitoring aquaculture areas worldwide. This approach could also be extended to monitor different species, enabling more comprehensive management strategies. However, scalability may be influenced by data resolution, availability, and local environmental characteristics. For instance, regions with lower spatial resolution or limited historical remote sensing data may experience reduced classification accuracy.
The scalability of the U-Net model is further influenced by the temporal and spatial variability of aquaculture sites. While U-Net has proven effective for stable zones like Haizhou Bay, it may face challenges in more dynamic environments or regions with higher variability in farm distribution. Environmental factors such as water quality fluctuations, seasonal changes, and species-specific growing conditions could also complicate model performance in new regions. Nevertheless, the methodology developed in this study provides a robust framework for large-scale aquaculture monitoring using remote sensing. Future work should focus on validating and refining the U-Net model in diverse environmental conditions to enhance its global applicability.
In terms of model selection, U-Net was chosen over other state-of-the-art deep learning models, such as ResUNet (Su et al., 2022a) and DeepLabV3+ (Ai et al., 2023), due to its balance between performance and computational efficiency. U-Net’s distinctive skip connections allow for the preservation of fine spatial details, which is crucial for accurately delineating aquaculture areas in coastal environments (Ronneberger et al., 2015). Its simpler architecture made it ideal for handling long-term datasets, like those used in this study (2000–2023), where computational efficiency was a key consideration. Future exploration could involve exploring more complex architectures, such as ResUNet and DeepLabV3+, to evaluate their potential for improving performance in larger-scale aquaculture monitoring tasks. The potential benefits of these models in handling multi-scale and more diverse aquaculture regions could offer insights into further improving classification accuracy for larger and more complex monitoring projects.
5 Conclusion
Based on multi-temporal Landsat remote sensing imagery from 2000 to 2023, this study utilized the U-Net convolutional neural network as a deep learning interpretation model to extract marine aquaculture areas. We conducted research on the spatiotemporal distribution of laver aquaculture areas in Haizhou Bay of China. In addition, we discussed the recognition performance of the remote sensing images acquired by sensors with different resolutions. Meanwhile, we explored the driving forces behind the evolution of laver aquaculture areas from various aspects, including natural factors, aquaculture techniques, and economic-social-policy.
This study concludes that the U-Net model is an effective tool for extracting and analyzing aquaculture areas from remote sensing images in Haizhou Bay, demonstrating superior performance compared to traditional methods. The aquaculture area exhibited distinct phases of growth and decline, influenced by a combination of natural environmental factors, technological advancements, and socio-economic policies. The period from 2000 to 2018 was characterized by supportive policies and technological improvements that contributed to peak aquaculture areas. However, post-2018, policy adjustments targeting high-quality development and environmental sustainability led to a decrease in aquaculture scale. This research highlights the critical role of economic growth, particularly economic development, in driving the initial expansion of laver aquaculture. However, market price impacts were minimal, indicating that technological innovations have been crucial for enhancing productivity and sustainability. Policy measures have decisively shaped the industry’s trajectory, underscoring the need for balanced strategies that integrate economic and ecological considerations. Ultimately, this study emphasizes the importance of combining remote sensing technology with economic and policy analysis to effectively understand and manage aquaculture systems. Future research should explore the applicability of this approach in other regions and investigate the long-term environmental impacts of aquaculture policies and practices. Additionally, Future research could explore complex architectures like ResUNet and DeepLabV3+ to improve performance in large-scale aquaculture monitoring, particularly in handling multi-scale and diverse regions.
Data availability statement
The raw data supporting the conclusions of this article will be made available by the authors, without undue reservation.
Author contributions
XL: Conceptualization, Funding acquisition, Methodology, Validation, Writing – original draft, Writing – review & editing. HH: Data curation, Methodology, Validation, Writing – original draft, Writing – review & editing. LW: Writing – review & editing. WQ: Conceptualization, Funding acquisition, Supervision, Writing – review & editing. CL: Writing – review & editing. CF: Resources, Software, Writing – review & editing. WL: Validation, Writing – review & editing. JT: Validation, Writing – review & editing.
Funding
The author(s) declare that financial support was received for the research and/or publication of this article. This work was supported by the Lianyungang Key Research and Development Program-Social Development (Project ID: SF2333); Lianyungang City “521 High-Level Talent Cultivation Project” Scientific Research Projects (LYG065212024023); National Natural Science Foundation of China (Project ID: 42306036); China Postdoctoral Science Foundation (Project ID:2023M731396); Lianyungang Postdoctoral Research Funding Program (Project ID: LYG20220011); Jiangsu Provincial Shuangchuang Doctor Program (Project ID: JSSCBS20230350); Undergraduate Innovation Trainning Program of Jiangsu Province (Project ID: 202411641054Y).
Acknowledgments
The authors gratefully acknowledge the United States Geological Survey (USGS), which has provided us with Landsat remote sensing images. We also extend our thanks to the Copernicus Climate Change Service for supplying the ERA5 reanalysis dataset, which has been integral to our meteorological analysis. Finally, we extend our heartfelt gratitude to the reviewers for their insightful comments and constructive suggestions, which have significantly enhanced the quality of this manuscript.
Conflict of interest
The authors declare that the research was conducted in the absence of any commercial or financial relationships that could be construed as a potential conflict of interest.
Generative AI statement
The author(s) declare that no Generative AI was used in the creation of this manuscript.
Publisher’s note
All claims expressed in this article are solely those of the authors and do not necessarily represent those of their affiliated organizations, or those of the publisher, the editors and the reviewers. Any product that may be evaluated in this article, or claim that may be made by its manufacturer, is not guaranteed or endorsed by the publisher.
Supplementary material
The Supplementary Material for this article can be found online at: https://www.frontiersin.org/articles/10.3389/fmars.2025.1529918/full#supplementary-material
Supplementary Figure 1 | The correlation between monthly averages of natural factors and area of laver aquaculture from 2000 to 2023. (A) 2-m Temperature; (B) Sea Surface Temperature; (C) Wind Speed; (D) Total Precipitation; (E) PAR.
Supplementary Table 1 | Policy document and score.
References
Ai B., Wang P., Yang Z., Tian Y., Liu D. (2023). Spatiotemporal dynamics analysis of aquaculture zones and its impact on green tide disaster in Haizhou Bay, China. Mar. Environ. Res. 183, 105825. doi: 10.1016/j.marenvres.2022.105825
Boyd C. E., D’Abramo L. R., Glencross B. D., Huyben D. C., Juarez L. M., Lockwood G. S., et al. (2020). Achieving sustainable aquaculture: Historical and current perspectives and future needs and challenges. J. World Aquacult. Soc. 51, 578–633. doi: 10.1111/jwas.12714
Bunting P. (2017). “Pre-processing of Remotely Sensed Imagery,” in The Roles of Remote Sensing in Nature Conservation: A Practical Guide and Case Studies, eds. Díaz-Delgado R., Lucas R., Hurford C.. (Cham, Switzerland: Springer), 39–63. doi: 10.1007/978-3-319-64332-8_3
Chen S. (2021). Spatiotemporal dynamics of mariculture area in Sansha Bay and its driving factors. Chin. J. Ecol. 40, 1137–1145. doi: 10.13292/j.1000-4890.202104.033
Chen N., Ying F., Wang J., Li J. (2021). Research on Land use information extraction based on U-Net. Remote Sens. Technol. Appl. 36, 285–292. doi: 10.11873/j.issn.1004-0323.2021.2.0285
Chen C., Zou Z., Sun W., Yang G., Song Y., Liu Z. (2024). Mapping the distribution and dynamics of coastal aquaculture ponds using Landsat time series data based on U2-Net deep learning model. Int. J. Digit. Earth 17, 2346258. doi: 10.1080/17538947.2024.2346258
Cheng Y., Sun Y., Peng L., He Y., Zha M. (2022). An improved retrieval method for Porphyra cultivation area based on suspended sediment concentration. Remote Sens. 14, 4338. doi: 10.3390/rs14174338
Cui B., Fei D., Shao G., Lu Y., Chu J. (2019). Extracting raft aquaculture areas from remote sensing images via an improved U-net with a PSE structure. Remote Sens. 11, 2053. doi: 10.3390/rs11172053
Cui B., Zhao Y., Yang M., Huang L., Lu Y. (2023). Reverse attention dual-stream network for extracting laver aquaculture areas from GF-1 remote sensing images. IEEE J. Select. Topics Appl. Earth Observ. Remote Sens 16, 5271–5283. doi: 10.1109/JSTARS.2023.3281823
Ding H., Yan X. (2019). Advances in Pyropia (formerly Porphyra) genetics and breeding. J. Fish. Sci. China 26, 592. doi: 10.3724/SP.J.1118.2019.19024
Gao L., Wang C., Liu K., Chen S., Dong G., Su H. (2022). Extraction of floating raft aquaculture areas from sentinel-1 SAR images by a dense residual U-Net model with pre-trained Resnet34 as the encoder. Remote Sens. 14, 3003. doi: 10.3390/rs14133003
Han M., Wu H., Chen Z., Li M., Zhang X. (2023). A survey of multi-label classification based on supervised and semi-supervised learning. Int. J. Mach. Learn. Cybernet. 14, 697–724. doi: 10.1007/s13042-022-01658-9
Hou Y., Liu Z., Zhang T., Li Y. (2021). C-UNet: Complement UNet for remote sensing road extraction. Sensors 21, 2153. doi: 10.3390/s21062153
Hou T., Sun W., Chen C., Yang G., Meng X., Peng J. (2022). Marine floating raft aquaculture extraction of hyperspectral remote sensing images based decision tree algorithm. Int. J. Appl. Earth Observ. Geoinform. 111, 102846. doi: 10.1016/j.jag.2022.102846
Hu J., Huang M., Yu H., Li Q. (2022). Research on extraction method of offshore aquaculture area based on Sentinel-2 remote sensing imagery. Mar. Environ. Sci. 41, 619–627. doi: 10.12111/j.mes.2021-x-160
Ibtehaz N., Rahman M. S. (2020). MultiResUNet: Rethinking the U-Net architecture for multimodal biomedical image segmentation. Neural Networks 121, 74–87. doi: 10.1016/j.neunet.2019.08.025
Kim D.-H. (2013). The relationship between climatic and oceanographic factors and laver aquaculture production. J. Fish. Business Admin. 44, 77–84. doi: 10.12939/FBA.2013.44.3.077
Li Y., Wang Q., Li X., Zhang X., Zhang Y., Chen A., et al. (2017). Unsupervised detection of acoustic events using information bottleneck principle. Digit. Signal Process. 63, 123–134. doi: 10.1016/j.dsp.2016.12.012
Lian X., Zhu G., Yang W., Zhu M., Xu H. (2020). Effect of heavy rainfall on nitrogen and phosphorus concentrations in rivers at river-net plain. Environ. Sci. 41, 4970–4980. doi: 10.13227/j.hjkx.202003183
Lin H., Lu X., Wang X., He S., Li S., Zheng W., et al. (2021). Research on spatial expansion mode of laver farming area in Jiangsu province. Mar. Sci. Bull. 40, 206–216. doi: 10.11840/j.issn.1001-6392.2021.02.010
Liu Z., Cao Y., Wang Y., Wang W. (2019). Computer vision-based concrete crack detection using U-net fully convolutional networks. Autom. Construct. 104, 129–139. doi: 10.1016/j.autcon.2019.04.005
Lu X., Gu Y., Wang X., Lin Y., Zhao Q., Wang K., et al. (2018). The identification of Porphyra culture area by remote sensing and spatial distribution change and driving factors analysis. Mar. Sci. 42, 87–96. doi: 10.11759/hykx20180401001
Lu Y., Li Q., Xin D., Hongyan W., Jilei L. (2015). A method of coastal aquaculture area automatic extraction with high spatial resolution images. Remote Sens. Technol. Appl. 30, 486–494. doi: 10.11873/j.issn.1004-0323.2015.3.0486
Lu Y., Shao W., Sun J. (2021). Extraction of offshore aquaculture areas from medium-resolution remote sensing images based on deep learning. Remote Sens. 13, 3854. doi: 10.3390/rs13193854
Ma Y., Zhao D., Wang R., Su W. (2010). Offshore aquatic farming areas extraction method based on ASTER data. Trans. Chin. Soc. Agric. Eng. 26, 120–124. doi: 10.3969/j.issn.1002-6819.2010.z2.023
Mulliqi N., Yildirim S., Mohammed A., Ahmedi L., Wang H., Elezaj O., et al. (2020). “The importance of skip connections in encoder-decoder architectures for colorectal polyp detection,” in 2020 IEEE international conference on image processing (ICIP). (Abu Dhabi, United Arab Emirates), 380–384. doi: 10.1109/ICIP40778.2020.9191310
Nguyen H. D., Wenresti G. G., Nitin K. T., Truong H. M. (2013). Cobia cage culture distribution mapping and carrying capacity assessment in Phu Quoc, Kien Giang province. J. Vietnam. Environ. 4, 12–19. doi: 10.13141/jve.vol4.no1.pp12-19
Olofsson P., Foody G. M., Herold M., Stehman S. V., Woodcock C. E., Wulder M. A. (2014). Good practices for estimating area and assessing accuracy of land change. Remote Sens. Environ. 148, 42–57. doi: 10.1016/j.rse.2014.02.015
Pan X., Jiang T., Zhang Z., Sui B., Liu C., Zhang L. (2020). A new method for extracting laver culture carriers based on inaccurate supervised classification with FCN-CRF. J. Mar. Sci. Eng. 8, 274. doi: 10.3390/jmse8040274
Qin P., Cai Y., Wang X. (2021). Small waterbody extraction with improved U-Net using Zhuhai-1 hyperspectral remote sensing images. IEEE Geosci. Remote Sens. Lett. 19, 1–5. doi: 10.1109/LGRS.2020.3047918
Ren X., Liu Y., Xu B., Zhang C., Ren Y., Cheng Y., et al. (2020). Ecosystem structure in the Haizhou Bay and adjacent waters based on Ecopath model. Mar. Sci. 42, 101–109. doi: 10.3969/j.issn.0253-4193.2020.06.012
Ronneberger O., Fischer P., Brox T. (2015). “U-net: convolutional networks for biomedical image segmentation,” in International Conference on Medical Image Computing and Computer-Assisted Intervention (MICCAI), eds. Navab N., Hornegger J., Wells W., Frangi A. (Cham, Switzerland: Springer) 234–241. doi: 10.1007/978-3-319-24574-4_28
Su J., Fan W., Wang F. (2020). Correlation analysis of spatial distribution change and driving factors of laver cultivation in Haizhou bay. China Agric. Inf. 32, 22–31. doi: 10.12105/j.issn.1672-0423.20200603
Su Z., Li W., Ma Z., Gao R. (2022b). An improved U-Net method for the semantic segmentation of remote sensing images. Appl. Intell. 52, 3276–3288. doi: 10.1007/s10489-021-02542-9
Su H., Wei S., Qiu J., Wu W. (2022a). RaftNet: A new deep neural network for coastal raft aquaculture extraction from Landsat 8 OLI data. Remote Sens. 14, 4587. doi: 10.3390/rs14184587
Sun L., Wang J., Zhang H., Xu M. (2020). Characteristics and mechanism of the environmental capacity changes in Haizhou bay, Northern Jiangsu, China from 2006 to 2016. Water 12, 2990. doi: 10.3390/w12112990
Tang Z., Cao Y., Jiang Q. (2025). Spatial and temporal changes of water environmental factors and water quality assessment in coastal waters of Jiangsu Province. J. Sea Res. 102570. doi: 10.1016/j.seares.2025.102570
Tang J., Li X., Zhang G., Lu W., Ni S., Zhang H., et al. (2022). Research progress of mechanized harvesting equipment and technology of laver. Fish. Modern. 49, 1–9. doi: 10.3969/i.issn.1007-9580.2022.03.001
Wang T., Li Y., Xie B., Zhang H., Zhang S. (2017). Ecosystem development of Haizhou Bay ecological restoration area from 2003 to 2013. J. Ocean Univ. China 16, 1126–1132. doi: 10.1007/s11802-017-3321-9
Wang X., Liu J., Xing Q., Chen Y. (2021). Monitoring of Porphyra cultivation dynamics in Lianyungang based on coastal zone imager. Mar. Sci. 45, 9–17. doi: 10.11759/hykx20200831003
Wei Z., Xing Q., Guo R., Li L. (2018). Study on the spatial distribution variation of Porphyra aquaculture in the southern Yellow Sea during the period 2000–2015 retrieved by satellite remote sensing. J. Ocean Technol. 37, 17–22. doi: 10.3969/i.issn.1003-2029.2018.04.003
Wu R. (2023). Cropland recognition in southern hilly areas under a hybrid U-Net model. Bull. Survey. Mapp. 12), 57–62. doi: 10.13474/j.cnki.11-2246.2023.0359
Wu Y., Zhang J., Tian G., Cai D., Liu S. (2006). A survey to aquiculture with remote sensing technology in Hainan Province. Chin. J. Trop. Crops 27, 108–111. doi: 10.1016/j.ejps.2006.05.004
Xue Z., Su F., Sun X., Gao Y. (2010). “Research for extraction of aquaculture water information in coastal zone using CBERS-02B data based on object-oriented technique,” in 2010 International Conference on Innovative Computing and Communication and 2010 Asia-Pacific Conference on Information Technology and Ocean Engineering. (Macao, China: IEEE), 17–19. doi: 10.1109/CICC-ITOE.2010.11
Xue M., Wu M., Zheng L., Liu J., Liu L., Zhu S., et al. (2023). Multi-factors synthetically contribute to ulva prolifera outbreaks in the south yellow sea of China. Remote Sens. 15, 5151. doi: 10.3390/rs15215151
Yang S., Xu Y. (2024). Research on the path to enhance international competitiveness of Jiangsu laver industry. J. Aquacult. 45, 60–62. doi: 10.3969/j.issn.1004-2091.2024.02.016
Ying Z., Wu J., Del Valle T. M., Yang W. (2020). Spatiotemporal dynamics of coastal aquaculture and driving force analysis in Southeastern China. Ecosys. Health Sustainabil. 6, 1851145. doi: 10.1080/20964129.2020.1851145
Zhang X., Ma S., Su C., Shang Y., Wang T., Yin J. (2020a). Coastal oyster aquaculture area extraction and nutrient loading estimation using a GF-2 satellite image. IEEE J. Select. Topics Appl. Earth Observ. Remote Sens. 13, 4934–4946. doi: 10.1109/JSTARS.2020.3016823
Zhang K., Su H., Dou Y. (2021). A new multi-classification task accuracy evaluation method based on confusion matrix. Comput. Eng. Sci. 43, 1910–1919. doi: 10.3969/j.issn.1007-130X.2021.11.002
Zhang Z., Wu C., Coleman S., Kerr D. (2020b). DENSE-INception U-net for medical image segmentation. Comput. Methods progr. biomed. 192, 105395. doi: 10.1016/j.cmpb.2020.105395
Zheng Y., Wu J., Wang A., Chen J. (2018). Object-and pixel-based classifications of macroalgae farming area with high spatial resolution imagery. Geocarto Int. 33, 1048–1063. doi: 10.1080/10106049.2017.1333531
Keywords: U-net model, remote sensing, Landsat, Haizhou Bay, laver aquaculture, economicsocial-policy
Citation: Li X, He H, Wu L, Qiao W, Liu C, Fu C, Li W and Tang J (2025) Spatiotemporal dynamics and multidimensional drivers of laver aquaculture in Haizhou Bay: insights from U-net-based remote sensing monitoring. Front. Mar. Sci. 12:1529918. doi: 10.3389/fmars.2025.1529918
Received: 18 November 2024; Accepted: 17 March 2025;
Published: 28 March 2025.
Edited by:
Yngvar Olsen, Norwegian University of Science and Technology, NorwayReviewed by:
Shengjie Ren, Queensland University of Technology, AustraliaFelipe-Omar Tapia-Silva, Autonomous Metropolitan University, Mexico
Copyright © 2025 Li, He, Wu, Qiao, Liu, Fu, Li and Tang. This is an open-access article distributed under the terms of the Creative Commons Attribution License (CC BY). The use, distribution or reproduction in other forums is permitted, provided the original author(s) and the copyright owner(s) are credited and that the original publication in this journal is cited, in accordance with accepted academic practice. No use, distribution or reproduction is permitted which does not comply with these terms.
*Correspondence: Wenli Qiao, cWlhb3dsQGpvdS5lZHUuY24=
 Xue Li
 Haihong He
 Lizhen Wu
 Wenli Qiao
 Chunli Liu
 Congju Fu
 Wenjing Li5