 Yan Song
 Maotian Li1*
 Weihua Li
 Yan Liu
 Jing Chen
94% of researchers rate our articles as excellent or good
Learn more about the work of our research integrity team to safeguard the quality of each article we publish.
Find out more
ORIGINAL RESEARCH article
Front. Mar. Sci. , 03 March 2025
Sec. Coastal Ocean Processes
Volume 12 - 2025 | https://doi.org/10.3389/fmars.2025.1529744
The high primary productivity zone (HPPZ) of estuaries is known for its flourishing fisheries and active interactions with coastal and oceanic ecosystems. However, the spatiotemporal patterns and underlying mechanisms that regulate the HPPZ remain unclear, especially in the face of drastic changes in riverine inputs. Using 40 years of in situ monitoring data along the Yangtze River estuary, the spatiotemporal evolution of the HPPZ regulated by basin-estuarine-offshore flux fluctuations has been reconstructed for the past and conclusions drawn for future developments. Moreover, the biological processes that influence the formation of the HPPZ were explored within the context of estuarine filtration and buffering effects. The obtained dataset includes chlorophyll a (Chl-a) concentrations and multiple environmental factors. The results displayed that the HPPZ is characterized by a high annual average Chl-a concentration of 3.6 ± 2.4 μg/L, which is driven by sufficient light and nutrient availability that promote phytoplankton blooms. In contrast, the inner high turbidity zone exhibits an average annual Chl-a concentration of 1.0 ± 0.7 μg/L, primarily due to limited light availability inhibiting phytoplankton growth. Meanwhile, the outer lower nutrient zone, with an average annual Chl-a concentration of 0.9 ± 1.1 μg/L, results from nutrient deficiencies that limit phytoplankton growth. Notably, the synergistic effect of sediment declines and eutrophication has resulted in a 6.5 μg/L increment of the HPPZ’s annual Chl-a concentration and a 3628 km² expansion of its area extent over 40 years. This significant change is attributed to the increase in water transparency resulting from a reduction in sediment transported from the watershed to the sea, along with an increase in riverine nitrogen and phosphorus discharge. A future projection, based on the historical total suspended matter and nutrients over the past 40 years, suggests that annual Chl-a concentration in the HPPZ will reach 10.5 μg/L, and the area is projected to increase to 7,904 km² by 2050. This study presents the first quantification of Chl-a concentrations and spatial range of the HPPZ in the estuary, focusing on the interaction between riverine and oceanic materials. These findings offer a deeper understanding of managing ecological risks in large estuaries.
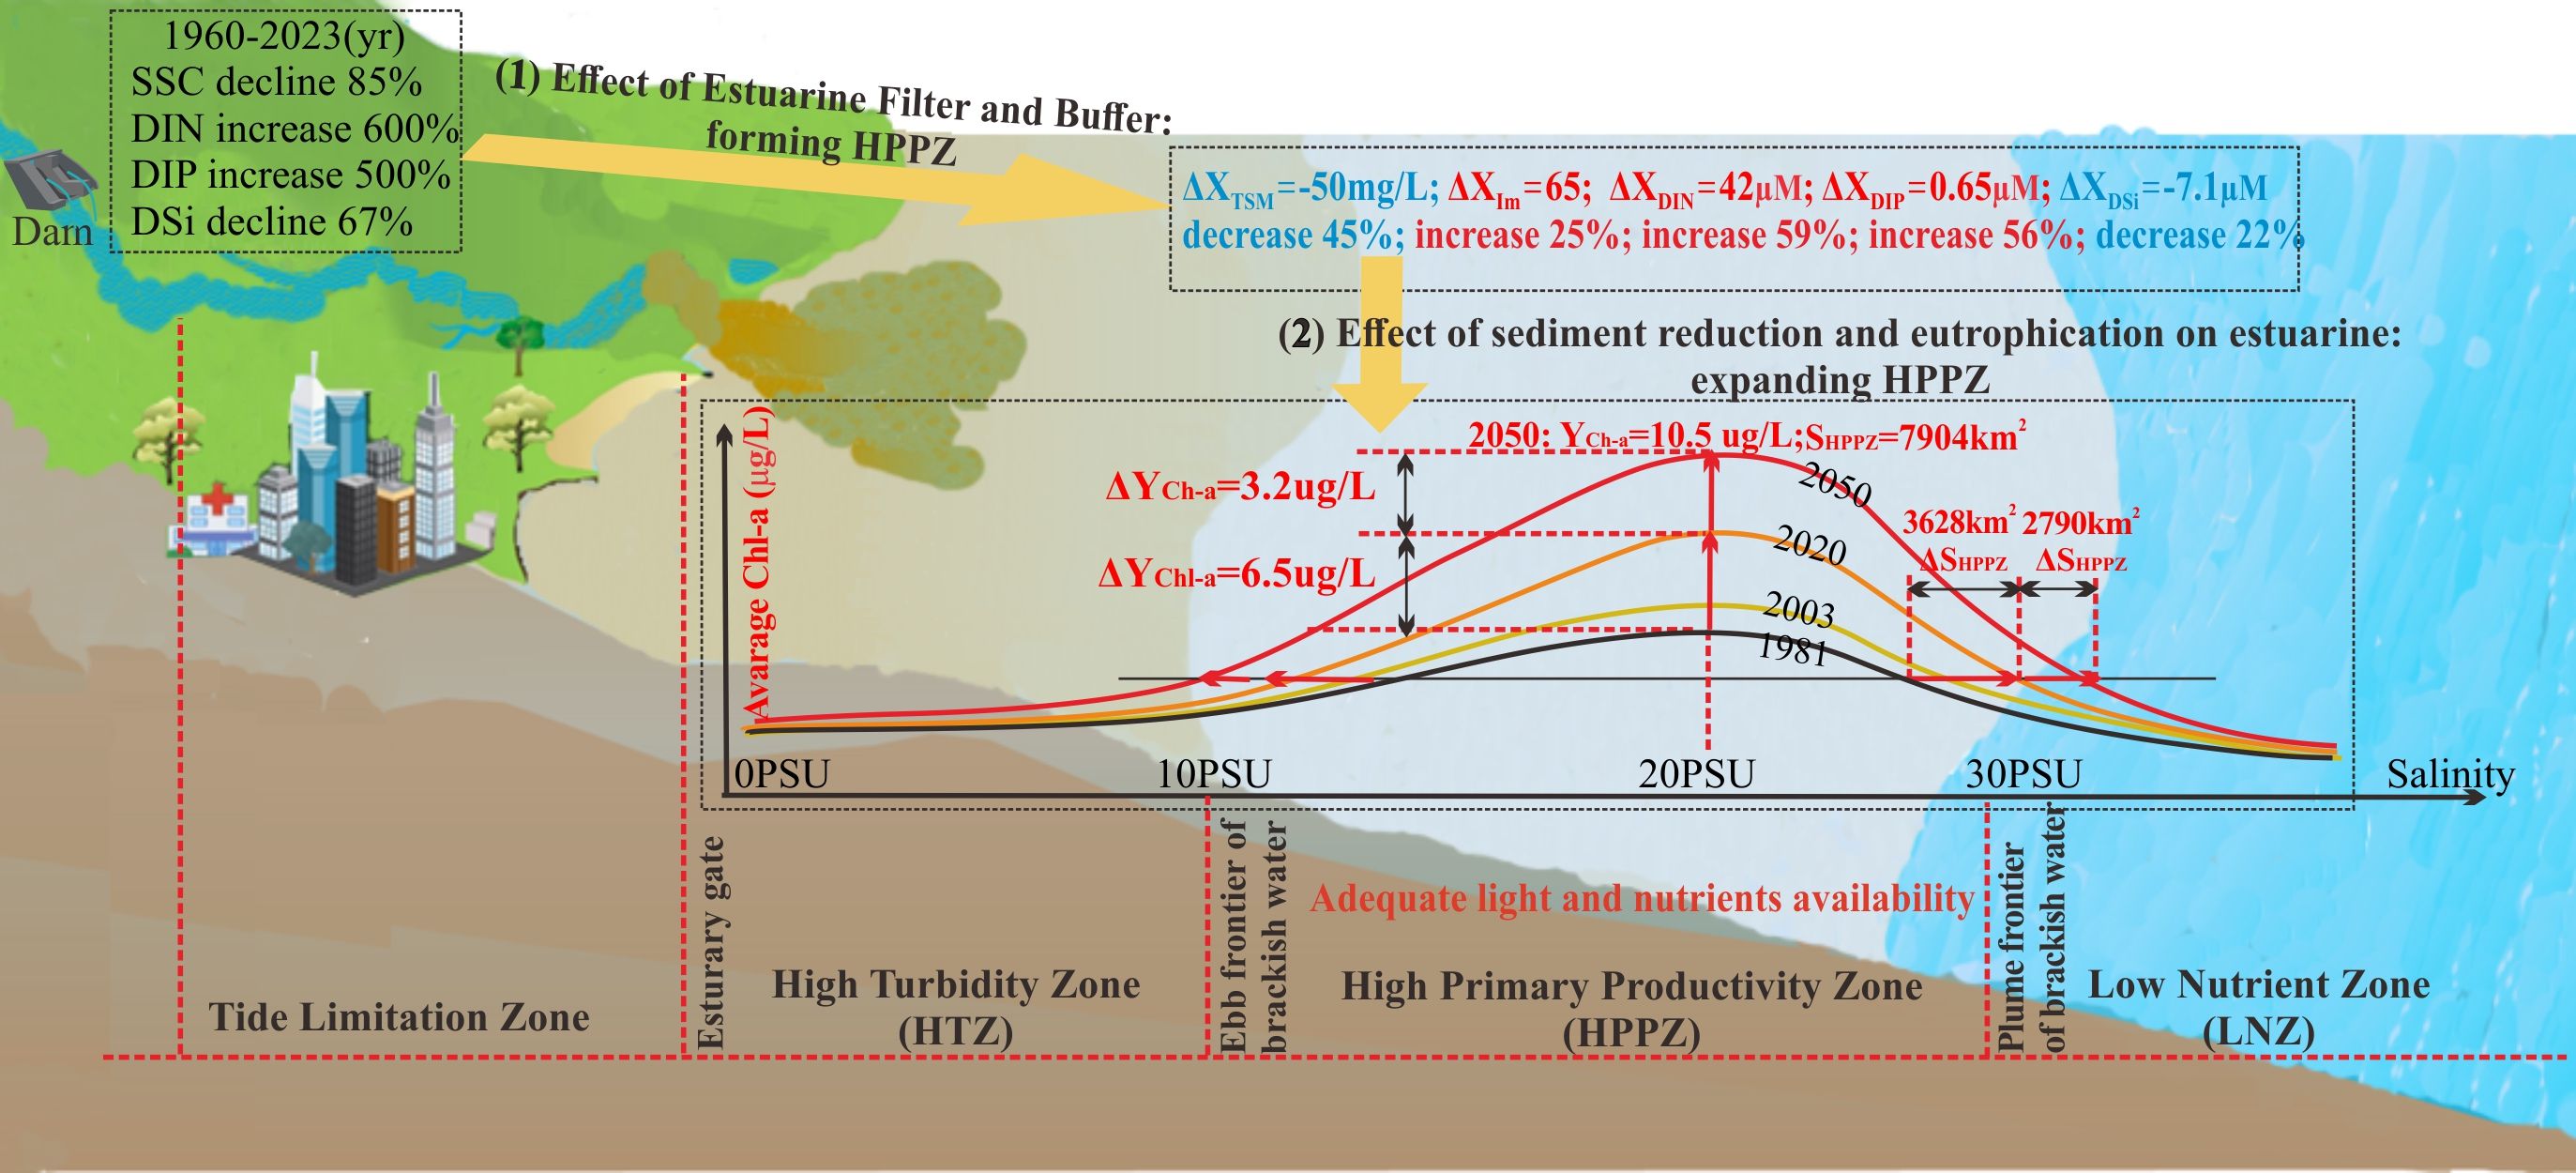
Graphical Abstract.
Marine primary productivity serves as the basis of marine ecosystem food chains, reflecting the ability of marine phytoplankton to produce organic matter through photosynthesis (Chassot et al., 2010). It is also a crucial component in the assessment of fisheries resources and global carbon cycling (Chassot et al., 2010). The estuarine region is an essential area of high primary productivity zone (HPPZ) in the ocean, primarily due to the nutrient-rich freshwater inflow from rivers supporting estuarine phytoplankton blooms (Beman et al., 2005). Although estuarine HPPZ covers only 7% of the global ocean area, it contributes 30% of primary productivity (Van Meter et al., 2018). The Yangtze River is the world’s third-largest river in terms of water discharge, with a basin population of 459 million (http://www.cjw.gov.cn/zjzx/lypgk/zjly/). However, in recent decades, intensive human activities (e.g., such as dam construction and pollution discharge) have influenced the natural transport of riverine materials. This has altered input patterns to the sea, leading to coastal eutrophication and changes in primary productivity (Song et al., 2023; Wang et al., 2021). Consequently, investigating the spatiotemporal regulation mechanisms of HPPZ in the Yangtze River estuary and its response patterns to future environmental changes is crucial, as it supports the guidance on ecosystem health and sustainable development.
A positive relation has been reported between the intensity of human activities in estuaries and marine primary productivity (Douglas et al., 2022; Sun et al., 2019). These activities include water conservancy projects, land use changes, pollution emissions, etc., which indirectly or directly affect the production capacity of marine ecosystems by altering marine environmental conditions, especially nutrient conditions (Burford and Faggotter, 2021). Although the previous works provide a qualitative understanding of the relationship between HPPZ and environmental factors, further development of precise quantitative models is urgently needed to thoroughly reveal the effects of material fluxes on the spatiotemporal changes of estuarine HPPZ. Quantitative modeling of the mechanisms driving spatial and temporal changes in the HPPZ remain challenging due to an insufficient understanding of the complex causal relationships between the HPPZ and environmental factors. This is because such causal relationships are usually non-linear and vary by location (Murrell et al., 2007; Mungenge et al., 2023). Moreover, the multiple covariates of environmental factors contributing to HPPZ variations further constrain the quantification process (Xiao et al., 2019).
Long-term, large-scale in situ field measurements are indispensable for establishing a dynamic eco-model of temporal and spatial variations in estuarine HPPZ. However, previous works have typically explored the effects of seasonal variation by sampling and monitoring changes in temperature, runoff, and nutrient concentrations during specific months only (Kimmerer et al., 2012; Widianingsih et al., 2023; Woodland et al., 2015). Some research also focuses on natural patterns such as tidal cycles and diurnal light variations, as well as extreme events like floods or droughts that can alter HPPZ (Burford et al., 2012; Canion et al., 2013; Frankenbach et al., 2020). However, Chl-a concentration samples collected monthly or quarterly may not adequately capture the characteristics of long-term changes in the HPPZ. Furthermore, previous researches on the primary productivity of the Yangtze River estuary have primarily lacked a comprehensive and systematic study of the regulatory mechanisms and responses from the perspective of land-sea integration. These limitations hinder the ability to accurately reconstruct the historical impact of the watershed environment on the intensity and extent of HPPZ in the estuary and adjacent marine.
Insights into the spatiotemporal response mechanism of the estuarine HPPZ to watershed environmental changes should not remain the final step. Currently, the ongoing expansion of the HPPZ area in coastal zones is coupled with persistent challenges, including eutrophication and red tide outbreaks, largely attributable to substantial alterations in sediment and nutrient fluxes into the sea (Dai M. et al., 2023). Specifically, Chl-a concentrations in coastal waters are on the rise globally annually. From 2003 to 2020, the impact area and frequency of algal blooms in global coastal waters demonstrated a significant overall increase, rising by 13.2% and 59.2%, respectively (Dai Y. et al., 2023). Due to the lack of a dynamic model tracing the HPPZ affected by environmental factors, it is difficult to make accurate predictions of HPPZ development based on environmental changes on interannual or decadal scales. Therefore, based on a comprehensive understanding of the spatiotemporal regulatory mechanism of HPPZ, further construction of a monitoring and early warning model for marine productivity is necessary to achieve precise predictions of changes in the HPPZ intensity and extent.
It is assumed in this study that the spatiotemporal patterns of HPPZ regulation are constrained by the availability of suspended sediment and nutrients. To verify this hypothesis, the Yangtze River basin-estuary-offshore was selected as a representative area, and summer phytoplankton Chl-a concentration was used as a bioindicator of estuarine HPPZ. Additionally, environmental indicators were collected for the summers over the past 40 years, including total suspended matter (TSM) concentrations, sea surface salinity (SSS), dissolved inorganic nitrogen (DIN), dissolved inorganic phosphorus (DIP), and dissolved silicon (DSi). All the databases were integrated to reveal the spatial and temporal patterns of primary productivity in the Yangtze River estuary and its adjacent marine areas in the past and future and also elucidate the impact of human activities. The findings will serve as a valuable reference for addressing ecological issues in estuarine environments.
The Yangtze River is the longest in Asia, with a length of approximately 6,400 kilometers (Figure 1A). The Yangtze River basin included 264 large reservoirs (capacity exceeding 100 million m3) in 2020 (Figure 1B), with a total capacity equivalent to 27.78% of the average annual runoff of the Yangtze River (Liu et al., 2022). The Yangtze River estuary (121°E–124.5°E, 29.5°N–33°N), adjacent to the East China Sea (Figure 1C), is the third largest estuary in the world. Due to the nutrients carried by the significant runoff and sediment from the Yangtze River into the sea, the complex flow system, and the distinctive topography, a zone of high primary productivity has been formed in the estuary.
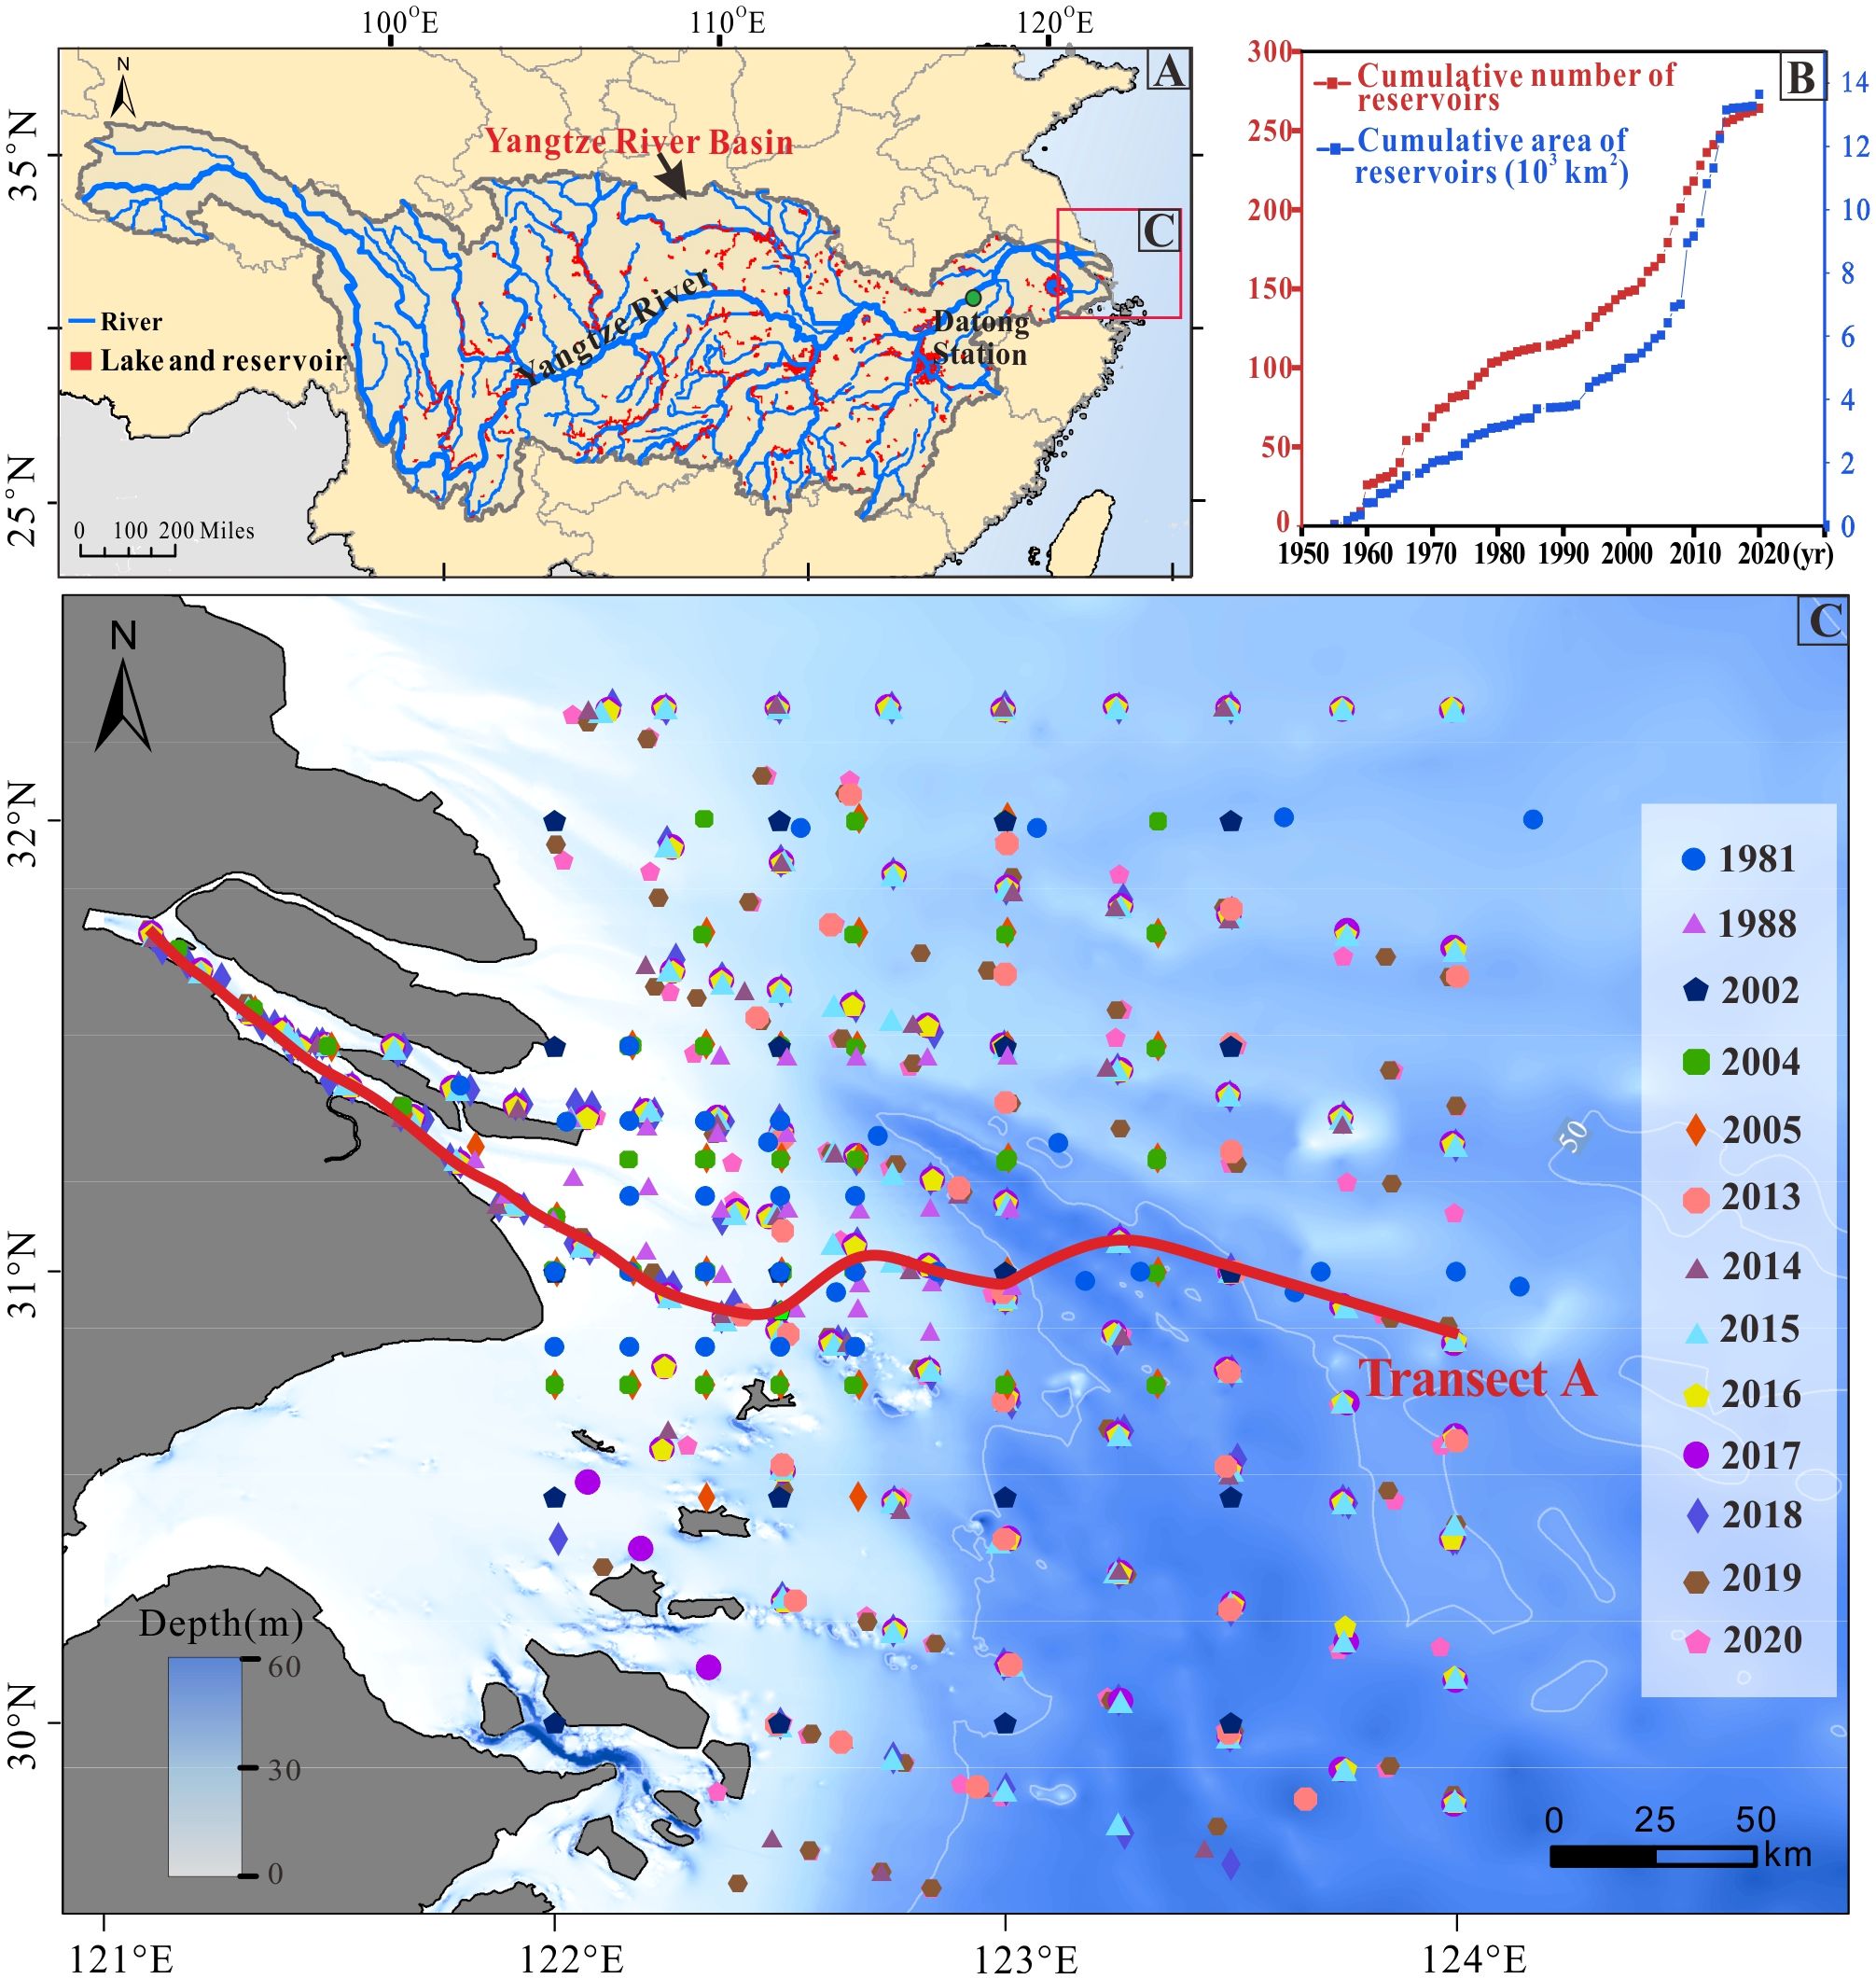
Figure 1. Study area and monitoring sites. (A) Distribution of rivers, lakes, and reservoirs in the Yangtze River basin; (B) Yearly cumulative changes in the number and area of reservoirs in the Yangtze River basin; (C) Distribution of annual cruise survey sites in the Yangtze River estuary (1981–2020), with data for 13 years (note: the number of cruise survey stations for each year is shown in parentheses in the legend). Transect A, marked by a red line, extends from the estuary channel to the shelf.
To explore the effect of nutrients and sediment flux into the sea on the HPPZ of estuarine, field cruise in situ survey data from the Yangtze River estuary for the period 1980–2020 were analyzed. The dataset consists of a total of 649 station series from 13 summers (Figure 1C; Supplementary Table S1), including Chl-a concentration (indicative of the HPPZ) and five environmental factors: DIN, DIP, DSi, SSS, and TSM. Besides, two apparent optical properties of a water body were calculated in the study; light attenuation coefficient (Kd) and light attenuation (Im). The detailed testing and calculation methods for these indicators are outlined in Supplementary Text S1.
The Datong hydrological station is the final runoff control station located in the lower reaches of the Yangtze River (Figure 1A), approximately 640 kilometers away from the entrance to the sea. The upstream watershed monitored by this station encompasses an area of 170,500 km2, representing around 95% of the total Yangtze River watershed area (Zuo et al., 2022). The annual flux data into the sea, including Suspended Sediment Concentration (SSC), DIN, DIP, and DSi, from 1960 to 2020 were collected from the Datong hydrometric station (http://www.cjw.gov.cn/zwzc/zjgb/), the State Key Laboratory of Estuarine and Coastal Research, and related research papers (Gao et al., 2012; Song et al., 2023; Wu et al., 2018).
Chl-a, the primary photosynthetic pigment found in phytoplankton, is commonly used as a reliable indicator to assess the level of primary productivity in aquatic environments due to its well-established and straightforward measurement methods (Vörös and Padisák, 1991). The HPPZ is defined by distinct inflection points or boundaries on the fitted curve relating Chl-a concentration to salinity (Figure 2).
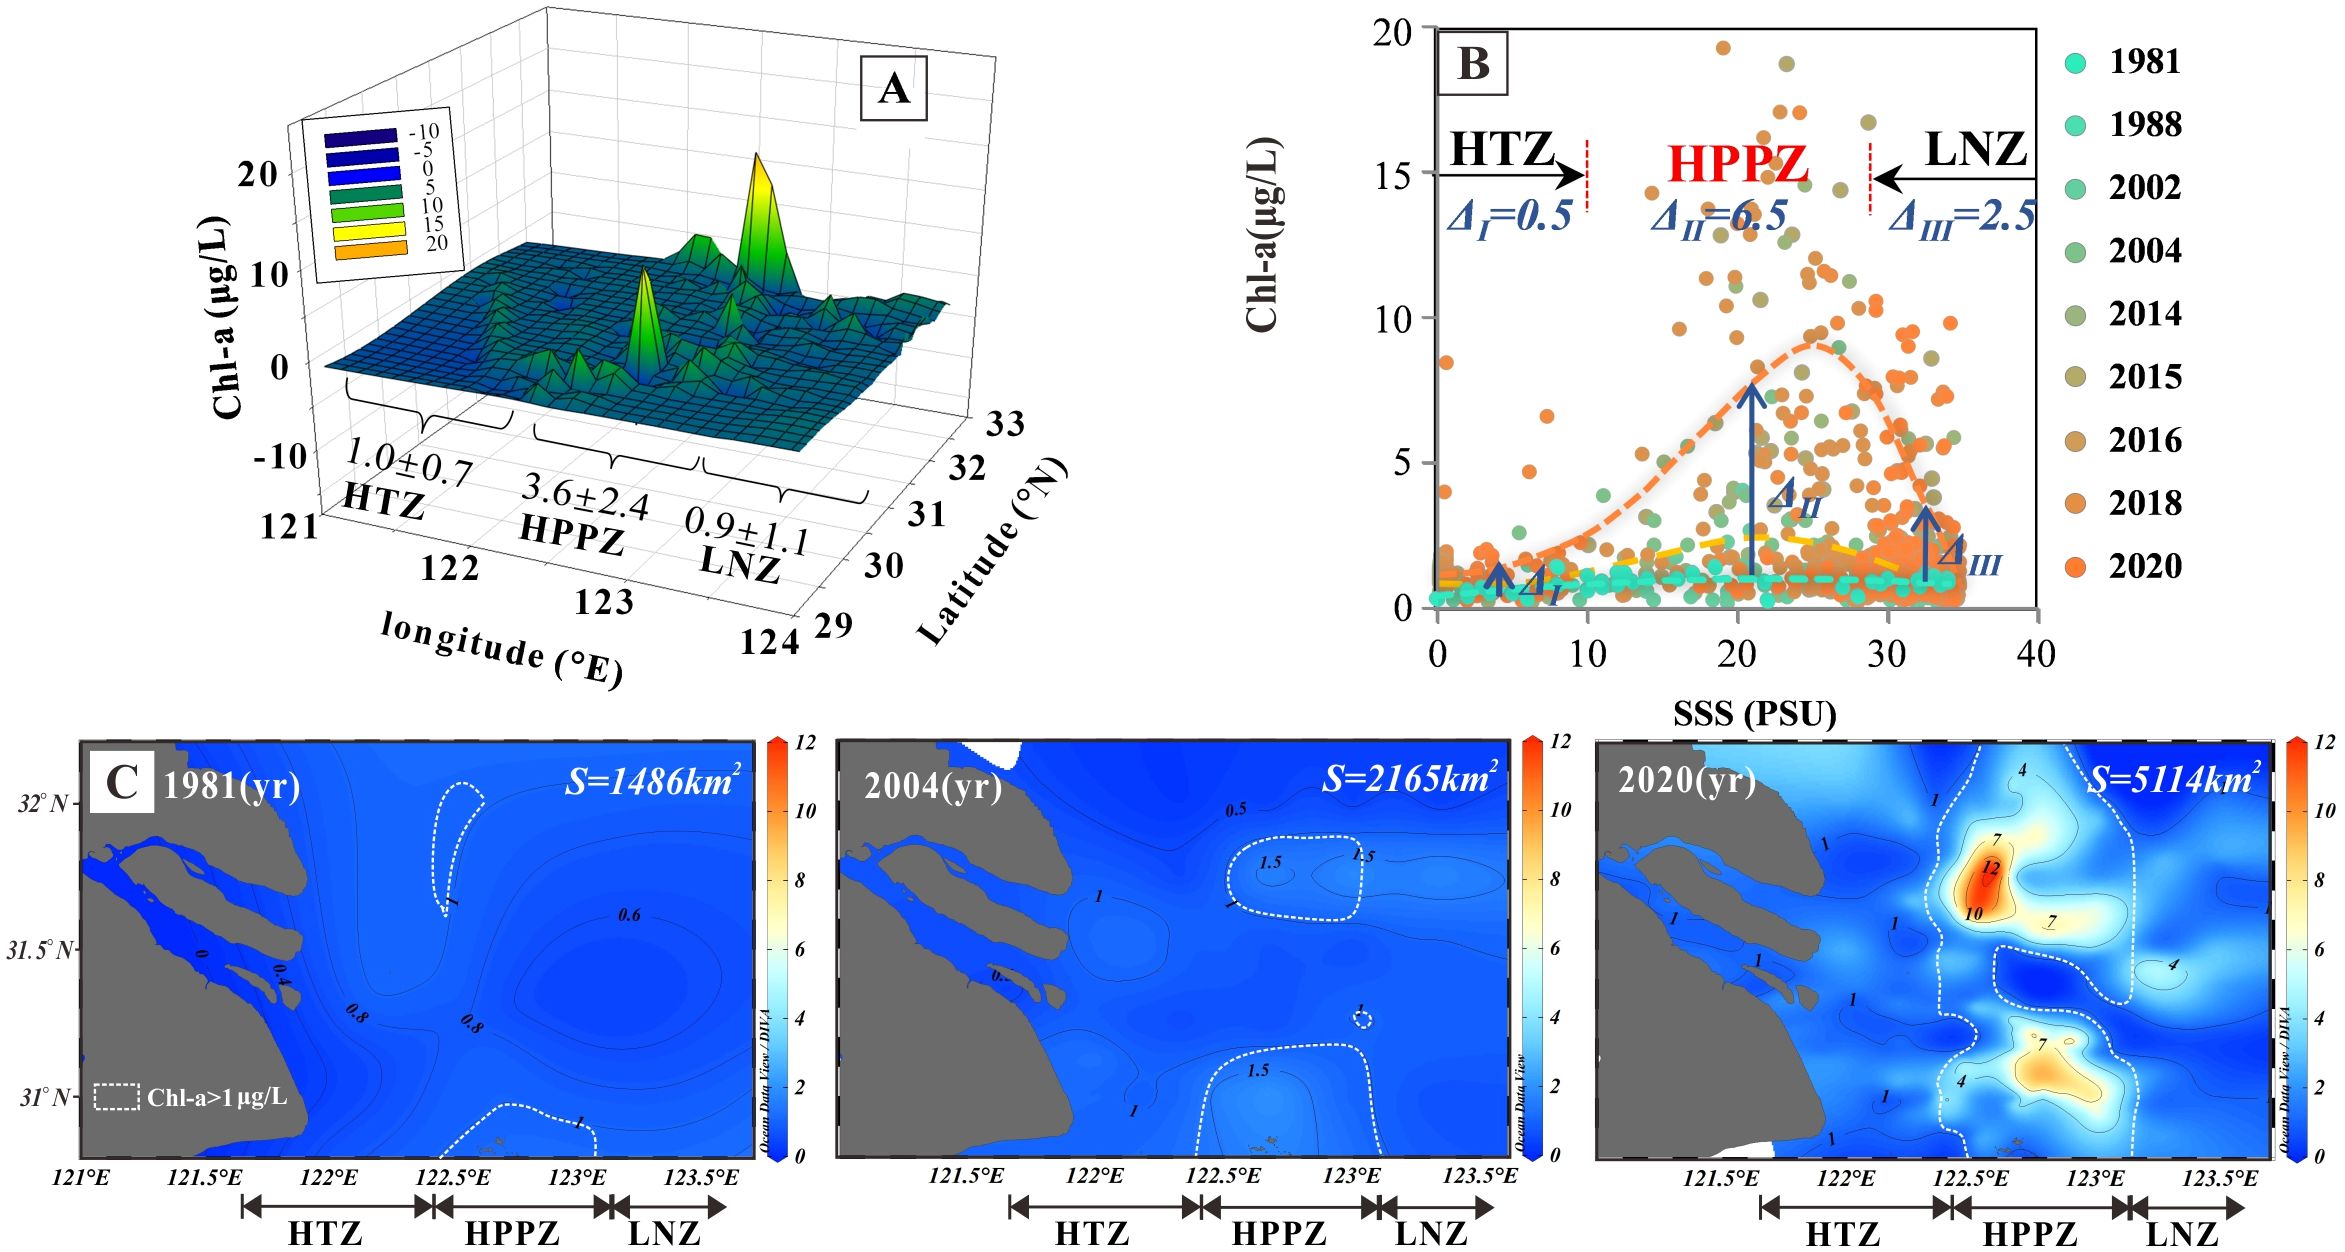
Figure 2. Spatial and temporal variations of Chl-a concentration in the Yangtze River estuary. (A) Spatial distribution of the average annual Chl-a concentration per grid over the last four decades. (B) Temporal evolution of annual Chl-a concentration for each salinity PSU interval from 1981 to 2020. Orange, yellow, and green dashed lines represent fitted lines for Chl-a in 2020, 2004, and 1981, respectively. Δ represents the difference between the average value of Chl-a concentration in 2020 and its value in 1981. (C) Spatial and temporal evolution of annual Chl-a concentrations per grid for 1981, 2004, and 2020. S indicates the area within the HPPZ where the Chl-a concentration exceeds 1 μg/L, as highlighted by the white lines in the figure.
The study gridded the entire area at a 0.05° × 0.05° resolution in both longitude and latitude directions. The data from each cruise were interpolated onto the grid using weighted-average gridding. The multi-year average of all parameters at each grid point was then calculated by averaging the data from all cruises that shared the same grid points, and the distribution pattern was then visualized using Ocean Data View software. The total area of the HPPZ was then calculated using the following formula:
Where Atotal is the total area of the HPPZ with Chl-a concentration greater than 1 μg/L, Ncells is the number of units which Chl-a concentration exceeds 1 μg/L, and Agrid is the actual area corresponding to each grid cell.
Previous studies on the concentration and distribution of Chl-a have primarily relied on remote sensing images due to the challenges of in situ observation in the field, and thus lack the calibration provided by long-term in situ monitoring (Chawla et al., 2020). In comparison, the present study is based on a large amount of field data. The relationships among nutrients, sediments, and Chl-a in the HPPZ were established to accurately replicate the complex real-world conditions.
In this study, to investigate the potential for future development of the HPPZ, we employed data from Transect A (Figure 1C) to construct a temporal model aimed at quantitatively assessing the impacts of changes in incoming material-controlled Chl-a concentrations and the spatial distribution of the HPPZ. The dataset was categorized into two groups based on a temporal cut-off point of 2003 for the data collected (Supplementary Figure S1). This cut-off was selected because 2003 marked the commencement of water storage in the Yangtze River basin due to the construction of the Three Gorges Dam, the largest hydropower project globally. The establishment of the Three Gorges Dam has profoundly affected environmental conditions in the Yangtze River estuary (Du et al., 2016; Li et al., 2012; Wang et al., 2017).
Principal component regression (PCR) analysis was employed to develop a predictive model for the evolution of HPPZ, considering the complexities associated with Chl-a growth dynamics in the estuary. Chl-a was designated the dependent variable to represent the HPPZ, while various environmental factors were treated as independent variables. The multicollinearity model was formulated as outlined in the following equations.
Where FChl-a represents the Chl-a concentration, while Fa and Fb are the principal components that significantly influence the variation of Chl-a concentration in HPPZ. Coefficients A and B correspond to the contributions of Fa and Fb to Chl-a, respectively, and C is a constant. ZXi indicates the standardized data for factor i, where xi denotes the original data for factor i, μi represents the mean of the original data for factor i, and σi signifies the standard deviation of the original data for factor i. Coefficients a through j represent the contributions of factors i to Fa or Fb.
The spatial distribution pattern of the HPPZ was investigated by analyzing cumulative Chl-a data obtained from field investigations conducted over the last four decades. The results indicate that the Chl-a concentration in the Yangtze River estuary during the summer exhibits a characteristic low-high-low gradient distribution. The Chl-a concentration increases progressively from the inner estuary towards the sea, reaching a peak in the middle region of the estuary before subsequently declining (Figure 2A). Analysis of the fitted curve relating Chl-a concentration to salinity reveals two distinct inflection points when Chl-a concentration reaches 1.0 µg/L. The first inflection point occurs at 122.5°E, corresponding to a salinity of approximately 10 PSU, which aligns closely with the ebb frontier of brackish water in the Yangtze River estuary. The second inflection point is found at 123.5°E, where salinity is around 30 PSU, indicative of plume fronter of brackish water (Figures 2A, B; Li et al., 2021). These inflection points (boundaries) reflect variations in salinity, nutrient concentration, and hydrodynamic characteristics of the water body resulting from the interaction between freshwater and seawater in the Yangtze River. Consequently, by integrating the distribution characteristics of Chl-a concentration along with variations in other environmental factors such as turbidity, salinity, and nutrient concentrations, the Yangtze River Estuary was delineated into three distinct ecological functional zones: the inner high turbidity zone (HTZ), the central high primary productivity zone (HPPZ), and the outer low-nutrient zone (LNZ).
HPPZ is the most biologically productive region for phytoplankton within the Yangtze River Estuary. The two boundaries of the HPPZ correspond to the boundary of brackish water at the ebb front and the boundary of brackish water at the Yangtze River plume front. It is situated between 122.5°E and 123.5°E, exhibiting a salinity range of 10 to 30 PSU (Figure 2). The average annual Chl-a concentrations in the inner HTZ (<10 PSU) and outer LNZ (>30 PSU) were 1.0 ± 0.7 μg/L and 0.9 ± 1.1 μg/L, respectively, while the HPPZ exhibited an average annual Chl-a concentration of 3.6 ± 2.4 μg/L (Figure 2; Table 1). This information provides critical evidence for a more detailed examination of the mechanisms underlying phytoplankton productivity characteristics.
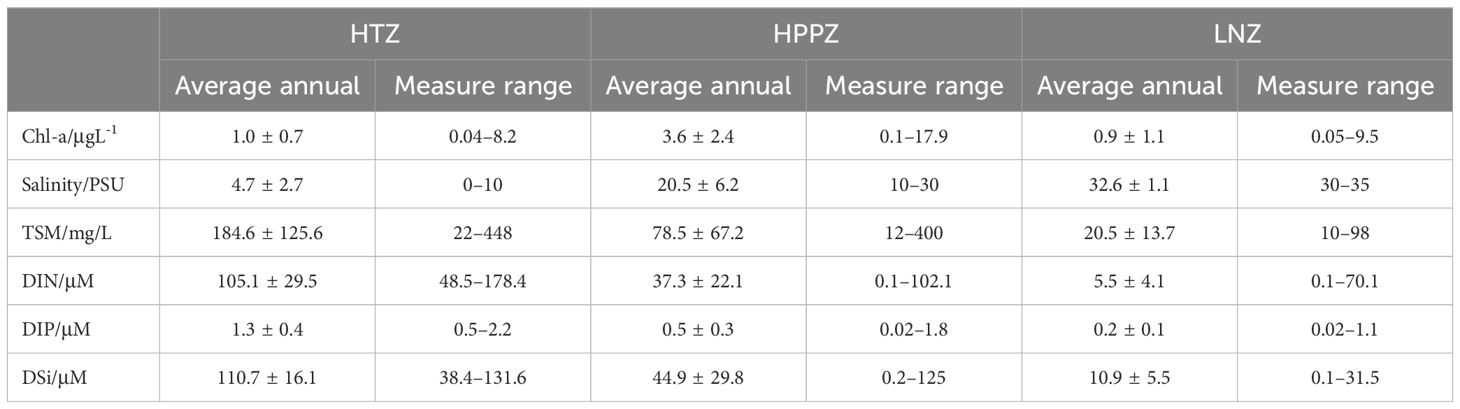
Table 1. Multi-year mean, standard deviations, and range of concentrations for Chl-a, salinity, TSM, DIN, DIP, and DSi in high turbidity zone (HTZ), high primary production zone (HPPZ), and low nutrients zone (LNZ) from 1981 to 2020.
The temporal evolution of HPPZ demonstrated a significant expansion over the past 40 years. The annual average concentration of Chl-a increased by 6.5 μg/L between 1981 and 2020 (P<0.001; Figure 2B). In addition, based on Equation 1, the area covered by Chl-a > 1 μg/L in the HPPZ was 1486, 2165, and 5114 km2 in years 1981, 2004 and 2020, respectively. This represents an increase of 679 km² from 1981 to 2004, and 3,628 km² from 1981 to 2020 (P<0.001; Figure 2C).
The spatial distribution of TSM, and nutrient concentrations in the 1980s and 2010s exhibited decreasing levels with increasing salinity from inner to the outer estuary (Figures 3A–K). The average annual TSM concentrations in the HTZ, HPPZ, and LNZ were 184.6 ± 125.6, 78.5 ± 67.2, and 20.5 ± 13.7 mg/L, respectively (Table 1). Influenced by TSM and Chl-a concentrations, the underwater light attenuation coefficient Kd showed an increasing trend and then slightly decreased from inner to the outer estuary (Figures 3C, H; Table 1). The highest nutrient concentrations were found in the HTZ, where the concentrations of DIN, DIP, and DSi were 105.1 ± 29.5, 1.3 ± 0.4, and 110.7 ± 16.1 μμ, respectively (Table 1). The HPPZ’s nutrient levels were moderate, with DIN, DIP, and DSi concentrations of 137.3 ± 22.1, 0.5 ± 0.3, and 44.9 ± 29.8 μM, respectively (Table 1). Conversely, the lowest nutrient concentrations were observed in LNZ, where salinity exceeded 30 PSU, with DIN, DIP, and DSi levels of 5.5 ± 4.1, 0.2 ± 0.1, and 10.9 ± 5.5 μM, respectively (Figures 3D–F; Table 1). Nutrient limitation criteria for phytoplankton growth were defined based on previous research (Justić et al., 1995; Harrison et al., 1977): absolute nitrogen limitation occurs when DIN<1 μM, absolute phosphorus limitation when DIP<0.1 μM, and absolute silicon limitation when DSi<2 μM. Relative nitrogen limitation is indicated by DIN/DIP<10 and DIN/DSi<1; relative phosphorus limitation by DIN/DIP>22 and DSi/DIP>22; and relative silicon limitation by DSi/DIN<1 and DSi/DIP<10. In this study, the ratios of DIN, DIP, and DSi were calculated at each sampling point to assess nutrient limitations in the surface seawater of the LNZ from 1980 to 2020 based on the above thresholds. The results showed that 10% of the sampling points exhibited absolute nitrogen limitation, 50% exhibited absolute phosphorus limitation, and 16% exhibited absolute silicon limitation. Additionally, 80% of sites showed relative phosphorus limitation, while 10% exhibited relative silicon limitation.
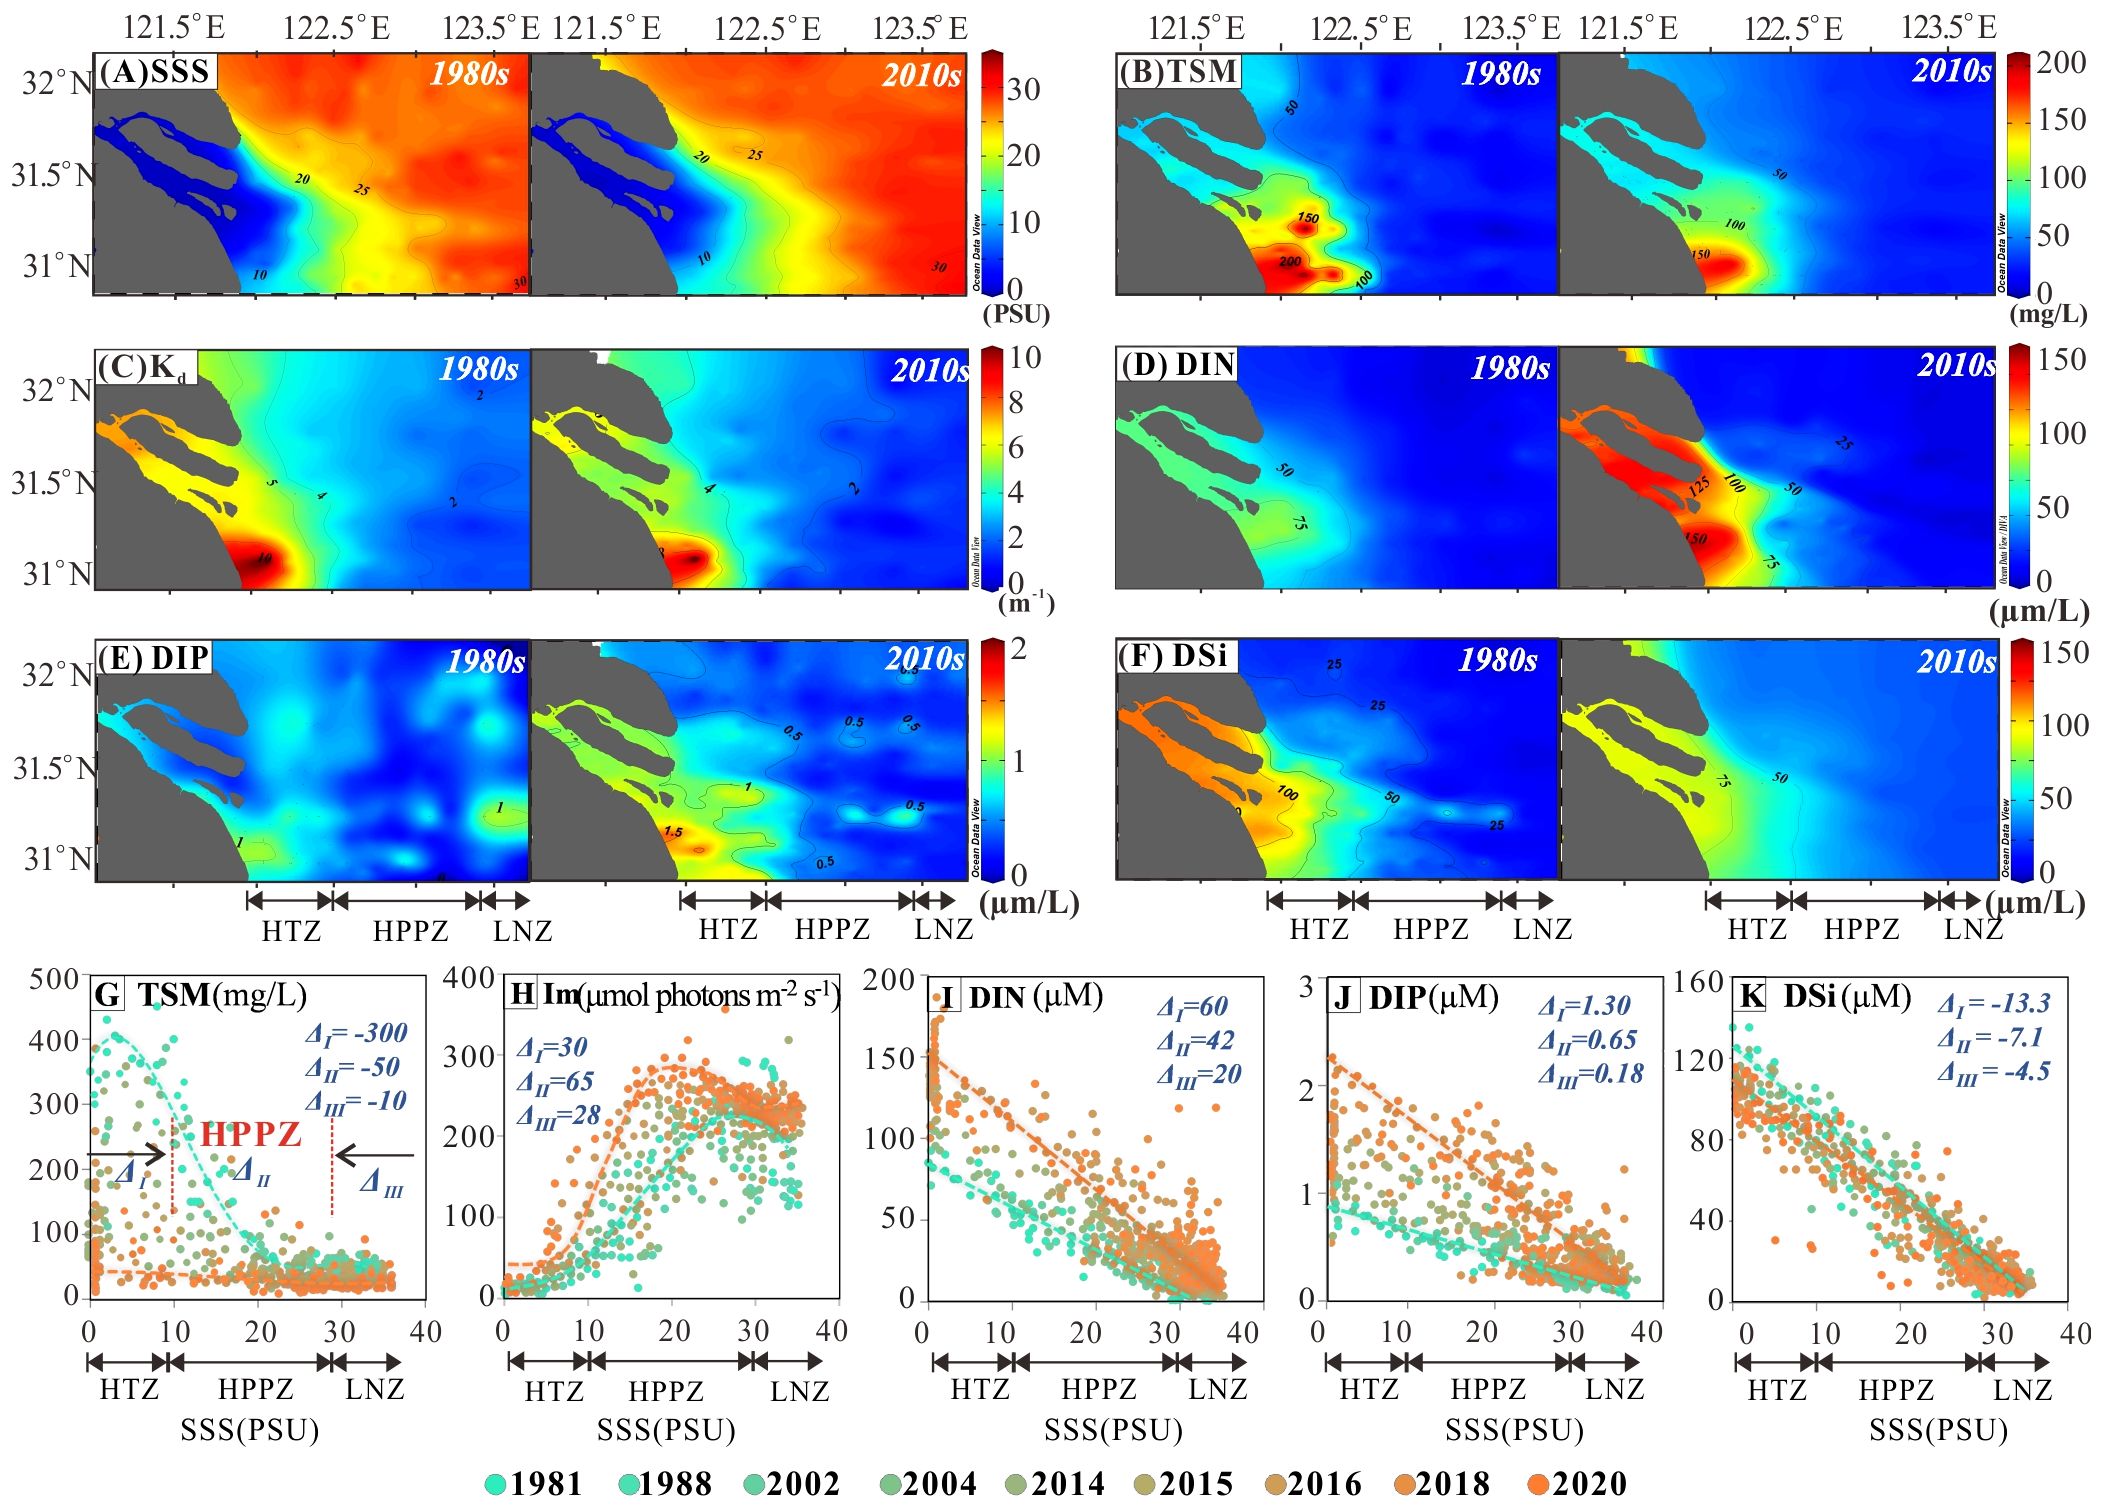
Figure 3. Evolution of environmental factors in the Yangtze Estuary in summer from 1980 to 2020. (A–F) A comparison of the spatial distribution of SSS, TSM, Kd, DIN, DIP, and DSi in the 1980s and 2010s. (G–K) Annual average changes in TSM, Im, DIN, DIP, and DSi with increasing salinity in 10 representative years (the orange dashed line represents the fitted line for environmental factors in 2020, while the green dashed line indicates the fitted line for environmental factors in 1981). Δ represents the difference between the average environmental factor value in 2020 and its value in 1981.
The analysis of 40 years of field data on TSM and nutrients in the estuary was used to reconstruct the historical variations over the past half-century. The findings indicate a significant decrease in TSM concentrations, particularly inside HTZ and HPPZ, by 300 mg/L and 50 mg/L, respectively (Figure 3G). The reduction in TSM has led to an increase in underwater illuminance levels, with the most significant rise of 65 μmol photons m-2 s-1 occurring in the HPPZ (Figure 3H). Similar to TSM, concentrations of DSi also showed a decreasing trend over the past 40 years, with a maximum decrease of approximately 13.3 μM inside HTZ and 7.1 μM in HPPZ, respectively (Figure 3K). However, DIN and DIP exhibited a consistent upward trend, particularly in HTZ (increases of 60 μM for DIN and 1.3 μM for DIP) and HPPZ (increases of 42 μM for DIN and 0.65 μM for DIP) (Figures 3I, J).
To comprehensively investigate the influence of the watershed environment on the development of estuarine HPPZ, nutrients and SSC discharged from the Yangtze River basin over the last six decades were systematically collected and assessed for their impact on TSM and nutrient levels in the estuary. The results show the annual SSC and DSi concentrations in the Yangtze River basin have decreased by 85% and 67% over the past 60 years (Figures 4A, D), and the average TSM and DSi levels in the Yangtze River estuary have decreased by 45% (Figure 4A) and 22% (Figure 4D), respectively. Moreover, concentrations of DIN and DIP at the Yangtze River basin (Datong Station) have increased by approximately 600% and 500% over the past 60 years. Similarly, an increase of such nutrients is occurring in the Yangtze River estuary with overall increases of 59% (Figure 4B) and 56% (Figure 4C).
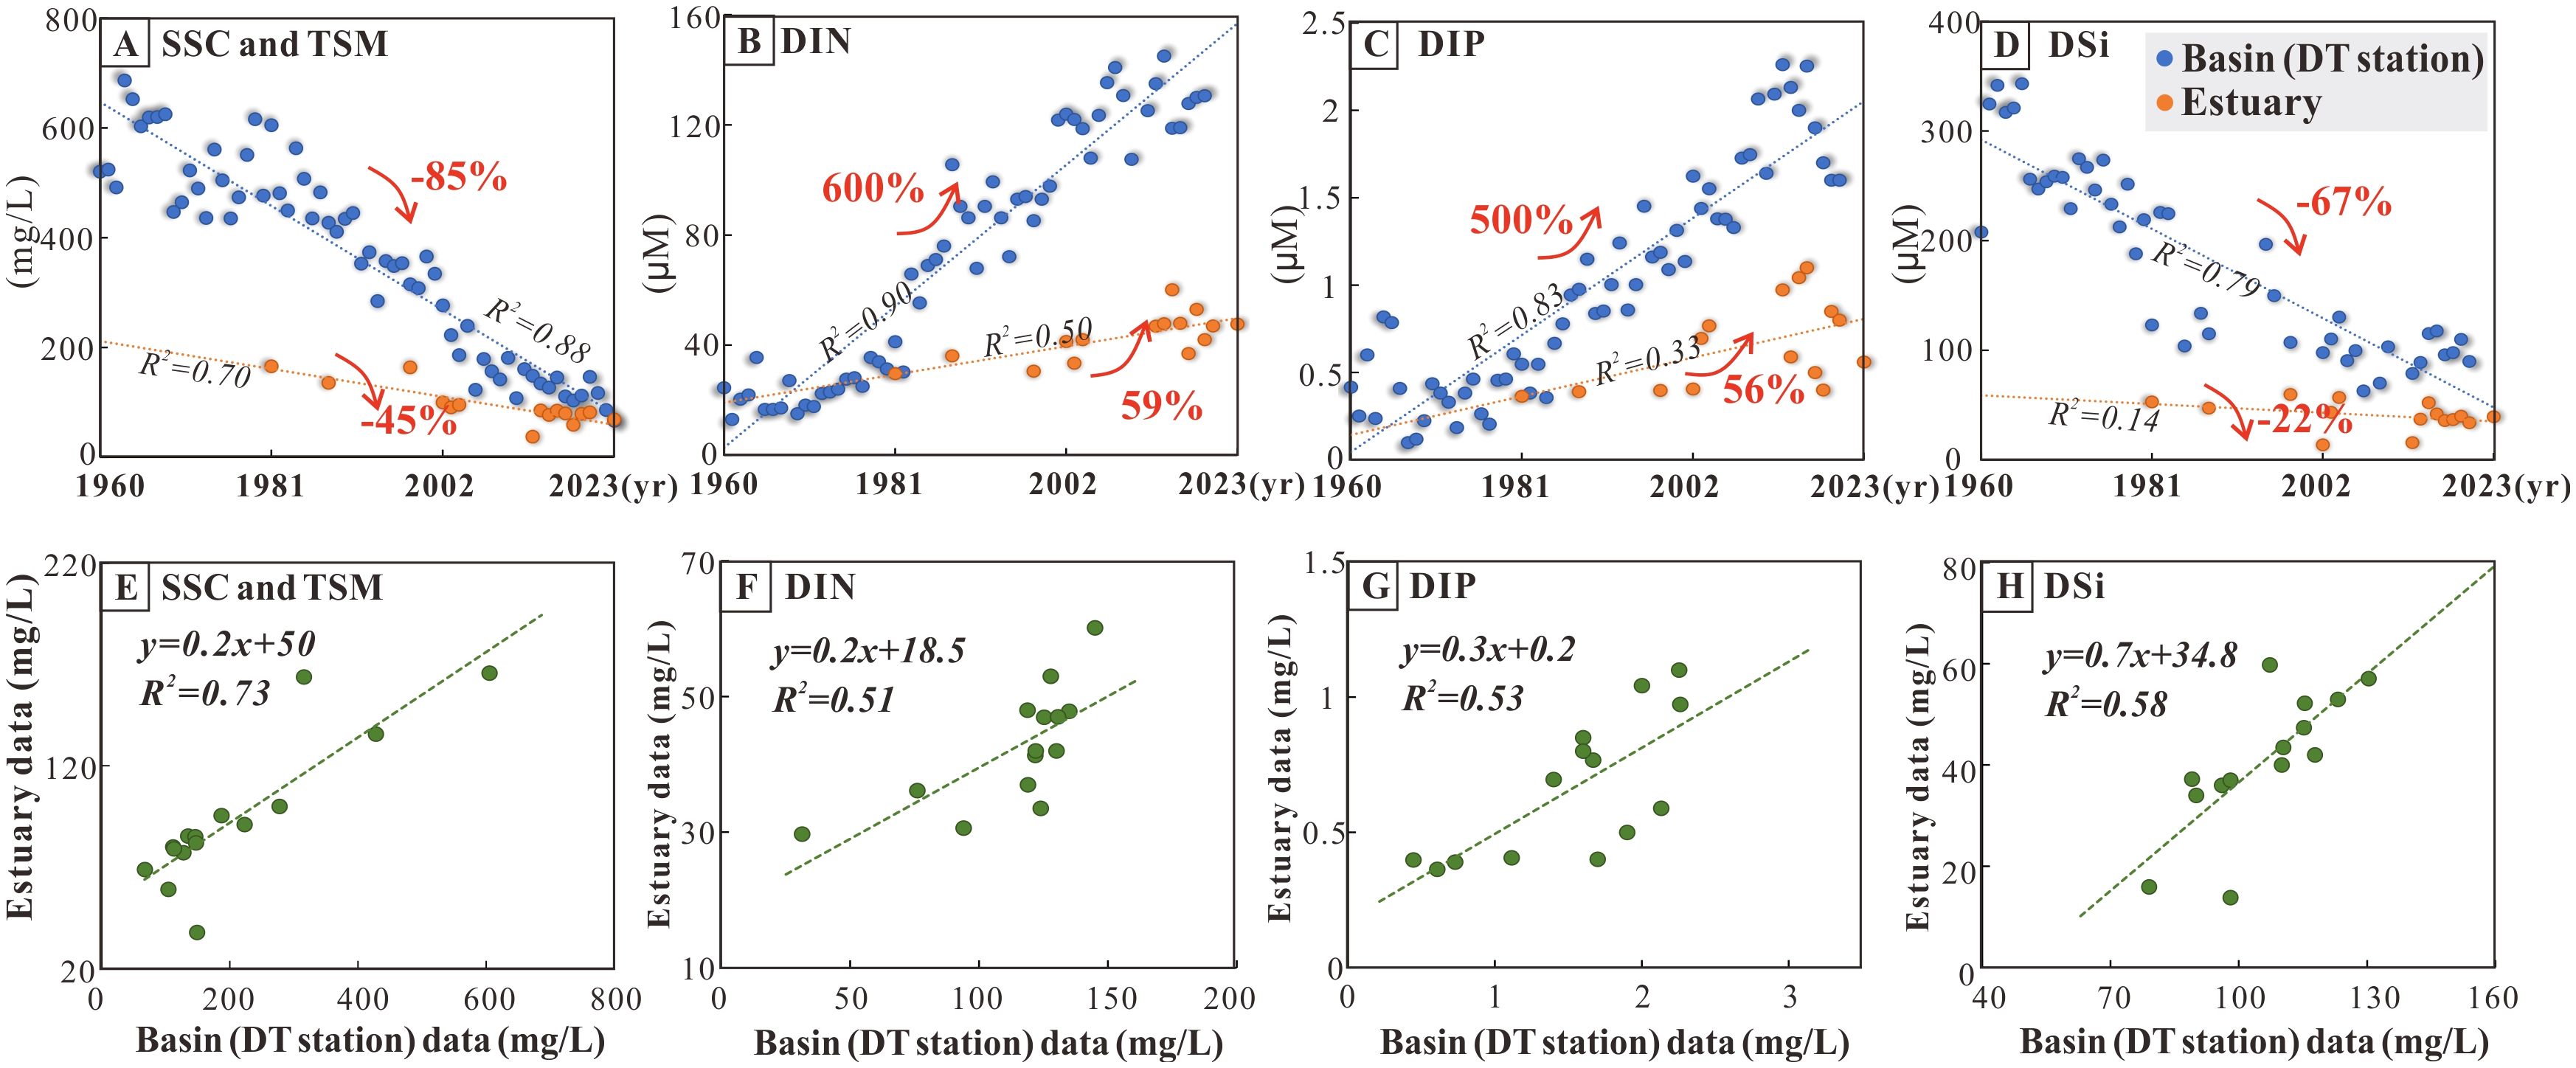
Figure 4. Sediment and nutrient dynamics in the Yangtze River basin (Datong runoff station) and estuary for the past half-century. (A–D) Comparison of annual average of measured data for four environmental factors at Datong station and Yangtze River estuary. (Data for the estuary were averaged over the entire study area after annual measurements were gridded.) (E–H) Correlation of environmental factors in the Yangtze River basin and estuary. (The horizontal and vertical axes represent data from the Datong runoff station in the basin and data from the estuary for the same year, respectively).
Correlations were analyzed between SSC, DIN, DIP, and DSi concentrations in the watershed over the past decades and the corresponding TSM, DIN, DIP, and DSi concentrations in the estuary for the same years. The results indicate a positive and consistent response (R2 = 0.51–0.73) of estuarine ecosystems to changes in the watershed environment (Figures 4E–H). The slopes of the regression equations ranged from 0.2 to 0.7, suggesting that the decreases in estuarine TSM and DSi were only 0.2 to 0.7 times the declines observed in the basin. Similarly, estuarine DIN and DIP increases were only 0.2 and 0.3 times the increases recorded in the basin (Figures 4E–H).
Based on the Equations 2–5 and database from 1981 to 2002, a regression equation of Chl-a concentration and environmental factors in the HPPZ was established as follows.
Similarly, the regression correlation between 2004 and 2020 was inferred as follows,
Based on the above results, it can be inferred that the degree of regulation of Chl-a concentration by the same environmental factor was varied before and after 2003. Assuming that TSM and nutrient concentrations in the estuary, along with their effects on Chl-a concentration in the HPPZ, continue to fluctuate over the next 30 years in a manner consistent with the patterns observed over the past 40 years, we can analyze these dynamics quantitatively. By calculating the difference in the coefficients for the same environmental factors from Equations 6, 7, we can determine the annual rate of change by dividing this difference by 20. This rate is then multiplied by 30 to project the potential relationship between these factors and Chl-a over the period from 2020 to 2050. This relationship can be expressed mathematically as follows (Equation 8).
Assuming that environmental factors continue to exhibit the same fluctuations observed over the past 40 years, we can project changes in DIP, DIN, DSi, TSM, and Im over the next 30 years based on the incremental TSM and nutrients in the HPPZ at section A before and after 2003 (Supplementary Figure S1). The projected changes are as follows: DIP and DIN are expected to increase by 26.9 and 0.65 μM, DSi is projected to decrease by 15.9 µM, TSM is likely to decline by 53.6 mg/L, and Im will increase by 19.3 μmol photons m-2 s-1. Using Equation 8, we anticipate that the average Chl-a concentration in the HPPZ at transect A of the Yangtze River Estuary will peak at 8.18 μg/L by the year 2050. Furthermore, based on the relationship between the average Chl-a concentration at transect A and the HPPZ over the past 40 years, as well as the predicted Chl-a concentration at transect A in 2050, the mean Chl-a concentration in the HPPZ at the Yangtze River Estuary is projected to peak at 10.5 μg/L in 2050, according to the following equation:
Where C (predicted HPPZ Chl-a) represents the predicted mean Chl-a concentration in the HPPZ at the Yangtze River Estuary in 2050. C (HPPZ Chl-a) refers to the average Chl-a concentration at the HPPZ over the past 40 years, which is 3.60 μg/L (Figure 2A). C (transect A Chl-a) is the average Chl-a concentration at transect A over the past 40 years, which is 2.79 μg/L (Supplementary Figure S1), while C (predicted transect A Chl-a) represents predicted average Chl-a concentration at transect A in 2050, which is 8.18 μg/L.
Likewise, the HPPZ exhibited an expansion trend, although this change has not been linear over the past 40 years. To facilitate the analysis of this complex dynamic process, the variation in HPPZ area over extended time scales in this study was approximated as a linear change. The annual variations observed in the 40-year time series data provide a more accurate representation of the gradual changes induced by large-scale, sustained reservoir construction on estuarine HPPZ. Thus, it can be concluded that the HPPZ, has increased by an average of 93 km² per year over the last four decades (Figure 2C). If this trend continues, the HPPZ is projected to expand to approximately 7904 km² by 2050. It is worth mentioning that while PCR can simplify the model by reducing the dimensionality of the variables, it may overlook complex interactions or nonlinear relationships, making it difficult to uncover the true causal relationships between variables, and instead only capturing their correlations.
The spatial distribution of TSM and nutrients showed a decreasing trend from the inner HTZ to the outer LNZ, with intermediate nutrient concentrations in the HPPZ (Figures 2B, C). This spatial pattern is primarily attributed to the estuarine filter and buffer effect, where various biogeochemical processes, including sedimentation, flocculation, resuspension, seawater dilution, and biological uptake, progressively reduce the concentrations of TSM and nutrients from the inner to the outer estuary (Asmala et al., 2014; Dias et al., 2016; Kitheka et al., 2016; Deng et al., 2023; Wan et al., 2023; Zhao L. et al., 2024). In contrast, the spatial distribution of Chl-a exhibited a distinct pattern characterized by low-high-low concentrations across the HTZ, HPPZ, and LNZ (Figure 3B). This distribution is similarly shaped by the estuarine filtration and buffering effects, with distinct Chl-a zones established through various filtering and buffering processes (Becherer et al., 2016; Restrepo et al., 2018; Xiao et al., 2018).
As noted in the results, in contrast to previous studies (Li et al., 2021), these three zones were defined by two natural inflection points on the fitted line (Figure 2B) representing the relationship between Chl-a concentration and salinity in this study. The inflection points correspond to the saline brackish ebb flow (salinity of approximately 10 PSU) and the boundary of brackish water at the Yangtze river plume front (which has a salinity of roughly 30 PSU). The inner HTZ, located between the estuary gate and the frontier of brackish ebb flow, is characterized by strong sedimentation, resuspension, and flocculation processes (Festa and Hansen, 1978; Hudson et al., 2017; Li and Zhang, 1998). These filtration and buffering processes led to a high TSM concentration (184.6 ± 125.6 mg/L) and a low Chl-a concentration (1.0 ± 0.7 μg/L) in this zone (Table 1), as the TSM significantly exceeds the light limitation threshold of 37 mg/L (Cloern, 1987). This suggests that turbidity-induced low light conditions are the primary limiting factor for phytoplankton growth, resulting in low Chl-a concentrations despite abundant nutrients in the HTZ (Dijkstra et al., 2019; Gameiro et al., 2011).
The middle HPPZ is situated between the frontiers of brackish ebb flow and the boundary of brackish water at the Yangtze River plume front, with strong brackish water drifting and biological uptake processes (Ge et al., 2020). These processes contribute to a reduction in TSM levels within the zone, which, in turn, enhances light availability in the HPPZ compared to HTZ (Table 1; Figures 3G–K). The favorable light conditions in brackish water, driven by the filtering and buffering effects of the HTZ and HPPZ, along with the availability of inorganic nutrients, promote an increase in Chl-a concentrations in the HPPZ through phytoplankton blooms (Thompson, 1999).
The outer LNZ is situated at the outer frontier of brackish drifting flow, where ocean water biogeochemical processes predominate (Largier, 1993). These processes are influenced by estuarine filtration and buffering. Specifically, the absorption of nutrients by phytoplankton in the HPPZ and the convergence around the plume front limits the transport of nutrients to the shelf water, leading to low nutrient levels in the LNZ (Table 1). The low TSM and high Im in the LNZ (Figures 3G–H) suggest that the surface waters are well-lighted, with limited nutrients (Figures 3I–K) playing a key role in regulating Chl-a levels in this zone. The scarcity of essential nutrients restricts the growth and reproduction of phytoplankton (Justić et al., 1995; Harrison et al., 1977), leading to diminished Chl-a levels in LNZ, which is different from the cause of low Chl-a concentrations in HTZ.
Overall, the formation of the HPPZ in the Yangtze River estuary is controlled by the availability of nutrients and light irradiance. Low Chl-a concentrations observed in HTZ and LNZ are attributed to light and nutrient limitations, respectively. The processes of laminarization and flocculation at suspended sediment fronts within the estuary causes the TSM concentration to decrease rapidly near the sediment front, with light limitation primarily confined to the HTZ. This dynamic effect leads to a balanced supply of light and nutrients in the SSS zone of 10–30 PSU, thus creating the estuarine HPPZ. Notably, the results of this study are based on summer data, while seawater stratification, driven by seasonal temperature variations, affects nutrient distribution and may lead to seasonal differences in phytoplankton growth (Liu et al., 2016).
Similar to the temporal increase in Chl-a concentrations observed in the HPPZ at the Yangtze River estuary, comparable rises have also been documented along the coasts of East Asia, South Asia, East Africa, South America, and Europe (Elsworth et al., 2020). Elevated Chl-a levels in the HPPZ reflect fluctuation in the physicochemical environmental factors in estuarine waters (Brown and Ozretich, 2009; Ho et al., 2015; Mathew et al., 2021; Shikata et al., 2008). Specifically, water temperature can influence phytoplankton metabolic processes, affecting Chl-a levels, which are observed during seasonal fluctuations (Seguro et al., 2015). This study specifically examines the interannual variability of summer phytoplankton, without incorporating seasonal comparisons. Additionally, the East China Sea’s surface water temperature exhibits a relatively modest change rate, increasing at approximately 0.09°C per decade (Bao and Ren, 2014). Given this minimal fluctuation, the study primarily emphasizes the impacts of eutrophication and sand reduction on phytoplankton dynamics at an interannual scale, while the role of water temperature is not explicitly considered. Furthermore, upwelling, the process of transporting nutrient-rich bottom water to the surface seawater to supply phytoplankton growth, essentially still contributes to the formation of the HPPZ by altering the concentration of nutrients (Brown and Ozretich, 2009). Compared to temperature and upwelling, light and nutrients are more critical factors for Chl-a synthesis (Barrera-Alba et al., 2019). This is because phytoplankton photosynthesis is primarily reliant on light energy, while the production of Chl-a and enzymes related to photosynthesis necessitates nutrients, notably nitrogen, phosphorus, and silicon (Ge et al., 2020; Kessouri et al., 2021; Yu et al., 2019).
The significant reductions of 85% in TSM and 60% in DSi in annual flux into the estuary over the past few decades (Figures 4A, D) can be attributed to the construction of dams and reservoirs in the Yangtze River Basin, where these reservoirs retain materials that would otherwise flow from rivers to the sea (Treguer and de la Rocha, 2013; Song et al., 2023; Zhao B. et al., 2024). The number of large reservoirs in the Yangtze River Basin has increased from 2 in 1960 to 268 in 2020, with a reservoir capacity of 500 million m3 to 27.2 billion m3, and an area of 30 km2 to 13.6×10³ km2 (Figure 1B) (Song et al., 2023). Such abrupt decline of sediment flux into the sea occurred in many other basins such as the Mississippi, Danube, Mekong, and Yellow Rivers due to the dam and reservoir constructions (Dethier et al., 2022; Humborg et al., 1997; Maavara et al., 2020). Additionally, the significant increases of DIN (600%) and DIP (500%) in annual flux into the estuary (Figures 4B, C) can be attributed to human activities in the basin, including urbanization, industrial operations, and agricultural practices. It is estimated that more than 6,000 large outfalls in the basin (each with annual discharges exceeding 100,000 tons) discharge about 34.41 billion tons of wastewater, of which 25.81 billion tons enter the river in 2020 (https://www.mee.gov.cn/hjzl/sthjzk/sthjtjnb/). The wastewater, including domestic sewage, industrial effluent, and agricultural runoff, carries nitrogen and phosphorus, exceeding the self-purification capacity of the runoff into the river (http://www.cjw.gov.cn/zwzc/zjgb/), ultimately leading to an eutrophic state (Song et al., 2023). Significant reductions in sediment and major increases in N and P nutrient fluxes from the watershed led to yearly rises in light and nutrient levels in the estuarine HPPZ water, fostering algal growth. Therefore, the increase in intensity and expansion of the estuarine HPPZ over the past 60 years has been influenced by the synergistic effects of reduced sediment supply and eutrophication in the Yangtze River basin, primarily driven by dam construction and pollutant discharges. It is important to note that the Chl-a, DIN, and DIP concentrations discharged to the sea, have exhibited a slightly fluctuating downward trend in recent years (Figures 2 and 4B), this observation does not contradict the conclusions of this study. This study primarily examines the long-term effects of dam construction and anthropogenic discharges on water quality and sediment since the 1960s. Over this extended period, the overall DIN, DIP, and Chl-a concentrations have demonstrated increasing trends.
However, the amplitude of changes in the estuarine environmental factors has been only 0.2 to 0.7 times that of the changes in the watershed over the past 40 years. Specifically, the concentrations of DIN and DIP in the estuary have increased by only 0.2 and 0.3 times, respectively, compared to those in the watershed (Figures 4E–H). This suggests that the estuarine region has a strong regulatory capacity, as the amplitude of nutrient concentration changes is significantly smaller than that of the input from the watershed. At the same time, the Chl-a concentration and the HPPZ region showed an increasing trend over the same period (Figures 2B, C). This indicates that the expansion of the HPPZ has played an important buffering role in the incoming nutrients in the estuarine region over the past few decades. Indeed, the combination of abundant light availability and nutrients has promoted algal growth, which, in turn, has facilitated nutrient uptake by the algae, thereby mitigating the rise in nutrient concentrations. Consequently, nutrient uptake by algae not only supports the increase in Chl-a concentrations and the area of the HPPZ but also buffers the heightened nutrient amplitude within the HPPZ.
Intensified human activities in the basin have significantly altered the transport patterns of materials to the sea, which in turn drive uncontrolled changes in estuarine Chl-a concentration and range. This work quantified for the first time, based on 40 years of field monitoring, the historical evolution of watershed-to-ocean material flux and their effects on the estuarine HPPZ level and extent. We found that the formation and spatiotemporal variability of the HPPZ are primarily driven by the availability of suspended sediment and nutrients. Specifically, a balance of light and nutrient availability in the central estuarine (10–30 PSU) favors phytoplankton growth, developing the HPPZ based on estuarine filtration and buffering effects on material entering the sea. The Chl-a concentration in the Yangtze River estuary’s HPPZ increased by 6.5 μg/L, and its area expanded by 3628 km2 over the past 40 years, primarily attributed to increased water transparency due to watershed sediment reduction and increased nutrient input from nitrogen and phosphorus. These mechanistic regulation patterns are illustrated in Figure 5 for visual interpretation. Importantly, we further modeled the spatiotemporal regulation of the Chl-a factor in the estuarine HPPZ based on the principal component regression algorithm for accurate prediction of future HPPZ Chl-a concentrations. Using this model, the Chl-a concentrations in the estuarine HPPZ are predicted to peak at 10.5 μg/L by 2050 given the current human impact levels. Our results confirm that material transport pattern changes in the watershed-estuary-ocean system disrupt the natural material flow of marine ecosystems. This poses a serious threat to the stability of marine ecosystems, especially under increased intervention from human activities such as watershed dam construction and sewage discharge. These perturbations potentially impact estuarine primary productivity, emphasizing the necessity and importance of further exploration of estuarine phytoplankton abundance and diversity under human activities.
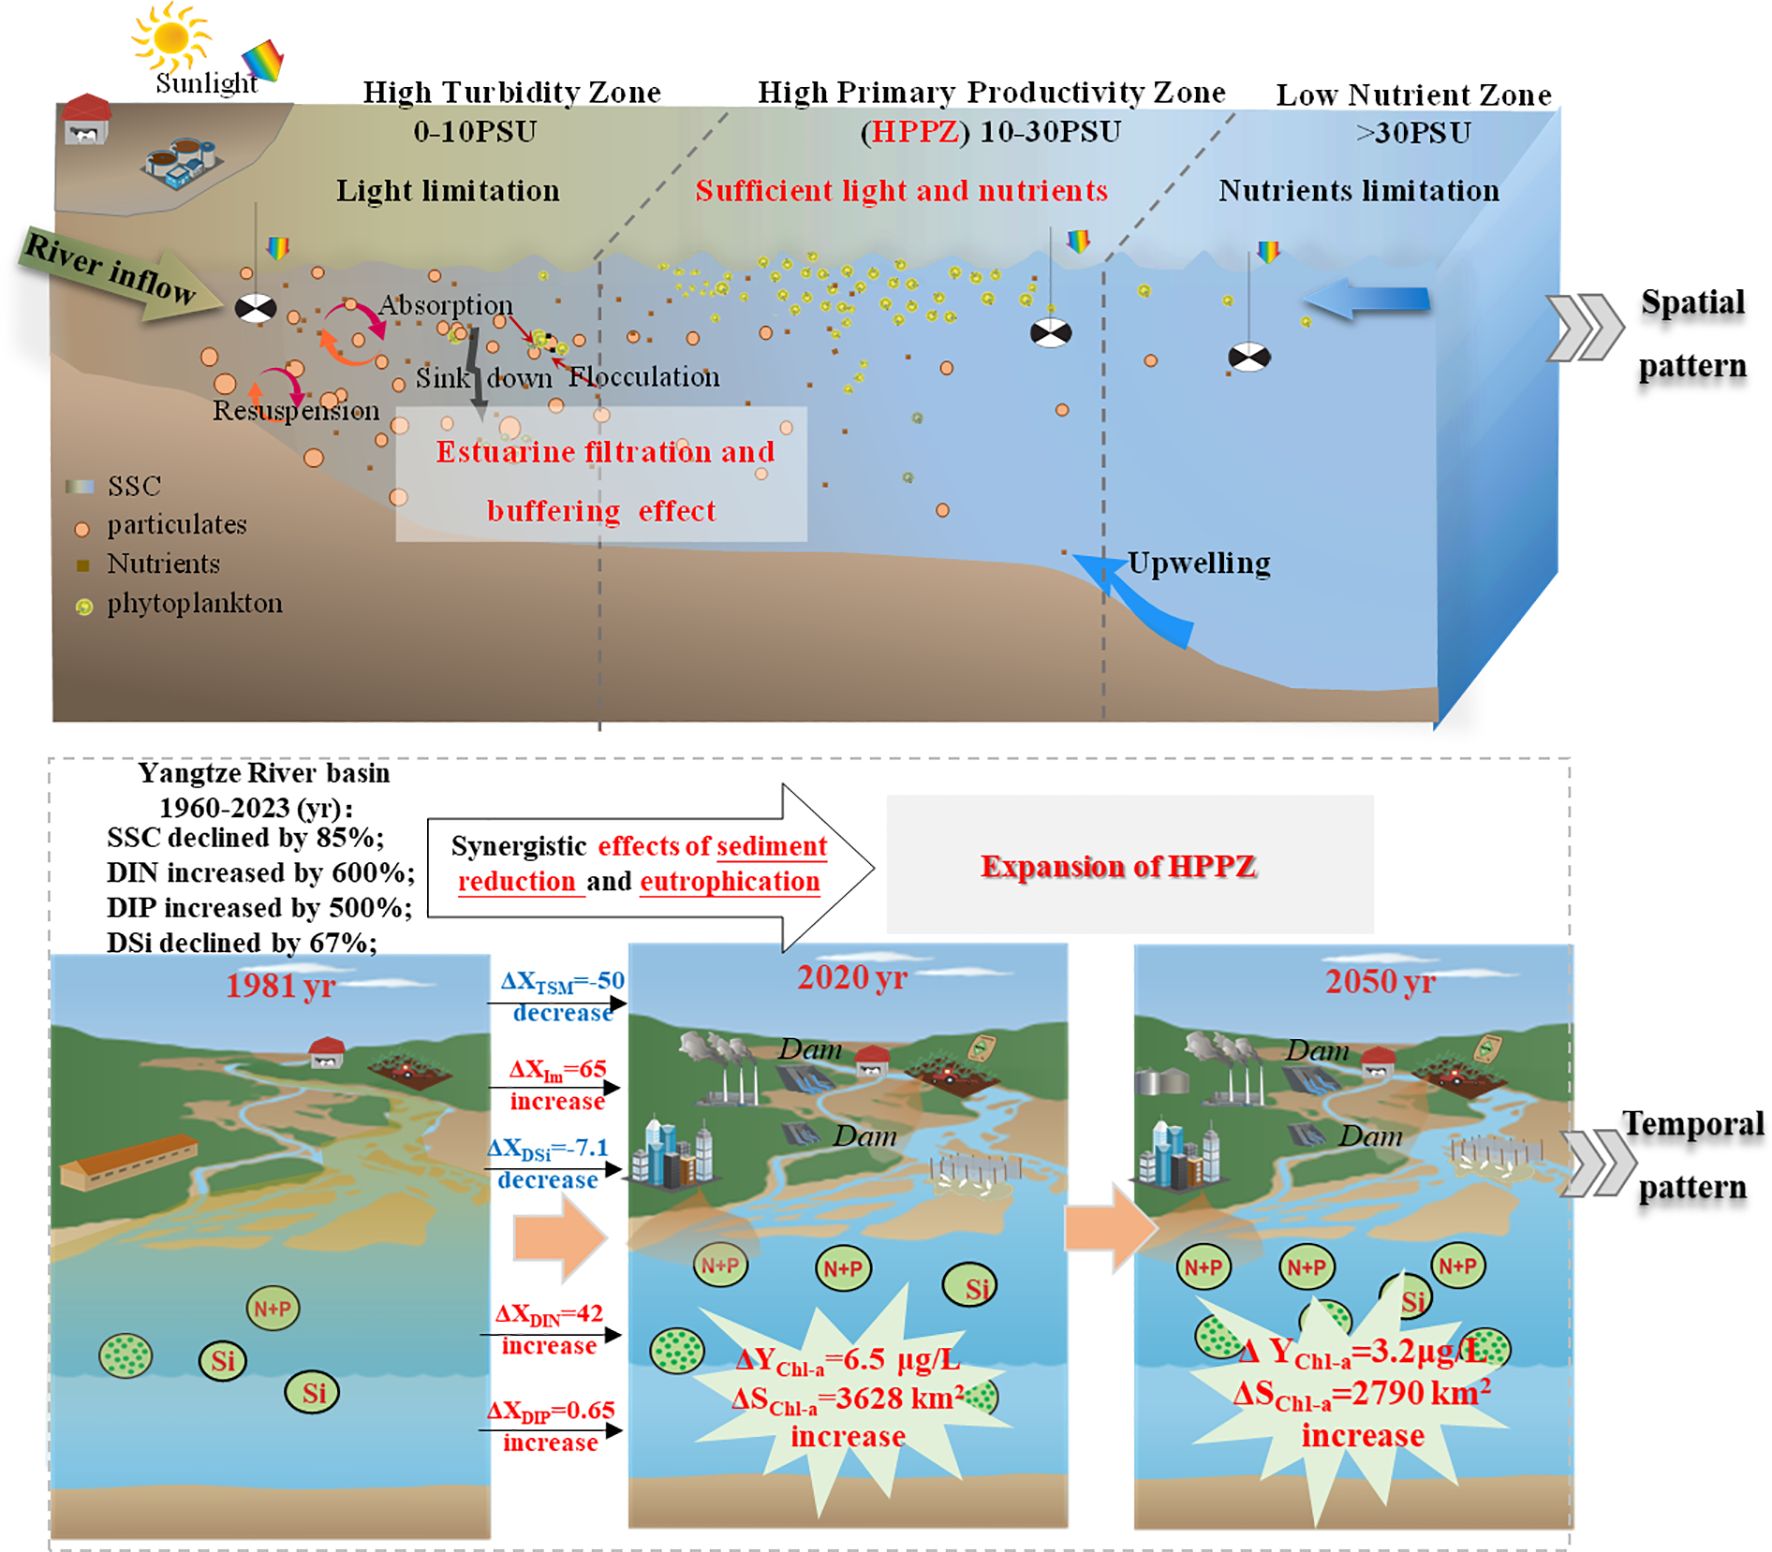
Figure 5. Schematic diagram of the spatiotemporal regulation mechanism of the intensity and extent of the estuarine HPPZ in response to changes in input material in the Yangtze River basin-estuarine-offshore System. ΔX represents the amount of change in environmental factors including TSM (mg/L), Im (μmol photons m-2 s-1), and nutrients (μμ), from 1981 to 2020. ΔYChl-a and ΔSChl-a indicate the amount of change in Chl-a concentration and area (Chl-a concentration >1 μg/L) within the HPPZ over time.
The original contributions presented in the study are included in the article/Supplementary Material. Further inquiries can be directed to the corresponding authors.
YS: Data curation, Methodology, Writing – original draft. ML: Funding acquisition, Investigation, Supervision, Writing – review & editing. XL: Data curation, Formal analysis, Writing – review & editing. WL: Writing – review & editing. HY: Data curation, Writing – review & editing. YL: Conceptualization, Supervision, Writing – review & editing. JC: Conceptualization, Supervision, Writing – review & editing. SS: Writing – review & editing. LH: Writing – review & editing, Funding acquisition. KL: Writing – review & editing.
The author(s) declare that financial support was received for the research, authorship, and/or publication of this article. This study was supported by the National Key R&D Program of China (2024YFF0808801), the Open Research Fund of State Key Laboratory of Estuarine and Coastal Research (SKLECKF202408), and the ECNU Academic Innovation Promotion Program for Excellent Doctoral Students (No. YBNLTS2024-003). We thank the National Natural Science Foundation of China for funding the shared voyage to the Yangtze River Estuary.
We are deeply grateful to Professor Tim Rixen, the editor, and the reviewers for their insightful comments and meticulous suggestions that significantly improved our manuscript. Special thanks are extended to Assistant Professor Said A. Shetaia for his expert language editing, and to Professors Lijun Hou and Ke Li for their invaluable contributions to data analysis and financial support throughout this research endeavor.
The authors declare that the research was conducted in the absence of any commercial or financial relationships that could be construed as a potential conflict of interest.
The author(s) declare that no Generative AI was used in the creation of this manuscript.
All claims expressed in this article are solely those of the authors and do not necessarily represent those of their affiliated organizations, or those of the publisher, the editors and the reviewers. Any product that may be evaluated in this article, or claim that may be made by its manufacturer, is not guaranteed or endorsed by the publisher.
The Supplementary Material for this article can be found online at: https://www.frontiersin.org/articles/10.3389/fmars.2025.1529744/full#supplementary-material
Asmala E., Bowers D. G., Autio R., Kaartokallio H., Thomas D. N. (2014). Qualitative changes of riverine dissolved organic matter at low salinities due to flocculation. J. Geophys. Res. Biogeosci. 119, 1919–1933. doi: 10.1002/2014JG002722
Bao B., Ren G. (2014). Climatological characteristics and long-term change of SST over the marginal seas of China. Cont. Shelf Res. 77, 96–106. doi: 10.1016/j.csr.2014.01.013
Barrera-Alba J. J., Abreu P. C., Tenenbaum D. R. (2019). Seasonal and inter-annual variability in phytoplankton over a 22-year period in a tropical coastal region in the southwestern Atlantic Ocean. Cont. Shelf Res. 176, 51–63. doi: 10.1016/j.csr.2019.02.011
Becherer J., Floeser G., Umlauf L., Burchard H. (2016). Estuarine circulation versus tidal pumping: Sediment transport in a well-mixed tidal inlet. J. Geophys. Res. Oceans 121, 6251–6270. doi: 10.1002/2016JC011640
Beman J. M., Arrigo K. R., Matson P. A. (2005). Agricultural runoff fuels large phytoplankton blooms in vulnerable areas of the ocean. Nature 434, 211–214. doi: 10.1038/nature03370
Brown C. A., Ozretich R. J. (2009). Coupling between the coastal ocean and yaquina bay, oregon: importance of oceanic inputs relative to other nitrogen sources. Estuar. Coast. 32, 219–237. doi: 10.1007/s12237-008-9128-6
Burford M. A., Faggotter S. J. (2021). Comparing the importance of freshwater flows driving primary production in three tropical estuaries. Mar. pollut. Bull. 169, 112565. doi: 10.1016/j.marpolbul.2021.112565
Burford M. A., Webster I. T., Revill A. T., Kenyon R. A., Whittle M., Curwen G. (2012). Controls on phytoplankton productivity in a wet–dry tropical estuary. Estuar. Coast. Shelf Sci. 113, 141–151. doi: 10.1016/j.ecss.2012.07.017
Canion A., MacIntyre H. L., Phipps S. (2013). Short-term to seasonal variability in factors driving primary productivity in a shallow estuary: Implications for modeling production. Estuar. Coast. Shelf Sci. 131, 224–234. doi: 10.1016/j.ecss.2013.07.009
Chassot E., Bonhommeau S., Dulvy N. K., Melin F., Watson R., Gascuel D., et al. (2010). Global marine primary production constrains fisheries catches. Ecol. Lett. 13, 495–505. doi: 10.1111/j.1461-0248.2010.01443.x
Chawla I., Karthikeyan L., Mishra A. K. (2020). A review of remote sensing applications for water security: quantity, quality, and extremes. J. Hydrol. 585, 124826. doi: 10.1016/j.jhydrol.2020.124826
Cloern J. E. (1987). Turbidity as a control on phytoplankton biomass and productivity in estuaries. Continent. Shelf Res. 7, 1367–1381. doi: 10.1016/0278-4343(87)90042-2
Dai M., Zhao Y., Chai F., Chen M., Chen N., Chen Y., et al. (2023). Persistent eutrophication and hypoxia in the coastal ocean. Cambridge Prisms: Coast. Futures 1, e19. doi: 10.1017/cft.2023.7
Dai Y., Yang S., Zhao D., Hu C., Xu W., Anderson D. M., et al. (2023). Coastal phytoplankton blooms expand and intensify in the 21st century. Nature 615, 280–284. doi: 10.1038/s41586-023-05760-y
Deng Z., He Q., Manning A. J., Chassagne C. (2023). A laboratory study on the behavior of estuarine sediment flocculation as function of salinity, EPS and living algae. Mar. Geol. 459, 107029. doi: 10.1016/j.margeo.2023.107029
Dethier E. N., Renshaw C. E., Magilligan F. J. (2022). Rapid changes to global river suspended sediment flux by humans. Science 376, 1447–1452. doi: 10.1126/science.abn7980
Dias F. J., da S., Castro B. M., Lacerda L. D., Miranda L. B., Marins R. V. (2016). Physical characteristics and discharges of suspended particulate matter at the continent-ocean interface in an estuary located in a semiarid region in northeastern Brazil. Estuar. Coast. Shelf Sci. 180, 258–274. doi: 10.1016/j.ecss.2016.08.006
Dijkstra Y. M., Chant R. J., Reinfelder J. R. (2019). Factors controlling seasonal phytoplankton dynamics in the delaware river estuary: an idealized model study. Estuar. Coast. 42, 1839–1857. doi: 10.1007/s12237-019-00612-3
Douglas E. J., Bulmer R. H., MacDonald I. T., Lohrer A. M. (2022). Estuaries as coastal reactors: importance of shallow seafloor habitats for primary productivity and nutrient transformation, and impacts of sea level rise. N. Z. J. Mar. Freshw. Res. 56, 553–569. doi: 10.1080/00288330.2022.2107027
Du J. L., Yang S. L., Feng H. (2016). Recent human impacts on the morphological evolution of the Yangtze River delta foreland: A review and new perspectives. Estuar. Coast. Shelf Sci. 181, 160–169. doi: 10.1016/j.ecss.2016.08.025
Elsworth G. W., Lovenduski N. S., McKinnon K. A., Krumhardt K. M., Brady R. X. (2020). Finding the fingerprint of anthropogenic climate change in marine phytoplankton abundance. Curr. Clim. Change Rep. 6, 37–46. doi: 10.1007/s40641-020-00156-w
Festa J. F., Hansen D. V. (1978). Turbidity maxima in partially mixed estuaries: A two-dimensional numerical model. Estuar. Coast. Mar. Sci. 7, 347–359. doi: 10.1016/0302-3524(78)90087-7
Frankenbach S., Ezequiel J., Plecha S., Goessling J. W., Vaz L., Kuhl M., et al. (2020). Synoptic spatio-temporal variability of the photosynthetic productivity of microphytobenthos and phytoplankton in a tidal estuary. Front. Mar. Sci. 7. doi: 10.3389/fmars.2020.00170
Gameiro C., Zwolinski J., Brotas V. (2011). Light control on phytoplankton production in a shallow and turbid estuarine system. Hydrobiologia 669, 249–263. doi: 10.1007/s10750-011-0695-3
Gao L., Li D., Zhang Y. (2012). Nutrients and particulate organic matter discharged by the Changjiang (Yangtze River): Seasonal variations and temporal trends. J. Geophys. Res. 117, G04001. doi: 10.1029/2012JG001952
Ge J., Torres R., Chen C., Liu J., Xu Y., Bellerby R., et al. (2020). Influence of suspended sediment front on nutrients and phytoplankton dynamics off the Changjiang Estuary: A FVCOM-ERSEM coupled model experiment. J. @ Mar. Syst. 204, 103292. doi: 10.1016/j.jmarsys.2019.103292
Harrison P. J., Conway H. L., Holmes R. W., Davis C. O. (1977). Marine diatoms grown in chemostats under silicate or ammonium limitation. III. Cellular chemical composition and morphology of Chaetoceros debilis, Skeletonema costatum, and Thalassiosira gravida. Mar. Biol. 43, 19–31. doi: 10.1007/bf00392568
Ho T. Y., Pan X., Yang H. H., Wong G. ,. T. F., Shiah F. K. (2015). Controls on temporal and spatial variations of phytoplankton pigment distribution in the Northern South China Sea. Deep Sea Res. Part II: Topical Stud. Oceanography 117, 65–85. doi: 10.1016/j.dsr2.2015.05.015
Hudson A. S., Talke S. A., Jay D. A. (2017). Using satellite observations to characterize the response of estuarine turbidity maxima to external forcing. Estuar. Coast. 40, 1–16. doi: 10.1007/s12237-016-0164-3
Humborg C., Ittekkot V., Cociasu A., VonBodungen B. (1997). Effect of Danube River dam on Black Sea biogeochemistry and ecosystem structure. Nature 386, 385–388. doi: 10.1038/386385a0
Justić D., Rabalais N. N., Turner R. E., Dortch Q. (1995). Changes in nutrient structure of river-dominated coastal waters: stoichiometric nutrient balance and its consequences. Estuar. Coast. Shelf Sci. 40, 339–356. doi: 10.1016/S0272-7714(05)80014-9
Kessouri F., McWilliams J. C., Bianchi D., Sutula M., Renault L., Deutsch C., et al. (2021). Coastal eutrophication drives acidification, oxygen loss, and ecosystem change in a major oceanic upwelling system. Proc. Natl. Acad. Sci. U. S. A. 118, e2018856118. doi: 10.1073/pnas.2018856118
Kimmerer W. J., Parker A. E., Lidstroem U. E., Carpenter E. J. (2012). Short-term and interannual variability in primary production in the low-salinity zone of the san francisco estuary. Estuar. Coast. 35, 913–929. doi: 10.1007/s12237-012-9482-2
Kitheka J. U., Mavuti K. M., Nthenge P., Obiero M. (2016). The turbidity maximum zone in a shallow, well-flushed Sabaki estuary in Kenya. J. Sea Res. 110, 17–28. doi: 10.1016/j.seares.2015.03.001
Largier J. L. (1993). Estuarine fronts: how important are they? Estuaries 16, 1–11. doi: 10.2307/1352760
Li J., Zhang C. (1998). Sediment resuspension and implications for turbidity maximum in the Changjiang Estuary. Mar. Geol. 148, 117–124. doi: 10.1016/S0025-3227(98)00003-6
Li P., Yang S. L., Milliman J. D., Xu K. H., Qin W. H., Wu C. S., et al. (2012). Spatial, temporal, and human-induced variations in suspended sediment concentration in the surface waters of the yangtze estuary and adjacent coastal areas. Estuar. Coast. 35, 1316–1327. doi: 10.1007/s12237-012-9523-x
Li W., Ge J., Ding P., Ma J., Glibert P. M., Liu D. (2021). Effects of dual fronts on the spatial pattern of chlorophyll-a concentrations in and off the changjiang river estuary. Estuar. Coast. 44, 1408–1418. doi: 10.1007/s12237-020-00893-z
Liu X., Li M., Chen J., Xu Y. J., Zhang W., Chen Z., et al. (2022). Natural and reservoir-induced channel changes in the Yangtze River Tidal Reach. J. Hydrol. 605, 127398. doi: 10.1016/j.jhydrol.2021.127398
Liu X., Xiao W., Landry M. R., Chiang K.-P., Wang L., Huang B. (2016). Responses of phytoplankton communities to environmental variability in the east China sea. Ecosystems 19, 832–849. doi: 10.1007/s10021-016-9970-5
Maavara T., Akbarzadeh Z., Van Cappellen P. (2020). Global dam-driven changes to riverine N:P:Si ratios delivered to the coastal ocean. Geophys. Res. Lett. 47, e2020GL088288. doi: 10.1029/2020GL088288
Mathew J., Singh A., Gopinath A. (2021). Nutrient concentrations and distribution of phytoplankton pigments in recently deposited sediments of a positive tropical estuary. Mar. pollut. Bull. 168, 112454. doi: 10.1016/j.marpolbul.2021.112454
Mungenge C. P., Wasserman R. J., Dondofema F., Keates C., Masina F. M., Dalu T. (2023). Assessing chlorophyll-a and water quality dynamics in arid-zone temporary pan systems along a disturbance gradient. Sci. Total Environ. 873, 162272. doi: 10.1016/j.scitotenv.2023.162272
Murrell M. C., Hagy J. D., Lores E. M., Greene R. M. (2007). Phytoplankton production and nutrient distributions in a subtropical estuary: Importance of freshwater flow. Estuar. Coast. 30, 390–402. doi: 10.1007/BF02819386
Restrepo J. C., Schrottke K., Traini C., Bartholomae A., Ospino S., Ortíz J. C., et al. (2018). Estuarine and sediment dynamics in a microtidal tropical estuary of high fluvial discharge: Magdalena River (Colombia, South America). Mar. Geol. 398, 86–98. doi: 10.1016/j.margeo.2017.12.008
Seguro I., García C. M., Papaspyrou S., Gálvez J. A., García-Robledo E., Navarro G., et al. (2015). Seasonal changes of the microplankton community along a tropical estuary. Reg. Stud. Mar. Sci. 2, 189–202. doi: 10.1016/j.rsma.2015.10.006
Shikata T., Nagasoe S., Matsubara T., Yoshikawa S., Yamasaki Y., Shimasaki Y., et al. (2008). Factors influencing the initiation of blooms of the raphidophyte Heterosigma akashiwo and the diatom Skeletonema costatum in a port in Japan. Limnol. Oceanogr. 53, 2503–2518. doi: 10.4319/lo.2008.53.6.2503
Song Y., Tong M., Li M., Liu X., Yao H., Fang Y., et al. (2023). The biogenic elements retention in reservoirs of the Yangtze River basin and effect on the nutrient flux into the sea. Global Planet. Change 230, 104280. doi: 10.1016/j.gloplacha.2023.104280
Sun Q., Hong Y., Lu F. (2019). A study on the correlation between the marine primary productivity of pearl river estuary and human activities. Technol. Innovation prod 3, 12–15. doi: 10.3969/j.issn.1674-9146.2019.03.012 (In Chinese)
Thompson P. (1999). The response of growth and biochemical composition to variations in daylength, temperature and irradiance in the marine diatom Thalassiosira pseudonana (Bacillariophyceae). J. Phyco. 35, 1215–1223. doi: 10.1046/j.1529-8817.1999.3561215.x
Treguer P. J., de la Rocha C. L. (2013). The world ocean silica cycle. Annu. Rev. Mar. Sci. 5, 477–501. doi: 10.1146/annurev-marine-121211-172346
Van Meter K. J., Van Cappellen P., Basu N. B. (2018). Legacy nitrogen may prevent achievement of water quality goals in the Gulf of Mexico. Science 360, 427. doi: 10.1126/science.aar4462
Vörös L., Padisák J. (1991). Phytoplankton biomass and chlorophyll-a in some shallow lakes in central Europe. Hydrobiologia 215, 111–119. doi: 10.1007/BF00014715
Wan X. S., Sheng H. X., Liu L., Shen H., Tang W., Zou W., et al. (2023). Particle-associated denitrification is the primary source of N2O in oxic coastal waters. Nat. Commun. 14, 8280. doi: 10.1038/s41467-023-43997-3
Wang L., Chen Q., Han R., Wang B., Tang X. (2017). Responses of the phytoplankton community in the Yangtze River estuary and adjacent sea areas to the impoundment of the Three Gorges Reservoir. Ann. Limnol. Int. J. Limnol. 53, 1–10. doi: 10.1051/limn/2016027
Wang Y., Liu D., Xiao W., Zhou P., Tian C., Zhang C., et al. (2021). Coastal eutrophication in China: Trend, sources, and ecological effects. Harmful Algae 107, 102058. doi: 10.1016/j.hal.2021.102058
Widianingsih W., Hartati R., Endrawati H. (2023). Horizontal distribution of chlorophyll-a and water quality on Delta Wulan Estuary, Demak Regency, Central Java, Indonesia. Bio Web Conf. 74, 4003. doi: 10.1051/bioconf/20237404003
Woodland R. J., Thomson J. R., Mac Nally R., Reich P., Evrard V., Wary F. Y., et al. (2015). Nitrogen loads explain primary productivity in estuaries at the ecosystem scale. Limnol. Oceanogr. 60, 1751–1762. doi: 10.1002/lno.10136
Wu Y., Eglinton T. I., Zhang J., Montlucon D. B. (2018). Spatiotemporal variation of the quality, origin, and age of particulate organic matter transported by the yangtze river (Changjiang). J. Geophys. Res.-Biogeosci. 123, 2908–2921. doi: 10.1029/2017JG004285
Xiao W., Laws E. A., Xie Y., Wang L., Liu X., Chen J., et al. (2019). Responses of marine phytoplankton communities to environmental changes: New insights from a niche classification scheme. Water Res. 166, 115070. doi: 10.1016/j.watres.2019.115070
Xiao Y., Wu Z., Cai H., Tang H. (2018). Suspended sediment dynamics in a well-mixed estuary: The role of high suspended sediment concentration (SSC) from the adjacent sea area. Estuar. Coast. Shelf Sci. 209, 191–204. doi: 10.1016/j.ecss.2018.05.018
Yu Y., Xing X., Liu H., Yuan Y., Wang Y., Chai F. (2019). The variability of chlorophyll-a and its relationship with dynamic factors in the basin of the South China Sea. J. Mar. Syst. 200, 103230. doi: 10.1016/j.jmarsys.2019.103230
Zhao B., Zeng Q., Wang J., Jiang Y., Liu H., Yan L., et al. (2024). Impact of cascade reservoirs on nutrients transported downstream and regulation method based on hydraulic retention time. Water Res. 252, 121187. doi: 10.1016/j.watres.2024.121187
Zhao L., Gao L., Thomas D. N. (2024). Molecular size variations of chromophoric dissolved organic matter (CDOM) along a salinity gradient in the Changjiang River estuary. Estuar. Coast. Shelf Sci. 297, 108606. doi: 10.1016/j.ecss.2023.108606
Keywords: HPPZ, Chl-a, basin-estuary-offshore, sediment-reduction effect, eutrophication effect
Citation: Song Y, Li M, Liu X, Li W, Yao H, Liu Y and Chen J (2025) Effects of riverine nutrient enrichment and sediment reduction on high primary productivity zone in the Yangtze River estuary: historical reconstruction and future perspective. Front. Mar. Sci. 12:1529744. doi: 10.3389/fmars.2025.1529744
Received: 17 November 2024; Accepted: 11 February 2025;
Published: 03 March 2025.
Edited by:
Tim Rixen, Leibniz Centre for Tropical Marine Research (LG), GermanyReviewed by:
Moritz Müller, Swinburne University of Technology Sarawak Campus, MalaysiaCopyright © 2025 Song, Li, Liu, Li, Yao, Liu and Chen. This is an open-access article distributed under the terms of the Creative Commons Attribution License (CC BY). The use, distribution or reproduction in other forums is permitted, provided the original author(s) and the copyright owner(s) are credited and that the original publication in this journal is cited, in accordance with accepted academic practice. No use, distribution or reproduction is permitted which does not comply with these terms.
*Correspondence: Maotian Li, bXRsaUBza2xlYy5lY251LmVkdS5jbg==; Weihua Li, d2hsaUBza2xlYy5lY251LmVkdS5jbg==
Disclaimer: All claims expressed in this article are solely those of the authors and do not necessarily represent those of their affiliated organizations, or those of the publisher, the editors and the reviewers. Any product that may be evaluated in this article or claim that may be made by its manufacturer is not guaranteed or endorsed by the publisher.
Research integrity at Frontiers
Learn more about the work of our research integrity team to safeguard the quality of each article we publish.