
95% of researchers rate our articles as excellent or good
Learn more about the work of our research integrity team to safeguard the quality of each article we publish.
Find out more
ORIGINAL RESEARCH article
Front. Mar. Sci. , 07 February 2025
Sec. Marine Molecular Biology and Ecology
Volume 12 - 2025 | https://doi.org/10.3389/fmars.2025.1522677
 Maelle Sevellec1*
 Anaïs Lacoursière-Roussel2
 Eric Normandeau3‡
 Louis Bernatchez4†
 Kimberly Lynn Howland1
Introduction: Environmental DNA (eDNA) metabarcoding of water is increasingly being used to monitor coastal biodiversity shifts. However, we have limited knowledge of whether samples collected during discreet temporal periods depict holistic ecosystem changes over longer time spans.
Methods: Here, we show how eDNA community structure varies across repeated sampling events at different temporal scales ranging from years to months to days at an Arctic coastal site, Churchill (Canada), using metabarcoding analyses of water eDNA samples with four universal primer pairs (two primers in COI and two in the 18S rRNA).
Results: Daily variations were highly dynamic and less structured, likely due to the stochastic nature of estuarine ecosystems, but there was a clear annual consistency in eDNA communities with a high proportion of shared taxa between years. However, monthly sampling was the most efficient for capturing holistic biodiversity.
Discussion: We provide recommendations for optimal eDNA metabarcoding sampling design based on our observations. The study underscores the importance of understanding biological and physical factors altering eDNA detection to improve the efficiency of detecting and interpreting long-term eDNA changes.
Biological time-series observations are essential to better understanding ecological processes and determine human impacts on oceans (Ducklow et al., 2009; Bálint et al., 2018; Takahashi et al., 2023). Effective marine monitoring programs have been successfully conducted, sometimes using time series collected over decades (Fontaine and Rynearson, 2023). Environmental DNA (eDNA) metabarcoding from water samples is increasingly being utilized to monitor coastal biodiversity and detect changes in biological communities over time (Deiner et al., 2017; Mathieu et al., 2020). Programs such as the Ocean Biomolecular Observing Network (OBON) are now established to enhance ocean biomonitoring through global-scale collaborations and long-term investigations by using eDNA metabarcoding or other biomolecular techniques (https://obon-ocean.org/about/).
In order to determine if there are stable, recurrent eDNA detections across different time scales and environmental conditions, a better understanding of how eDNA in the environment changes with species phenology (e.g., life stage, reproduction, and metabolism) and physical processes (e.g., hydrodynamics, temperature, UV) (Seymour, 2019; de Souza et al., 2016; Rourke et al., 2022) is essential. This knowledge is also crucial for meaningful interpretation of long-term eDNA data trends. An increasing number of studies have reported eDNA detection peaks within a short seasonal window and attributed this pattern to biological factors (Laramie et al., 2015; Sigsgaard et al., 2017; Stoeckle et al., 2017; Handley et al., 2019; Troth et al., 2021; Sevellec et al., 2021; Collins et al., 2022). While several studies have reported significant interannual variation in communities detected with eDNA (Closek et al., 2019; Laporte et al., 2021; Di Capua et al., 2021; Carvalho et al., 2024), few have documented short-term variation (Kelly et al., 2018; Jensen et al., 2022; Ely et al., 2021; Dowell et al., 2024) and how natural short-term variability can affect our capacity to interpret coastal eDNA data to evaluate holistic changes in community structure over time.
Time series of water eDNA metabarcoding offer significant potential for coastal Arctic biomonitoring. The Arctic Ocean is undergoing profound climate and associated biological change driven by physical transformations, including sea ice melting, rising sea temperatures, and increased shipping activities (Garcia-Soto et al., 2021; Murray et al., 2024). Despite the logistical challenges of surveying Arctic biota, many of which are endemic, rapid changes in marine communities have been documented (Post et al., 2009; Koenigstein, 2020). The ability of eDNA metabarcoding to detect organisms across multiple trophic levels makes it a valuable tool in this vast and remote region (Lacoursière-Roussel et al., 2018; Leduc et al., 2019; Sevellec et al., 2021; Geraldi et al., 2024). This non-invasive method is also among the most ethical approaches for biomonitoring marine communities, making it particularly valuable in sensitive Arctic regions. In order to adequately characterize long-term fluctuations in biodiversity, however, we still need to appreciate how seasonal and intra-seasonal patterns of oceanic biodiversity behave in the Arctic region.
Here, we compared different temporal sampling strategies for monitoring eDNA metazoan communities using the Canadian Arctic port of Churchill as a case study, with the goal of contributing advice on conducting efficient and scientifically tenable eDNA-based coastal surveillance and monitoring programs. We contrasted eDNA metazoan communities detected for three different temporal sampling strategies, including (i) interannual, (ii) monthly, and (iii) daily sampling efforts to help inform best practices for monitoring and interpreting eDNA time series.
This study builds on previous spatial comparisons of Arctic coastal metazoan communities in a Churchill port using both eDNA metabarcoding and conventional species collections (Lacoursière-Roussel et al., 2018; Leduc et al., 2019). Churchill is a key Arctic port in Canada and is situated on a large estuary, creating dynamic eDNA assemblages from marine water and freshwater communities (Lacoursière-Roussel et al., 2018; Sevellec et al., 2021). The estuary is located at the mouth of the Churchill River on Hudson Bay (Manitoba, Canada, 58°46′N, 94°11′W). We compared three different sampling approaches at different temporal scales each representing similar time commitments, which could be realistically implemented in long-term monitoring (i.e., sampling for 3–4 days distributed across consecutive days, consecutive months, consecutive years). The three temporal sampling strategies correspond to years (interannual: August 2015 and 2016; N=80), months (August 2015/2016, September 2017, October 2017, November 2017 and December 2017; N=158), and days (August 10th, 11th, 12th 2016; N=18). There were 20 samples also collected in August 2017, as planned in our original design, but were compromised during the extraction process. All the samples were collected in the same geographic area, within 0.67 km of each other (Supplementary Table S1). Although spatial distance influenced the eDNA community composition in this study, the relatively close proximity of the samples resulted in a much greater proportion of explained variance being attributed to temporal variation (PERMANOVA Temporal COI, R2 = 21.128, P < 0.001, PERMANOVA Spatial COI, R2 = 4.683, P < 0.001, PERMANOVA Temporal 18S, R2 = 35.158, P < 0.001, PERMANOVA Spatial 18S, R2 = 6.137, P < 0.001). All samples from the different temporal strategies were collected and processed following protocols detailed in Lacoursière-Roussel et al. (2018). In brief, we collected 250 mL of surface water (at ~1 m–2 m depth) which was filtered (0.7 μm, 25 mm diameter GFF) using a syringe. Filters were preserved in longmire buffer, placed on ice during field transport, and frozen at −20°C until DNA extraction.
DNA was extracted from filters using a QIAshredder and phenol/chloroform protocol as described in Lacoursière-Roussel et al. (2018). Technical variability of primer biases from high-throughput sequencing was reduced by using four different universal primer pairs (Goldberg et al., 2016; Kelly et al., 2019). Thus, eDNA was amplified by two pairs of mitochondrial cytochrome c oxidase subunit I (COI) primers (mlCOIintF/jgHCO2198 and LCO1490/ill_C_R) (Folmer et al., 1994; Geller et al., 2013; Leray et al., 2013; Shokralla et al., 2015) and two pairs of ribosomal gene 18S primers (F-574/R-952 and TAReuk454FWD1/TAReukREV3) (Hadziavdic et al., 2014; Stoeck et al., 2010). A one-step dual-indexed PCR approach with Illumina barcoded adapters was performed using 6 µl Qiagen Multiplex Mastermix, 4 µl diH20, 1 µl of each primer (10µM), and 3 µl of DNA. The PCR program consisted of an initial denaturation step at 95°C for 15 min, followed by 35 cycles at 94°C for 30 s, 54°C for 90 s (except for primer LCO1490/ill_C_R which was at 52°C for 90 s), and 72°C for 60 s, and a final elongation at 72°C for 10 min. Three PCR replicates were done for each sample and primer pair combination. After purification using Ultra AMPure beads and quantification by PicoGreen, the aliquots were pooled together in equal molar concentrations. Sequencing was carried out on three different flow cells (one per year) using an Illumina MiSeq at the Plateforme d’Analyses Génomiques (IBIS, Université Laval, Québec, Canada, www.ibis.ulaval.ca).
Meticulous care was taken and good practices implemented to avoid contamination risks. In the field, the sampling kits, composed of sterilized bottles, filters, gloves, syringes, and tweezers, were bagged and sealed and then exposed to UV for 30 min following assembly. Multiple field negative controls were performed for each sampling event, with 250 ml of sterilized distilled water, (three in 2015, four in 2016, and four in 2017), which were all treated as regular samples for the remaining manipulations until sequencing. In the laboratory, (i) eDNA extraction, PCR preparation, and post-PCR steps were performed in three separate rooms; (ii) all PCR manipulations were performed in a UV hood; (iii) all laboratory bench space and tools were treated with a 10% bleach solution and exposed to UV for 30 min before performing any manipulations. At the extraction step, additional negative controls were performed, with 950 µl of distilled sterile water (four in 2015, five in 2016, and eight in 2017), and were also integrated in the amplification and sequencing processes. At the amplification step, a negative PCR control was done for each sample and primer pair (i.e., 3 µl of sterilized distilled water) because barcodes were different for each sample. No positive amplification was visualized in the PCR negative control via 1.5% agarose gel electrophoresis. Finally, sequences from taxa deemed to be associated with sample contamination were removed (Supplementary Table S2) following a decision process based on their relative abundance detected in the negative controls as detailed in Leduc et al. (2019) and Sevellec et al. (2021). In brief, contaminant taxa were removed if the total number of sequences detected in negative controls (field and extraction; N=28) was greater than 2% of the total number of sequences detected across all samples for a given genus or species. This contamination protocol aims to limit potential result bias by retaining dominant Arctic taxa that would be expected to contribute low levels of contamination (Drake et al., 2022).
Cleaning and classification of the sequences were performed with the MiSeq Control software v2.3 then with Barque version v1.5.2 (www.github.com/enormandeau/barque). In brief, raw forward and reverse reads were trimmed, merged, cleaned of chimeras, and denoised, and then clustered as operational taxonomic units (OTUs) with a threshold of 97% similarity. Finally, the COI sequences were annotated using BOLD (http://www.boldsystems.org) and the 18S sequences were annotated using SILVA (https://www.arb-silva.de/). Sequences from non-marine species (insects and most mammals), as well as those that could not be taxonomically assigned, were removed from our dataset. Because of the different filtration steps, and based on our contamination protocol, nine (COI) and seven (18S) samples collected in September and October 2017 were removed from the data set. For the year, month, and day sampling designs, we successfully blasted a per sample average of 587.4, 565.5, and 411.6 sequences for COI1, 386.6, 547.3, and 253.6 sequences for COI2, 1,575.1, 1,043.9, and 239.6 sequences for 18S1, and 632.0, 517.0, and 135.8 sequences for 18S2, respectively. Because the results obtained between the gene primers COI1 and COI2 data as well as 18S1 and 18S2 data were highly similar (Supplementary Figure S1), reads were summed for each gene. For results below, COI includes both COI1 and COI2 and 18S includes both 18S1 and 18S2.
Coastal marine eDNA communities in Churchill Port were compared across the three temporal sampling strategies hereafter refer to as years (interannual: August 2015 and 2016), months (August 2015/2016, September 2017, October 2017, November 2017, and December 2017) and days (August 10th, 11th, and 12th, 2016). To determine the effect of sampling effort, genus-level rarefaction curves were created with BiodiversityR and ggplot2 packages using R (R Core Team, 2013) using relative abundance without prior transformation for the three temporal communities. Since samples were available from two different years in the August period for the monthly sampling strategy, this analysis was done using two subgroups to avoid overestimating biodiversity: (i) August 2015 with the months of September, October, November, and December in 2017, (ii) August 2016 with the months of September, October, November, and December in 2017.
To investigate the differences among eDNA communities from the various temporal sampling strategies, two analyses were performed using a genus matrix after Hellinger transformation with the R vegan package: PERMANOVA analyses (number of permutations = 10,000) and principal coordinate analyses (PCoA) were performed on a Bray–Curtis distance matrix representing (dis)similarity among eDNA communities. Furthermore, to confirm that the significant results of the PERMANOVA and PCoA analyses were not driven by variations in group dispersions, multivariate homogeneity was evaluated using the betadisper function (R vegan package). No significant differences in dispersion homogeneity were observed across temporal strategy groups (betadisper P>0.01). To examine the taxonomic composition of each temporal sampling strategy, three tree maps were generated to represent yearly, monthly, and daily strategies at the genus level, using Hellinger-transformed data and the R treemap package.
To visualize similarities among eDNA communities, Venn diagrams were created using InteractiVenn (Heberle et al., 2015). These were complemented by Similarity Percentage (SIMPER) analyses performed with PAleontological STatistics software (PAST 4) ((Hammer et al., 2005) to evaluate dissimilarities of temporal sampling strategies on overall average dissimilarity index (OAD index). This index ranged from 0 (samples have identical taxa composition) to 100 (the samples do not share any taxa). The SIMPER analysis also identified the taxa that explain similarity (similarity percent) or dissimilarity (contribution percent) within the temporal strategies group. In this study, the SIMPER analyses were based on Hellinger transformed data. Finally, to determine the differences between taxonomy levels, temporal variation was contrasted for each phyla using time-series analysis (R vegan package) on the most abundant representative genus within each (i.e., annelida - Nais, chordata - Halocynthia, cnidaria - Aurelia, mollusca - Mytilus, porifera - Spongilla). More precisely, the distribution of Hellinger transformed data for each representative genus was plotted separately for each temporal sampling strategy. To compare if the relative abundance of shared genera varied among temporal sampling strategies, a non-parametric Kruskal–Wallis test was performed using Hellinger transformed data.
A total of 206,492 (COI) and 151,433 (18S) aquatic metazoan sequences were obtained after trimming the raw dataset composed of 148 (COI) and 150 (18S) eDNA samples from the Churchill port (for more details, see Supplementary Table S3). For both the genes, the accumulation curves for the year and month sampling strategies reached a plateau, whereas the eDNA community based on daily samples were at the end of the semi-logarithmic curves for each primer (Figure 1). At the same given level of sampling effort, the monthly strategy yielded the highest number of taxa, followed closely by the yearly strategy, whereas daily sampling resulted in the lowest number of taxa.
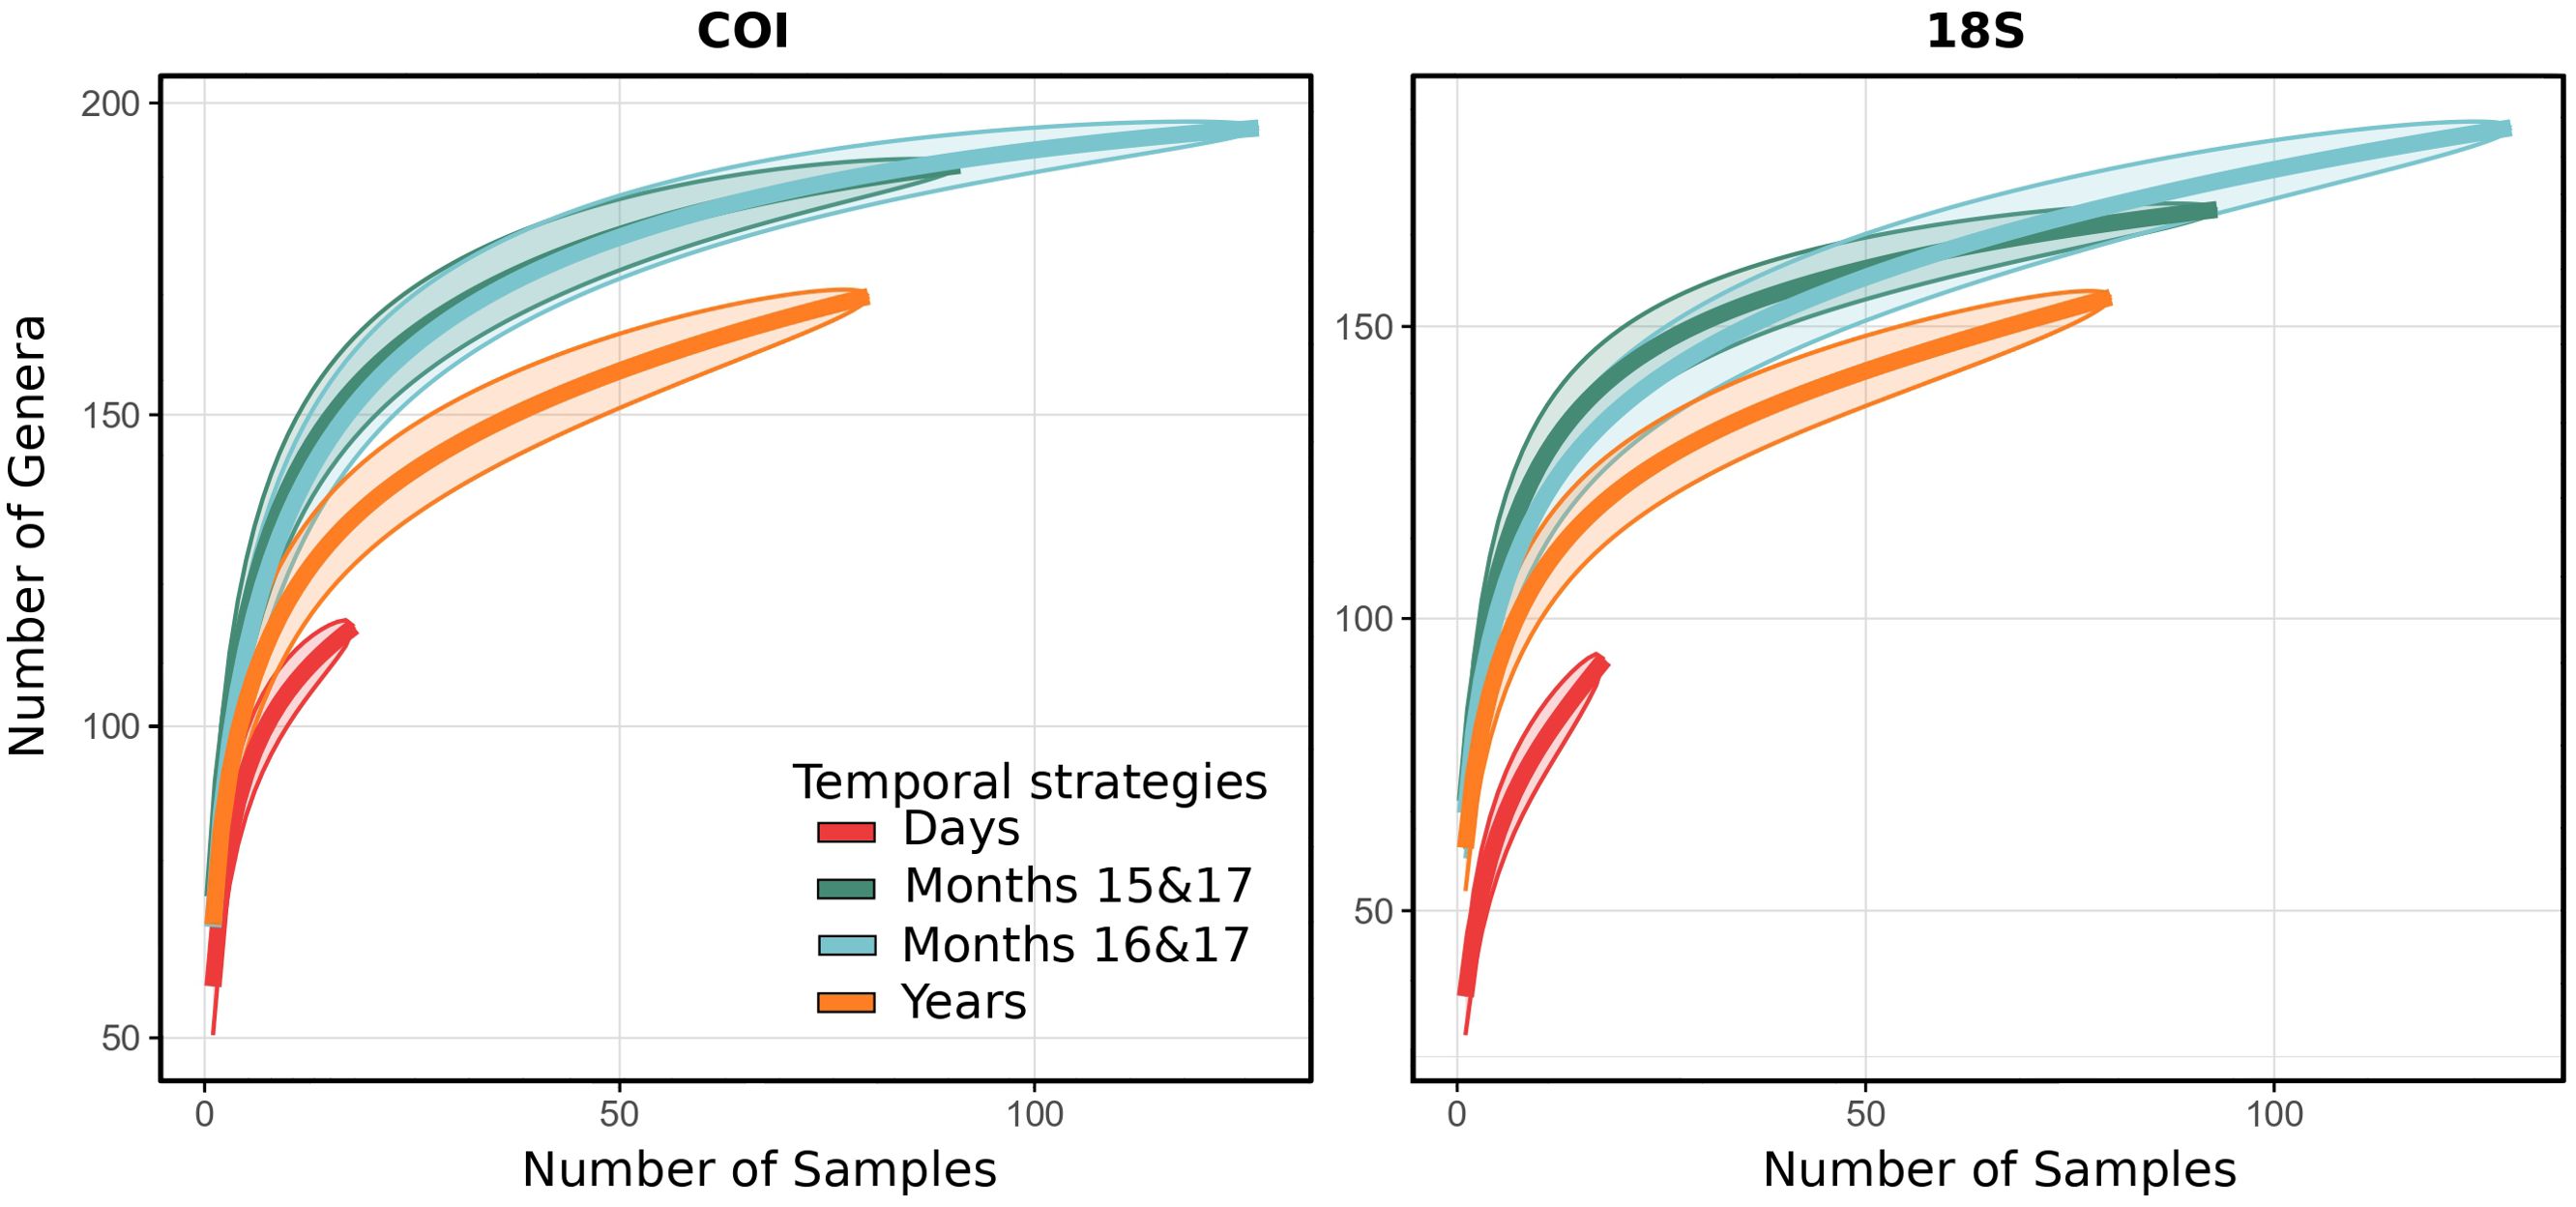
Figure 1. Genera accumulation curves of eDNA coastal communities for different temporal strategies. Genera accumulation curves were computed for COI (COI1: mlCOIintF/jgHCO2198 and COI2: LCO1490/ill_C_R) and 18S (18S1: F-574-R-952, and 18S2: TAReuk454FWD1-TAReukREV3). Days: Aug 2016 from 10th to 12th; Months 15&17: Aug 2015, Sept 2017, Oct 2017, Nov 2017 and Dec 2017; Months 16&17: Aug 2016, Sept 2017, Oct 2017, Nov 2017 and Dec 2017; Years: Aug 2015 and Aug 2016.
The PCoA results were significantly different between years (i.e., between August 2015 and 2016; PERMANOVA year, P < 0.001 for both primers), but the samples from 2015 and 2016 clustered side by side, especially with the COI primers (Figure 2). The monthly eDNA communities formed distinct clusters (PERMANOVA month, P < 0.001) that showed a gradual seasonal change (Table 1; Figure 2). In the opposite way, no distinct communities were observed among the three consecutive days (Table 1). The PCoA revealed scattered sample data points along axis-2 for the COI primers and along axis-1 for the 18S primers, suggesting high stochasticity and a lack of clear community structure at the daily temporal scale (Figure 2).
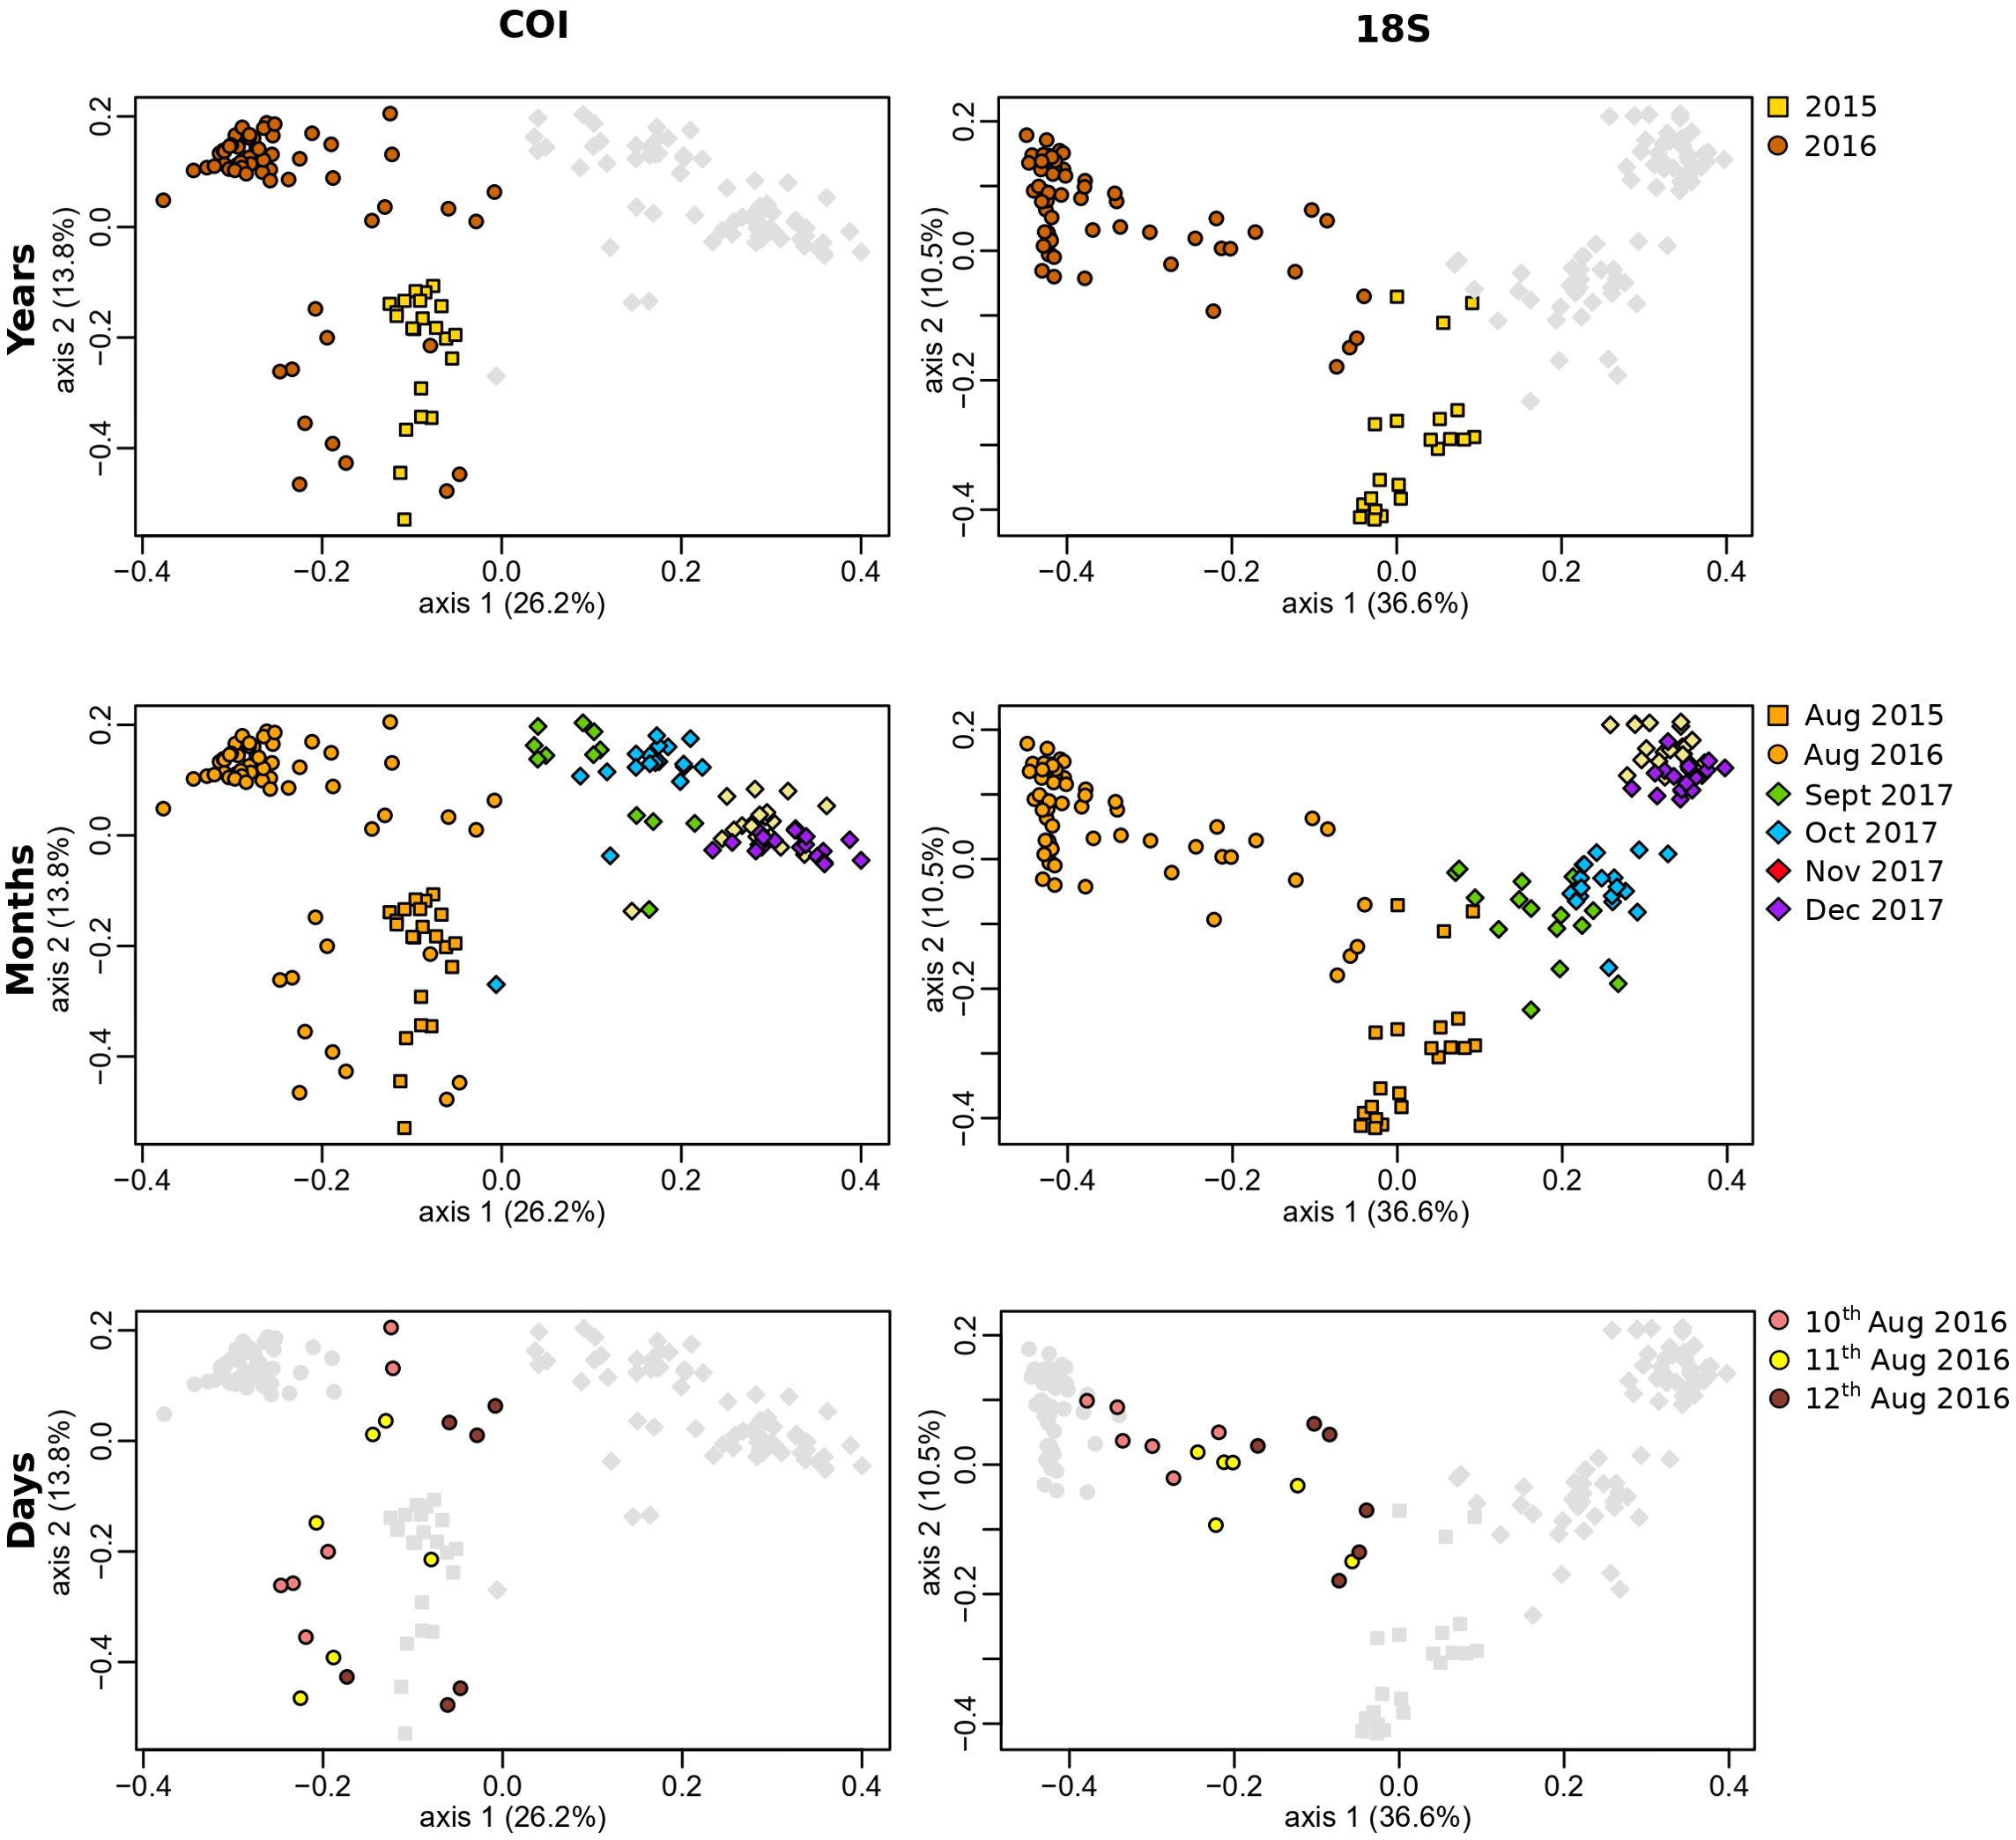
Figure 2. Principal coordinate analyses (PCoA) of Arctic coastal eDNA communities across different temporal sampling strategies, using COI and 18S gene primers. The analyses were conducted using Bray–Curtis dissimilarity distances after a Hellinger transformation in R. Axes represent the two dimensions explaining the highest proportion of variance in community composition. Each dot represents an individual eDNA sample, positioned according to its taxonomic composition. Dots in close proximity indicate greater similarity, whereas those farther apart indicate greater dissimilarity. All graphs display the full dataset, with gray dots representing samples not included in the specific analyses of years, months, and days, respectively.
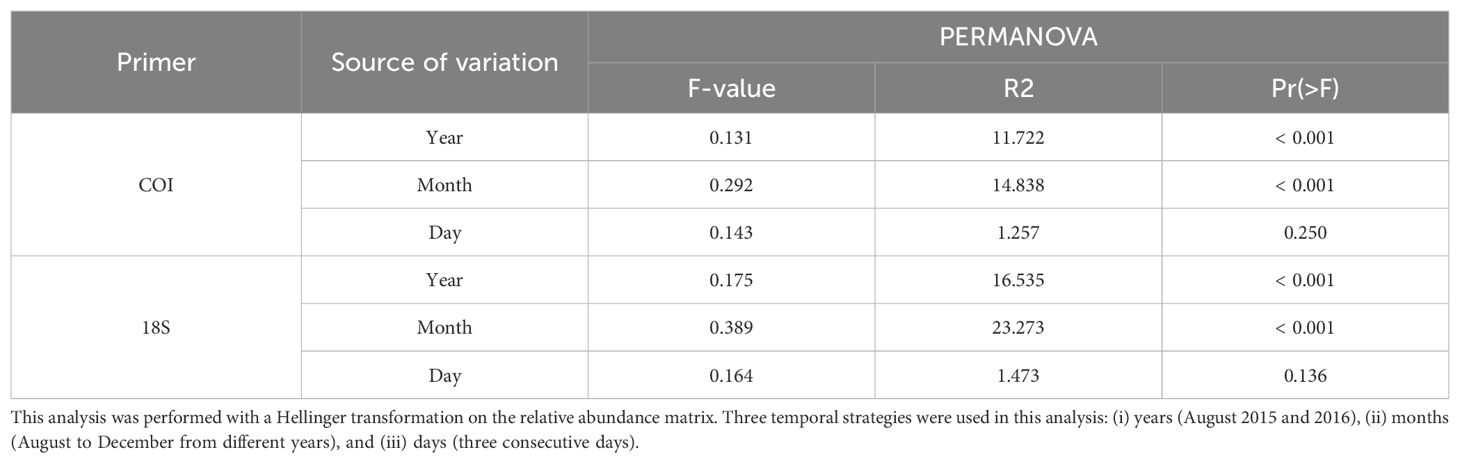
Table 1. Summary of PERMANOVA test statistics of Arctic eDNA communities for 18S and COI (see legend Figure 1).
Despite differences in the temporal sampling design, the eDNA communities shared similar dominant (most abundant) genera (Figure 3 for COI and Supplementary Figure S3 for 18S). Using the COI gene, the annelida Pectinaria, Nais, Chaetogaster, and Harmothoe were highly represented in the three temporal communities. Other commonly and highly detected taxa were the arthropods Acartia and Pseudocalanus, the mollusks Mytilus and Macoma, the cnidarians Aurelia and Hydra, and the chordate Delphinapterus. Similar patterns were observed with the 18S gene, where dominant genera included the mollusks Macoma and Mytilus, the cnidarian Laomedea, and the bryozoan Alcyonidium, all consistently present across the eDNA communities.
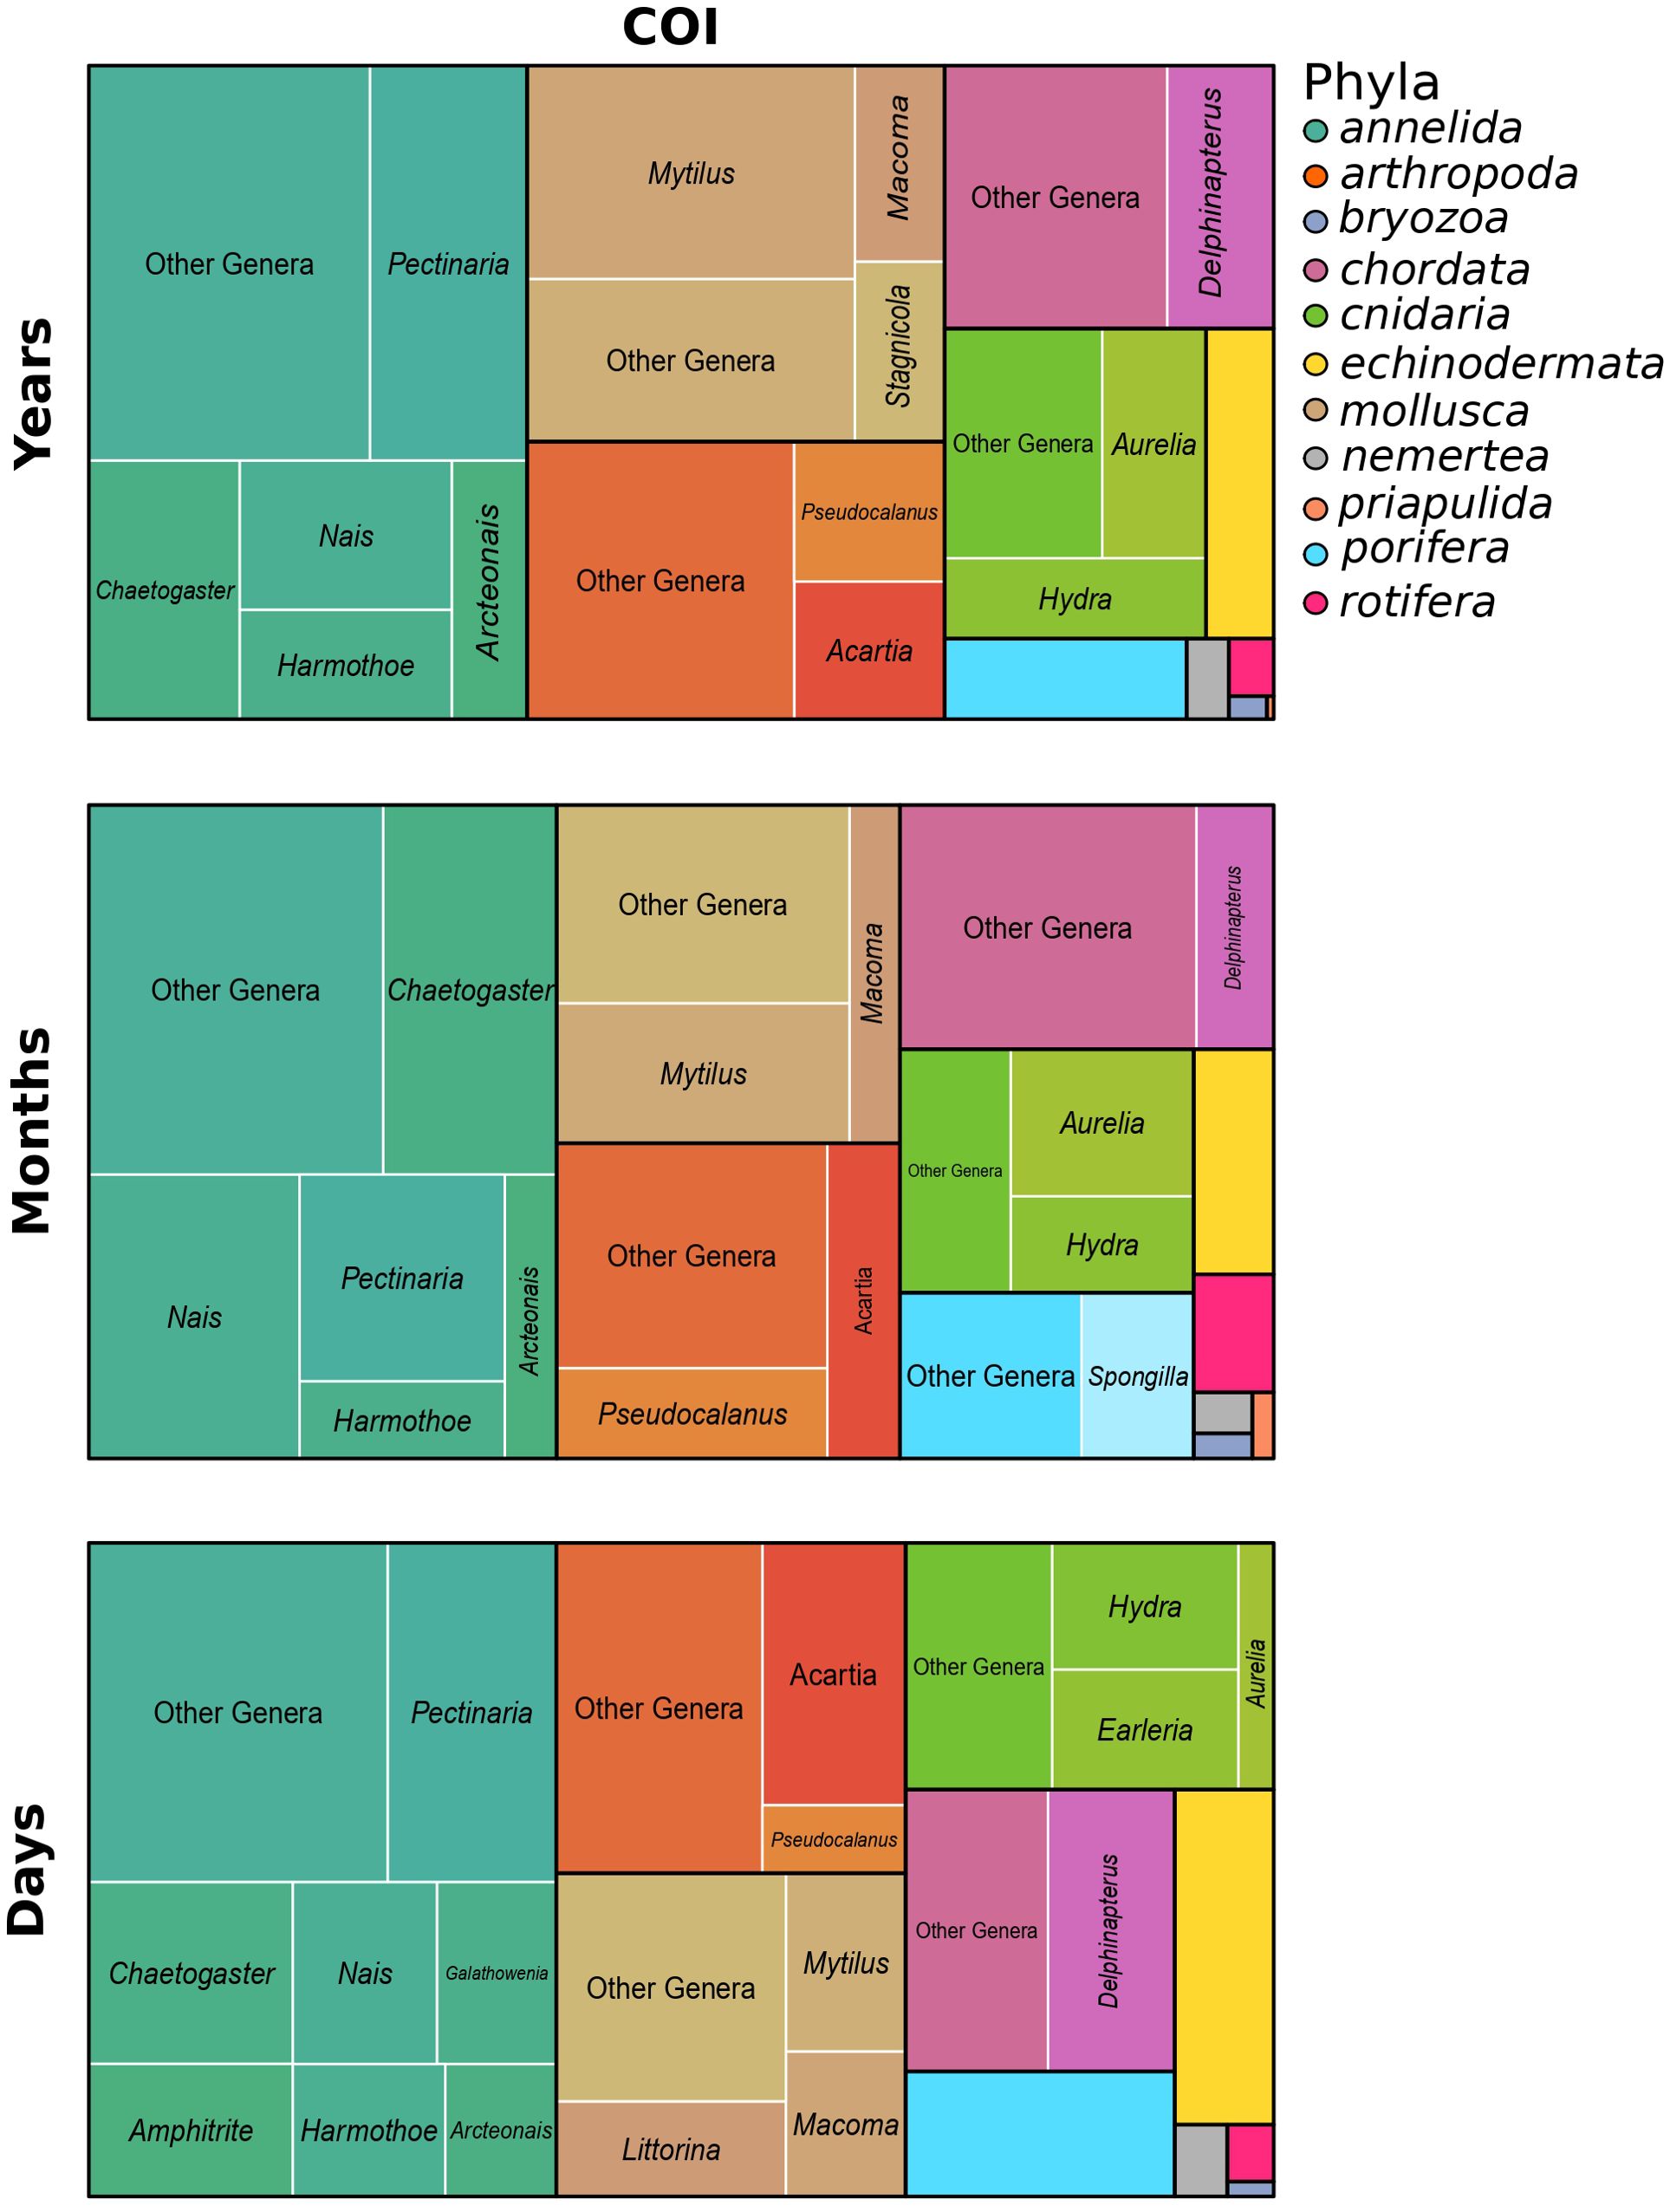
Figure 3. Tree map representations of eDNA community composition at the genus level for the three temporal sampling strategies using the COI primer. Each tree map is organized by phyla: the most abundant genera within a given phylum are labeled by name, whereas the less abundant ones are grouped under “other genera”. A corresponding figure displaying taxa identified with the 18S primer is provided in the Supplementary Materials (Supplementary Figure S3).
Consistent with the above previous results, the highest proportion of genera were shared between the yearly eDNA communities (COI: 63.9%; 18S: 55.1%). In contrast, a much lower proportion of shared genera were detected among the 5 months (COI: 25.1%; 18S: 16.7%) and the three consecutive days (COI: 48.3%; 18S: 38.7%) with both genes (Figure 4). Results from SIMPER were generally consistent with the Venn results. For COI, the overall average dissimilarity index was lower based on the yearly sampling strategy (63.49%) than for monthly (67.05%) and daily (64.71%) eDNA sampling strategies, indicating greater community similarity across years compared with months and days (Table 2). For the 18S gene, the overall average dissimilarity index was lower for the daily communities (61.41%) compared with the yearly (74.24%) or monthly communities (75.24%). For both COI and 18S, the overall average dissimilarity index decreased from September 2017 to December 2017, indicating that winter months presented a more stable eDNA community than summer or fall eDNA communities.
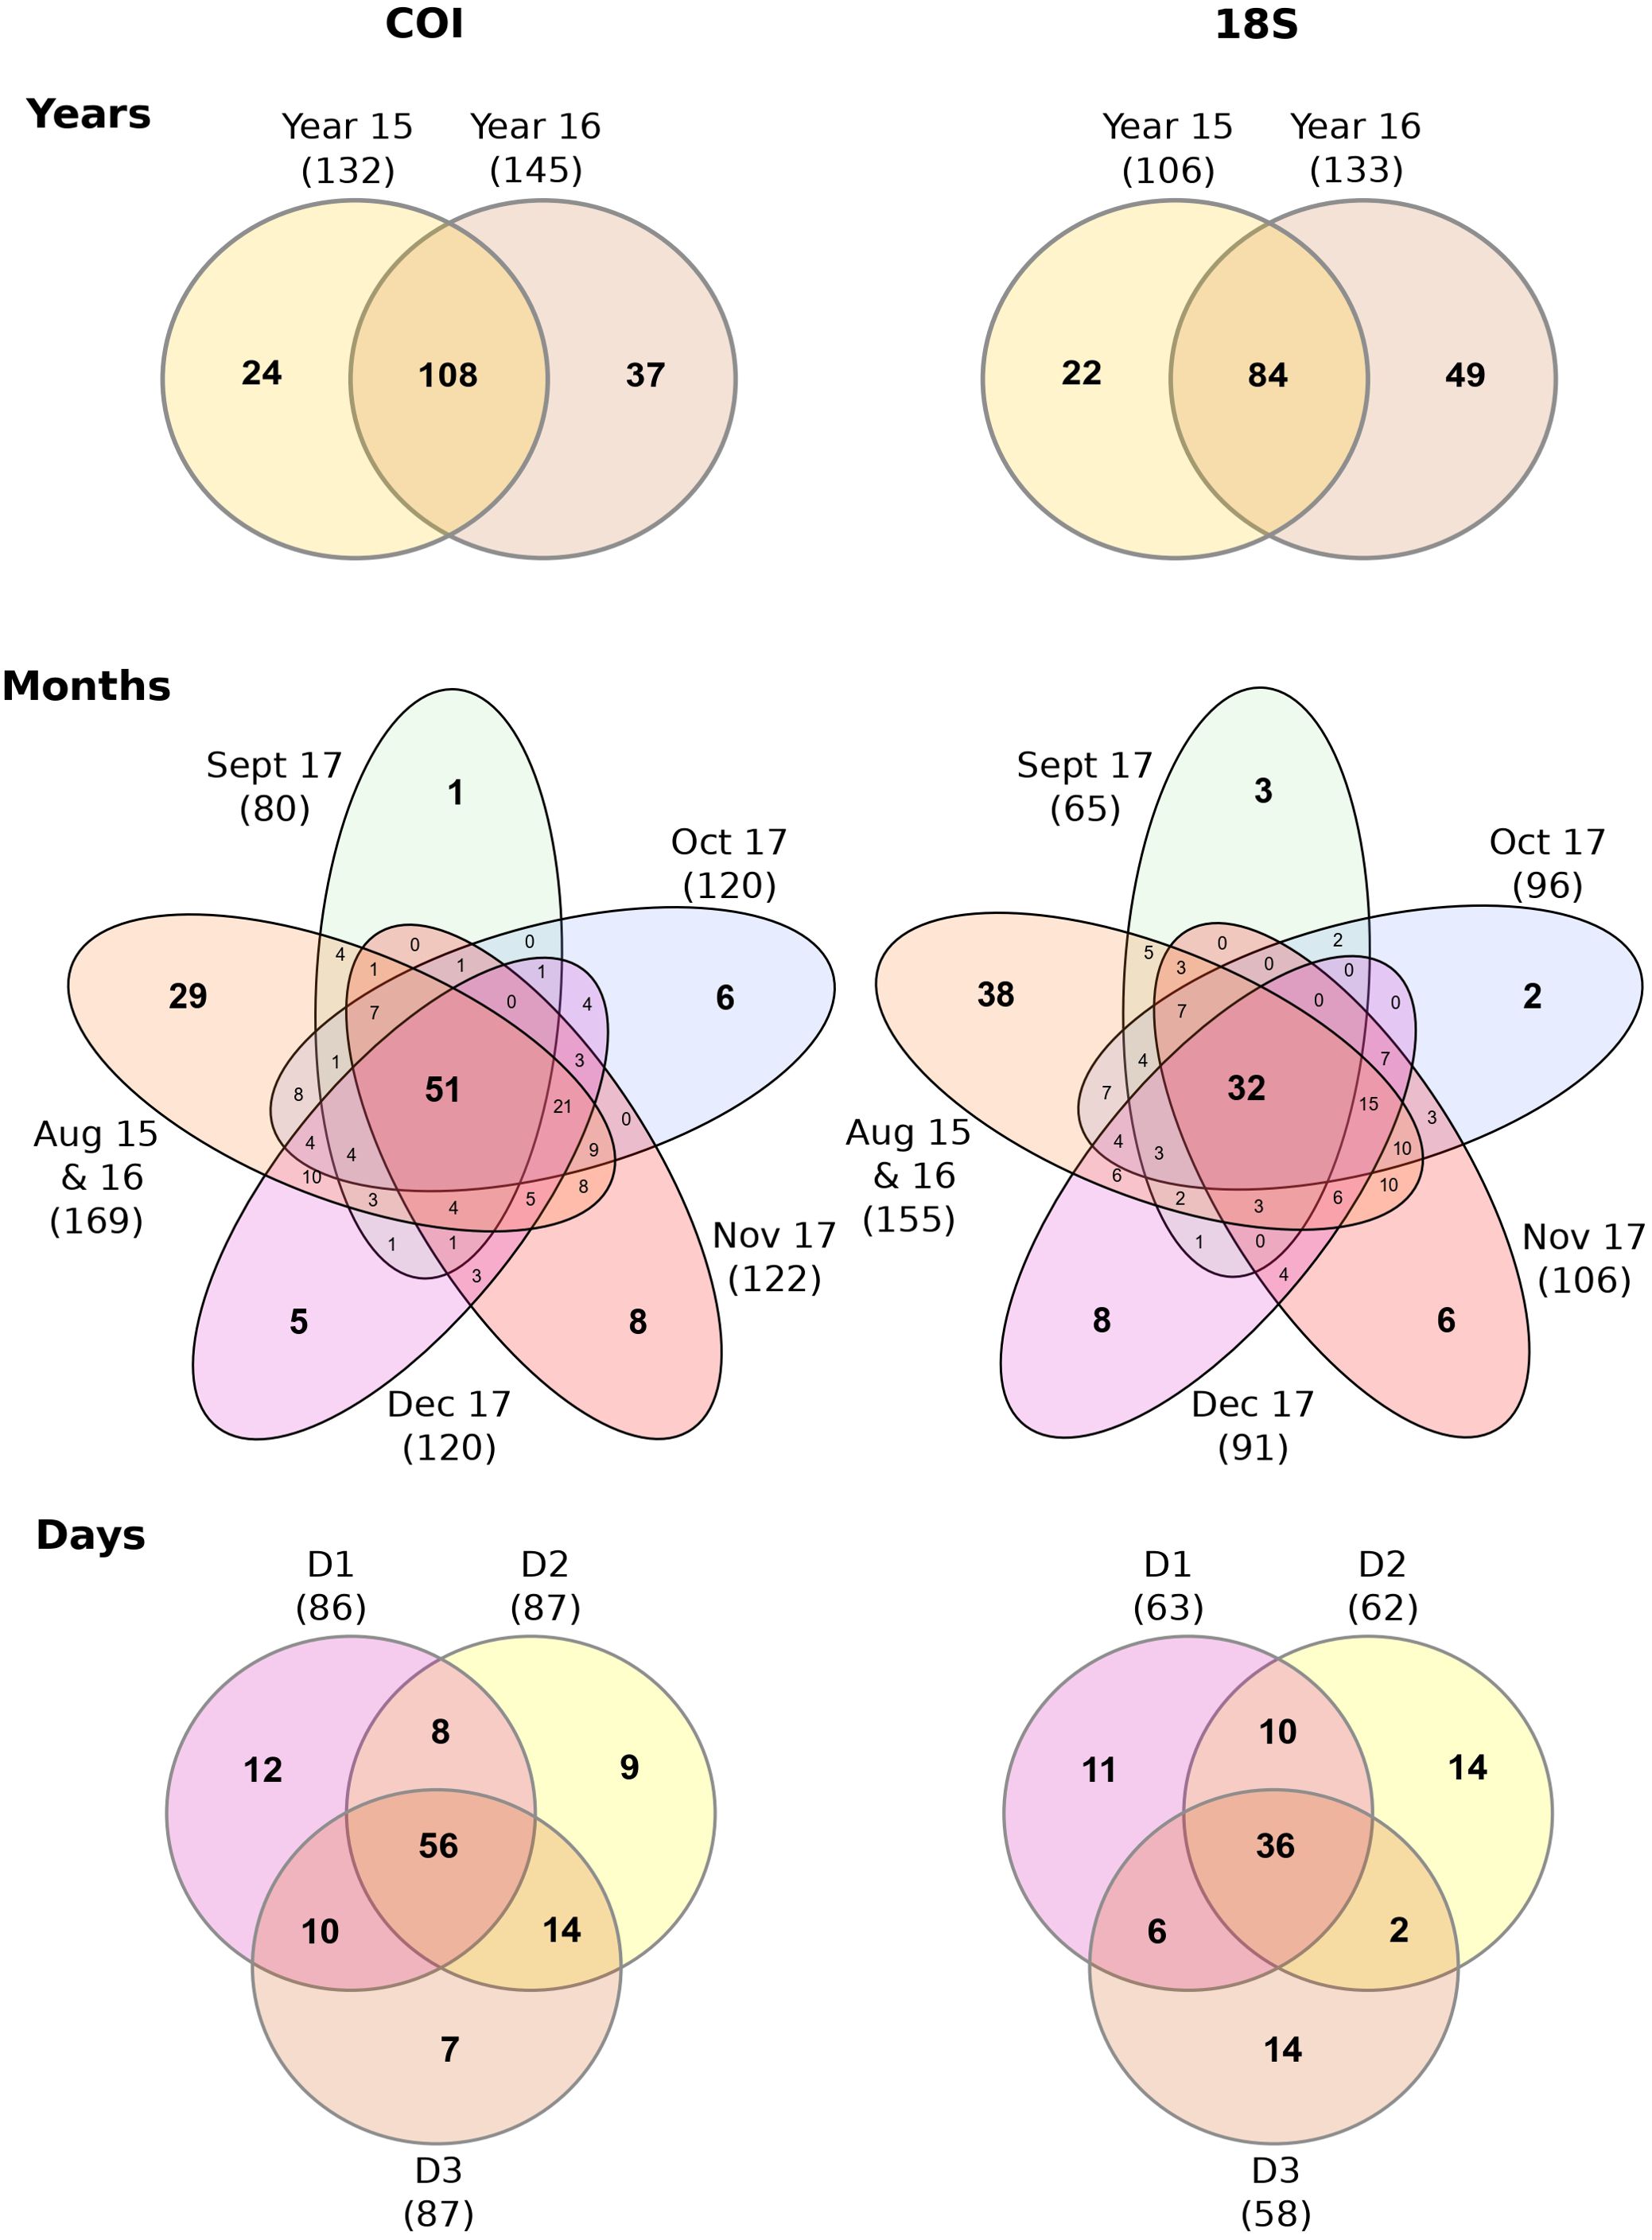
Figure 4. Venn diagram of Arctic eDNA communities at the genus level for different temporal sampling strategies. These figures were performed with the gene primers COI and 18S. Each color of the Venn diagram was unique and represented a given period of time within each temporal sampling strategy. Overlapping colors and numbers within indicate the shared genera shared (community stability) among time periods within the different temporal strategies.
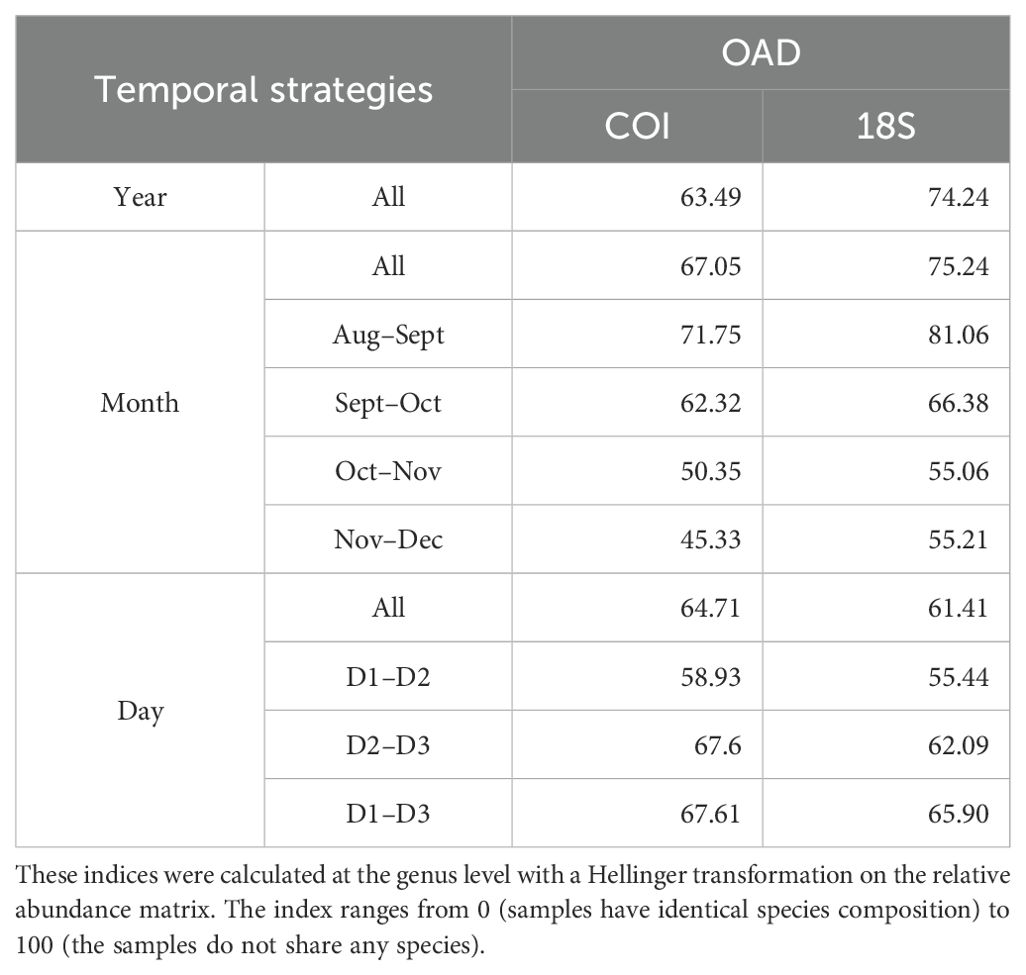
Table 2. The overall average dissimilarity (OAD) index from SIMPER analysis for eDNA communities for the year, month, and day temporal sampling strategies performed for both COI and 18S (see legend Figure 1).
For the COI primers, the three most dissimilar genera between years included the mollusk Mytilus (90.48% similarity), the copepod Pseudocalanus (93.17%), and the annelid Pectinaria (93.52%) (Supplementary Table S4). Across months, the most dissimilar genera for COI were the annelid Nais (94.56%), the bivalve Mytilus (94.78%), and the annelid Chaetogaster (95.19%) (Supplementary Table S5). For the daily sampling strategy, the percentage of similarity for the three most dissimilar taxa was 95% for the annelid Pectinaria, 95.84% for the copepod Acartia, and 96.14% for the annelid Galathowenia (Supplementary Table S6). The most dissimilar genera detected with the 18S primers are presented in the Supplementary Tables S7–S9.
For five highly detected genera representing different phyla, the relative abundance varied within and among the different temporal sampling strategies (Figure 5). All the genera had significant variation in abundance between months (Kruskal–Wallis test, P < 0.01, Table 3). Three genera, Nais, Aurelia, and Mytilus, displayed variation in abundance among years for the both gene primers (Table 3). Although no genera showed significant variation in abundance between days with the 18S primers, differences were observed for the genera Aurelia and Mytilus with the COI primers (Table 3; Figure 5). Interestingly, the temporal variation in relative abundance of these five genera was similar with the COI and 18S combined gene primers (Figure 5). For example, the cnidarian Aurelia was detected in August 2015 and 2016 as well as from September to November 2017, but not detected in December for either of the genes. Other genera with patterns of note included the tunicate Halocynthia which was characterized by detection in only a few samples forming a succession of eDNA peaks in August 2015 and 2016. The relative abundance of the freshwater sponge, Spongilla, tended to increase from August to December. Interestingly, the 1-week difference between the sampling of year temporal strategy (6 August 2016) and the daily strategy (10–12 August 2016) resulted in a rapid increase of annelid Nais relative abundance.
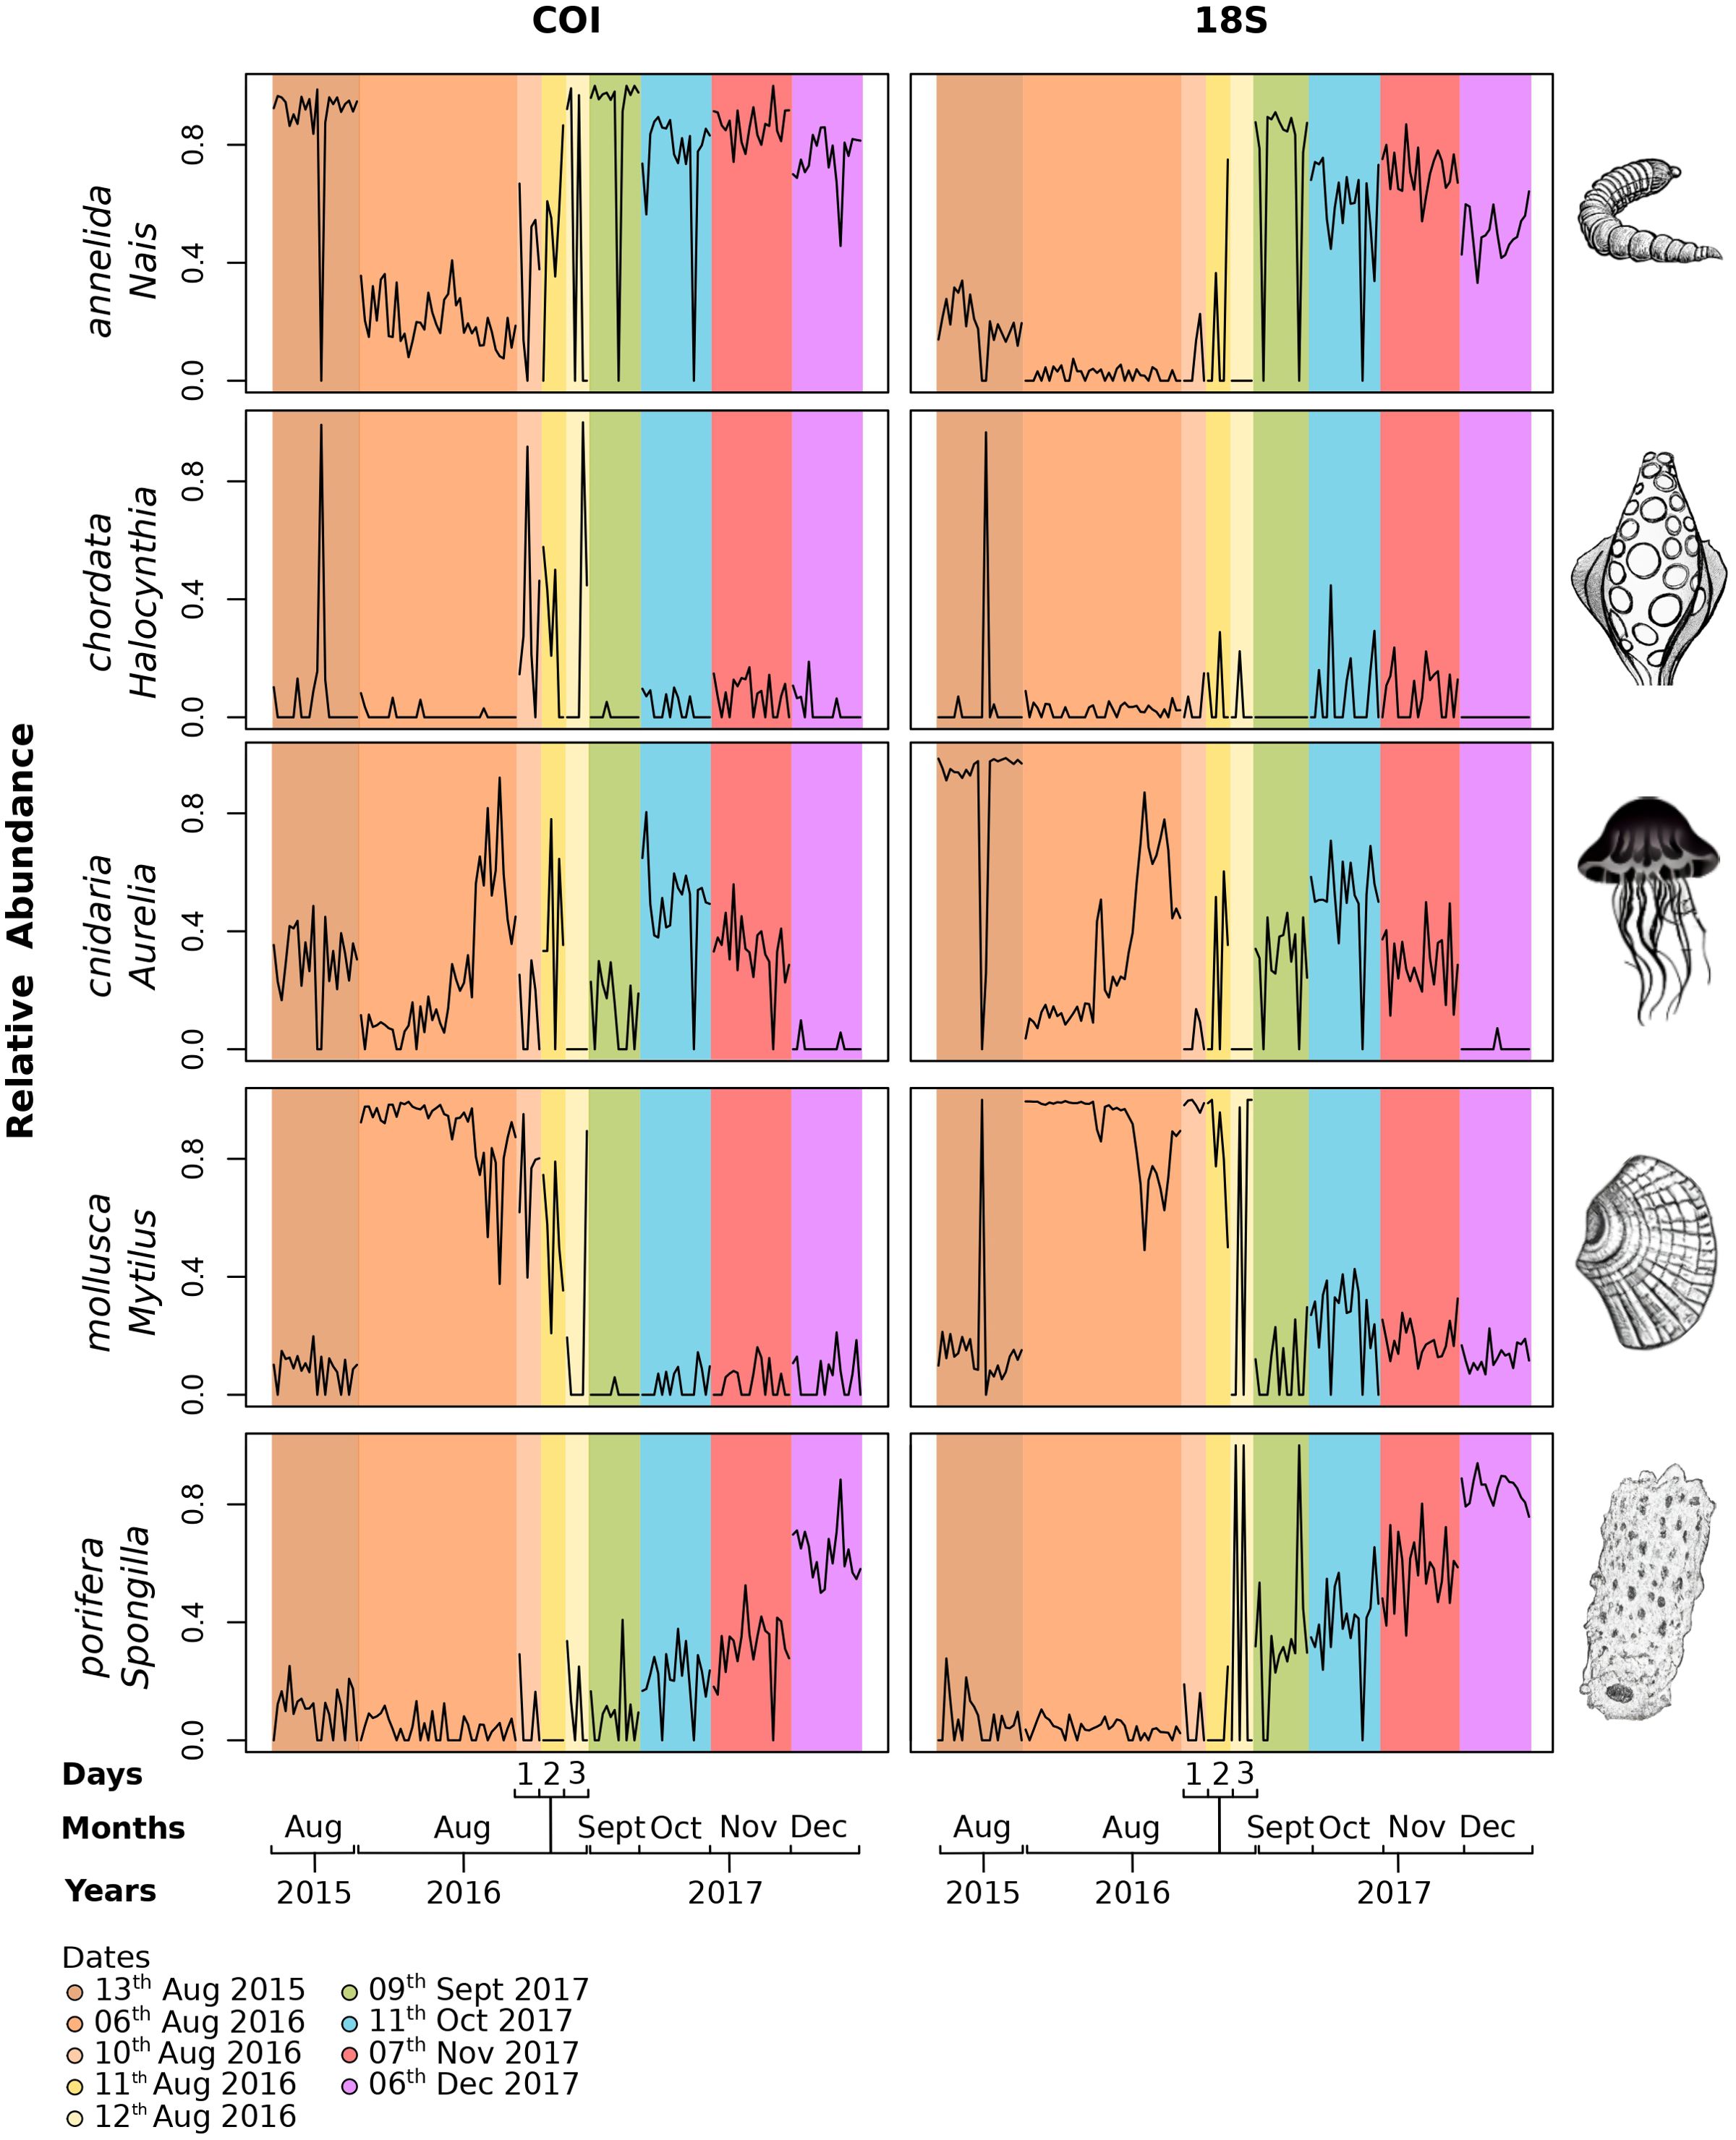
Figure 5. eDNA timeline distribution of representative Arctic genera from key phyla for both COI and 18S. These figures represent five highly detected genera which came from different phyla based on a relative abundance matrix after a Hellinger transformation.
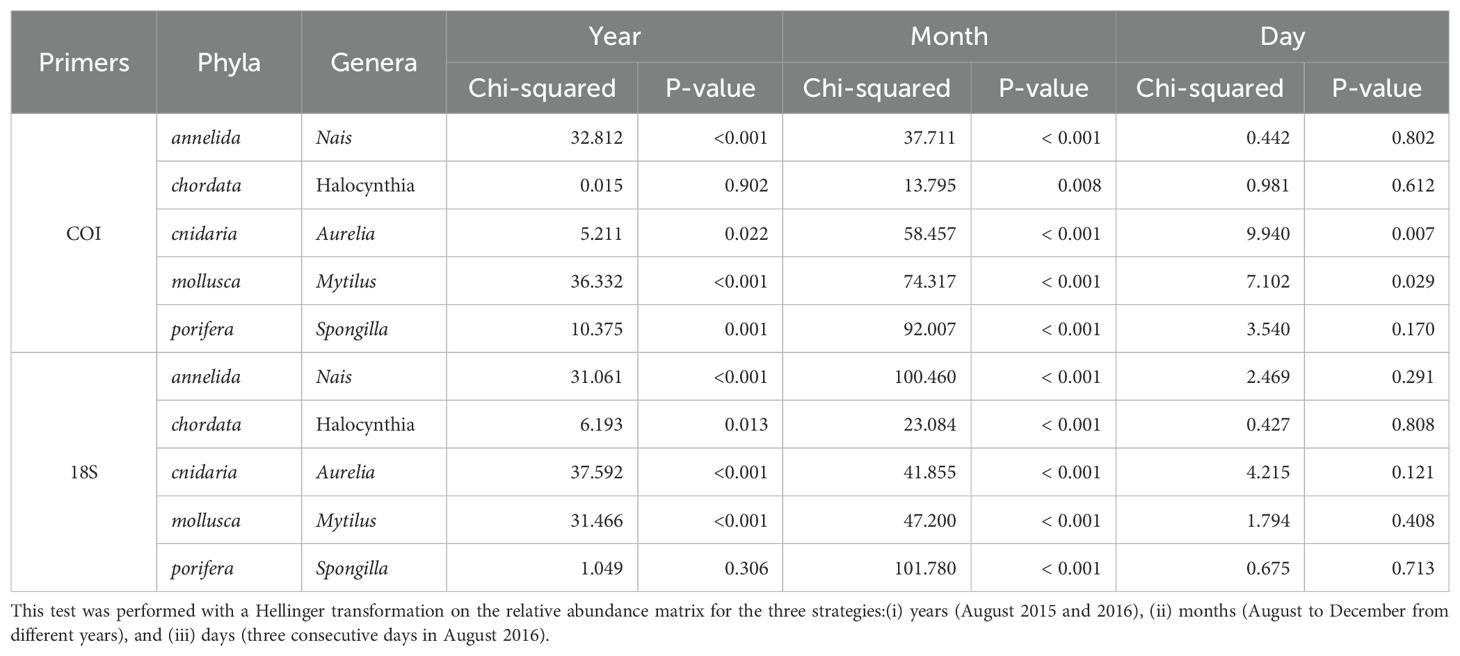
Table 3. Kruskal–Wallis test results performed on five representative genera from key phyla shared by all the samples for different temporal strategies for the combined 18S and COI primers (see legend Figure 1).
In recent years, eDNA metabarcoding has transformed how we survey ocean biodiversity (Deiner et al., 2017; Thompson and Thielen, 2023). DNA detection rates vary temporally due to biological and physical factors such as eDNA shedding, gametes/larval release/hatching, DNA degradation, and dispersal rates (Lacoursière-Roussel et al., 2016; Buxton et al., 2017; Salter, 2018; Wacker et al., 2019). In this study, we compared eDNA metabarcoding data from three temporal sampling strategies to inform how eDNA metabarcoding sampling strategies can reliably inform us about long-term biodiversity trends. Our findings contribute to improved knowledge of short- and long-term variability of eDNA in coastal ecosystems to help design eDNA research and monitoring programs and interpretation of eDNA changes over time. Comparison of community structure for the interannual temporal sampling strategy revealed a high proportion of shared taxa despite the fact that daily eDNA communities had high variability in this dynamic estuarine ecosystem. However, monthly collections captured the greatest overall taxa richness among temporal sampling strategies. This improved sampling efficiency translates into reduced lab work and costs.
A clear interannual recurrence in eDNA taxa composition was observed during the summer period covered by our dataset, consistent with what is known from long-term studies in other estuarine habitats (Flint, 1985). Indeed, diversity and abundance of estuarine taxa have been shown to change over an annual cycle in a generally recurring year-to-year pattern controlled by the phenology of species and abiotic environmental parameters such as temperature and light availability (Boero, 1994) with demonstrated stability in biological communities over the long term (Schrandt and MacDonald, 2020). The annual recurrence of marine communities is well known thanks to long-term series observations, such as those at the Western Channel Observatory in the English Channel or the Boknis Eck Time Series Station in the Baltic Sea (Southward et al., 2004; Lennartz et al., 2014). To date, only a handful of studies have used eDNA metabarcoding to monitor marine eDNA communities over a long time series (Ip et al., 2023; Sildever et al., 2023; Chrismas et al., 2023). For example, Ip et al. (2023) demonstrated that eDNA metabarcoding is an effective tool for detecting annual coral spawning events in Singapore’s tropical reefs. Over a 3-year period, they identified recurring spawning events for 38 coral and 133 fish species, showing that eDNA metabarcoding can quickly provide valuable ecological insights, particularly on previously overlooked spawning-related activities, helping to solve knowledge gaps.
Monthly trends from a variety of studies support that eDNA detection rates vary with marine biota life cycle activities such as species distributions, phenology, metabolic rate, migration timing, and reproduction (e.g., Djurhuus et al., 2020). Previous studies have also highlighted similar eDNA variations and potential relationships linked to the life cycle of organisms in marine communities (Dunn et al., 2017; Djurhuus et al., 2020; Sevellec et al., 2021). The observed transition in eDNA taxa composition from summer to fall across different years likely reflects the life cycle of organisms in the estuarine community as well as their adaptation to seasonal changes in abiotic and biotic factors (Carvalho et al., 2024). For example, the high relative abundance of the taxon Mytilus observed during our study in August 2016 could potentially correspond to a spawning event (Storhaug et al., 2019). Similarly, for the genus Aurelia, a high relative abundance was observed in August 2016, suggesting an eDNA peak that could be associated with a bloom (e.g., Peng et al., 2023) or larval recruitment (Giussani et al., 2016). Likewise, large blooms of Aurelia medusae, which have been increasing in frequency worldwide, are associated with warming and increased zooplankton densities (Goldstein and Steiner, 2020) characteristic of late summer conditions in the Churchill estuary.
Among all the temporal strategies we examined, a high number of shared taxa were observed, indicating that a large number of taxa release their DNA in a temporally stable manner into the water column (Supplementary Table S10). Moreover, our results indicate a more stable eDNA community in winter compared with summer (Table 2). Although eDNA production, influenced by biological factors such as metabolic rate and reproduction, slows down during winter, degradation rates are also lower in the Arctic waters due to colder temperatures and ice cover reducing UV-B levels and diminishing microbial activity (Caza-Allard et al., 2022; Strickler et al., 2015). As a result, winter eDNA ecology, from production to degradation, is more stable than that of summer or fall.
Although the monthly temporal design is an efficient sampling strategy to capture seasonal patterns and maximize representation of biodiversity, a higher-frequency sampling design, such as a bi-monthly sampling, could provide more reliable data for detecting long-term shifts, as expected in the Arctic (Rademaker et al., 2024). For example, in our study, the relative abundance of the genera Aurelia and Halocynthia was highly variable, even within a 1-week period.
With the daily sampling strategy, biological communities varied highly among consecutive dates, which is likely reflective of the natural change in the estuarine community due to biological factors such as behavior, mobility, migratory, or reproduction cycles (Bluhm and Gradinger, 2008; Dowell et al., 2024) but also daily variation in physical factors such as freshwater inputs, wind, and temperature (Stewart, 2019; Rourke et al., 2022). Like all biomonitoring methods, eDNA metabarcoding allows observation of a fraction of the total marine or estuarine communities at a given moment. Given that rarefaction curves seemed to have remained further from saturation for daily sampling, sample collection at multiple time points within a day or over several days should provide a more comprehensive picture of surveyed communities, improving the probability of detecting rare taxa. Furthermore, knowledge on how gaps in reference sequence databases and primer bias can alter detection patterns among different sampling periods will improve abilities to interpret eDNA changes over time (Van der Loos and Nijland, 2021).
Identifying optimal eDNA sampling frequencies and time periods for a given system will increase the detection rates of local communities. Annual recurrence in eDNA communities combined with monthly sampling indicates potential for optimizing sampling during peak periods of marine life activity. For well-studied taxa, sampling at an annual scale during optimal periods could substantially increase knowledge of phenology and track how life history events and populations of individual taxa and/or biological communities may change over longer time scales with, for example, changing climatic conditions or increased industrial development. In order to gauge such optimal periods, monthly or even weekly eDNA surveys over potential periods of interest during the year would be recommended.
Efficient sampling strategies are essential to acquiring eDNA datasets that are as robust and informative as possible. Here, we observed that sampling at multiple time points provides a more holistic view of Arctic estuarine communities. This study suggests that, when using eDNA metabarcoding, monthly sampling is likely the most optimal strategy to effectively capture a comprehensive portrait of estuarine communities. Ideally, such a sampling strategy can be studied over multiple years to follow annual patterns of eDNA communities. However, if time and resources are limited, repeat sampling at a consistent time of year could offer a viable alternative to monitoring for long-term changes in coastal communities, based on our observations of annual stability in a large component of the eDNA community. A better understanding of the biological and physical factors affecting eDNA presence for taxa of interest is fundamental for optimizing eDNA sampling and resources, achieving more accurate predictions of eDNA communities.
The datasets presented in this study can be found in online repositories. The names of the repository/repositories and accession number(s) can be found below: https://www.ncbi.nlm.nih.gov/, PRJNA436081.
Ethical approval was not required for the study involving animals in accordance with the local legislation and institutional requirements because environmental DNA is no invasive.
MS: Formal analysis, Writing – original draft, Writing – review & editing. AL-R: Conceptualization, Funding acquisition, Methodology, Supervision, Writing – review & editing. EN: Software, Writing – review & editing. LB: Conceptualization, Funding acquisition, Resources, Writing – review & editing. KH: Conceptualization, Funding acquisition, Resources, Writing – review & editing.
The author(s) declare financial support was received for the research, authorship, and/or publication of this article. This research was supported by ArcticNet Funding to AL-R, LB, and KH, Polar Knowledge Canada Funding to KH, LB, and AL-R (Award Number: PKC-NST-1617-0016A), and Fisheries and Oceans Canada (Aquatic Invasive Species Monitoring and Arctic Science) Funding to KH.
We acknowledge that this research was conducted on the unceded and unsurrendered traditional territories of Mé tis peoples (Churchill Estuary Hudson Bay). We are grateful to L. Bernatchez who helped to conceive ideas and secure funding for the project as well as providing lab facilities and expertise before he passed away. We appreciate all of his support and contributions throughout the study. We thank V. Cypihot, A. Dispas, F. Hartog, N. Leduc, and staff of the Churchill Northern Studies Center (L. Fishback, T. Taylor, E. Roberts, and F. LeTaro) for assisting with field logistics and sample collection. We are grateful to C. Hernandez, A. Perreault-Payette, B. Bougas, and L. Deslauriers who performed laboratory work and B. Boyle for his help with the Illumina MiSeq sequencing. This work benefited from feedback received during presentations of draft results to the International Council for Exploration of the Seas (ICES) Expert Working Groups on Ballast Water and Other Shipping Vectors and Introductions and Transfers of Marine Organisms.
The authors declare that the research was conducted in the absence of any commercial or financial relationships that could be construed as a potential conflict of interest.
The author(s) declare that no Generative AI was used in the creation of this manuscript.
All claims expressed in this article are solely those of the authors and do not necessarily represent those of their affiliated organizations, or those of the publisher, the editors and the reviewers. Any product that may be evaluated in this article, or claim that may be made by its manufacturer, is not guaranteed or endorsed by the publisher.
The Supplementary Material for this article can be found online at: https://www.frontiersin.org/articles/10.3389/fmars.2025.1522677/full#supplementary-material
Bálint M., Pfenninger M., Grossart H.-P., Taberlet P., Vellend M., Leibold M. A., et al. (2018). Environmental DNA time series in ecology. TREE 33, 945–957. doi: 10.1016/j.tree.2018.09.003
Bluhm B. A., Gradinger R. (2008). Regional variability in food availability for arctic marine mammals. Ecol. Appl. 18, S77–S96. doi: 10.1890/06-0562.1
Boero F. (1994). Fluctuations and variations in coastal marine environments. Mar. Ecol. 15, 3–25. doi: 10.1111/j.1439-0485.1994.tb00038.x
Buxton A. S., Groombridge J. J., Zakaria N. B., Griffiths R. A. (2017). Seasonal variation in environmental DNA in relation to population size and environmental factors. Sci. Rep. 7, 46294. doi: 10.1038/srep46294
Carvalho C. O., Gromstad W., Dunthorn M., Karlsen H. E., Schrøder-Nielsen A., Ready J. S., et al. (2024). Harnessing eDNA metabarcoding to investigate fish community composition and its seasonal changes in the oslo fjord. Sci. Rep. 14, 10154. doi: 10.1038/s41598-024-60762-8
Caza-Allard I., Laporte M., Côté G., April J., Bernatchez L. (2022). Effect of biotic and abiotic factors on the production and degradation of fish environmental DNA: an experimental evaluation. Environ. DNA 4, 453–468. doi: 10.1002/edn3.266
Chrismas N., Allen R., Allen M. J., Bird K., Cunliffe M. (2023). A 17-year time-series of fungal environmental DNA from a coastal marine ecosystem reveals long-term seasonal-scale and inter-annual diversity patterns. Proc. R. Soc B 290, 20222129. doi: 10.1098/rspb.2022.2129
Closek C. J., Santora J. A., Starks H. A., Schroeder I. D., Andruszkiewicz E. A., Sakuma K. M., et al. (2019). Marine vertebrate biodiversity and distribution within the central california current using environmental DNA (eDNA) metabarcoding and ecosystem surveys. Front. Mar. Sci. 6. doi: 10.3389/fmars.2019.00732
Collins R. A., Baillie C., Halliday N. C., Rainbird S., Sims D. W., Mariani S., et al. (2022). Reproduction influences seasonal eDNA variation in a temperate marine fish community. Limnol. Oceanogr 7, 443–449. doi: 10.1002/lol2.10271
Deiner K., Bik H. M., Mächler E., Seymour M., Lacoursière-Roussel A., Altermatt F., et al. (2017). Environmental DNA metabarcoding: transforming how we survey animal and plant communities. Mol. Ecol. 26, 5872. doi: 10.1111/mec.14350
de Souza L. S., Godwin J. C., Renshaw M. A., Larson E. (2016). Environmental DNA (eDNA) detection probability is influenced by seasonal activity of organisms. PloS One 11, e0165273. doi: 10.1371/journal.pone.0165273
Di Capua I., Piredda R., Mazzocchi M. G., Zingone A. (2021). Metazoan Diversity and Seasonality through eDNA Metabarcoding at a Mediterranean Long-Term Ecological Research Site. ICES J. Mar. Sci. 78, 3303–3316. doi: 10.1093/icesjms/fsab059
Djurhuus A., Closek C. J., Kelly R. P., Pitz K. J., Michisaki R. P., Starks H. A., et al. (2020). Environmental DNA reveals seasonal shifts and potential interactions in a marine community. Nat. Commun. 11, 254. doi: 10.1038/s41467-019-14105-1
Dowell R., Dunn N., Head C., Yesson C., Williams J., Ransome E. (2024). Environmental DNA captures diurnal fluctuations of surface eukaryotes on a tropical coral reef. Environ. DNA 6, e512. doi: 10.1002/edn3.512
Drake L. E., Cuff J. P., Young R. E., Marchbank A., Chadwick E. A., Symondson W. O. C. (2022). An assessment of minimum sequence copy thresholds for identifying and reducing the prevalence of artefacts in dietary metabarcoding data. Methods Ecol. Evol. 13, 694–710. doi: 10.1111/2041-210X.13780
Ducklow H. W., Doney S. C., Steinberg D. K. (2009). Contributions of long-term research and time-series observations to marine ecology and biogeochemistry. Ann. Rev. Mar. Sci. 1, 279–302. doi: 10.1146/annurev.marine.010908.163801
Dunn N., Priestley V., Herraiz A., Arnold R., Savolainen V. (2017). Behavior and season affect crayfish detection and density inference using environmental DNA. Ecol. Evol. 7, 7777–7785. doi: 10.1002/ece3.3316
Ely T., Barber P. H., Man L., Gold Z. (2021). Short-lived detection of an introduced vertebrate eDNA signal in a nearshore rocky reef environment. PloS One 16, e0245314. doi: 10.1371/journal.pone.0245314
Flint R. W. (1985). Long-term estuarine variability and associated biological response. Estuaries 8, 158–169. doi: 10.2307/1351865
Folmer O., Black M., Hoeh W., Lutz R., Vrijenhoek R. (1994). DNA primers for amplification of mitochondrial cytochrome c oxidase subunit I from diverse metazoan invertebrates. Mol. Mar. Biol. Biotechnol. 3, 294–299.
Fontaine D. N., Rynearson T. A. (2023). Multi-year time series reveals temporally synchronous diatom communities with annual frequency of recurrence in a temperate estuary. Limnol. Oceanogr 68, 1982–1994. doi: 10.1002/lno.12400
Garcia-Soto C., Cheng L., Caesar L., Schmidtko S., Jewett E. B., Cheripka A., et al. (2021). An overview of ocean climate change indicators: sea surface temperature, ocean heat content, ocean pH, dissolved oxygen concentration, arctic sea ice extent, thickness and volume, sea level and strength of the AMOC (Atlantic meridional overturning circulation). Front. Mar. Sci. 8. doi: 10.3389/fmars.2021.642372
Geller J., Meyer C., Parker M., Hawk H. (2013). Redesign of PCR primers for mitochondrial cytochrome c oxidase subunit I for marine invertebrates and application in all-taxa biotic surveys. Mol. Ecol. Resour 13, 851–861. doi: 10.1111/1755-0998.12138
Geraldi N. R., Krause-Jensen D., Ørberg S. B., Frühe L., Sejr M. K., Hansen J. L. S., et al. (2024). Environmental drivers of arctic communities based on metabarcoding of marine sediment eDNA. Proc. R. Soc B 291, 20231614. doi: 10.1098/rspb.2023.1614
Giussani V., Costa E., Pecorino D., Berdalet E., De Giampaulis G., Gentile M., et al. (2016). Effects of the harmful dinoflagellate ostreopsis cf. Ovata on different life cycle stages of the common moon jellyfish aurelia sp. Harmful Algae 57, 49–58. doi: 10.1016/j.hal.2016.05.005
Goldberg C. S., Turner C. R., Deiner K., Klymus K. E., Thomsen P. F., Murphy M. A., et al. (2016). Critical considerations for the application of environmental DNA methods to detect aquatic species. Methods Ecol. Evol. 7, 1299–1307. doi: 10.1111/2041-210X.12595
Goldstein J., Steiner U. K. (2020). Ecological drivers of jellyfish blooms – the complex life history of a “Well-known” Medusa (Aurelia aurita). J. Anim. Ecol. 89, 910–920. doi: 10.1111/1365-2656.13147
Hadziavdic K., Lekang K., Lanzen A., Jonassen I., Thompson E. M., Troedsson C. (2014). Characterization of the 18S rRNA gene for designing universal eukaryote specific primers. PloS One 9, e87624. doi: 10.1371/journal.pone.0087624
Hammer Ø., Harper D. A. T., Ryan P. D. (2005). PAST–Palaeontological statistics, ver. 1.34. Palaeontol. Electron 4, (9).
Handley L. L., Read D. S., Winfield I. J., Kimbell H., Johnson H., Li J., et al. (2019). Temporal and spatial variation in distribution of fish environmental DNA in englands largest lake. Environ. DNA 1, 26–39. doi: 10.1002/edn3.5
Heberle H., Meirelles G. V., da Silva F. R., Telles G. P., Minghim R. (2015). InteractiVenn: A web-based tool for the analysis of sets through venn diagrams. BMC Bioinform. 16, 169. doi: 10.1186/s12859-015-0611-3
Ip Y. C. A., Chang J. J. M., Tun K. P. P., Meier R., Huang D. (2023). Multispecies environmental DNA metabarcoding sheds light on annual coral spawning events. Mol. Ecol. 32, 6474–6488. doi: 10.1111/mec.16621
Jensen M. R., Sigsgaard E. E., de Paula Ávila M., Agersnap S., Brenner-Larsen W., Sengupta M. E., et al. (2022). Short-term temporal variation of coastal marine eDNA. Environ. DNA 4, 747–762. doi: 10.1002/edn3.285
Kelly R. P., Gallego R., Jacobs-Palmer E. (2018). The effect of tides on nearshore environmental DNA. PeerJ 6, e4521. doi: 10.7717/peerj.4521
Kelly R. P., Shelton A. O., Gallego R. (2019). Understanding PCR processes to draw meaningful conclusions from environmental DNA studies. Sci. Rep. 9, 12133. doi: 10.1038/s41598-019-48546-x
Koenigstein S. (2020). “Arctic Marine Ecosystems, Climate Change Impacts, and Governance Responses: An Integrated Perspective from the Barents Sea,” in Arctic Marine Sustainability: Arctic Maritime Businesses and the Resilience of the Marine Environment (Springer International Publishing, Cham), 45–71. doi: 10.1007/978-3-030-28404-6_3
Lacoursière-Roussel A., Howland K., Normandeau E., Grey E. K., Archambault P., Deiner K., et al. (2018). eDNA metabarcoding as a new surveillance approach for coastal arctic biodiversity. Ecol. Evol. 8, 7763–7777. doi: 10.1002/ece3.4213
Lacoursière-Roussel A., Rosabal M., Bernatchez L. (2016). Estimating Fish Abundance and Biomass from eDNA Concentrations: Variability among Capture Methods and Environmental Conditions. Mol. Ecol. Resour 16, 1401–1414. doi: 10.1111/1755-0998.12522
Laporte M., Reny-Nolin E., Chouinard V., Hernandez C., Normandeau E., Bougas B., et al. (2021). Proper environmental DNA metabarcoding data transformation reveals temporal stability of fish communities in a dendritic river system. Environ. DNA 3, 1007–1022. doi: 10.1002/edn3.224
Laramie M. B., Pilliod D. S., Goldberg C. S. (2015). Characterizing the distribution of an endangered salmonid using environmental DNA analysis. Biol. Conserv. 183, 29–37. doi: 10.1016/j.biocon.2014.11.025
Leduc N., Lacoursière-Roussel A., Howland K. L., Archambault P., Sevellec M., Normandeau E., et al. (2019). Comparing eDNA metabarcoding and species collection for documenting arctic metazoan biodiversity. Environ. DNA 1, 342. doi: 10.1002/edn3.35
Lennartz S. T., Lehmann A., Herrford J., Malien F., Hansen H.-P., Biester H., et al. (2014). Long-term trends at the boknis eck time series station (Baltic sea), 1957–2013: does climate change counteract the decline in eutrophication? Biogeosciences 11, 6323–6339. doi: 10.5194/bg-11-6323-2014
Leray M., Yang J. Y., Meyer C. P., Mills S. C., Agudelo N., Ranwez V., et al. (2013). A new versatile primer set targeting a short fragment of the mitochondrial COI region for metabarcoding metazoan diversity: application for characterizing coral reef fish gut contents. Front. Zoo 10, 34. doi: 10.1186/1742-9994-10-34
Mathieu C., Hermans S. M., Lear G., Buckley T. R., Lee K. C., Buckley H. L. (2020). A systematic review of sources of variability and uncertainty in eDNA data for environmental monitoring. Front. Ecol. Evol. 8. doi: 10.3389/fevo.2020.00135
Murray A., Priest T., Antich A., von Appen W.-J., Neuhaus S., Havermans C. (2024). Investigating pelagic biodiversity and gelatinous zooplankton communities in the rapidly changing european arctic: an eDNA metabarcoding survey. Environ. DNA 6, e569. doi: 10.1002/edn3.569
Peng S., Wang L., Ma Y., Ye L., Hou C., Liu Y., et al. (2023). Application of environmental DNA metabarcoding and quantitative PCR to detect blooming jellyfish in a temperate bay of northern China. Ecol. Evol. 13, e10669. doi: 10.1002/ece3.10669
Post E., Forchhammer M. C., Bret-Harte M. S., Callaghan T. V., Christensen T. R., Elberling B., et al. (2009). Ecological dynamics across the arctic associated with recent climate change. Science 325, 1355–1358. doi: 10.1126/science.1173113
Rademaker M., Peck M. A., van Leeuwen A. (2024). Local reflects global: life stage-dependent changes in the phenology of coastal habitat use by north sea herring. Glob. Change Biol. 30, e17285. doi: 10.1111/gcb.17285
R Core Team (2013). R: A Language and Environment for Statistical Computing (Vienna, Austria: Foundation for Statistical Computing).
Rourke M. L., Fowler A. M., Hughes J. M., Broadhurst M. K., DiBattista J. D., Fielder S., et al. (2022). Environmental DNA (eDNA) as a tool for assessing fish biomass: A review of approaches and future considerations for resource surveys. Environ. DNA 4, 9–33. doi: 10.1002/edn3.185
Salter I. (2018). Seasonal variability in the persistence of dissolved environmental DNA (eDNA) in a marine system: the role of microbial nutrient limitation. PloS One 13, e0192409. doi: 10.1371/journal.pone.0192409
Schrandt M. N., MacDonald T. C. (2020). Long-term stability of the faunal community of a subtropical estuary: evaluating disturbances in the context of interannual variability. Estuaries Coast. 43, 347–359. doi: 10.1007/s12237-019-00684-1
Sevellec M., Lacoursière-Roussel A., Bernatchez L., Normandeau E., Solomon E., Arreak A., et al. (2021). Detecting community change in arctic marine ecosystems using the temporal dynamics of environmental DNA. Environ. DNA 3, 573–590. doi: 10.1002/edn3.155
Seymour M. (2019). Rapid progression and future of environmental DNA research. Commun. Biol. 2, 1–3. doi: 10.1038/s42003-019-0330-9
Shokralla S., Porter T. M., Gibson J. F., Dobosz R., Janzen D. H., Hallwachs W., et al. (2015). Massively parallel multiplex DNA sequencing for specimen identification using an illumina miSeq platform. Sci. Rep. 5, 9687. doi: 10.1038/srep09687
Sigsgaard E. E., Broman Nielsen I., Carl H., Krag M. A., Knudsen S. W., Xing Y., et al. (2017). Seawater environmental DNA reflects seasonality of a coastal fish community. Mar. Biol. 164, 128. doi: 10.1007/s00227-017-3147-4
Sildever S., Nishi N., Tazawa S., Kasai H., Hirai J., Shiomoto A., et al. (2023). Eight years of weekly eDNA monitoring in the north-western pacific. Environ. DNA 5, 1202–1215. doi: 10.1002/edn3.452
Southward A. J., Langmead O., Hardman-Mountford N. J., Aiken J., Boalch G. T., Dando P. R., et al. (2004). Long-term oceanographic and ecological research in the western english channel. Adv. Mar. Biol. 47, 1–105. doi: 10.1016/S0065-2881(04)47001-1
Stewart K. A. (2019). Understanding the effects of biotic and abiotic factors on sources of aquatic environmental DNA. Biodivers. Conserv. 28, 983–1001. doi: 10.1007/s10531-019-01709-8
Stoeck T., Bass D., Nebel M., Christen R., Jones M. D. M., Breiner H.-W., et al. (2010). Multiple marker parallel tag environmental DNA sequencing reveals a highly complex eukaryotic community in marine anoxic water. Mol. Ecol. 19, 21–31. doi: 10.1111/j.1365-294X.2009.04480.x
Stoeckle M. Y., Soboleva L., Charlop-Powers Z. (2017). Aquatic environmental DNA detects seasonal fish abundance and habitat preference in an urban estuary. PloS One 12, e0175186. doi: 10.1371/journal.pone.0175186
Storhaug E., Nahrgang J., Bondo Pedersen K., Brooks S. J., Petes L., Bakhmet I. N., et al. (2019). Seasonal and spatial variations in biomarker baseline levels within arctic populations of mussels (Mytilus spp.). Sci. Total Environ. 656, 921–936. doi: 10.1016/j.scitotenv.2018.11.397
Strickler K. M., Fremier A. K., Goldberg C. S. (2015). Quantifying Effects of UV-B, Temperature, and pH on eDNA Degradation in Aquatic Microcosms. Biol. Conserv. 183, 85–92. doi: 10.1016/j.biocon.2014.11.038
Takahashi M., Saccò M., Kestel J. H., Nester G., Campbell M. A., van der Heyde M., et al. (2023). Aquatic environmental DNA: A review of the macro-organismal biomonitoring revolution. Sci. Total Environ. 873, 162322. doi: 10.1016/j.scitotenv.2023.162322
Thompson L. R., Thielen P. (2023). Decoding dissolved information: environmental DNA sequencing at global scale to monitor a changing ocean. Curr. Opin. Biotechnol. 81, 102936. doi: 10.1016/j.copbio.2023.102936
Troth C. R., Sweet M., Nightingale J., Burian A. (2021). Seasonality, DNA degradation and spatial heterogeneity as drivers of eDNA detection dynamics. Sci. Total Environ. 768, 144466. doi: 10.1016/j.scitotenv.2020.144466
Van der Loos L. M., Nijland R. (2021). Biases in bulk: DNA metabarcoding of marine communities and the methodology involved. Mol. Ecol. 30, 3270–3288. doi: 10.1111/mec.15592
Keywords: Arctic, eDNA metabarcoding, temporal sampling strategies, eDNA annual recurrence, eDNA monthly biodiversity, eDNA daily variation, estuarine ecosystem
Citation: Sevellec M, Lacoursière-Roussel A, Normandeau E, Bernatchez L and Howland KL (2025) Effect of eDNA metabarcoding temporal sampling strategies on detection of coastal biodiversity. Front. Mar. Sci. 12:1522677. doi: 10.3389/fmars.2025.1522677
Received: 04 November 2024; Accepted: 07 January 2025;
Published: 07 February 2025.
Edited by:
Sandie M. Degnan, The University of Queensland, AustraliaReviewed by:
Cristina Diez-Vives, Spanish National Research Council (CSIC), SpainCopyright © 2025 Maelle Sevellec, Eric Normandeau, Louis Bernatchez, and His Majesty the King in Right of Canada, as represented by Fisheries and Oceans Canada for the contribution of Anaïs Lacoursière-Roussel and Kimberly Howland. This is an open-access article distributed under the terms of the Creative Commons Attribution License (CC BY). The use, distribution or reproduction in other forums is permitted, provided the original author(s) and the copyright owner(s) are credited and that the original publication in this journal is cited, in accordance with accepted academic practice. No use, distribution or reproduction is permitted which does not comply with these terms.
*Correspondence: Maelle Sevellec, bWFlbGxlLnNldmVsbGVjQGdtYWlsLmNvbQ==
†Deceased
‡ORCID: Eric Normandeau, orcid.org/0000-0003-2841-9391
Disclaimer: All claims expressed in this article are solely those of the authors and do not necessarily represent those of their affiliated organizations, or those of the publisher, the editors and the reviewers. Any product that may be evaluated in this article or claim that may be made by its manufacturer is not guaranteed or endorsed by the publisher.
Research integrity at Frontiers
Learn more about the work of our research integrity team to safeguard the quality of each article we publish.