 Matteo Barbato1,2,3*
 Sara Bonanomi3,4
 Diego Borme5
 Ilija Ćetković6
 Francesco Colloca7
 Manfredi Di Lorenzo3,8
 Ilaria A. M. Marino1,3
 Carlotta Mazzoldi1,2,3
 Ana Pešić6
 Antonello Sala4
 Lorenzo Zane1,2,3
 Massimo Mezzavilla1
- 1Department of Biology, University of Padova, Padova, Italy
- 2National Inter-University Consortium for Marine Sciences (CoNISMa), Rome, Italy
- 3National Biodiversity Future Center (NBFC), Palermo, Italy
- 4Italian National Research Council (CNR), Institute for Marine Biological Resources and Biotechnologies (IRBIM), Ancona, Italy
- 5National Institute of Oceanography and Applied Geophysics (OGS), Trieste, Italy
- 6Institute of Marine Biology, University of Montenegro, Kotor, Montenegro
- 7Department of Integrative Marine Ecology, Stazione Zoologica Anton Dohrn, Rome, Italy
- 8Department of Integrative Marine Ecology, Sicily Marine Centre, Stazione Zoologica Anton Dohrn, Palermo, Italy
Elasmobranch species are the direct or accidental catch of fisheries and can have a commercial importance. In the Mediterranean Sea, a long-term period of overfishing brought several demersal elasmobranchs to be depleted and threatened by extinction, due to vulnerability related to their life history traits. In such exploited species, information on genetic diversity and connectivity is lacking and should be collected to identify management units. In this study, we focused on two threatened smooth-hound species, Mustelus Mustelus (Linnaeus, 1758) and M. punctulatus (Risso, 1827), whose abundance and distribution showed a decline at the Mediterranean regional level in the last century. Thanks to an opportunistic yet extensive sampling, we obtained the largest subregional collection of specimens for genetic analysis so far. In total, 86 and 214 specimens of M. mustelus and M. punctulatus were collected between 2016 and 2020 in the Adriatic Sea and the Strait of Sicily. We assessed the population genetic structure typing 17 microsatellites and sequencing part of the mitochondrial control region in both species. We observed a substantial nuclear and mitochondrial genetic structure when accounting for the geographical sampling area for both species. Our results indicate the presence of at least two genetic stocks for each of the two species: one in the Strait of Sicily and the other in the Adriatic Sea. This study provides valuable data that should be integrated into a broader approach to define management units, improving the development of an effective management strategy for these threatened species in the Central Mediterranean Sea.
1 Introduction
The decline of elasmobranchs worsened during the late 20th and early 21st centuries, due to extensive global overexploitation of their populations (Dulvy et al., 2021). Their life history traits, including the slow growth rate and low fecundity, compared to other marine species, make elasmobranchs vulnerable to overfishing (Dulvy et al., 2017). Non-random space use (i.e., site fidelity and philopatry) and reproductive aggregations further contribute to their vulnerability (Hueter et al., 2005; Chapman et al., 2015; Hirschfeld et al., 2021). The conservation status of many elasmobranch species highlights the need for a scientific-tailored management plan (Dulvy et al., 2021). The concept of stock is a fundamental pillar in fishery management defined as an intraspecific group of randomly mating individuals with temporal or spatial integrity (Ihssen et al., 1981). The identification of genetic stock is a key step that could help delineate the geographic boundaries of populations characterized by consistent genetic distinctiveness (i.e., genetic structure) where divergence in allele frequencies is found at both nuclear and mitochondrial loci (Moritz, 1994). Ultimately, the combination of all ecological and biological traits (e.g., phenotype, movement, and genetics) leads to the definition of a management unit at different temporal organization (Abaunza et al., 2008; Cadrin et al., 2014).
Among evolutionary process, gene flow and genetic drift are two opposite forces that determine the genetic structure of a population and the genetic connectivity between adjacent populations. When gene flow occurs, the migratory movement and the successful mating of one or more individuals may contribute to the gene pool of a recipient population (Cadrin et al., 2014). Unlike species with larval stage, elasmobranchs are characterized by an active dispersal that occurs at the late juvenile/adult stage. Migrants may join an adjacent population without contribution to gene flow if successful mating relies on behavioral knowledge to engage with foreign reproductive aggregation (Ovenden, 2013). In elasmobranch species, genetic connectivity is influenced by maximum depth of occurrence, maximum body size, habitat, and species-specific dispersal potential (Hirschfeld et al., 2021).
In the Mediterranean Sea, elasmobranch species are overfished, and their decline was reported (Ferretti et al., 2013; Barausse et al., 2014; Walls and Dulvy, 2021). The common smooth-hound (Mustelus mustelus), hereafter Mm, and the black-spotted smooth-hound (M. punctulatus), hereafter Mp, are among the most important landed shark species in the Mediterranean Sea, as bycatch and being seasonally targeted by small-scale fishery, operating in the Northern Adriatic Sea and in the Strait of Sicily, two of the few Mediterranean areas where these species still show viable populations (Barausse et al., 2014; Colloca et al., 2017, Colloca et al., 2020; Carpentieri et al., 2021; Di Lorenzo et al., 2022; Maioli et al., 2023). Indeed, both species suffered a steep decline in the last century, with a strong contraction of their occurrence and abundance (Colloca et al., 2017), and they are classified in the International Union for Conservation of Nature (IUCN) red list as endangered (Mm) and vulnerable (Mp) at the global level (Jabado et al., 2021a; 2021b), as vulnerable at the Mediterranean level (Farrell and Dulvy, 2016; Dulvy et al., 2016), and endangered by the Italian IUCN (Rondinini et al., 2022). These two benthic species are found in coastal habitats and shelf area, and they both feed on crustaceans, with only adults preying large crustaceans, cephalopods, and small teleosts (Di Lorenzo et al., 2020; Finotto et al., 2023). Their morphology is similar, except for the presence of black dots in Mp and for a species-specific mouth shape (Marino et al., 2018). They also differ in the maximum size and the size at sexual maturity, with Mm being larger and maturing at a greater size than Mp (Riginella et al., 2020; Boscolo Palo et al., 2022). The seasonal movement of Mm was highlighted in the Northern-Central Adriatic Sea (Manfredi et al., 2010; Bonanomi et al., 2018; Barbato et al., 2021) and a strong site fidelity was described for both species in the Strait of Sicily (Boscolo Palo et al., 2022). Hybridization between these two species was detected only in a single clutch (Marino et al., 2015b).
Genetic structure differences were identified in other benthic Mediterranean elasmobranch species, linked to habitat fragmentation, heterogeneity, and the presence of oceanographic currents (Gubili et al., 2014; Catalano et al., 2022; Di Crescenzo et al., 2022; Melis et al., 2023). Consequently, a similar hypothesis can be formulated for both Mustelus species. To date, a differentiated genetic structure was described between Mediterranean subregions for nuclear DNA (nDNA) only in M. mustelus but not for mitochondrial DNA (mtDNA) (Hull et al., 2019).
An opportunistic yet extensive sampling of tissues for genetics, representing the first subregional effort, enabled this research on M. mustelus and M. punctulatus. This study aimed to 1) evaluate nuclear and mitochondrial diversity of the two species and 2) assess their genetic structure in two Mediterranean subareas, the Adriatic Sea, and the Strait of Sicily. To this end, we used 17 microsatellite loci—the largest panel of nuclear markers applied to these species—and partial sequencing of the control region (CR), a widely used mitochondrial marker. Microsatellites are highly polymorphic nDNA loci with repeated motifs [1–6 base pairs (bp)], typically located in non-coding regions unaffected by selection. Their co-dominant inheritance provides detailed insights into heterozygosity and genetic structure (Dudgeon et al., 2012). The CR, an mtDNA marker, is uniparentally inherited and has variable non-coding regions, less constrained by selection than protein-coding mtDNA genes, enabling analyses of haplotype and nucleotide diversity while complementing population differentiation studies (Phillips et al., 2021; Portnoy and Heist, 2012)
2 Materials and methods
2.1 Sample collection and DNA extraction
During scientific surveys on fishing vessels operating various fishing gears from 2016 to 2020, muscle tissue samples were opportunistically collected from 300 individuals (86 Mm and 214 Mp), representing populations from the Strait of Sicily (SIC; GSA 16) and the Adriatic Sea (ADRI; GSA 17 and 18). Within ADRI, samples were taken from the Italian Northern-Central coasts (N-ADRI; GSA 17) and the Montenegrin coasts (S-ADRI; GSA 18), with S-ADRI samples collected exclusively in 2020 (Figure 1; Supplementary Figures S1, S2). Sampled individuals were identified using the latest diagnostic morphological features from Marino et al. (2018) such as black spot presence, distance of the nostrils and mouth shape, and, when possible, dermal denticle observation under stereoscopes. Total length (TL; in centimeters), sex, and haul coordinates were recorded for individuals: Mm ranged from 40- cm to 150-cm TL (24 females and 14 males) and Mp from 30-cm to 120-cm TL (58 females and 68 males) in N-ADRI. In SIC, Mm ranged from 30- cm to 150-cm TL (21 females and 17 males) and Mp from 30- cm to 90-cm TL (30 females and 21 males). In S-ADRI, only female Mp were sampled, ranging from 92-cm to 138-cm TL (Figure 1); only three Mm were sampled in S-ADRI and were not included in the analyses. From each individual, a muscle sample was collected and stored in pure grade ethanol at 4 degree Celsius (°C) for further analyses.
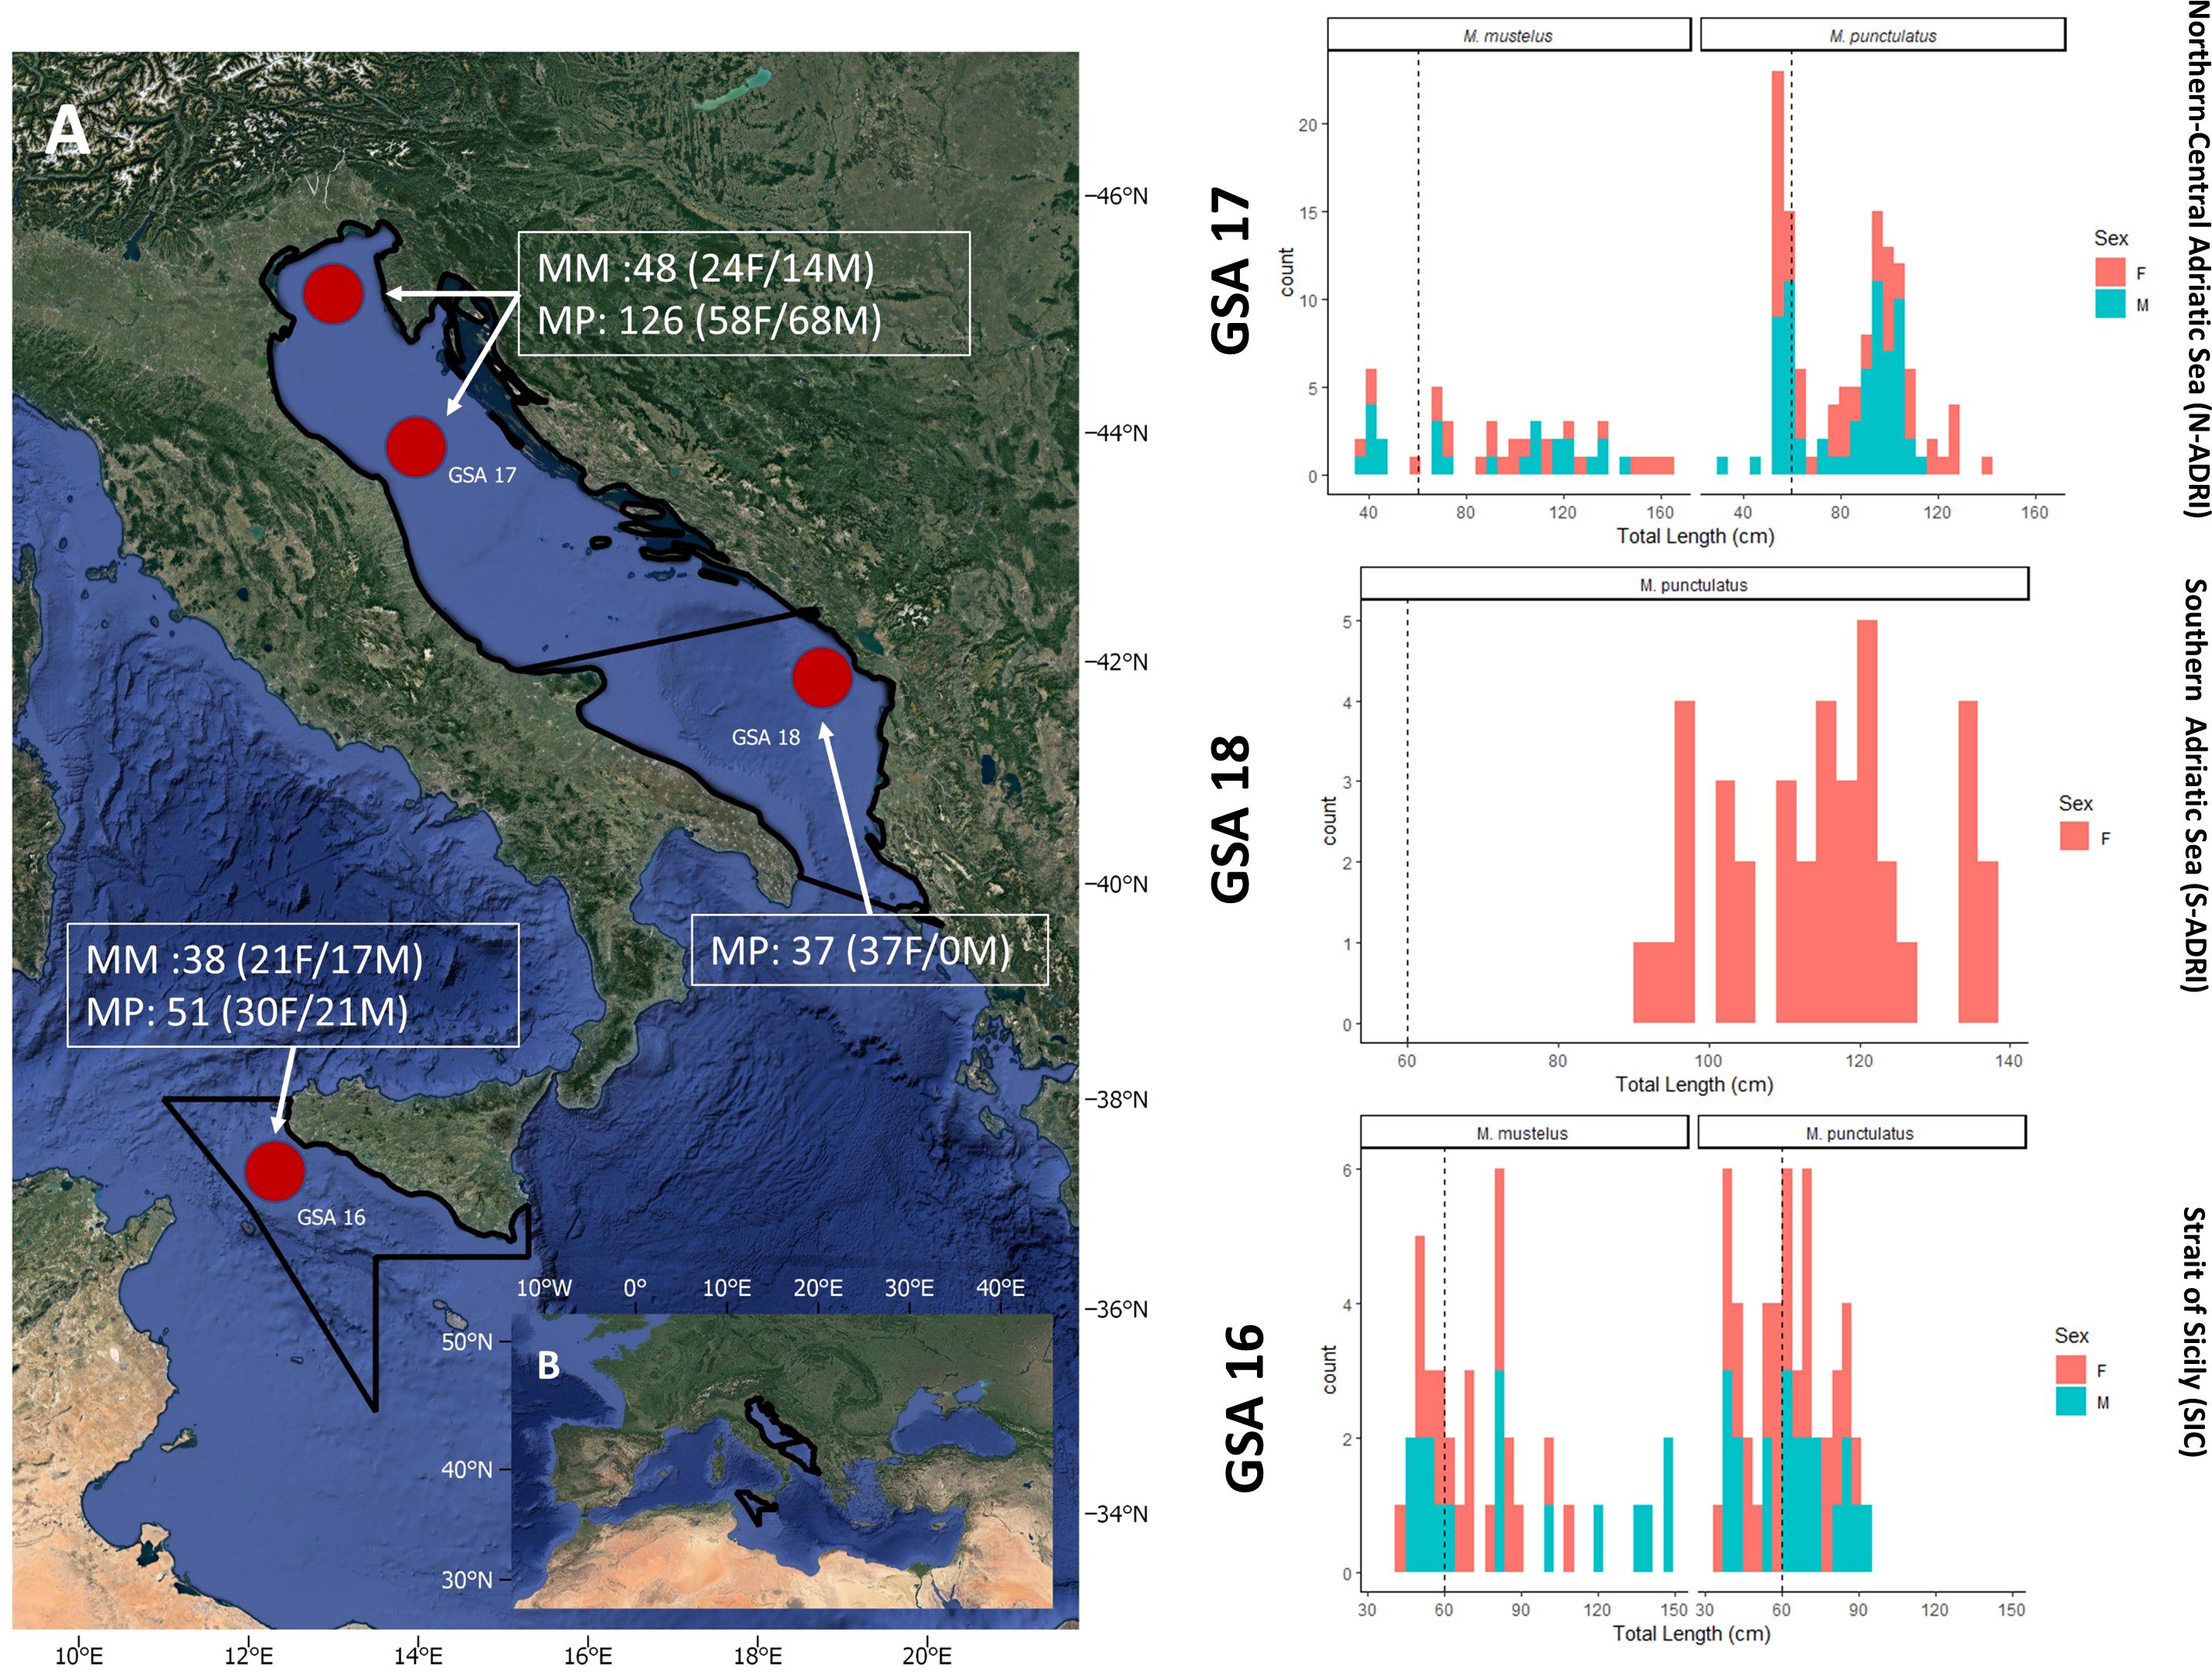
Figure 1. (A) Red points indicate cumulatively all sampling coordinate points in the North-Central Adriatic Sea (GSA17), defined as N-ADRI, the Southern Adriatic Sea (GSA18), defined as S-ADRI, and the Strait of Sicily (GSA16), defined as SIC, in the Mediterranean Sea (Google Maps, 2023); (B) length frequency distribution of the sampled M. mustelus (Mm) and M. punctulatus (Mp) females (red) and males (green) from each sampling locations (red circles in the map A). Plots were created by 'ggplot2' R package (Wickham, 2016).
Genomic DNA was extracted from 30-mg to 40-mg tissue samples by salting-out protocol (Patwary et al., 1994), and the extract quality was checked by 1% agarose gel in TBE buffer (1×) electrophoresis, with GelRed stain (0.025 μL/mL; Biotium). Extracted DNA was conserved at −20°C.
2.2 Nuclear DNA amplification
A total number of 19 loci were used (Supplementary Table S1.1), starting from previously tested microsatellites (Boomer and Stow, 2010; Chabot and Nigenda, 2011; Giresi et al., 2012; Marino et al., 2015a; Maduna et al., 2017). Among these, four loci were amplified in only one of the two species, according to previous successful amplification and testing (Marino et al., 2015a; Maduna et al., 2017), namely, Mmu9 and Gg22 in Mm and MaND5 and Mh29 in Mp. Thus, for each species, 17 microsatellites for each species were included throughout the analysis. The microsatellites were divided into three groups and amplified by a Multiplex PCR kit (QIAGEN) according to the published amplification profiles (Marino et al., 2015a; Hull et al., 2019). For each microsatellite, fluorophores were chosen according to length to avoid overlapping (Supplementary Table S1.1). A separate single locus PCR was carried out for the Mmu11 locus, and PCR products were assembled before sending to the genotyping service (see Supplementary Materials for Mmu11 amplification profile). This was necessary only in Mmu11 because the allelic peaks did not match when comparing single and multiplex amplifications. After checking the successful amplification by electrophoresis in 1.8% agarose gel, PCR products were sent to the BMR Genomics (Padua, Italy) for genotyping service where an ABI Prism 3100 Genetic Analyzer and LIZ500 as size standard were used. Scoring to examine the allelic profiles was performed for each sample by the software PEAK SCANNER v1.0 (Applied Biosystems). The binning was done by FLEXIBIN (Amos et al., 2007).
2.3 Mitochondrial DNA amplification
For the CR amplification, the primer pair MaCYB/MaDLP was used (Hull et al., 2019), following the protocols reported therein. After confirming the amplification by electrophoresis, amplicons were purified by EuroSAP - PCR Enzymatic Clean-up (Euroclone, Italy) and then sent for Sanger sequencing at the Eurofins Genomics (Colone, Germany). All sequences were manually checked for quality by FinchTV (Geospiza Inc.) and then trimmed, edited, and forward primer–removed. All sequences were visualized in Mega 6 (Tamura et al., 2013) and aligned by Muscle algorithm (Edgar, 2004) with default parameters.
The sequenced fragment encompassed the last part of cytochrome b, two Transfer Ribonucleic Acid (tRNA), and the first part of the CR (orientation 5′-3′) when compared to the full mitochondrial genome of Mm, available on GenBank (accession number MH559351.1) by Blastn (Altschul et al., 1990) and Clustal Muscle alignment (Edgar, 2004). The initial sequenced fragment was composed of 713 bp and the first 230 bp encompassed the cytochrome b and tRNAs. The remaining 483 bp included the beginning of the CR region, which started at base position 15638 of the Mm complete genome (Supplementary Figure S3). All the downstream analyses were performed considering only the CR fragment (483 bp).
2.4 Genetic diversity
Microsatellite genotypes were first checked for null alleles using MicroChecker v2.2.3 (Van Oosterhout et al., 2004), and their presence was evaluated on the estimation of genetic structure by FreeNA (Chapuis and Estoup, 2007). GENEPOP ON THE WEB v4.2 (Raymond and Rousset, 1995; Rousset, 2008) was used for testing linkage disequilibrium (LD) and deviations from Hardy–Weinberg equilibrium (HWE). For statistical significance of multiple tests, Benjamini–Hochberg correction (B-H; Benjamini and Hochberg, 1995) was applied with the function p.adjust on RStudio 1.3.1093-1 (RStudio Team, 2020). Bayesian structure analysis by STRUCTURE (Pritchard et al., 2000) was run to obtain the most reliable species identification for each specimen, assuming an admixture ancestry model with independent allelic frequencies and without a prior on sample origin (see Supplementary Materials for more details). Using the species identification based on STRUCTURE, for each species, the nDNA genetic diversity was calculated using the R package DiveRsity (Keenan et al., 2013), as the number of alleles observed per locus per population sample (A), the allelic richness (AR), the observed and expected heterozygosity (HO and HE), and the inbreeding coefficient (FIS). For the mtDNA, the CR diversity was calculated by DnaSP (Rozas et al., 2017) on the basis of the same species identification. Total number of haplotypes (H), haplotype diversity (h), and nucleotide diversity (π) were obtained. The haplotype network was created using TCS (Clement et al., 2000) and edited with PopART (Leigh and Bryant, 2015). To avoid that population structure was influenced by family structure, Colony v2.0.6.7 (Jones and Wang, 2010) was used for each species in separate runs selecting for female and male polygamy with inbreeding and cloning, by full-likelihood method at 95% and no prior. Only one sample for each full-sibling pair was kept for further analysis (see Supplementary Materials).
2.5 Population differentiation
To assess the level of genetic structure among the sampling sites in the two species, a Bayesian clustering analysis by STRUCTURE was performed with correlated allelic frequencies together with the abovementioned settings and software to account for uneven sample size.
For both nDNA and mtDNA, genetic differentiation, pairwise FST, and ΦST respectively, was determined by ARLEQUIN (Excoffier and Lischer, 2010) with 104 permutations across sampling sites. Only for the Mp, the comparisons were performed between the ADRI and SIC (pooling together N-ADRI and S-ADRI), and among N-ADRI, S-ADRI, and SIC. When appropriate, B-H correction for multiple comparisons was performed with experiment-wide significance at p-values < 0.01. To assess whether unbalanced sample size in Mp may have affected the genetic differentiation, a random subsampling was performed, taking 50 random individuals from N-ADRI (N = 37) and S-ADRI (N = 13) while also balancing the sex ratio; the metrics of genetic differentiation were computed as described above.
The discriminant analysis of principal components (DAPC) (Jombart et al., 2010) was used to investigate population genetic structure. By summarizing between-group variation and ignoring within-group variation, DAPC effectively identified genetic structure within the samples. This multivariate approach assigned individuals to distinct groups and assessed inter-population differentiation without relying on specific population genetics models (e.g., HWE and LD).
3 Results
3.1 Genetic diversity
3.1.1 Nuclear DNA
DNA of satisfactory quality was obtained from the 300 available tissue samples, and it was used to confirm the morphological identification using STRUCTURE. The optimal K was equal to 2 and cluster analysis allowed identifying 86 Mm and 214 Mp. Overall, four samples were discarded because of too many missing loci (Supplementary Figure S4). Using FST, the genetic divergence between the two species was 0.63 (p-value < 0.001). The presence of null alleles did not affect the estimates of genetic structure (Supplementary Table S2), and no significant deviation from HWE (Supplementary Table S3) and LD (data not shown) was detected across sampling sites. Thus, all loci were kept for further analyses. In Mm, a low genetic diversity emerged at both locations, with AR around 3.5 and Ho between 0.33 and 0.36, whereas Mp samples showed even smaller values, with AR between 2.14 and 2.33 and with Ho between 0.22 and 0.26. FIS turned out to be positive across locations (Supplementary Table S4).
3.1.2 Mitochondrial DNA
The mtDNA CR of 83 samples of Mm and 207 samples of Mp was successfully sequenced, whereas 10 samples were not kept for further analyses (Supplementary Table S5). Among the excluded samples, seven Mp (N = 3 from the N-ADRI, 1 from the S-ADRI, and 3 from the SIC) and three Mm from SIC had poor sequencing quality or failed amplification. One specimen was identified to be an introgressed hybrid and discarded. In detail, the individual (sample #S301) had a CR haplotype belonging to Mp, but it was identified as a sexually mature male of 135 cm of TL Mm based on morphology, and this species identification was confirmed by STRUCTURE. In this sample, only one of the two Mm species-specific microsatellites (Mmu9) was successfully amplified. Even though the sample was excluded from further analysis, being out of the scope of this study, its haplotype was accounted for in the haplotype occurrence.
In Mm, a moderate variation was found, with four haplotypes and three or two segregating sites, respectively, in N-ADRI and SIC. In Mp, the haplotype number ranged from 3 to 5 and the segregating sites between 2 and 5 (Supplementary Table S5). In Mm, the haplotype N3 was the most frequent, present in 63% of individuals, followed by N4. Haplotype N2 and N10 were only found in the SIC and the N-ADRI, respectively (Figure 2, Supplementary Table S6). Mp has 83% of individuals with haplotype N1, and N7 was the second most frequent haplotype. Mp presented three unique haplotypes in the N-ADRI (N11, N12, and N13), one in the S-ADRI (N9), and two in the SIC (N6 and N8) (Figure 2, Supplementary Table S7).
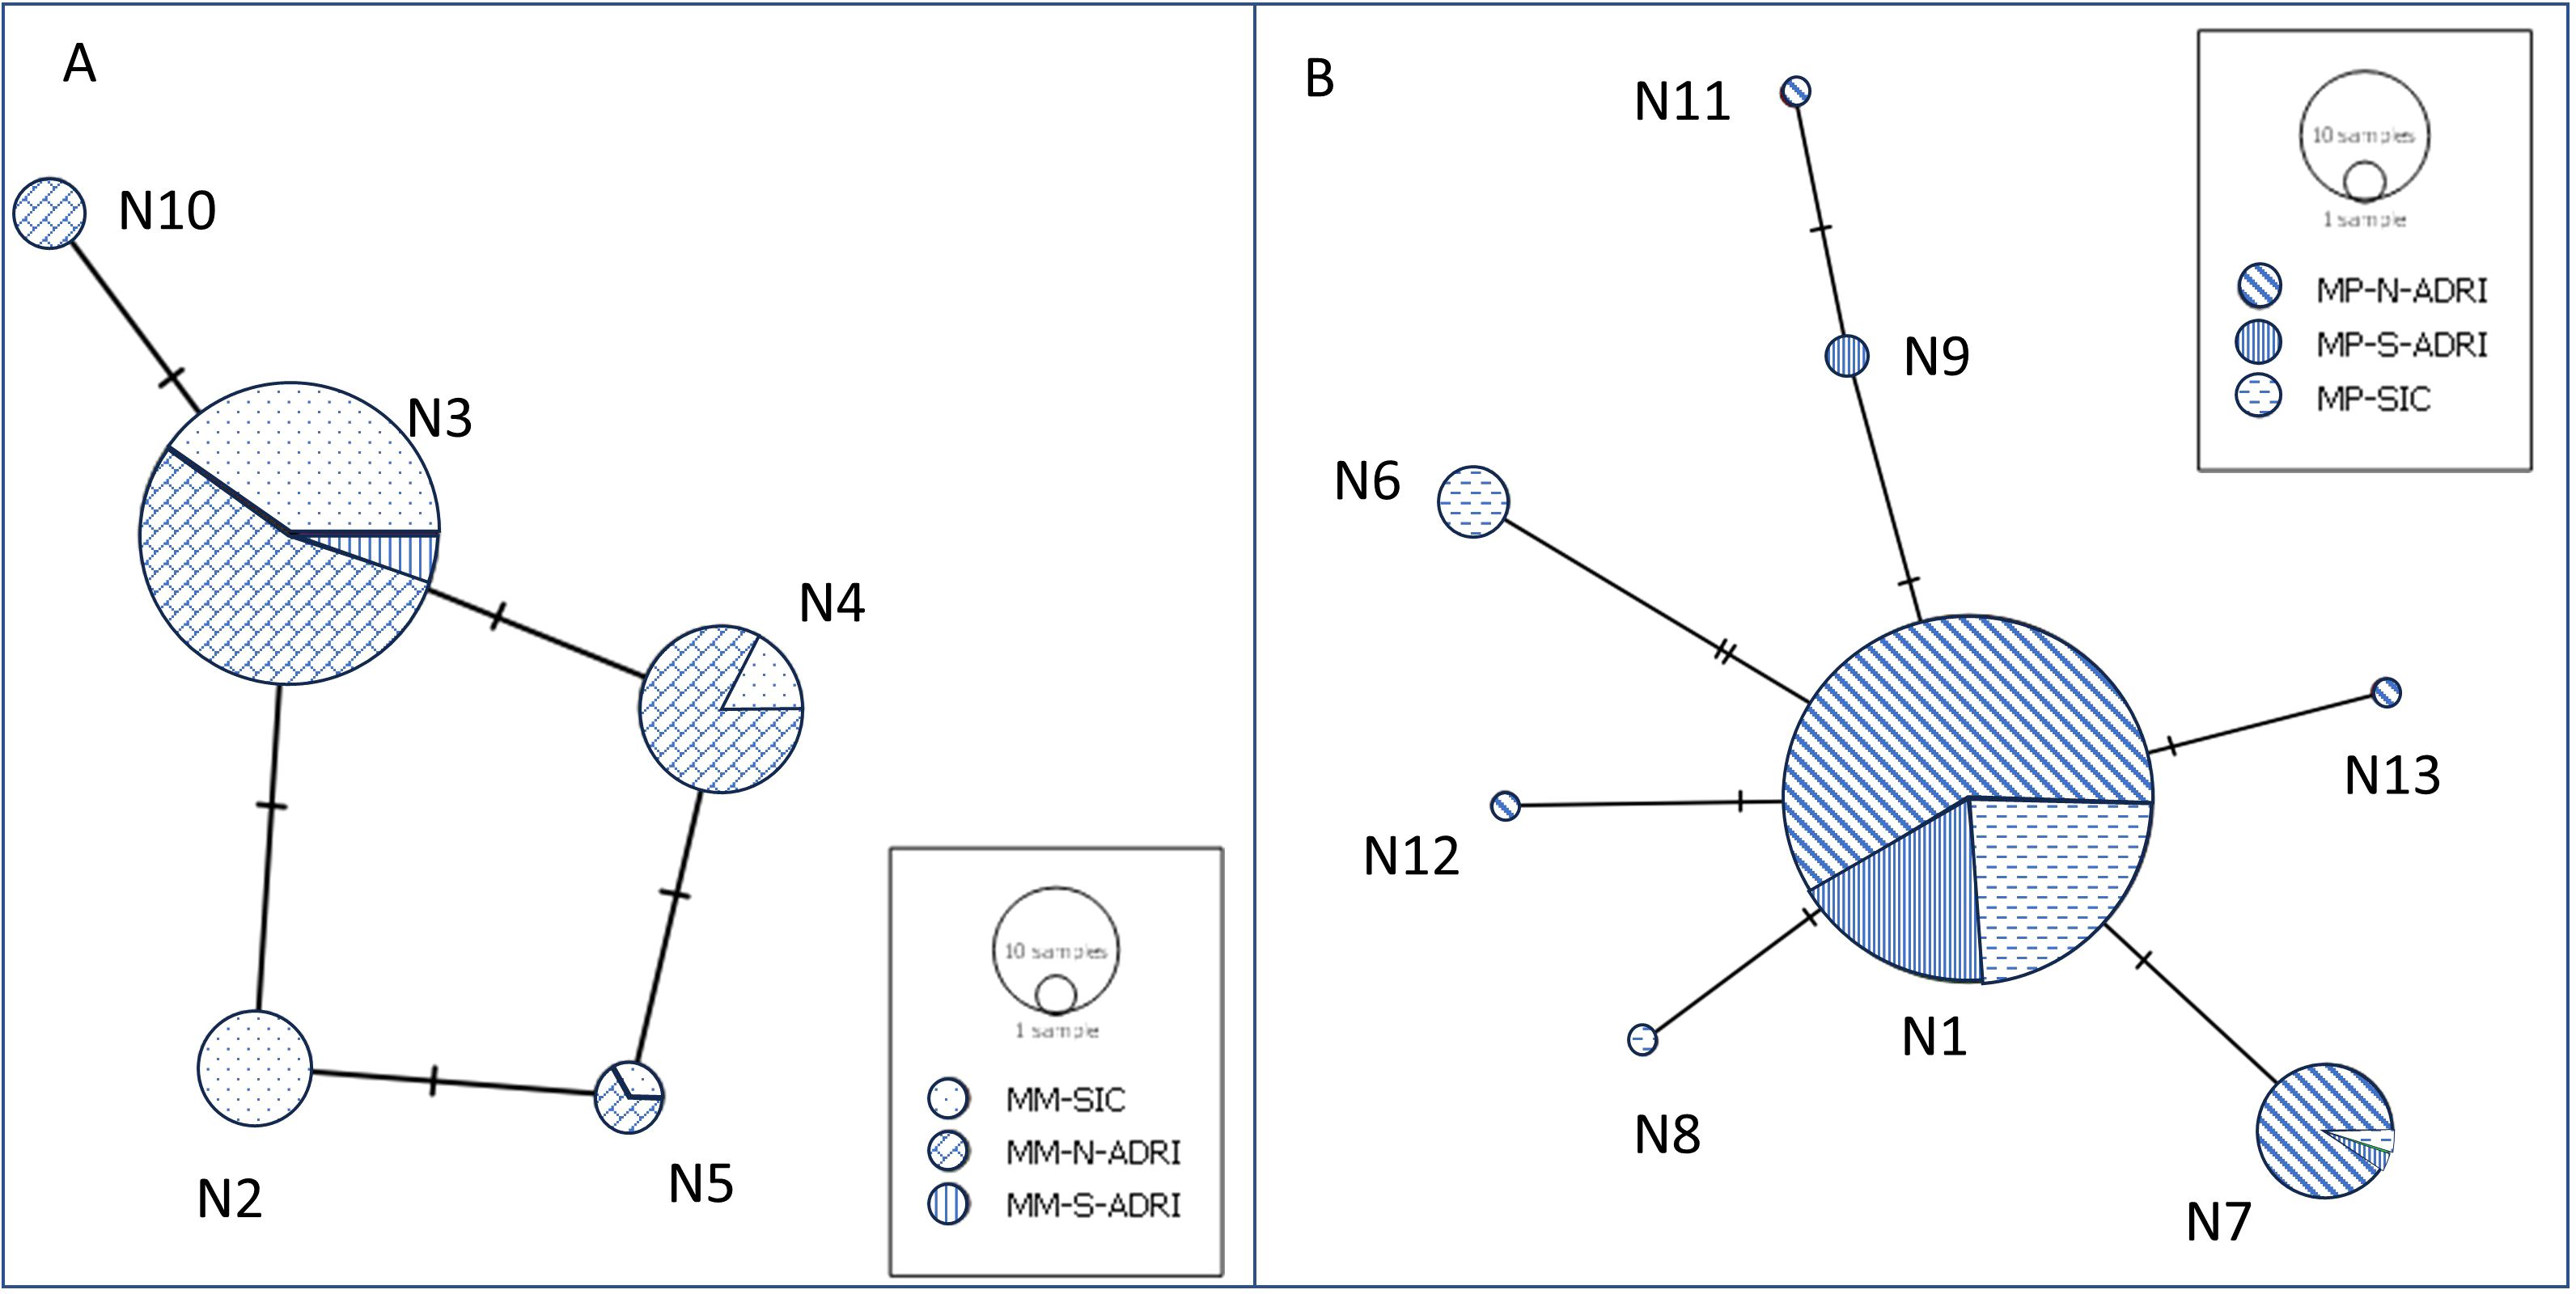
Figure 2. Haplotype network of the sequenced control region fragment of M. mustelus (A) and M. punctulatus (B). The size of the circles represents the number of samples belonging to a unique haplotype.
3.2 Population differentiation
3.2.1 Microsatellites
Without using prior information of sample origin, the cluster analysis in STRUCTURE did not evidence the presence of structure between the ADRI and the SIC (Supplementary Figure S5) for both species, with STRUCTURESELECTOR metrics indicating that the optimal K was equal to 1. From ARLEQUIN analysis, however, microsatellite-derived FST showed a statistically significant differentiation between the population samples from N-ADRI and SIC in Mm (FST = 0.02, p-value = 0.005) and between ADRI and SIC in Mp (FST = 0.03, p-value = 0.003); for this latter species, genetic differences did not emerge between N-ADRI and S-ADRI samples (FST = 0.002, p-value = 0.23), whereas divergence was found between S-ADRI and the SIC (FST = 0.02, p-value < 0.001). The result of significant genetic differentiation between ADRI and SIC in Mp was further investigated, possibly biased by the unbalanced sample size of the two population samples (N = 163 and 51, respectively). To this end, the analysis was repeated, randomly subsampling 50 ADRI individuals from the genetically homogeneous N-ADRI and S-ADRI population samples (see Materials and Methods) and comparing them with the 51 SIC individuals, confirming our finding (FST = 0.03, p-value < 0.001) (Table 1).
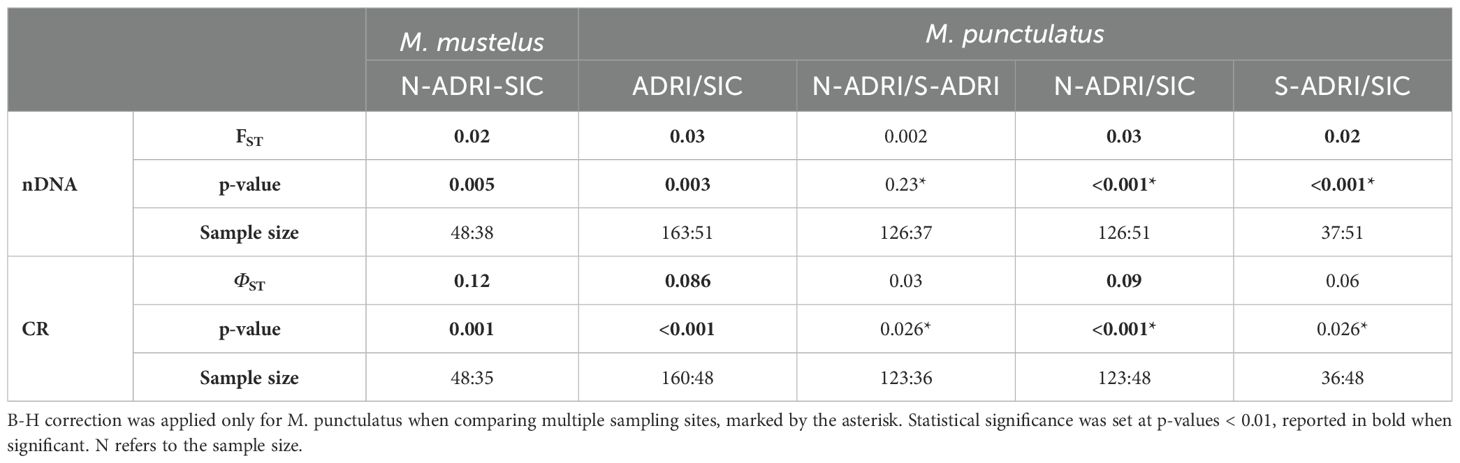
Table 1. Pairwise FST and ΦST values were calculated, respectively according to microsatellite on nuclear DNA and to controlo region (CR) on mitochondrial DNA comparing the sampling origins (N-ADRI, Northern-Central Adriatic Sea; S-ADRI, Southern Adriatic Sea; SIC, Strait of Sicily); B-H correction was applied only for M. punctulatus when comparing multiple sampling sites, marked by the asterisk, and statistical significance was set at p-values < 0.01, reported in bold when significant.
DAPC analyses revealed a clear distinction for Mm among the two sampling sites (N-ADRI) and SIC, with a reasonable power to reassign individuals from the two locations using our microsatellites data, albeit with a slight overlap between the two regions (Figures 3A, B). On the other hand, DAPC analyses on Mp revealed no distinction between N-ADRI and S-ADRI, but a significant level of correct re-assignment for SIC versus N-ADRI, with still an overlap between the two clusters (Figures 3C, D).
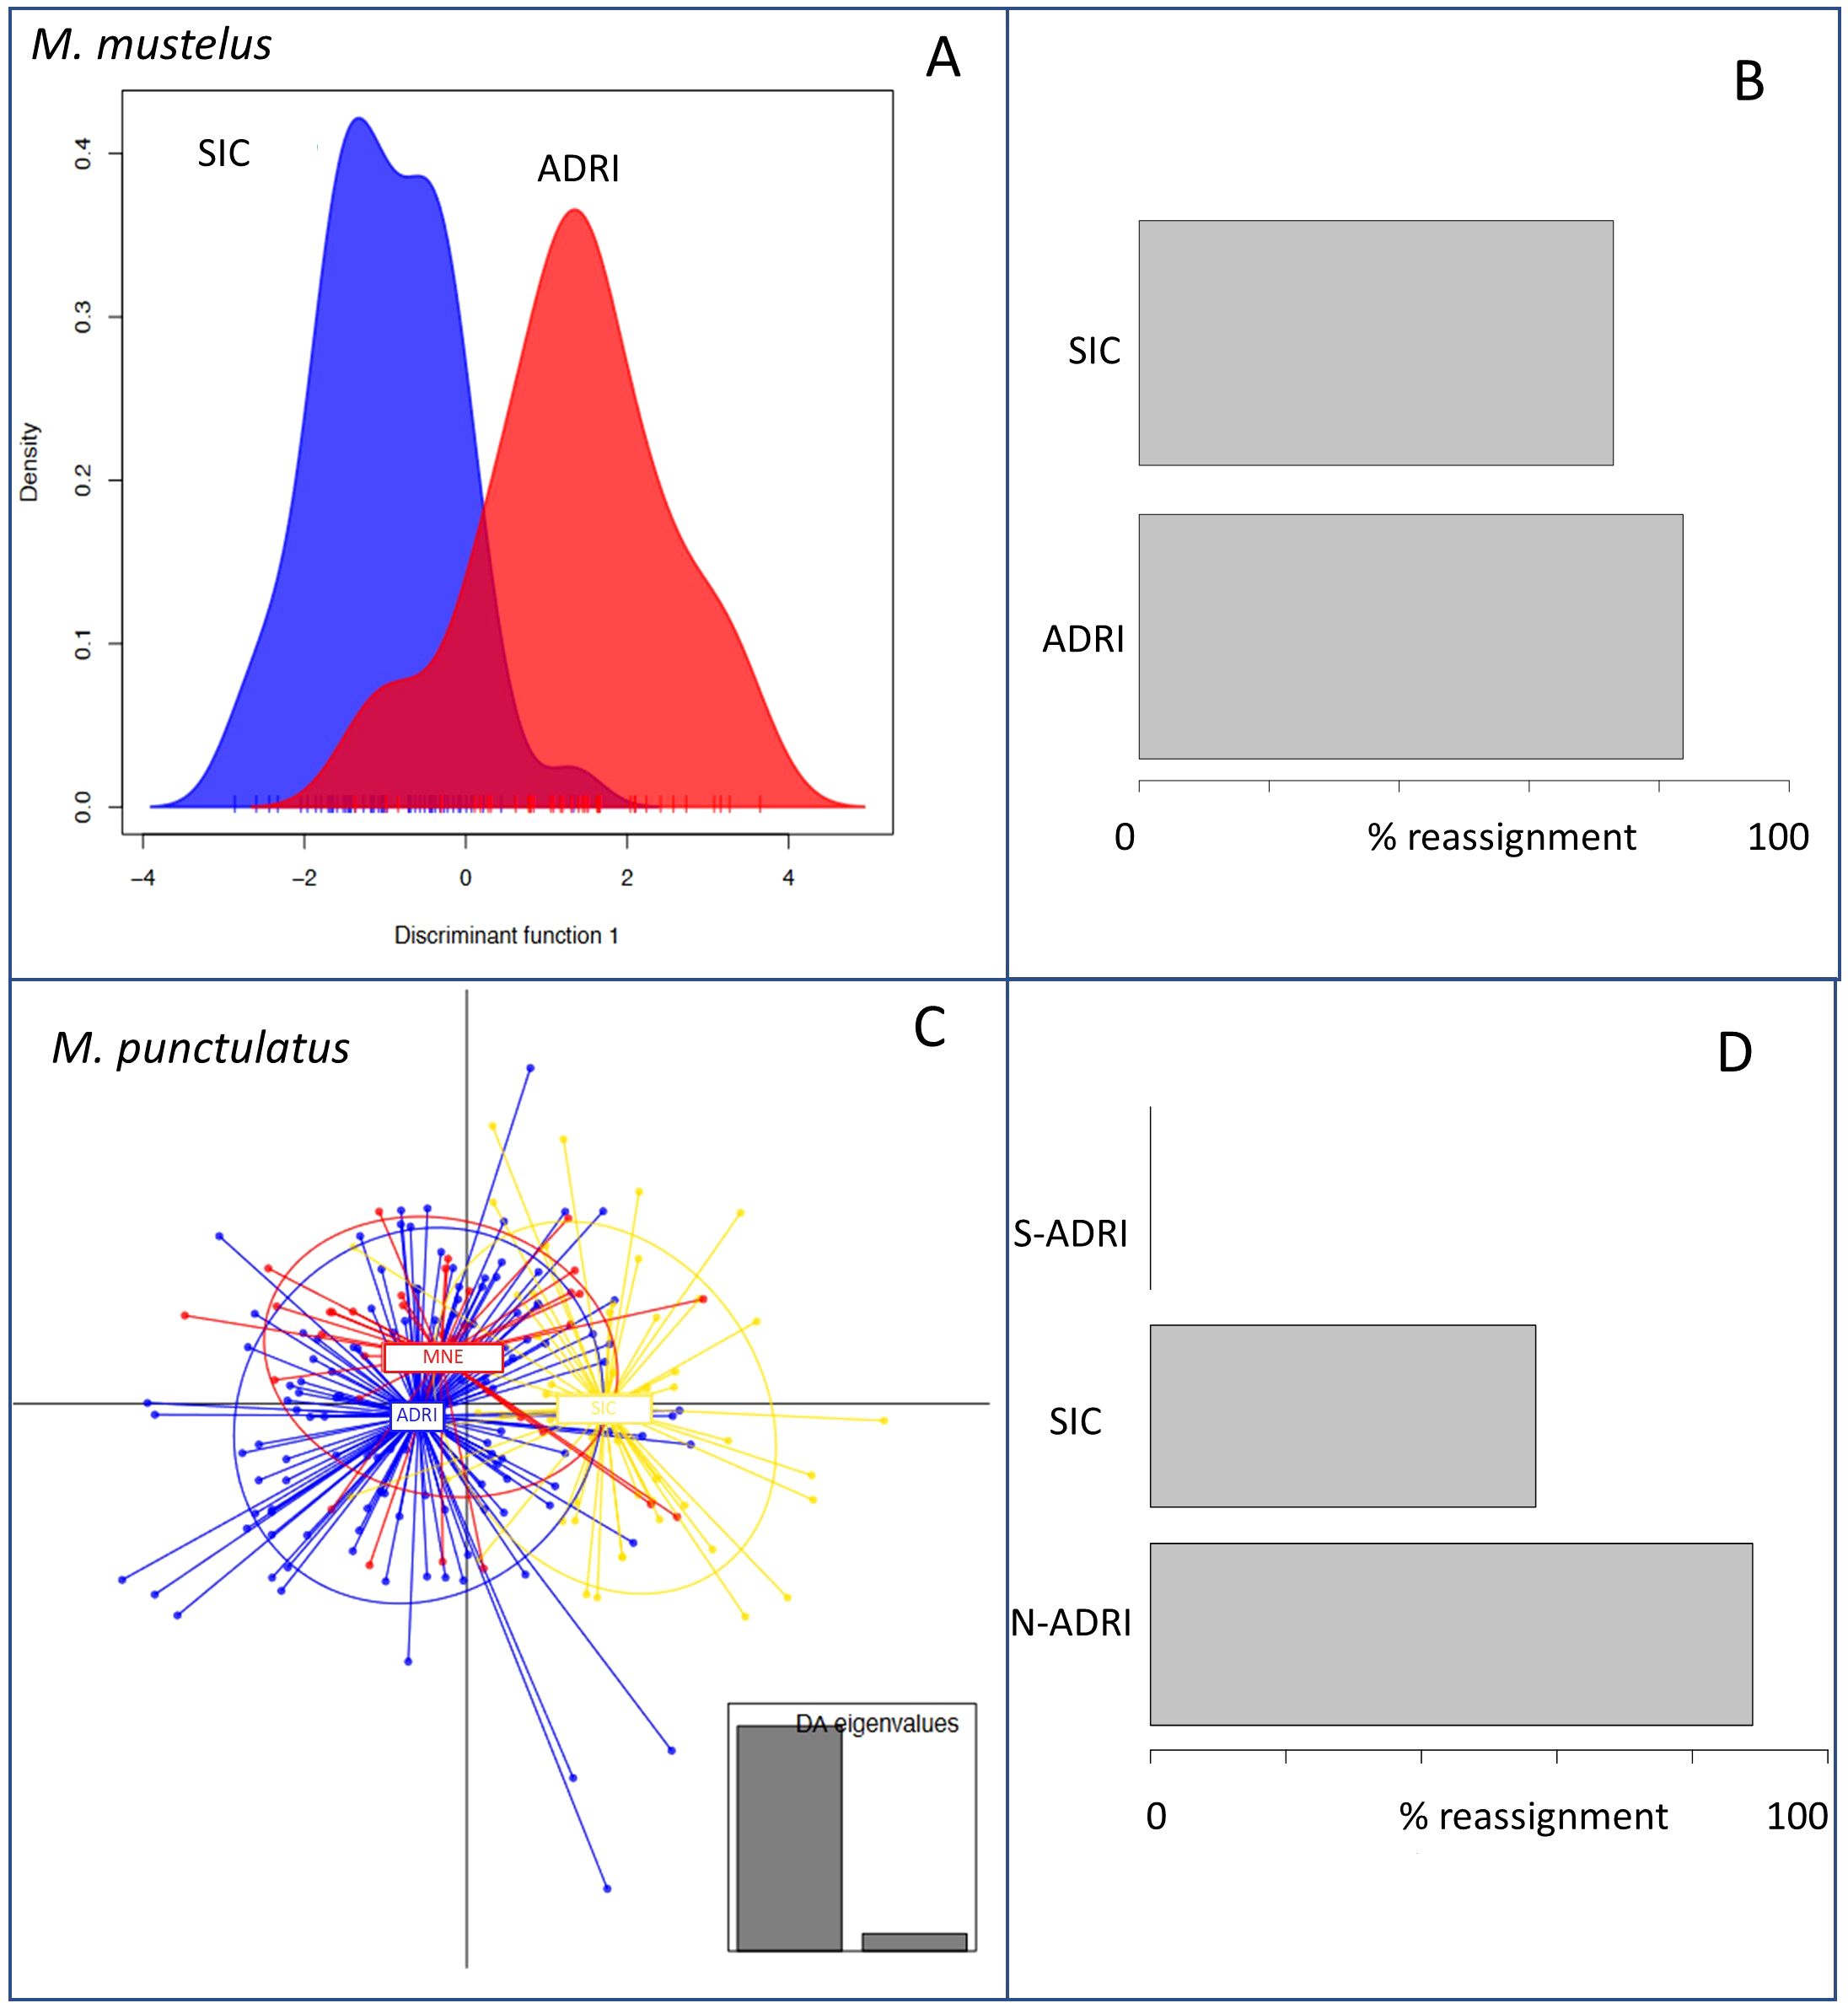
Figure 3. DAPC analysis accounting for the sampling origin for M. mustelus (A, B) and M. punctulatus (C, D). For the two studied species, the principal component diagram (A, C) and the bar plot of the percentage of reassignment (B, D) are shown. The average percentage of correct reassignment for M. mustelus is 0.9, which indicates a high degree of discrimination between SIC and ADRI clusters. On the other hand, we have an average reassignment around 0.68 for M. punctulatus. This value is due to the low level of discrimination between N-ADRI and S-ADRI (e.g., samples from Montenegro) clusters. Population codes: ADRI (Adriatic Sea); N-ADRI (North Adriatic Sea); S-ADRI (South Adriatic Sea, Montenegro coast); SIC (Strait of Sicily).
3.2.2 Control region
CR-derived ΦST values showed significant differentiation in both species sampled in the ADRI and the SIC (ΦST = 0.12, p-value = 0.001, in Mm; and ΦST = 0.086, p-value < 0.001 in Mp). When accounting for uneven sample size in Mp, randomly subsampled sequences from N-ADRI and S-ADRI confirmed the differences with SIC (ΦST = 0.07, p-value < 0.001). After B-H correction, significant genetic divergence emerged only in Mp between the N-ADRI and the SIC (ΦST = 0.09, p-value < 0.001), whereas no statistical significance was observed between the N-ADRI and S-ADRI (ΦST = 0.03, p-value = 0.026) and between the S-ADRI and the SIC (ΦST = 0.06, p-value = 0.026) (Table 1).
4 Discussion
4.1 Genetic diversity
A low genetic diversity emerged in this study, particularly evident in the nDNA of Mp with an expected heterozygosity of about 0.25 and only about two alleles expected per locus. For Mm, the genetic diversity was slightly higher, with about 35% expected heterozygotes and 3.5 alleles per locus, and, to a small extent, greater than what previously found in Mm with only nine microsatellites (Hull et al., 2019). The low nuclear diversity found in our study is in line with the one found in other benthic elasmobranchs in the Mediterranean populations such as the Galeus melastomus in the southern Adriatic Sea and in Sicily (AR = 2.7–2.8 and HE = 0.36–0.4; Di Crescenzo et al., 2022) and the Raja asterias in the northern Adriatic Sea (AR = 3.35 and HE = 0.56; Catalano et al., 2022). On the other hand, a higher nuclear diversity (AR = 5.2–6.5, HE = 0.56–0.76) was reported in the northern Adriatic Sea for other benthic elasmobranch species, such as the Schyliorhinus canicula (Gubili et al., 2014), the R. clavata (Melis et al., 2023), and the epibenthic Squalus acanthias (Gračan et al., 2020). The mtDNA diversity found in our study mirrors the pattern observed with nDNA, showing a very low variability in Mp (h = 0.16–0.31 and π = 0.0003–0.001) and higher values in Mm (h = 0.52–0.54 and π = 0.001); in Mm, despite the shorter sequenced fragment in our study, CR showed similar diversity values to those previously found (Hull et al., 2019). CR diversity, however, is known to vary between closely related species and within the same species (Subramanian and Lambert, 2011). Accordingly, several studies in other elasmobranch species reported very different patterns with a moderate to high CR genetic diversity in some species [reviewed by Hull et al. (2019); h = 0.78–0.99 and π = 0.004–0.35], including S. canicula from the Adriatic Sea (h = 0.71 and π = 0.003; Gubili et al., 2014).
For the aforementioned benthic elasmobranch species, whose genetic diversity was investigated in many Mediterranean subareas (Gubili et al., 2014; Catalano et al., 2022; Di Crescenzo et al., 2022; Melis et al., 2023), including the two smooth-hound species of the present study, their steep decline found support in literature (Colloca et al., 2017; Ferretti et al., 2013; Dulvy et al., 2021). This calls for further research to deepen the understanding of fishery-induced effect of the genetic diversity of over-exploited elasmobranch species (Domingues et al., 2018)
4.2 Population differentiation
The evidence of genetic structure found in our study for Mm confirms and extends what was previously known at the global level for this species (Hull et al., 2019). In fact, although, as expected, our extended microsatellite panel confirms the existence of genetic differentiation between the Adriatic Sea and the Strait of Sicily, our study adds new support for the occurrence of a genetic structure between these two Mediterranean areas that, thanks to our higher sample size, were detected, for the first time, using also mtDNA. In Mm, the occurrence of one high-frequency shared haplotype in SIC and ADRI could be due to a recent common ancestor, whereas the other shared haplotypes could be the result of recent immigration. However, the existence of the unique haplotype (N10) points out to the occurrence of some level of isolation reflecting either localized adaptation or bottlenecks in N-ADRI. In Mp, although one prevailing ancestral haplotype was found, multiple unique haplotypes were detected in both N-ADRI, S-ADRI, and SIC, highlighting a higher degree of isolation and genetic drift. Through sequencing a longer CR fragment, focused research could discern whether mtDNA divergence could also result from a sex-biased dispersal (Hirschfeld et al., 2021; Phillips et al., 2021). However, the haplotype network and the value of ΦST and FST could potentially be explained by alternative hypothesis such as female-mediate gene flow, incomplete lineage sorting, or strong population genetic declines, as also discussed at global level in Hull et al. (2019). This result of genetic differentiation is in line with what reported for this species at the global scale, Mm displayed a significant level of isolation shaped by the effect of oceanic currents or other biogeographical barriers, despite the capability to undertake rare and long migrations (Mann and Bullen, 2009; da Silva et al., 2013; Maduna et al., 2016). In South African water, the combination of tagging and genetic methods in Mm contributed to find a contrasted dynamic between a strong site fidelity in a relatively short period and a significant gene flow at evolutionary scale (Klein et al., 2022).
With regard to Mp, our study provided the first evidence for a significant structure between SIC and ADRI, with a pattern that mirrors the Mm structure. It is worth noting that seasonal and permanent currents occur in this area; in particular, the ADRI circulation consisted in wind-driven currents, one from south to north along the eastern coast and another one from north to the south in the western coast, and three seasonal gyres (Russo and Artegiani, 1996). The ADRI hydrodynamics did not appear to influence the genetic differentiation between N-ADRI and S-ADRI in Mp while being responsible for the genetic structure of many marine species with larval dispersal (Papetti et al., 2013; Matić-Skoko et al., 2018). Similarly, other populations of Mustelus species appeared to be genetically structured, including the gummy shark (M. antarcticus) in Australian waters despite a wide movement range (238–900 km) (Braccini et al., 2017) and the brown smooth-hound (M. henlei) in the Gulf of California (Sandoval-Castillo and Beheregaray, 2015). Our analyses of re-assignment using DAPC further supported the concept of two distinct and yet slightly connected populations, highlighting the presence of a semi-permeable barrier between the Adriatic Sea and the Mediterranean Sea.
Despite being opportunistic, our sampling represents the first coordinated subregional effort, yielding the largest genetic dataset for these exploited species. Combining microsatellite genotyping with CR sequencing, we detected genetic diversity and a statistically significant population structure between the Adriatic Sea and the Strait of Sicily, confirming two distinct genetic stocks for Mm (SIC) and Mp (ADRI) for the first time. Our results were in line with previous analyses on Mediterranean and benthic elasmobranch species that showed significant genetic structuring between Mediterranean areas (Gubili et al., 2014; Catalano et al., 2022; Di Crescenzo et al., 2022; Melis et al., 2023). The diversity of habitats present between ADRI and SIC, encompassed by deep water and the presence of the Strait of Otranto, seemed to act as an only semi-permeable dispersal barrier for many populations of elasmobranch species, highlighting the importance of identifying genetic stock. Behaviors like philopatry and sex-biased dispersal may play a role in shaping the genetic structure and contribute to the connectivity in elasmobranch (Chapman et al., 2015; Phillips et al., 2021), but, due to the opportunistic sampling, this study was not able to address this goal and needs to be further investigated. Considering the stock definition (Ihssen et al., 1981), fishery management of these two stocks could be improved tailoring stock specific strategies that consider different growth rate, reproduction and nursery areas, and harvesting dynamic (Cadrin et al., 2014). The commercial relevance and the conservation issues of Mm and Mp in the two Mediterranean populations require the delineation of management units. Albeit a holistic approach is needed, our study provides solid evidence in relation to the genetic stocks of these exploited and threatened shark species.
Data availability statement
The datasets presented in this study can be found in online repositories. The names of the repository/repositories and accession number(s) can be found in the article/Supplementary Material. The datasets generated during and/or analysed during the current study are available in the Figshare repository: https://doi.org/10.6084/m9.figshare.22652257.
Ethics statement
Samples from the Adriatic Sea were collected from dead specimens caught during professional fishing activity and, therefore, no approval from the local ethics committee was necessary. In the strait of Sicily, all procedures carried out were approved by the international authorities (EU/DG Mare, FAO/GFCM). All specimens and methods were caught and performed in accordance with the relevant guidelines and regulations. In the cases the animal was alive when it arrived on the vessel during the scientific survey (MEDITS-DCF, EU Reg. 199/2008), it was suppressed in compliance with the recommendation of Decree Law n. 26 of 4 March 2014. All efforts were made to minimize suffering. The study was conducted in accordance with the local legislation and institutional requirements.
Author contributions
MB: Writing – original draft, Writing – review & editing, Conceptualization, Data curation, Formal analysis, Investigation, Methodology. SB: Funding acquisition, Writing – review & editing. DB: Investigation, Writing – review & editing. IC: Investigation, Writing – review & editing. FC: Investigation, Writing – review & editing. MD: Investigation, Writing – review & editing. IM: Conceptualization, Data curation, Investigation, Methodology, Writing – review & editing. CM: Conceptualization, Funding acquisition, Writing – review & editing. AP: Investigation, Writing – review & editing. AS: Funding acquisition, Writing – review & editing. LZ: Conceptualization, Methodology, Project administration, Supervision, Writing – review & editing. MM: Conceptualization, Investigation, Methodology, Supervision, Validation, Writing – review & editing.
Funding
The author(s) declare financial support was received for the research, authorship, and/or publication of this article. We would like to acknowledge that this study was funded by the monitoring programme “BYCATCH 2016-2017” and “Task 5.1a PLNRDA 2018-2020” in compliance with the Regulations (EC) 812/2004 and from the “Piano di Lavoro Nazionale Raccolta Dati Alieutici 2018-2020” in compliance with EU Data Collection Framework and the scientific survey programme (MEDITS-DCF, EU Reg. 199/2008). Additional funding to LZ was provided by the National Biodiversity Future Center (NBFC, funded under the European Union Next-GenerationEU (National Recovery and Resilience Plan (PNRR), Mission 4 Component 2 Investment 1.4 - D.D. 3175 18/12/2021, CN_00000033), which also funded IAM salary. This study was also funded by the Italian Ministry of Education, Universities and Research (MIUR) within the scientific research program of national interest “Preserving coastal marine ecosystem functions and services under climate change pressure and overfishing” to LZ (PRIN 2020 Prot. 2020J3W3WC). Open Access funding provided by Università degli Studi di Padova | University of Padua, Open Science Committee.
Conflict of interest
The authors declare that the research was conducted in the absence of any commercial or financial relationships that could be construed as a potential conflict of interest.
The author(s) declared that they were an editorial board member of Frontiers, at the time of submission. This had no impact on the peer review process and the final decision.
Generative AI statement
The author(s) declare that no Generative AI was used in the creation of this manuscript.
Publisher’s note
All claims expressed in this article are solely those of the authors and do not necessarily represent those of their affiliated organizations, or those of the publisher, the editors and the reviewers. Any product that may be evaluated in this article, or claim that may be made by its manufacturer, is not guaranteed or endorsed by the publisher.
Supplementary material
The Supplementary Material for this article can be found online at: https://www.frontiersin.org/articles/10.3389/fmars.2025.1520573/full#supplementary-material
References
Abaunza P., Murta A. G., Campbell N., Cimmaruta R., Comesaña A. S., Dahle G., et al (2008). Stock identity of horse mackerel (Trachurus trachurus) in the Northeast Atlantic and Mediterranean Sea: Integrating the results from different stock identification approaches. Fisheries Research 89 (2), 196–209. doi: 10.1016/j.fishres.2007.09.022
Altschul S. F., Gish W., Miller W., Myers E. W., Lipman D. J. (1990). Basic local alignment search tool. J. Mol. Biol. 215, 403–410. doi: 10.1016/S0022-2836(05)80360-2
Amos W., Hoffman J. I., Frodsham A., Zhang L., Best S., Hill A. V. S. (2007). Automated binning of microsatellite alleles: problems and solutions. Mol. Ecol. Notes 7, 10–14. doi: 10.1111/j1471-8286200601560x
Barausse A., Correale V., Curkovic A., Finotto L., Riginella E., Visentin E., et al. (2014). The role of fisheries and the environment in driving the decline of elasmobranchs in the northern Adriatic Sea. ICES Mar. Sci. 71, 1593–1603. doi: 10.1093/icesjms/fst222
Barbato M., Barría C., Bellodi A., Bonanomi S., Borme D., Ćetković I., et al. (2021). The use of fishers’ Local Ecological Knowledge to reconstruct fish behavioural traits and fishers’ perception of conservation relevance of elasmobranchs in the Mediterranean Sea. Mediterr Mar. Sci. 22, 603–622. doi: 10.12681/mms.25306
Benjamini Y., Hochberg Y. (1995). Controlling the false discovery rate: a practical and powerful approach to multiple testing. J. R Stat. 57, 289–300. doi: 10.1111/j2517-61611995tb02031x
Boomer J., Stow J. (2010). Rapid isolation of the first set of polymorphic microsatellite loci from the Australian gummy shark, Mustelus antarcticus, and their utility across divergent shark taxa. Conserv. Genet. Resour. 2, 393–395. doi: 10.1007/s12686-010-9244-0
Boscolo Palo G., Di Lorenzo M., Gancitano S., Ragonese S., Mazzoldi C., Colloca F. (2022). Sharks do not always grow slowly: tagging data reveal a different pattern of growth, longevity and maturity for threatened smooth-hounds in the central mediterranean sea. J. Mar. Sci. Eng. 10, 1647. doi: 10.3390/jmse10111647
Braccini M., Rensing K., Langlois T., McAuley R. (2017). Acoustic monitoring reveals the broad-scale movements of commercially important sharks. Marine Ecology Progress Series 577, 121–129. doi: 10.3354/meps12251
Cadrin S. X., Karr L. A., Mariani S. (2014). “Chapter one – Stock identification methods: An overview,” (Academic Press, San Diego, CA).
Carpentieri P., Nastasi A., Sessa M., Srour A. (Eds.) (2021). “Incidental catch of vulnerable species in Mediterranean and Black Sea fisheries – A review,” in Studies and Reviews No 101 (General Fisheries Commission for the Mediterranean (FAO, Rome). doi: 10.4060/cb5405en
Catalano G., Crobe V., Ferrari A., Baino R., Massi D., Titone A., et al. (2022). Strongly structured populations and reproductive habitat fragmentation increase the vulnerability of the Mediterranean starry ray Raja asterias (Elasmobranchii, Rajidae). Aquat Conserv. Mar. Freshw. Ecosyst. 32, 66–84. doi: 10.1002/aqc3739
Chabot C. L., Nigenda S. (2011). Characterization of 13 microsatellite loci for the tope shark, Galeorhinus galeus, discovered with next-generation sequencing and their utility for eastern Pacific smooth-hound sharks (Mustelus). Conserv. Genet. Resour. 3, 553–555. doi: 10.1007/s12686-011-9418-8
Chapman D. D., Feldheim K. A., Papastamatiou Y. P., Hueter R. E. (2015). There and back again: a review of residency and return migrations in sharks, with implications for population structure and management. Annu. Rev. Mar. Sci. 7, 547–570. doi: 10.1146/annurev-marine-010814-015730
Chapuis M. P., Estoup A. (2007). Microsatellite null alleles and estimation of population differentiation. Mol. Biol. Evol. 24, 621–631. doi: 10.1093/molbev/msl191
Clement M., Posada D. C. K. A., Crandall K. A. (2000). TCS: a computer program to estimate gene genealogies. Mol. Ecol. 9, 1657–1659. doi: 10.1046/j.1365-294x.2000.01020.x
Colloca F., Carrozzi V., Simonetti A., Di Lorenzo M. (2020). Using local ecological knowledge of fishers to reconstruct abundance trends of elasmobranch populations in the Strait of Sicily. Front. Mar. Sci. 7, 508. doi: 10.3389/fmars202000508
Colloca F., Enea M., Ragonese S., Di Lorenzo M. (2017). A century of fishery data documenting the collapse of smooth hounds (Mustelus spp) in the Mediterranean Sea. Aquat Conserv. Mar. Freshw. Ecosyst. 27, 1145–1155. doi: 10.1002/aqc2789
da Silva C., Kerwath S. E., Attwood C. G., Thorstad E. B., Cowley P. D., Økland F., et al. (2013). Quantifying the degree of protection afforded by a no-take marine reserve on an exploited shark. Afr J. Mar. Sci. 35, 57–66. doi: 10.2989/1814232X2013769911
Di Crescenzo S., Ferrari A., Barría C., Cannas R., Cariani A., Drewery J., et al. (2022). First evidence of population genetic structure of the deep-water blackmouth catshark Galeus melastomus Rafinesqu. Front. Mar. Sci. 9. doi: 10.3389/fmars.2022.953895
Di Lorenzo M., Calò A., Di Franco A., Milisenda G., Aglieri G., Cattano C., et al. (2022). Small-scale fisheries catch more threatened elasmobranchs inside partially protected areas than in unprotected areas. Nat. Commun. 13, 1–11. doi: 10.1038/s41467-022-32035
Di Lorenzo M., Vizzini S., Signa G., Andolina C., Boscolo Palo G., Gristina M., et al. (2020). Ontogenetic trophic segregation between two threatened smooth-hound sharks in the Central Mediterranean Sea. Sci. Rep. 10, 1–15. doi: 10.1038/s41598-020-67858-x
Domingues R. R., Hilsdorf A. W. S., Gadig O. B. F. (2018). The importance of considering genetic diversity in shark and ray conservation policies. Conserv. Genet. 19, 501–525. doi: 10.1007/s10592-017-1038-3
Dudgeon C. L., Blower D. C., Broderick D., Giles J. L., Holmes B. J., Kashiwagi T., et al. (2012). A review of the application of molecular genetics for fisheries management and conservation of sharks and rays. J. Fish Biol. 80, 1789–1843. doi: 10.1111/j1095-8649201203265x
Dulvy N. K., Farrell E. D., Buscher E. (2016). Mustelus punctulatus (Mediterranean assessment) (The IUCN Red List of Threatened Species 2016) (Accessed 06 April 2023).
Dulvy N. K., Pacoureau N., Rigby C. L., Pollom R. A., Jabado R. W., Ebert D. A., et al. (2021). Overfishing drives over one-third of all sharks and rays toward a global extinction crisis. Curr. Biol. 31, 4773–4787. doi: 10.1016/jcub202108062
Dulvy N. K., Simpfendorfer C. A., Davidson L. N., Fordham S. V., Bräutigam A., Sant G., et al. (2017). Challenges and priorities in shark and ray conservation. Curr. Biol. 27 (11), R565–R572. doi: 10.1016/jcub201704038
Edgar R. C. (2004). MUSCLE: multiple sequence alignment with high accuracy and high throughput. Nucleic Acids Res. 32, 1792–1797. doi: 10.1093/nar/gkh340
Excoffier L., Lischer E. (2010). Arlequin suite ver 35: A new series of programs to perform population genetics analyses under Linux and Windows. Mol. Ecol. Res. 10, 564–567. doi: 10.1111/j1755-0998201002847x
Farrell E., Dulvy N. (2016). Mustelus mustelus (Mediterranean assessment) (The IUCN Red List of Threatened Species 2016) (Accessed 06 April 2023).
Ferretti F., Osio G. C., Jenkins C. J., Rosenberg A., Lotze H. K. (2013). Long-term change in a meso-predator community in response to prolonged and heterogeneous human impact. Sci. Rep. 3, 1057. doi: 10.1038/srep01057
Finotto L., Berto D., Rampazzo F., Raicevich S., Bonanomi S., Mazzoldi C. (2023). Trophic partitioning among three mesopredatory shark species inhabiting the Northwestern Adriatic Sea. Diversity 15, 1163. doi: 10.3390/d15121163
Giresi M., Renshaw M. A., Portnoy D. S., Gold J. R. (2012). Isolation and characterization of microsatellite markers for the dusky smoothhound shark, Mustelus canis. Conserv. Genet. Resour. 4, 101–104. doi: 10.1007/s12686-011-9506-9
Google Maps (2023). [Northern Adriatic Sea and Mediterranean Sea]. Retrieved August 4, 2024, from QGIS 3 canvas as XYZ tiles.
Gračan R., Lazar B., Zupan S., Bužan E. (2020). Genetic characterisation of the spiny dogfish Squalus acanthias in the Adriatic Sea: evidence for high genetic diversity and an Atlantic–South Pacific origin. Mar. Freshw. Res. 72, 131–139. doi: 10.1071/MF19337
Gubili C., Sims D. W., Veríssimo A., Domenici P., Ellis J., Grigoriou P., et al. (2014). A tale of two seas: contrasting patterns of population structure in the small-spotted catshark across Europe. R Soc. Open Sci. 1, 140175. doi: 10.1098/rsos140175
Hirschfeld M., Dudgeon C., Sheaves M., Barnett A. (2021). Barriers in a sea of elasmobranchs: From fishing for populations to testing hypotheses in population genetics. Glob Ecol. Biogeogr 30, 2147–2163. doi: 10.1111/geb13379
Hueter R. E., Heupel M. R., Heist E. J., Keeney D. B. (2005). Evidence of philopatry in sharks and implications for the management of shark fisheries. J. Northwest Atl Fish Sci. 35, 239–224. doi: 10.2960/J.v35.m493
Hull K. L., Asbury T. A., da Silva C., Dicken M., Veríssimo A., Farrell E. D., et al. (2019). Strong genetic isolation despite wide distribution in a commercially exploited coastal shark. Hydrobiologia 838, 121–137. doi: 10.1007/s10750-019-03982-8
Ihssen P. E., Booke H. E., Casselman J. M., McGlade J. M., Payne N. R., Utter F. M. (1981). Stock identification: materials and methods. Can. J. fisheries Aquat. Sci. 38, 1838–1855. doi: 10.1139/f81-230
Jabado R. W., Chartrain E., Cliff G., Da Silva C., De Bruyne G., Derrick D., et al. (2021a). Mustelus mustelus (The IUCN Red List of Threatened Species 2021). Available online at: https://dxdoiorg/102305/IUCNUK2021-2RLTST39358A124405881en (Accessed 06 April 2023).
Jabado R. W., Dulvy N. K., Farrell E. D., Buscher E., Derrick D. (2021b). Mustelus punctulatus (The IUCN Red List of Threatened Species 2021). Available online at: https://dxdoiorg/102305/IUCNUK2021-1RLTST161485A124493853en (Accessed 06 April 2023).
Jombart T., Devillard S., Balloux F. (2010). Discriminant analysis of principal components: a new method for the analysis of genetically structured populations. BMC Genet. 11, 1–15. doi: 10.1186/1471-2156-11-94
Jones O., Wang J. (2010). COLONY: a program for parentage and sibship inference from multilocus genotype data. Mol. Ecol. Res. 10, 551–555. doi: 10.1111/j1755-0998200902787x
Keenan K., McGinnity P., Cross T. F., Crozier W. W., Prodöhl P. A. (2013). diveRsity: An R package for the estimation and exploration of population genetics parameters and their associated errors. Methods Ecol. Evol. 4, 782–788. Available at: https://CRANR-projectorg/package=diveRsity (accessed September 13, 2024).
Klein J. D., Asbury T. A., da Silva C., Hull K. L., Dicken M. L., Gennari E., et al. (2022). Site fidelity and shallow genetic structure in the common smooth-hound shark Mustelus mustelus confirmed by tag-recapture and genetic data. J. Fish Biol. 100, 134–149. doi: 10.1111/jfb14926
Leigh J. W., Bryant D. (2015). Popart: full-feature software for haplotype network construction. Methods Ecol. Evol. 6, 1110–1116. doi: 10.1111/2041-210x12410
Maduna S. N., da Silva C., Wintner S. P., Roodt-Wilding R., Bester-van der Merwe A. E. (2016). When two oceans meet: regional population genetics of an exploited coastal shark, Mustelus mustelus. Mar. Ecol. Prog. Ser. 544, 183–196. doi: 10.3354/meps11596
Maduna S. N., Rossouw C., Da Silva C., Soekoe M., Bester-van-der-Merwe A. E. (2017). Species identification and comparative population genetics of four coastal houndsharks based on novel NGS-mined microsatellites. Ecol. Evol. 7, 1462–1486. doi: 10.1002/ece32770
Maioli F., Weigel B., Chiarabelli E., Manfredi C., Anibaldi A., Isailović I., et al. (2023). Casini, M.(2023) Influence of ecological traits on spatio-temporal dynamics of an elasmobranch community in a heavily exploited basin. Sci. Rep. 13, 9596. doi: 10.1038/s41598-023-36038-y
Manfredi C., Ciavaglia E., Isajlovic I., Piccinetti C., Vrgoc N. (2010). Temporal and spatial distribution of some elasmobranchs in the northern and central adriatic sea/distribuzione spazio-temporale di alcuni elasmobranchi in alto e medio adriatico. Biol. Mar. Mediterr 17, 254.
Mann B. Q., Bullen E. M. (2009). ORI/WWF-SA Tagging Project: Summary of Tag and Recapture Data for Smoothhound sharks (Mustelus mustelus) Caught Along the Southern African Coast from 1984 to 2008 (Durban: Oceanographic Research Institute).
Marino I. A. M., Finotto L., Colloca F., Di Lorenzo M., Gristina M., Farrell E. D., et al. (2018). Resolving the ambiguities in the identification of two smooth-hound sharks (Mustelus mustelus and Mustelus punctulatus) using genetics and morphology. Mar. Biodivers 48, 1551–1562. doi: 10.1007/s12526-017-0701-8
Marino I. A. M., Riginella E., Cariani A., Tinti F., Farrell E. D., Mazzoldi C., et al. (2015a). New molecular tools for the identification of 2 endangered smooth-hound sharks, Mustelus mustelus and Mustelus punctulatus. J. Hered 106, 123–130. doi: 10.1093/jhered/esu064
Marino I. A. M., Riginella E., Gristina M., Rasotto M. B., Zane L., Mazzoldi C. (2015b). Multiple paternity and hybridization in two smooth-hound sharks. Sci. Rep. 5, 1–11. doi: 10.1038/srep12919
Matić-Skoko S., Šegvić-Bubić T., Mandić I., Izquierdo-Gomez D., Arneri E., Carbonara P., et al. (2018). Evidence of subtle genetic structure in the sympatric species Mullus barbatus and Mullus surmuletus (Linnaeus 1758) in the Mediterranean Sea. Sci. Rep. 8, 1–14. doi: 10.1038/s41598-017-18503-7
Melis R., Vacca L., Cariani A., Carugati L., Charilaou C., Di Crescenzo S., et al. (2023). Baseline genetic distinctiveness supports structured populations of thornback ray in the Mediterranean Sea. Aquat. Conservation: Mar. Freshw. Ecosyst. 33, 458–471. doi: 10.1002/aqc.3939
Moritz C. (1994). Defining ‘evolutionarily significant units’ for conservation. Trends Ecol. Evol. 9, 373–375. doi: 10.1016/0169-5347(94)90057-4
Ovenden J. R. (2013). Crinkles in connectivity: combining genetics and other types of biological data to estimate movement and interbreeding between populations. Mar. Freshw. Res. 64, 201–207. doi: 10.1071/MF12314
Papetti C., Di Franco A., Zane L., Guidetti P., De Simone V., Spizzotin M., et al. (2013). Single population and common natal origin for Adriatic Scomber scombrus stocks: evidence from an integrated approach. ICES J. Mar. Sci. 70, 387–398. doi: 10.1093/icesjms/fss201
Patwary M. U., Kenchington E. L., Bird C. J., Zouros E. (1994). The use of random amplified polymorphic DNA (RAPD) markers in genetic studies of the sea scallop Placopecten magellanicus (Gmelin 1971). J. Shellfish Res. 13, 547–553.
Phillips N. M., Devloo-Delva F., McCall C., Daly-Engel T. S. (2021). Reviewing the genetic evidence for sex-biased dispersal in elasmobranchs. RevFish Biol. Fish 31, 821–841. doi: 10.1007/s11160-021-09673-9
Portnoy D. S., Heist E. J. (2012). Molecular markers: progress and prospects for understanding reproductive ecology in elasmobranchs. J. Fish Biol. 80, 1120–1140. doi: 10.1111/j.1095-8649.2011.03206.x
Pritchard J. K., Stephens M., Donnelly P. (2000). Inference of population structure using multilocus genotype data. Genet 155, 945–959. doi: 10.1093/genetics/1552945
Raymond M., Rousset F. (1995). An exact test for population differentiation. Evolution 49, 1280–1283. doi: 10.2307/2410454
Riginella E., Correale V., Marino I. A. M., Rasotto M. B., Vrbatovic A., Zane L., et al. (2020). Contrasting life-history traits of two sympatric smooth-hound species: implication for vulnerability. J. Fish Biol. 96, 853–857. doi: 10.1111/jfb14262
Rondinini C., Battistoni A., Teofili C. (2022). Lista Rossa IUCN dei Vertebrati Italiani 2022 (Roma, Italy: Comitato Italiano IUCN e Ministero dell’Ambiente e della Sicurezza Energetica).
Rousset F. (2008). genepop’007: a complete re-implementation of the genepop software for Windows and Linux. Mol. Ecol. Res. 8, 103–106. doi: 10.1111/j1471-8286200701931x
Rozas J., Ferrer-Mata A., Sánchez-DelBarrio J. C., Guirao-Rico S., Librado P., Ramos-Onsins S. E., et al. (2017). DnaSP 6: DNA sequence polymorphism analysis of large data sets. Mol. Biol. Evol. 34, 3299–3302. doi: 10.1093/molbev/msx248
RStudio Team (2020). RStudio: Integrated Development for R RStudio (Boston, MA: PBC). Available at: http://wwwrstudiocom/ (accessed June 20, 2024).
Sandoval-Castillo J., Beheregaray L. B. (2015). Metapopulation structure informs conservation management in a heavily exploited coastal shark (Mustelus henlei). Mar. Ecol. Prog. Ser. 533, 191–203. doi: 10.3354/meps11395
Subramanian S., Lambert D. M. (2011). Time dependency of molecular evolutionary rates? Yes and no. Genome Biol. Evol. 3, 1324–1328. doi: 10.1093/gbe/evr108
Tamura K., Stecher G., Peterson D., Filipski A., Kumar S. (2013). MEGA6: molecular evolutionary genetics analysis version 60. Mol. Biol. Evol. 30, 2725–2729. doi: 10.1093/molbev/mst197
Van Oosterhout C., Hutchinson W. F., Wills D. P., Shipley P. (2004). MICRO-CHECKER: software for identifying and correcting genotyping errors in microsatellite data. Mol. Ecol. Notes 4, 535–538. doi: 10.1111/j1471-8286200400684x
Walls R., Dulvy N. (2021). Tracking the rising extinction risk of sharks and rays in the Northeast Atlantic Ocean and Mediterranean Sea. Sci. Rep. 11, 1–15. doi: 10.1038/s41598-021-94632-4
Keywords: Triakidae, connectivity, elasmobranch, conservation, management
Citation: Barbato M, Bonanomi S, Borme D, Ćetković I, Colloca F, Di Lorenzo M, Marino IAM, Mazzoldi C, Pešić A, Sala A, Zane L and Mezzavilla M (2025) New findings into the genetic population structure of two commercially valuable and threatened sharks, Mustelus mustelus (Linnaeus, 1758) and M. punctulatus (Risso, 1827), allow refining management strategy in the Central Mediterranean Sea. Front. Mar. Sci. 12:1520573. doi: 10.3389/fmars.2025.1520573
Received: 31 October 2024; Accepted: 13 January 2025;
Published: 07 February 2025.
Edited by:
Brendan Shea, Beneath the Waves, Inc., United StatesReviewed by:
Edgardo Diaz-Ferguson, Estación Científica Coiba AIP, PanamaLisa M. Crawford, Stony Brook University, United States
João Pedro Barreiros, University of the Azores, Portugal
Copyright © 2025 Barbato, Bonanomi, Borme, Ćetković, Colloca, Di Lorenzo, Marino, Mazzoldi, Pešić, Sala, Zane and Mezzavilla. This is an open-access article distributed under the terms of the Creative Commons Attribution License (CC BY). The use, distribution or reproduction in other forums is permitted, provided the original author(s) and the copyright owner(s) are credited and that the original publication in this journal is cited, in accordance with accepted academic practice. No use, distribution or reproduction is permitted which does not comply with these terms.
*Correspondence: Matteo Barbato, bWF0dGUuYmFyYmF0b0BnbWFpbC5jb20=