 Johanna Stedt
 Linnea Brokmar
 Aleksija Neimanis
 William F. Englund2
 Per Carlsson
 Anna Roos
- 1Department of Biology, Lund University, Lund, Sweden
- 2Department of Environmental Analysis and Research, Swedish Museum of Natural History, Stockholm, Sweden
- 3Department of Pathology and Wildlife Diseases, Swedish Veterinary Agency, Uppsala, Sweden
- 4Department of Animal Biosciences, Swedish University of Agricultural Sciences, Uppsala, Sweden
Knowledge of animal diets is fundamental in ecology as it can provide insight into the structure, function and resilience of entire ecosystems. In this study we investigate the diet composition of the harbour porpoise (Phocoena phocoena), a small marine top predator with great ecological importance, to provide updated dietary estimates for the species in Swedish waters. This is done by parallel use of macroscopic stomach content analysis and DNA based prey species determinations by DNA metabarcoding (sDNA analysis), which allows us to also compare and evaluate the methods’ respective and combined performance. We show that harbour porpoises during 2017-2022 consumed a broad variety of both benthic and pelagic fish along the Swedish west coast. The combination of macroscopic and sDNA analysis for diet estimation yielded an almost two-fold increase in species and taxa detection compared to macroscopic analysis alone, with overall detection of 36 unique prey species from 21 prey families. Consistent with results from previous studies in the area, the main prey taxa were clupeids, gadoids and gobiids. In the macroscopic analysis these three taxa together represent more than 80% of the relative numerical contribution to the estimated diet. Using sDNA analysis the same three taxa dominate the relative read abundance, with clupeids detected in all sampled porpoise stomachs, gobiids in 86% of stomachs, and gadoids in 66%. The diet estimates from the two diet tracing methods are overall in high agreement, but sDNA analysis increased the number of detected prey taxa and also increased the sample size by allowing extraction of dietary data from apparently empty stomachs. The detection probability of some occurring prey taxa, however, appears to be method dependent. To facilitate combined use of sDNA and macroscopic analysis in diet studies, we established and propose a new occurrence metric that can be used to merge data for more straightforward diet comparisons. We conclude that for diet studies on harbour porpoises and other cetaceans, which often present empty stomachs in post-mortem examinations, the use of sDNA analysis has the potential to recover valuable data from animals where stomach samples would otherwise be disregarded as unavailable for diet analysis.
1 Introduction
Knowledge of animal diets is fundamental in ecology, as species interactions and food web dynamics give powerful insight into the structure, function and resilience of entire ecosystems (Estes et al., 2011). Understanding what animals feed on also allows understanding of intra- and interspecific niche specialization (Kratina et al., 2012; Xia et al., 2020), and insight into nutritional physiology and energetics (Birnie-Gauvin et al., 2017; Rojano-Donate et al., 2024). To answer the question “what does this animal eat” might seem straightforward, but diet tracing in ecology requires careful method selection as each approach provide its’ own set of limitations (Nielsen et al., 2017). Traditionally, animal dietary studies are performed by extraction of preserved macroscopic remains from ingested prey found in faecal and stomach content (Pierce and Boyle, 1991; Nielsen et al., 2017) or by analysis of organic macromolecules, such as fatty acids or stable isotope analysis (SIA) of bulk or specific compounds in animal tissue. The former is a time consuming and labour-intensive method, requiring training and access to reference material. However, in addition to data on relative occurrence and importance of detected prey taxa, it can also provide information on size and age of detected prey species (Nielsen et al., 2017; Hyslop, 2006).
In recent years, DNA metabarcoding has emerged as a popular new technique for dietary studies as it is a time-efficient way to obtain large sample sizes with high taxonomic resolution (Nielsen et al., 2017). In aquatic environments, metabarcoding of environmental DNA (eDNA) is now frequently used for e.g. biodiversity monitoring and invasive species detection (Ruppert et al., 2019). The technique is increasingly used to study the diet of both terrestrial (Norgaard et al., 2021; Soininen et al., 2013) and aquatic species (van Zinnicq Bergmann et al., 2021; Voelker et al., 2020), but mainly using DNA from scat or faeces. For species where faecal samples are difficult to obtain in the field, for example for most fully aquatic animals or extremely rare species, diet consumption can instead be estimated using gastrointestinal content from deceased animals (e.g. Zhang et al., 2023). The performance of DNA metabarcoding of gastrointestinal content in relation to macroscopic analysis of ingested prey hard parts has been previously investigated, however, mostly using results where methods are performed on different individuals (Cordone et al., 2021; Gül et al., 2023). Only a few detailed studies of method performance, by parallel use of both methods on the same individuals followed by diet estimate comparisons, exist [e.g. for small freshwater fish (Kuhrt et al., 2023) and seals (McCosker et al., 2024)]. For cetaceans, similar detailed studies are lacking, although a recent study on beaked whales suggest that the two methods provide promising complementary results (Stavenow et al., 2022).
In this study, we applied parallel use of DNA metabarcoding and macroscopic analysis on gastrointestinal content from the same individuals. We used a marine mammal, the harbour porpoise (Phocoena phocoena), as our study species. The harbour porpoise is the only cetacean species resident in Swedish marine waters and a top predator with high ecological importance (Machovsky-Capuska and Raubenheimer, 2020). Previous studies have shown that porpoises in Swedish waters feed on a variety of small benthic and pelagic fish, but that the diet is often dominated by gadoid, gobiid and clupeid species (Angerbjörn et al., 2007; Andreasen et al., 2017; Börjesson et al., 2003; Aarefjord et al., 1995). There is, however, reason to expect that the diet of harbour porpoises in Swedish waters has changed over the past 13 years and is different from when it was last investigated.
As top predators, marine mammals are globally challenged by restructured food webs and collapses of important prey fish populations due to overfishing and eutrophication (Frank et al., 2005). The fish populations in the Baltic Sea (Casini et al., 2008, 2009) and on the west coast of Sweden (Blocker et al., 2023) have experienced drastic regime shifts during the last decades, and a recent study suggests that porpoises in nearby Danish waters might target smaller prey than before (Wisniewska et al., 2016). Given that prey availability and quality have large impacts on the overall distribution and health of the species (Spitz et al., 2018), and that all three porpoise populations found in Swedish waters are threatened and in need of protection (Owen et al., 2024; Amundin et al., 2022; Carlén et al., 2021), updated diet estimates are required.
Stranded and bycaught harbour porpoises are continuously collected along the Swedish coast and examined by necropsy for national health monitoring. These animals provide valuable samples for research, on e.g. the diet of this otherwise elusive species, and offer a unique opportunity for comparative studies on dietary analysis methods. By applying parallel analysis by DNA metabarcoding and macroscopic analysis of gastrointestinal content on the same porpoise individuals and comparing the methods’ respective diet estimates, one aim of this study was to evaluate method performance and provide guidance for future diet studies. A second aim was to provide updated diet estimates for porpoises in Swedish waters, allowing descriptions of potential dietary changes and presence of dietary differences between sexes, age groups, seasons, and sea districts.
2 Materials and methods
2.1 Sample collection
Sixty-five bycaught or stranded harbour porpoises collected along the Swedish coast between 2017-2022 were included in this study (Figure 1). Post-mortem examinations, including detailed external and internal investigation, were performed by a team of veterinary pathologists and biologists at the Swedish Veterinary Agency (Uppsala, Sweden) following standardised necropsy protocols (Read and Murray, 2000; Kuiken and Hartman, 1991; Ijsseldijk et al., 2019). Stomachs, and in most cases also intestines, were collected for dietary analysis and processed immediately or frozen (-20°C) until later processing. Morphometrics and life history parameters were documented and biological samples collected as described in Neimanis et al. (2022), allowing age group classification. Porpoises with a body weight less than 11 kg and a body length less than 91 cm were considered non-weaned neonates (following Lockyer, 2003; van Elk et al., 2019) and not included. Based on the geographic location of recovery, each individual was assigned to a sea district (Skagerrak/Kattegat/Öresund/Southern Baltic) (Figure 1).
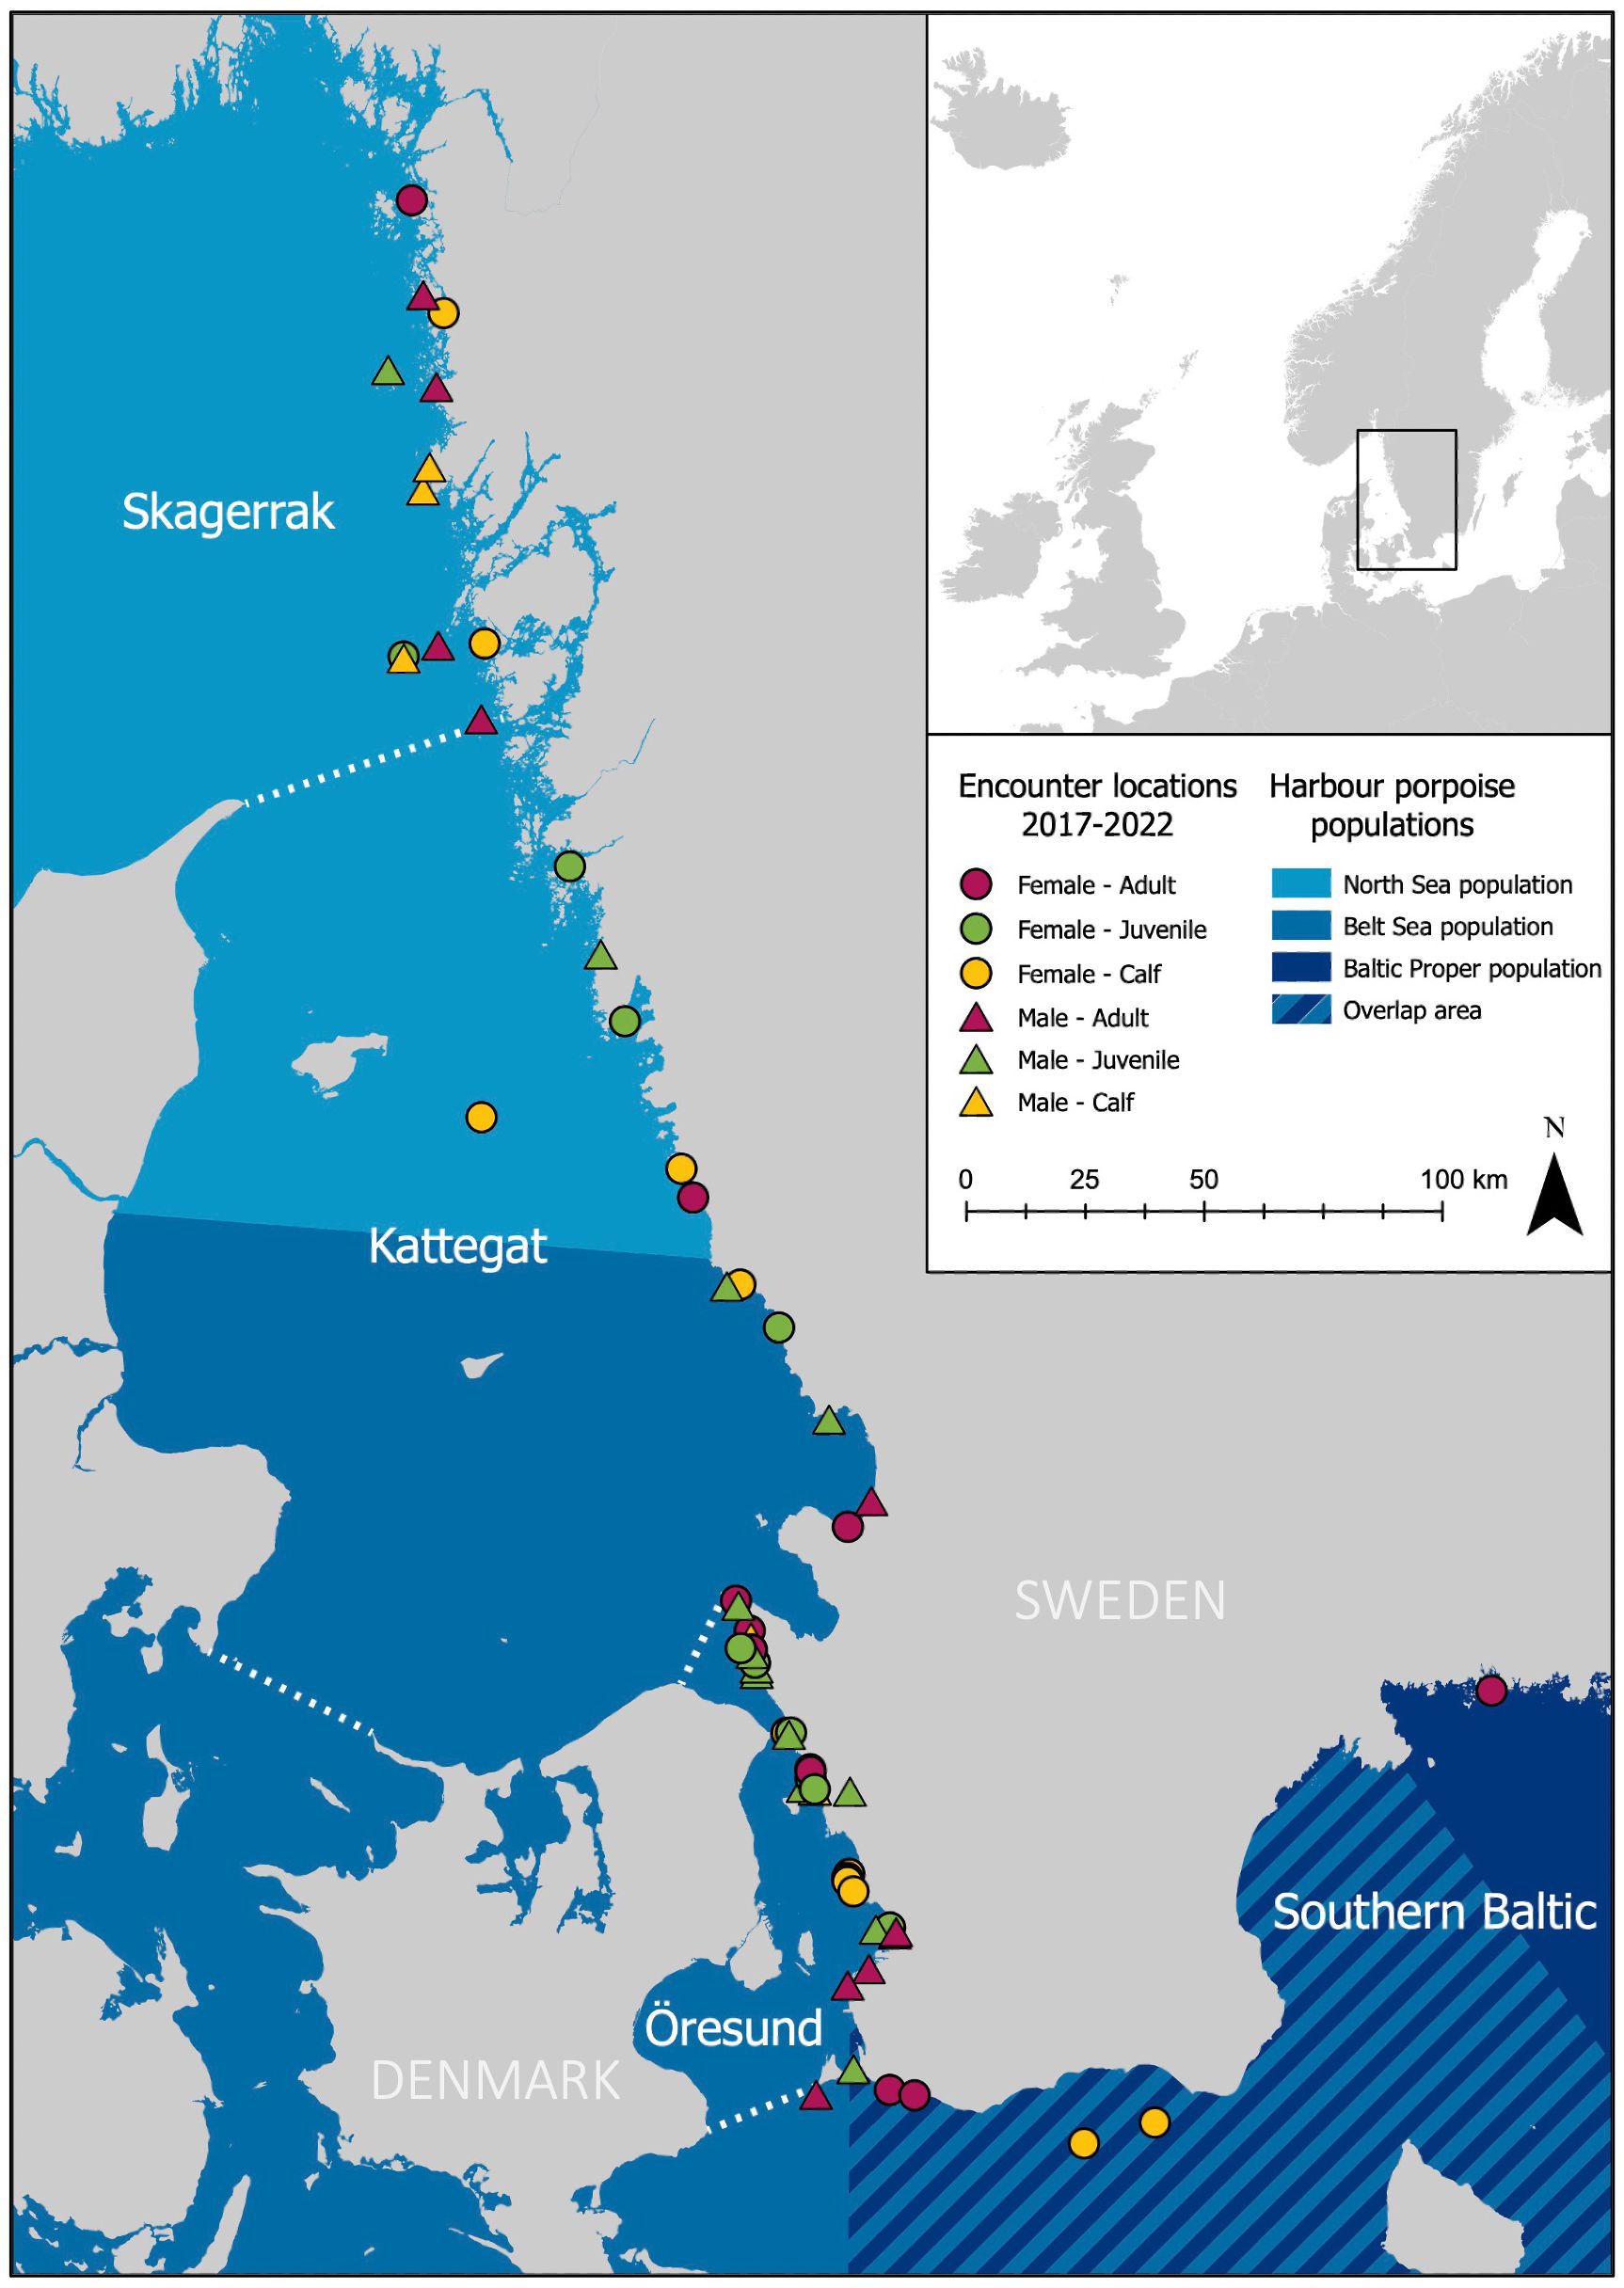
Figure 1. Summer management areas of harbour porpoise populations in the Baltic region overlayed with encounter locations of 65 stranded or bycaught harbour porpoises (Phocoena phocoena) collected in Sweden during 2017-2022 for post-mortem examination and dietary analysis. White dotted lines denote borders for sea districts. Management area layers created and provided by I Carlén.
2.2 Macroscopic stomach content analysis
Stomachs, and in some cases intestine, (hereafter referred to as only ‘stomach’) were carefully rinsed and the content of each stomach was passed through a series of sieves (mesh sizes 0.5-2 mm) to separate and extract potential hard parts (e.g. otoliths, skeletal parts, and cephalopod beaks). Sagittal otoliths were used for fish species identification, down to the lowest possible taxonomic level, based on morphology using published species identification literature (Leopold et al., 2001; Härkönen, 1986). Cephalopod beaks were used to identify cephalopod presence, but not identified to species. For each stomach, all otoliths and cephalopod beaks were counted.
When otolith degradation state allowed, sagittal otolith length and width were measured at micrometre scale using a stereo microscope (Nikon SMZ1500), an Infinity 1 camera and the program Infinity Analyze. Measurements were used to calculate prey length and body mass based on published species-specific relationships (Leopold et al., 2001; Härkönen, 1986). Average relationships for related prey species were used to estimate individual length and body mass from prey otoliths which could only be identified to family level. Correction factors accounting for otolith wear were not applied, as prey size estimation was not the priority of this study. Hence, estimated fish size averages are underestimates.
2.3 DNA based prey species determinations
For DNA based metabarcoding analysis of stomach content (sDNA analysis), a sample (approx. 2 ml) of gastrointestinal fluid was collected using a stool collection tube. To minimize potential impact from uneven prey DNA distribution within stomachs, sub-samples were taken from each of the three chambers of the stomach and from the intestines and then pooled. sDNA samples were stored frozen (-20°C) and later analysed at the Centre for Genetic Identification at the Swedish Museum of Natural History. Consistent with procedures used in similar studies investigating marine mammal diet using faecal samples (Deagle et al., 2005) and stomach content (Zhang et al., 2023), only a small fraction of the 2 ml sample volume was extracted for genetic analysis. sDNA samples for all 65 porpoises were sequenced for fish and 54 of these were also analysed for detection of cephalopods using invertebrate primers.
DNA extractions were carried out in a dedicated molecular laboratory using a Kingfisher flex extraction robot and a Kingfisher Cell and Tissue DNA extraction kit following the manufacturer's protocol. Preceding amplification, samples were treated with proteinase K and incubated in 56°C for at least four hours. A short sequence of the mitochondrial DNA was then amplified through PCR technique using two universal sets of primers optimized for sequencing and detection of fish species (Miya et al., 2015) and invertebrates (Geller et al., 2013; Leray et al., 2013) (Table 1). All locus-specific primers were fused with iTru_R1 and iTru_R2 respectively (Glenn et al., 2019). Amplifications were done in reactions including 1 x Master Mix (Qiagen Multiplex), 0,5 μl of each primer (10 μM), and 4 μl template in a total volume of 12,5 μl. Each sample was done in triplicates which were pooled before building libraries, and each PCR run included a negative control. PCR conditions during sequencing of fish fauna included initial denaturation at 95°C for 15 min followed by 50 cycles of 95°C for 30 sec, 65°C for 90 sec, 72°C for 60 sec, and a final step at 60°C for 30 mins. PCR conditions for invertebrate fauna included initial denaturation at 95°C for 15 min followed by 16 cycles of 95°C for 30 sec, 62°C for 90 sec, 72°C for 60 sec, followed by 25 cycles of 95°C for 30 sec, 46°C for 90 sec, 72°C for 60 sec, and a final step at 60°C for 30 mins. PCR products were cleaned using 0,9 x AmPure beads. The second PCR round, adding indexes to the libraries, was performed with 1 x KAPA HiFi HotStart Ready Mix, 2 μl of indexing primers (iTru5 and ITru7) and 11μl of bead-cleaned PCR product from the first PCR round in a total volume of 25 μl. PCR conditions during the second round were initial denaturation at 98°C for 45 sec, followed by 5 cycles at 98°C for 15 sec, 65°C for 30 sec, 72°C for 30 sec, and a final extension at 72°C for 60 sec. Finished libraries were cleaned using 0,9 x AmPure beads and concentrations were measured on a Qubit instrument. Sequencing was done at BMKgene using a NovaSeq6000 instrument with PE150 reads and using v1.5 chemistry.
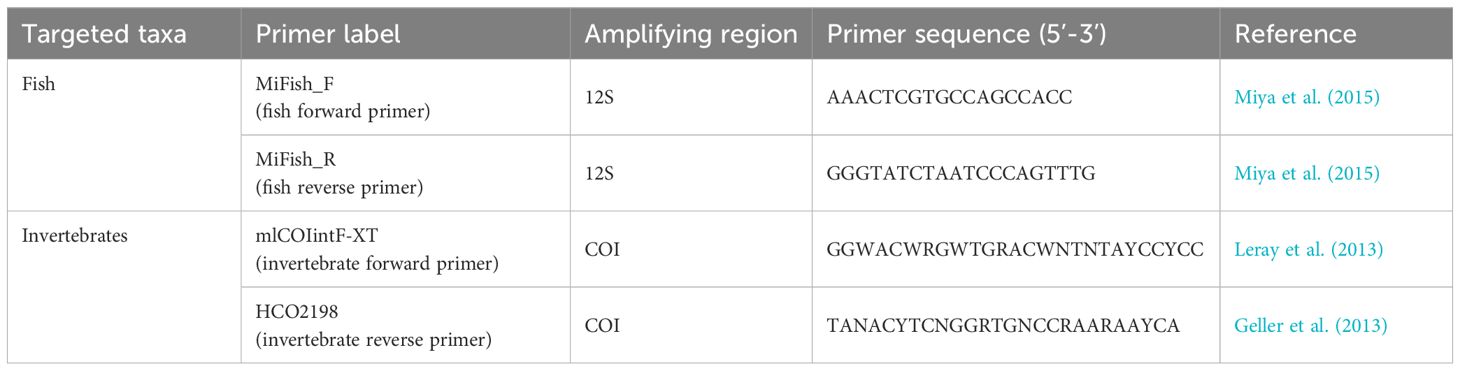
Table 1. Primer pairs and associated details for the high-throughput sequencing of fish and invertebrates through sDNA metabarcoding used in this study.
Primer sequences were trimmed from raw data using the program cutadapt (Martin, 2011). In R (version 4.4.1), the DADA2 package (version 1.32.0) (Callahan et al., 2016) was used to detect and quantify unique sequences of biological origin in raw data. Output sequences representing at least 0.1% of the reads within a sample and appearing in at least 0.1% of the total reads were taxonomically identified using BLAST (Basic Local Alignment Search Tool) and the Nucleotide database available from NCBI (National Center for Biotechnology Information). The cutoff threshold was set to 0.1% to minimize the number of false positives while at the same time including most of the correct output sequences. For fish, identifications with less than 98% match were excluded to increase accuracy of the automatic taxonomic assignation and exclude chimeric sequences. For invertebrates, an initial cutoff point of 98% was used, but because this generated almost no detections, this cutoff point was lowered to 90%. After initial sequence matching, all fish and invertebrate matches were reviewed manually to validate identifications.
2.4 Prey consumption metrics
To estimate dietary importance [defined as contributed amount, not e.g. energetic content, of identified prey taxa (see Hyslop, 2006)] and relative contribution of identified prey species, four prey consumption metrics were calculated. For macroscopic data, percent numerical contribution (%N), percent frequency of occurrence (%FOO), and weighted percent of occurrence (wPOO) were calculated. For sDNA data, percent relative read abundance (%RRA), percent frequency of occurrence (%FOO), and weighted percent of occurrence (wPOO) were calculated. This was done for all occurring prey species and families/taxa, as well as on sample population-level and constructed porpoise group levels to allow comparison between defined groups of porpoises (sex/age group/geographic area/season) and dietary analysis methods.
Percent numerical contribution (%N) represents the proportional numerical contribution of a given prey to the diet and can be calculated as:
where n is the total number of individual items recorded for each prey category and N is the total number of recorded items for all prey categories. %N provides a rough quantitative estimate of the relative importance of each prey category to individual- and sample population-level diet estimates. In traditional macroscopic analysis, it might however overemphasize the importance of small prey items taken in large numbers, as prey size is unaccounted for (Hyslop, 2006).
Percent frequency of occurrence (%FOO) represents the proportion of samples that contain a given prey category and can be calculated as:
where S is the total number of samples, and I is an indicator function such that Ii,k = 1 if prey category (species/taxa) i is present in sample k, and 0 if not. %FOO thus give the percentage of samples with presence of a certain prey and provides a crude qualitative estimate of the dietary spectrum on a sample population-level (Hyslop, 2006).
For metabarcoding results, the percent Relative Read Abundance (%RRA) of a given prey item represents its proportional abundance by sequence counts (Deagle et al., 2019). It was calculated as:
where r is the total number of sequences recorded for each prey category and R is the total number of sequences for all prey categories. In a dataset with many prey taxa, %RRA is poorly correlated with prey abundance as each taxon have a different amplification efficiency for a given set of PCR primers (Kelly et al., 2019). However, in metabarcoding datasets where PCR procedures are maintained consistent the amplification efficiency can be expected to remain constant within a taxon across samples (assuming amplification efficiency to solely be a product of primer-template interaction). Proportional taxa-specific sDNA indices, such as %RRA calculated using read counts for only a specific taxa of interest, can thus capture trends in taxon-specific biomass with high accuracy and be used to study relative changes in species-specific occurrence (Kelly et al., 2019).
For both methods, all prey species and families/taxa were ranked based on their estimated dietary contribution by %FOO. Finally, the relative weight contribution expressed as a percent (%W) was calculated for those prey taxa where the condition of macroscopically detected otoliths allowed calculations of bodyweight.
An additional novel metric which combines the results from macroscopic and sDNA analysis was also established. This metric was termed macro-sDNA weighted percent of occurrence (wPOOmac-sDNA) and combines macroscopic and sDNA results to a joint metric by equal weighting of results from the two methods. This metric was calculated for all occurring prey species, families/taxa, and for all constructed porpoise group levels to allow overall dietary comparisons between defined groups of porpoises (sex/age group/geographic area/season).
The macro-sDNA weighted percent of occurrence can be calculated for any individual in a dataset with combined macroscopic and sDNA results on prey item occurrence. Similar to wPOO, wPOOmac-sDNA can then also be summarized to sample-population level. It assigns equal weight to all occurring prey categories within an individual stomach, but gives categories detected with both methods twice the relative importance. For any specific individual and prey category, the macro-sDNA weighted percent of occurrence can be calculated as:
Where Tk is the number of prey categories (species/taxa) detected in sample k, and I is an indicator function such that Ii,k = 1 if prey category (species/taxa) i is present in sample k, and 0 if not.
2.5 Data analyses
Data preparation was performed in Microsoft Excel version 16.89 (Microsoft Corporation, 2018). All statistical analysis and data visualization were performed in R version 4.3.3 (R Core Team, 2024). Map visualization of data distribution was created using ArcGIS Pro version 3.3.0 (ESRI, 2024).
Seasonal distribution of collected and sampled porpoises were investigated by plotting the number of porpoises per age group (adult/juvenile/calf) and type of discovery (found dead/bycatch) by month using the R package ‘ggplot’ (Wickham, 2016). Distributions of collected porpoises by dyads of sex, age class, and sea district were plotted using the R package ‘ggmosaic’ (Jeppson et al., 2021).
Estimated sample population-level diets by macroscopic and sDNA analysis were compared visually by two types of plots. Taxa contributing with >5% of the relative numerical occurrence (%N) for macroscopic analysis and relative read abundance (%RRA) for sDNA analysis were visualized in method specific pie chart plots. The relative frequency of occurrence (%FOO) for the 11 prey taxa with >10% estimated dietary contribution by any of the methods or metrics was plotted side-by-side in a combined bar plot.
In addition, the two methods were compared by calculation of Czekanowski’s similarity index (CI) using the package ‘epiR’ in R (Stevenson and Sergeant, 2025). The index was calculated on sample population-level %FOO and ranked %FOO for each prey family (including class Cephalopoda as a family) and species level. Summarized results for all available pairwise comparisons were visualized by barplots of the four possible combinations. The CI index has previously been used to compare pairwise dietary estimates yielded by different methods (Nielsen et al., 2017), and is well-suited for dietary comparisons with varying numbers of detected prey items (Kohn and Riggs, 1982). A CI index of 100% represents complete overlap between methods, while 0% denotes no overlap. Further, to visually explore and provide individual examples of estimated diet by the two methods, a comparison of individual-level estimated diet by macroscopic and sDNA analysis was done on a random subset of six porpoise individuals by plotting the number and species of detected prey by each of the two methods.
Presence of dietary differences between sexes, age classes, sea districts, and quarters of year were mainly investigated by plots of the method-combined metric macro-sDNA weighted percent of occurrence (wPOOmac-sDNA) of detected prey families in estimated diet for each group. Prey families contributing by <5% to a groups’ wPOOmac-sDNA were pooled into ‘Other’. However, to investigate potential differences in diet estimates between methods, the weighted percent of occurrence (wPOO) for detected prey families in estimated diet was also plotted for each method and group, respectively.
The number of prey species detected by each of the two diet tracing methods were statistically compared by non-parametric unpaired two-samples Wilcoxon test. Given the much larger sample size for the sDNA diet tracing method (nsDNA = 65) compared to the macroscopic method (nmacro = 26), and to facilitate interpretation of results, the additional detailed statistical analysis was performed only on sDNA data. An unpaired two-samples Wilcoxon test was used to test for sex specific differences in number of prey species. Similarly, potential differences in number of prey species between age groups were investigated statistically using non-parametric Kruskal-Wallis test. Post-hoc pairwise comparisons were made by Dunn’s test with Bonferroni correction using the package ‘rstatix’ in R (Kassambara, 2023).
Group-specific differences in the dietary contribution of the three main prey families (Clupeidae, Gadidae and Gobiidae) were investigated using taxa-specific proportional read counts (taxa-specific %RRA). For Clupeidae, three samples were considered highly influencing outliers, as they contributed with 61% (female calf from Q2 in Skagerrak), 19% (juvenile female from Q4 in Kattegat) and 7% (adult male from Q3 in Skagerrak) of the total taxa-specific read counts, and were removed prior to statistical analysis. Similarly, two samples were removed as outliers in the taxa-specific %RRA dataset for Gadidae as they contributed with 45% (male calf from Q2 in Skagerrak) and 38% (female calf from Q3 in Öresund) of the total read counts. For Gobiidae, three samples were removed as outliers prior to taxa-specific analysis; one representing 54% of the total taxa-specific read counts (juvenile female from Q2 in Kattegat), one representing 13% (female calf from Q1 in Öresund), and one representing 12% (male calf from Q1 in Skagerrak). Again, unpaired two-samples Wilcoxon tests were used to test for sex specific differences, while differences between remaining groups (age, quarter of year, and sea district) were investigate by non-parametric Kruskal-Wallis tests followed by post-hoc pairwise comparisons by Dunn’s test with Bonferroni correction.
Distributions and descriptive details of groups of data in statistical tests were visualized in raincloud plots using the package ‘smplot2’ in R (Min, 2024).
3 Results
3.1 Sample distribution
Collected porpoises were relatively evenly distributed along the west coast of Sweden and also included some individuals from the Southern Baltic (Figure 1). The majority of collected porpoises were discovered within the summer management areas of the North Sea population and the Belt Sea population (Figure 1). A majority of the collected and sampled porpoises were bycaught individuals (70%, 46 out of 65), either directly delivered to us by fishermen (n=23) or cause of death determined during necropsies to be due to bycatch (n=19), or probable bycatch (n=4). The remaining 19 individuals had other determined causes of death, such as health disorders, emaciation or predation.
Porpoises were collected during all months of the year, though not all age groups were represented for all months and a larger number of porpoises were available from March-May (Figure 2). The distributions of porpoises by dyads of sex, age group, and sea district were overall even, even if some pairs were underrepresented (Figure 3).
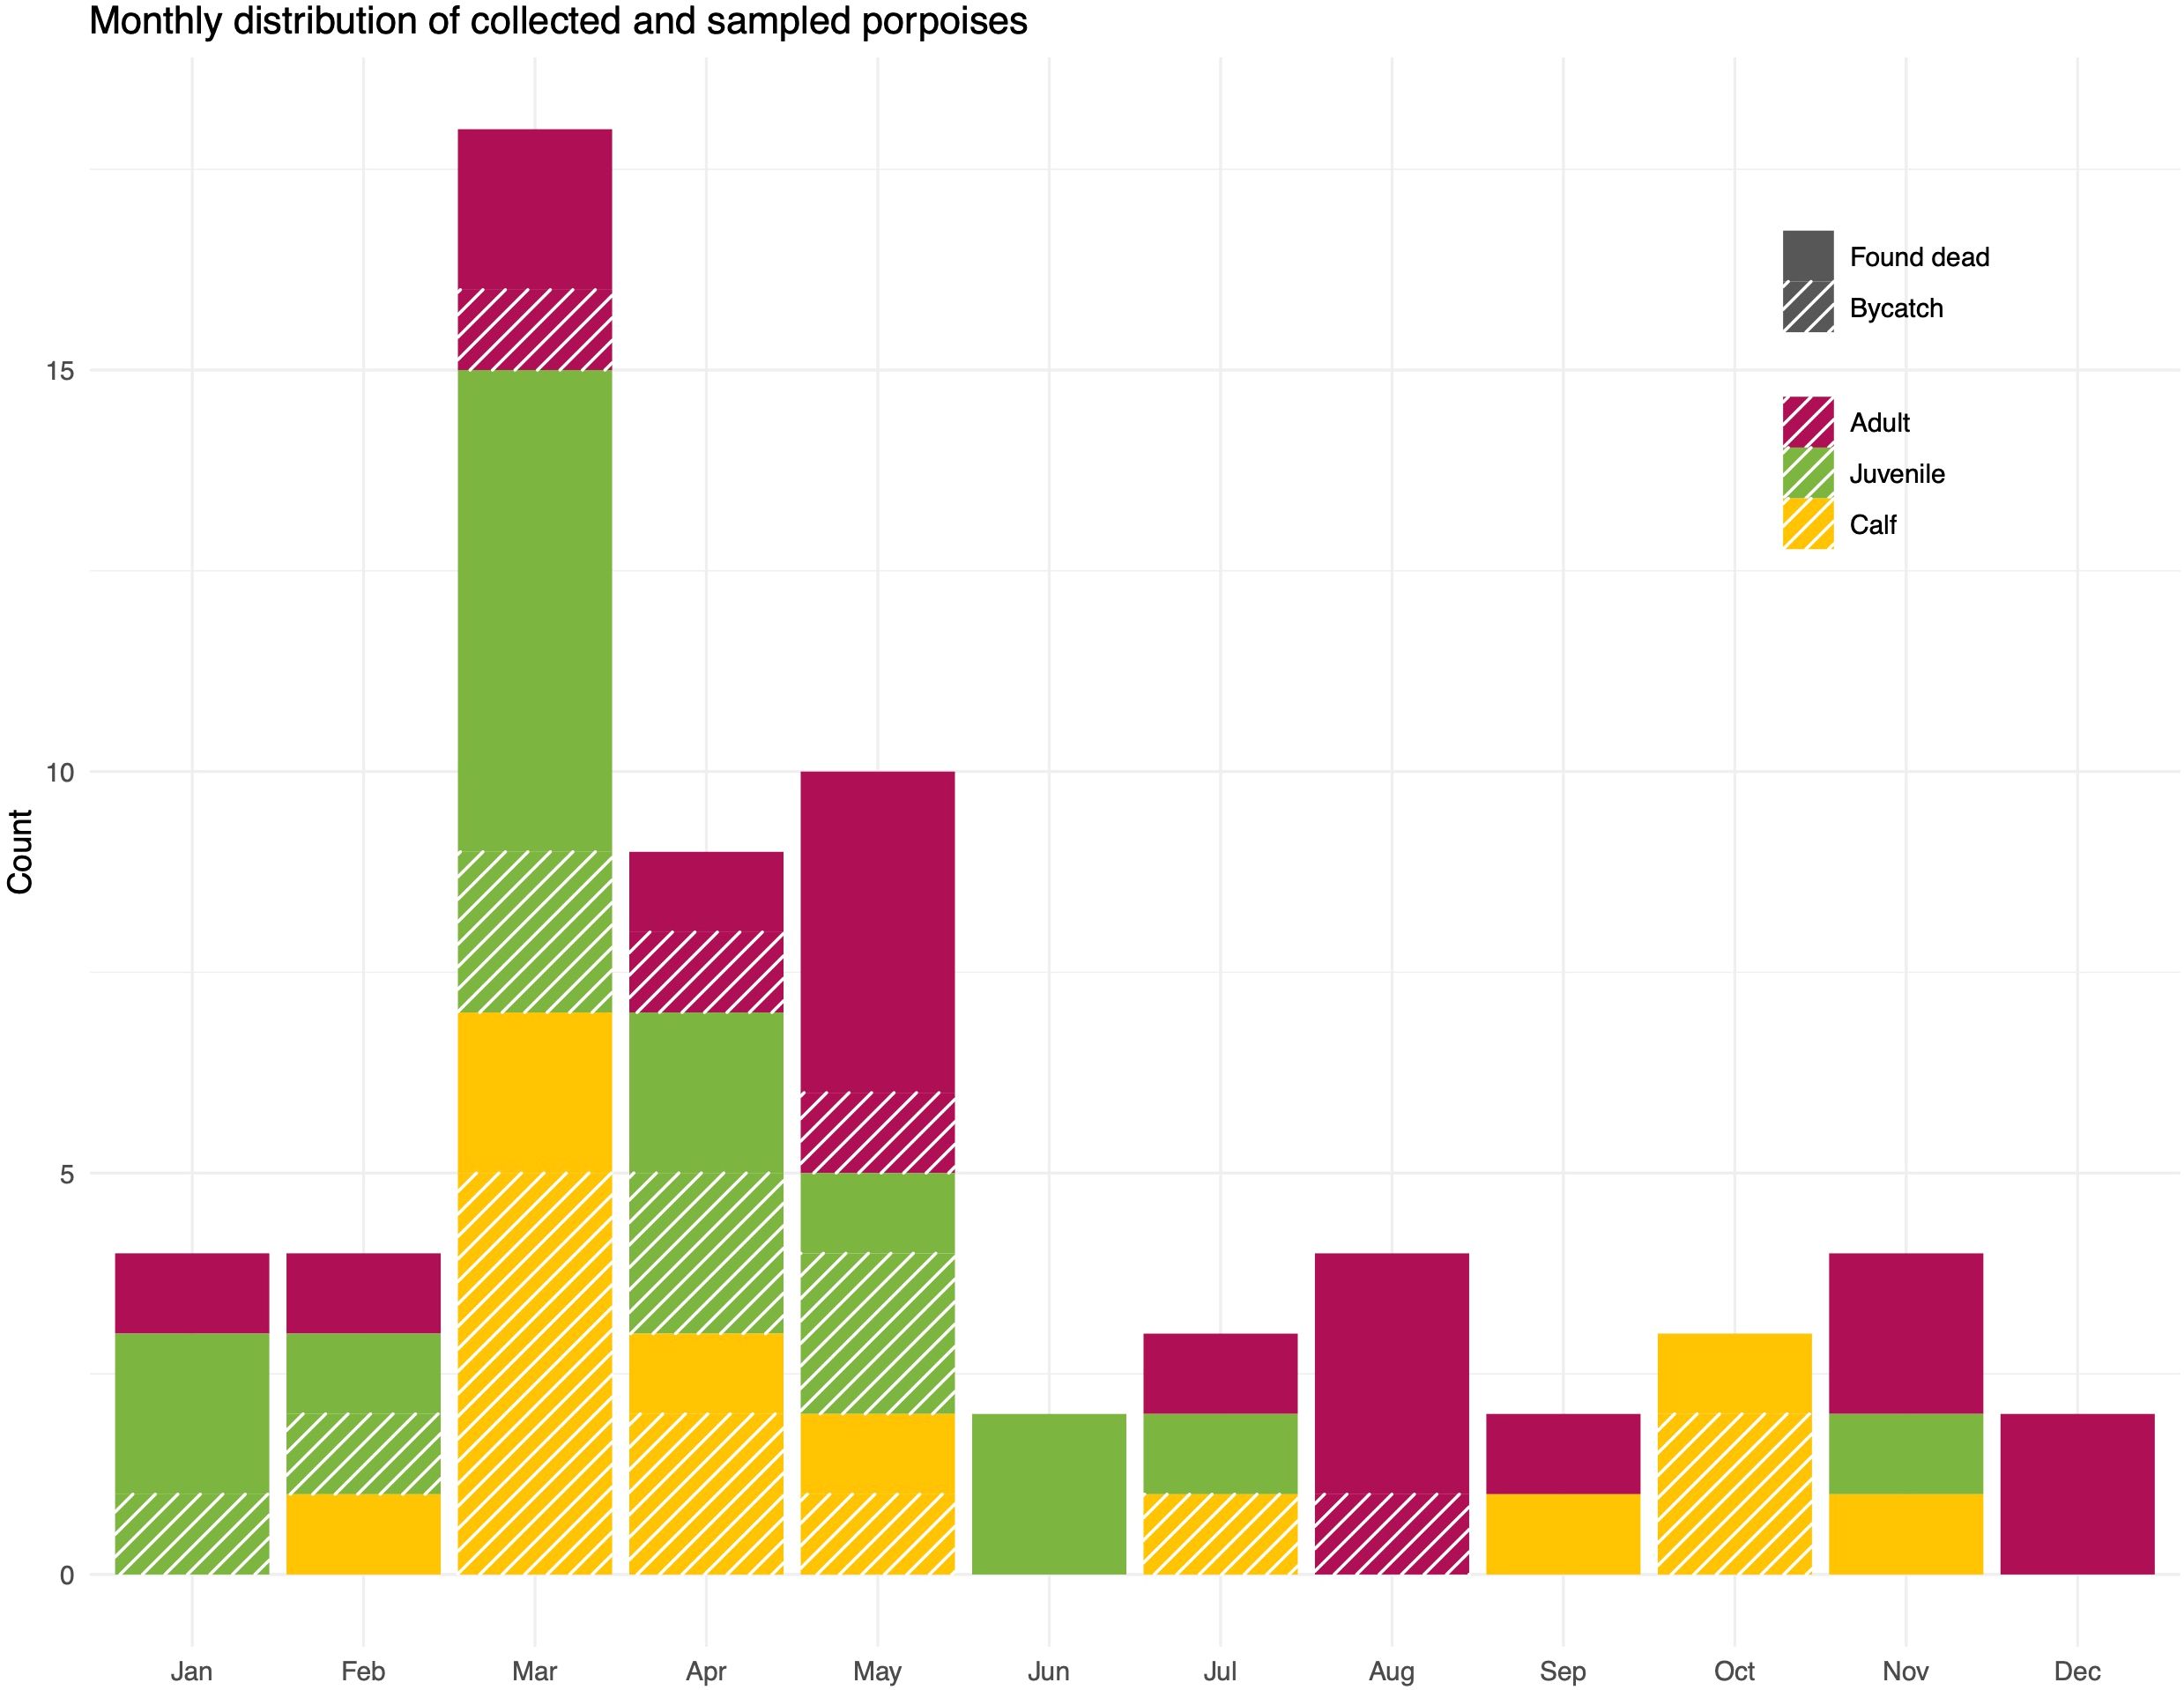
Figure 2. Total number of collected and sampled porpoises per month, age class and type of discovery.

Figure 3. Distribution of collected porpoises for (A) sex per age class, (B) sex per sea district, and (C) age class per sea district. Width of bar denotes relative contribution to the total number of samples and labels inside bars represent number of samples within that group.
3.2 Macroscopic stomach content
Hard parts from prey were extracted from 26 of the 65 sampled stomachs, and 39 stomachs were empty. Median number of items (otoliths and beaks) per non-empty stomach was 4.5 (range 1-184) and in total 412 prey items were found. A total of 20 fish and cephalopod species belonging to 10 taxa (9 fish families and class Cephalopoda) were identified macroscopically (Table 2). Four prey taxa dominated the numerical contribution to the macroscopically estimated sample population-level diet; Gobiidae (36%), Gadidae (29%), Clupeidae (18%), and Cephalopoda (11%) (Figure 4A). The same four taxa also had the highest frequency of occurrence in macroscopically estimated sample population-level diet (Figure 4C).
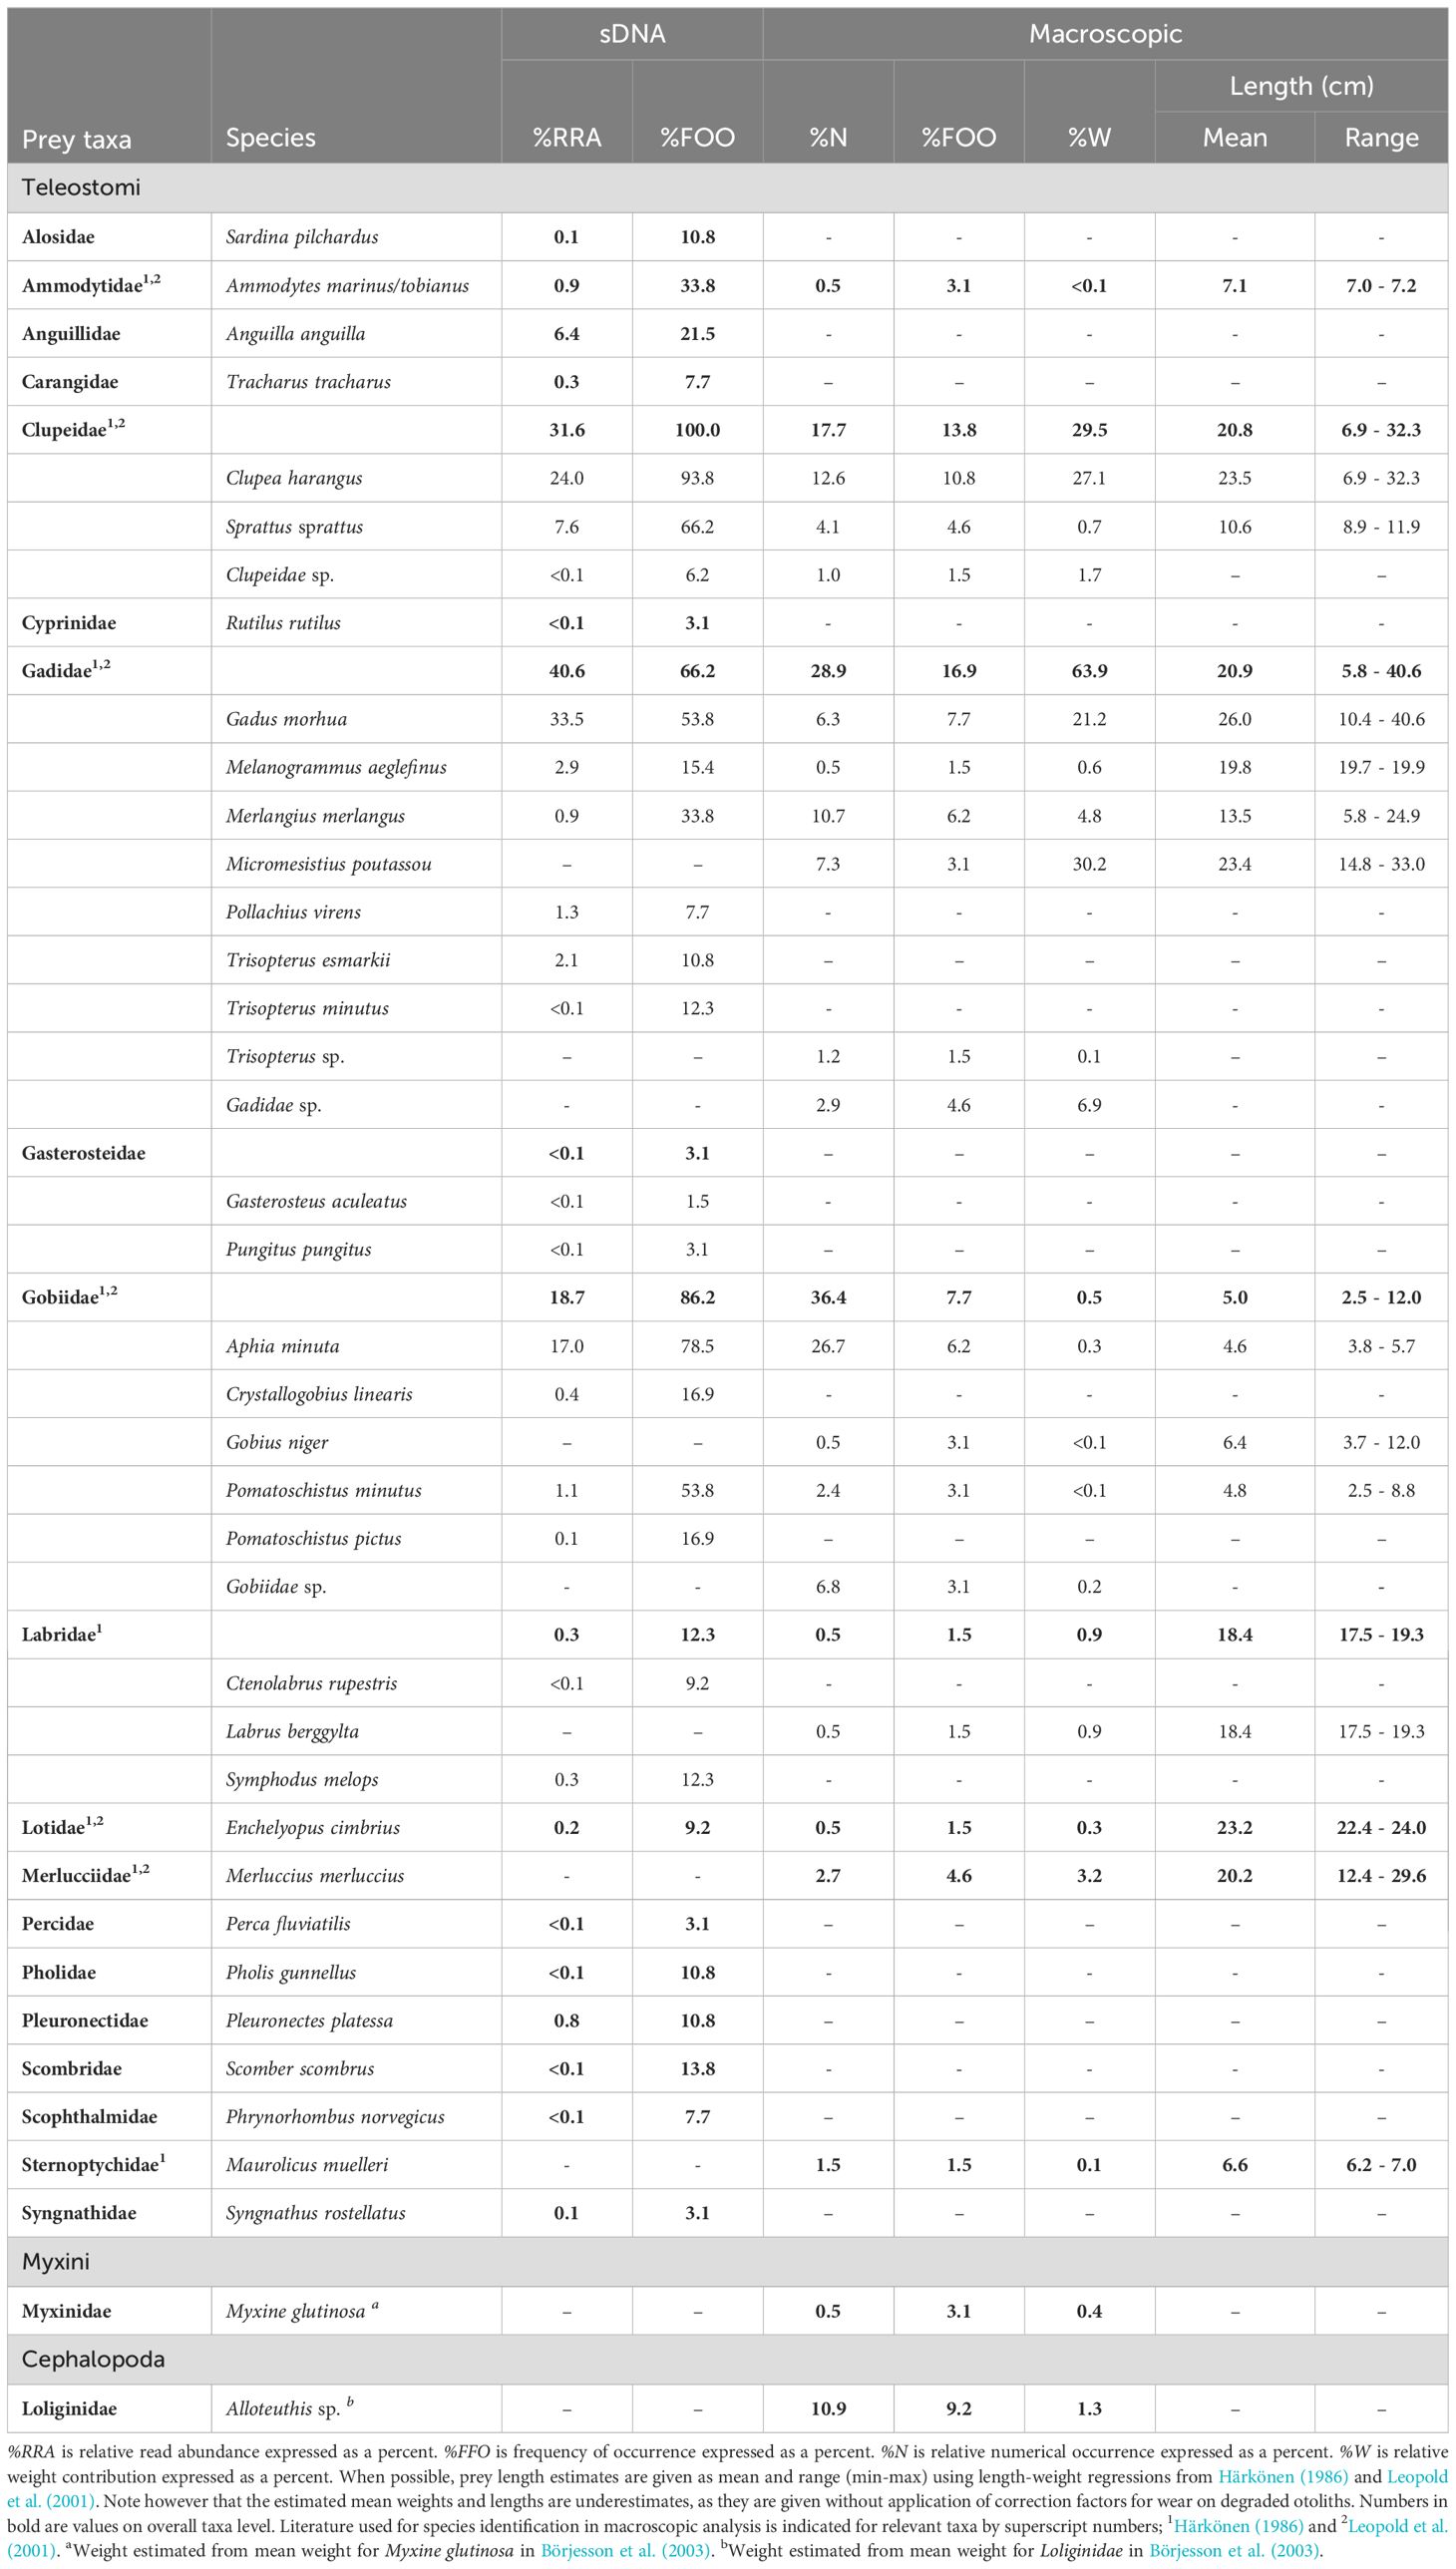
Table 2. Sample population-level estimated diet contribution for detected prey taxa in 65 harbour porpoise stomachs from Swedish waters in years 2017-2022 by DNA metabarcoding (sDNA) and macroscopic analysis.
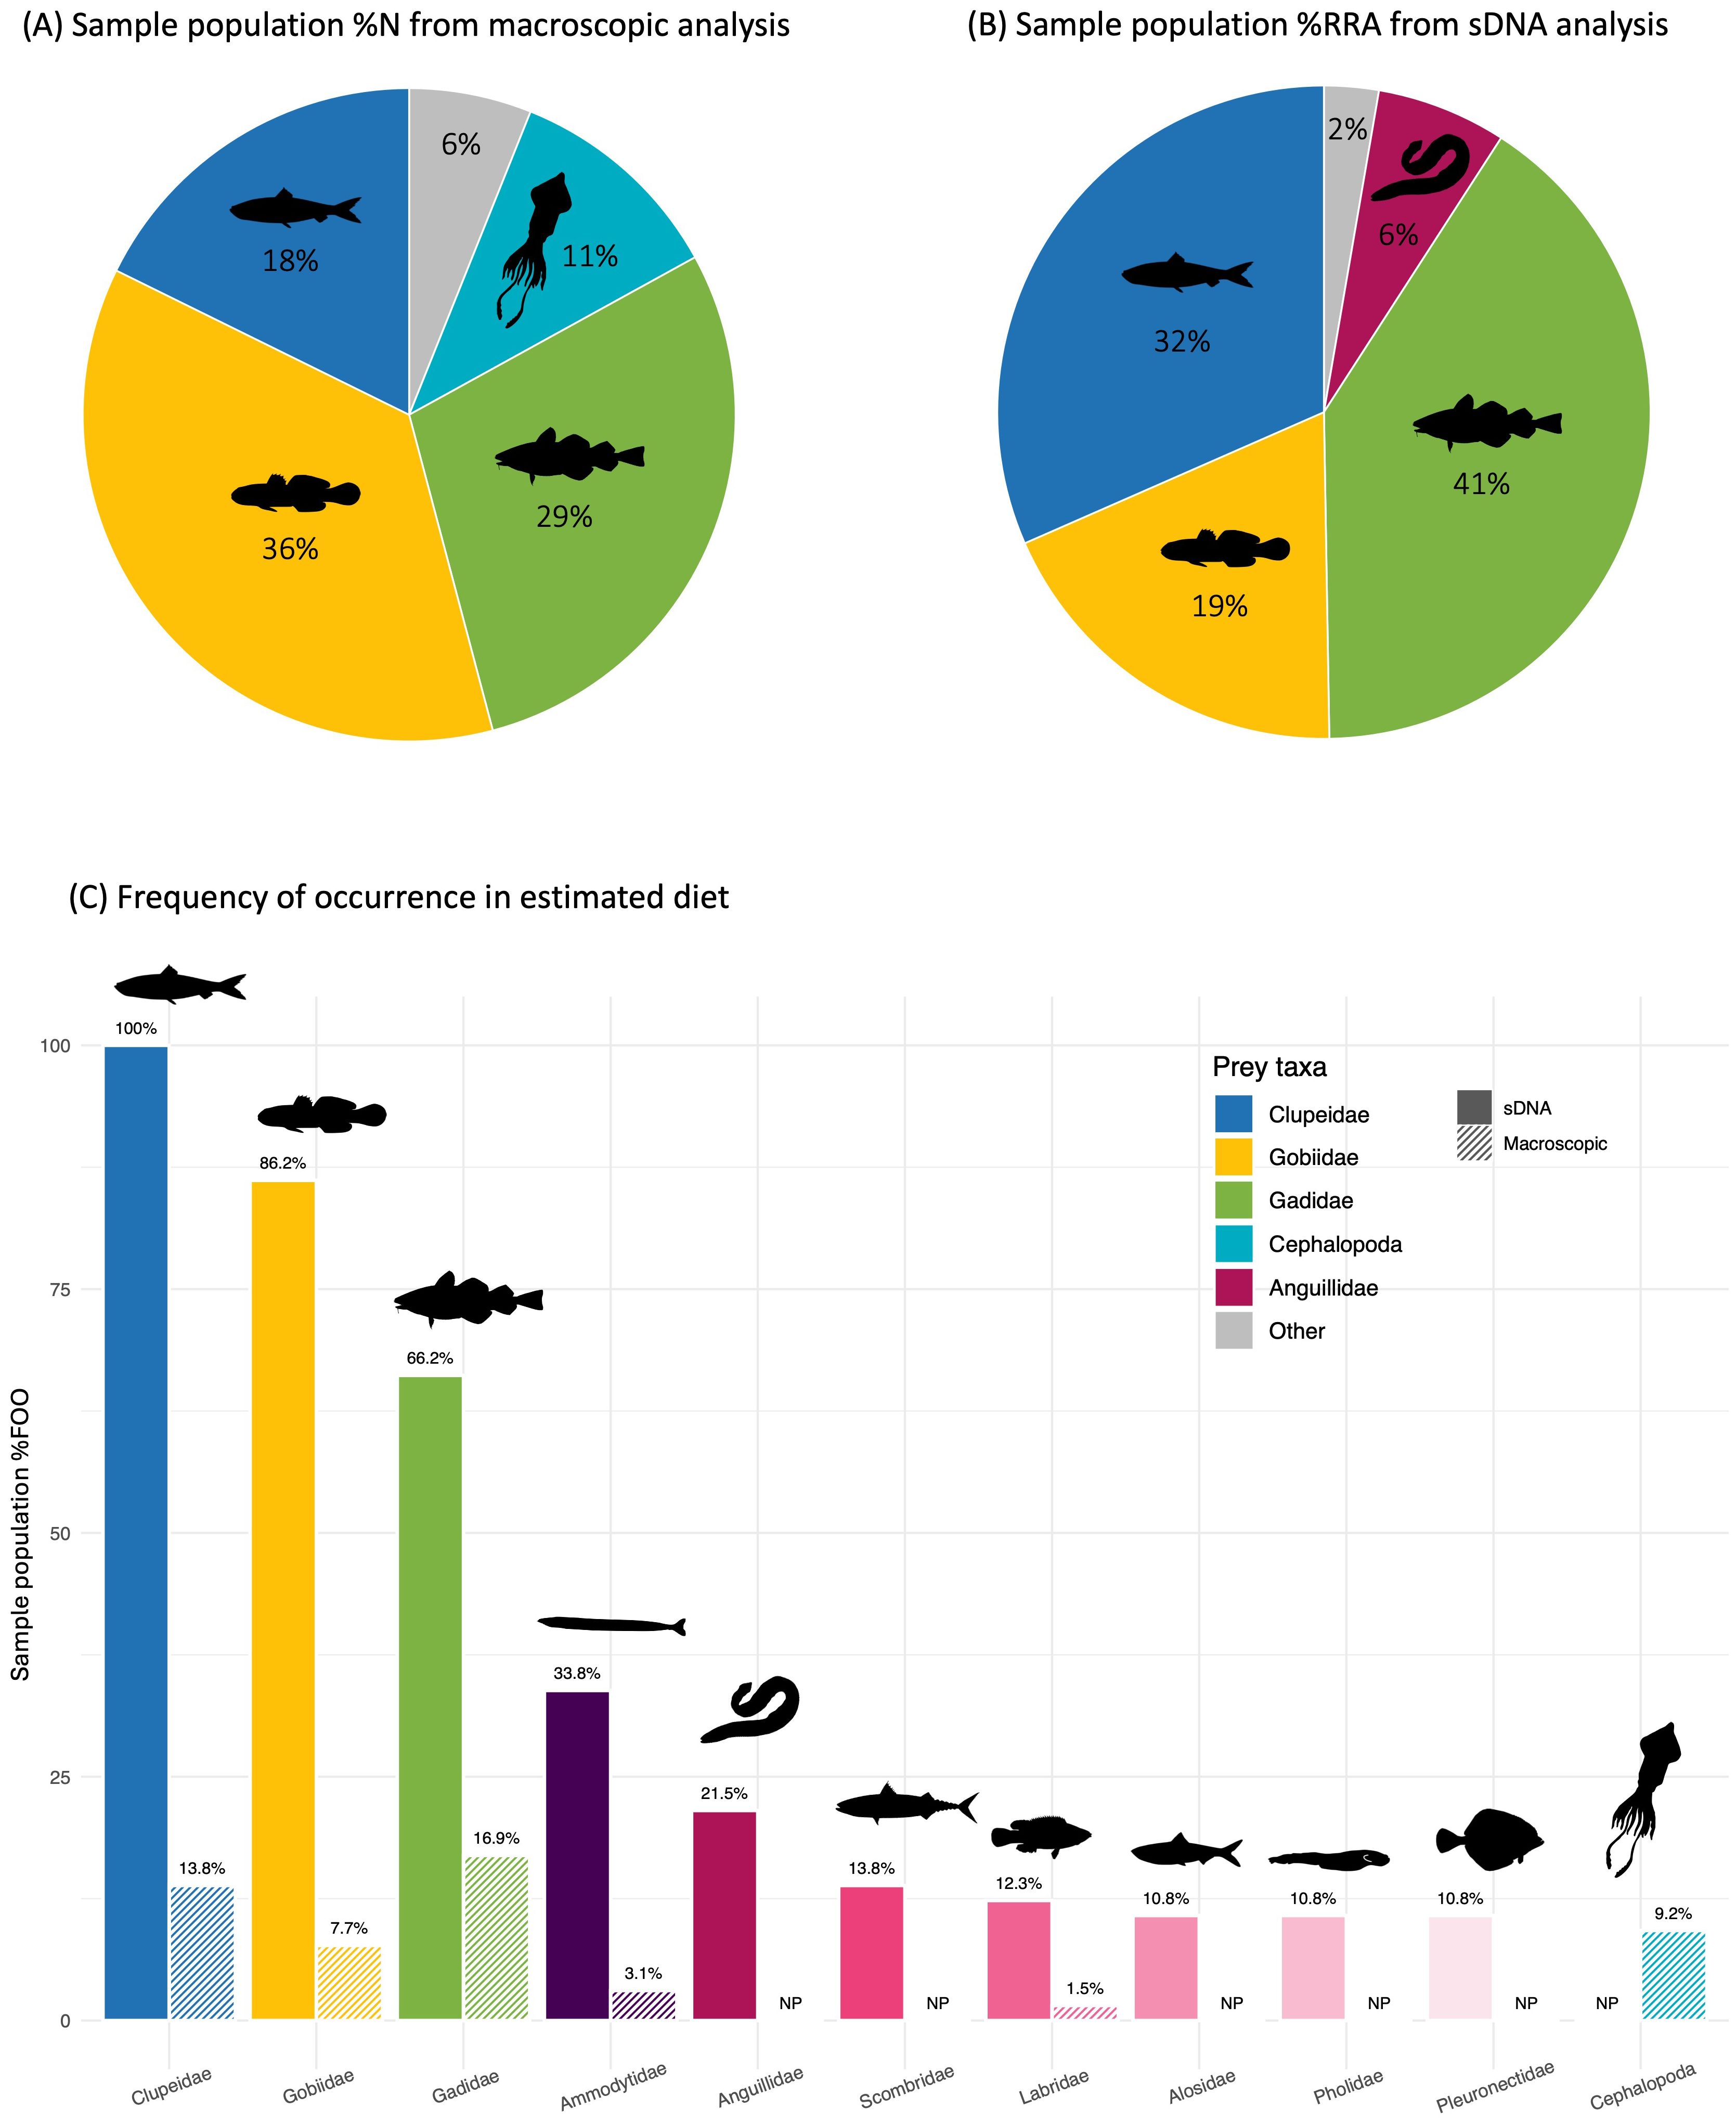
Figure 4. Estimated main diet for harbour porpoises in Swedish waters during 2017-2022 by (A) relative numerical contribution (%N) of detected prey species by macroscopic analysis, (B) relative read abundance (%RRA) by sDNA analysis, and (C) frequency of occurrence (%FOO) in side-by-side comparisons of results from sDNA and macroscopic analysis. In (A, B) taxa contributing with <5%N to estimated diet by the respective method are combined into the category ‘Other’. In (C) frequency of occurrence (%FOO) is shown for the 11 most common prey taxa (by any of the methods or metrics). NP, ‘Not present’.
Contribution to estimated diet by %W was dominated by gadoids (64%) and clupeids (30%) (Table 2). Top five prey taxa by rank importance to %FOO were in falling order Gadidae, Clupeidae, Cephalopoda, Gobiidae, and Ammodytidae (Table 3). On a more detailed level, top five prey species by rank importance to %FOO were in falling order Clupea harengus, Cephalopoda sp., Gadus morhua, Aphia minuta and Merlangius merlangus (Table 3). Mean estimated prey size was 13.3 cm and median estimated prey size was 9.0 cm (range 2.5-40.6 cm).
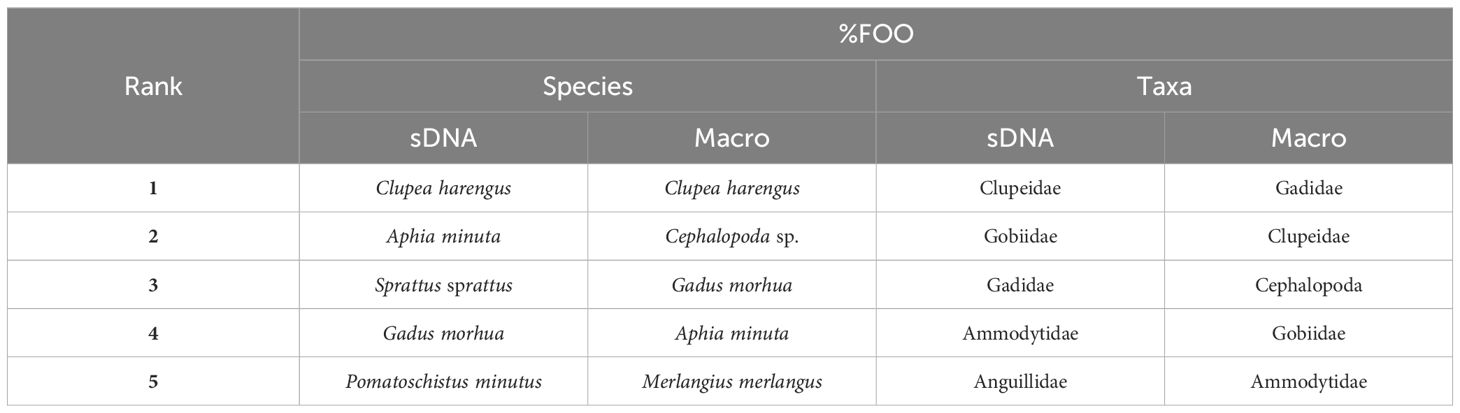
Table 3. Top five prey species and taxa ranked by importance through frequency of occurrence (%FOO) in estimated overall sample population diet by sDNA and macroscopic analysis.
3.3 Prey species found by sDNA metabarcoding
Prey DNA was successfully amplified and sequenced for all the 65 stomachs, thereby providing sDNA dietary data for all sampled individuals. Negative controls did not generate any PCR product and were excluded from downstream analysis. Mean number of sequence counts per stomach was 230 277 sequences and the median was 7 371 (range 35-3 214 542). A total of 29 fish prey species belonging to 17 families were identified through sDNA metabarcoding (Table 2).
Four prey families dominated the estimated sample population-level diet in terms of relative read abundance; Gadidae (41%), Clupeidae (32%), Gobiidae (19%) and Anguillidae (6%) (Figure 4B). Clupeids were detected in all stomachs (100% FOO), and almost as common were gobiids (86%) and gadoids (66%) (Figure 4C). In addition, seven other prey families were found in more than 10% of the analysed stomachs (Figure 4C). Top five prey taxa by rank importance to %FOO were in falling order Clupeidae, Gobiidae, Gadidae, Ammodytidae and Anguillidae (Table 3). On a more detailed level, top five prey species by rank importance to %FOO were in falling order Clupea harengus, Aphia minuta, Sprattus sprattus, Gadus morhua and Pomatoschistus minutus (Table 3).
3.4 Combining and comparing methods
The combination of macroscopic and sDNA analysis for diet estimation yielded a total of 36 detected unique prey species and 21 prey families (including Cephalopoda as a family). Compared to detections by macroscopic analysis alone, this corresponds to an almost two-fold increase in species and taxa detection.
Pairwise comparisons by calculation of Czekanowski’s similarity index revealed that sDNA and macroscopic analysis provided more similar sample population-level diet estimates on prey family-level than on species-level (Figure 5). Regardless of prey taxonomic resolution, the similarity between results from the two methods increased when ranking prey by %FOO importance (Figure 5). Out of the semi-quantitative metrics, ranked %FOO on prey family level provided the highest CI with a mean overlap of compared pairs by almost 80% (Figure 5).
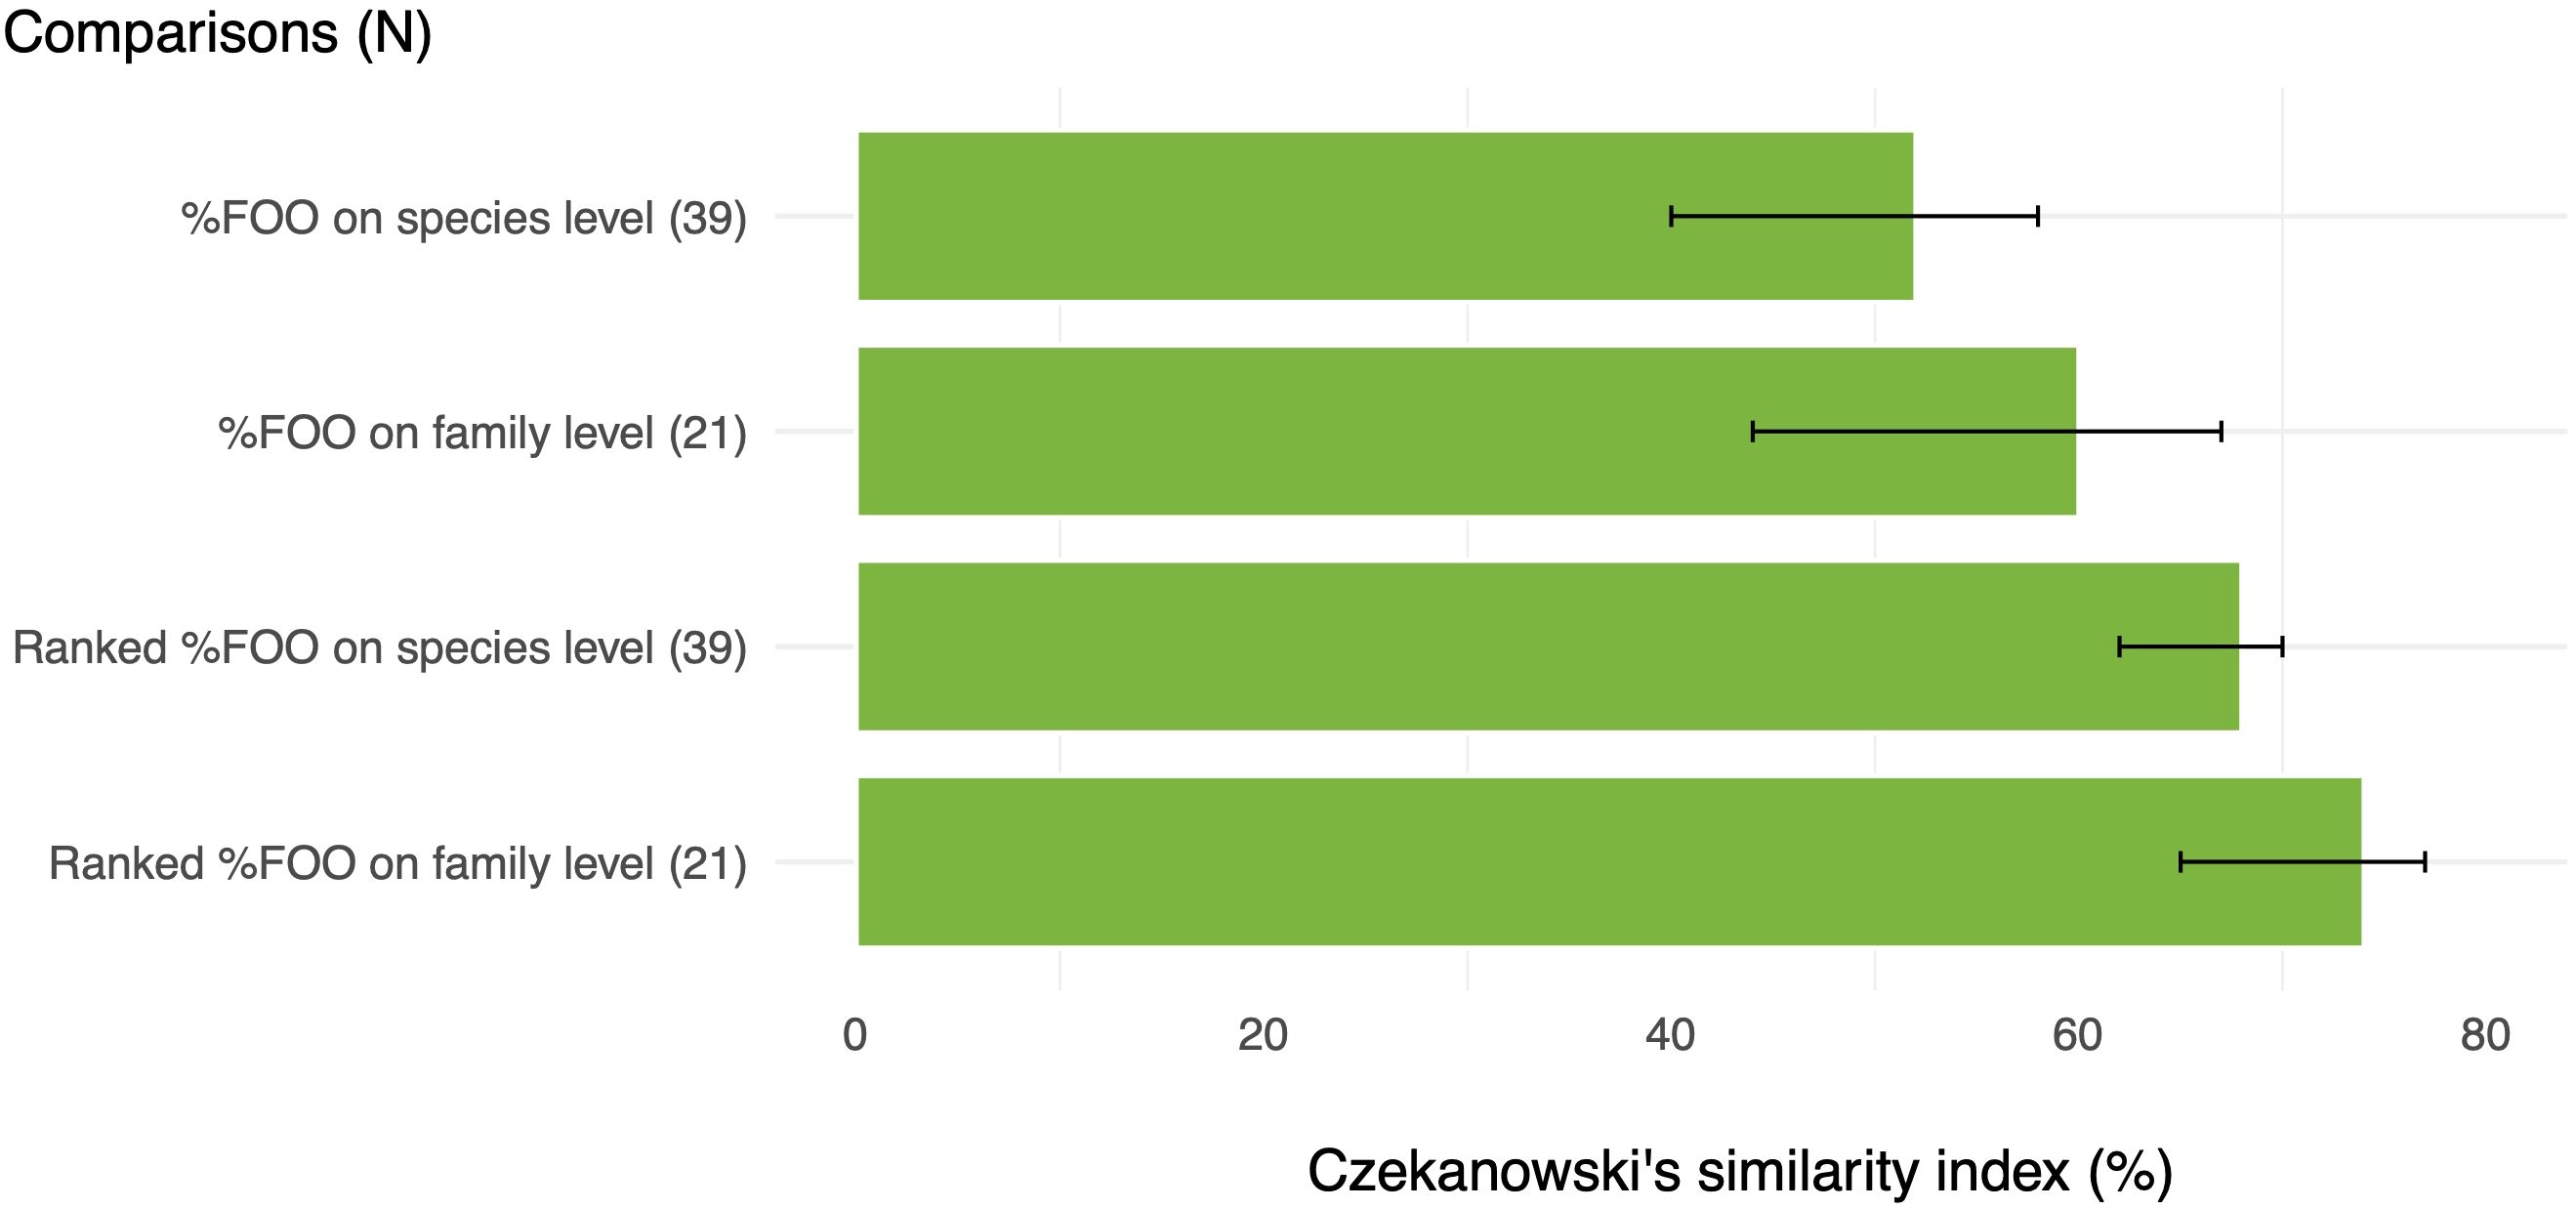
Figure 5. Pairwise comparisons of estimated diets by sDNA and macroscopic analysis for prey consumption metrics %FOO and ranked %FOO, and on family (n=21) and species (n=39) level, respectively. A Czekanowski similarity index of 100% represent complete overlap and similarity of estimated diet between methods, while 0% denotes no overlap. Bars represent means and error bars show 95% confidence intervals.
The median number of prey species detected by macroscopic analysis was 0 (IQR = 1, mean = 0.8), whereas sDNA analysis detected a median of 5 prey species (IQR = 4, mean = 6.3) (Figure 6). The difference was significant (W = 212.5, p< 0.0001, effect size r = 0.789).
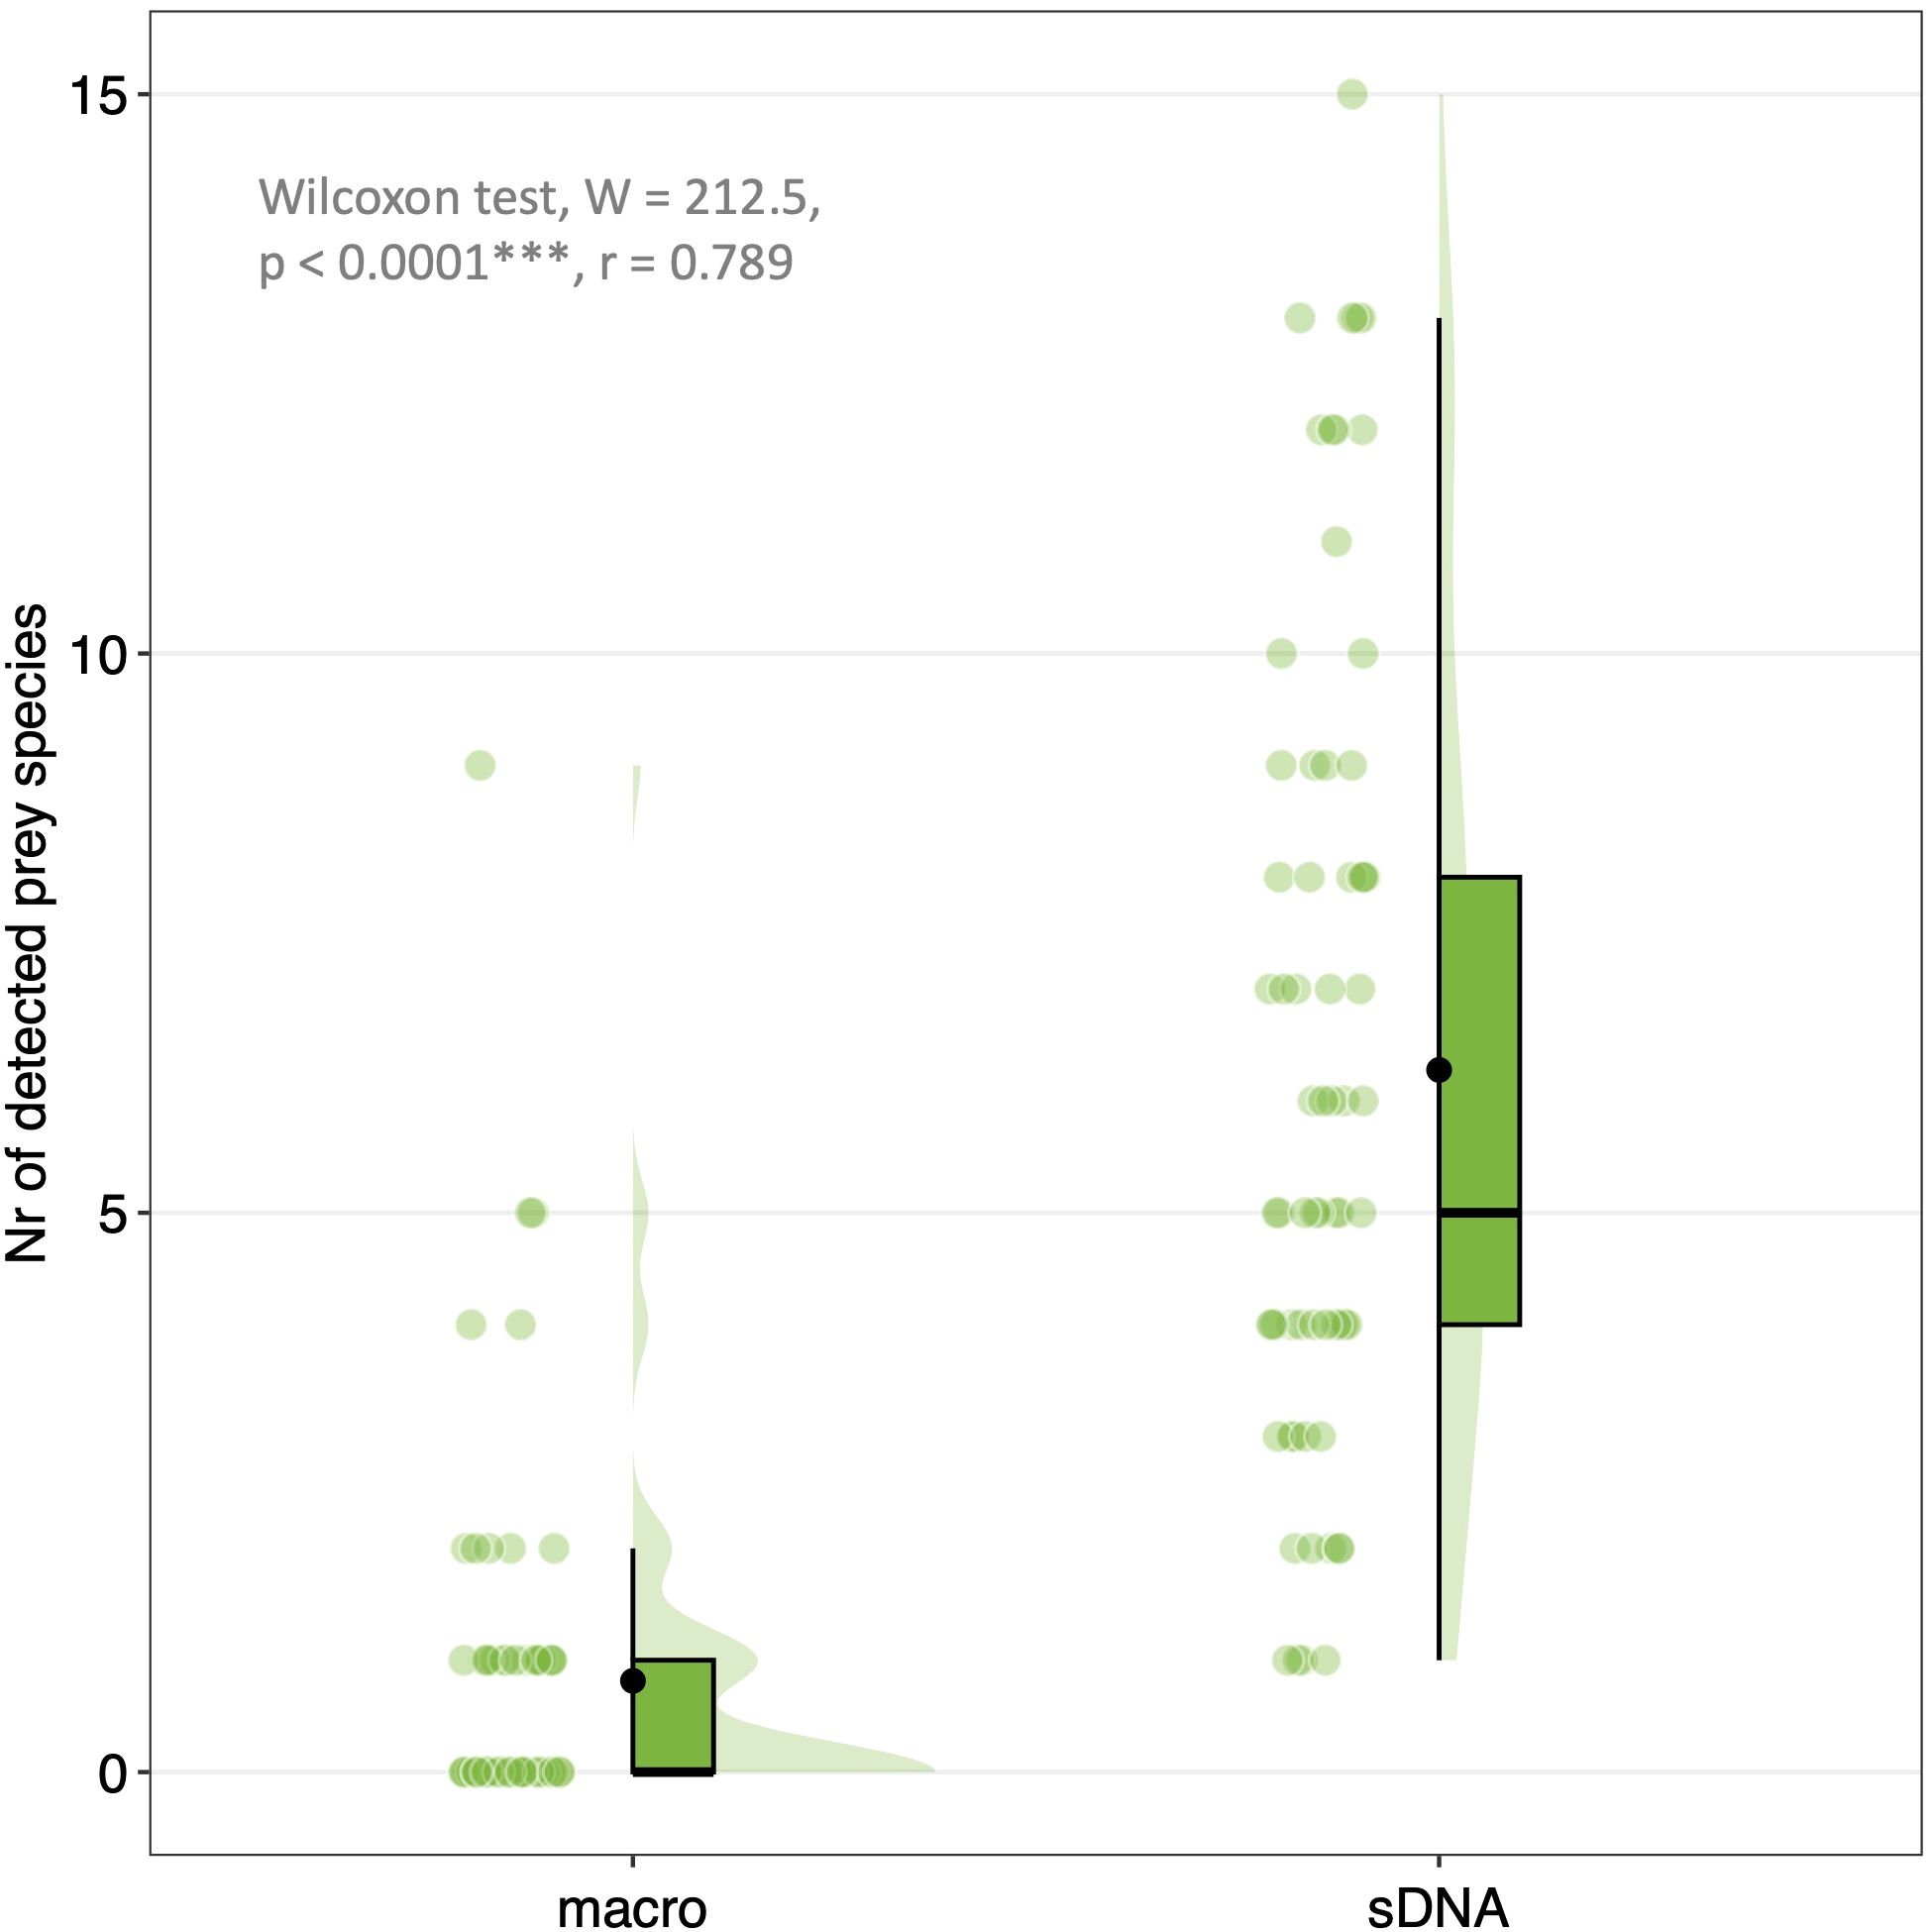
Figure 6. Raincloud plots illustrating the significantly higher number of prey species detected by sDNA analysis (sDNA) compared to macroscopic analysis (macro). Boxes are boxplots. Lower and upper box boundaries are 25th (Q1) and 75th (Q3) percentiles, and their range represent the Interquartile Range (IQR). Vertical lines indicate min-max range of data, with data outside of range being outliers. Black horizontal lines are medians. Black dots indicate mean. Coloured dots represent raw data. Shaded areas are density curves illustrating distribution of data. Asterisks indicate level of statistical significance of results.
The individual-level comparison of estimated diet on a random subset of six porpoise individuals further illustrated that sDNA analysis detected a higher number of prey species than macroscopic analysis (Figure 7). In addition, sDNA analysis could detect a high number of prey species also in seemingly empty stomachs, where no hard parts were extracted during macroscopic analysis (Figure 7). The agreement between methods in terms of taxa detected was high for the six individuals, although the taxonomic resolution increased with use of sDNA (Figure 7).

Figure 7. Number and species of detected prey in individual-level diet estimates by macroscopic and sDNA analysis respectively for a random subset of six porpoise individuals (HP1-HP6).
3.5 Dietary differences between groups of porpoises
3.5.1 Sexes
There were no differences in the number of prey species detected by sDNA analysis for females (median = 5.5, IQR = 5, mean = 6.2) and males (median = 5, IQR = 4, mean = 6.4) (W = 528, p = 0.942) (Figure 8A).

Figure 8. Group-specific raincloud plots illustrating the number of prey species detected by sDNA analysis for (A) sexes and (B) age classes. Results from statistical analyses are given and show detection in (B) of a higher number of prey species in calves compared to juveniles. Boxes are boxplots. Lower and upper box boundaries are 25th (Q1) and 75th (Q3) percentiles, and their range represent the Interquartile Range (IQR). Vertical lines indicate min-max range of data, with data outside of range being outliers. Black horizontal lines are medians. Black dots indicate mean. Coloured dots represent raw data. Shaded areas are density curves illustrating distribution of data. Asterisks indicate level of statistical significance of results.
There were only small differences between sexes in the sample population-level estimated diets (wPOOmac-sDNA), with both male and female diet being dominated by occurrence of clupeids, gadoids and gobiids (Figure 9A). Females did however have a slightly higher occurrence of Ammodytidae (6%) compared to males (4.8%) (Figure 9A). The method specific data and plots showed some further interesting differences between males and females, with e.g. cephalopods being more prevalent in female (wPOOmacro = 20%) than male diet (wPOOmacro = 11%), and Myxinidae occuring in male (wPOOmacro = 13%) but not in female diet (wPOOmacro = 0%) (Supplementary Figure S1A).

Figure 9. Group-specific comparisons of estimated diet (wPOOmac-sDNA) for (A) sexes, (B) age classes, (C) quarters of year, and (D) sea districts. For each bar, taxa contributing with <5% wPOOmac-sDNA to estimated diet are combined into the category ‘Other’. Numbers in brackets denote sample size.
For the three main prey taxa, there were no significant differences between males and females in the taxa-specific relative contribution of read counts (taxa-specific %RRA) (Table 4; Figures 10A–C).
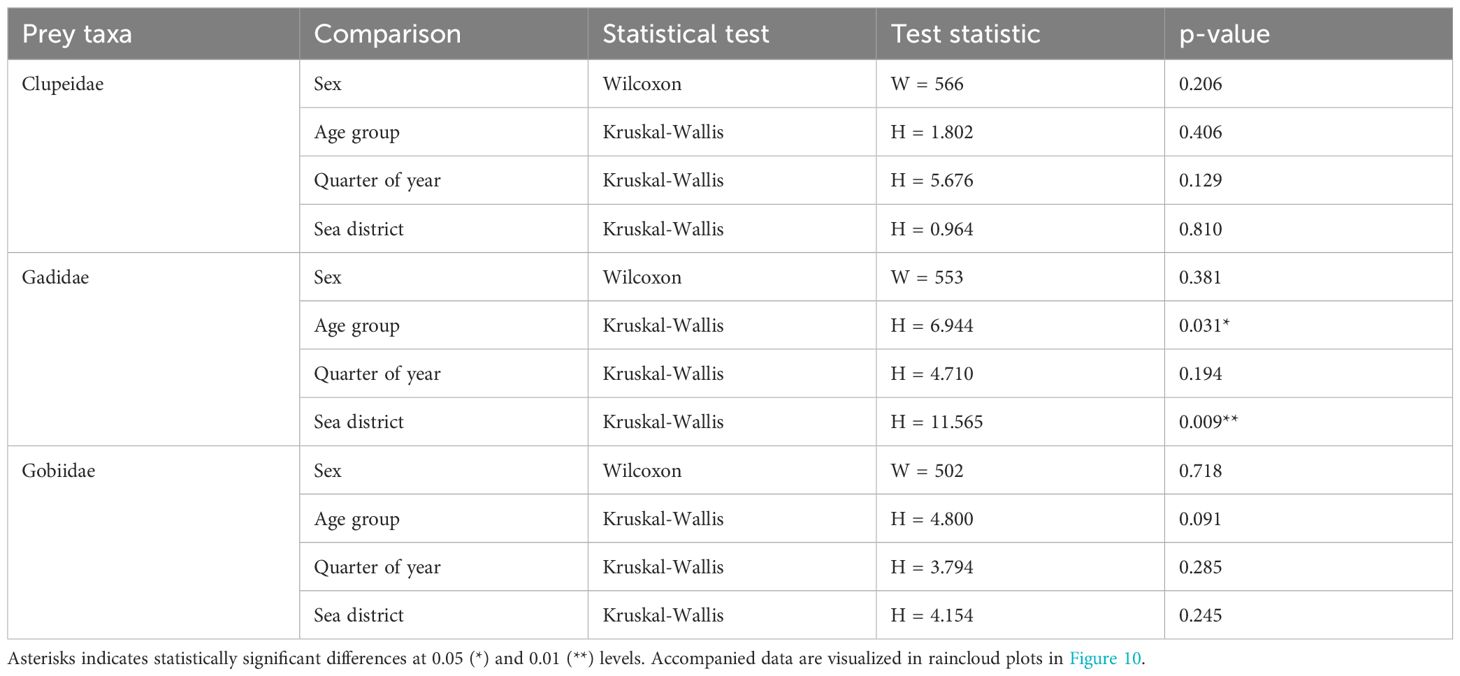
Table 4. Statistical test details for taxa specific comparisons between four constructed groups of porpoises using unpaired two-samples Wilcoxon tests and Kruskal-Wallis tests by rank.
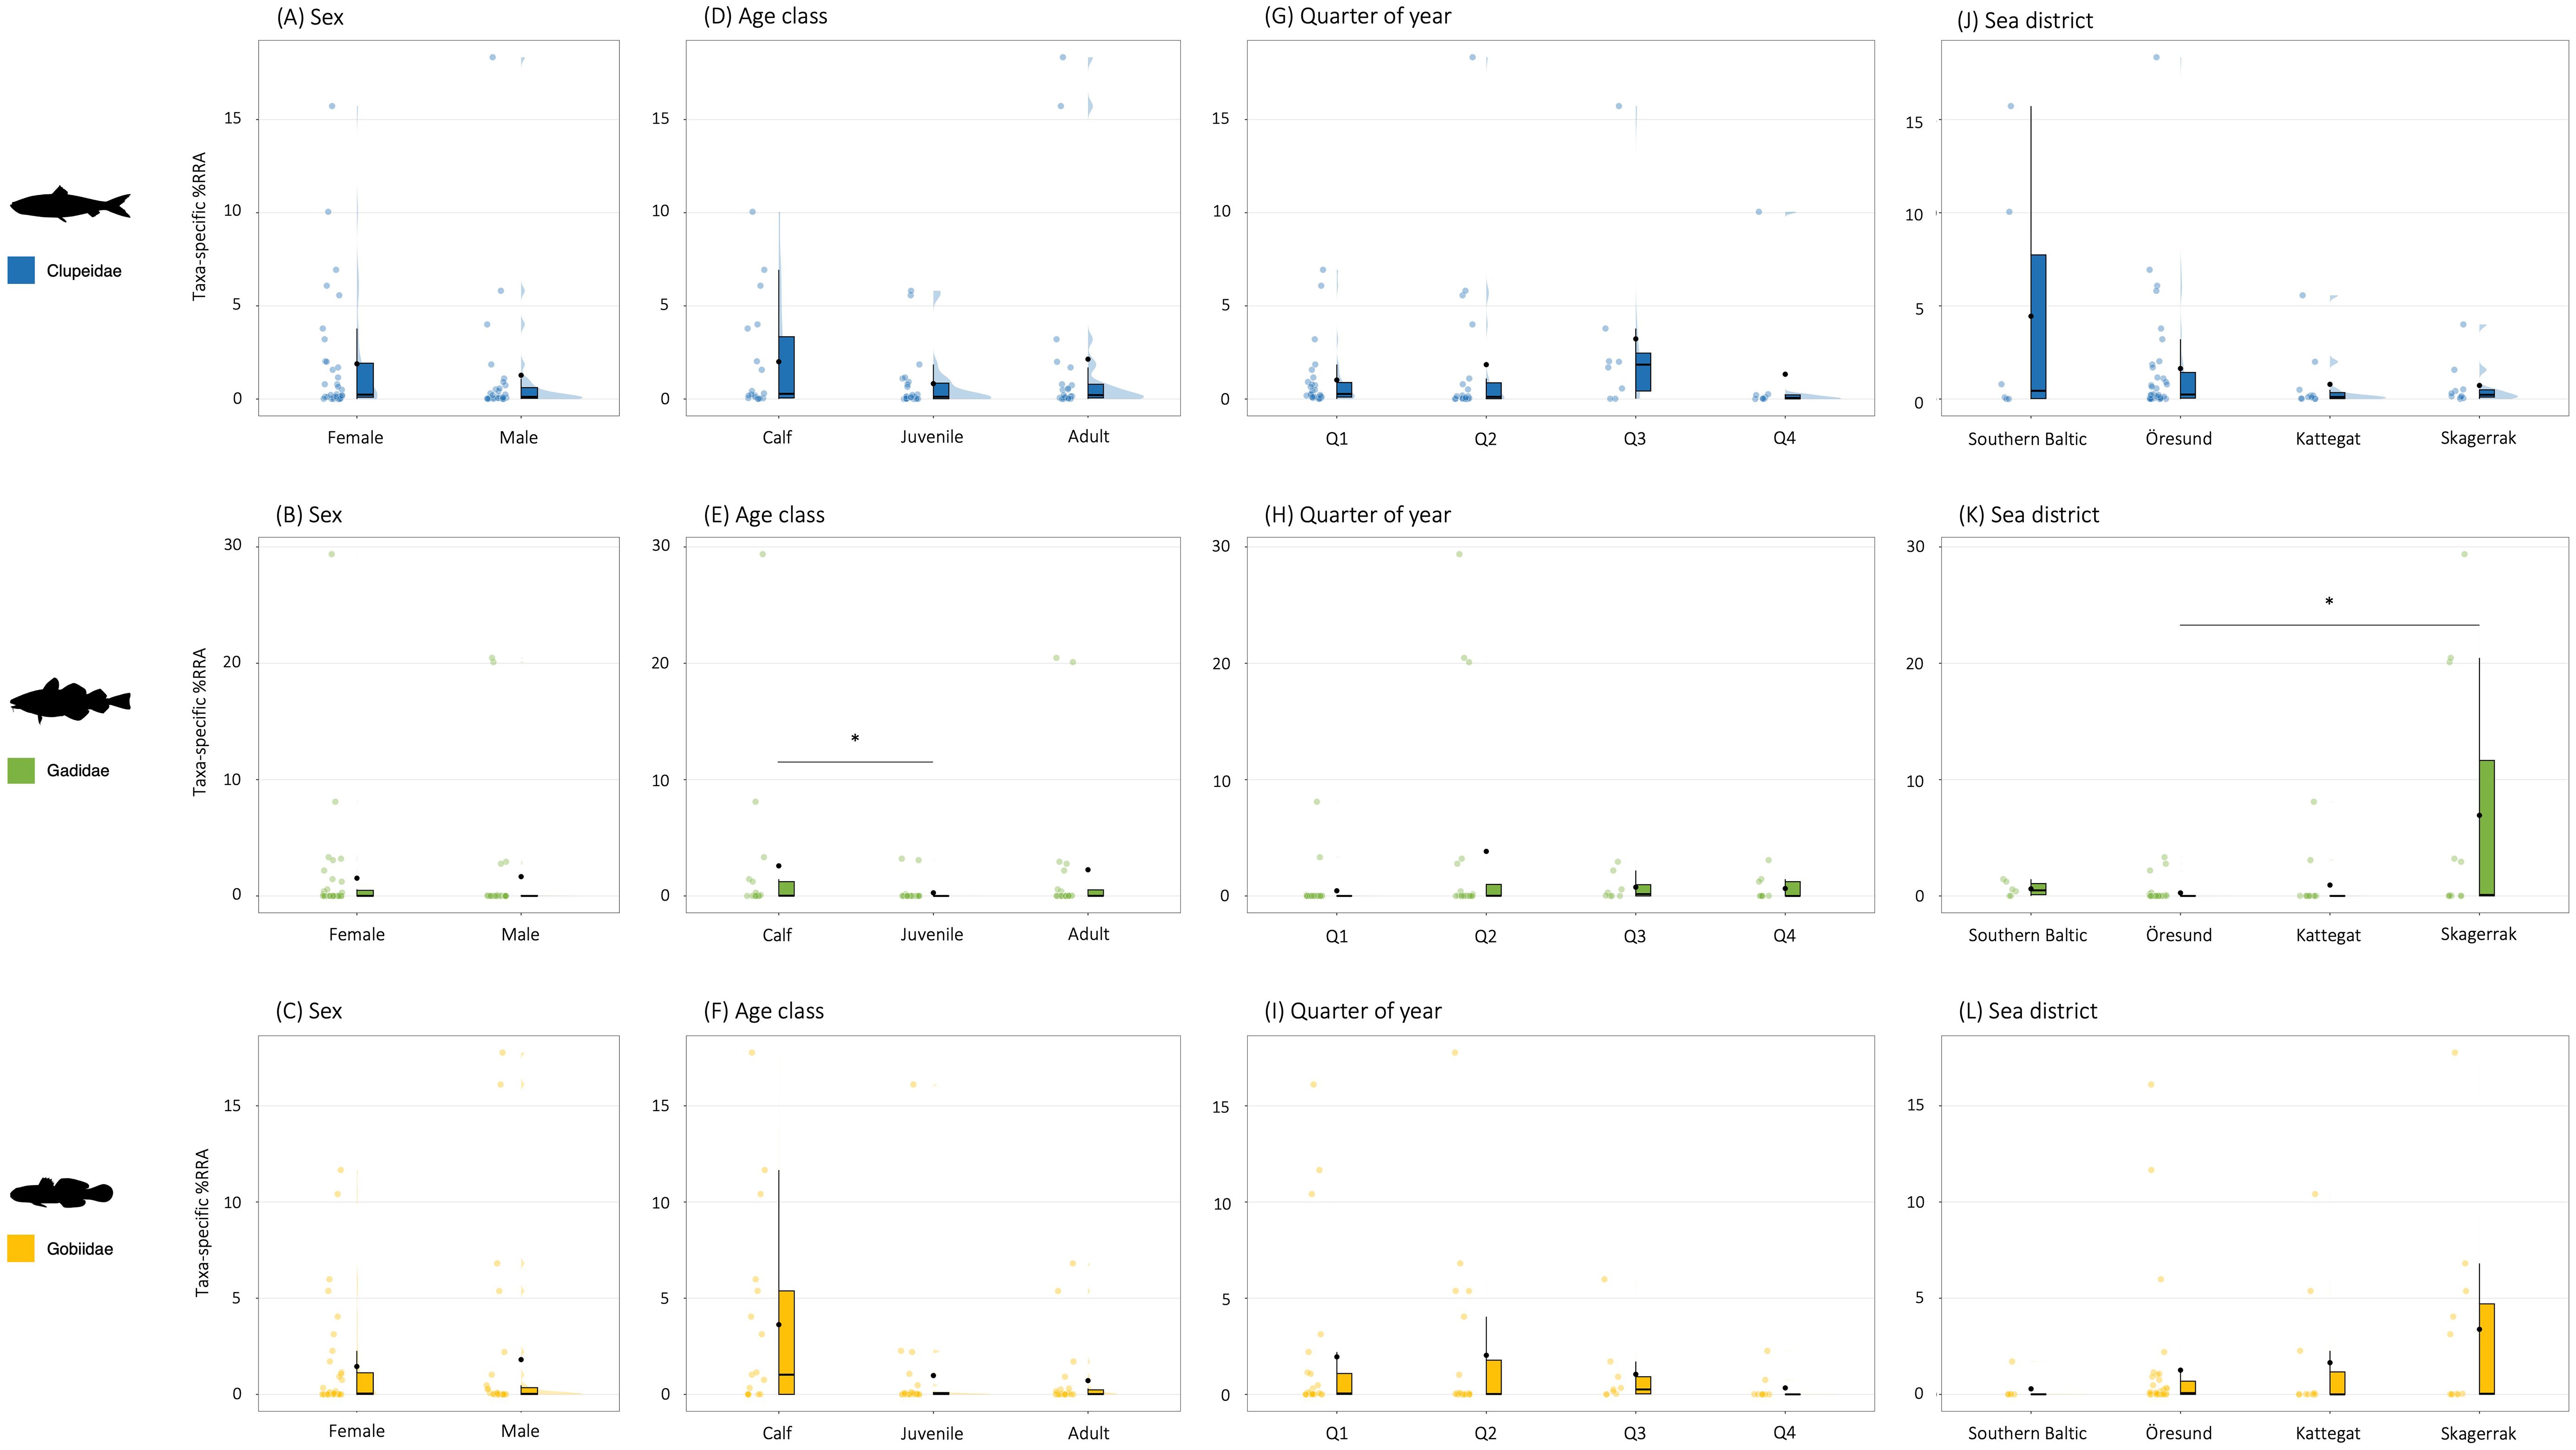
Figure 10. Raincloud plots with taxa-specific contributions to harbour porpoise diet by comparisons of constructed groups by (A–C) sexes, (D–F) age classes, (G–I) quarters of year, and (J–L) sea districts. Panels represent the three main prey taxa for harbour porpoises found in this study (Clupeidae, Gadidae and Gobiidae) and dietary contribution is given as taxa-specific %RRA. Boxes are boxplots. Lower and upper box boundaries are 25th (Q1) and 75th (Q3) percentiles, and their range represent the Interquartile Range (IQR). Vertical lines indicate min-max range of data, with data outside of range being outliers. Black horizontal lines are medians. Black dots indicate mean. Coloured dots represent raw data. Shaded areas are density curves illustrating distribution of data. Significant results from statistical analyses are indicated inside plots, and all statistical test results are given in Table 4. Note that no comparisons between taxa should be made as the dependent variable is taxa-specific. Note also the variation in y-range between panels.
3.5.2 Age classes
There was a significant difference between age classes in the number of prey species detected by sDNA analysis (H = 7.965, df = 2, p = 0.019). Post-hoc pairwise comparisons revealed the difference to only be significant between calves and juveniles (z = 2.61, p = 0.027), with a higher number of species detected in calves (median = 6, IQR = 5.5, mean = 7.5) compared to juveniles (median = 4, IQR = 3, mean = 4.6) (Figure 8B).
Apart from the high occurrences of clupeids, gadoids and gobiids in the diet of all three age classes, the only taxa occurring in >5% of samples when grouped by age classes were Ammodytidae (Figure 9B). This prey taxa occurred in 6.5% of adult diet samples, 5.8% of calf diet samples, and in 4.2% of juvenile diet samples. The method specific data and plots revealed some more pronounced age class differences, with a relatively high occurrence of Myxinidae in adult (wPOOmacro = 11%) and juvenile (wPOOmacro = 8%) samples, while being entirely absent in samples from calves (wPOOmacro = 0%) (Supplementary Figure S1). Also, cephalopods occur in more than 30% of the macroscopically analysed samples from juveniles, while being almost non-occurring in samples from adults (wPOOmacro = 3%), and completely lacking in samples from calves (wPOOmacro = 0%) (Supplementary Figure S1B).
For Clupeidae and Gobiidae, there were no significant differences between age classes in the taxa-specific relative contribution of read counts (taxa-specific %RRA) (Table 4; Figures 10D, F), although visual inspection of data suggests a higher dietary importance of gobiids for calves compared to juveniles and adults (Figure 10F). For Gadidae, a difference was found between the age classes (H = 6.944, df = 2, p = 0.031), with a higher contribution (z = 2.47, p = 0.040) of gadoids to the diet of calves (median = 0.02, IQR = 1.23, mean = 2.6) compared to juveniles (median = 0.00, IQR = 0.00, mean = 0.27) (Figure 10E).
3.5.3 Quarters of year
The three main prey taxa; clupeids, gadoids and gobiids, occurred in a large proportion of the diet samples throughout the year. There were, however, a potentially higher occurrence of clupeids and lower occurrences of gadoids and gobiids during late autumn/winter (Q4), compared to the other parts of the year (Figure 9C). Ammodytidae had a high relative occurrence during late spring (Q2, 7%) and autumn/winter (Q4, 14%), compared to Q1 (2%) and Q3 (2%). Cephalopods were entirely missing from samples from Q2, Q3 and Q4, and only occurred during early spring (Q1, 5%). Anguillidae occurred in 6% of diet samples from summer/early autumn (Q3), but only in 2% of samples from Q1, Q2 and Q4, respectively (Figure 9C). The method-specific data and plots revealed that e.g. Myxinidae occurred in a high relative proportion of the samples during Q1 (wPOOmacro = 14%), while being completely absent in all diet samples from Q2, Q3 and Q4 (Supplementary Figure S1C). Also, Merluccidae occurs in a much higher relative proportion of the samples in Q3 (wPOOmacro = 20%), than during Q1 (wPOOmacro = 2%), Q2 (wPOOmacro = 3%), and Q4 (wPOOmacro = 0%) (Supplementary Figure S1C).
For the three main prey taxa, there were no significant differences between quarters of year in the taxa-specific relative contribution of read counts (taxa-specific %RRA) (Table 4; Figures 10G–I). Clupeids, however, seem to be of somewhat relatively higher importance during Q3 (Figure 10G), while gobiids seem to contribute least to the diet during Q4 (Figure 10I).
3.5.4 Sea districts
Clupeids were found to occur in high proportions in the sample population-level diet in all four sea districts, although being least common in Skagerrak (Figure 9D). Ammodytidae occurred in a considerable part of the diet samples from Kattegat (14%) and the Southern Baltic (11%), while being less common in samples from Öresund (2%) and Skagerrak (3%) (Figure 9D). The method-specific data and plots again revealed interesting detailed patterns, with e.g. noticeably higher relative occurrence of cephalopods in Öresund (wPOOmacro = 23%) and Kattegat (wPOOmacro = 33%) diet samples compared to the Southern Baltic (wPOOmacro = 0%) and Skagerrak (wPOOmacro = 0%) (Supplementary Figure S1D). Also, Myxinidae were found in a third of the samples from Skagerrak (wPOOmacro = 30%), while being completely absent in all samples from the other sea districts (Supplementary Figure S1D). Merluccidae only occurred in samples from Öresund (wPOOmacro = 10%) and Skagerrak (wPOOmacro = 3%) (Supplementary Figure S1D).
For clupeids and gobiids, there were no differences between sea districts in the taxa-specific relative contribution of read counts (taxa-specific %RRA) (Table 4; Figures 10J, L). Visual inspection of the data do however indicate highest relative importance of clupeids in the diet samples from the Southern Baltic and Öresund (Figure 10J). There seems to be a similar tendency for an increased relative contribution of gobiids in Skagerrak compared to the other areas (Figure 10L). A confirmed difference was found for gadoids (H = 11.565, df = 3, p = 0.040), with a higher contribution (z = 3.03, p = 0.015) of gadoids to the diet samples from Skagerrak (median = 0.09, IQR = 11.6, mean = 6.9) compared to Öresund (median = 0.00, IQR = 0.02, mean = 0.26) (Figure 10K).
4 Discussion
Prior to a more detailed discussion of the findings in our study, we want to highlight some overall considerations that are important to keep in mind during the interpretation of results from diet studies in general, and our study in particular. In all diet studies, results and interpretations are highly affected by the diet metric of choice. In our study, we mostly refer to prey taxa in terms of their relative occurrences in diet sample groups. This metric provides valuable insight into how common different taxa are, but give no information on their relative dietary contribution by number or biomass, which is important to keep in mind.
Diet samples collected from dead specimens of wild animals are often inherently uneven in their spatial and temporal distribution. As we believe the dietary information from e.g. just a few porpoise individuals from the Southern Baltic holds great value, although the sample size is very small compared to the more well-covered Öresund, we present results from groups with highly varied group sizes side-by-side. These results do however require careful interpretation, as direct comparisons between some groups might not be justifiable. Similarly, results from groups comprised of only a few individuals are not necessarily representative for species where the individual variation in dietary preferences is high, or where other factors (e.g. uneven sex or age class distributions within the group) might also affect some of the observed differences.
4.1 Method performance and similarity in estimated diet
In this study, the use of sDNA analysis of gastrointestinal content increased the number of detected prey taxa and their taxonomic resolution when compared to traditional macroscopic analysis performed on the same stomach samples (Figure 6). Macroscopic stomach analysis identified 19 prey species belonging to 10 taxa (9 fish families and class Cephalopoda), while sDNA analysis identified 28 prey species belonging to 17 fish families (Table 2). As some species were only detected by one of the methods, the number of detected species (n=36) and taxa (n=21, 20 fish families and class Cephalopoda) increased further when the two approaches were combined. The sDNA samples more often included material also from the intestines, but the differences in detected prey taxa by the two methods are unlikely to be significantly influenced by lower number of intestines in macroscopic analysis, as hard parts are generally found in the main stomach and not the intestines.
In addition, the use of sDNA increased the number of stomach samples where prey remains could be successfully retrieved for dietary analysis. The sDNA approach was able to amplify prey DNA from all samples included in this study, while more than half of the samples were empty in terms of hard parts needed for macroscopic diet analysis. Since sDNA analysis had the capacity to detect prey in apparently empty stomachs, this method has the potential to drastically increase sample size and recover valuable data from animals where stomach samples would otherwise be discarded as unavailable for diet analysis.
Contrasting the estimates of dietary proportions from sDNA and macroscopical analysis show that their similarity depends on the taxonomic resolution used, but that the two methods are generally in high agreement for prey identification on family-level (Figure 5). The increase in mismatch between estimated diets on species-level is unlikely to be caused by misidentification of species, but is most likely explained by the increased taxonomic resolution provided by sDNA. This is supported by the increased similarity between methods when decreasing the resolution of estimated diet to family-level or rank importance. The highest agreement between estimated diets by the methods compared was found when prey was ranked by importance on family level (Figure 5). For studies aiming at identifying occurring prey species in a predator’s diet and ranking their relative importance, sDNA analysis could thus potentially provide a fast and easy alternative to traditional macroscopic analysis.
The comparative plots of estimated sample population- (Figure 4) and individual-level (Figure 7) diets confirm the overlapping results of both methods, especially on prey family-level. The same three prey families (Clupeidae, Gadidae and Gobidae) dominate the estimated sample-population diet in terms of relative occurrence (Figure 4). The detection probability of some occurring prey taxa, however, appears to be method dependent, as e.g. Cephalopoda and Myxinidae only occur in macroscopic data, while Ammodytidae and Alosidae are highly occuring in sDNA data but almost lacking in macroscopic data (Table 2; Figure 4). As five out of the six stomachs with detected cephalopod beaks were also analysed using invertebrate primers, the lack of detection of cephalopods in sDNA estimated diet is most likely due to methodological constraints in detection of cephalopod DNA or caused by differences in residence time of prey remains in porpoise stomachs, with cephalopod DNA likely being detectable in the stomach of a porpoise for a much shorter time than cephalopod beaks. Very small prey species, such as gobiids, or species with otoliths that degrade fast, such as clupeids, might on the contrary be more likely to be detected by sDNA analysis as their hard parts could be easily missed in macroscopic analysis which rely on visual detection.
The subset of individual-level diet estimates confirmed that fish prey families detected by macroscopic analysis are correctly identified in sDNA analysis and that the metabarcoding approach increased taxonomic resolution (Figure 7). The individual-level comparison in Figure 7 also suggest that gobiids and clupeids might go unnoticed in macroscopic analysis, even when they are clearly detected by the sDNA approach. Again, this could be related to the small size and degradation rate of otoliths from these species. It could also be an indication that sDNA analysis is more likely than macroscopic analysis to detect secondary prey, i.e. prey not actively targeted by the studied predator, but instead passively ingested as part of the stomach content of consumed primary prey. These results are similar to what was found when macroscopic examination of otoliths and DNA metabarcoding analysis were compared for Sowerbys beaked whales in Swedish waters (Stavenow et al., 2022). It is also evident from Figure 7 that the sDNA metabarcoding approach, even for stomachs considered macroscopically empty, can recover enough material to deliver useful dietary information. One of the porpoise individuals, HP5, in fact had 13 prey species from 7 fish families identified by sDNA although it was considered macroscopically empty (Figure 7).
4.2 Methodological considerations
Although the results from the two methods in general were in high agreement, there were also clear differences. DNA metabarcoding of gastrointestinal content clearly increased the number of prey species and taxa detected, while at the same time allowing increased sample size by inclusion of apparently empty stomachs. Cetaceans often present empty stomachs in post-mortem examinations, as entangled individuals often vomit prior to death and debilitated animals that strand may not have fed for a period prior to death, which reduce the number of samples available for macroscopic analysis. For whale, dolphin and porpoise diet studies, the use of sDNA analysis thus has the potential to significantly increase sample size and improve our knowledge of individual- and population-level diets, species interactions, and food web dynamics.
Results from DNA metabarcoding can be biased by detection of unrepresentative species by amplification of genetic material included through contamination (van der Loos and Nijland, 2021). However, by exclusion of species with low sequence counts the remaining detected species in diet studies can be reasonably assumed to be primary, and perhaps in some cases secondary, prey. In diet estimates for animals that feed on whole prey items, the smallest prey species could be mistaken for primary prey although they might not have been actively targeted but rather ingested as secondary prey. Since harbour porpoises are capture suction feeders (Johnston and Berta, 2011) capable of actively ingesting small centimetre size prey, misinterpretation of such small secondary prey as primary prey is possible. One way to investigate this could be to study the overlap in presence of occurring species. Species frequently or always found together in a stomach may be an indication that one of the species might be ingested by the consumer as secondary prey. An overlap between detected prey species might, however, also be due to similar habitat preferences by the prey, possibly resulting in a high probability of being ingested by the same consumer close in time. For our diet estimates, the high numerical contribution and relative occurrence of small centimetre size gobiid prey species could be overestimated through such secondary prey ingestion. However, studies on live porpoises in nearby waters indicate that Belt Sea porpoises actively feed on thousands of centimetre size prey items every day (Wisniewska et al., 2016), supporting the accuracy of the sDNA methodology and a large proportion of gobiids in our diet estimates.
During metabarcoding there may also be biases towards disproportionate sequence counts if the primers amplify DNA fragments from certain species prey more efficiently than for others during the PCR process (Bowen and Iverson, 2013; Deagle et al., 2013). In addition, the sDNA methodology does leave some, at least periodically, important harbour porpoise prey species undetected. The reason for failed detection of cephalopods and Myxine glutinosa (Atlantic hagfish) by sDNA should be investigated further, and needs to be considered during interpretation of sDNA results. Development of specific primers for species of particular interest, which for harbour porpoises could be the design of primers for cephalopod species occurring in the Baltic region, could potentially increase the detection probability of these species in sDNA analysis.
Depending on required dietary resolution, one approach in future cetacean (and other similar wildlife) dietary studies could be to complement the sDNA analysis with a simple visual scan of sampled stomachs, for e.g. cephalopod beaks and other items known to be poorly detected by metabarcoding, to allow detection and inclusion of these species in the resulting diet estimates. The use of appropriate primers for amplifications, which allow detection of all potentially important prey families, are also extremely important in sDNA analysis (Nielsen et al., 2017). Successful diet tracing using metabarcoding therefore require some prior knowledge of the consumer’s potential diet.
Macroscopic analysis of hard parts is, however, not without its own biases and pitfalls, as it is sensitive to executor experience and reference material quality. Incorrect species identification might occur, especially when separating species belonging to the same prey family, which is of less concern in metabarcoding. As the digestion rate of otoliths varies between species, with some species having otoliths more sensitive to degradation and breakage than others (e.g. clupeids), there is a risk of underestimation of their occurrence in diet estimates based on macroscopic analysis (Härkönen, 1986; Pierce and Boyle, 1991). Further, otoliths with high area to volume ratios degrade faster during digestion than otoliths with low area to volume ratios (Murie and Lavigne, 1985). For example, otoliths from clupeids and scombrids have been found to degrade at a faster rate than otoliths from pleuronectids and gadoids (Silva and Neilson, 1985). For harbour porpoises, it has been estimated that otoliths from some common prey species are completely broken down and unable to retrieve already 10 hours after feeding (Wijnsma et al., 2001). Again, DNA metabarcoding through sDNA analysis may thus support and supplement macroscopic analysis, allowing identification of prey to species level and detailed dietary estimations which would be otherwise impossible.
Clearly, both macroscopic and sDNA analysis methods have inherent benefits and shortcomings. Therefore, a combined approach could be preferred, especially because parallel interpretation of results from both methods is not straight-forward. One way forward could be to combine results from macroscopic and sDNA analysis into a joint metric, which we suggest and use in this study by the establishment of the metric termed macro-sDNA weighted percent of occurrence (wPOOmac-sDNA). Although this metric fails to detail some low occurring but interesting prey taxa, it provides a promising novel approach for future diet studies that utilize both methods to study overall diet patterns. Also, by combination with investigations of method-specific data, potential presence of rare but biologically important or interesting prey can be picked up.
4.3 Harbour porpoise diet in Swedish waters
By both methods and all metrics used, the same three prey families; Gobiidae, Gadidae and Clupeidae, were clearly identified as main prey for harbour porpoises in Swedish waters during 2017-2022 (e.g. Figures 4, 9; Tables 2, 3). This is consistent with previous studies (Börjesson et al., 2003; Angerbjörn et al., 2007; Andreasen et al., 2017; Aarefjord et al., 1995). By numerical importance (%N) in macroscopic analysis, cephalopods also made up a considerable part of the estimated diet (11%) (Figure 4A; Table 2), although the taxa only occurred in 1 out of 10 of the macroscopically analysed stomachs (Figure 4C). Anguilla anguilla (European eel), on the other hand, occured in 1 out of 5 stomachs (Figure 4C) but only represented 6% of the relative read abundance (Figure 4B). Other prey, like ammodytids were found by sDNA analysis in a large proportion of the stomachs (Figure 4C), but represented a minor fraction of the overall estimated diet contribution by numerical occurrence (Figure 4A) and relative read abundance (Figure 4B).
The estimated sample population-level diet in this study supports the current notion that harbour porpoises forage on a large variety of prey species and switch their diet in response to prey abundance (Ransijn et al., 2021). Their proven ability to prey on a diversity of species in a variety of habitat contexts (Stedt et al., 2024) is visible also in the results of this current study, with 36 unique species from 21 different prey families detected as potential prey. However, most identified prey species and taxa seem to add minor dietary contributions, and are either not to be considered important prey species or they might e.g. represent important seasonal prey species for a certain life-history category of porpoises.
The mean estimated prey size for porpoises during 2017-2022 in Swedish waters was 13.3 cm (min-max range 2.5-40.6 cm). This is in the range of estimated prey sizes for the same populations for years 1985-2011 (Aarefjord et al., 1995; Andreasen et al., 2017; Börjesson et al., 2003). In Danish waters, concerns have been raised for decreased prey target sizes and potential food limitation for harbour porpoises, with studies suggesting that most prey targeted is only 3-10 cm in size (Wisniewska et al., 2016). Such a decrease in prey size is not supported by our results. It might be that porpoises overall target larger prey in Swedish waters than they do in some Danish waters. However, since the tagged porpoises in Wisniewska et al. (2016) mainly were distributed in inner Danish waters during the short data collection period, they might reflect only local or regional prey choice and availability, but fail to mirror conditions on population-level scale. Similar local dietary trends might be present also in other areas, e.g. in Sweden. In fact, our macroscopic diet estimates suggest an increased numerical contribution of gadoids to adult harbour porpoise diet, from approximately 20% during 1989-1996 to more than 60% in recent years. Such a potential switch in preferred prey for adult harbour porpoises in some Swedish waters during the past 30 years could reflect a functional response by porpoises to simultaneous changes in local prey abundance (Ransijn et al., 2021), but needs to be investigated further.
Dietary differences between adult male and female porpoises have been found in one previous study in the area (Andreasen et al., 2017), but not all (Aarefjord et al., 1995; Santos and Pierce, 2003). A higher number of targeted prey taxa, i.e. broader dietary niche, or specialization towards certain nutrient-rich species, could however be expected for reproducing females given their higher energetic need for reproductive investment (i.e. for gestation and nursing) (Santos and Pierce, 2003). We do not find support in our data that females target more species than males (Figure 8A), neither can the higher relative occurrence of cephalopods in female diet (20% vs 11% wPOOmacro) be explained by a relatively higher energetic content of this taxa (Spitz et al., 2010). A higher presence of Myxinidae in adult female diet has previously been observed (Börjesson et al., 2003). Our data show that Myxinidae occur only in male diet (wPOOmacro = 13%) but not in female diet (wPOOmacro = 0%). However, as Myxinidae was exclusively detected in adult and juvenile samples from Q1 in Skagerrak and our dataset only had one adult and one juvenile female from Q2 from this sea district the lack of Myxinidae from female diet could be simply due to chance.
Juveniles seem to prey on fewer prey species than calves, and probably also adults (Figure 8B). A lower number of targeted prey species and narrower dietary niche by juveniles could be due to behavioural differences between the age classes, e.g. exposing juveniles to an overall less diverse fish assemblage, or not allowing inexperienced juveniles to effectively predate upon all species targeted by the behaviourally more experienced adults. The higher diversity of prey in calf diet could then be explained by their close relationship with their mother (Hamel et al., 2025), potentially allowing them access to the same dietary niche. The joint presence of mothers and their calves in certain foraging habitats, such as shallow areas with sandy bottoms (Stedt et al., 2024), could then potentially also explain the relatively higher occurrence of Ammodytidae, compared to juveniles, in both calf and adult diet.
Gadoids had a higher relative contribution in the diet of calves than juveniles (Figure 10E). Calves also seem to target gobiids to a higher extent than juveniles and adults (Figure 10F), although no statistical differences were found (Table 4). Different age classes of porpoises could be hypothesised to target different prey sizes, with adults possibly targeting larger prey than juveniles and calves. This could result in calves and adults targeting different age classes of the same species, e.g. when predating on cod and other gadids. The higher proportion of gobiids in calf diet (Figure 10F) suggest that these small prey may not be the preferred prey targeted by adults, but instead perhaps represent important and easily available staple-food for calves during their first year while they develop their hunting skills for other, e.g. bigger, prey.
Interestingly, cephalopods almost exclusive occurred in the diet of juveniles, and Merluccidae in the diet of adults (Supplementary Figure S1B). If these occurrences represent true specializations or biases due to the overrepresentation of juveniles in Q1 and adults in Q3 (Figure 2), which were also the only periods of the year when these species occurred in the diet (Supplementary Figure S1C), should be investigated further. If the diet estimates from this study are robust, they otherwise indicate that cephalopods might only be targeted by juvenile, mostly female, porpoises in Öresund and Kattegat during the first quarter of the year (Supplementary Figure S1). As some cephalopod species, e.g. Alloteuthis subulata, have been reported to sporadically occur in high numbers in Öresund during the spring, this might reflect a true seasonal dietary preference. Similarly, Anguilla anguilla seems to be targeted mostly by adult females in the southern part of Sweden during Q3 (Supplementary Figure S1), which co-occurs with the spawning migration of Anguilla anguilla from Sweden to the Sargasso Sea (Righton et al., 2016). The occurrence of Anguilla anguilla in adult female diet could perhaps represent a diet switch to periodically occurring especially energy rich prey to meet their increased metabolic demand when they nurse their newborn calves (Gallagher et al., 2018).
The taxa-specific groupwise comparisons should not be used to make comparisons between different taxa, but provide interesting insights into taxa-specific relative occurrences for constructed groups of porpoises (Figure 10). For Clupeidae, the lack of differences in taxa-specific relative abundances between investigated groups of porpoises demonstrate a continued general high importance of Clupea harengus and Sprattus sprattus to porpoise diet in Swedish waters (Börjesson et al., 2003; Angerbjörn et al., 2007; Andreasen et al., 2017; Aarefjord et al., 1995). Clupeid abundance along the Swedish coast varies over the year, as the spring-spawning herring migrate from the feeding grounds in the Skagerrak and North Sea to the Rügen area in the western Baltic Sea, but densities are especially high in the northern parts of Öresund during the long overwintering period of the western Baltic herring in the autumn (Nielsen et al., 2001). The tendency for a higher contribution of clupeids to diet in Q3 (Figure 10G) would therefore be interesting to investigate further, as there are also clear tendencies for higher relative contributions of clupeids in Öresund and the Southern Baltic (Figure 10J) possibly indicating that porpoises effectively target seasonally abundant prey.
Although gadoids are of high importance to both males and females throughout the year (Figures 10B, H), their higher contribution to the diet of calves (Figure 10E) is interesting. It is possible that porpoise calves target smaller prey sizes, i.e. age classes, of cod than adults do. If so, this pattern could potentially be linked to the high abundance of gadoids in diet samples from Skagerrak (Figure 10K), as local recruitment and juvenile cod stochastically occur with varying strength in this area (Svedäng et al., 2019; Svedäng and Svenson, 2006) despite overall collapsed cod stocks along the Swedish west coast (Bartolino et al., 2012).
5 Conclusions
We show that harbour porpoises along the Swedish west coast target a broad variety of fish from a diverse range of both benthic and pelagic prey species, which is consistent with previous studies in the area (Andreasen et al., 2017; Börjesson et al., 2003; Aarefjord et al., 1995). Preferred prey families are Gadidae, Gobiidae and Clupeidae, which together represent a clear majority of the estimated diet irrespective of diet tracing method used. By parallel application of sDNA and macroscopic analysis on samples from the same harbour porpoise individuals, this study provides an important methodological comparison. Despite some mismatch in estimated diet, the two methods are overall in high agreement.
In diet studies utilizing stomachs from deceased animals, sDNA could supplement or replace traditional macroscopic analysis as it drastically decreases the time and effort required to acquire reliable semi-quantitative dietary estimates. Diet tracing through metabarcoding does however not allow estimations of prey size, which can be important information when studying dietary changes and food web dynamics. However, when detection of main prey species/families or relative changes in prey preference over time are of interest, the use of sDNA holds great potential as it significantly reduces the amount of labour, while at the same time increases sample size and taxonomic resolution. In this study, some potentially biologically important prey items were poorly detected by sDNA analysis while clearly apparent in macroscopic analysis. By establishment of a novel joint metric, we do however show that the two methods can be successfully combined to detail prey species composition and study overall diet patterns.
Data availability statement
The raw data supporting the conclusions of this article will be made available by the authors upon request, without undue reservation.
Ethics statement
Ethical approval was not required for the study involving animals in accordance with the local legislation and institutional requirements because no live animals were used in this study. Post-mortem examinations of found dead or bycaught porpoises were conducted under the directive of the Swedish Agency for Marine and Water Management as part of Sweden’s environmental monitoring.
Author contributions
JS: Conceptualization, Data curation, Formal analysis, Funding acquisition, Investigation, Visualization, Writing – original draft, Writing – review & editing. LB: Conceptualization, Formal analysis, Investigation, Writing – review & editing. AN: Conceptualization, Funding acquisition, Investigation, Resources, Writing – review & editing. WE: Data curation, Investigation, Writing – review & editing. PC: Conceptualization, Funding acquisition, Supervision, Writing – review & editing. AR: Conceptualization, Funding acquisition, Supervision, Investigation, Resources, Writing – review & editing.
Funding
The author(s) declare that financial support was received for the research and/or publication of this article. Since 2016, funding for post-mortem examinations of porpoises is provided under the directive of the Swedish Agency for Marine and Water Management as part of Sweden’s environmental monitoring. The work presented here was additionally funded by the Swedish Research Council Formas (grant number AC-2023/0032 to PC), the Royal Physiographic Society in Lund (grant number 41981 to JS), the Royal Swedish Academy of Sciences (grant number BS2022-0041 to JS), the Gyllenstierna Krapperup’s Foundation (grant number KR2023-0022 to JS) and the Helge Ax:son Johnson Foundation (grant number F22-0192 to JS). JS would also like to thank the Royal Physiographic Society in Lund (grant number 43744) for travel funds allowing participation and data collection during porpoise necropsies at the Swedish Veterinary Agency in Uppsala.
Acknowledgments
We would like to thank Tero Härkönen and Foteini Kappa for assistance during macroscopic species identification. Thanks also to Karl Lundström for sharing your expertise in macroscopic diet analysis. We are grateful to Annika Strömberg and Sedra Bäcklin for their respective contributions to macroscopic lab work. Thanks also to Karin Hårding and the ‘seal-team’ at Gothenburg University for discussions and feedback. A special thank you to Jasmine Stavenow for assistance during data collection and for valuable comments on an early version of the manuscript. Thanks to Anders Nilsson for statistical advice and Erik Fridolf for GIS support. We thank the reviewers for their comments and suggestions which significantly improved our manuscript. We are also thankful to all who has helped with collection of deceased porpoises over the years, especially Svante Lysén, Anders Nilsson, Kennet Lundin, Magnus Gelang and others at the Natural History Museum in Gothenburg, Elin Lygård, Malin Mélen and colleagues at Kullaberg, staff at Kullabergsguiderna, Kristin Johansson, Jan-Åke Hillarp, Michael Palmgren, Havets Hus, SLU Aqua, Kristineberg Marine Research Station and Tjärnö Marine Laboratory. Finally, we are grateful to everyone who has reported findings of dead harbour porpoises to us and by doing so made this study possible. Some of the results presented in this paper have previously been published as part of a doctoral thesis (Stedt, 2024).
Conflict of interest
The authors declare that the research was conducted in the absence of any commercial or financial relationships that could be construed as a potential conflict of interest.
Generative AI statement
The author(s) declare that no Generative AI was used in the creation of this manuscript.
Publisher’s note
All claims expressed in this article are solely those of the authors and do not necessarily represent those of their affiliated organizations, or those of the publisher, the editors and the reviewers. Any product that may be evaluated in this article, or claim that may be made by its manufacturer, is not guaranteed or endorsed by the publisher.
Supplementary material
The Supplementary Material for this article can be found online at: https://www.frontiersin.org/articles/10.3389/fmars.2025.1517330/full#supplementary-material
Supplementary Figure 1 | Side-by-side comparisons of estimated diet (%FOO) by sDNA and macroscopic analysis for (A) sexes, (B) age classes, (C) quarters of year, and (D) sea districts. For each bar, taxa contributing with <5% FOO to estimated diet are combined into the category ‘Other’. Numbers in brackets denote sample size.
References
Aarefjord H., Bjørge A. J., Kinze C. C., Lindstedt I. (1995). Diet Of The Harbour Porpoise (Phocoena Phocoena) Special Issue 16 In Scandinavian Waters (Report Of The International Whaling Commision), 211–222.
Amundin M., Carlström J., Thomas L., Carlén I., Teilmann J., Tougaard J., et al. (2022). Estimating the abundance of the critically endangered Baltic Proper harbour porpoise (Phocoena phocoena) population using passive acoustic monitoring. Ecol. Evol. 12, 1–39. doi: 10.1002/ece3.v12.2
Andreasen H., Ross S. D., Siebert U., Andersen N. G., Ronnenberg K., Gilles A. (2017). Diet composition and food consumption rate of harbor porpoises (Phocoena phocoena) in the western Baltic Sea. Mar. Mammal Sci. 33, 1053–1079. doi: 10.1111/mms.2017.33.issue-4
Angerbjörn A., Börjesson P., Brandberg K. (2007). Stable isotope analysis of harbour porpoises and their prey from the Baltic and Kattegat/Skagerrak Seas. Mar. Biol. Res. 2, 411–419. doi: 10.1080/17451000601023896
Bartolino V., Cardinale M., Svedäng H., Linderholm H. W., Casini M., Grimwall A., et al. (2012). Historical spatiotemporal dynamics of eastern North Sea cod. Can. J. Fisheries Aquat. Sci. 69, 833–841. doi: 10.1139/f2012-028
Birnie-Gauvin K., Peiman K. S., Raubenheimer D., Cooke S. J. (2017). Nutritional physiology and ecology of wildlife in a changing world. Conserv. Physiol. 5, cox030. doi: 10.1093/conphys/cox030
Blocker A. M., Gutte H. M., Bender R. L., Otto S. A., Sguotti C., Mollmann C. (2023). Regime shift dynamics, tipping points and the success of fisheries management. Sci. Rep. 13, 289. doi: 10.1038/s41598-022-27104-y
Börjesson P., Berggren P., Ganning B. (2003). Diet of harbor porpoises in the Kattegat and Skagerrak seas: accounting for individual variation and sample size. Mar. Mammal Sci. 19, 38–058. doi: 10.1111/j.1748-7692.2003.tb01091.x
Bowen W. D., Iverson S. J. (2013). Methods of estimating marine mammal diets: A review of validation experiments and sources of bias and uncertainty. Mar. Mammal Sci. 29, 719–754. doi: 10.1111/j.1748-7692.2012.00604.x
Callahan B. J., Mcmurdie P. J., Rosen M. J., Han A. W., Johnson A. J., Holmes S. P. (2016). DADA2: High-resolution sample inference from Illumina amplicon data. Nat. Methods 13, 581–583. doi: 10.1038/nmeth.3869
Carlén I., Nunny L., Simmonds M. P. (2021). Out of sight, out of mind: how conservation is failing European porpoises. Front. Mar. Sci. 8. doi: 10.3389/fmars.2021.617478
Casini M., Hjelm J., Molinero J. C., Lovgren J., Cardinale M., Bartolino V., et al. (2009). Trophic cascades promote threshold-like shifts in pelagic marine ecosystems. Proc. Natl. Acad. Sci. U.S.A. 106, 197–202. doi: 10.1073/pnas.0806649105
Casini M., Lovgren J., Hjelm J., Cardinale M., Molinero J. C., Kornilovs G. (2008). Multi-level trophic cascades in a heavily exploited open marine ecosystem. Proc. Biol. Sci. 275, 1793–1801. doi: 10.1098/rspb.2007.1752
Cordone G., Lozada M., Vilacoba E., Thalinger B., Bigatti G., Lijtmaer D. A., et al. (2021). Metabarcoding, direct stomach observation and stable isotope analysis reveal a highly diverse diet for the invasive green crab in Atlantic Patagonia. Biol. Invasions 24, 505–526. doi: 10.1007/s10530-021-02659-5
Deagle B. E., Thomas A. C., Mcinnes J. C., Clarke L. J., Vesterinen E. J., Clare E. L., et al. (2019). Counting with DNA in metabarcoding studies: How should we convert sequence reads to dietary data? Mol. Ecol. 28, 391–406. doi: 10.1111/mec.2019.28.issue-2
Deagle B. E., Thomas A. C., Shaffer A. K., Trites A. W., Jarman S. N. (2013). Quantifying sequence proportions in a DNA-based diet study using Ion Torrent amplicon sequencing: which counts count? Mol. Ecol. Resour 13, 620–633. doi: 10.1111/men.2013.13.issue-4
Deagle B. E., Tollit D. J., Jarman S. N., Hindell M. A., Trites A. W., Gales N. J. (2005). Molecular scatology as a tool to study diet: analysis of prey DNA in scats from captive Steller sea lions. Mol. Ecol. 14, 1831–1842. doi: 10.1111/j.1365-294X.2005.02531.x
Estes J. A., Terborgh J., Brashares J. S., Power M. E., Berger J., Bond W. J., et al. (2011). Trophic downgrading of planet Earth. Science 333, 301–306. doi: 10.1126/science.1205106
Frank K. T., Petrie B., Choi J. S., Leggett W. C. (2005). Trophic cascades in a formerly cod-dominated ecosystem. Science 308, 1621–1623. doi: 10.1126/science.1113075
Gallagher C. A., Stern S. J., Hines E. (2018). The metabolic cost of swimming and reproduction in harbor porpoises (Phocoena phocoena) as predicted by a bioenergetic model. Mar. Mammal Sci. 34, 875–900. doi: 10.1111/mms.12487
Geller J., Meyer C., Parker M., Hawk H. (2013). Redesign of PCR primers for mitochondrial cytochrome c oxidase subunit I for marine invertebrates and application in all-taxa biotic surveys. Mol. Ecol. Resour 13, 851–861. doi: 10.1111/men.2013.13.issue-5
Glenn T. C., Pierson T. W., Bayona-Vasquez N. J., Kieran T. J., Hoffberg S. L., Thomas Iv J. C., et al. (2019). Adapterama II: universal amplicon sequencing on Illumina platforms (TaggiMatrix). PeerJ 7, e7786. doi: 10.7717/peerj.7786
Gül G., Keskin E., Demirel N. (2023). Comparison of fish prey contribution in the diet of European hake by visual assessment of stomach contents and DNA metabarcoding. Environ. Biol. Fishes 106, 613–625. doi: 10.1007/s10641-023-01398-x
Hamel H., Torres Ortiz S., Wahlberg M. (2025). Long-term observations reveal short-term mother–calf affiliation in wild harbour porpoises. Anim. Behav. 219. doi: 10.1016/j.anbehav.2024.10.006
Härkönen T. J. (1986). Guide to the Otoliths of the Bony Fishes of the Northeast Atlantic (Hellerup: Danbui ApS).
Hyslop E. J. (2006). Stomach contents analysis—a review of methods and their application. J. Fish Biol. 17, 411–429. doi: 10.1111/j.1095-8649.1980.tb02775.x
Ijsseldijk L. L., Brownlow A. C., Mazzariol S. (2019). Best practice on cetacean post mortem investigation and tissue sampling – joint ACCOBAMS and ASCOBANS document. Available online at: https://accobams.org/wp-content/uploads/2021/07/Best-practices-on-cetacean-post-mortem-investigation.pdf.
Jeppson H., Hofmann H., Cook D. (2021). ggmosaic: Mosaic Plots in the 'ggplot2' Framework. Available online at: https://CRAN.R-project.org/package=ggmosaic.
Johnston C., Berta A. (2011). Comparative anatomy and evolutionary history of suction feeding in cetaceans. Mar. Mammal Sci. 27, 493–513. doi: 10.1111/j.1748-7692.2010.00420.x
Kassambara A. (2023). _rstatix: Pipe-Friendly Framework for Basic Statistical Tests_. R package version 0.7.2. Available online at: https://CRAN.R-project.org/package=rstatix.
Kelly R. P., Shelton A. O., Gallego R. (2019). Understanding PCR processes to draw meaningful conclusions from environmental DNA studies. Sci. Rep. 9, 12133. doi: 10.1038/s41598-019-48546-x
Kohn A. J., Riggs A. C. (1982). Sample size dependence in measures of proportional similarity. Mar. Ecol. Prog. Ser. 9, 147–151. doi: 10.3354/meps009147
Kratina P., Lecraw R. M., Ingram T., Anholt B. R. (2012). Stability and persistence of food webs with omnivory: Is there a general pattern? Ecosphere 3, 1–18. doi: 10.1890/ES12-00121.1
Kuhrt A., Musetta-Lambert J., Power M., Rautio M., Culp J. (2023). Method choice affects estimates of diet and niche breadth for small stream fish. Hydrobiologia 851, 1241–1257. doi: 10.1007/s10750-023-05386-1
Kuiken T., Hartman M. G. in Proceedings of the First European Cetacean Society Workshop on Cetacean Pathology: Dissection Techniques and Tissue Sampling, Leiden, The Netherlands, 13–14 September 1991. Available online at: https://www.europeancetaceansociety.eu/sites/default/files/Newsletter%2017.pdf.
Leopold M. F., Van Damme C. J. G., Philippart C. J. M., Winter C. J. N. (2001). Otoliths of North Sea Fish: fish identification key by means of otoliths and other hard parts (Amterdam: Expert Center for Taxonomic Identification (ETI), University of Amsterdam).
Leray M., Yang J. Y., Meyer C. P., Mills S. C., Agudelo N., Ranwez V., et al. (2013). A new versatile primer set targeting a short fragment of the mitochondrial COI region for metabarcoding metazoan diversity: application for characterizing coral reef fish gut contents. Front. Zool 10, 34. doi: 10.1186/1742-9994-10-34
Lockyer C. (2003). Harbour porpoises (Phocoena phocoena) in the North Atlantic: Biological parameters. NAMMCO Sci. Publications 5, 71–89. doi: 10.7557/3.2740
Machovsky-Capuska G. E., Raubenheimer D. (2020). The nutritional ecology of marine apex predators. Ann. Rev. Mar. Sci. 12, 361–387. doi: 10.1146/annurev-marine-010318-095411
Martin M. (2011). Cutadapt removes adapter sequences from high-throughput sequencing reads. EMBnet.journal 17, 10–12. doi: 10.14806/ej.17.1.200
McCosker C. M., Olson Z. H., Ono K. A. (2024). A comparative methodological approach to studying the diet of a recovering marine predator, the grey seal (Halichoerus grypus). Can. J. Zoology 102, 182–194. doi: 10.1139/cjz-2023-0104
Microsoft Corporation. (2018). Microsoft Excel. Available online at: https://office.microsoft.com/excel.
Min S. H. (2024). “Visualization of composite plots in R using a programmatic approach and smplot2,” in Advances in Methods and Practices in Psychological Science, vol. 7(3). doi: 10.1177/25152459241267927
Miya M., Sato Y., Fukunaga T., Sado T., Poulsen J. Y., Sato K., et al. (2015). MiFish, a set of universal PCR primers for metabarcoding environmental DNA from fishes: detection of more than 230 subtropical marine species. R Soc. Open Sci. 2, 150088. doi: 10.1098/rsos.150088
Murie D. J., Lavigne D. M. (1985). “Digestion and retention of Atlantic herring otoliths in the stomachs of grey seals,” in Marine Mammals and Fisheries. Eds. Beddington J. R., Beverton R. J. H., Lavigne D. M. (George Allen & Unwin, London, England), 1–16.
Neimanis A., Stavenow J., Agren E. O., Wikstrom-Lassa E., Roos A. M. (2022). Causes of death and pathological findings in stranded harbour porpoises (Phocoena phocoena) from Swedish waters. Anim. (Basel) 12, 1–16. doi: 10.3390/ani12030369
Nielsen J. M., Clare E. L., Hayden B., Brett M. T., Kratina P., Gilbert M. T. P. (2017). Diet tracing in ecology: Method comparison and selection. Methods Ecol. Evol. 9, 278–291. doi: 10.1111/mee3.2018.9.issue-2
Nielsen R. J., Lundgren B., Jensen T. F., Stæhr K.-J. (2001). Distribution, density and abundance of the western Baltic herring (Clupea harengus) in the Sound (ICES Subdivision 23) in relation to hydrographical features. Fisheries Res. 50, 235–258. doi: 10.1016/S0165-7836(00)00220-4
Norgaard L., Olesen C. R., Trojelsgaard K., Pertoldi C., Nielsen J. L., Taberlet P., et al. (2021). eDNA metabarcoding for biodiversity assessment, generalist predators as sampling assistants. Sci. Rep. 11, 6820. doi: 10.1038/s41598-021-85488-9
Owen K., Gilles A., Authier M., Carlström J., Genu M., Kyhn L. A., et al. (2024). A negative trend in abundance and an exceeded mortality limit call for conservation action for the Vulnerable Belt Sea harbour porpoise population. Front. Mar. Sci. 11. doi: 10.3389/fmars.2024.1289808
Pierce G., Boyle P. (1991). A review of methods of diet analysis in piscivorous marine mammals. Oceanography Mar. Biology: an Annu. Rev. 29, 409–486.
Ransijn J. M., Hammond P. S., Leopold M. F., Sveegaard S., Smout S. C. (2021). Integrating disparate datasets to model the functional response of a marine predator: A case study of harbour porpoises in the southern North Sea. Ecol. Evol. 11, 17458–17470. doi: 10.1002/ece3.v11.23
R Core Team (2024). R: A language and environment for statistical computing (Vienna, Austria: R Foundation for Statistical Computing).
Read A. J., Murray K. T. (2000). Gross Evidence of Human-Induced Mortality in Small Cetaceans. U.S. Dep. Commer., NOAA Tech. Memo. NMFS-OPR-15, 21p.
Righton D., Westerberg H., Feunteun E., Okland F., Gargan P., Amilhat E., et al. (2016). Empirical observations of the spawning migration of European eels: The long and dangerous road to the Sargasso Sea. Sci. Adv. 2, e1501694. doi: 10.1126/sciadv.1501694
Rojano-Donate L., Teilmann J., Wisniewska D. M., Jensen F. H., Siebert U., Mcdonald B. I., et al. (2024). Low hunting costs in an expensive marine mammal predator. Sci. Adv. 10, eadj7132. doi: 10.1126/sciadv.adj7132
Ruppert K. M., Kline R. J., Rahman M. S. (2019). Past, present, and future perspectives of environmental DNA (eDNA) metabarcoding: A systematic review in methods, monitoring, and applications of global eDNA. Global Ecol. Conserv. 17, 1–29. doi: 10.1016/j.gecco.2019.e00547
Santos M. B., Pierce G. J. (2003). The diet of harbour porpoise (Phocoena phocoena) in the Northeast Atlantic. Oceanography Mar. Biology: an Annu. Rev. 41, 355–390.
Silva J. D., Neilson J. D. (1985). Limitations of using otoliths recovered in scats to estimate prey consumption in seals. Can. J. Fisheries Aquat. Sci. 42, 1439–1442. doi: 10.1139/f85-180
Soininen E. M., Zinger L., Gielly L., Bellemain E., Bråthen K. A., Brochmann C., et al. (2013). Shedding new light on the diet of Norwegian lemmings: DNA metabarcoding of stomach content. Polar Biol. 36, 1069–1076. doi: 10.1007/s00300-013-1328-2
Spitz J., Mourocq E., Schoen V., Ridoux V. (2010). Proximate composition and energy content of forage species from the Bay of Biscay: high- or low-quality food? ICES J. Mar. Sci. 67, 909–915. doi: 10.1093/icesjms/fsq008
Spitz J., Ridoux V., Trites A. W., Laran S., Authier M. (2018). Prey consumption by cetaceans reveals the importance of energy-rich food webs in the Bay of Biscay. Prog. Oceanography 166, 148–158. doi: 10.1016/j.pocean.2017.09.013
Stavenow J., Roos A. M., Ågren E. O., Kinze C., Englund W. F., Neimanis A. (2022). Sowerby’s beaked whales (Mesoplodon bidens) in the Skagerrak and Adjacent waters: historical records and recent post-mortem findings. Oceans 3, 250–267. doi: 10.3390/oceans3030018
Stedt J. (2024). Porpoises and their prey - Diet and foraging behaviour of Belt Sea harbour porpoises (Lund: Doctoral dissertation for the degree of Doctor of Philosophy, Lund University).
Stedt J., Hamel H., Torres Ortiz S., Hojer Kristensen J., Wahlberg M. (2024). Harbour porpoises are flexible predators displaying context-dependent foraging behaviours. Ecol. Evol. 14, e70671. doi: 10.1002/ece3.v14.12
Stevenson M., Sergeant E. (2025). _epiR: Tools for the Analysis of Epidemiological Data_. R package version 2.0.80. Availlable online at: https://CRAN.R-project.org/package=epiR.
Svedäng H., Barth J. M. I., Svenson A., Jonsson P., Jentoft S., Knutsen H., et al. (2019). Local cod (Gadus morhua) revealed by egg surveys and population genetic analysis after longstanding depletion on the Swedish Skagerrak coast. ICES J. Mar. Sci. 76, 418–429. doi: 10.1093/icesjms/fsy166
Svedäng H., Svenson A. (2006). Cod Gadus morhua L. populations as behavioural units: inference from time series on juvenile abundance in the eastern Skagerrak. J. Fish Biol. 69, 151–164. doi: 10.1111/j.1095-8649.2006.01272.x
van der Loos L. M., Nijland R. (2021). Biases in bulk: DNA metabarcoding of marine communities and the methodology involved. Mol. Ecol. 30, 3270–3288. doi: 10.1111/mec.v30.13
van Elk C. E., van de Bildt M. W. G., van Run P., Bunskoek P., Meerbeek J., Foster G., et al. (2019). Clinical, pathological, and laboratory diagnoses of diseases of harbour porpoises (Phocoena phocoena), live stranded on the Dutch and adjacent coasts from 2003 to 2016. Vet. Res. 50, 88. doi: 10.1186/s13567-019-0706-3
van Zinnicq Bergmann M. P. M., Postaire B. D., Gastrich K., Heithaus M. R., Hoopes L. A., Lyons K., et al. (2021). Elucidating shark diets with DNA metabarcoding from cloacal swabs. Mol. Ecol. Resour 21, 1056–1067. doi: 10.1111/1755-0998.13315
Voelker M. R., Schwarz D., Thomas A., Nelson B. W., Acevedo-Gutierrez A. (2020). Large-scale molecular barcoding of prey DNA reveals predictors of intrapopulation feeding diversity in a marine predator. Ecol. Evol. 10, 9867–9885. doi: 10.1002/ece3.v10.18
Wijnsma G., Pierce G. J., Santos M. B. (2001). Assessment of errors in cetacean diet analysis: in vitro digestion of otoliths. J. Mar. Biol. Assoc. United Kingdom 79, 573–575. doi: 10.1017/S0025315498000733
Wisniewska D. M., Johnson M., Teilmann J., Rojano-Donate L., Shearer J., Sveegaard S., et al. (2016). Ultra-high foraging rates of harbor porpoises make them vulnerable to anthropogenic disturbance. Curr. Biol. 26, 1441–1446. doi: 10.1016/j.cub.2016.03.069
Xia Y., Li Y., Zhu S., Li J., Li S., Li X. (2020). Individual dietary specialization reduces intraspecific competition, rather than feeding activity, in black amur bream (Megalobrama terminalis). Sci. Rep. 10. doi: 10.1038/s41598-020-74997-8
Keywords: cetacean, dietary analysis, feeding ecology, methodology comparison, Phocoena phocoena, prey, stomach content, Sweden
Citation: Stedt J, Brokmar L, Neimanis A, Englund WF, Carlsson P and Roos A (2025) Combining DNA metabarcoding with macroscopic analysis increases the number of detected prey taxa in the estimated diet for harbour porpoises. Front. Mar. Sci. 12:1517330. doi: 10.3389/fmars.2025.1517330
Received: 25 October 2024; Accepted: 26 February 2025;
Published: 27 March 2025.
Edited by:
Xuelei Zhang, Ministry of Natural Resources, ChinaReviewed by:
Jianqing Lin, Shantou University, ChinaPavel Gol'din, National Academy of Sciences of Ukraine (NAN Ukraine), Ukraine
Eileen Heße, Wageningen University and Research, Netherlands
Copyright © 2025 Stedt, Brokmar, Neimanis, Englund, Carlsson and Roos. This is an open-access article distributed under the terms of the Creative Commons Attribution License (CC BY). The use, distribution or reproduction in other forums is permitted, provided the original author(s) and the copyright owner(s) are credited and that the original publication in this journal is cited, in accordance with accepted academic practice. No use, distribution or reproduction is permitted which does not comply with these terms.
*Correspondence: Johanna Stedt, am9oYW5uYS5zdGVkdEBiaW9sLmx1LnNl
†These authors share first authorship