
95% of researchers rate our articles as excellent or good
Learn more about the work of our research integrity team to safeguard the quality of each article we publish.
Find out more
ORIGINAL RESEARCH article
Front. Mar. Sci. , 27 March 2025
Sec. Physical Oceanography
Volume 12 - 2025 | https://doi.org/10.3389/fmars.2025.1516780
The renewal of bottom water masses in the deep South Adriatic Pit (SAP) is mainly determined by the arrival of very dense water that forms in the North Adriatic in winter (NAdDW) and which is transported into the SAP by gravity currents. To investigate the occurrence of these currents, we analyze high-frequency time series of thermohaline and velocity data at three moorings of the EMSO South Adriatic Sea regional facility, which consists of two observation areas: the SAP observatory (E2M3A) and the shelf and slope observatory (BB in the Bari Canyon and FF on the furrow area on the open slope), from 2012 to 2022, as well as reanalysis data from Copernicus over the same period. This analysis shows that gravity currents in the deep SAP (dSAP) only occurred in 2012, 2017, 2018, and 2022 (bottom ventilation years). The water masses were mixed differently after gravity current events, as 2012 was mainly driven by temperature, 2017 and 2022 by salinity, and 2018 by both. It was also found that in 2012 and 2018 the gravity current mainly passed through FF, while in 2017 it passed through BB. An analysis of the time scale showed that the average duration of the bursts of fluctuation triggered by the arrival of the gravity current in the dSAP was a few months (3 months on average). It was also revealed that the travel time from the formation of the NAdDW to BB was around 2 months on average, and that the travel time from BB (FF) to E2M3A was around 2 weeks. A comparison between the Copernicus reanalysis and the E2M3A time series also showed consistent differences in density, both in value and variability, resulting in the detection of gravity current events being unclear for the former.
The Adriatic Sea is a semi-enclosed basin of small size, 800 km long and 200 km wide. It is nevertheless a main driver for the eastern Mediterranean thermohaline circulation (Cushman-Roisin et al., 2001) due to the production of Adriatic deep waters (AdDW) (Ovchinnikov et al., 1985; Artegiani et al., 1997; Gačic et al., 2001; Mantziafou and Lascaratos, 2004; Chiggiato et al., 2016; Amitai et al., 2019). The generation of dense water masses in the Adriatic is linked to the cyclonic circulation, to the strong winter cooling by cold and dry katabatic Bora winds (Supić and Orlić, 1999), and to the inflow of saline waters through the Otranto strait. These saline water characteristics are modified by freshwater inflow, mainly through the Po River (Bensi et al., 2013). On a larger scale, it influences the Mediterranean climate (Gačić et al., 2010; Civitarese et al., 2023) and the water mass properties of the Atlantic Ocean, due to the outflow of dense waters at the Strait of Gibraltar (Bryden et al., 1994; Richardson et al., 2000; García Lafuente et al., 2007; García-Lafuente et al., 2009). More precisely, the outflow of generated dense waters through the Strait of Otranto is of great importance for both, the surface and deep layers of the Ionian Sea. It influences the BIOS mechanism, leading to the entrance of saltier (Levantine Intermediate Water, LIW) or fresher water (Atlantic Water, AW) into the Adriatic through the decadal variability between cyclonic and anticyclonic circulation of the northern Ionian gyre (Gačić et al., 2010; Civitarese et al., 2023).
The Adriatic Sea can be divided into three sub-basins: the northern one (less than 50 m deep), the middle one with the Jakuba pit (less than 270 m deep), and the southern one with the South Adriatic Pit (1200 m deep), which is separated from the Ionian Sea by the Otranto Sill (780 m). The deep layers of the South Adriatic Pit (SAP) are filled with the densest water masses, which can be formed locally by deep convection [see for example: (Killworth, 1983; Schott et al., 1996; Marshall and Schott, 1999; Testor et al., 2018)] or remotely by gravity currents (Benjamin, 1968; Simpson, 1982; Wirth, 2009; Chiggiato et al., 2016; Rétif et al., 2024) from the northern Adriatic, the North Adriatic Dense Waters (NAdDW), where shelf convection occurs (Vilibić et al., 2023). These water masses are also modified by mesoscale and submesoscale dynamics, turbulence, and double diffusive mixing (Amorim et al., 2024).
Once the dense water is formed, it flows southward as a gravity current, following isobaths on the western side of the Adriatic Sea (Vilibić et al., 2023). It splits during its way toward the Southern Adriatic, with a part filling the Jakuba pit in the Middle Adriatic (Artegiani and Salusti, 1987) and the other part flowing towards the SAP. Topographic features play a guiding role, especially the Bari canyon (Chiggiato et al., 2016; Paladini de Mendoza et al., 2022a), leading to down-slope cascading of dense water. Some of the dense water spills over the Otranto Strait into the Ionian basin (Bignami et al., 1990).
The role of gravity currents as compared to deep convection is of great importance, as the ventilation (transfer of properties such as dissolved oxygen from the surface to the interior of the ocean) of the deepest layers of the SAP is mainly caused by the former and only rarely by the latter (Gačić et al., 2002; Cardin and Gačić, 2003; Cardin et al., 2011; Bensi et al., 2014). Gravity currents flowing into the SAP do not occur every year, as this depends on the interplay between different forcing conditions mentioned above, but also on the existing stratification, which is the result of previous intermittent gravity current events and convection events on the one hand and long-term vertical diffusion on the other (Cardin et al., 2020b).
In this study, we present an analysis of occurrences of gravity currents reaching the dSAP between 2012 and 2022 using time series data obtained from the South Adriatic EMSO regional facility (http://emso.eu/observatories-node/south-adriatic-Sea/) supplemented by data from Copernicus Marine Service. The description of methodology and data used is presented in section 2, while results and discussions are described in section 3. Conclusions are given in section 4.
The data analyzed come from the South Adriatic regional facility, which is part of the EMSO-Eric observation network consisting of two sites, one of which is located in the center of the SAP (E2M3A-position: Lat 41.53°N, Lon 18.06°E, see Figure 1) and the other consisting of two moorings on the western side of the southern Adriatic continental edge (mooring BB-position Lat 41.34°N, Lon 17.19°E and FF-position Lat 41.81°N, Lon 17.04°E, see Figure 1). The combination of data collected at these three moorings allows us to observe the flow of gravity currents in the SAP after the dense water formation in the northernmost part of the Adriatic Sea. The monitoring strategy set up for the southern Adriatic observatory is based on continuous and high-frequency measurements of temperature (T), salinity (S), oxygen (O) and velocities, which are suitable for detecting both long-term changes, episodic processes over decades (Cardin et al., 2020b), and high-frequency processes (1h) such as waves and turbulence.
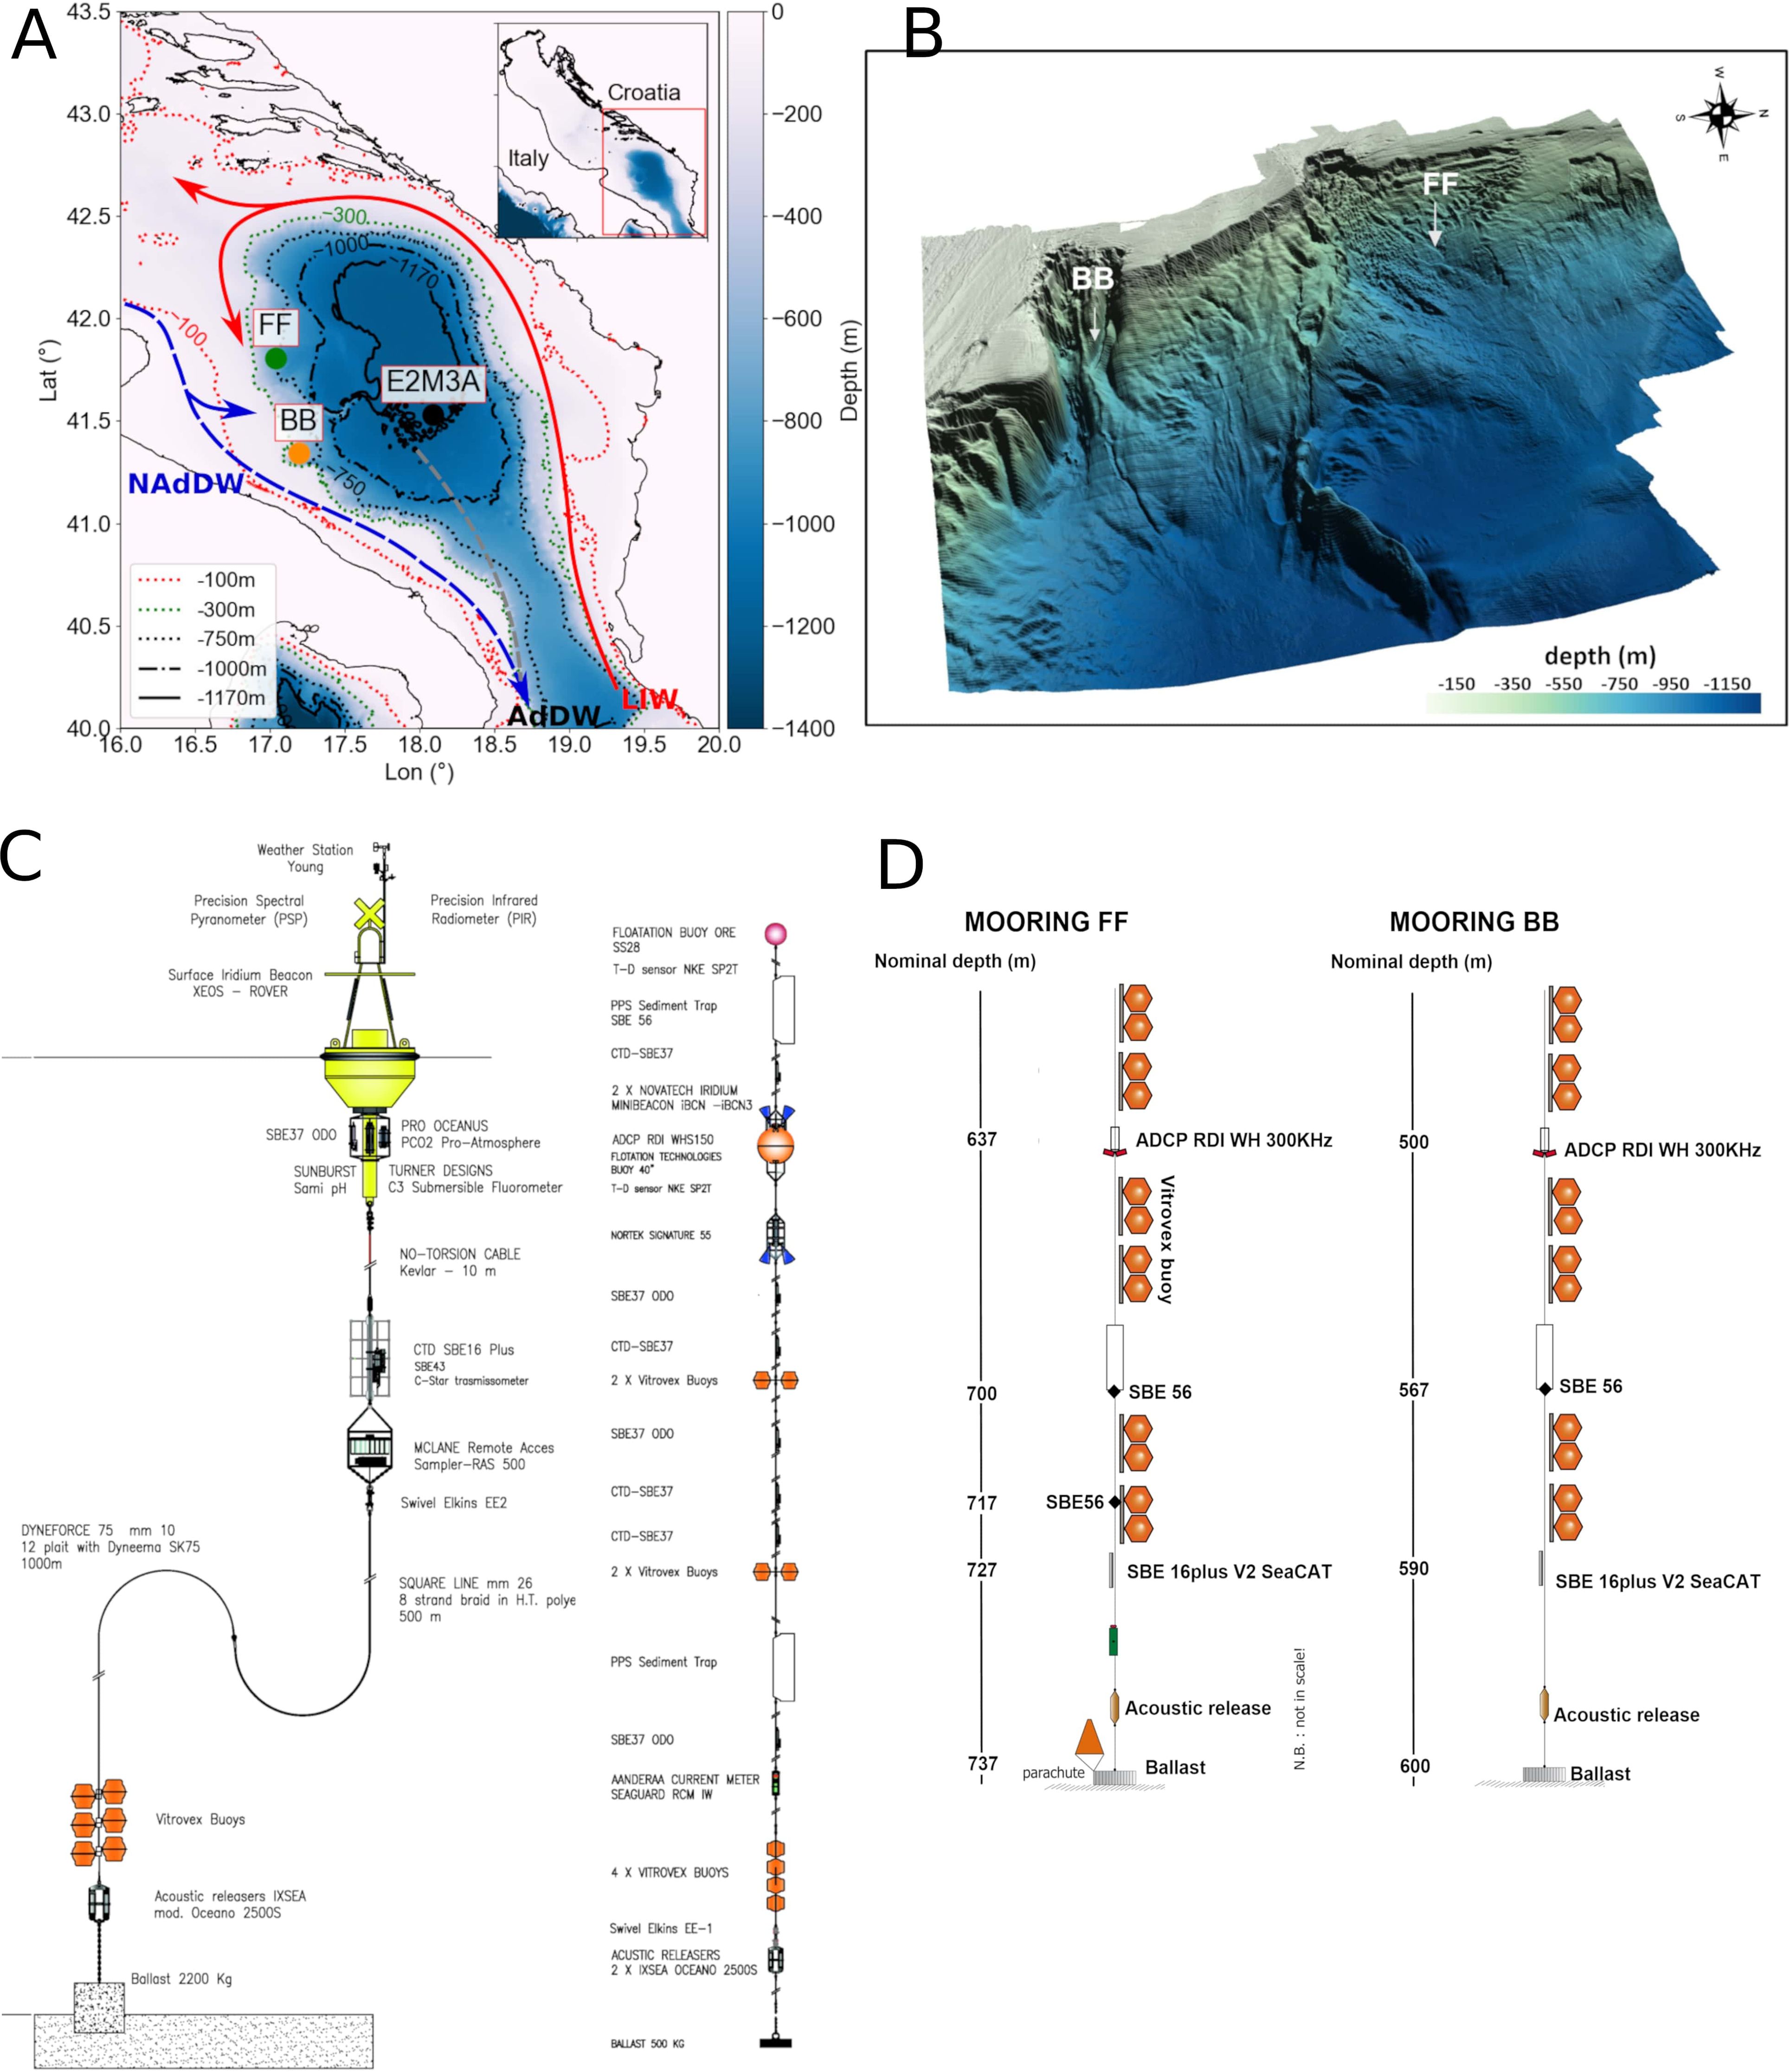
Figure 1. Bathymetric map of the Adriatic Sea showing the locations of moorings EMSO-E2M3A, BB, and FF, and the main water masses pathways, the Levantine Intermediate Water (LIW), the North Adriatic Dense Water (NAdDW), and the Adriatic Deep Water (AdDW). (A) A zoom on the area near the Bari canyon, where BB and FF moorings are located, is shown in (B). Moorings of the South Adriatic regional facility, EMSO-E2M3A, EMSO-BB, and EMSO-FF, are presented in (C, D), respectively.
The E2M3A observatory, which has been in operation since 2006 (Bensi et al., 2014; Cardin et al., 2014a, 2015, 2018, 2020b, 2020a, 2024; 2025; Amorim et al., 2024), collects hourly data of T, S and O at seven different levels of the water column (150, 350, 550, 750, 900, 1,000 and 1,200 dbar). In this study, we focus on the period from December 2011 to December 2022 (a period in which the availability of data is greatest for the three moorings combined) for the deepest layers of the pit.
The mooring BB is placed at 600 m depth on the main branch of the Bari Canyon system and FF on the furrow area on the open slope at 733 m depth (Paladini de Mendoza et al., 2022b, 2024a, 2024b). The two mooring lines are 100 m long, have been in operation since 2012, and collect half-hourly T, S, and current data at different levels of the water column. The Teledyne RD Workhorse 307KHz ADCP in downward-looking mode measures the currents of the last 100 m near the seafloor every 30 min with an accuracy of ±0.5 cm s−1 and a resolution of 0.1 cm s−1. The ADCP is a four-beam, convex configuration with a beam angle of 20°, and the number of depth cells is set to 27 with a cell size of 4 m. A CTD probe, SBE 16plus V2 SeaCAT, is located approximately 10 m above the seafloor to record thermohaline parameters. The water conductivity data were measured with a sensor with an accuracy of 5 × 10⁻⁴ Sm−1 and a resolution of 5 × 10⁻⁵ Sm−1; the water temperature was measured using a thermometer, with an accuracy of 5 × 10⁻³ °C and a resolution of 1 × 10⁻⁴ °C. The moorings are also equipped with a temperature sensor SBE56 (accuracy ±2 × 10⁻³ °C and 1 × 10⁻⁴ °C resolution), which is installed in FF at a height of 37 and 20 m from the seabed and in BB at a height of 33 m from the seabed.
In this study, we consider the potential temperature (θ) and S; θ was derived using the Gibbs Seawater GSW Oceanographic Toolbox, which contains the TEOS-10 routines (McDougall and Barker, 2011). The Python language was used in this study through several libraries: the Numpy module (Harris et al., 2020), the Pandas module (McKinney, 2010), the Scipy module (Virtanen et al., 2020), and the StatsModels module (Seabold and Perktold, 2010). We used the Matplotlib module (Hunter, 2007) to display the results.
Quality control of the E2M3A mooring data used in this study was performed in several steps according to the RITMARE Fixed Sites Network Procedures Quality Control (QC) guide (Cardin et al., 2014b) & OceanSites QC procedures: a physical range to remove outliers, a spike test to remove large differences between sequential measurements, a change test to check the rate of change over time, and an interpolation to fill gaps no longer than 6h. The salinity threshold of (Cardin et al., 2014b) was modified because of the increase of S in the Southern Adriatic (an increase of θ is also observed).
Additionally, the application of this standard QC, trends, and offsets present in the time series were corrected with CTD casts performed at the E2M3A site, the majority of which were realized during maintenance cruises. Trends were corrected taking into account the general trend in the area (global increase of θ and S) while offsets due to instrument errors were subtracted from the time series.
Finally, as far as BB and FF moorings are concerned, the quality of the data is ensured by regular maintenance operations during which instruments and the components of the moorings are checked to ensure their functionality, durability, and resistance during the survey period. In addition, the instruments are regularly calibrated at the factory and compared with the CTD calibrated on board, as described in (Paladini de Mendoza et al., 2022a). QC of the currents and thermohaline data of the BB and FF moorings used in this study was performed in several steps according to the procedure described in the “Data Quality Check” paragraph of (Paladini de Mendoza et al., 2022a).
The properties of the water masses in the dSAP are modified by the arrival of gravity currents. If the mixing is turbulent and the gravity current passes through BB or FF or both, with no other source, the resulting water mass (after the arrival) is formed by the weighted average of BB, FF, and dSAP waters (before the arrival) at ratios R. Due to the conservation of salt and heat, we have:
Subscripts BB and FF stand for the properties at the two moorings, while subscripts b and a stand for the properties in the dSAP before and after the arrival of dense waters, respectively. Potential temperatures (salinities) θBB, θFF (SBB, SFF) are averaged over six days around the day of maximum density, while θb, θa (Sb, Sa) are averaged over two weeks, from three to one week before the arrival of the gravity current for the former and from one to three weeks after its arrival for the latter. The mixing ratios (RBB, RFF, and Rb) are positive constants that indicate the proportion of the corresponding water mass in the resulting water mass, and their sum is therefore equal to 1. This means that the point in the θ/S diagram that represents the situation after the fluctuations must lie within the triangle formed by the water masses at BB, FF and in the dSAP before the gravity current arrives.
In this study, we considered hourly data from an upward-looking RDI ADCP positioned at the bottom of the BB mooring and data from a point current meter Aanderaa Seaguard Recording Current Meter (RCM) positioned near-bottom layer (1,166 m) of the SAP (E2M3A). The ADCP velocity data were decomposed into u and v components and represented in a coordinate system with one axis along the direction of the major variance corresponding to the canyon axis (downward flow component). The canyon axis of the main variance forms an angle of 110° with true north in the clockwise direction. To determine the characteristics and the number of days with gravity currents and the paths, we construct an index Nv along the downward axis, which is the number of hours in a day when the velocity in the canyon exceeds a threshold value (0.17 ms−1). We consider days on which Nv > 6. This allows us to quantify the limits of the pulse regime observed in the velocity time series. To the E2M3A speed data, a moving averaged filtered with a time window of 7 days was applied to determine the onset of gravity current. The result was then compared to the annual maximum potential density anomalies (PDA) values in the North Adriatic.
We define the temporal variability of a variable X based on a centered sliding-mean:
with Δt = 20 days, a period which is a compromise between smoothing the signal and keeping the relevant information for our study (the order of magnitude of the time scales we are studying is greater than 2 weeks). The normalization of a variable X is done by:
where 〈X〉 and σ (X) are respectively the mean and the standard deviation of X over the whole dataset.
To identify strong fluctuation, we use 6 criteria. The first two are: for the PDA and oxygen. The e third is based on the differences of the PDAs at BB and FF: if the water masses at both locations come from the same generation site, their density should be similar, i.e. with , where ρFF and ρBB are PDA at FF and BB mooring, respectively. If the water masses either at FF or BB or both are to reach the bottom of the pit (fourth criteria), their PDA must exceed the PDA in the pit, i.e., ρFF > ρE2M3A or ρBB > ρE2M3A with ρE2M3A the PDA at E2M3A mooring. A fifth criteria involving the PDA of water mass generated in the North Adriatic is described in subsection 3.2 and a sixth one involving an analysis of mixing ratio between incoming and the already present water mass in the dSAP is presented in subsection 3.4. The years that satisfy all the criteria are named “bottom ventilation years.”
Copernicus reanalysis data for the Mediterranean Sea and ERA-5 datasets from the Copernicus-ECMWF portal were used to assess the surface heat fluxes and the influence of salinity on the formation of dense water and the thermohaline properties of the water masses in the three sub-basins of the Adriatic Sea (North, Middle, and South).
Net surface heat fluxes were derived using hourly ERA-5 datasets of Copernicus-EMCWF (European Centre for Medium-Range Weather Forecasts, https://doi.org/10.24381/cds.adbb2d47) portal [Qtot; (Herbasch et al., 2020; Hersbach et al., 2023)] on three different areas: North, Middle and South Adriatic. We used data from 1979 to 2022. The total surface heat flux:
is the sum of (from left to right) the short-wave radiation, the long-wave radiation, the latent heat flux, and the sensible heat flux. The data is sampled hourly, but in our study we use daily averages. The resolution of the grid is 0.25°. We consider a spatial average over each of the three basins from December to March (winter period) and derive the monthly integrated surface heat flux for each month of this period.
The thermohaline properties of the water masses (S and θ) on the North Adriatic region are obtained from the Copernicus database (https://doi.org/10.25423/CMCC/MEDSEA/_MULTIYEAR_PHY_006_004_E3R1I) (Escudier et al., 2020; Nigam et al., 2021; Escudier et al., 2021). The data have a daily frequency and a horizontal grid resolution of 0.042°. Salinity is averaged over the 10 upper meters of the water column (and also over the entire water column in the Supplementary Figure S6), and we also consider monthly averages for salinity during the winter period. We use a dataset running from 2011 to 2022.
The PDA values are derived from daily S and θ datasets using the Gibbs Seawater (GSW) Oceanographic Toolbox, which includes the TEOS-10 routine (McDougall and Barker, 2011). We present PDA values corresponding to the mean of the PDA values in the upper 10 m of the water column.
Three-dimensional velocities were also obtained from the Copernicus database (https://doi.org/10.48670/moi-00021) (EU Copernicus Marine Service Information, 2024). The data considered are from 2012/01/01 to 2021/06/30. They have a daily frequency and a horizontal grid resolution of 0.083°. We consider an average of velocities at 1063 m corresponding to nodes of the model closer in latitude and longitude than 0.1° to the E2M3A position (four nodes).
The water masses in the SAP area are modified by advection, convection, gravity current, and/or salt fingering occurring at the basin scale, mesoscale, submesoscale, or even microscale. Historically, (Lipizer et al., 2014) has observed through a climatology analysis using all available data an increase relative to the time series in salinity and temperature of +0.18 and +0.54°C, respectively in the dSAP over the period 1911–2009, while (Vilibić et al., 2023), using cruises CTD data and Argo floats, reported an acceleration of this increase during the period 2007-2022 of 0.2 and 1°C, respectively. High-frequency data measured at the E2M3A also show an increase in potential temperature by +0.69°C and in salinity by +0.17 in the period from 2012 to 2023 (Figure 2). In addition, a shift in salinity distribution occurred in 2017 with a sharp increase at the surface and in the intermediate layers, which reduced the stability of the vertical stratification and led to a two-layer structure with a pycnocline at 950 m (Amorim et al., 2024). In fact, (Amorim et al., 2024) reported a change in regime stability after winter 2017. Gravity currents that bring dense water into the deepest part of the pit maintain this two-layer structure, increasing the density of bottom water masses.
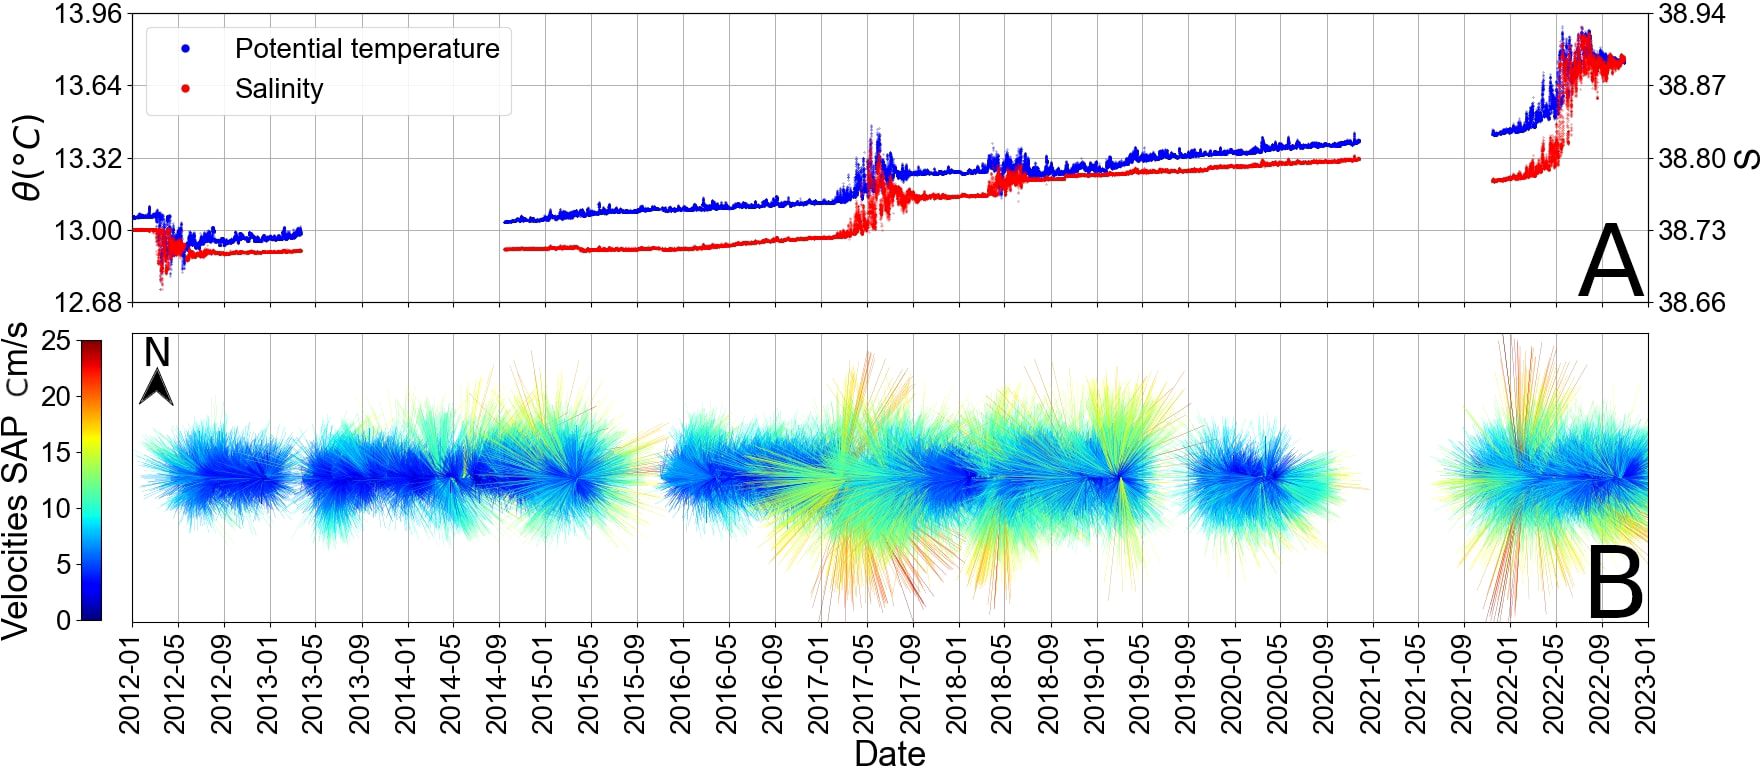
Figure 2. Time series of θ (A), S, and velocities (B) at E2M3A regional facility (1200 m deep). Velocities are represented on a stick diagram where the sticks direction are computed according to the true North, which is oriented vertically at the top of the figure.
The time series of S, θ, PDA, and O in the dSAP all show bursts of strong fluctuations that start in the late winter period in 2012, 2017, 2018, and 2022 and can be characterized by the fluctuation index defined in subsection 2.1.4 (see Figure 3). The strong fluctuations of oxygen during bottom ventilation years provide information about the ventilation that took place in the dSAP, as mentioned by (Gačić et al., 2002; Cardin et al., 2011; Bensi et al., 2014; Cardin et al., 2020b; Amorim et al., 2024). They cannot be the result of a deep convection event, as convection, during the studied period, never reached 900 m and could then not destroy the two-layer structure that was mentioned in (Amorim et al., 2024). The ventilation of the deep layer is therefore due to gravity currents. Here, we argue that the strong fluctuations are the result of gravity currents of North Adriatic origin entering the dSAP along the topography and accumulating there (Bensi et al., 2013; Mihanović et al., 2018), where it is subject to local mixing processes. The next gravity current arrives a year or a few years later.
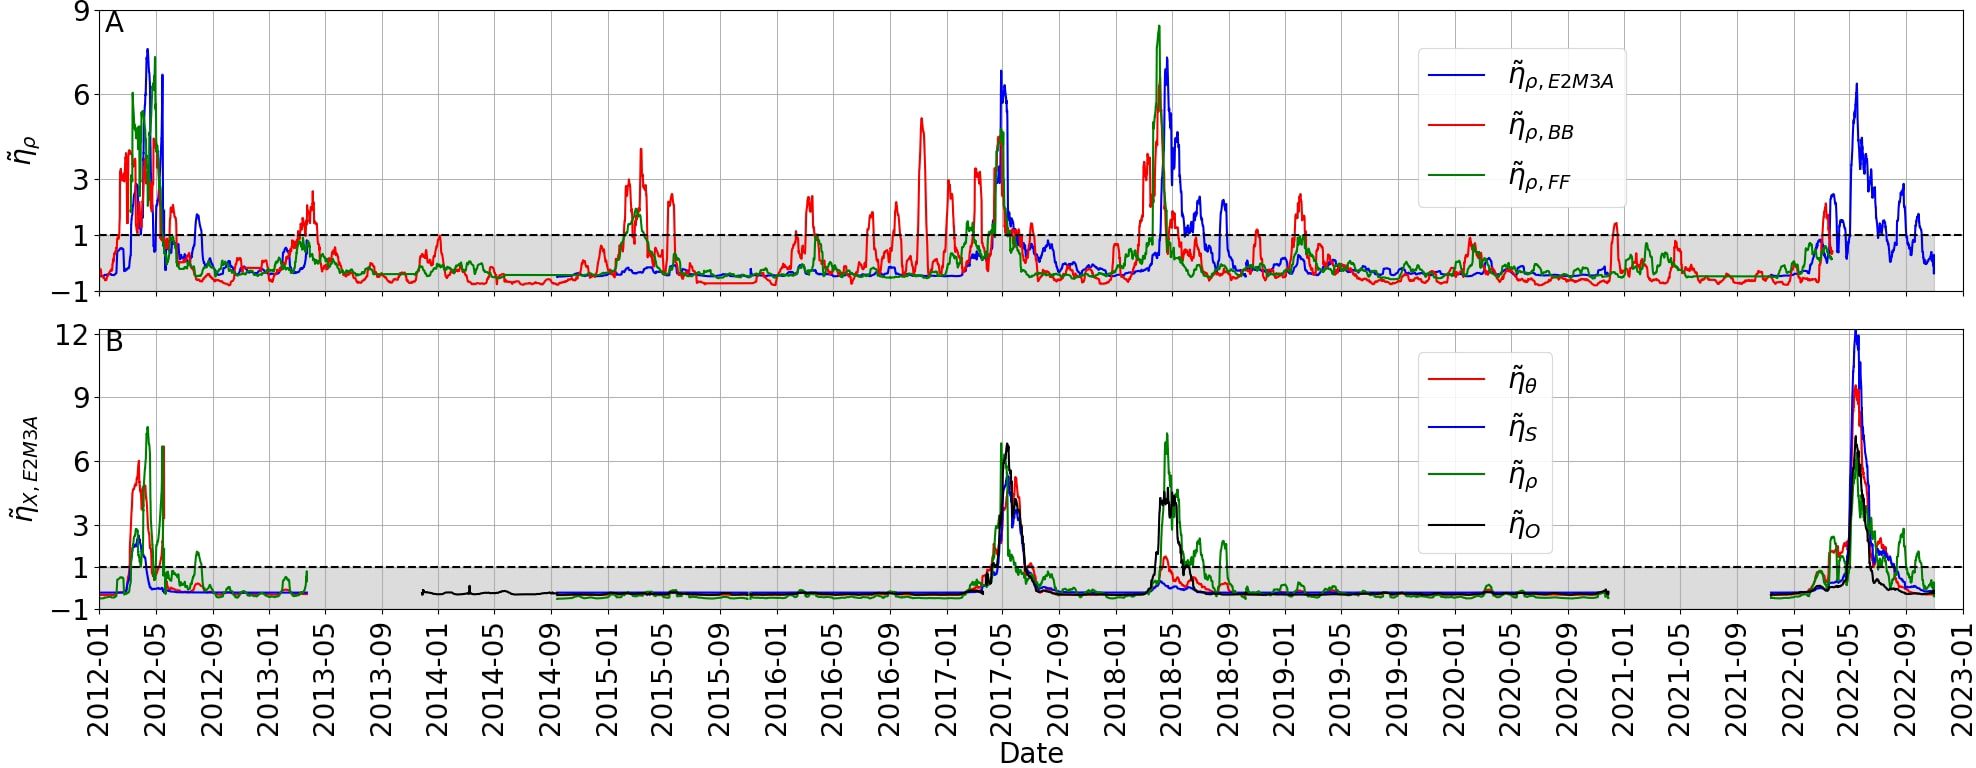
Figure 3. Time series of at E2M3A (blue), BB (red) and FF (green) (A) and time series of (red), (blue), (green) and at E2M3A (B). On (A) we observe that strong fluctuations are present in 2012, 2017, 2018 and 2022 at E2M3A, BB and FF but BB and FF also exhibits strong in 2013, 2015, 2016, 2019 and 2021. On (B) a consistency on the time of maximum fluctuations between the different scalar variables measured at E2M3A is observed.
Bursts of fluctuations of PDA at BB and FF are indicators of bottom ventilation of the SAP. If the water masses transported by these gravity currents are dense enough, they proceed to the dSAP, leading to turbulent mixing. In Figure 3 (and in Supplementary Figure S1 for SBE56 fluctuations at BB or FF in 2022), we observe that in 2012, 2017, 2018, and 2022, bursts of PDA fluctuations at BB were followed by bursts of fluctuations at the E2M3A mooring. The same applies to the FF mooring. The 15-day averages of PDA at the three moorings show a sawtooth behavior with a sudden increase in PDA, followed by a period of relaxation (Figure 4). This sawtooth behavior is also discussed by (Querin et al., 2016; Cardin et al., 2020b) for the SAP and by (Mihanović et al., 2018) for the Jakuba pit. Querin et al. (2016) and Cardin et al. (2020b) explained this phenomenon as follows: the first phase consists of a linear density decrease in the SAP, which is due to local mixing driven by flow instabilities and mesoscale turbulence generated by the large-scale cyclonic circulation of the South Adriatic sub-basin. In contrast, the second phase consists of the abrupt increase of density, which is the result of gravity currents transporting NAdDW formed during the strongest winters. The second phase effectively ventilates the dSAP, which remains unventilated during the first phase. The saw-tooth behavior for oxygen observed at E2M3A was explained by Marini et al. (2006) for the Jakuba pit, where bottom water masses lose oxygen between two ventilation events due to mineralization, while nutrients increase. Martellucci et al. (2024) also observed the same saw-tooth behavior of oxygen at the BB mooring during the 2017, 2018, and 2019 ventilation events where dissolved oxygen increased to more than 235 µmolkg−1.
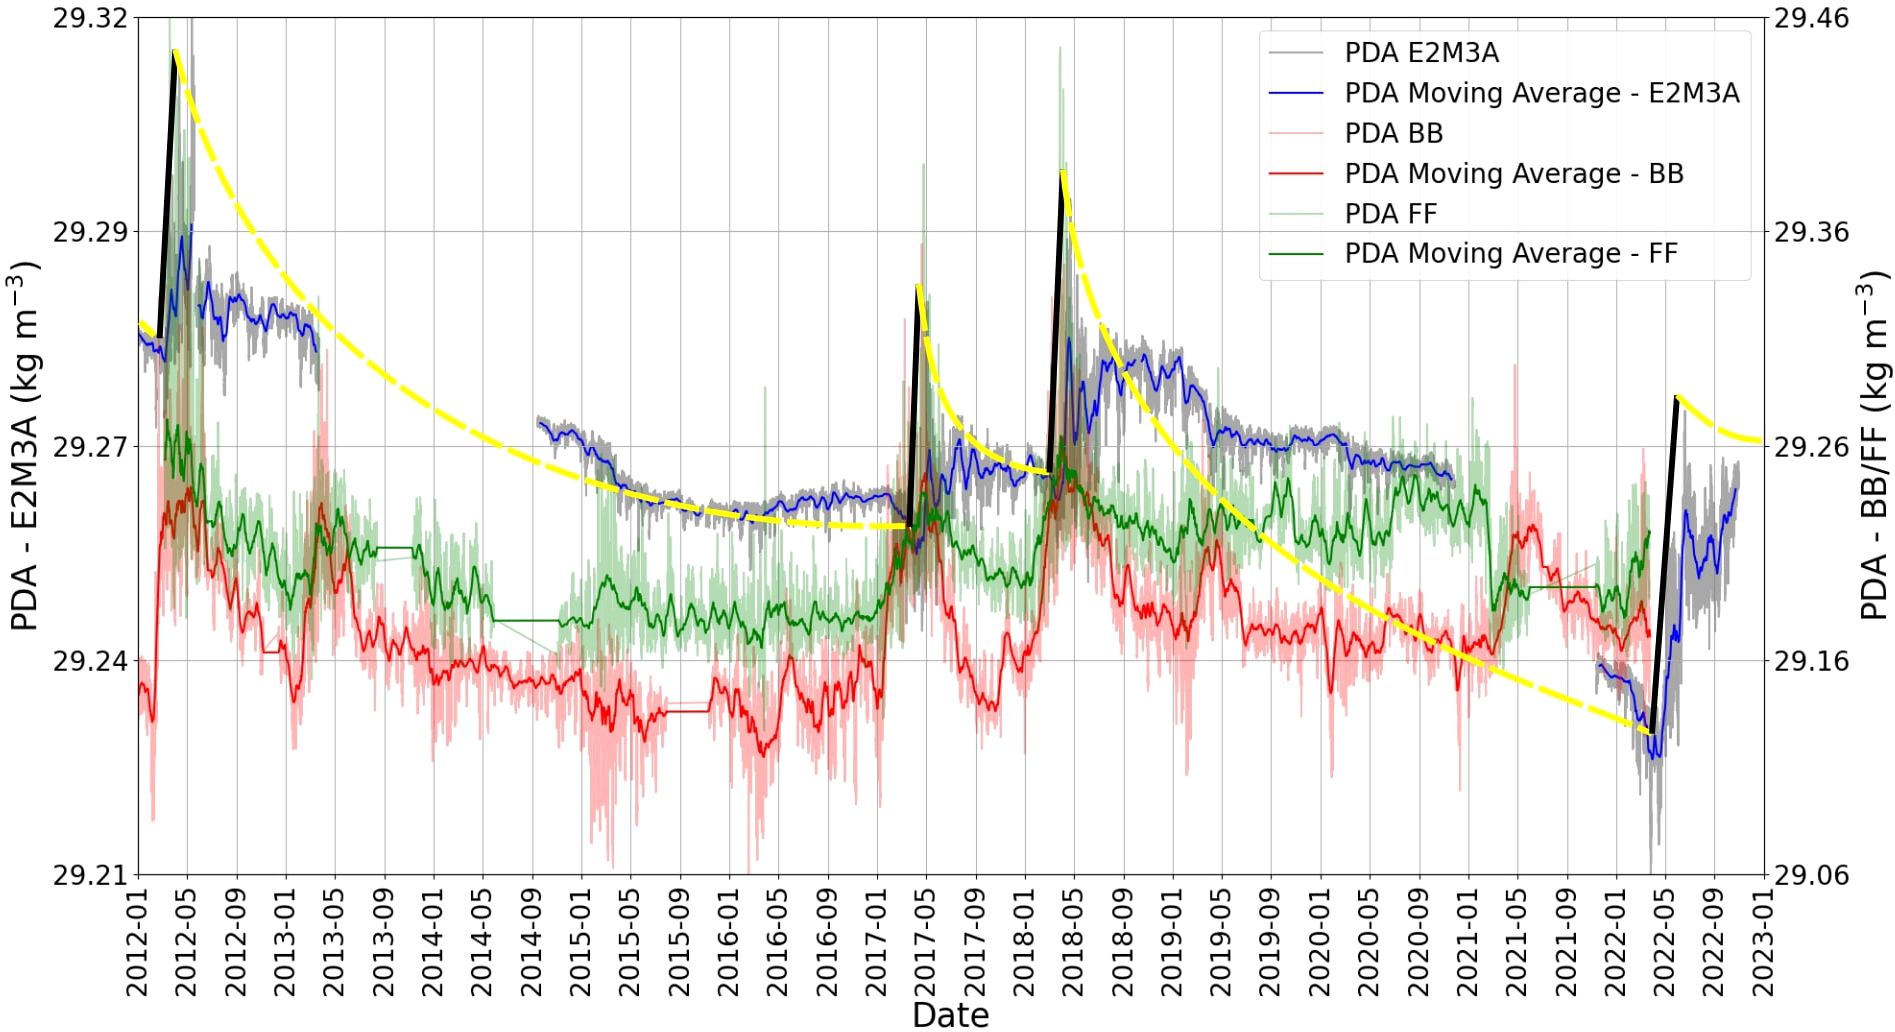
Figure 4. PDA time series at E2M3A (blue), BB (red), and FF (green). Bold red, blue, and green lines are 15 days moving averages. The saw-tooth behavior is defined by an abrupt PDA increase (black lines) followed by a slower PDA decrease (yellow lines). Bottom ventilation years are years when the density differences between BB and FF are small (criteria 3), where density at BB and/or FF is greater than the density at E2M3A (criteria 4).
Table 1 shows that the years in which all criteria are confirmed are 2012, 2017, 2018, and 2022 (fluctuations at BB and FF for T can be seen in Supplementary Figure S1). The occurrence of gravity currents in two consecutive years (2017/2018), as compared to a five-year period (Querin et al., 2016; Cardin et al., 2020b), possibly indicates an exceptional period of water mass changes for the south Adriatic, as mentioned by (Vilibić et al., 2023; Amorim et al., 2024).
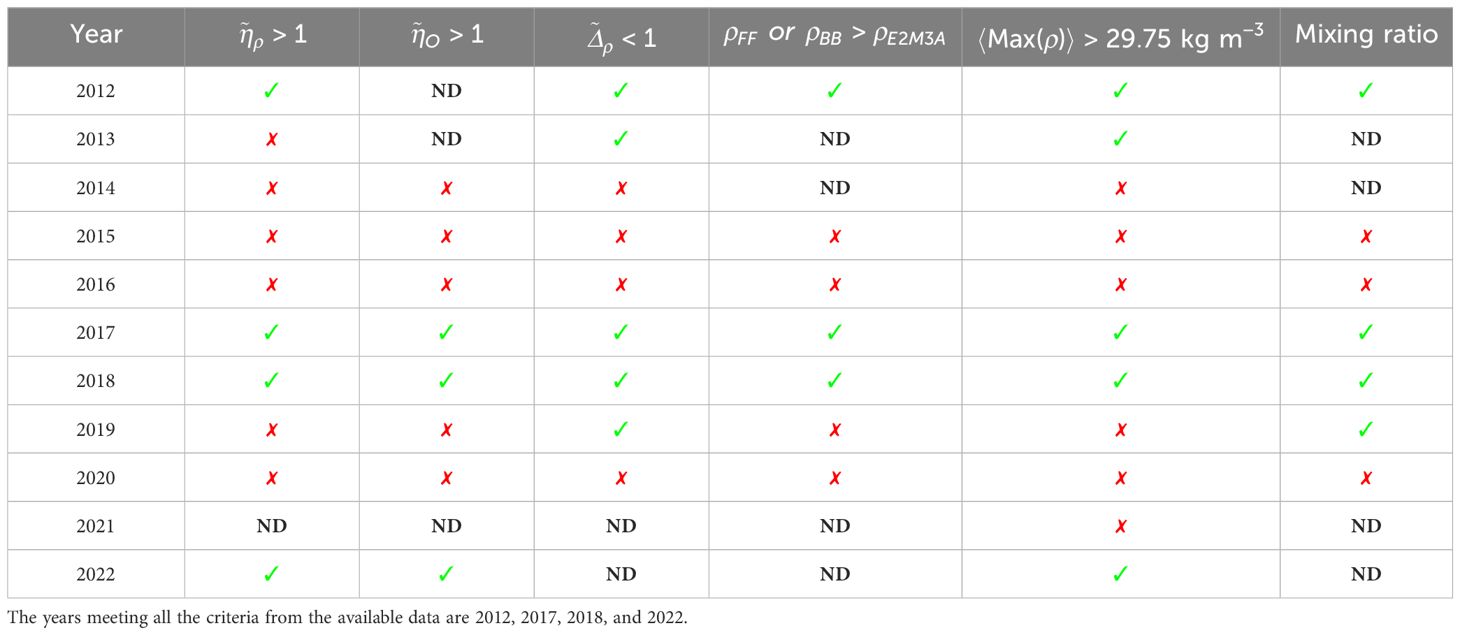
Table 1. Fluctuations criteria (No Data at E2M3A, BB or FF is symbolized with ND, a non-verified criterion with ✗, and a verified one with ✓) for the 1200 dbar layer.
Exceptional PDA fluctuations are observed in 2015, 2016, 2019, and 2021 in BB and FF, but no remarkable fluctuations were observed in the dSAP (Figure 3), which is due to the fact that the water in BB and FF was not dense enough to reach the bottom (Figure 4). We observed nevertheless fluctuations in the upper layer (900 and 1,000 dbar) (not discussed in the article). These waters intrude the pit at a higher level (measured at about 900 dbar, not discussed here). For instance, Martellucci et al. (2024) observe a lighter NAdDW than usual in 2015 and 2016 that filled the intermediate layer of the SAP. In 2013, strong fluctuations were also reported at BB and FF, but in the absence of data at E2M3A this year, no conclusion can be drawn about the presence of a gravity current reaching the dSAP or intruding at higher levels. As for the other years, none of the criteria were met in 2014 and 2020 (Table 1) and no significant fluctuations are observed in neither in BB nor in FF (Figure 3).
Pulses of dense water in the dSAP due to gravity currents are associated with the generation of NAdDW in the North Adriatic during winter periods, as shown by Di Biagio et al. (2023), where a moderate correlation (0.68) between the high concentration of dissolved oxygen in the deeper layers of the SAP with the intermittent inflow of NAdDW was found for the period 2012-2014. Evidence for the arrival of these dense water pulses is associated with the high concentration of dissolved oxygen, as mentioned by Manca et al. (2006). To determine this arrival, we compare the annual variability of PDA maxima in the North and Middle Adriatic with the gravity current events observed in the dSAP. To do so, we used PDA derived from conservative temperature (CT) and absolute salinity (SA) (which are calculated using Copernicus T and S data, see Figure 5) for the entire Adriatic Sea and determined the area where the NAdDW formed and the date of the PDA maximum. We considered a two-week centered mean around this date for the North-Middle Adriatic surface waters with a threshold of minimum water PDA to be able to reach the dSAP, which is the minimum value registered at the E2M3A bottom ventilation years, as will be discussed in the next paragraphs.
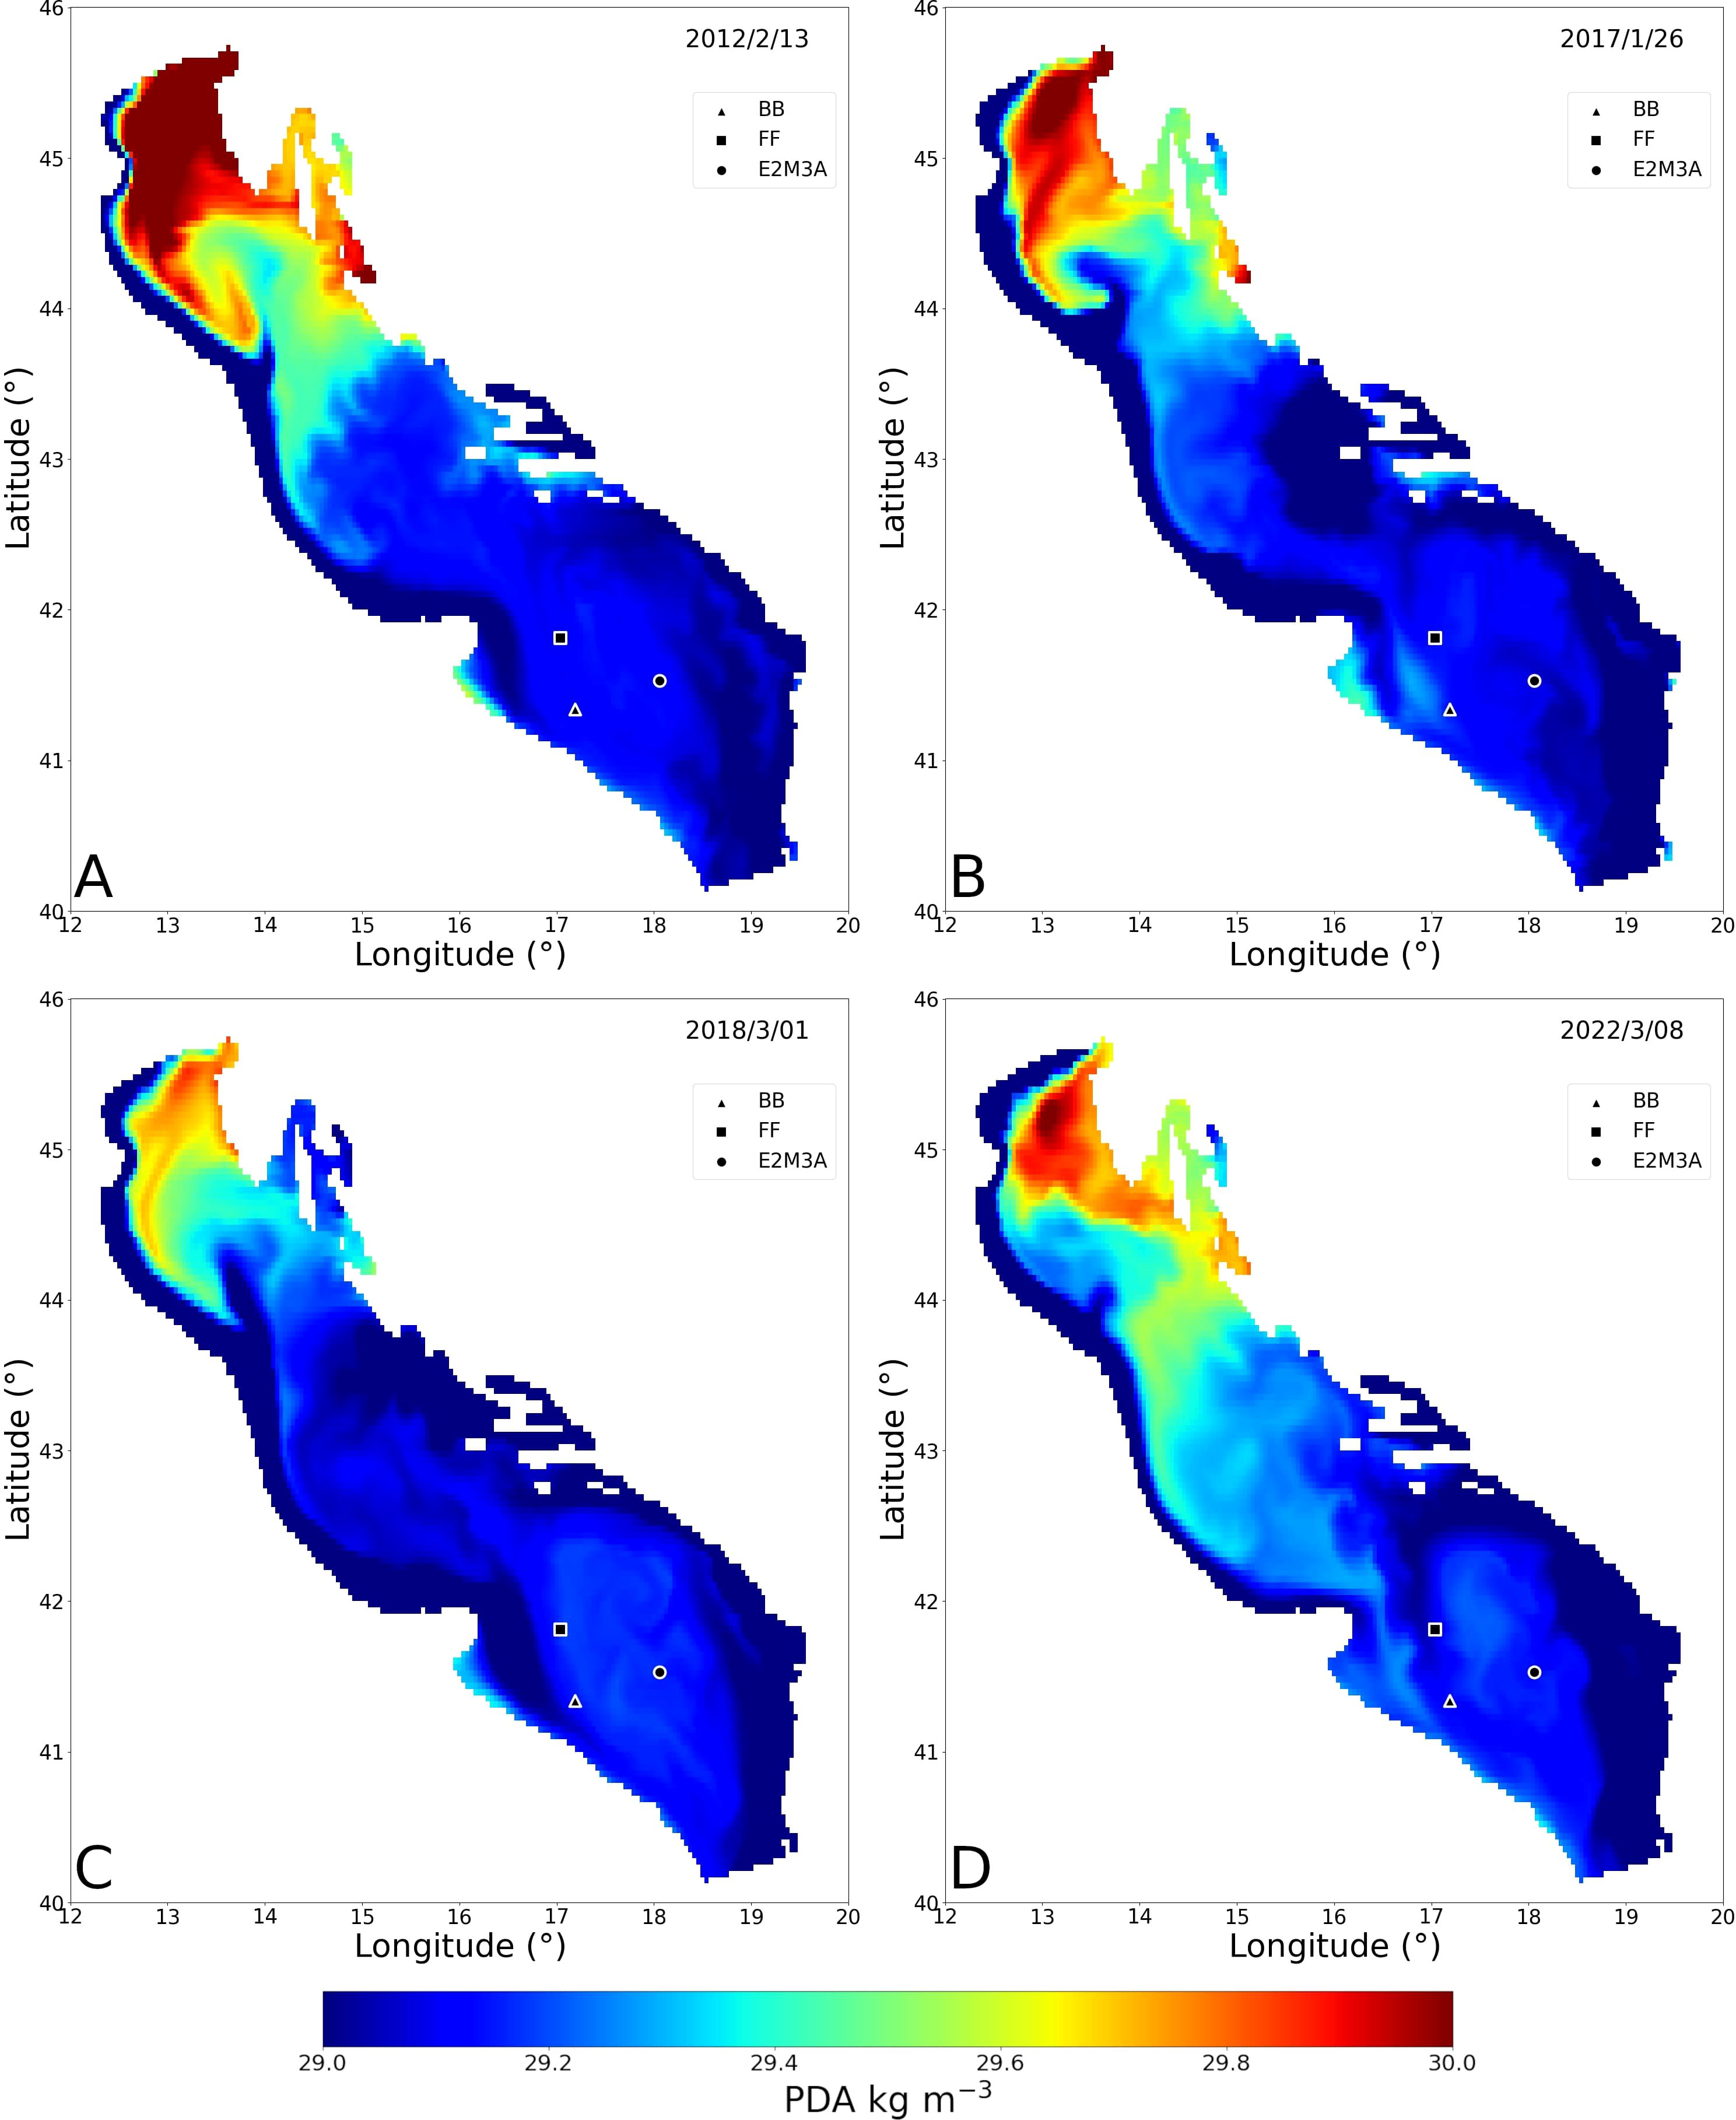
Figure 5. PDA map for dates when PDA is maximum in North and Middle Adriatic, for the bottom ventilation years: 2012 (A), 2017 (B), 2018 (C) and 2022 (D). We observe PDA values up to 30 kg m−3 and a tendency of the highest PDA to be located in the northernmost part of the Adriatic Sea. Due to the cyclonic circulation, dense water at the surface moves southward on the western side.
Results show that a gravity current event is detected in the pit when this criterion (Equation 2) is verified. Several years meet this criterion: 2012, 2017, 2018, and 2022 (bottom ventilation years) and 2013. These results are consistent with (Neri et al., 2022) who found NAdDW signatures with PDA values above 29.2 at bottom depth (between 40 and 60 m) at the sampling station SG05 (about 30 km from the coast near Senigalia) during the winters of 2012, 2017, and 2018. During these years, most of the water column was characterized by pools of waters with S above 38.5. In addition, (Mihanović et al., 2018) reported a maximum of PDA around mid-February in 2012 along the western Adriatic shelf, a result consistent with Table 2.
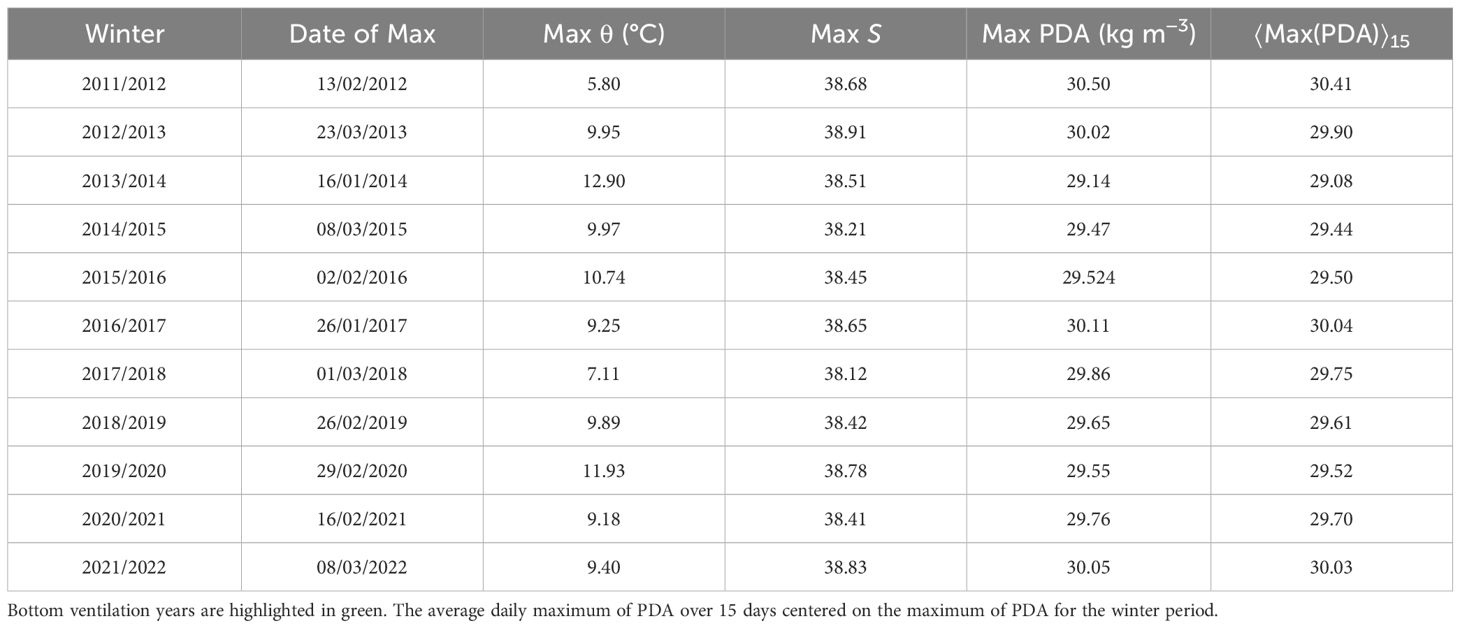
Table 2. Maximum of densities in the North/Middle Adriatic for the different winters, with the corresponding salinities and potential temperatures.
Nevertheless, the reduction in the density of the NAdDW due to mixing on the way south also plays an important role in the cascading of gravity currents in the dSAP. Therefore, an estimate of this reduction was made for bottom ventilation years (Table 2; Figure 4), which in 2012 amounted to 1.18 kg m−3, 0.83 kg m−3 in 2017, 0.56 kg m−3 (minimum value) in 2018 and 0.76 kg m−3 in 2022. Looking at the moving centered average of the speed with a window of 7 days (not shown here) at the current meter at E2M3A (Figure 2), it can be seen that the highest values correspond to years with bottom ventilation, with the minimum at 13.89 cm s−1, which corresponds to the value for the minimum density reduction found in 2018. Other bottom ventilated years depict higher velocities, such as 17.98 cm s−1 in 2017 and 15.65 cm s−1 in 2022. This indicates that the higher the turbulence level and mixing, the higher the speed in the dSAP.
The dense water formed during the bottom ventilation years also varies in its physical properties (Table 2). While in 2012 a rather low θ value (5.80°C) and a high S value (38.68) defined the water mass at the time and place of maximum PDA formation, in 2017 and 2022 salinity played a more important role (38.65 and 38.83 respectively and θ around 9°C). In 2018, the situation between the two parameters as driving factors is more balanced. Potential temperature of 7.11°C is between the values of 2012 and 2017/2022 with the lowest S value among the four bottom ventilation years (38.12). This observation agrees with (Supić and Vilibić, 2006) who stated that some years are dominated by either low T or high S values, but there are also years when the situation is more complicated and both parameters contribute.
Dense water formation is driven by heat loss and the preconditioning phase of the water column. We investigate the influence of these factors on the formation of NAdDW, firstly calculating the monthly average values of the integrated surface heat fluxes for the North, Middle, and South Adriatic Figures 6, 7 (delimitation of these three regions is shown in the Supplementary Figures S2–S4). In the following, we determine the annual variability of spatially and monthly integrated surface heat fluxes by normalizing it, taking into account all available data sets (1979–2022) from ERA-5 (Hersbach et al., 2023; Herbasch et al., 2020). We define 〈Qm〉 the average over all the years of the surface heat flux for the month m:
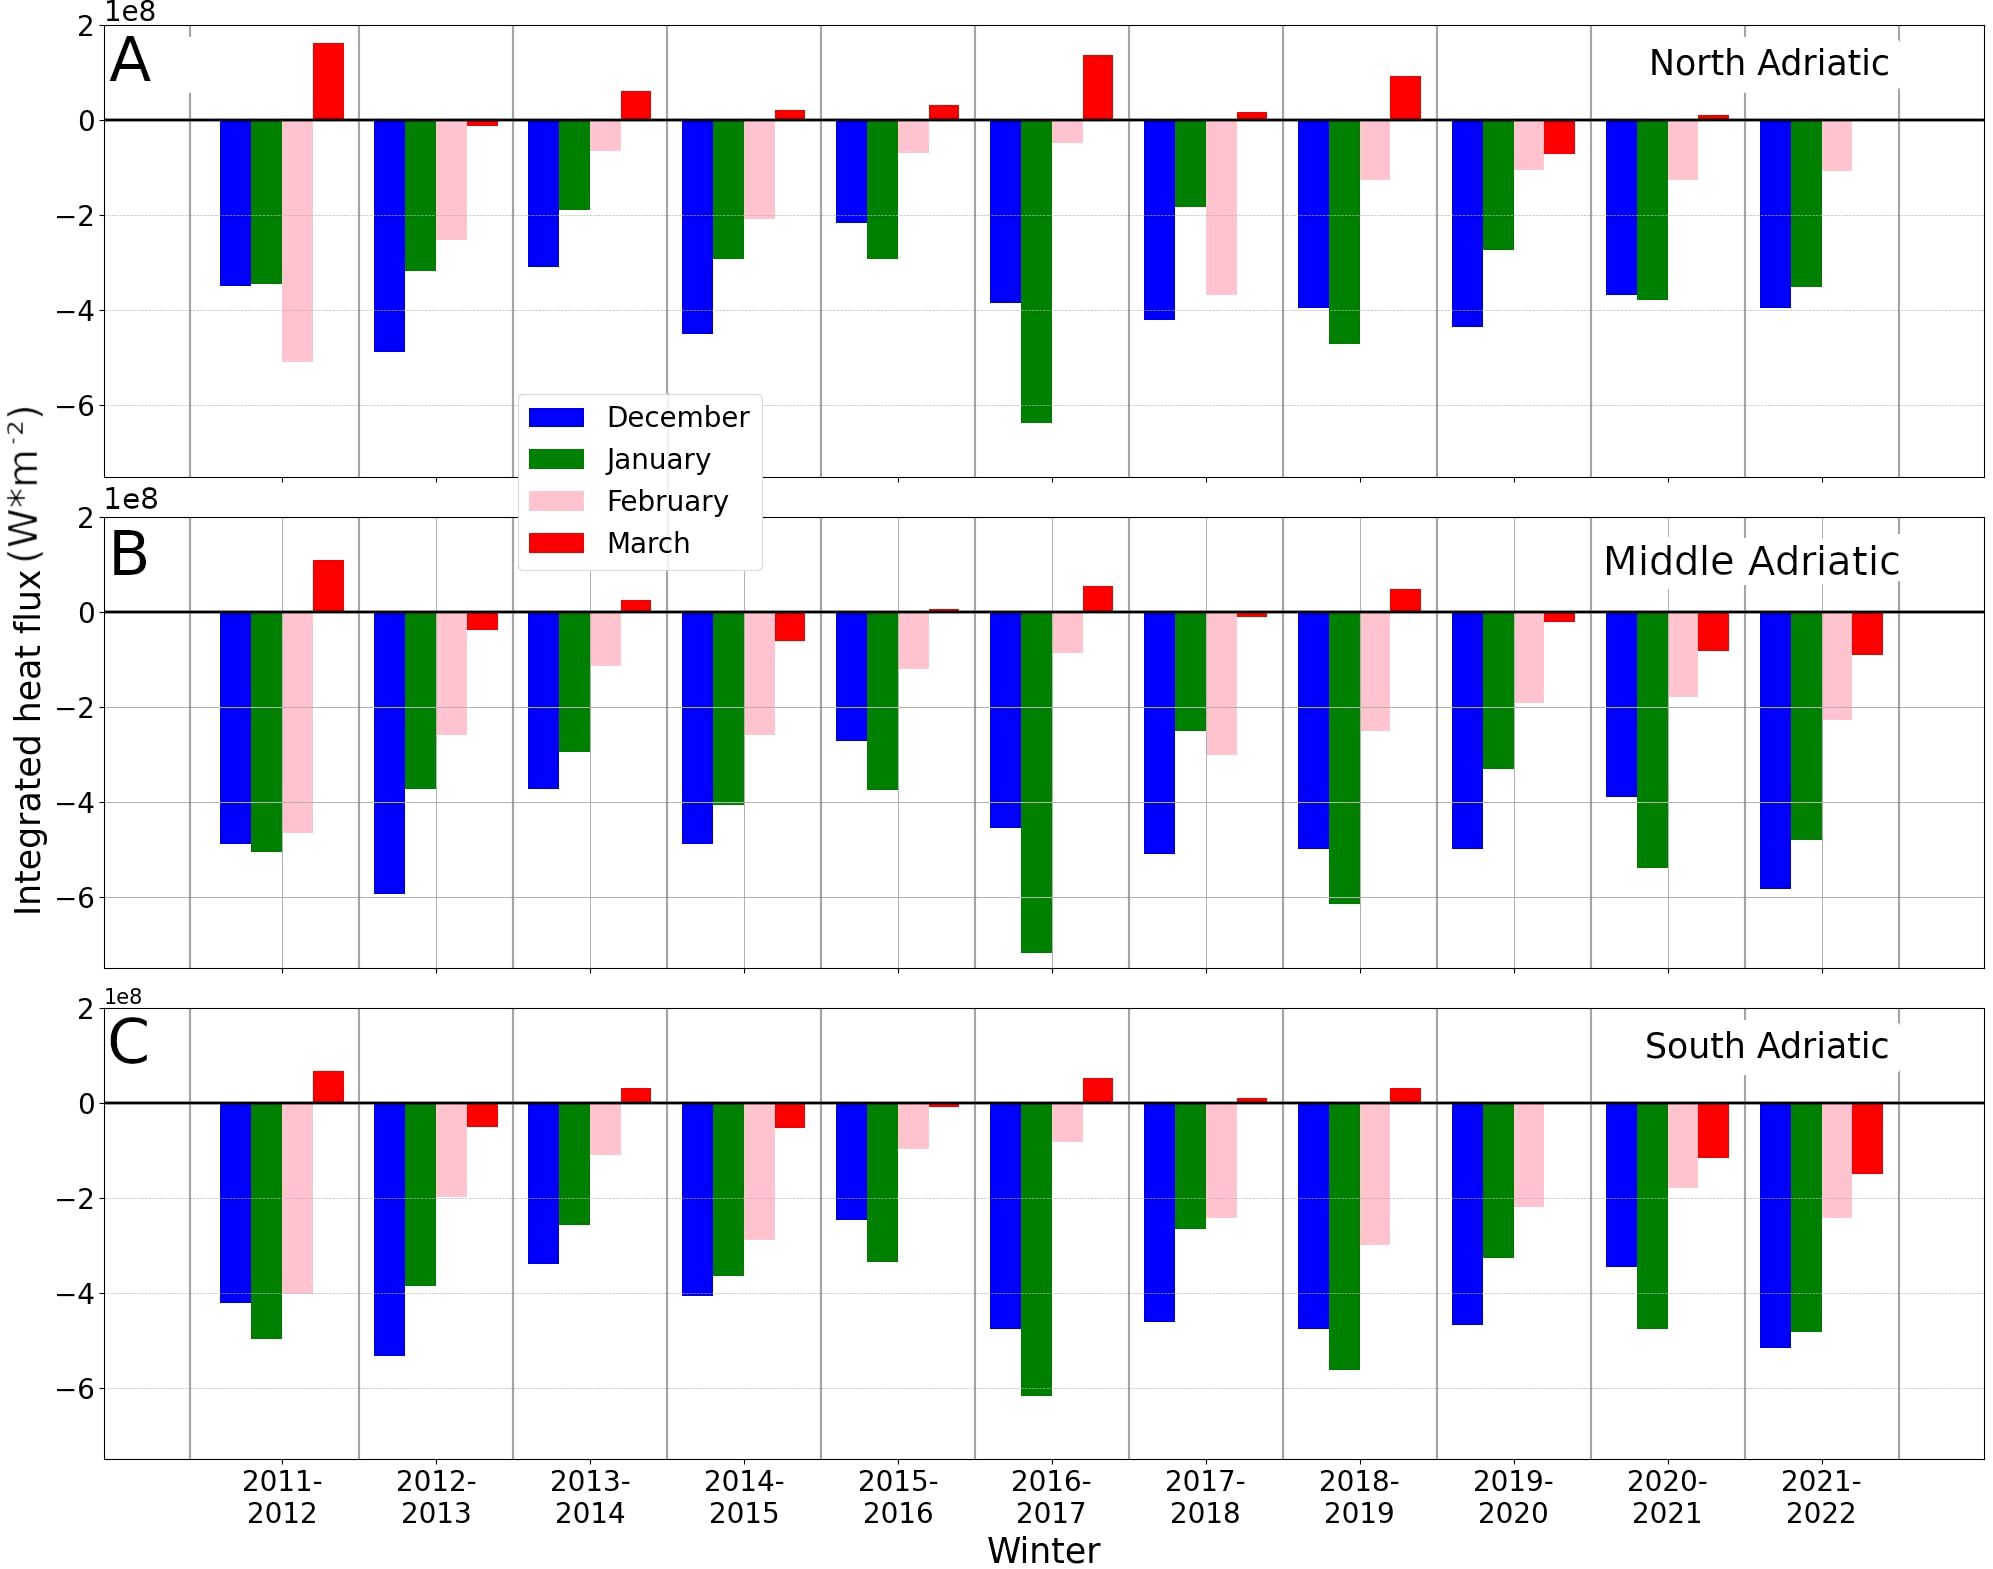
Figure 6. Qtot monthly integrated for the winter period (from December to March) in the North (A), Middle (B) and South (C) Adriatic from winter 2011/2012 to winter 2021/2022. Strong heat losses will be present during strong winters (January 2017 for example) and may induce generation for very dense waters. Strong heat losses at the beginning of the winter period will allow a strong preconditioning of the water mass.
Secondly, monthly average values of salinity values integrated over the upper 10 m (Figure 7) and over the whole water column (S6) are also derived for the North Adriatic.
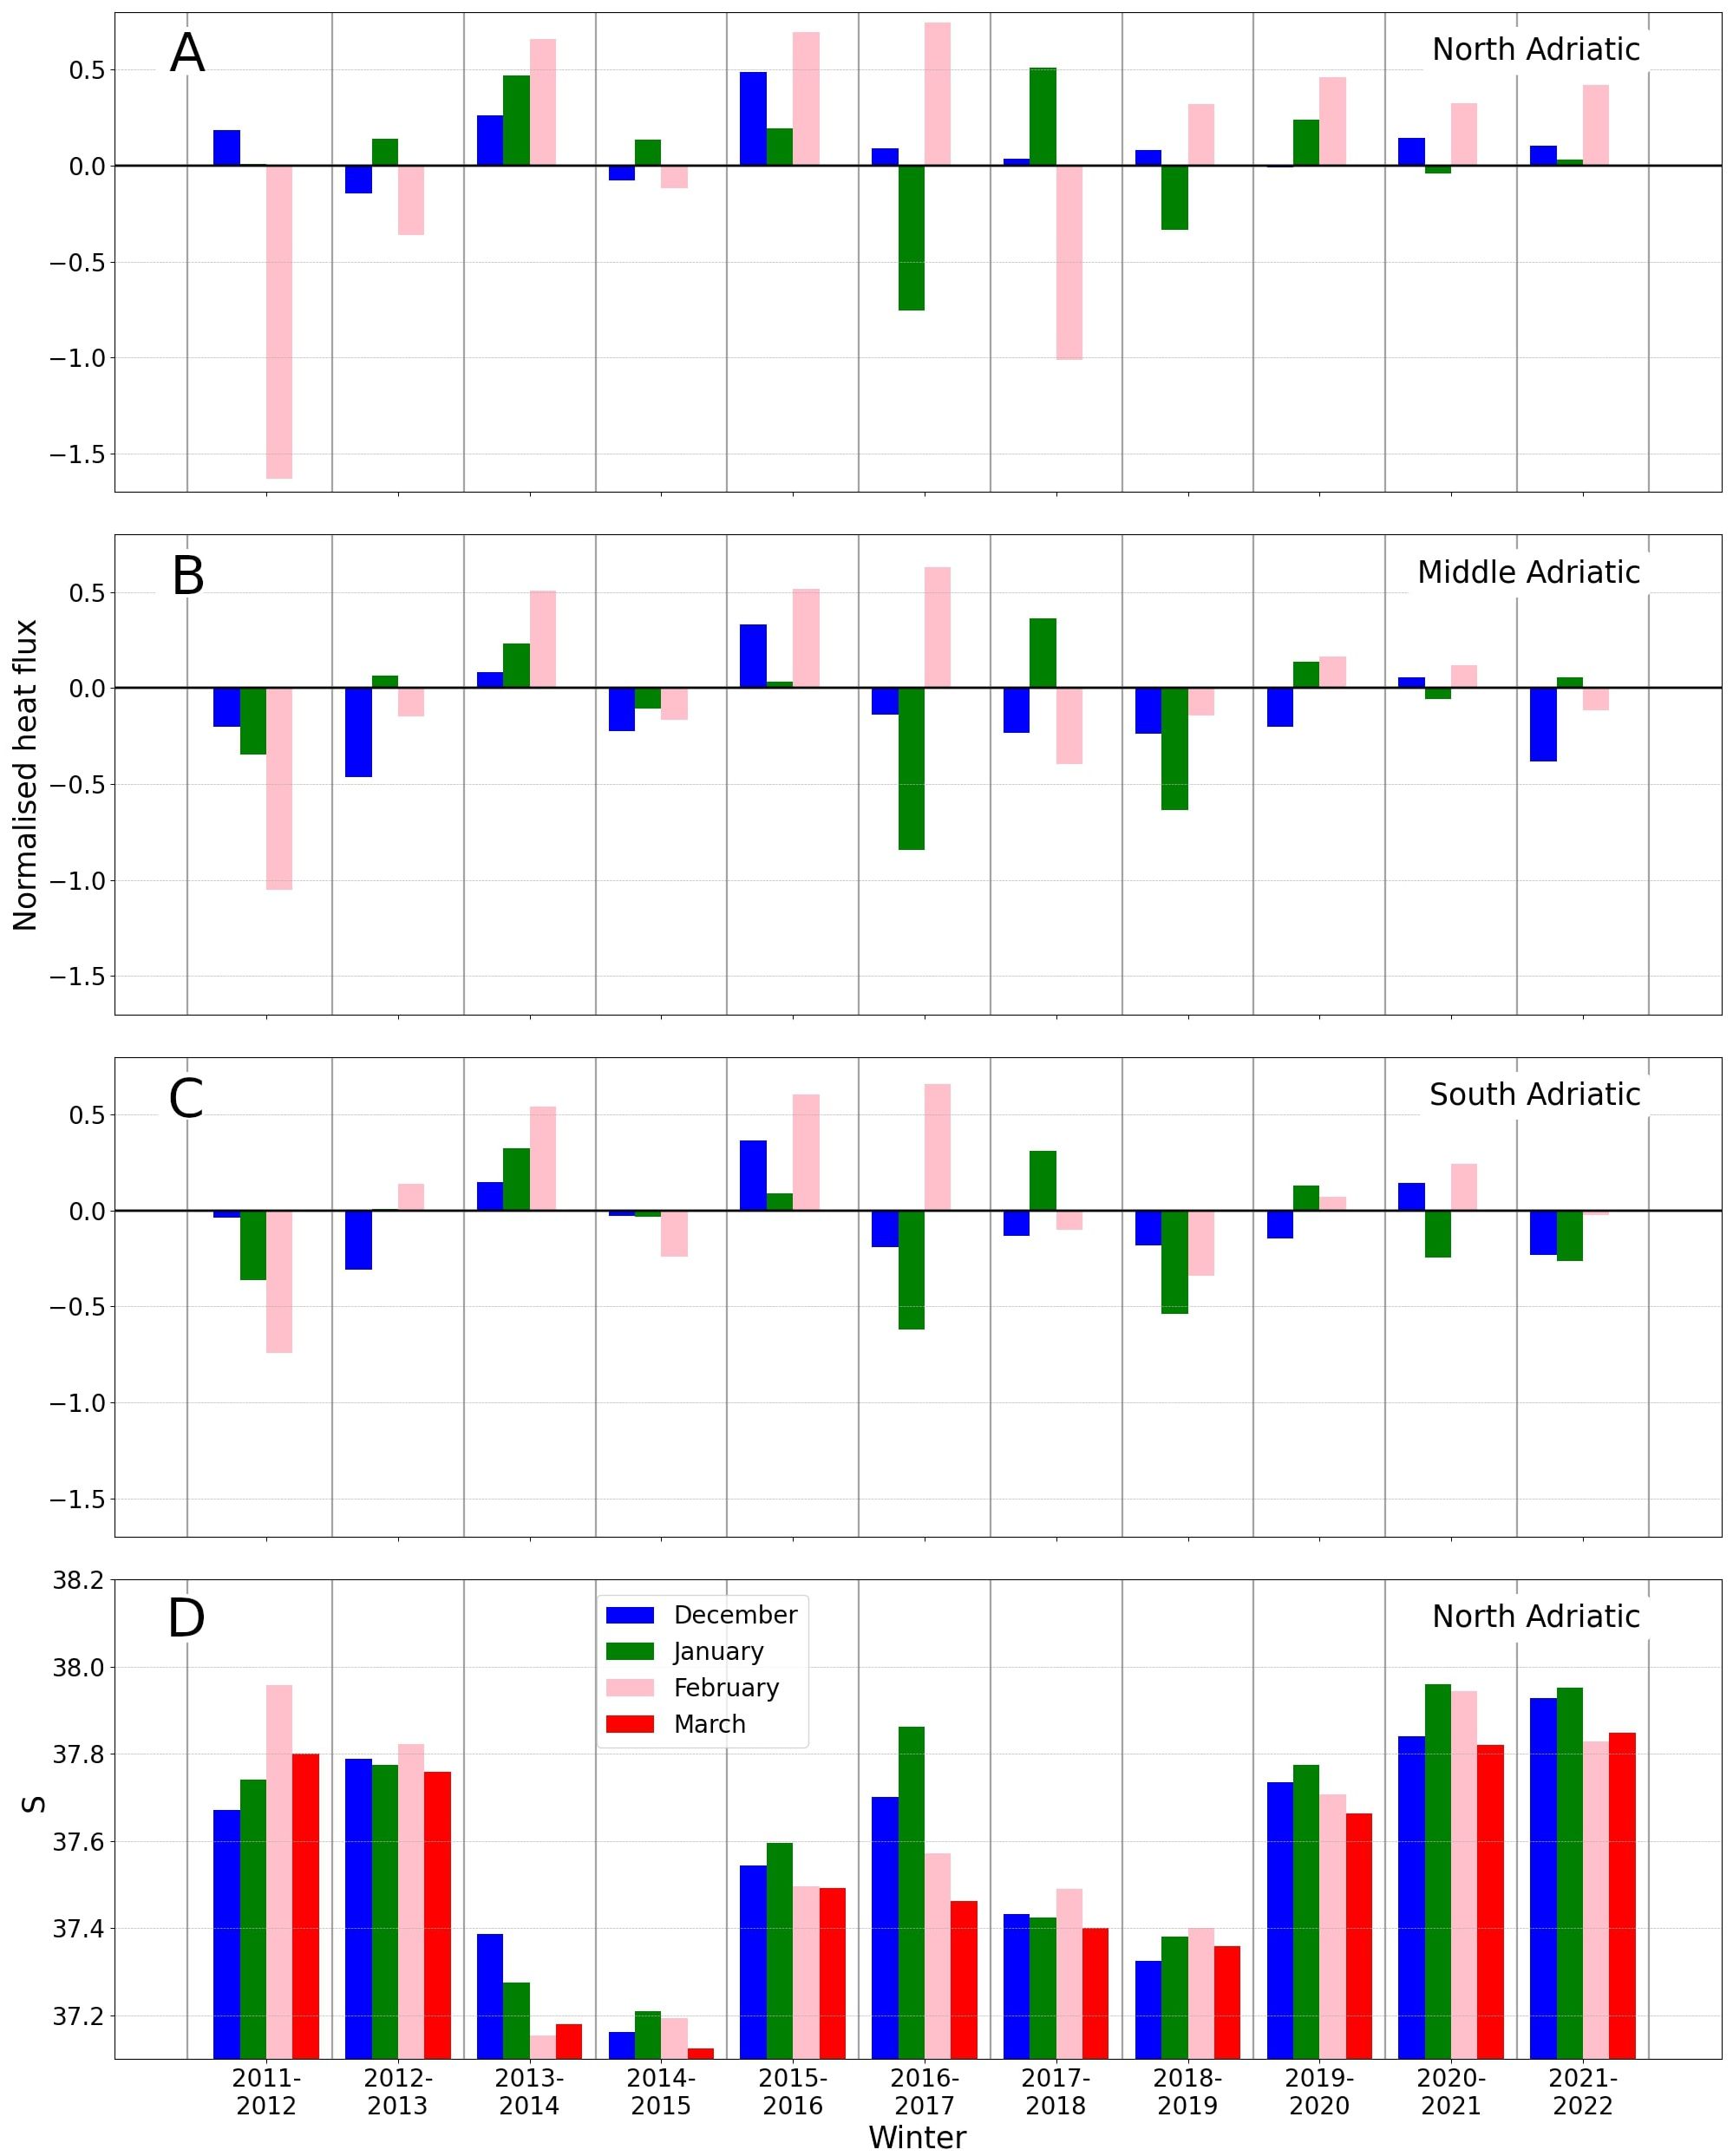
Figure 7. Total surface heat flux monthly normalized for the winter period (December to February) in the North (A), Middle (B), and South (C) Adriatic from winter 2011/2012 to winter 2021/2022 and salinity monthly average for winter period (December to March) in the North Adriatic from winter 2011/2012 to winter 2021/2022 (D). The normalization (A–C) is done monthly with Equation 3 considering the period 1979/2022. Strong negative values in February 2012 as well as in January 2017 and February 2018, mean that, considering all the Januaries of Februaries from 1979 to 2022, these were particularly strong. For (D) salinity is average over the 10 upper meters of the water column. High values of S, as during winter 2021/2022, may favor the formation of very dense water.
The analysis of the time series shows that in 2012 strong heat losses occur (−5 × 10⁸ Wm−2) (Figure 6) in February as compared to other years of our dataset (Figure 7). At the same time, high saline waters fill the surface layer in the North Adriatic, especially in January and February (37.9 and 37.8, respectively) (Figure 7), leading to the formation of very dense waters with a maximum observed on 13/02/2012 (Table 2). (Mihanović et al., 2013) and (Janeković et al., 2014) showed that the increase of 0.3 in S during the preconditioning of the water column in the North Adriatic (summer–autumn 2011) was one of the main factors that triggered the 2012 event.
In 2017 and after, the oceanographic condition of the Adriatic changed due to an overall increase of S, as mentioned in (Amorim et al., 2024). Regarding the North Adriatic, that year’s strongest integrated heat loss with a value of −6 × 10⁸ Wm−2 took place in January (Figure 6) and exhibits the maximum value among all Januaries of the period considered (Figure 7). Salinity values are also among the highest [with a mean value greater than 38.3 on the whole water column in January (S6) and nearly 37.9 for the upper 10 m (Figure 7)].
These results explain the high PDA values we observe in January 2017 in Table 2 with a maximum on the 26/01/2017 in the Northern Adriatic of 30.11 kg m−3.
In 2018, as already mentioned, the situation is more balanced. We observe relatively low S values in the North Adriatic compared to the other years (Figure 7). As for the winter period, the beginning was characterized by strong heat losses (−4 × 10⁸ Wm−2, Figure 6) in December, no significant losses in January, and a subsequent strong loss (−3.7 × 10⁸ Wm−2, Figure 6) in February. The latter destabilized the water column, which was already less stable due to the intrusion of high-saline water in early 2017, as shown by (Amorim et al., 2024). The combination of these conditions could explain that the high-density water (Table 2) triggered the gravity current observed this year in the deepest part of the pit, where the highest density value was observed at the end of April (Figure 4).
Winter 2022 can be considered a very mild winter for the North Adriatic, as there are no strong losses compared to the other years (positive normalized values, Figure 7) (Figure 6). However, in contrast to the other years analyzed above, very strong heat loss events occurred in December and January in the Middle Adriatic (−5.9 × 10⁸ Wm−2 and −4.8 × 10⁸ Wm−2, respectively, Figure 6). In terms of salinity, the winter months in the north have the highest value for the entire water column compared to all years, with a mean value around 38.45 (S6). This high amount of salt in the water column leads to a density of PDA = 30.03, which is among the highest observed during the bottom ventilation years (Table 2). The strong heat losses in the Middle rather than in the Northern Adriatic could explain the observation of gravity currents in the pit earlier than in the other years (19/02/2022).
In this section, we first consider the typical time scales of the duration of the gravity current event at BB and at E2M3A. Secondly, we estimate the travel time and speed of the gravity current from the generation site in the North Adriatic to BB/FF and from BB/FF to E2M3A. Results are presented in Table 3.
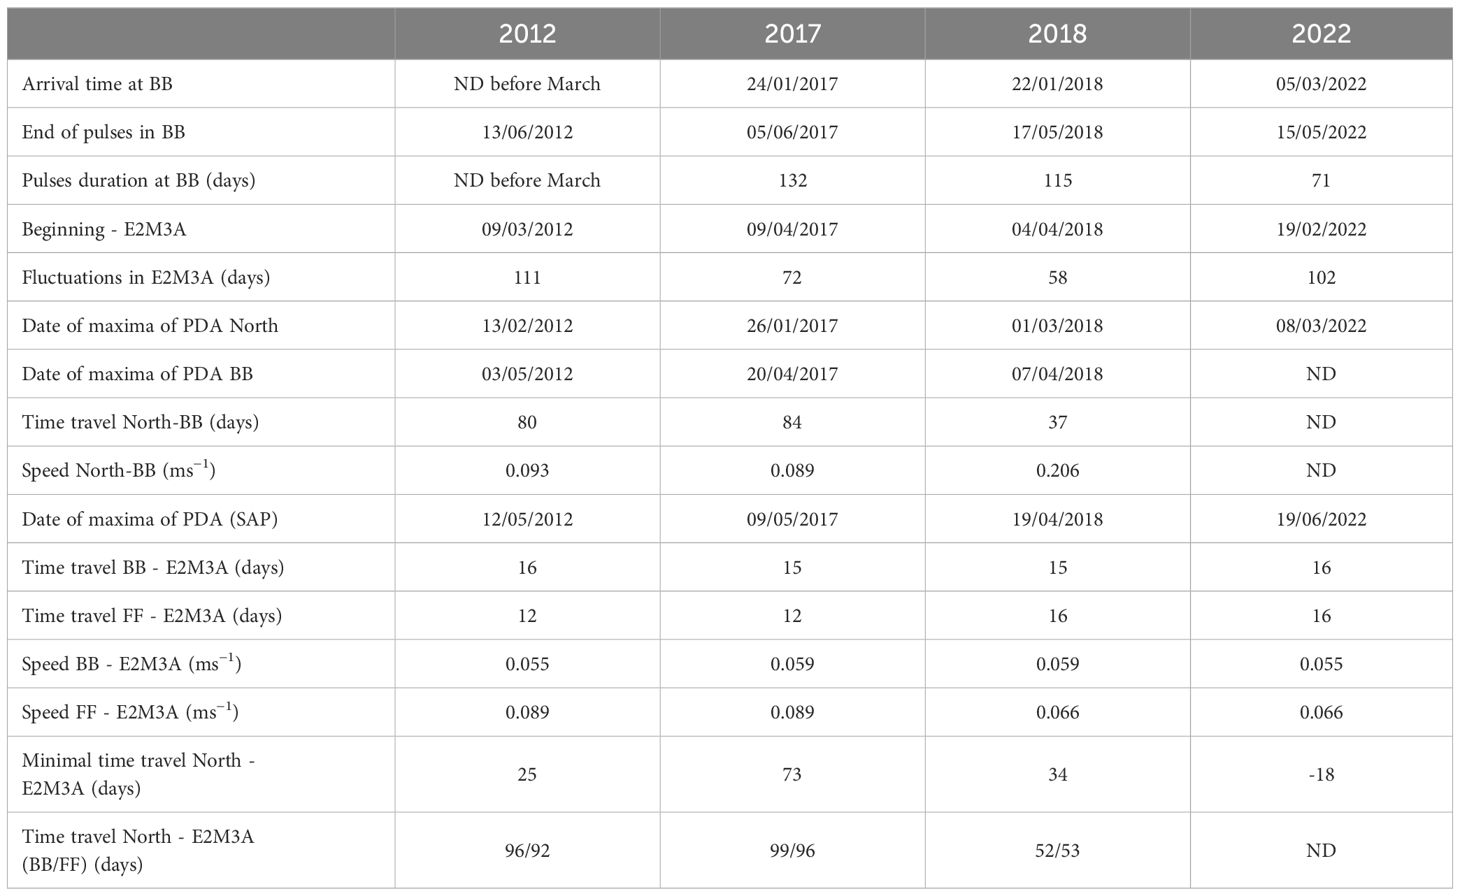
Table 3. Duration time of bursts at E2M3A and BB, travel times from the dense water generation site in the North to BB and from BB to E2M3A, as well as associated velocities.
To determine the duration of the gravity current event, we use the ADCP data at BB. A gravity current is present when the observed speed V is greater than 0.17 ms−1, which corresponds to the average speed plus one standard deviation. We further consider speeds greater than 0.17 ms−1 along the down-slope axis (Vc). This threshold can be justified considering the study of Paladini de Mendoza et al. (2022a) where it was observed that the passage of gravity currents in FF or BB are marked by a decrease of water temperature and/or high salinity values which is more important for velocities greater than 0.17 ms−1. The beginning of bursts of fluctuations in the dSAP was defined as the time when exceeds two times , the standard deviation of fluctuations during non-bottom ventilation years.
The speeds recorded at BB along the down-slope axis (Figures 8B–E) exhibit regimes formed by a series of pulses or consisting of isolated points, which are in the following neglected, (section 2.1.3) to determine the beginning and the end of the pulse regime in the speed time series (Figure 8; Table 3). The results show that pulses end earlier in 2018 and 2022 (mid-May) than in 2012 and 2017 (beginning of June) (Table 3) which lead to an average duration of the pulses of 106 days during the bottom ventilation years (Table 3). Moreover, we determined the average travel time between BB (FF) and E2M3A, using bursts of fluctuations of PDA, of 15.5 days (14 days) (Table 3). These results show, firstly, that the mean velocity of the gravity current from BB (FF) to the dSAP is on average of 0.057 ms−1 (0.078 ms−1) (Table 3). Secondly, they show that the end of the cascading of gravity currents in the dSAP (and so the beginning of the relaxation period) ends no later than 29/06 in 2012, 20/06 in 2017, 01/06 in 2018, and 02/06 in 2022. Considering the average time travel observed between BB and E2M3A, these values are consistent with those of Martellucci et al. (2024), who mentions an outflow of NAdDW from the Bari canyon toward the SAP usually in spring from March to June. These values indicate then that the duration time of bursts of fluctuations in the dSAP varies from 58 days in 2018 to 111 days in 2012 (Table 3) which is also consistent with the fact that among bottom ventilation years, 2018 is the year when the less dense water was formed in the North (Table 2). We observe that in 2017 and 2018 the duration of pulses at BB is greater than the duration of bursts of fluctuations in the dSAP (Table 3). The opposite was true in 2022, which is explained by water passing though FF played a greater role in the renewal of the dSAP water mass (Supplementary Figure S1) and pulses began earlier there (10/02, not shown here).
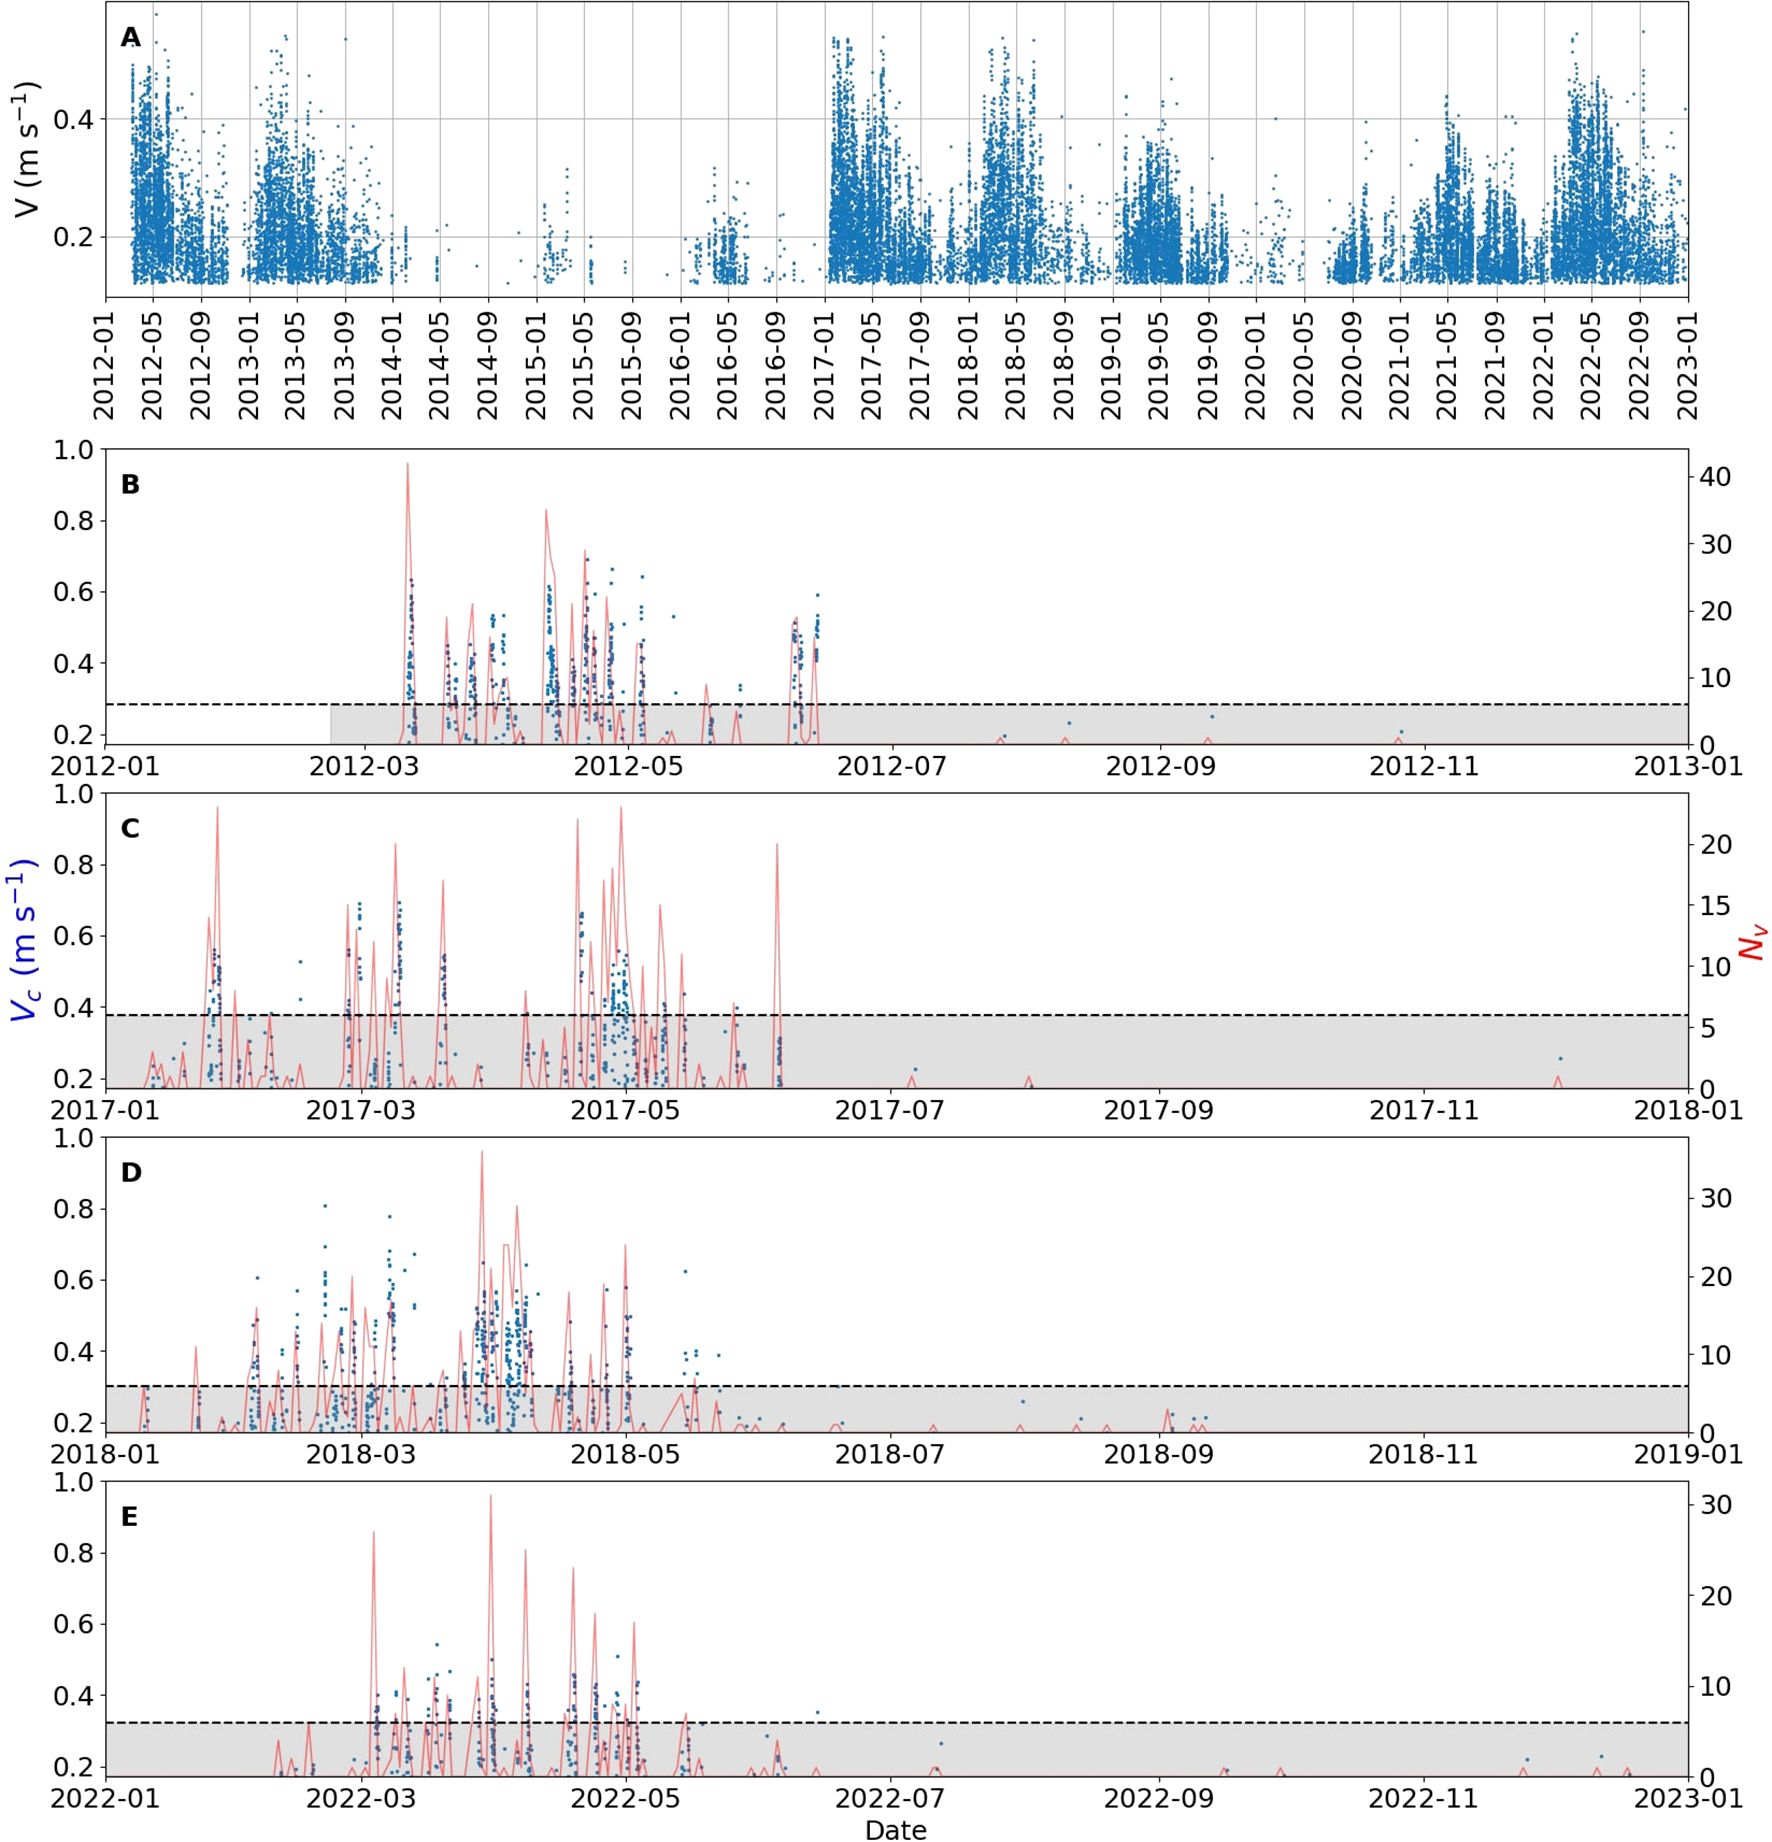
Figure 8. (A) Speed at BB mooring, only considering values above the threshold of 0.17 ms−1. Downslope velocities above 0.17 ms−1 for (B) 2012, (C) 2017, (D) 2018, and (E) 2022 (bottom ventilation years) are shown in blue. For (B–E) the daily number of speed greater than 0.17 ms−1 is shown in red (section 2.1.3). We consider days when the number of values Nv is greater than 6 for the detection of the beginning and the end of the gravity current event.
During bottom ventilation years, the minimum travel time from the formation site in the North Adriatic to the dSAP (interval between the date of the PDA maximum in the North Adriatic and the date of the start of the bursts of fluctuations at E2M3A) ranges from 25 days to 73 days, see Tables 2, 3. However, in 2022, we obtain a negative value indicating that the start of the bursts of fluctuations in the dSAP is due to either dense water that formed well before 08/03/2022 (date of the PDA maximum, Table 2) or dense water formed in the Middle Adriatic (see section 3.2 above). Assuming that the maximum of the PDA at the formation site in the North Adriatic generates the maximum of the PDA in the dSAP, a more accurate travel time ranges from 52 days in 2018–99 days in 2017 (Table 3), which is consistent with the order of magnitude of 2–4 months for the travel time from the North to the Southern Adriatic mentioned in the literature (Vilibić and Orlić, 2001, 2002; Rubino et al., 2012; Benetazzo et al., 2014). These travel times lead to the velocity of the dense water masses (Table 3) ranging from 0.083 ms−1 in 2012 to 0.16 ms−1 in 2018.
In the literature, (Vilibić and Orlić, 2001) mentioned a time of two months for the arrival of the NAdDW near Bari, which means a velocity of 7−8 cm s−1 (a value also mentioned by (Hendershott and Rizzoli, 1976). However, as shown by (Vilibić, 2003) in his study around the Palagruza Sill, the NAdDW current can be very variable and reach velocities of up to 20 cm s−1 in the southeast. This variability in NAdDW velocity was also mentioned by (Benetazzo et al., 2014), who found an NAdDW velocity in the order of 30 cm s−1 when leaving the northern basin in the early stage of formation and 9 cm s−1 on average after this early stage. Another hypothesis for the short time travel in 2018 is a higher ambient velocity of the water masses, to which the gravity currents are submitted on their way southward. To investigate this feature, maps of the difference in 7-day mean projected meridional velocity along the Adriatic axis in the near bottom (15−25 m above the bottom) (V′) between 2018 and the other bottom ventilation years (not shown here, see Supplementary Figure S8 for the difference between 2018 and 2017). We observed higher V′ values southward in 2018, explaining the higher dense water velocity observed. This result is confirmed by Table 4; Supplementary Figure S7, which take into account the three areas on the western part of the Adriatic Sea sub-basins for 2012, 2017, and 2018 in the near-bottom region and which depict higher ambient velocities in each basin in 2018 as compared to the other years.
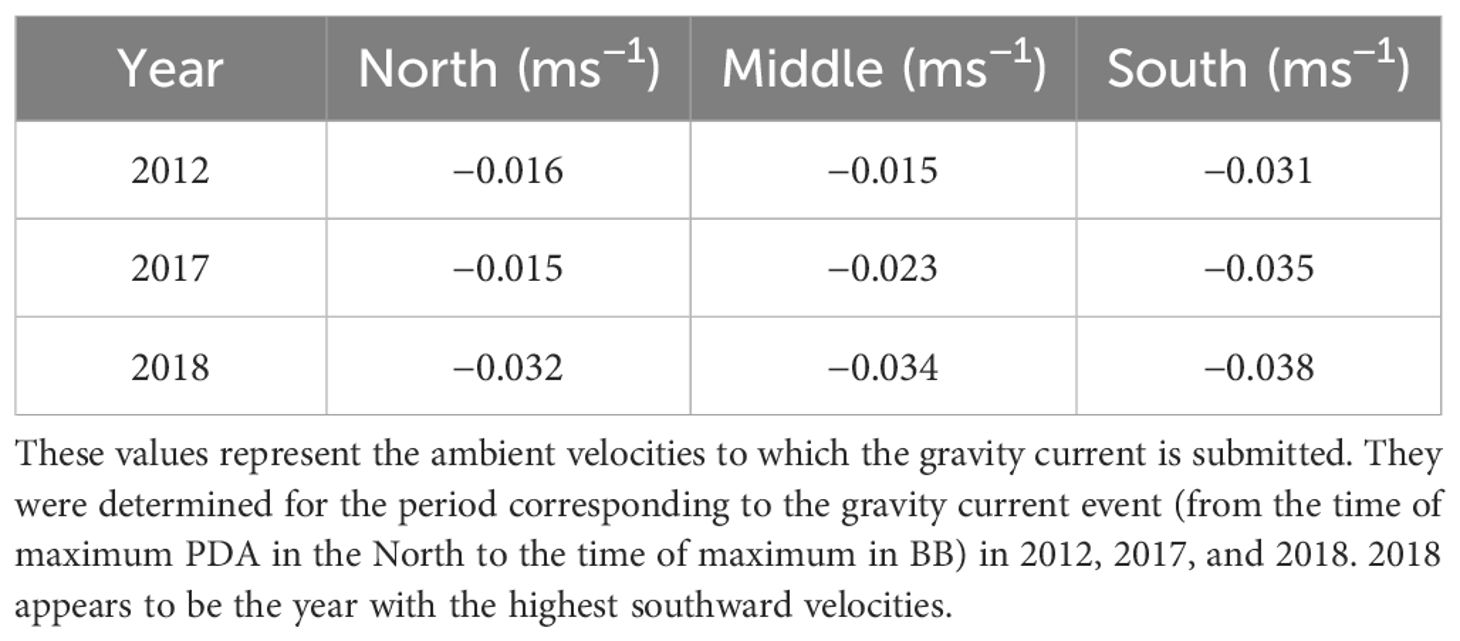
Table 4. Mean value of projected northward velocities along the Adriatic axis (V ′) in the near bottom (15–25 cm above the bottom) for areas on the western side of the North, Middle, and South Adriatic in 2012, 2017, and 2018.
The water masses in the dSAP after a bottom ventilation event are a mixture of intruding waters, mainly through BB and FF, and the water present before the event (see section 2.1.2). If the mixing is due to turbulent motion of water parcels, the difference in the molecular diffusion coefficients does not matter and the mixing ratios of Equation 1 apply. The different water masses are presented in θ/S diagrams (Figure 2), and can be distinguished based on their thermohaline properties (see section 2.1.2). A mixing of water masses shown in this diagram leads to a new water mass consisting of the weighed combination of all water masses involved. Therefore, in our case, the water mass after the bottom ventilation event must lie within the triangle represented by the water mass at E2M3A before the fluctuation and the water masses at BB and FF (see section 2.1.2). In terms of Equation 1, this means that all ratios (R) lie in the interval [0,1] and their sum equals unity. This condition is satisfied by the thermohaline properties for all the bottom ventilation years considered, that is, 2012, 2017, and 2018 (no thermohaline data is present for 2022 at BB/FF) (Figure 9). This finding presents criteria 6, further indicating that a gravity current event is responsible for bottom ventilation.
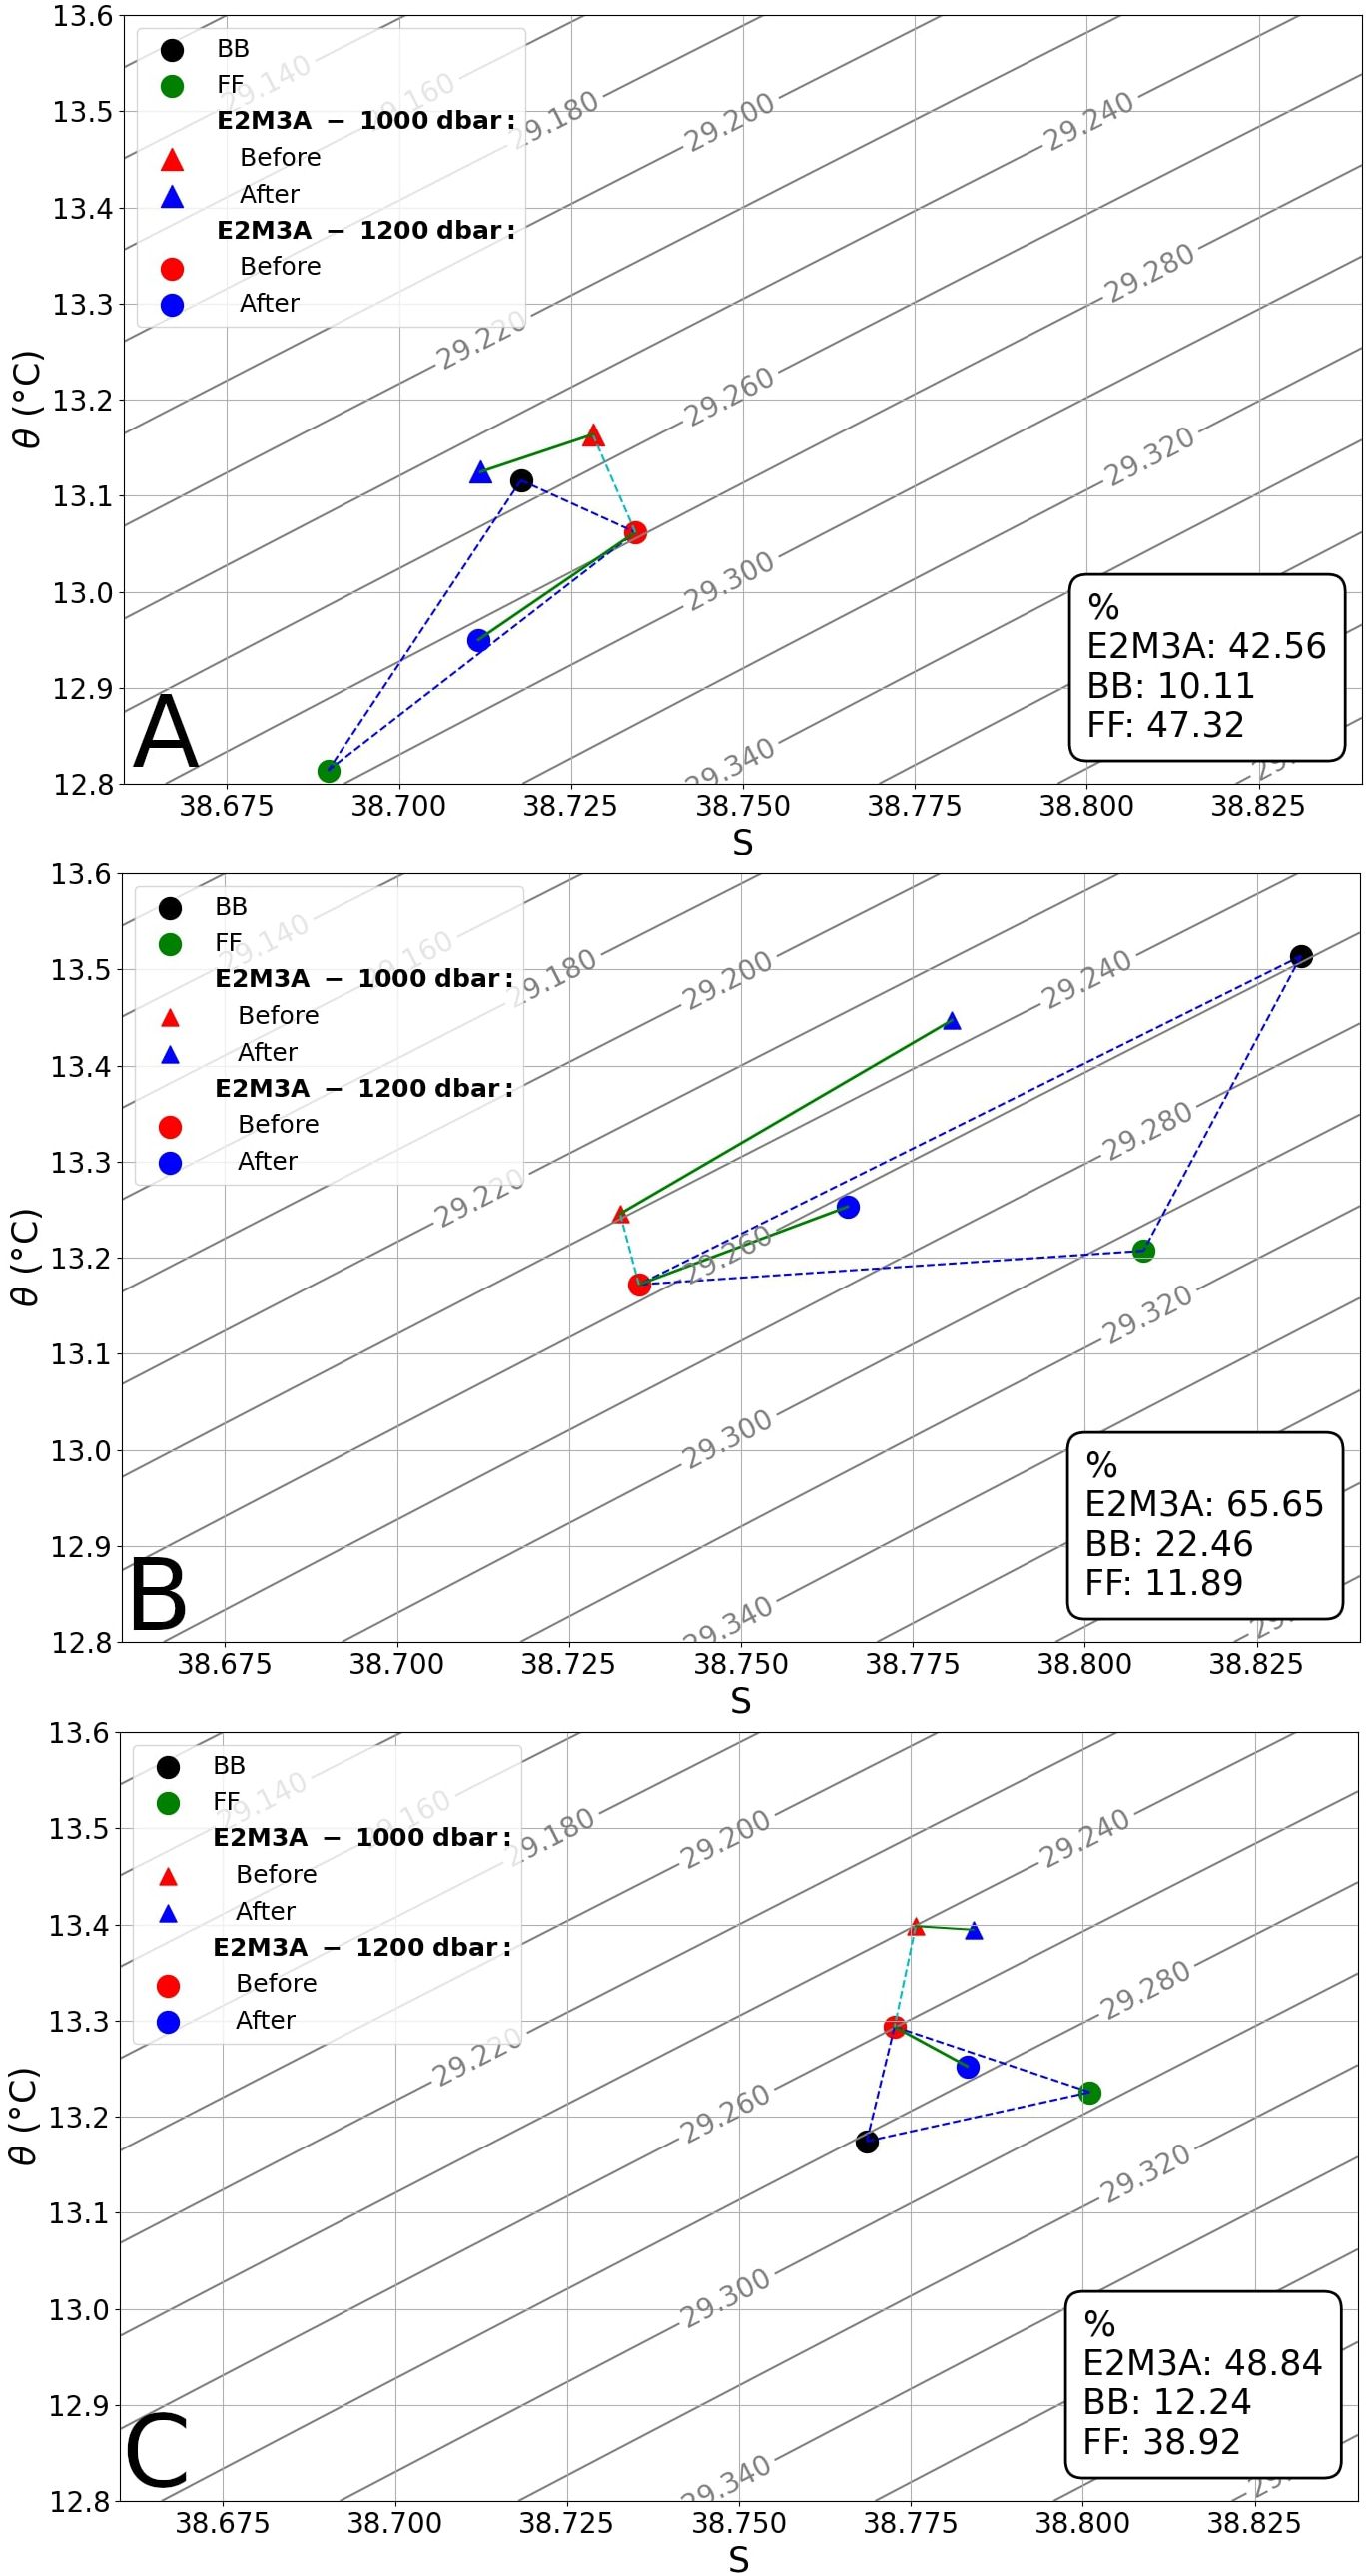
Figure 9. θ/S diagrams at E2M3A, at 1,000 and 1,200 dbar, for the bottom ventilation years recorded: 2012 (A), 2017 (B), and 2018 (C). Isopycnals are represented by the contour lines. The point representing the situation at 1,200 dbar after the fluctuation (blue point) is within the triangle defined by the water mass coming from BB (black point), the water mass coming from FF (green point) and the water mass before the fluctuation (red point) for the different bottom ventilation years. The difference between the two depths (1,000 and 1,200 dbar) is almost perpendicular to their respective changes in water-mass properties.
In addition, it is interesting to note that for all three years, the θ/S properties differ. Indeed, the percentage of water mass originating from BB or FF involved in changing the properties of the deepest water mass at E2M3A differs between the different bottom ventilation events (Figure 9) with values ranging from 10% to 23% for BB in 2012 and 2017, respectively, and from 12% to 48% for FF in 2018 and 2012, respectively. This means that in 2012 and 2018, the water mass involved in the change of the deepest waters of the dSAP passed mainly through FF, while in 2017 it passed mainly through BB. In 2022, in Supplementary Figure S1, fluctuations seem to occur mainly at FF mooring, indicating that the water flowing into the pit came mainly from FF in that year.
In all three bottom ventilation years, we observe an increase in density due to gravity currents (Figure 9). This increase is 1 × 10⁻² kg m−3 in 2012, 5 × 10⁻³ kg m−3 in 2017, and 1.2 × 10⁻² kg m−3 in 2018. Considering the period studied, for which the density has a variability of −0.1 kg m−3, this means that the density changes are 10%, 5%, and 12% of the total variability in 2012, 2017, and 2018, respectively, and they are opposing the general trend (increasing in density, Figure 3). These changes are non-negligible because, in order to reach the bottom, the density of the water mass transported by the gravity current has only to be slightly superior to the water mass in place. The information about potential temperature and salinity shows which variable was the driver for the gravity current. In 2012, we observed a decrease in S and θ by almost 2.5 × 10⁻² and 0.13°C, respectively, suggesting that temperature was the driver of the gravity current. In contrast, 2017 shows an increase in both S and θ by almost 4 × 10⁻² and 0.14 °C, respectively, suggesting that salinity is the driver. In 2018, we observed both a decrease in θ by about 1 × 10⁻² °C and an increase in S by about 1.5 × 10⁻² °C (Figure 9). This year, the change in water mass properties is almost perpendicular to the isopycnals, which leads to a significant increase in density. In 2012 and 2017, the change was mostly along the isopycnals, the former exhibiting a decrease and the latter an increase in spiciness.
The intrusion of the water transported by the gravity current into the dSAP is mainly turbulent, since no replacement of the previous water mass was found. This is evidenced by the substantial value of Rb for all three bottom ventilation events. Furthermore, for the different bottom ventilation years, the change vector at 1,200 dbar at E2M3A before and after the fluctuations is close to the vector at 1,000 dbar at E2M3A and almost perpendicular to the vector defined by the difference of these two water masses before the fluctuations (Figure 9). This means that the mixing between the water masses at 1,000 dbar and at 1,200 dbar, which would lead to a variation along the initial water mass differences, is small.
A θ/S diagram also provides information that helps to exclude convection being responsible for the change of water mass properties in the dSAP as seen on Figure 9, where the point corresponding to the water mass after the bottom ventilation at 1,000 dbar has a lower density than the point corresponding to the same situation at 1,200 dbar for all three years. This means that convection, which homogenizes the water masses in the vertical, is not involved here and that the dSAP is ventilated by gravity currents.
The observation of gravity currents through the Copernicus reanalysis is subject to the performance of the model to detect mesoscale processes. To compare E2M3A Lagrangian observations and Copernicus Eulerian results, we derive a 15-point average of Copernicus PDA around the E2M3A position (Figure 10). Results show that bursts of fluctuations are not well represented in the Copernicus reanalysis, as no significant event is reported during bottom ventilation years by the fluctuation index (Figure 10). Furthermore, the correlation coefficient between the two time series is equal to 0.24 (and 0.13 for a weekly average), which indicates that this model does not have a vertical resolution high enough to detect gravity currents cascading to the dSAP, see (Laanaia et al., 2010). During bottom ventilation years, we can observe fluctuations in the Copernicus reanalysis, but, considering the whole time series, they are not significant in terms of the fluctuation index (see Figure 10). Nevertheless, as presented in Figure 11, potential temperature and salinity of the Copernicus reanalysis follow the general trend of the E2M3A time series. For the horizontal velocities, the amplitudes in the Copernicus reanalysis are typically five times smaller, and gravity currents are not discernible. The reanalysis poor results depicted in Figure 10 are due to a next-to-compensation of the influence of potential temperature and salinity when density is considered and a deficiency of the Copernicus data to capture high-frequency (weekly) changes. Today’s fine resolution numerical models of the Adriatic do not allow sufficient resolution to represent the topographic features important for the dynamics of a gravity current and its nonlinear dynamics.
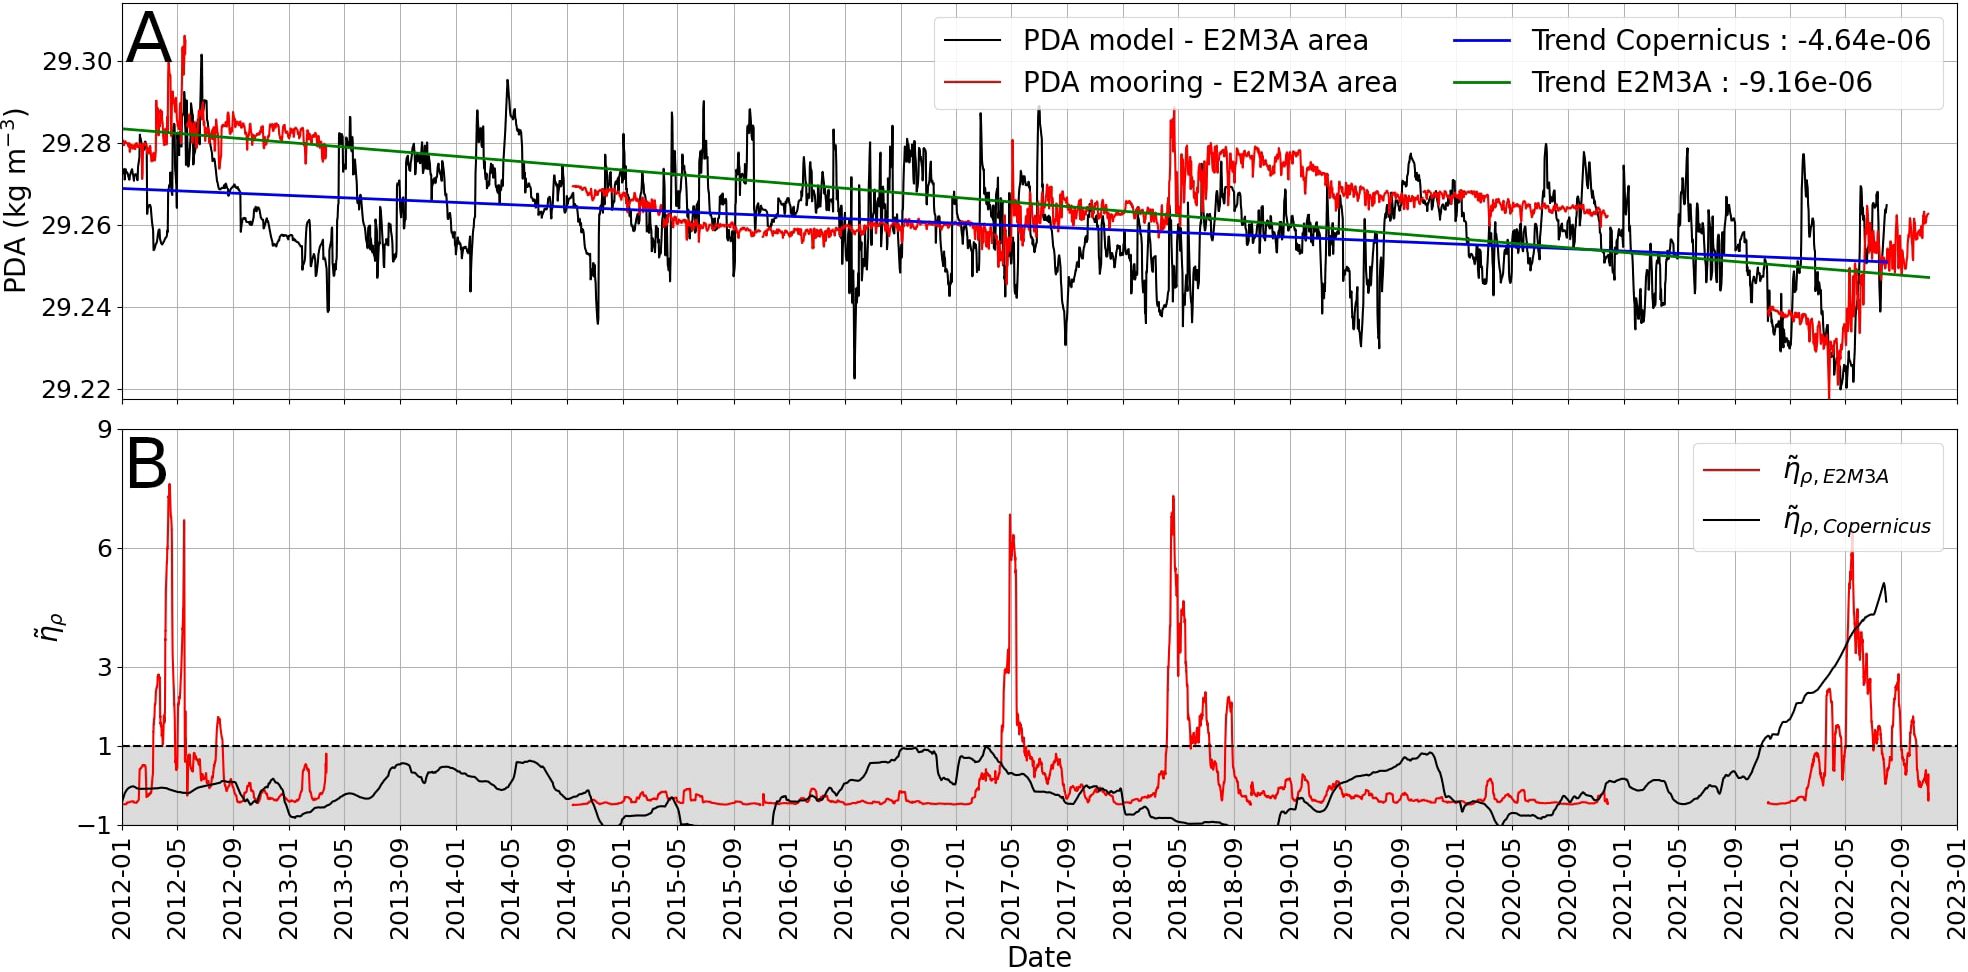
Figure 10. Comparison of the daily average between the Copernicus reanalysis and E2M3A mooring of the PDA time series (A) and the comparison of the fluctuation index (B).
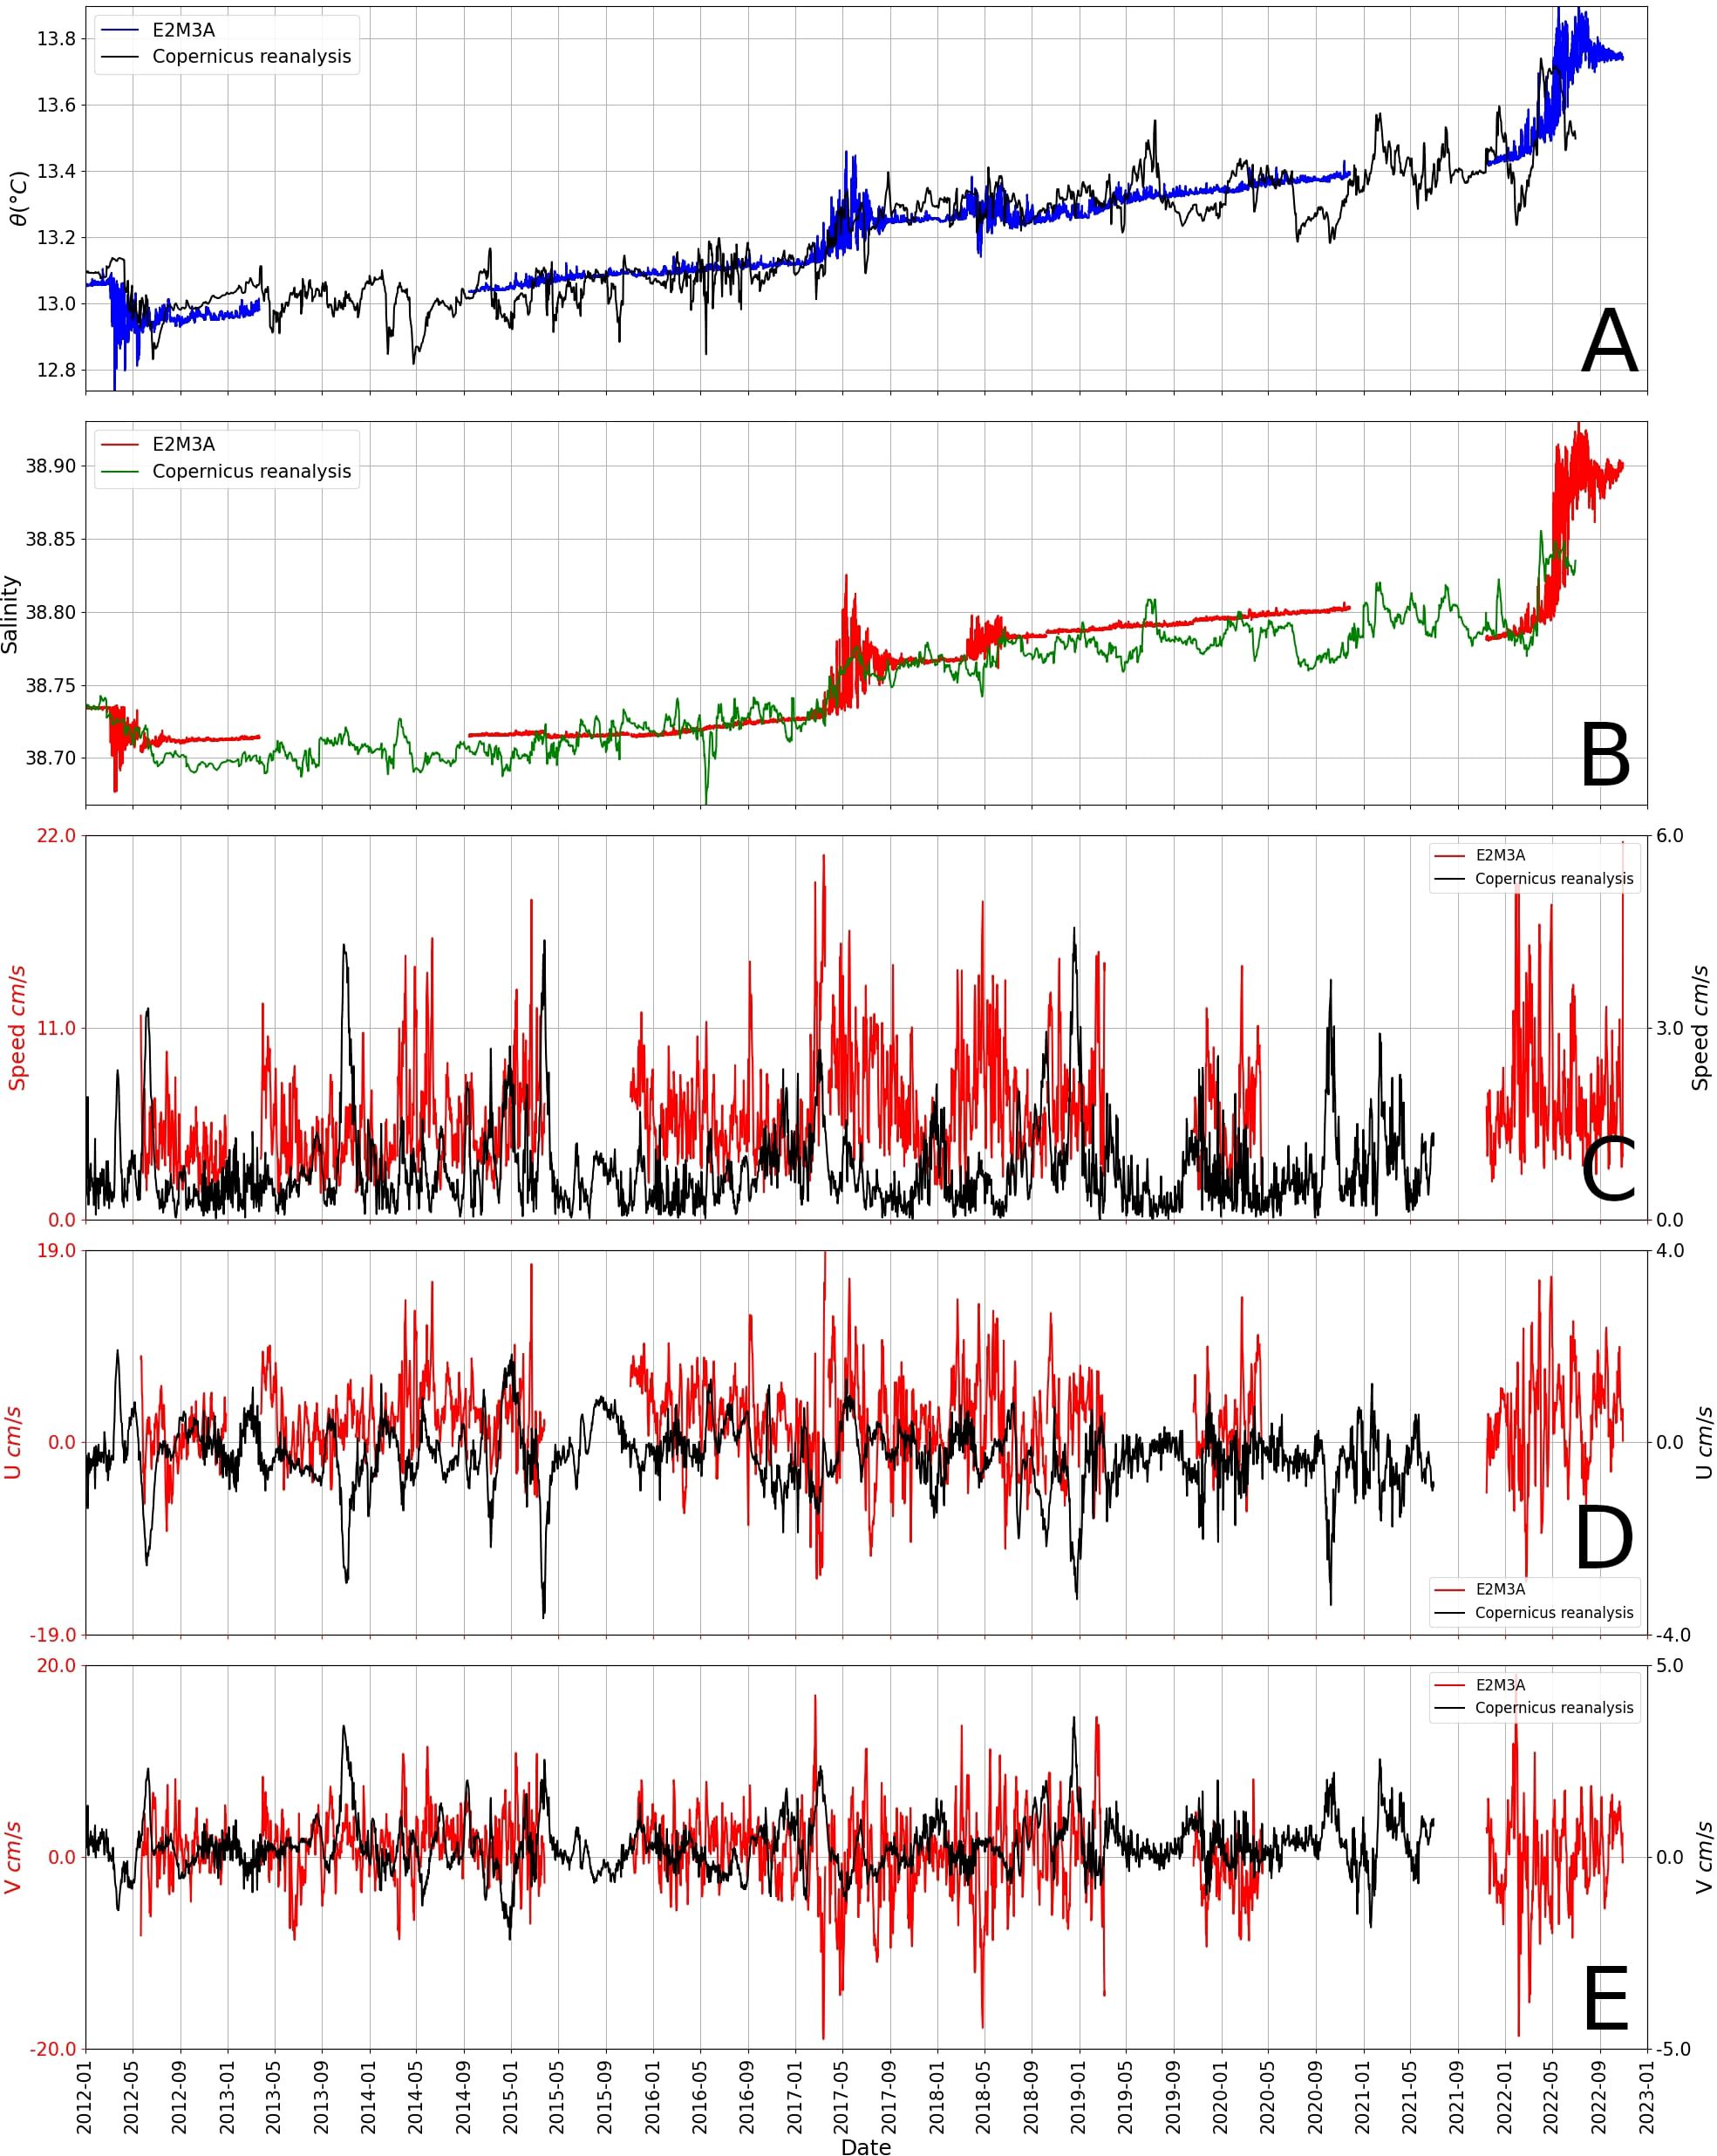
Figure 11. Comparison of θ (A), S (B), Speed (C), zonal component of velocity u (D), and meridional component of velocity (E) for E2M3A and the Copernicus reanalysis. For θ and S, the general trend is well captured by the reanalysis. Differences appear for the speed and the components of velocity, where strong fluctuations observed on Copernicus reanalysis time series are absent from E2M3A observations.
We presented a comparison of three moorings (E2M3A, BB, and FF) CTD and velocity data as well as reanalysis from Copernicus to determine that gravity currents reached the dSAP in 2012, 2017, 2018, and 2022. This result is based on six criteria (see Table 1) applied during the period 2012–2022. We found an almost perfect concordance of all criteria, as only during bottom ventilation years all criteria are satisfied for all available data (see Table 1).
The definition of the fluctuation index , which determines the time interval during which the significant fluctuations occur, made it possible to show a consistency between, firstly, the detection at the three moorings, since events reported in BB/FF are followed by events at E2M3A, and secondly, the different criteria based on data studied when considering only the dSAP. The latter have linked bursts of fluctuations in density (> 1, first criteria) and oxygen (> 1, second criteria), proving that ventilation has taken place. Apart from the fact that the fluctuation index for moorings BB and FF must be satisfied, the normalized density difference should be significantly small (less than 1) to assume that the observed bursts of fluctuation are the result of the passage of a gravity current from the same source region. We observed that the years that meet the fluctuation index all meet this condition (third criteria). The dense water that flowed in BB or FF did not necessarily lead to bursts of fluctuations in the dSAP, even if their density difference was small, but rather in the upper layers of the pit (900 dbar and 1,000 dbar) or even not at all. This means that the water transported by the gravity currents must be denser than the water already present in the dSAP (fourth criteria). The definition of the density threshold of 29.75 kg m−3 using the Copernicus reanalysis on the North Adriatic (fifth criteria) represents the minimum density of the NAdDW to reach the dSAP. Furthermore, the analysis of θ/S diagrams provides valuable information on the mixing ratio between the water masses of the three moorings. The thermohaline properties of the water masses in the dSAP after the bursts of fluctuations show to be differently mixed among bottom ventilation years, with different contributions from BB and FF. The θ/S diagram shows that 2012 was mainly driven by potential temperature, while 2017 was mainly driven by salinity. The year 2018 seems to be influenced by both salinity and potential temperature. It was also found that in 2012 and 2022 the gravity current was mainly passing through FF, on the open slope North of the Bari canyon. Furthermore, we found that the water transported by the gravity current is mainly turbulent since no replacement of water masses took place in the dSAP and that convection cannot be responsible for the change in water mass properties in the dSAP, as the bottom density is greater than density at 1,000 dbar after the bottom ventilation.
The combination of all criteria was only met for the bottom ventilation years (2012, 2017, 2018, and 2022), but among other years some are characterized by a gravity current event when the water density was not high enough to reach the dSAP (2015, 2016, 2019, and 2021). It was also found that 2013 also satisfied the fifth criteria. Furthermore, in 2013 and 2019 the criteria on the difference in density between BB and FF is satisfied, but this can also be achieved without a gravity current.
NAdDW formed during bottom ventilation years and with PDAs greater than 30 kg m−3 were generated by the same forcing that drive gravity current in the dSAP. In 2012, potential temperature was the main driver of NAdDW formation, while in 2017 and 2022 it was salinity. In 2018 both potential temperature and salinity were involved in the NAdDW formation. The bottom ventilation years were also characterized by strong integrated heat losses that triggered the formation of this water (Figure 7).
The time scale analysis, taking into account both the ADCP and PDA time series (2012–2022), revealed firstly that the duration of speed pulses in BB is a few months (from late January to May), leading to an average duration of bursts of fluctuations in the dSAP of a few months (from March to June) for all the bottom ventilation years. Second, the time travel from the generation of NAdDW to BB was found to be 80, 84, and 37 days in 2012, 2017, and 2018, respectively, implying that the speed of the gravity current varies from year to year. A tentative explanation for the short travel time in 2018 is the higher south-eastward ambient velocity on the west coast of the Adriatic as compared to the other bottom ventilation years (on average 0.04 ms−1 in 2018 and 0.02 ms−1 in 2012 and in 2017). After reaching BB (FF), the travel time to the dSAP is around 2 weeks, which corresponds to an average speed of 0.06 ms−1 (0.08 ms−1).
Finally, the comparison between the Copernicus reanalysis and the E2M3A PDAs time series for the dSAP show consistent differences in both value and variability. The former does not clearly detect gravity current events during bottom ventilation years (Figure 10), which is certainly due to a low vertical resolution of the numerical model employed. Nevertheless, temperature and salinity time series of both datasets are similar and show the same trend, suggesting that the density compensation, emphasizing small differences in T and S between observations and the reanalysis, leads to significant differences in the PDAs.
Our results show that the stratification and ventilation of the dSAP are determined by the competition between small-scale mixing, which has a homogenizing effect, and intermittent gravity currents, which have a restratifying and ventilating effect (see also Querin et al. (2016); Cardin et al. (2020b)). Both processes are strongly influenced by small-scale turbulent dynamics. While the former is continuous and local, the latter is intermittent, almost singular in space and time and also strongly dependent on small-scale topographic features and remote forcings. Parameterization exist to represent the former in digital twins or avatars of the ocean, while the latter is more difficult to capture. The dSAP is thus an example of a long-term, large-scale climatic evolution that depends on small-scale short-term processes that need to be investigated using high-frequency long term observational data.
This study highlights how high frequency measurements of physical and biogeochemical parameters of the South Adriatic EMSO regional facility are necessary in the perspective of observing mesoscale and submesoscale processes that affect the circulation of the Adriatic Sea and in term the general Mediterranean overturning circulation.
The datasets presented in this study can be found in online repositories. The names of the repository/repositories and accession number(s) can be found in the article/Supplementary Material. Further inquiries can be directed to the corresponding author/s. Data are available at the National Oceanographic Data Center – NODC (https://nodc.ogs.it), at the ISP ERDDAP Server (https://bo.isp.cnr.it/erddap/index.html), on the Copernicus marine data store (https://data.marine.copernicus.eu/products) and on the Copernicus climate data store (https://cds.climate.copernicus.eu/datasets).
JM: Conceptualization, Data curation, Formal analysis, Investigation, Methodology, Software, Visualization, Writing – original draft, Writing – review & editing. AW: Writing – original draft, Writing – review & editing, Conceptualization, Investigation, Methodology, Supervision, Formal analysis. FM: Writing – original draft, Writing – review & editing. SM: Writing – original draft, Writing – review & editing. VC: Writing – original draft, Writing – review & editing, Conceptualization, Funding acquisition, Investigation, Methodology, Resources, Supervision, Formal analysis.
The author(s) declare that financial support was received for the research and/or publication of this article. This work was carried out within the framework of the cooperation agreement between EMSO-Italy and OGS/CNR-ISP to financially support the operation of the South Adriatic Regional Facility. Funding support was also given by the National Recovery and Resilience Plan of Italian Ministry of University and Research funded by EU – Next Generation EU Mission 4 “Education and Research” – Component 2: Project IR0000032 – ITINERIS, so as by a grant from the Ufficio Supporto alla Ricerca e Grant of CNR-Italy (CNR-USRG). OGS and CNR provided the ship-time to maintain the sites.
This work benefited from data produced and collected by the OGS- EMSO South Adriatic Site, an EMSO IT Joint Research Unit and the EMSO-ERIC Site. The authors would like to thank the PHYS group, the TEC group and the CTMO of the OGS and the CNR-ISP for their valuable support and work in maintaining the EMSO-SA site regional facility and their valuable help in realizing this work. The results contain modified Copernicus Climate Change Service information 2020. Neither the European Commission nor ECMWF is responsible for any use that may be made of the Copernicus information or data it contains. This study has been conducted using EU Copernicus Marine Service Information and DOI links to data used in this study.
The authors declare that the research was conducted in the absence of any commercial or financial relationships that could be construed as a potential conflict of interest.
The author(s) declare that no Generative AI was used in the creation of this manuscript.
All claims expressed in this article are solely those of the authors and do not necessarily represent those of their affiliated organizations, or those of the publisher, the editors and the reviewers. Any product that may be evaluated in this article, or claim that may be made by its manufacturer, is not guaranteed or endorsed by the publisher.
The Supplementary Material for this article can be found online at: https://www.frontiersin.org/articles/10.3389/fmars.2025.1516780/full#supplementary-material
Supplementary Figure 1 | Time series of at E2M3A (blue), BB (red) and FF (green). Temperature data used here at BB and FF were obtained with CTD SBE56 placed at around 40 m above the bottom of the two respective mooring lines. In 2022, bursts of fluctuations observed at E2M3A are mainly due to bursts of fluctuations observed in FF.
Supplementary Figure 2 | Map of the points selected for the derivation of Qtot in the North Adriatic.
Supplementary Figure 3 | Map of the points selected for the derivation of Qtot in the Middle Adriatic.
Supplementary Figure 4 | Map of the points selected for the derivation of Qtot in the South Adriatic.
Supplementary Figure 5 | Points considered for the derival of monthly salinity in the North Adriatic (for both the 10m average and the whole water column average).
Supplementary Figure 6 | Salinity monthly average on the whole water column for winter period (December to March) in the North Adriatic from winter 2011/2012 to winter 2021/2022. High values of S, as during winter 2021/2022, may favor the formation of very dense water.
Supplementary Figure 7 | Time series of velocities at the near bottom (15/25m above the bottom) in the North, Middle, and South Adriatic for 2012, 2017, and 2018. These velocities are the result of averages on areas near the eastern coast of Italy. The black vertical lines represent the date of maximum of density in the northern Adriatic while the yellow lines represent the date of maximum of density at BB.
Supplementary Figure 8 | Seven day averages of the projected Northward velocity (V’) from week 19/02-25/02 to the week 26/03-01/04 in 2018 (left column) and differences between 2018 and 2017 for the same quantity (right column). Velocities were derived with SSH maps from Copernicus reanalysis and are projected along the Adriatic Sea axis. A negative value means that, along the western coast of the Adriatic Sea, we observe a higher southward ambient velocity.
Amitai Y., Ashkenazy Y., Gildor H. (2019). The effect of wind-stress over the eastern Mediterranean on deep-water formation in the Adriatic sea. Deep Sea Res. Part II: Top. Stud. Oceanogr. 164, 5–13. doi: 10.1016/j.dsr2.2018.11.015
Amorim F. L. L., Le Meur J., Wirth A., Cardin V. (2024). Tipping of the double-diffusive regime in the southern adriatic pit in 2017 in connection with record high-salinity values. Ocean Sci. 20, 463–474. doi: 10.5194/os-20-463-2024
Artegiani A., Paschini E., Russo A., Bregant D., Raicich F., Pinardi N. (1997). The Adriatic sea general circulation. part 1: Air–sea interactions and water mass structure. J. Phys. Oceanogr. 27, 1492–1514. doi: 10.1175/1520-0485(1997)027<1492:TASGCP>2.0.CO;2
Artegiani A., Salusti E. (1987). Field observations of the flow of dense water on the bottom of the Adriatic sea during the winter of 1981. Oceanol. Acta 10, 387–391.
Benetazzo A., Bergamasco A., Bonaldo D., Falcieri F., Sclavo M., Langone L., et al. (2014). Response of the Adriatic sea to an intense cold air outbreak: Dense water dynamics and wave-induced transport. Prog. Oceanogr. 128, 115–138. doi: 10.1016/j.pocean.2014.08.015
Benjamin T. B. (1968). Gravity currents and related phenomena. J. Fluid Mechan. 31, 209–248. doi: 10.1017/S0022112068000133
Bensi M., Cardin V., Rubino A. (2014). Thermohaline Variability and Mesoscale Dynamics Observed at the Deep-Ocean Observatory E2M3A in the Southern Adriatic Sea Vol. 9 (American Geophysical Union (AGU), John Willey Sons, Inc), 139–155. doi: 10.1002/9781118847572.ch9
Bensi M., Cardin V., Rubino A., Notarstefano G., Poulain P. M. (2013). Effects of winter convection on the deep layer of the southern adriatic sea in 2012. J. Geophys. Res.: Oceans 118, 6064–6075. doi: 10.1002/2013JC009432
Bignami F., Salusti E., Schiarini S. (1990). Observations on a bottom vein of dense water in the southern adriatic and ionian seas. J. Geophys. Res.: Oceans 95, 7249–7259. doi: 10.1029/JC095iC05p07249
Bryden H. L., Candela J., Kinder T. H. (1994). Exchange through the strait of Gibraltar. Prog. Oceanogr. 33, 201–248. doi: 10.1016/0079-6611(94)90028-0
Cardin V., Bensi M., Pacciaroni M. (2011). Variability of water mass properties in the last two decades in the south Adriatic sea with emphasis on the period 2006–2009. Continent. Shelf Res. 31, 951–965. doi: 10.1016/j.csr.2011.03.002
Cardin V., Bensi M., Siena G., Ursella L. (2014a). E2m3a-2011-2013-time-seriessouthadriatic. doi: 10.6092/84CB588D-97E5-4C64-91BB-BA6109DFA530
Cardin V., Bensi M., Ursella L., Siena G. (2015). E2m3a-2013-2015-time-series south Adriatic. doi: 10.6092/F8E6D18E-F877-4AA5-A983-A03B06CCB987
Cardin V., Bensi M., Ursella L., Siena G. (2018). E2m3a-2015-2017-time series-south adriatic. doi: 10.6092/238B5903-A173-4FC3-AC5F-5FEDF1064A39
Cardin V., Gačić M. (2003). Long-term heat flux variability and winter convection in the adriatic sea. J. Geophys. Res.: Oceans 108. doi: 10.1029/2002JC001645
Cardin V., Siena G., Brunetti F., Kuchler S. (2020a). E2m3a-2017-2019-ctd-time-series south Adriatic. doi: 10.6092/d0d50095-bd30-4ff7-8d0a-a12121e72f78
Cardin V., Siena G., Giorgetti A., Ursella L., Brosich A., Partescano E. (2014b). The ritmare fixed sites network procedures for real-time data quality control. doi: 10.13140/RG.2.2.31100.44166
Cardin V., Ursella L., Le Meur J., Siena G., Mansutti P., Fabio B., et al. (2024). E2m3a-2019-2020-water-column-time-series- south Adriatic. doi: 10.13120/QAC0-1S48
Cardin V., Ursella L., Le Meur J., Siena G., Mansutti P., Fabio B., et al. (2025). E2m3a-2021-2022-water-column-time-series- south Adriatic. doi: 10.13120/S046-JA62
Cardin V., Wirth A., Khosravi M., Gačić M. (2020b). South Adriatic recipes: Estimating the vertical mixing in the deep pit. Front. Mar. Sci. 7. doi: 10.3389/fmars.2020.565982
Chiggiato J., Bergamasco A., Borghini M., Falcieri F. M., Falco P., Langone L., et al. (2016). Dense-water bottom currents in the southern Adriatic sea in spring 2012. Mar. Geol. 375, 134–145. doi: 10.1016/j.margeo.2015.09.005
Civitarese G., Gačić M., Batistić M., Bensi M., Cardin V., Dulčić J., et al. (2023). The bios mechanism: History, theory, implications. Prog. Oceanogr. 216, 103056. doi: 10.1016/j.pocean.2023.103056
Cushman-Roisin B., Gacic M., Poulain P.-M., Artegiani A. (2001). Physical Oceanography of the Adriatic Sea: Past, Present and Future. (Dordrecht: Springer). doi: 10.1007/978-94-015-9819-4
Di Biagio V., Martellucci R., Menna M., Teruzzi A., Amadio C., Mauri E., et al. (2023). Dissolved oxygen as an indicator of multiple drivers of the marine ecosystem: the southern Adriatic sea case study. State Planet 1-osr7, 10. doi: 10.5194/sp-1-osr7-10-2023
Escudier R., Clementi E., Cipollone A., Pistoia J., Drudi M., Grandi A., et al. (2021). A high resolution reanalysis for the Mediterranean sea. Front. Earth Sci. 9. doi: 10.3389/feart.2021.702285
Escudier R., Clementi E., Omar M., Cipollone A., Pistoia J., Aydogdu A., et al. (2020). Mediterranean sea physical reanalysis (cmems med-currents) (version 1). Frontiers in Earth Science, 9. doi: 10.3389/feart.2021.702285
EU Copernicus Marine Service Information, C (2024). Global Ocean Physics Reanalysis. doi: 10.48670/moi-00021
Gačić M., Borzelli G. L. E., Civitarese G., Cardin V., Yari S. (2010). Can internal processes sustain reversals of the ocean upper circulation? The Ionian sea example. Geophys. Res. Lett. 37. doi: 10.1029/2010GL043216
Gačić M., Civitarese G., Miserocchi S., Cardin V., Crise A., Mauri E. (2002). The open-ocean convection in the southern Adriatic: a controlling mechanism of the spring phytoplankton bloom. Continent. Shelf Res. 22, 1897–1908. doi: 10.1016/S0278-4343(02)00050-X
Gačic M., Lascaratos A., Manca B., Mantziafou A. (2001). Adriatic Deep Water and Interaction with the Eastern Mediterranean Sea. (Dordrecht: Springer). doi: 10.1007/978-94-015-9819-44
García-Lafuente J., Delgado J., Sánchez Román A., Soto J., Carracedo L., Díaz del Río G. (2009). Interannual variability of the mediterranean outflow observed in espartel sill, western strait of Gibraltar. J. Geophys. Res.: Oceans 114. doi: 10.1029/2009JC005496
García Lafuente J., Sánchez Román A., Díaz del Río G., Sannino G., Sánchez Garrido J. C. (2007). Recent observations of seasonal variability of the mediterranean outflow in the strait of Gibraltar. J. Geophys. Res.: Oceans 112. doi: 10.1029/2006JC003992
Harris C. R., Millman K. J., van der Walt S. J., Gommers R., Virtanen P., Cournapeau D., et al. (2020). Array programming with numpy. Nature 585, 357–362. doi: 10.1038/s41586-020-2649-2
Hendershott M. C., Rizzoli P. (1976). The winter circulation of the Adriatic sea. Deep Sea Res. Oceanogr. Abstr. 23, 353–370. doi: 10.1016/0011-7471(76)90834-2
Herbasch H., Bell B., Berrisford P., Hirahara S., Horányi A., Muñoz-Sabater J., et al. (2020). The era5 global reanalysis. Q. J. R. Meteorol. Soc. 146, 1999–2049. doi: 10.1002/qj.3803
Hersbach H., Bell B., Berrisford P., Biavati G., Horányi A., Muñoz Sabater J., et al. (2023). Era5 hourly data on single levels from 1940 to present. doi: 10.24381/cds.adbb2d47
Hunter J. D. (2007). Matplotlib: A 2d graphics environment. Comput. Sci. Eng. 9, 90–95. doi: 10.1109/MCSE.2007.55
Janeković I., Mihanović H., Vilibić I., Tudor M. (2014). Extreme cooling and dense water formation estimates in open and coastal regions of the Adriatic sea during the winter of 2012. J. Geophys. Res.: Oceans 119, 3200–3218. doi: 10.1002/2014JC009865
Killworth P. D. (1983). Deep convection in the world ocean. Rev. Geophys. 21, 1–26. doi: 10.1029/RG021i001p00001
Laanaia N., Wirth A., Molines J. M., Barnier B., Verron J. (2010). On the numerical resolution of the bottom layer in simulations of oceanic gravity currents. Ocean Sci. 6, 563–572. doi: 10.5194/os-6-563-2010
Lipizer M., Partescano E., Rabitti A., Giorgetti A., Crise A. (2014). Qualified temperature, salinity and dissolved oxygen climatologies in a changing Adriatic sea. Ocean Sci. 10, 771–797. doi: 10.5194/os-10-771-2014
Manca B., Ibello V., Pacciaroni M., Scarazzato P., Giorgetti A. (2006). Ventilation of deep waters in the Adriatic and Ionian seas following changes in thermohaline circulation of the eastern Mediterranean. Climate Res. - Climate Res. 31, 239–256. doi: 10.3354/cr031239
Mantziafou A., Lascaratos A. (2004). An eddy resolving numerical study of the general circulation and deep-water formation in the Adriatic sea. Deep Sea Res. Part I: Oceanogr. Res. Pap. 51, 921–952. doi: 10.1016/j.dsr.2004.03.006
Marini M., Russo A., Paschini E., Grilli F., Campanelli A. (2006). Short-term physical and chemical variations in the bottom water of middle Adriatic depressions. Climate Res. 31, 227–237. doi: 10.3354/cr031227
Marshall J., Schott F. (1999). Open-ocean convection: Observations, theory, and models. Rev. Geophys. 37, 1–64. doi: 10.1029/98RG02739
Martellucci R., Menna M., Mauri E., Pirro A., Gerin R., Paladini de Mendoza F., et al. (2024). Recent changes of the dissolved oxygen distribution in the deep convection cell of the southern adriatic sea. J. Mar. Syst. 245, 103988. doi: 10.1016/j.jmarsys.2024.103988
McDougall T., Barker P. (2011). Getting started with teos-10 and the gibbs seawater (gsw) oceanographic toolbox. SCOR/IAPSO WG 127, 1–28.
McKinney (2010). “Data Structures for Statistical Computing in Python,” in Proceedings of the 9th Python in Science Conference. Eds. van der Walt S., Millman J., 56–61. doi: 10.25080/Majora-92bf1922-00a
Mihanović H., Janeković I., Vilibić I., Kovačević V., Bensi M. (2018). Modelling interannual changes in dense water formation on the northern Adriatic shelf. Pure Appl. Geophys. 175, 4065–4081. doi: 10.1007/s00024-018-1935-5
Mihanović H., Vilibić I., Carniel S., Tudor M., Russo A., Bergamasco A., et al. (2013). Exceptional dense water formation on the adriatic shelf in the winter of 2012. Ocean Sci. 9, 561–572. doi: 10.5194/os-9-561-2013
Neri F., Romagnoli T., Accoroni S., Campanelli A., Marini M., Grilli F., et al. (2022). Phytoplankton and environmental drivers at a long-term offshore station in the northern Adriatic sea, (1988–2018). Continent. Shelf Res. 242, 104746. doi: 10.1016/j.csr.2022.104746
Nigam T., Escudier R., Pistoia J., Aydogdu A., Omar M., Clementi E., et al. (2021). Mediterranean sea physical reanalysis interim (cmems med-currents, e3r1i system) (version 1). doi: 10.25423/CMCC/MEDSEA\MULTIYEAR\PHY\006\004\E3R1
Ovchinnikov I. M., Zats V. I., Krivosheia V. G., Udodov A. I. (1985). Formation of deep eastern Mediterranean waters in the Adriatic sea. Oceanology 25, 704–707.
Paladini de Mendoza F., Miserocchi S., Langone L., Giordano P., Schroeder K., Borghini M., et al. (2024a). Moored ADCP measurements in the Southern Adriatic Sea at mooring site BB and FF, June 2020 - April 2023. doi: 10.5281/zenodo.10604970
Paladini de Mendoza F., Miserocchi S., Langone L., Giordano P., Schroeder K., Borghini M., et al. (2024b). Moored CTD measurements in the Southern Adriatic Sea at mooring site BB and FF, June 2020 - March 2022. doi: 10.5281/zenodo.14576897
Paladini de Mendoza F., Schroeder K., Langone L., Chiggiato J., Borghini M., Giordano P., et al. (2022a). Deep-water hydrodynamic observations of two moorings sites on the continental slope of the southern Adriatic sea (mediterranean sea). Earth Sys. Sci. Data 14, 5617–5635. doi: 10.5194/essd-14-5617-2022
Paladini de Mendoza F., Schroeder K., Langone L., Chiggiato J., Borghini M., Giordano P., et al. (2022b). Moored current and temperature measurements in the Southern Adriatic Sea at mooring site BB and FF, March 2012-June 2020. doi: 10.5281/zenodo.7311090
Querin S., Bensi M., Cardin V., Solidoro C., Bacer S., Mariotti L., et al. (2016). Saw-tooth modulation of the deep-water thermohaline properties in the southern adriatic sea. J. Geophys. Res.: Oceans 121, 4585–4600. doi: 10.1002/2015JC011522
Rétif S., Negretti M. E., Wirth A. (2024). Predicting the vertical density structure of oceanic gravity current intrusions. Sci. Rep. 14, 10274. doi: 10.1038/s41598-024-60878-x
Richardson P., Bower A., Zenk W. (2000). A census of meddies tracked by floats. Prog. Oceanogr. 45, 209–250. doi: 10.1016/S0079-6611(99)00053-1
Rubino A., Romanenkov D., Zanchettin D., Cardin V., Hainbucher D., Bensi M., et al. (2012). On the descent of dense water on a complex canyon system in the southern adriatic basin. Continent. Shelf Res. 44, 20–29. doi: 10.1016/j.csr.2010.11.009
Schott F., Visbeck M., Send U., Fischer J., Stramma L., Desaubies Y. (1996). Observations of deep convection in the gulf of lions, northern Mediterranean, during the winter of 1991/92. J. Phys. Oceanogr. 26, 505–524. doi: 10.1175/1520-0485(1996)026〈0505:OODCIT〉2.0.CO;2
Seabold S., Perktold J. (2010). “Statsmodels: Econometric and statistical modeling with python,” in Proceedings of the 9th Python in Science Conference, eds. van der Walt S., Millman J. 92–96. doi: 10.25080/Majora-92bf1922-011
Simpson J. E. (1982). Gravity currents in the laboratory, atmosphere, and ocean. Annu. Rev. Fluid Mechan. 14, 213–234. doi: 10.1146/annurev.fl.14.010182.001241
Supić N., Orlić M. (1999). Seasonal and interannual variability of the northern Adriatic surface fluxes. J. Mar. Syst. 20, 205–229. doi: 10.1016/S0924-7963(98)00083-9
Supić N., Vilibić I. (2006). Dense water characteristics in the northern Adriatic in the 1967–2000 interval with respect to surface fluxes and po river discharge rates. Estuarine Coast. Shelf Sci. 66, 580–593. doi: 10.1016/j.ecss.2005.11.003
Testor P., Bosse A., Houpert L., Margirier F., Mortier L., Legoff H., et al. (2018). Multiscale observations of deep convection in the Northwestern Mediterranean sea during winter 2012–2013 using multiple platforms. J. Geophys. Res.: Oceans 123, 1745–1776. doi: 10.1002/2016JC012671
Vilibić I. (2003). An analysis of dense water production on the north Adriatic shelf. Estuarine Coast. Shelf Sci. 56, 697–707. doi: 10.1016/S0272-7714(02)00277-9
Vilibić I., Orlić M. (2001). Least-squares tracer analysis of water masses in the south Adriatic, (1967–1990). Deep Sea Res. Part I: Oceanogr. Res. Pap. 48, 2297–2330. doi: 10.1016/S0967-0637(01)00014-0
Vilibić I., Orlić M. (2002). Adriatic water masses, their rates of formation and transport through the otranto strait. Deep Sea Res. Part I: Oceanogr. Res. Pap. 49, 1321–1340. doi: 10.1016/S0967-0637(02)00028-6
Vilibić I., Pranić P., Denamiel C. (2023). North adriatic dense water: lessons learned since the pioneering work of mira zore-armanda 60 years ago, 53–78. doi: 10.32582/aa.64.1.11
Virtanen P., Gommers R., Oliphant T. E., Haberland M., Reddy T., Cournapeau D., et al. (2020). Scipy 1.0: fundamental algorithms for scientific computing in python. Nat. Methods 17, 261–272. doi: 10.1038/s41592-019-0686-2
Keywords: gravity current, deep sea, Adriatic, physical oceanographic processes, time series, instruments and data processing, EMSO-ERIC
Citation: Le Meur J, Wirth A, Paladini de Mendoza F, Miserocchi S and Cardin V (2025) Intermittent supply of dense water to the deep South Adriatic Pit: an observational study. Front. Mar. Sci. 12:1516780. doi: 10.3389/fmars.2025.1516780
Received: 24 October 2024; Accepted: 17 February 2025;
Published: 27 March 2025.
Edited by:
Chunyan Li, Louisiana State University, United StatesReviewed by:
Shijian Hu, Chinese Academy of Sciences (CAS), ChinaCopyright © 2025 Le Meur, Wirth, Paladini de Mendoza, Miserocchi and Cardin. This is an open-access article distributed under the terms of the Creative Commons Attribution License (CC BY). The use, distribution or reproduction in other forums is permitted, provided the original author(s) and the copyright owner(s) are credited and that the original publication in this journal is cited, in accordance with accepted academic practice. No use, distribution or reproduction is permitted which does not comply with these terms.
*Correspondence: Julien Le Meur, amxlbWV1ckBvZ3MuaXQ=
Disclaimer: All claims expressed in this article are solely those of the authors and do not necessarily represent those of their affiliated organizations, or those of the publisher, the editors and the reviewers. Any product that may be evaluated in this article or claim that may be made by its manufacturer is not guaranteed or endorsed by the publisher.
Research integrity at Frontiers

Learn more about the work of our research integrity team to safeguard the quality of each article we publish.