Abstract
Due to the complex coastline and topography, changes of temperature and circulation in global shelf seas caused by typhoons have significantly region-specific three-dimensional structures. As one temperate semi-enclosed shelf sea, the Yellow Sea is highly susceptible to typhoons in summer. In August 2012 Typhoon Damrey moving northwestward over the Yellow Sea was observed to cause significant bottom temperature warming in the southern coastal waters of the Shandong Peninsula, but its impacts on the three-dimensional changes of temperature and circulation in the whole Yellow Sea and the underlying dynamics are still unclear. Using observations and high-resolution numerical simulations, we showed that during Damrey’s passage the South Yellow Sea exhibited spatially coherent surface cooling, particularly forming a distinct surface cooling band on the right side of the typhoon track. With the mixed layer deepening, the subsurface layer deepened and experienced temperature warming, especially on the right side of the typhoon track. The surface cooling and subsurface warming were primarily caused by strong wind-enhanced vertical mixing. In the deep layer, temperature exhibited pronounced warming in the southern coastal waters of the Shandong Peninsula but cooling in a southeast-northwest band along the bottom slope just off the Subei Shoal. Bottom temperature warming in the southern coastal waters of the Shandong Peninsula was caused by coastal downwelling resulting from upper layer coastward Ekman transport. Conversely, vertically consistent temperature cooling just off the Subei Shoal was caused by coastward and upward advection of cold water across the temperature fronts and thermocline due to surface layer Ekman divergence. The intensity and spatial distributions of temperature cooling just off the Subei Shoal were related to the distance between the typhoon track and Subei Shoal. Closer proximity of the typhoon track to the Subei Shoal would lead to more pronounced bottom cooling. This study enriches our understanding of three-dimensional hydrodynamic changes induced by typhoons with different tracks in the Yellow Sea.
1 Introduction
The Yellow Sea is a temperate semi-enclosed shelf sea surrounded by mainland China and the Korean Peninsula adjacent to the northwestern Pacific Ocean (Figure 1A). It connects with the East China Sea to the south and features a trough extending northwestward from the continental slope in the East China Sea to the Bohai Sea. The hydrodynamic conditions in the Yellow Sea exhibit distinct seasonal variations. During summer, strong stratification develops in the Yellow Sea, with remnant cold water from the previous winter residing in the deep layer (Guan, 1963). This cold water, known as the Yellow Sea Cold Water Mass (YSCWM), is typically delineated by the 10°C isotherm (He et al., 1959; Xia et al., 2006; Li et al., 2024). The temperature difference between the surface layer and the YSCWM can reach up to 18°C. In the bottom layer, tidal fronts separate the YSCWM from warm coastal waters (Lie, 1989; Lü et al., 2010; Zhao, 1986; Zhai et al., 2021).
Figure 1

(A) Bathymetry (color; m) in the eastern China seas and northwestern Pacific Ocean derived from the one arc-minute global relief model of Earth’s surface. The white solid rectangle indicates the model domain. Black arrows denote main currents in the East China Sea, namely the Taiwan Warm Current (TWWC), Tsushima Warm Current (TSWC) and Kuroshio Current. The white dashed line indicates the Yellow Sea Cold Water Mass (YSCWM). The green star denotes the area where ship observations were obtained by Yang et al. (2017). The inset box shows the ship observation sites (black dots) and adjacent model grids (colorful dots). (B) Tracks (gray lines) of typhoons that passed over the Yellow Sea and Bohai Sea during 1949–2023 derived from the Tropical Cyclone Data Center of the China Meteorological Administration. The thick black line denotes the track of Typhoon Damrey in August 2012. The color dots indicate the typhoon intensities, with TD for Tropical Depression, TS for Tropical Storm, STS for Severe Tropical Storm, TY for Typhoon, STY for Severe Typhoon, and SuperTY for Super Typhoon. The red line and blue line denote the tracks of Typhoon Lekima in 2019 and Bavi in 2020, respectively.
The Yellow Sea experiences frequent typhoon activities during summer−autumn (Figure 1B; Liu et al., 2022a, b). Typhoons are among the most intense synoptic phenomena on Earth and pose significant hazards to most mid- and low-latitude coastal regions globally (Zhou et al., 2019; Studholme et al., 2022). The impacts of typhoons on multi-scale oceanographic and ecological processes, as well as their mechanisms and forecasting have been a long-standing focus of international frontier researches (e.g., Price, 1981; Emanuel, 2003; Chen et al., 2013; Zhang et al., 2021; Singh and Roxy, 2022; Yan et al., 2023). In the literature, many studies have investigated the impacts of typhoons on the hydrodynamic conditions in the Yellow Sea. However, most of these studies focused on the two-dimensional processes in the surface layer driven by strong wind-induced surface onshore currents or enhanced turbulent mixing. These processes resulted in rapid coastal sea level rising and widespread sea surface temperature (SST) cooling (Kim et al., 2014; Lee et al., 2016; Fu et al., 2016; Yang et al., 2019; Ji et al., 2020; Guan et al., 2021; Yu et al., 2022).
On the other hand, limited observations and numerical simulations also suggested that typhoons could induce dramatic changes in temperature and circulation below the sea surface layer, which differed greatly between regions (Chai et al., 2020; Sun et al., 2021; Liu et al., 2022a, b). For instance, during Lekima’s northward movement along the western Yellow Sea in August 2019, Liu et al. (2022a) indicated that wind-driven coastal downwelling south of the Shandong and Liaodong Peninsulas caused rapid bottom layer temperature (BLT) increases as high as 8°C, while wind-driven coastal upwelling and bottom onshore currents north of the Shandong Peninsula resulted in rapid BLT drops of 2−5°C. During Bavi’s northward movement in the eastern Yellow Sea in August 2020, Liu et al. (2022b) noted that wind-induced Ekman divergence generated two overturning circulation systems zonally across the Yellow Sea. Coastal downwelling led to BLT warming in coastal regions away from the typhoon track, while upwelling just below the typhoon track resulted in subsurface temperature cooling in regions along the typhoon track. Meanwhile, the Ekman divergence created sea surface falling along the typhoon track, inducing strong southward barotropic currents to the left of the typhoon track. These currents subsequently accelerated the southward movement of the YSCWM and thus caused significant cooling above the southern bottom slope of the South Yellow Sea (Liu et al., 2022b).
The above findings suggested significant differences in three-dimensional structures of the temperature and circulation changes in the Yellow Sea caused by typhoons with different tracks due to the complex coastline and topography. As shown in Figure 1B, typhoons passing over the Yellow Sea can be roughly divided into five categories based on their tracks moving northward or northeastward in the western Yellow Sea, or moving northward, northwestward or northeastward in the eastern Yellow Sea. Liu et al. (2022a, b) have given the detailed three-dimensional structures of temperature and circulation changes caused by typhoons moving northward in the western and eastern Yellow Sea. However, we still lack a comprehensive understanding of the three-dimensional responses of temperature and circulation in the Yellow Sea to the other three kinds of typhoons moving northwestward or northeastward. In August 2012, Damrey moved northwestward across the Yellow Sea with a quite different track from those of Lekima in August 2019 and Bavi in August 2020 (Figure 1B). During Damrey’s passage, Yang et al. (2017) observed a rapid increase of 4−10°C in BLT in the southern coastal regions of the Shandong Peninsula. The immediate questions were whether Damrey caused significant three-dimensional changes in temperature and circulation in the Yellow Sea or not and if yes, what were their differences from those caused by Lekima and Bavi and the underlying dynamics. Therefore, this study aimed to document the three-dimensional structure of changes in temperature and circulation in the Yellow Sea in response to Damrey’s passage and to elucidate the mechanisms responsible for these changes using observations and high-resolution numerical simulations. The remainder of this paper is organized as follows. Section 2 introduces the data, model configurations, and methodology. Section 3 presents the results. Section 4 explores the dynamics. Section 5 discusses the factors influencing the temperature and circulation responses to the northwestward-moving typhoons. Finally, Section 6 provides a brief summary.
2 Data, model configuration and methodology
2.1 Typhoon Damrey
In this study, we used typhoon information obtained from the Tropical Cyclone Data Center of the China Meteorological Administration. As shown in Figure 1B, Typhoon Damrey (No. 1210) originated in the northwestern Pacific Ocean, took a southeast-northwest course, reached the East China Sea on 1 August, and then entered the Yellow Sea on 2 August in 2012. After making landfall in Jiangsu Province at 18:00 on 2 August, it turned northward, entered the Bohai Sea and dissipated at 00:00 on 4 August. Figure 2 displays the 12-hourly sea surface winds over the Yellow Sea, Bohai Sea, and adjacent areas during the passage of Damrey.
Figure 2

(A–F) 12-hourly wind direction (arrows) and speed (m/s; color) at 10 m above sea surface during the passage of Damrey over the Yellow Sea, Bohai Sea and adjacent areas in August 2012.
2.2 Observations
Daily SST obtained from the Remote Sensing Systems (REMSS; Gentemann et al., 2010) was adopted to validate the model simulation and examine temperature variations during the typhoons’ passages. The REMSS SST data set combines the through-cloud capability of microwave data with the high spatial resolution and near-coastal capability of infrared data. Merged satellite observations were from both microwave sensors, including the Global Precipitation Measurement Microwave Imager, the Tropical Rainfall Measuring Mission Microwave Imager, the National Aeronautics and Space Administration (NASA) Advanced Microwave Scanning Radiometer for Earth Observing System, the Advanced Microwave Scanning Radiometer 2, the WindSat Radiometer, and infrared sensors, such as the Moderate Resolution Imaging Spectroradiometer on the NASA Aqua and Terra platform and the Visible Infrared Imaging Radiometer Suite on board the Suomi National Polar-orbiting Partnership satellite. The REMSS SST has a spatial resolution of 0.09°, approximately 7.7–8.7 km in the Yellow Sea, and spans from June 2002 to the present.
Daily sea surface height (SSH) from the global eddy-resolving physical ocean and sea ice reanalysis at 1/12° resolution (GLORYS12; Jean-Michel et al., 2021) was adapted to validate the model simulation. The GLORYS12 product covers the altimetry period from 1993 to the present. It was produced by the Copernicus Marine Environment Monitoring Service (CMEMS), utilizing the Nucleus for European Modelling of the Ocean model, which was driven at the surface by atmospheric reanalysis data from the European Centre for Medium-Range Weather Forecasts (ECMWF). A reduced-order Kalman filter was used to assimilate available observations, including satellite-observed SST, SSH, and sea ice concentration, as well as in situ profiles of temperature and salinity.
In addition, Yang et al. (2017) conducted ship observations of temperature and salinity profiles in the southern coastal waters of the Shandong Peninsula on 1 August and 5 August before and after the passage of Damrey over the study area, respectively. Ship observation sites were marked as FS, B, C, D, E and F in Figure 1A. Note that ship observations were conducted at sites FS−E on the two days, but were also conducted at site F on 5 August. The observation sites were very close to each other and the minimum distance between them was much smaller than the model resolution as described in subsection 2.4. There were roughly four model grids that were close to the ship observation sites of Yang et al. (2017). Therefore, as shown in Figure 1A, the ship observations at observation sites FS, C, E and F were compared with the CTR simulation results at model grids FS′, C′, E′ and F′, respectively.
2.3 Atmospheric and oceanic reanalysis products
We used variables derived from the fifth-generation atmospheric reanalysis of the global climate generated by ECMWF (ERA5; Hersbach et al., 2020; Wu et al., 2020) as atmospheric forcing at the sea surface for the model simulations. The ERA5 dataset includes hourly estimates of the atmospheric, land, and oceanic climate variables from January 1940 to the present. It has a spatial resolution of 0.25°, approximately 31 km in the study area. Previous observations proved that the ERA5 dataset effectively captured the large-scale spatiotemporal variations in sea surface atmospheric forcing in the study area (Wu et al., 2020).
Additionally, the Hybrid Coordinate Ocean Model (HYCOM; Cummings and Smedstad, 2013) reanalysis data were used to provide initial and open boundary conditions for the model simulations. The HYCOM reanalysis was produced with HYCOM as the dynamical model and Navy Coupled Ocean Data Assimilation for data assimilation (Cummings, 2005). The HYCOM variables are available from January 1994 to present and cover the global ocean with a horizontal resolution of 1/12°.
2.4 Model configurations
The Regional Ocean Modeling System (ROMS; Shchepetkin and McWilliams, 2005) was used to understand the spatiotemporal variations in temperature and circulation during the passages of typhoons and the underlying dynamics. As shown in Figure 1A, the model domain included the entire East China Sea, Yellow Sea, and Bohai Sea, extending zonally from 117.4390°E to 133.8120°E and meridionally from 24.0919°N to 41.0031°N. Horizontally, ROMS employs an Arakawa C grid, allowing for local grid refinement or nesting. Vertically, ROMS utilizes a terrain-following coordinate system that stretches with changes in topography, enabling refinement at specific layers. In this study, the model simulation had a horizontal resolution of approximately 7.3 km and 20 vertical layers, with finer resolution near the sea surface. Vertical grid intervals basically increased from coastal regions to offshore regions. In the coastal regions, the smallest vertical grid interval was approximately 0.3 m. In the offshore regions where the YSCWM existed, the largest vertical grid interval near the sea surface was approximately 1.6 m and that near the sea bottom was approximately 10 m. The model topography was derived from 1 Arc-Minute Global Relief Model (ETOPO1; Amante and Eakins, 2009). Following Liu et al. (2022a), the generic length scale scheme (Umlauf and Burchard, 2003; Warner et al., 2005) was employed in the model to calculate vertical diffusion coefficients.
Initial values of temperature, salinity and current vector in the model simulation were obtained from the climatological mean variables of the HYCOM data during 1994−2023. There were three open boundaries (non-land boundaries) around the model domain (Figure 1A). Values of temperature, salinity, and subtidal current vector at the three open boundaries were derived from daily variables of the HYCOM data. Schemes proposed by Flather (1987) and Chapman (1985) were used for barotropic momentum and free surface at the three open boundaries, respectively. A mixed radiation-nudging scheme (Marchesiello et al., 2001) was adopted for the open boundary conditions of three-dimensional momentum, temperature, and salinity. Eight major tidal constituents (M2, S2, K1, O1, N2, K2, P1, Q1) extracted from the global ocean tidal model TPXO8 (Egbert and Erofeeva, 2002) were used as tidal forcing. TPXO8 is a global model of ocean barotropic tides, which best-fits, in a least-squares sense, the Laplace Tidal Equations and assimilates observations. The atmospheric forcing at the sea surface was derived from the ERA5 data Atmospheric forcing variables used in ROMS mainly included 10-m wind vectors, shortwave radiation, longwave radiation, 2-m air temperature, precipitation rate and humidity. The simulation period was from 1 January to 1 September in 2012. The above numerical simulation was defined as control (CTR) simulation.
2.5 Methodology
For two time series or spatial maps of X and Y, the correlation coefficient (R) is calculated as , the mean absolute bias (MAB) is calculated as MAB , the root mean square error (RMSE) is calculated as , where and are temporal or spatial anomalies, and denotes the time mean or space average. As different products had different spatial resolutions, the fine resolution variable was mapped onto the horizontal grid of the coarse resolution variable before the spatial correlation coefficient was calculated. In this study, the linear correlation coefficients are all above the 95% confidence level unless otherwise specified.
To examine the changes in density stratification, we calculated squared buoyancy frequency (N2) as , where was water potential density, =9.8 m/s2 was the gravity acceleration.
The temperature budget equation is expressed as
with the surface and bottom boundary conditions being
In the above equations, is water temperature, is vertical diffusivity coefficient, and , and are zonal, meridional and vertical components of the three-dimensional current vector. is the zonal coordinate being positive eastward, is the meridional coordinate being positive northward, and is the vertical coordinate being positive upward. is the net heat flux at sea surface, =3985 J (kg °C)−1 is the specific heat capacity of seawater at constant pressure, = 1025 kg m−3 is the reference density of seawater, and is the water depth. The abbreviation denoted the total change rate of temperature, denoted the change rate of temperature caused by three-dimensional current transports, and denoted the change rate of temperature caused by vertical turbulent diffusion. was the change rate of temperature caused by horizontal diffusion and was neglected in the analysis due to its small value resulting from the weak horizontal temperature gradient. All of the above temperature budget terms were directly output from the numerical model.
3 Temperature responses to the passage of Damrey
3.1 Model validation
Figures 3A–J show daily SSTs in the satellite observation and CTR simulation during Damrey’s passage over the study area. A visual comparison indicated that satellite-observed SSTs agreed with CTR-simulated SSTs, showing significant cooling on the right side of the typhoon track. The spatial correlation coefficients between satellite-observed and CTR-simulated SSTs were 0.82, 0.73, 0.69, 0.76, and 0.76 in the five days, respectively. In addition, MAB and RMSE were also relatively low, ranging from 0.77°C to 0.93°C and from 1.07°C to 1.32°C, respectively.
Figure 3

(A–J) Daily SSTs (°C) in the satellite observation and CTR simulation during Damrey’s passage over the study area from 1 August to 4 August in 2012. (K–T) Daily SSHs (m) in the satellite observation and CTR simulation during Damrey’s passage from 1 August to 4 August in 2012. In (A–T), the thick black curves denote the tracks of Damrey and the purple dots represent the positions of Damrey’s center at 0:00 of the day.
Meanwhile, daily SSHs in the satellite observation also agreed with those in the CTR simulation (Figures 3K–T). The spatial correlation coefficients between the satellite-observed and CTR-simulated SSHs were 0.96, 0.96, 0.97, 0.95, and 0.91 in the five days, respectively. MAB and RMSE between the satellite observation and CTR simulation were also relatively low, ranging from 0.14 m to 0.16 m and from 0.17 m to 0.18 m, respectively. SSH was relatively low in the entire Yellow Sea before the passage of Damrey. On 1 August, however, SSH began to rise in the South Yellow Sea, while remained almost unchanged in the North Yellow Sea. On 2−3 August, high SSH appeared in the Bohai Sea and South Yellow Sea, especially in the northwestward coastal areas of the Bohai Sea and southern coastal areas of the Shandong Peninsula. On 4 August, SSH decreased to low values after the typhoon dissipated.
The ship observations demonstrated the commonly-existed vertical structure of temperature profiles in the Yellow Sea, which was composed of an upper mixed layer, thermocline and a deep mixed layer, consistent with previous studies (Figures 4A–C; Zhai et al., 2021; Li et al., 2024). Damrey induced surface water cooling of approximately 2°C, subsurface water warming up to 10°C, bottom water warming of approximately 4°C, and deepening of both the mixed layer and thermocline by roughly 10 meters (Figures 4D). Figures 4E–H show the CTR-simulated temperature profiles in days of ship observations of Yang et al. (2017). Overall, the CTR simulation well reproduced the ship-observed vertical structures of temperature profiles. The deep layer temperature was warmer in the CTR simulation than in ship observations, and hence the thermal stratification was slightly weaker in the CTR simulation than in ship observations, possibly because that tidal mixing in the model simulation was weaker than that in reality. Though with smaller magnitudes, the CTR simulation well reproduced dramatic changes of temperature profiles during Damrey’s passage, which consisted of surface layer cooling, stronger subsurface layer warming and weaker deep layer warming.
Figure 4

Comparisons of ship-observed and CTR-simulated profiles of temperature and salinity in the southern coastal waters of the Shandong Peninsula before and after Damrey’s passage in August 2012. (A) Ship-observed profiles of temperature (°C) on 1 August before Damrey’s passage. (B) Same as (A) but on 5 August after Damrey’s passage. (C) Mean profiles of temperature on 1 and 5 August, respectively. (D) Mean temperature profile on 5 August minus that on 1 August. (E–H) Same as (A−D) but from the CTR simulation. (I–P) Same as (A–H) but for salinity.
We also compared the ship-observed and CTR-simulated salinity profiles before and after Damrey’s passage in Figures 4I–P. The salinity profiles were composed of an upper mixed layer, halocline and a deep mixed layer, consistent with temperature profiles. Damrey induced rapidly decreasing of salinity throughout the whole water column, especially at nearshore sites, accompanying the deepening of upper mixed layer (Figures 4I–L). The largest salinity decrease was approximately −0.45 and occurred at about 9.0 m in the lower halocline. The CTR simulation well reproduced the ship-observed vertical structures of salinity profiles. The CTR-simulated salinity was larger than ship-observed salinity throughout the whole water column, possibly because that we had no observations of runoffs of all rivers from the Shandong Peninsula into the Yellow Sea and excluded them in our model simulation. Though with smaller magnitudes, the CTR simulation well reproduced the dramatic salinity decrease in the subsurface and deep layers during Damrey’s passage. The largest salinity decrease in the CTR simulation was approximately −0.15 and occurred at about 9.4 m in the lower halocline. With no river runoffs from the Shandong Peninsula, however, the CTR-simulated salinity increased during Damrey’s passage due to the strong wind-enhanced turbulent mixing.
Overall, the above comparisons indicated that the model simulation well reproduced the dramatic changes in hydrodynamic conditions in the study area during the passage of Damrey.
3.2 Three-dimensional structure
3.2.1 Changes in SST and BLT
Figures 5A, F show the daily SST and BLT on 31 July, 2012 just before the arrival of Damrey in the Yellow Sea and Bohai Sea. In the model simulations, the deepest layer was chosen as the bottom layer. On 31 July, SST in the Yellow Sea basically decreased northward with higher values in the South Yellow Sea and southern coastal waters of the Bohai Sea than in other areas. The bottom layer was significantly characterized by shoreward-increasing temperature with the presence of the YSCWM in the central Yellow Sea and relatively warm waters in the coastal areas.
Figure 5
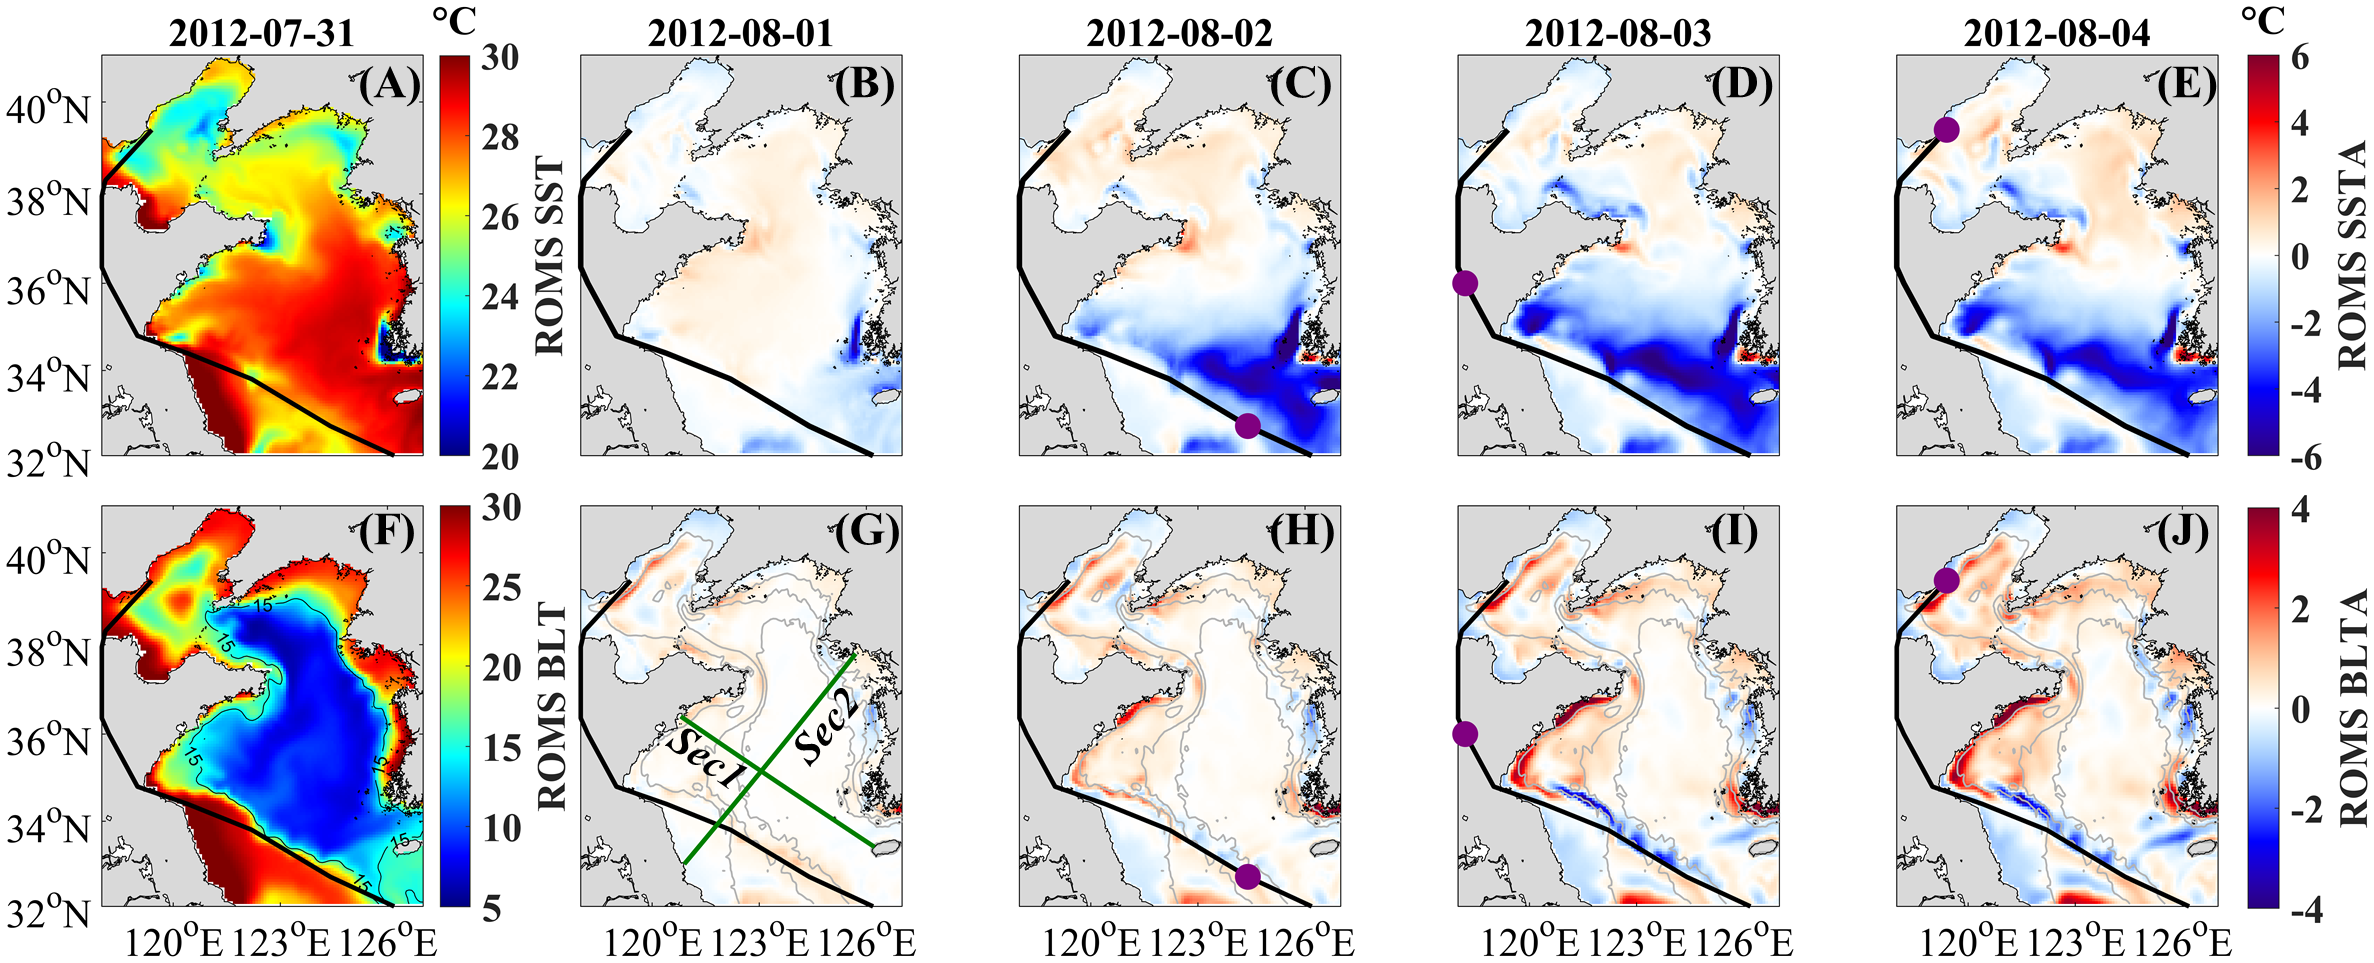
Changes in SST (°C) and BLT (°C) during the passage of Damrey over the study area from the CTR simulation. (A) Daily mean SST on 31 July. (B–E) SST changes (°C) in different days since 31 July. (F–J) Same as (A–E) but for daily mean BLT and its changes. In each panel, the thick black curve denotes the track of Damrey and the purple dot represents the center position of Damrey at 0:00 of that day. In (G), green lines denote the sections basically parallel (Sec1) and perpendicular (Sec2) to the track of Damrey.
Figures 5B–E show SST differences between 1−4 August and 31 July. On 1 August, sea surface cooling began in the southwestern coastal waters of the Korean Peninsula. From 2 to 3 August, sea surface cooling intensified, expanded spatially northwestward and eventually occurred in the entire South Yellow Sea. The most significant SST cooling was concentrated in a southeast-northwest band just along the right side of Damrey’s track, with the most intense SST cooling exceeding 5°C. Additionally, large areas with sea surface cooling also emerged off the northeastern Shandong Peninsula since 3 August. On 4 August, the spatial extent of SST cooling slightly decreased.
BLT changes were more complex than SST changes (Figures 5G–J). Notable BLT changes first appeared on 2 August and then intensified over time, peaking in magnitude on 3 August. BLT changes were more significant in the South Yellow Sea than in the North Yellow Sea. In the South Yellow Sea, significant BLT cooling up to 2°C occurred in a narrow southeast-northwest band just along the east side of the Damrey’s track. In other regions, however, BLT experienced warming. The most pronounced BLT warming, also exceeding 2°C, occurred in the southern coastal waters of the Shandong Peninsula. This BLT warming was consistent with ship observations of Yang et al. (2017). In the other areas with BLT warming, the temperature increases were generally less than 1°C. In the North Yellow Sea, BLT experienced cooling in the northern coastal waters of the Shandong Peninsula and warming in the southern coastal waters of the Liaodong Peninsula.
From above results, we could see that the spatial distributions of changes in SST and BLT induced by the northwestward-moving Damrey were quite different from those caused by Lekima and Bavi, which moved northward in the western and eastern Yellow Sea (Liu et al., 2022a, b).
3.2.2 Vertical structure
Given the significant differences between changes in SST and BLT during the passage of Damrey, it was useful to investigate the vertical structure of temperature changes throughout the entire water column. To this end, we examined the temperature changes along two sections in the South Yellow Sea (Figure 5G). Sec1 ran parallel to the Damrey’s track, extending from the northwestern areas off Cheju Island to the southern coastal areas of the Shandong Peninsula, where BLT warming was most pronounced. Sec2 extended from the Subei Shoal to the northern Ganghwa Bay, basically perpendicular to Damrey’s track. Both Sec1 and Sec2 traversed regions experiencing substantial changes in SST and BLT. Before the typhoon’s passage, temperatures on the two sections (Figures 6A, B) revealed that the Yellow Sea featured a shallow mixed layer and a strong thermocline, with the deep layer being occupied by cold water. Waters exhibited higher temperatures in nearshore areas than in offshore areas (Liu et al., 2022b; Li et al., 2024).
Figure 6
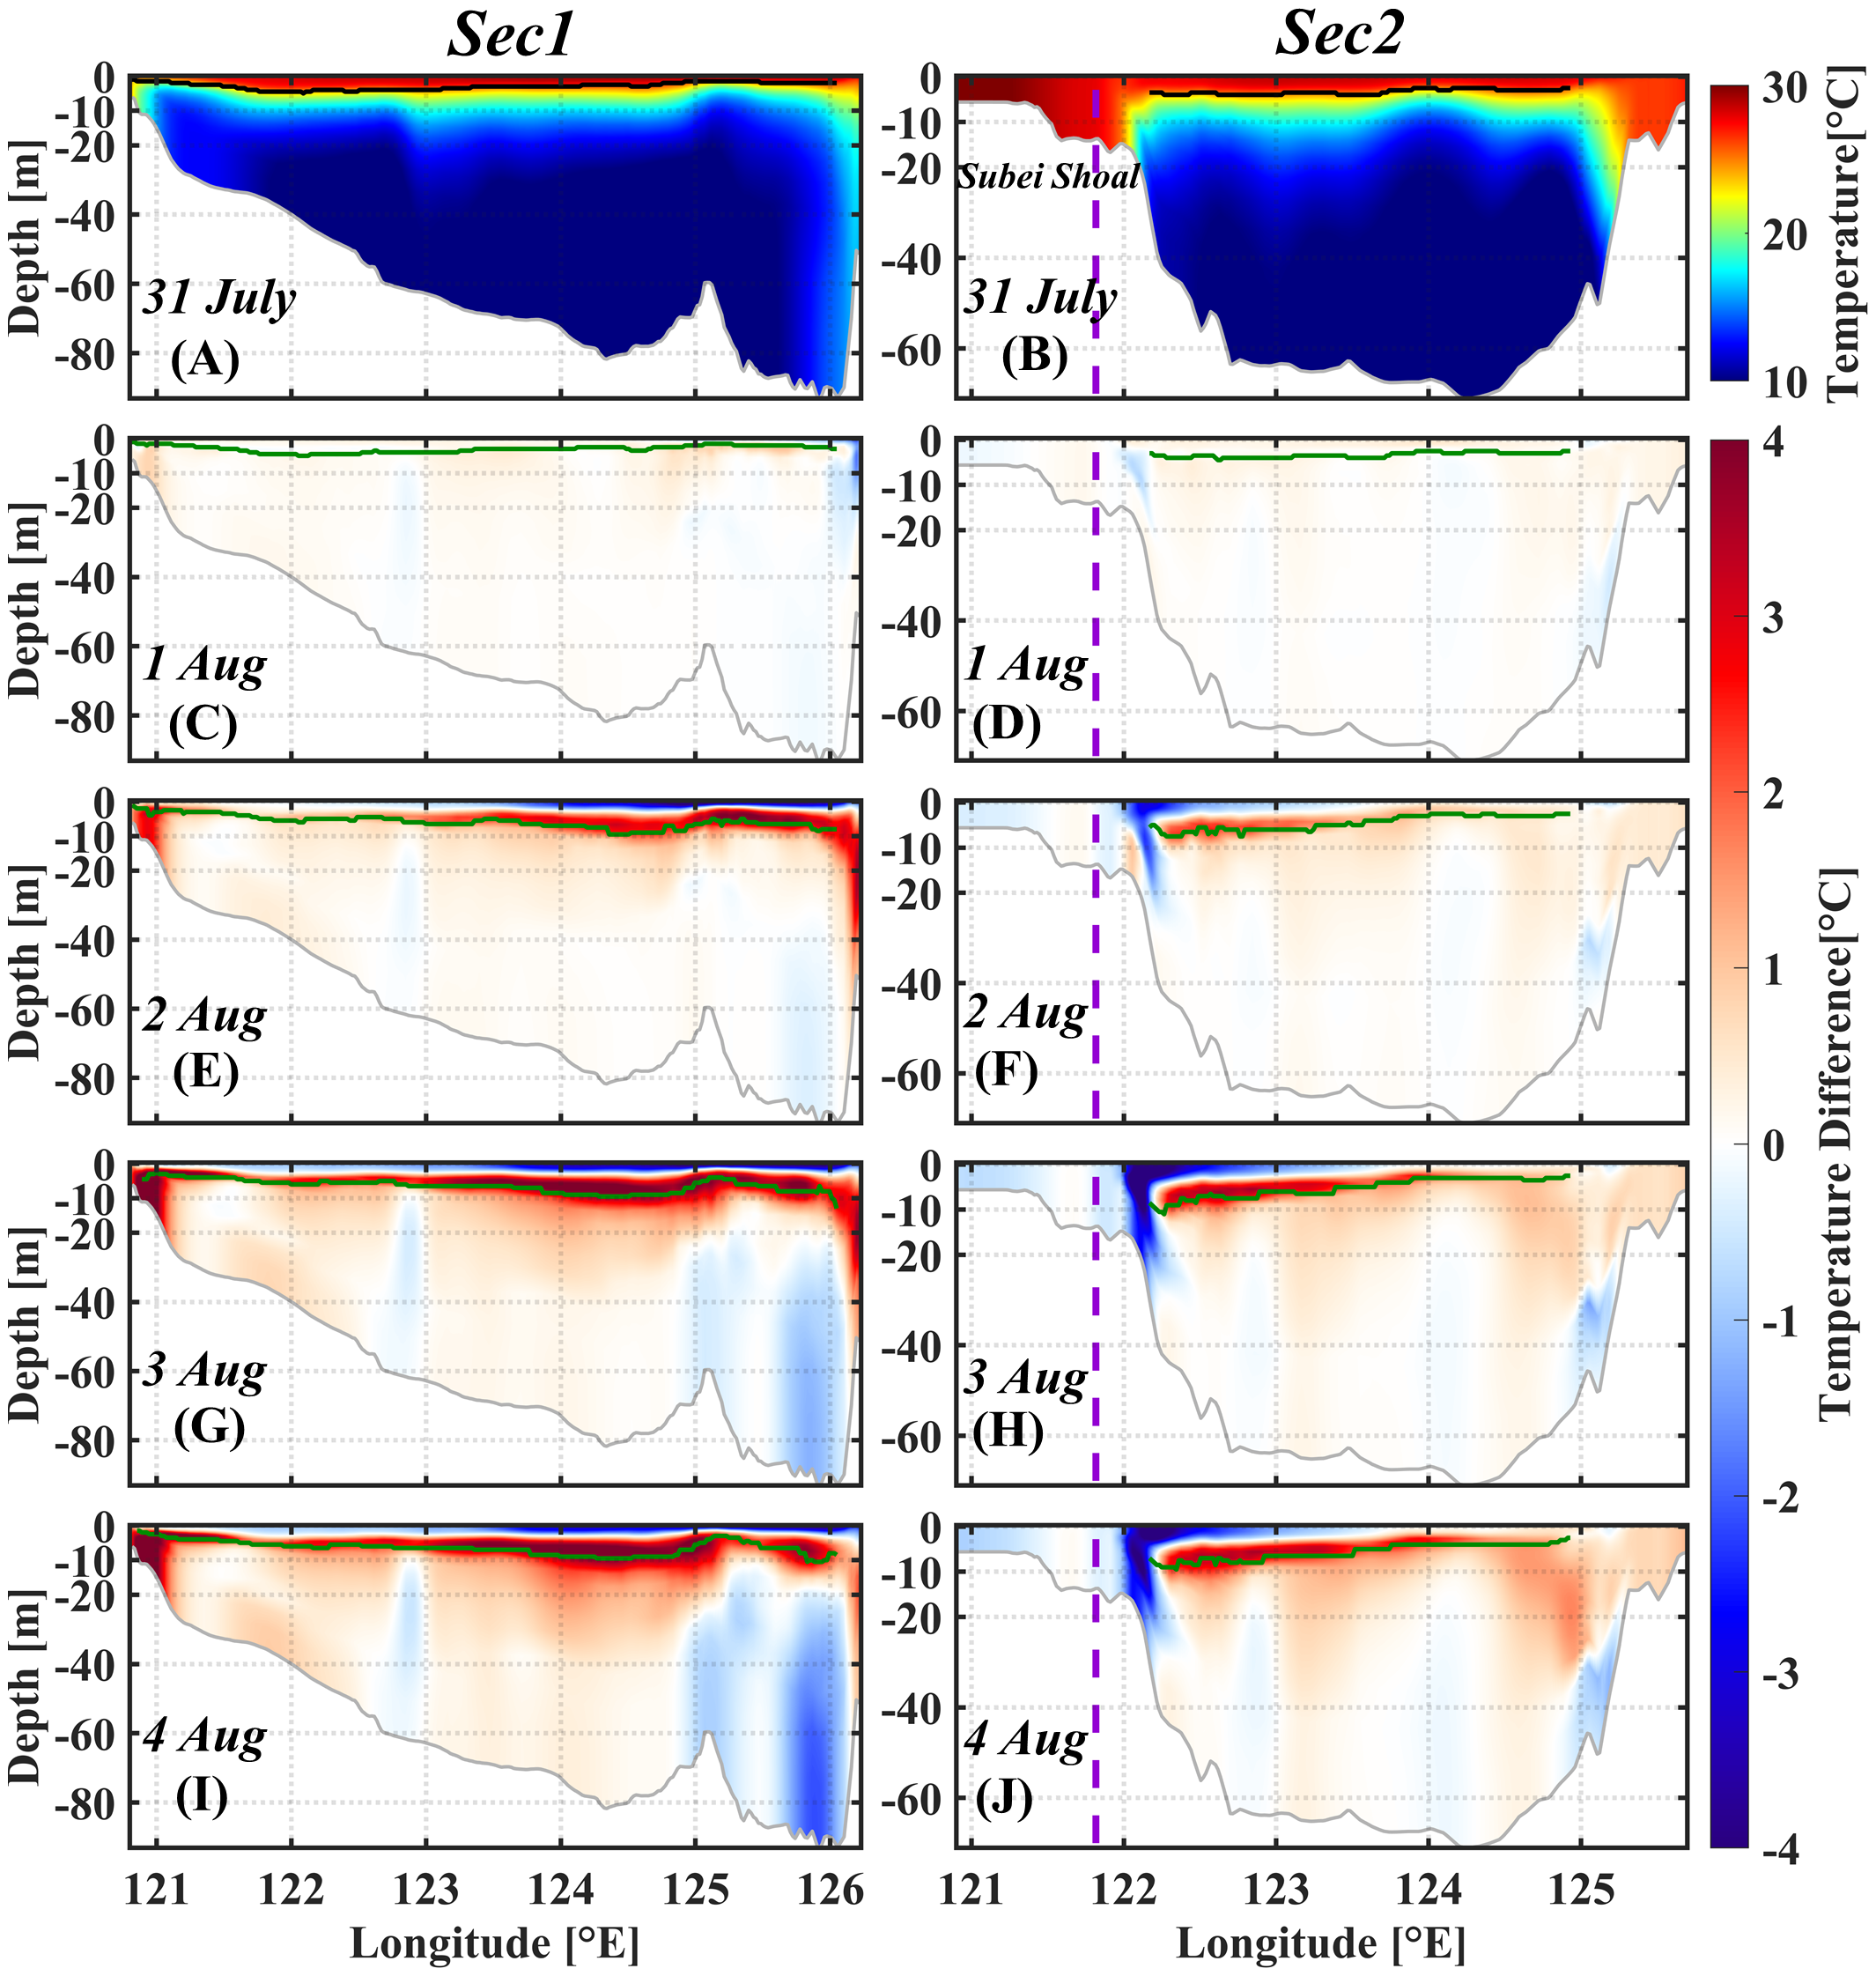
(A, B) Daily temperature (°C) on Sec1 parallel to the Damrey’s track and on Sec2 perpendicular to the Damrey’s track on 31 July. (C, D) Daily temperature changes (°C) since 31 July on Sec1 and Sec2 on 1 August. (E, F) Same as (C, D) but on 2 August. (G, H) Same as (C, D) but on 3 August. (I, J) Same as (C, D) but on 4 August. In each panel, the thick black or green line marks the depth of maximum N2 (s−2). The purple dashed line in the right panel indicates Damrey’s center at Sec2 during its passage.
Figures 6C–J present temperature changes at Sec1 and Sec2 during the passage of Damrey over the study area. Different from temperature changes in both the sea surface and bottom layers as shown in the above subsection, temperature in the subsurface layer exhibited significant warming along Sec1 and in most offshore areas along Sec2. The subsurface temperature warming connected with BLT warming in the southern coastal waters of the Shandong Peninsula along Sec1. The timing of subsurface temperature warming coincided with that of surface temperature cooling. On the contrary, vertically consistent temperature cooling occurred above the shelf break just off the Subei Shoal along Sec2. Based on previous studies (Liu et al., 2022a), this intense cooling of the entire water column was possibly caused by upwelling, which, in conjunction with other physical processes, strengthened sea surface cooling to its right. The underlying dynamics would be further investigated in the following section.
With quite different temperature changes in different layers, it was useful to examine the changes in density stratification. For that purpose, we showed in Figure 6 the variations in the depth of maximum N². As clearly seen from the figure, maximum N² greatly deepened with the passage of Damrey, reaching its maximum depth on 3 August.
As shown in Figure 7, subsurface temperature warming and density stratification deepening occurred in nearly the entire Yellow Sea except for the Subei Shoal. The most significant subsurface temperature warming mainly appeared on the right side of Damrey’s track in offshore areas and in the southern coastal areas of the Shandong Peninsula in the South Yellow Sea. On the other hand, the most significant density stratification deepening mainly occurred on the right side of Damrey’s track.
Figure 7
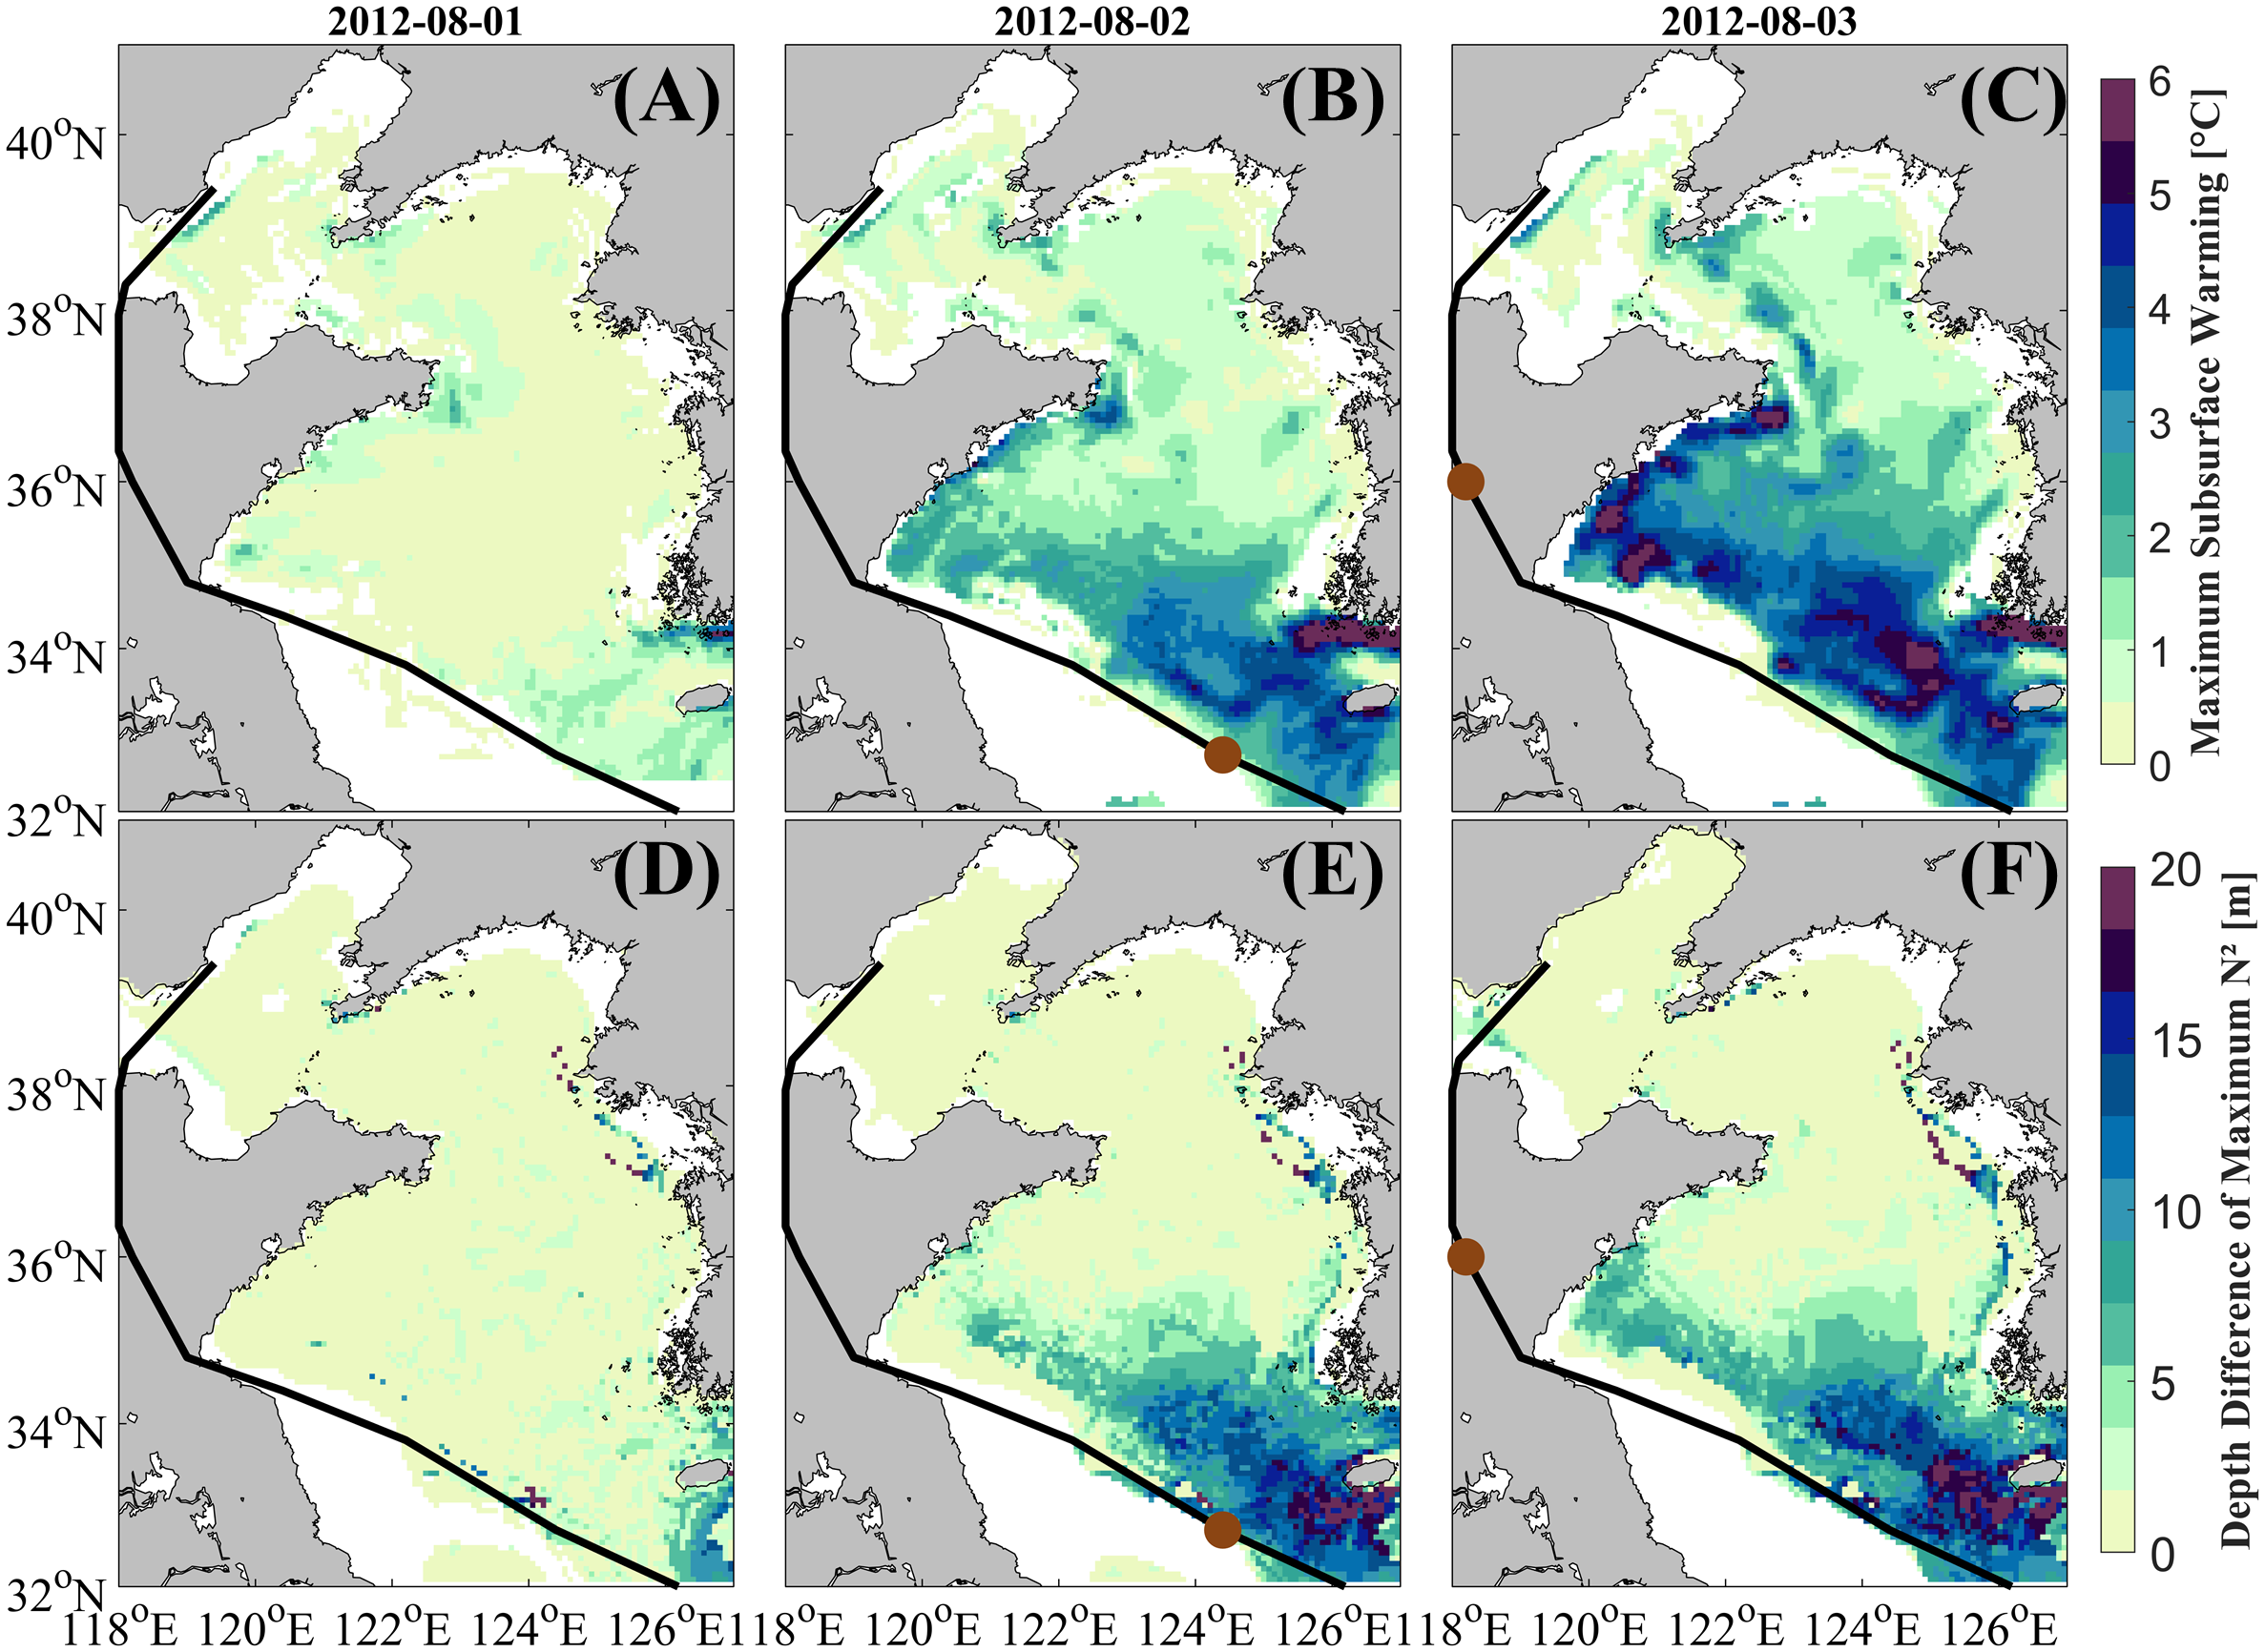
(A−C) Maximum subsurface temperature warming in different days since 31 July. (D−F) Depth difference (m) of the maximum N2 in different days since 31 July. In each panel, the thick black curve denotes the track of Damrey and the brown dot represents center position of Damrey at 0:00 of that day. In all panels, only results in regions with maximum N2 larger than 1.5 × 10⁻⁴ s−2 were shown.
4 Mechanisms
4.1 Temperature budget analysis
Note that Damrey passed over the Yellow Sea mainly on 2 August (Figure 2). To gain more insights into the underlying dynamics, Figure 8 gives daily mean temperature budget terms in the surface, subsurface, and bottom layers on 2 August. The spatial distributions of temperature change rates () were consistent with those of temperature changes. In the surface layer, showed spatially coherent negative values in most regions of the South Yellow Sea, and the largest temperature cooling rates occurred in a southeast-northwest band on the right side of the typhoon track. The negative was primarily caused by in most regions of the South Yellow Sea and by in sporadic coastal regions of the Korean Peninsula.
Figure 8

(A) Daily mean rate of temperature change (, °C/s) in the surface layer on 2 August. (B) Same as (A) but caused by turbulent vertical diffusion (, °C/s). (C) Same as (A) but caused by three-dimensional current transport (, °C/s). (D−F) Same as (A−C) but in the subsurface layer at 15 m. (G−I) Same as (A−C) but in the bottom layer. Dashed lines indicate temperature contours with an interval of 5.0°C. In each panel, the thick black curve denotes the track of Damrey.
In the subsurface layer at 15 m, positive values dominated most of the South Yellow Sea, forming a southeast-northwest band along the right side of Damrey’s track. The positive was primarily attributed to . This finding indicated that surface temperature cooling and subsurface temperature warming in the majority of the Yellow Sea were caused by the strengthened vertical mixing generated by the typhoon’s strong sea surface winds (Liu et al., 2022a, b). On the contrary, the positive in the southern coastal areas of the Shandong Peninsula was mainly caused by . The negative above the southern bottom slope of the South Yellow Sea just off the Subei Shoal was also caused by .
In the bottom layer, however, the was caused by different processes in different regions. The significant band-shaped negative along the bottom slope off the Subei Shoal and in the western coastal areas of the Korean Peninsula in the South Yellow Sea was dominated by . The positive in the southern coastal areas of the Shandong Peninsula, however, was caused by the combined effects of and .
From the above analyses, we could conclude that surface temperature cooling and subsurface temperature warming were primarily caused by strengthened vertical mixing in the majority of the Yellow Sea. The bottom water warming off the southern coast of the Shandong Peninsula was a joint effect of current transport and vertical mixing. However, the cooling of the entire water column just off the Subei Shoal was mainly contributed by the current transports across the temperature front and thermocline around the YSCWM.
4.2 Three-dimensional circulation changes
Temperature budget analyses suggested that three-dimensional current transport made significant contributions to temperature changes during Damrey’s passage, especially in the coastal areas and above the bottom slope. To fully understand the underlying processes, it was necessary to examine the three-dimensional circulation changes during Damrey’s passage over the Yellow Sea. For that purpose, Figures 9A–F display the spatiotemporal variations in daily ocean currents in both the sea surface and bottom layers from 31 July to 2 August. In each day, we subtracted tidal current vectors from hourly ocean current vectors and then calculated the average of residual current vectors to obtain daily ocean current vectors. By comparison, ocean currents on 31 July before Damrey’s passage were much weaker and thus not discussed further in this analysis.
Figure 9
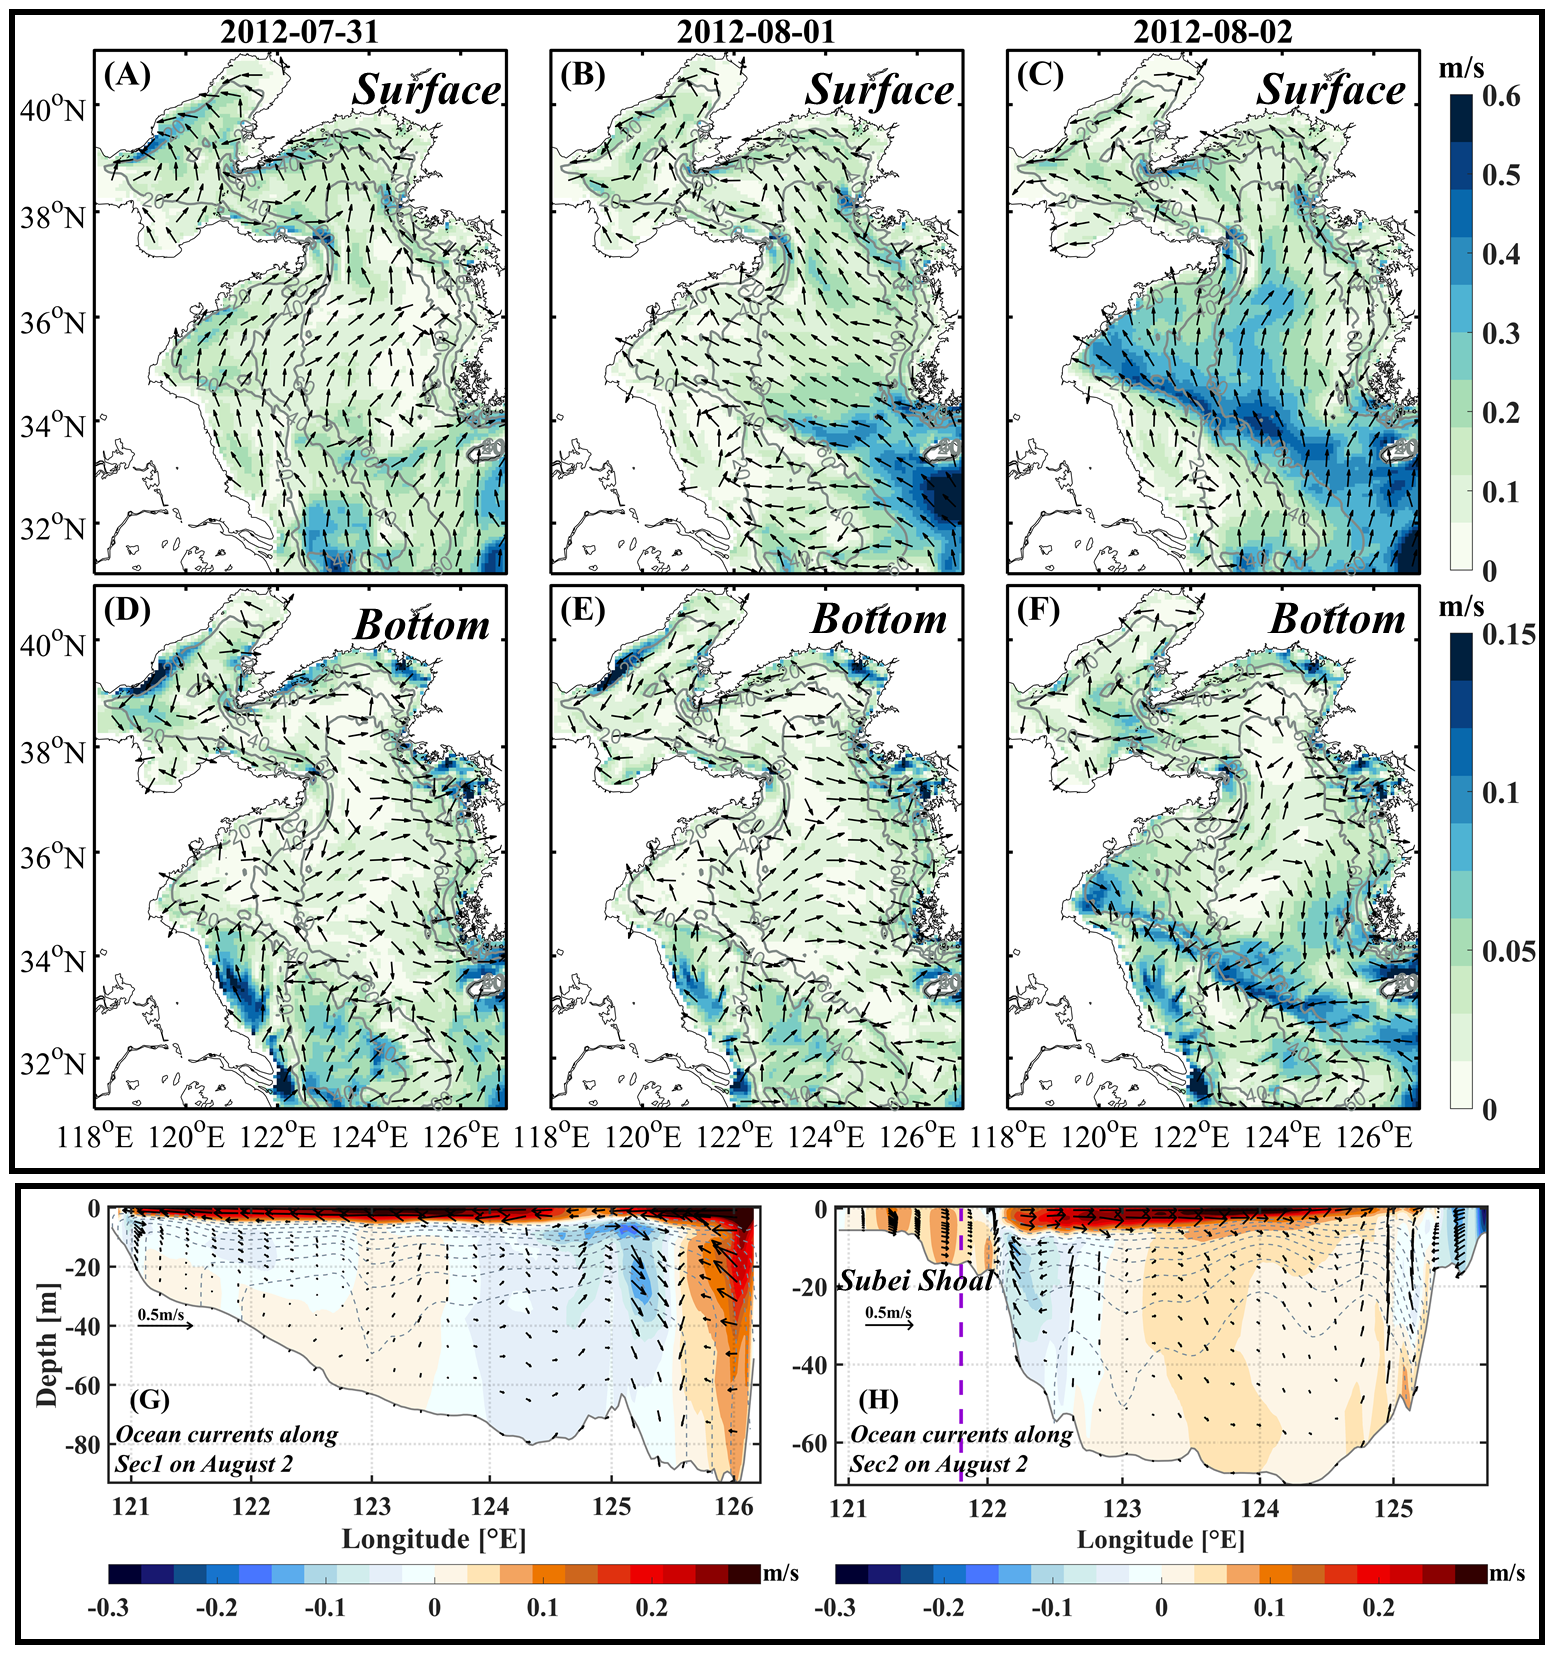
(A–C) Daily ocean current speed (color; m/s) and direction (arrow) in the surface layer from 31 July to 2 August. (D–F) Same as (A–C) but in the bottom layer. Gray lines (A−F) denote topographic contours with an interval of 20 m. (G) Ocean currents along Sec1 on 2 August. Color indicates the horizontal current, which is positive northwestward. (H) same as (G) but along Sec2. Color indicates the horizontal current, which is positive northeastward, and the purple dashed line indicates Damrey’s center on Sec2 during its passage. In (G, H), the vertical current is multiplied by 10,000 for clarity and gray dashed lines are temperature contours from 10°C to 24°C with an interval of 2°C on 2 August.
Damrey’s powerful winds began to trigger strong sea surface currents in the southeastern Yellow Sea after 12:00 on 1 August. Sea surface currents in the southeastern Yellow Sea flowed northwestward, with a maximum speed of approximately 0.6 m/s appearing to the southwest of the Cheju Island. On 2 August, as Damrey’s center moved primarily through the Yellow Sea, sea surface currents greatly strengthened across the entire basin. Sea surface currents were characterized by a strong northwestward current band just to the right side of the typhoon track and shifted to flow northward in other areas of the Yellow Sea. The current speeds in the strong northwestward current band usually exceeded 0.4 m/s, reaching up to 0.6 m/s. In contrast, sea surface current speed on the left side of the typhoon track was significantly weaker. In comparison with Figure 2, one could know that the strong sea surface currents were wind-forced Ekman currents in nature, which were deflected to the right with respect to sea surface winds, consistent with the situations during the passages of Lekima and Bavi (Liu et al., 2022a, b).
In the bottom layer, ocean currents were much smaller than those in the surface layer. The currents remained relatively unchanged on 1 August. However, on 2 August, distinct seaward currents, flowing in the opposite direction to the surface currents, appeared in the southern coastal areas of the Shandong Peninsula. Another hotspot region with strong ocean currents was along the bottom slope just off the Subei Shoal, where water depth increased northwestward rapidly from approximately 20 m to 40−60 m. The strong ocean currents exceeded 0.15 m/s and shifted to northwestward, crossing the isobaths and flowing consistently toward the typhoon track.
Clearly, ocean current changes in the surface and bottom layers in response to Damrey’s passage were opposite to each other in the southern coastal areas of the Shandong Peninsula and along the bottom slope off the Subei Shoal. To find out whether ocean currents in these areas exhibited a two-layer vertical structure, we examined ocean currents along Sec1 and Sec2. As seen in Figure 9G, the most striking feature along Sec1 was that ocean currents were characterized by a two-layer structure with opposite directions in depth layers above and below the upper limit of the subsurface temperature warming layer in the western part along the section. Especially along the southern coastal areas of the Shandong Peninsula, the two-layer currents were connected by coastal downwelling, crossing the tidal front and bringing warm waters downward. Along Sec2, two-layer ocean currents with opposite directions also could be seen along the bottom slope just off the Subei Shoal, and were connected to each other with significant upwelling (Figure 9H). The upwelling crossed the tidal front and brought the cold water upward. The above analyses suggested that just off the Subei Shoal, the strong wind-driven Ekman flow in the surface layer had significantly larger speed on the right side of Damrey’s track than on the left side. This phenomenon led to Ekman divergence below sea surface, especially on the right side of the typhoon track, causing Ekman pumping and resulting in upwelling just below and on the slightly right side of the typhoon center. The bottom layer water then flowed towards the center of this upwelling zone driven by horizontal pressure gradient force (Liu et al., 2022b).
To conclude, sea surface currents were primarily wind-forced Ekman currents in the South Yellow Sea during Damrey’s passage. They transported a large amount of water to accumulate along the south coast of the Shandong Peninsula, generating coastal downwelling. The coastal downwelling then transported warm surface water to deeper layers, leading to vertically consistent temperature warming below the surface. In contrast, wind-forced Ekman currents dispersed above the bottom slope just off the Subei Shoal, inducing upwelling. The upwelling transported cold water from the deep layer to sea surface layer, leading to vertically consistent temperature cooling.
5 Discussion
5.1 Impact of bottom topography
As indicated in previous studies (Liu et al., 2022a, b; Yan et al., 2023) and above sections, bottom topography played a quite important role in the three-dimensional responses of temperature and circulation in the shelf seas to typhoons. We conducted a numerical experiment (EXP_TOPO) to give more insights into the exact impacts of bottom topography in the current study. Model configurations of the EXP_TOPO simulation were nearly the same to those of the CTR simulation except that bottom topography in the EXP_TOPO simulation was modified to decrease linearly eastward to exclude the bottom slope just off the Subei Shoal (Figure 10A).
Figure 10
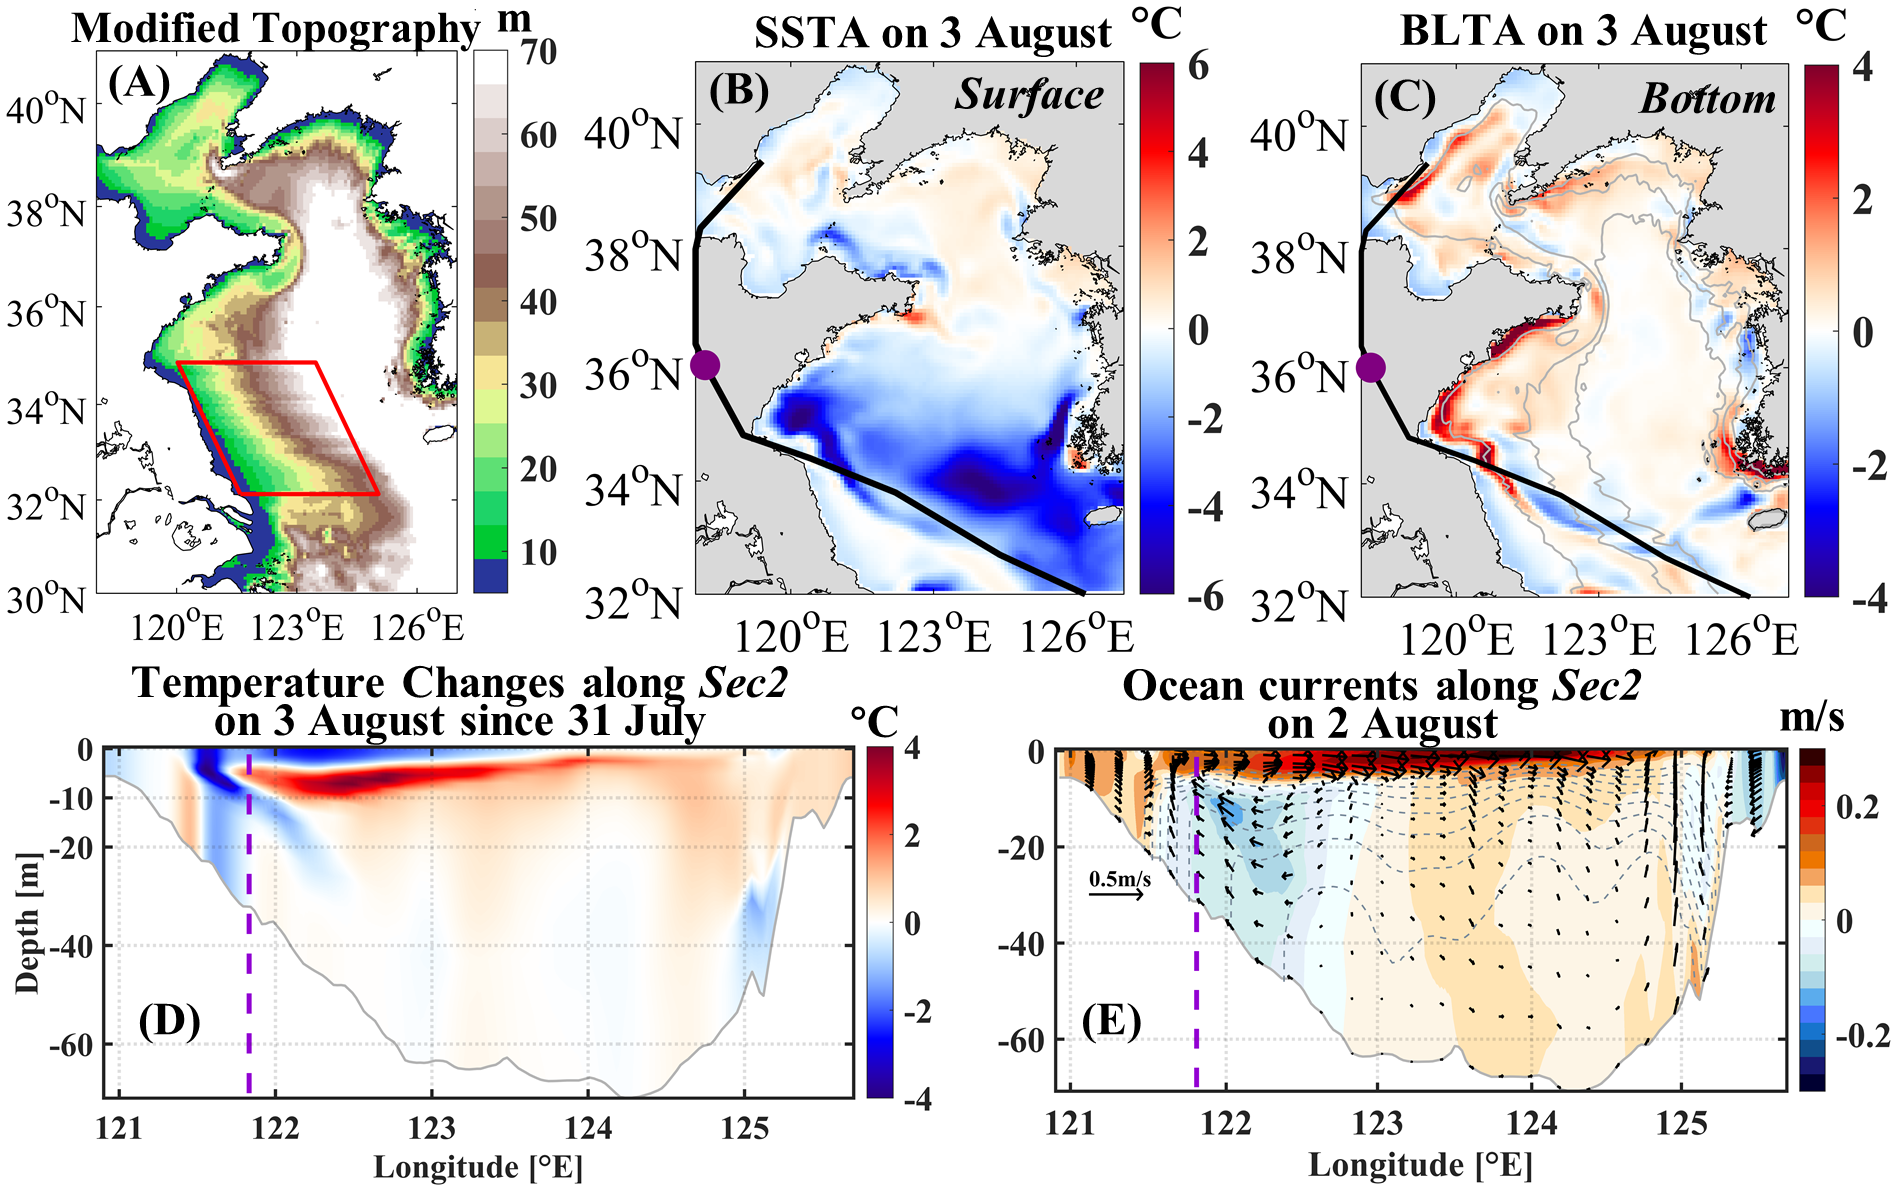
Bathymetry and changes in temperature and circulation in the EXP_TOPO simulation. (A) Bathymetry (m) in EXP_TOPO with the red box indicating the region where bottom topography was modified. (B) Daily SST changes (°C) on 3 August since 31 July. (C) Same as (B) but for daily BLT changes (°C). (D) Same as (B) but for temperature changes along Sec2. (E) Ocean currents along Sec2 on 2 August. Color indicates the horizontal current, which is positive northeastward. The vertical current component was multiplied by 10,000 for clarity. The gray dashed lines were temperature contours from 10°C to 24°C with an interval of 2°C on 2 August. In (D, E), the purple dashed lines indicate the typhoon’s center at Sec2 during its passage.
Figures 10B–D show the temperature changes in the EXP_TOPO simulation. Both SST cooling and bottom warming off the Subei Shoal moved closer to the coast in the EXP_TOPO simulation than in the CTR simulation. The vertically consistent temperature cooling moved shoreward from the right side of the typhoon to the left side along Sec2. On the right side of the typhoon track, there was still temperature cooling below the subsurface layer. To understand the underlying dynamics, we investigated ocean currents along Sec2 in the EXP_TOPO simulation on 2 August, because three-dimensional temperature changes dynamically resulted from three-dimensional current transports at an earlier time. Due to the absence of steep bottom slope, Damrey-induced upwelling off the Subei Shoal in the EXP_TOPO was much weaker than that in the CTR simulation (Figure 10E). The reduced upward transport of cold water then led to weaker temperature cooling. In addition, Damrey-induced upwelling also moved westward much closer to the coast in the EXP_TOPO simulation than in the CTR simulation. One could see that the bottom cold water in the EXP_TOPO simulation extended much closer to the coast and hence strengthened the thermal stratification in the coastal areas than that in the CTR simulation. This resulted in the Damrey-induced temperature cooling being located much closer to the coast than in the CTR simulation.
Therefore, the steep bottom slope was quite important in the development of the strong upwelling just off the Subei Shoal, which transported upward cold water and resulted in vertically consistent temperature cooling.
5.2 Impact of the distance between the typhoon track and the Subei Shoal
For typhoons moving northwestward over the Yellow Sea like Damrey, another important question should be discussed was whether the distance between the typhoon tracks and the bottom slope just off the Subei Shoal could greatly influence the three-dimensional temperature responses or not. To answer that question, we conducted a series of numerical experiments by directly shifting the sea surface winds during Damrey’s passage southward by 0.5°N (Wexp1) and northward by 0.5°N (Wexp2), 1.5°N (Wexp3), and 2.5°N (Wexp4), respectively. As examples, Figures 11A–D show the sea surface winds at 12:00 on 2 August in Wexp1−Wexp4.
Figure 11

(A) Sea surface wind vectors (arrow) and speeds (color) at 12:00 on 2 August in Wexp1. (B) Same as (A) but in Wexp2. (C) Same as (A) but in Wexp3. (D) Same as (A) but in Wexp4. (E–H) Same as (A–D) but for daily SST changes (°C) on 3 August since 31 July. (I–L) Same as (A–D) but for BLT changes (°C) on 3 August since 31 July. In (E–L), the black dashed lines indicate the typhoon tracks in numerical experiments. In (L), the green line marks a meridional section (Sec3) extending northward from the Subei Shoal to the Liaodong Peninsula.
Figures 11E–L display the temperature changes in the surface and bottom layers on 3 August since 31 July in the four numerical experiments. In the sea surface layer, the strong southeast-northwest band of temperature cooling in the South Yellow Sea moved northeastward, with its spatial extent gradually expanding and its intensity decreasing, from Wexp1 to Wexp4. In contrast, SST cooling off the northeastern Shandong Peninsula greatly strengthened from Wexp1 to Wexp4. In the bottom layer, temperature warming in the coastal waters and its maximum both moved northward from Wexp1 to Wexp4.
The above results indicated that the spatial patterns of changes in SST and BLT in the numerical experiments were basically same to those in the CTR simulation. Meanwhile, the underlying dynamics responsible for temperature changes in the numerical experiments were also same to those in the CTR simulation (Figure not shown). The largest differences between temperature changes in the CTR simulation and numerical experiments mainly occurred just off the Subei Shoal and in the coastal waters of the Shandong Peninsula. To give more details of these differences and the underlying dynamics, we showed in Figure 12 the temperature changes on 3 August since 31 July and vertical velocity on 2 August along a meridional section extending northward from the Subei Shoal to the Liaodong Peninsula (Sec3, the green line in Figure 11). From Wexp1 to Wexp4, vertically consistent temperature cooling just off the Subei Shoal weakened and disappeared, vertically temperature warming below sea surface in the southern coastal waters of the Shandong Peninsula and Liaodong Peninsula strengthened, and vertically consistent temperature cooling in the northeastern coastal waters of the Shandong Peninsula also strengthened. The underlying dynamics could be inferred from the spatiotemporal variations in vertical velocity along Sec3. From Wexp1 to Wexp4, upwelling was gradually replaced with downwelling on the bottom slope just off the Subei Shoal. However, there were strengthening downwelling in the southern coastal waters of the Shandong Peninsula and Liaodong Peninsula but upwelling in the northeastern coastal waters of the Shandong Peninsula.
Figure 12

Temperature changes (°C) and vertical velocity (m/s) along Sec3 in the numerical experiments. (A) Temperature changes on 3 August since 31 July in Wexp1. (B) Vertical velocity on 2 August in Wexp1. (C, D) Same as (A, B) but in Wexp2. (E, F) Same as (A, B) but in Wexp3. (G, H) Same as (A, B) but in Wexp4.
To summarize, the distance between the typhoon track and Subei Shoal was also a crucial factor governing the three-dimensional temperature responses in the Yellow Sea to northwestward-moving typhoons. With the typhoon track moving northeastward away from the Subei Shoal, vertically consistent temperature cooling just off the Subei Shoal would abate and disappear, but vertically temperature warming below sea surface in the southern coastal waters of the Shandong Peninsula and Liaodong Peninsula and vertically consistent temperature cooling in the northeastern coastal waters of the Shandong Peninsula would strengthen.
6 Conclusion
Due to the complex coastline and topography, the changes of temperature and circulation in a semi-enclosed shelf sea caused by typhoons with different tracks would have quite different three-dimensional structures. Using high-resolution numerical simulations and experiments, the current study investigated in detail the three-dimensional changes in temperature and circulation caused by Damrey in August 2012, which was one of typhoons moving northwestward over the Yellow Sea.
The results indicated that Damrey caused dramatic temperature changes mainly in the South Yellow Sea during its passage. Surface cooling encompassed almost the entire South Yellow Sea and was strongest in a southeast-northwest band on the right side of the typhoon track. Accompanied by a deepening of the upper mixed layer, the subsurface layer exhibited warming and deepening mainly on the right side of the typhoon track. In the bottom layer, the most significant changes were warming south of the Shandong Peninsula and a pronounced cooling band along the bottom slope just off Subei Shoal and along the southwest edge of the YSCWM.
The underlying dynamics mainly involved vertical turbulent mixing and three-dimensional current transport and was summarized in Figure 13. Sea surface winds generated intense turbulent mixing in the upper layer, which resulted in surface cooling and subsurface warming. In contrast, temperature changes in the deep layer were mainly caused by three-dimensional current transports. Bottom temperature warming in the southern coastal waters of the Shandong Peninsula was caused by coastal downwelling resulting from upper layer coastward Ekman transport. Vertically consistent temperature cooling just off the Subei Shoal was caused by coastward and upward advection of cold water across the temperature fronts and thermocline due to upper layer Ekman divergence. The intensity and spatial distributions of temperature cooling just off the Subei Shoal were related to the distance between the typhoon track and Subei Shoal. Closer proximity of the typhoon track to the Subei Shoal would lead to more pronounced bottom cooling. With the typhoon track moving northeastward away from the Subei Shoal, however, vertically consistent temperature cooling just off the Subei Shoal would abate and disappear, but vertically temperature warming below sea surface in the southern coastal waters of the Shandong Peninsula and Liaodong Peninsula and vertically consistent temperature cooling in the northeastern coastal waters of the Shandong Peninsula would strengthen.
Figure 13
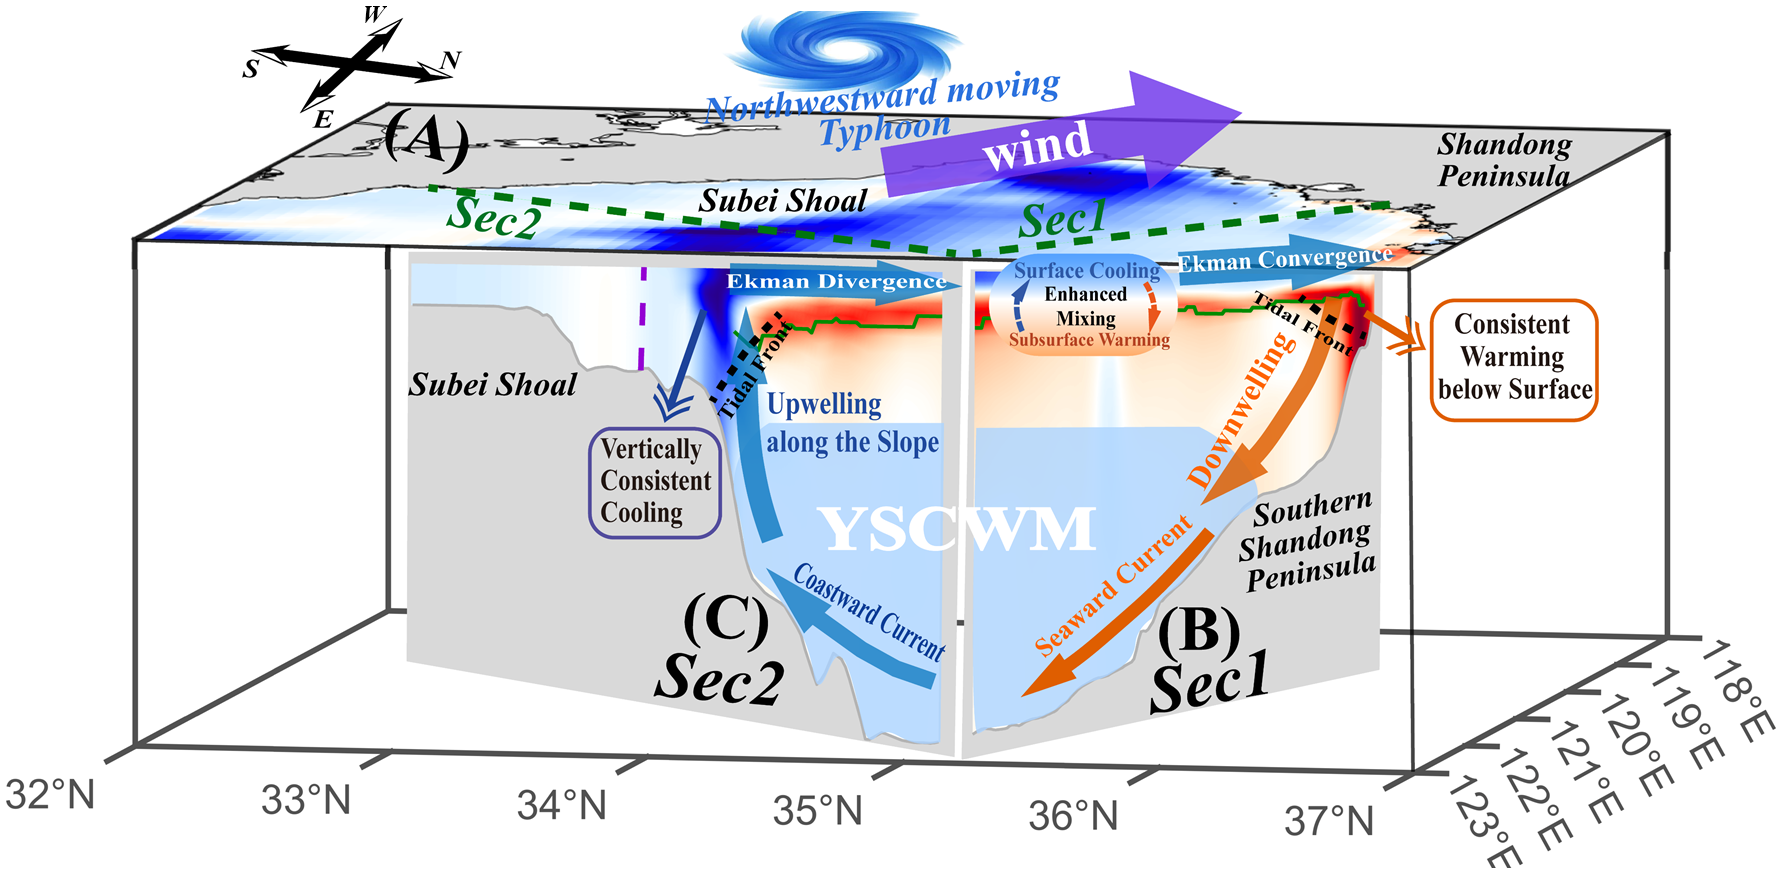
Schematic diagram illustrating processes responsible for changes in temperature and circulation in the South Yellow Sea in response to northwestward-moving typhoons. (A) Temperature changes in the sea surface layer. (B) Temperature changes and physical processes along the section parallel to the typhoon track. (C) Temperature changes and physical processes along the section perpendicular to the typhoon track.
In comparison with previous studies (Yang et al., 2017; Liu et al., 2022a, b), this study presents the first systematic investigation of the three-dimensional responses of temperature and circulation in the Yellow Sea to northwestward-moving typhoons. It also highlights that rapidly changing topography and the latitudes where northwestward-moving typhoons passed over the Yellow Sea are important factors determining the three-dimensional structures of temperature and circulation changes. Dramatic changes in the three-dimensional hydrodynamic conditions could further cause great changes in the biogeochemical processes and hence marine ecosystem, which are quite important for the sustainable development of bordering countries. In the future, more high-resolution observations and numerical simulations are needed to fully comprehend the three-dimensional physical-biogeochemical changes in the Yellow Sea in response to typhoons with different tracks and their impacts on multi-scale variations in the regional climate and ecosystem (Zhai et al., 2023, 2025).
Statements
Data availability statement
The raw data supporting the conclusions of this article will be made available by the authors, without undue reservation.
Author contributions
YM: Conceptualization, Formal analysis, Investigation, Methodology, Software, Visualization, Writing – original draft, Writing – review & editing. FZ: Conceptualization, Formal analysis, Funding acquisition, Investigation, Supervision, Writing – review & editing. XL: Methodology, Validation, Writing – review & editing. CL: Resources, Writing – review & editing. ZL: Data curation, Methodology, Validation, Writing – review & editing. YG: Resources, Writing – review & editing. PL: Resources, Writing – review & editing.
Funding
The author(s) declare financial support was received for the research, authorship, and/or publication of this article. This research was funded by the National Key Research and Development Program of China (2022YFF0801400), Scientific and Technological Projects of Zhoushan (2022C01004, 2022C81010), and National Science Foundation of China (42176016).
Conflict of interest
The authors declare that the research was conducted in the absence of any commercial or financial relationships that could be construed as a potential conflict of interest.
Generative AI statement
The author(s) declare that no Generative AI was used in the creation of this manuscript.
Publisher’s note
All claims expressed in this article are solely those of the authors and do not necessarily represent those of their affiliated organizations, or those of the publisher, the editors and the reviewers. Any product that may be evaluated in this article, or claim that may be made by its manufacturer, is not guaranteed or endorsed by the publisher.
References
1
Amante C. Eakins B. W. (2009). Data from: ETOPO1 1 Arc-Minute Global Relief Model: Procedures, Data Sources and Analysis. NOAA Technical Memorandum NESDIS NGDC-24. doi: 10.7289/V5C8276M
2
Chai X. Liang X. Zhao Y. Wu H. Wang (2020). An abnormal sea surface warming event as Typhoon Bolaven passes the Yellow Sea. Haiyang Xuebao42, 41–50. doi: 10.3969/j
3
Chapman D. C. (1985). Numerical treatment of cross-shelf open boundaries in a barotropic coastal ocean model. J. Phys. Oceanogr.15, 1060–1075. doi: 10.1175/1520-0485(1985)015<1060:NTOCSO>2.0.CO;2
4
Chen D. Lei X. Wang W. Han G. Zhou L. (2013). Upper ocean response and feedback mechanisms to typhoon. Adv. Earth Sci.10, 1077–1086. doi: 10.11867/j.issn.1001-8166.2013.10.1077
5
Cummings J. A. (2005). Operational multivariate ocean data assimilation. Quart J. R. Meteoro Soc.131, 3583–3604. doi: 10.1256/qj.05.105
6
Cummings J. A. Smedstad O. M. (2013). “Variational data assimilation for the global ocean,” in Data Assimilation for Atmospheric, Oceanic and Hydrologic Applications (Vol. II). Eds. ParkS. K.XuL. (Springer Berlin Heidelberg, Berlin, Heidelberg), 303–343. doi: 10.1007/978-3-642-35088-7_13
7
Egbert G. D. Erofeeva S. Y. (2002). Efficient Inverse modeling of barotropic ocean tides. J. Atmos. Oceanic Technol. 19, 183–204. doi: 10.1175/1520-0426(2002)019<0183:EIMOBO>2.0.CO;2
8
Emanuel K. (2003). Tropical cyclones. Annu. Rev. Earth Planetary Sci.31, 75–104. doi: 10.1146/annurev.earth.31.100901.141259
9
Flather R. A. (1987). A tidal model of the northeast pacific. Atmosphere-Ocean25, 22–45. doi: 10.1080/07055900.1987.9649262
10
Fu D. Luan H. Pan D. Zhang Y. Wang L. Liu D. et al . (2016). Impact of two typhoons on the marine environment in the Yellow Sea and East China Sea. Chin. J. Ocean. Limnol.34, 871–884. doi: 10.1007/s00343-016-5049-6
11
Gentemann C. L. Meissner T. Wentz F. J. (2010). Accuracy of satellite sea surface temperatures at 7 and 11 GHz. IEEE Trans. Geosci. Remote Sens.48, 1009–1018. doi: 10.1109/TGRS.2009.2030322
12
Guan B. (1963). A preliminary study of the variation of the temperature and the characteristics of the circulation of the Yellow Sea Cold Water Mass. Oceanography Limnologia Sin.5, 255–254.
13
Guan S. Zhao W. Sun L. Zhou C. Liu Z. Hong X. et al . (2021). Tropical cyclone-induced sea surface cooling over the Yellow Sea and Bohai Sea in the 2019 Pacific typhoon season. J. Mar. Syst.217, 103509. doi: 10.1016/j.jmarsys.2021.103509
14
He C. Wang Y. Lei Z. Xu S. (1959). A preliminary study of the formation of Yellow Sea Cold Mass and its properties. Oceanologia Limnologia Sin.2, 11–15.
15
Hersbach H. Bell B. Berrisford P. Hirahara S. Horányi A. Muñoz-Sabater J. et al . (2020). The ERA5 global reanalysis. Quart J. R. Meteoro Soc.146, 1999–2049. doi: 10.1002/qj.3803
16
Jean-Michel L. Eric G. Romain B.-B. Gilles G. Angélique M. Marie D. et al . (2021). The copernicus global 1/12° Oceanic and sea ice GLORYS12 reanalysis. Front. Earth Sci.9. doi: 10.3389/feart.2021.698876
17
Ji C. Ge Y. Li J. Liu Q. (2020). Study of the Yellow Sea responses to peripheral processes of Typhoon Chan-hom. Haiyang Xuebao42, 46–53. doi: 10.3969/j
18
Kim S. Matsumi Y. Yasuda T. Mase H. (2014). Storm surges along the Tottori coasts following a typhoon. Ocean Eng.91, 133–145. doi: 10.1016/j.oceaneng.2014.09.005
19
Lee J. Pang I. Moon J. (2016). Contribution of the Yellow Sea bottom cold water to the abnormal cooling of sea surface temperature in the summer of 2011. J. Geophysical Research: Oceans121, 3777–3789. doi: 10.1002/2016JC011658
20
Li H. Zhai F. Dong Y. Liu Z. Gu Y. Bai P. (2024). Interannual-decadal variations in the Yellow Sea Cold Water Mass in summer during 1958–2016 using an eddy-resolving hindcast simulation based on OFES2. Continental Shelf Res.275, 105223. doi: 10.1016/j.csr.2024.105223
21
Lie H.-J. (1989). Tidal fronts in the southeastern Hwanghae (Yellow Sea). Continental Shelf Res.9, 527–546. doi: 10.1016/0278-4343(89)90019-8
22
Liu X. Gu Y. Zhai F. Li P. Liu Z. Bai P. et al . (2022a). Dramatic temperature variations in the Yellow Sea during the passage of typhoon Lekima, (2019). Estuarine Coast. Shelf Sci.269, 107819. doi: 10.1016/j.ecss.2022.107819
23
Liu X. Zhai F. Yan J. Gu Y. Wang Y. Li P. et al . (2022b). Three-dimensional temperature responses to northward-moving typhoons in the shallow stratified yellow sea in summer. JGR Oceans127, e2022JC019091. doi: 10.1029/2022JC019091
24
Lü X. Qiao F. Xia C. Wang G. Yuan Y. (2010). Upwelling and surface cold patches in the Yellow Sea in summer: Effects of tidal mixing on the vertical circulation. Continental Shelf Res.30, 620–632. doi: 10.1016/j.csr.2009.09.002
25
Marchesiello P. McWilliams J. C. Shchepetkin A. (2001). Open boundary conditions for long-term integration of regional oceanic models. Ocean Model.3, 1–20. doi: 10.1016/S1463-5003(00)00013-5
26
Price J. (1981). Upper ocean response to a hurricane. J. Phys. Oceanography11, 153–175. doi: 10.1175/1520-0485(1981)011<0153:UORTAH>2.0.CO;2
27
Shchepetkin A. F. McWilliams J. C. (2005). The regional oceanic modeling system (ROMS): a split-explicit, free-surface, topography-following-coordinate oceanic model. Ocean Modelling9, 347–404. doi: 10.1016/j.ocemod.2004.08.002
28
Singh V. K. Roxy M. K. (2022). A review of ocean-atmosphere interactions during tropical cyclones in the north Indian Ocean. Earth-Science Rev.226, 103967. doi: 10.1016/j.earscirev.2022.103967
29
Studholme J. Fedorov A. V. Gulev S. K. Emanuel K. Hodges K. (2022). Poleward expansion of tropical cyclone latitudes in warming climates. Nat. Geosci.15, 14–28. doi: 10.1038/s41561-021-00859-1
30
Sun F. Yu F. Si G. Wang J. (2021). Influence of typhoon on temperature and current structure of the yellow sea. Oceanologia Limnologia Sin.52, 1125–1136. doi: 10.11693/hyhz20210200056
31
Umlauf L. Burchard H. (2003). A generic length-scale equation for geophysical turbulence models. J. Mar. Res.61, 235–265. doi: 10.1357/002224003322005087
32
Warner J. C. Sherwood C. R. Arango H. G. Signell R. P. (2005). Performance of four turbulence closure models implemented using a generic length scale method. Ocean Model.8, 81–113. doi: 10.1016/j.ocemod.2003.12.003
33
Wu W. Li P. Zhai F. Gu Y. Liu Z. (2020). Evaluation of different wind resources in simulating wave height for the Bohai, Yellow, and East China Seas (BYES) with SWAN model. Continental Shelf Res.207, 104217. doi: 10.1016/j.csr.2020.104217
34
Xia C. Qiao F. Yang Y. Ma J. Yuan Y. (2006). Three-dimensional structure of the summertime circulation in the Yellow Sea from a wave-tide-circulation coupled model. J. Geophys. Res.111, 2005JC003218. doi: 10.1029/2005JC003218
35
Yan J. Zhai F. Gu Y. Liu X. Li P. Liu Z. et al . (2023). Drastic fluctuation in water exchange between the yellow sea and bohai sea caused by typhoon lekima in august 2019: A numerical study. JGR Oceans128, e2022JC019260. doi: 10.1029/2022JC019260
36
Yang G.-B. Lü L.-G. Zhuang Z.-P. Xiong X.-J. Wang G.-S. Guo Y.-L. et al . (2017). Cruise observation of shallow water response to typhoon Damrey 2012 in the Yellow Sea. Continental Shelf Res.148, 1–8. doi: 10.1016/j.csr.2017.09.006
37
Yang Y. Li K. Du J. Liu Y. Liu L. Wang H. et al . (2019). Revealing the subsurface yellow sea cold water mass from satellite data associated with typhoon muifa. JGR Oceans124, 7135–7152. doi: 10.1029/2018JC014727
38
Yu B. Ge Y. Ren D. Ji C. Hu W. (2022). Observation of the yellow sea response to typhoon lekima. Mar. Sci.46, 10. doi: 10.11759/hykx20200616001
39
Zhai F. Liu Z. Gu Y. He S. Hao Q. Li P. (2023). Satellite-observed interannual variations in sea surface chlorophyll-a concentration in the yellow sea over the past two decades. JGR Oceans128, e2022JC019528. doi: 10.1029/2022JC019528
40
Zhai F. Liu Z. Li P. Gu Y. Sun L. Hu L. et al . (2021). Physical controls of summer variations in bottom layer oxygen concentrations in the coastal hypoxic region off the northeastern Shandong peninsula in the yellow sea. JGR Oceans126, e2021JC017299. doi: 10.1029/2021JC017299
41
Zhai F. Yu B. Dong Y. Gu Y. Liu Z. Li P. (2025). Three-dimensional structure of interannual-to-decadal variations in water temperature in the Yellow sea during 1998−2021. Clim Dyn63, 61. doi: 10.1007/s00382-024-07537-z
42
Zhang H. He H. Zhang W.-Z. Tian D. (2021). Upper ocean response to tropical cyclones: a review. Geosci. Lett.8, 1. doi: 10.1186/s40562-020-00170-8
43
Zhao B. (1986). The fronts of the Huanghai cold water mass (HCWM) induced by tidal mixing. Chin. J. Ocean. Limnol.4, 159–170. doi: 10.1007/BF02850432
44
Zhou L. Chen D. Lei X. Wang W. Wang G. Han G. (2019). Progress and perspective on interactions between ocean and typhoon. Chin. Sci. Bull.64, 60–72. doi: 10.1360/N972018-00668
Summary
Keywords
typhoon, shelf sea, temperature, circulation, three-dimensional structure
Citation
Ma Y, Zhai F, Liu X, Liu C, Liu Z, Gu Y and Li P (2025) Three-dimensional changes in temperature and circulation caused by northwestward-moving typhoons in a temperate semi-enclosed shelf sea in summer. Front. Mar. Sci. 12:1512102. doi: 10.3389/fmars.2025.1512102
Received
16 October 2024
Accepted
22 January 2025
Published
18 February 2025
Volume
12 - 2025
Edited by
Guoqi Han, Fisheries and Oceans Canada (DFO), Canada
Reviewed by
Guangjun Xu, Guangdong Ocean University, China
Yuehua Lin, Fisheries and Oceans Canada (DFO), Canada
Updates
Copyright
© 2025 Ma, Zhai, Liu, Liu, Liu, Gu and Li.
This is an open-access article distributed under the terms of the Creative Commons Attribution License (CC BY). The use, distribution or reproduction in other forums is permitted, provided the original author(s) and the copyright owner(s) are credited and that the original publication in this journal is cited, in accordance with accepted academic practice. No use, distribution or reproduction is permitted which does not comply with these terms.
*Correspondence: Fangguo Zhai, gfzhai@ouc.edu.cn
Disclaimer
All claims expressed in this article are solely those of the authors and do not necessarily represent those of their affiliated organizations, or those of the publisher, the editors and the reviewers. Any product that may be evaluated in this article or claim that may be made by its manufacturer is not guaranteed or endorsed by the publisher.