
94% of researchers rate our articles as excellent or good
Learn more about the work of our research integrity team to safeguard the quality of each article we publish.
Find out more
ORIGINAL RESEARCH article
Front. Mar. Sci., 04 April 2025
Sec. Marine Megafauna
Volume 12 - 2025 | https://doi.org/10.3389/fmars.2025.1506101
 Sophie Morisseau1,2*
 Matthieu Jeanson1,3
 Sarah Charroux1,3
 Yann Mercky1Charles Le Bozec1Michel Charpentier4Lucas Le Gall1
 Cyrielle Delvenne1
 Marc Girondot5
 Elliott Sucré1,2
 Damien Chevallier6
Understanding the spatial ecology of sea turtles is essential to ensure their long-term conservation by the preservation of their environment. The distribution and environmental preferences for egg-laying by the green turtle (Chelonia mydas) were studied on Grande Saziley beach in Mayotte (north of the Mozambique Channel). Green turtle nesting activity was geolocated during night patrols and the depth of specific nests was measured during two field campaigns in 2021 and 2022. Various original environmental parameters related to vegetation and beach morphology were extracted in a GIS environment based on this geolocated data using orthophotography and digital elevation models (DEMs) created by drones prior to field deployments. Sediment samples were also collected from the beach. Thanks to the combination of fieldwork and GIS analysis, this study makes it possible to examine a set of variables, which until now have rarely been studied simultaneously. The results showed that the Grande Saziley beach is a heterogeneous site with the distribution of egg-laying being concentrated in two hotspots. After principal component and GLMM statistical analysis, it appeared that gravid females preferentially lay in a low proportion of coarse sand at the bottom of the nest, at higher elevation and predominantly in surface sand with a low calcium carbonate content. This preference seems to be linked more to elevation, where black sand is mainly found at the top of the beach, rather than an intentional choice based on sand composition. No significant egg-laying site-related variables were found to explain the variations in nest depth. Our study was based on a new approach combining GIS techniques and drone surveys, enabling the collection of environmental parameters, a methodology that can easily be reproduced on other nesting beaches, reducing field workload. However, this work should be continued to assess the viability of sites for clutch survival while considering the spatial and temporal heterogeneity of the environment.
Habitat selection is a process by which individuals preferentially use or occupy a non-random set of available habitats (Morris, 2003). This concept is based on the ideal free distribution theory (Fretwell and Lucas, 1969) according to which animals select discrete habitats in order to maximize their fitness. However, the heterogeneity of the environment creates a multitude of habitats of varying qualities, which influence reproduction and survival rates at different spatial or temporal scales (Bloom et al., 2013; Beerens et al., 2015; Catlin et al., 2019; Maresh Nelson et al., 2020). In this respect, a distinction should be made between the available distribution (often assumed), which represents the space or environmental variables accessible to the individuals under investigation, and the used distribution, which corresponds to the same components actually used by the animal (Northrup et al., 2022). Investigating habitat selection is a fundamental aspect of species ecology and provides a way of assessing the importance of a given habitat for a species (Mayor et al., 2009). However, assessing habitat selection by individuals is a complex process. Habitat selection by animals occurs at multiple scales, both temporal and spatial (Mayor et al., 2009), and results from multiple factors that are not always easy to identify. This complexity is further compounded by the existence of various potential sources of statistical dependence such as the correlation between explanatory variables as well as spatial and temporal autocorrelation (Fieberg et al., 2010). Additionally, it is worth noting that any analysis that includes a limited number of explanatory factors may reveal significant indirect effects (Northrup et al., 2022). The analysis of habitat identification and selection is often arbitrary due to conceptual barriers or practical sampling limitations, although current research is increasingly moving towards a multiscale approach (Aarts et al., 2008; Mayor et al., 2009).
Sea turtles are one of the many species that select their nest site. In particular, the choice of egg-laying site will determine the microhabitat and directly influence the incubation conditions, notably temperature, humidity, salinity, and gas exchange, which are decisive to ensure the embryonic development of the brood (Ackerman, 1977, 1997; McGehee, 1979, 1990; Wood and Bjorndal, 2000; Miller et al., 2003). Beyond the survival of hatchlings, the egg-laying environment determined by the female represents a key issue, as it will also influence the sex ratio by temperature-dependent sex determination as well as the physical condition of the newborns (Horrocks and Scott, 1991; Heredero Saura et al., 2022). Sand characteristics, vegetation, and elevation linked to the distance from the tide are thought to be the main environmental parameters affecting abiotic factors within nest, while their characteristics will differ between nesting beaches (Mortimer, 1990; Horrocks and Scott, 1991; Zare et al., 2012; Kamel, 2013; Stewart et al., 2019; Stokes et al., 2024a). Nest characteristics, particularly depth, may also play a predominant role. For instance, deeper nests were shown to have lower temperatures and higher humidity in some locations (Ackerman, 1997; Van De Merwe et al., 2006; Marco et al., 2018; Visconti et al., 2022) leading to better hatching and emergence success and change the sex of hatchlings (Marco et al., 2018). In contrast, other studies have demonstrated a minimal effect of depth on temperature (Van De Merwe et al., 2006; Esteban et al., 2016; Stokes et al., 2024b). Female size may explain variations in nest depth, although authors do not agree about the influence of this parameter (Miller, 1997; Booth and Astill, 2001; Marco et al., 2018). However, no study has focused on the possible influence of environmental characteristics determined by the egg-laying location chosen by the female on nest depth.
Locating the used distribution, i.e. where females nesting (failure and egg-laying) and identifying the environmental parameters preferred by sea turtles for lay their egg, represents a major conservation challenge (Hamann et al., 2010), since it allows the targeting of nesting sites conducive to nesting success for each species depending on their ecology (Whitmore and Dutton, 1985; Serafini et al., 2009). Sea turtle nesting sites, located on beaches, are highly vulnerable to natural morphological changes and coastal urbanization (Cowell and Thom, 1994). Combined with sea-level rise, this “coastal squeeze” (Pontee, 2013) threatens nesting habitats, potentially reducing their availability (Mazaris et al., 2009; Varela et al., 2019; Veelenturf et al., 2020; Sönmez et al., 2021; Rivas et al., 2023). However, studies generally focus on just a few characteristics to identify the environmental preferences of sea turtles, thus identifying significant effects that may in fact be indirect. This is due to the difficulty of collecting data in the field while minimizing disturbance to egg-laying females. To overcome this constraint, our study proposes an innovative methodology combining GIS and UAV techniques, through the creation of DEMs and orthophotographs, making it possible to collect a large amount of original data, a posteriori, with fine-scale precision. Our study focuses on the Grande Saziley beach on Mayotte Island in the Southwest Indian Ocean (SWIO), which corresponds to RMU 15 (Wallace et al., 2010, 2023), and on the green sea turtle (Chelonia mydas), which was recently classified as a species of least concern in SWIO by the International Union for Conservation of Nature (IUCN) (Bourjea and Dalleau, 2023). Grande Saziley is an important nesting site on the island, with around 500 females nesting each year (Bourjea et al., 2007). The first aim of this study is to locate the used distribution by females, corresponding to nesting site (all turtle activities: egg-laying and failure, i.e. the female came to the beach but did not lay eggs) and to identify the preferred environmental parameters for egg-laying in this areas using multiparametric analysis. Second, the effects of the choice of egg-laying site on nest depth variations, is assessed. This work should be seen as a first step, whose ultimate aim is to assess whether the choice of egg-laying site by females is suitable for incubation success.
The study was conducted at Grande Saziley beach, southeastern Mayotte Island, located in the north of the Mozambique Channel in the southwestern Indian Ocean (Figure 1). Mayotte is a volcanic island surrounded by an almost uninterrupted barrier reef that encloses a lagoon. The island has a humid maritime tropical climate, characterized by an alternating monsoon rainy season (December to March) and dry season marked by trade winds (May to September). Grande Saziley beach is an isolated site, and the nearest village of Moutsamoudou is located 7 km away. Grande Saziley beach is 850 m long and 40 to 60 m wide and is bordered by a fringing reef averaging 100 m in width. Without any human development, it is surrounded by volcanic rocky promontories, and a backshore is characterized by a dry forest and partly comprised of mangroves.
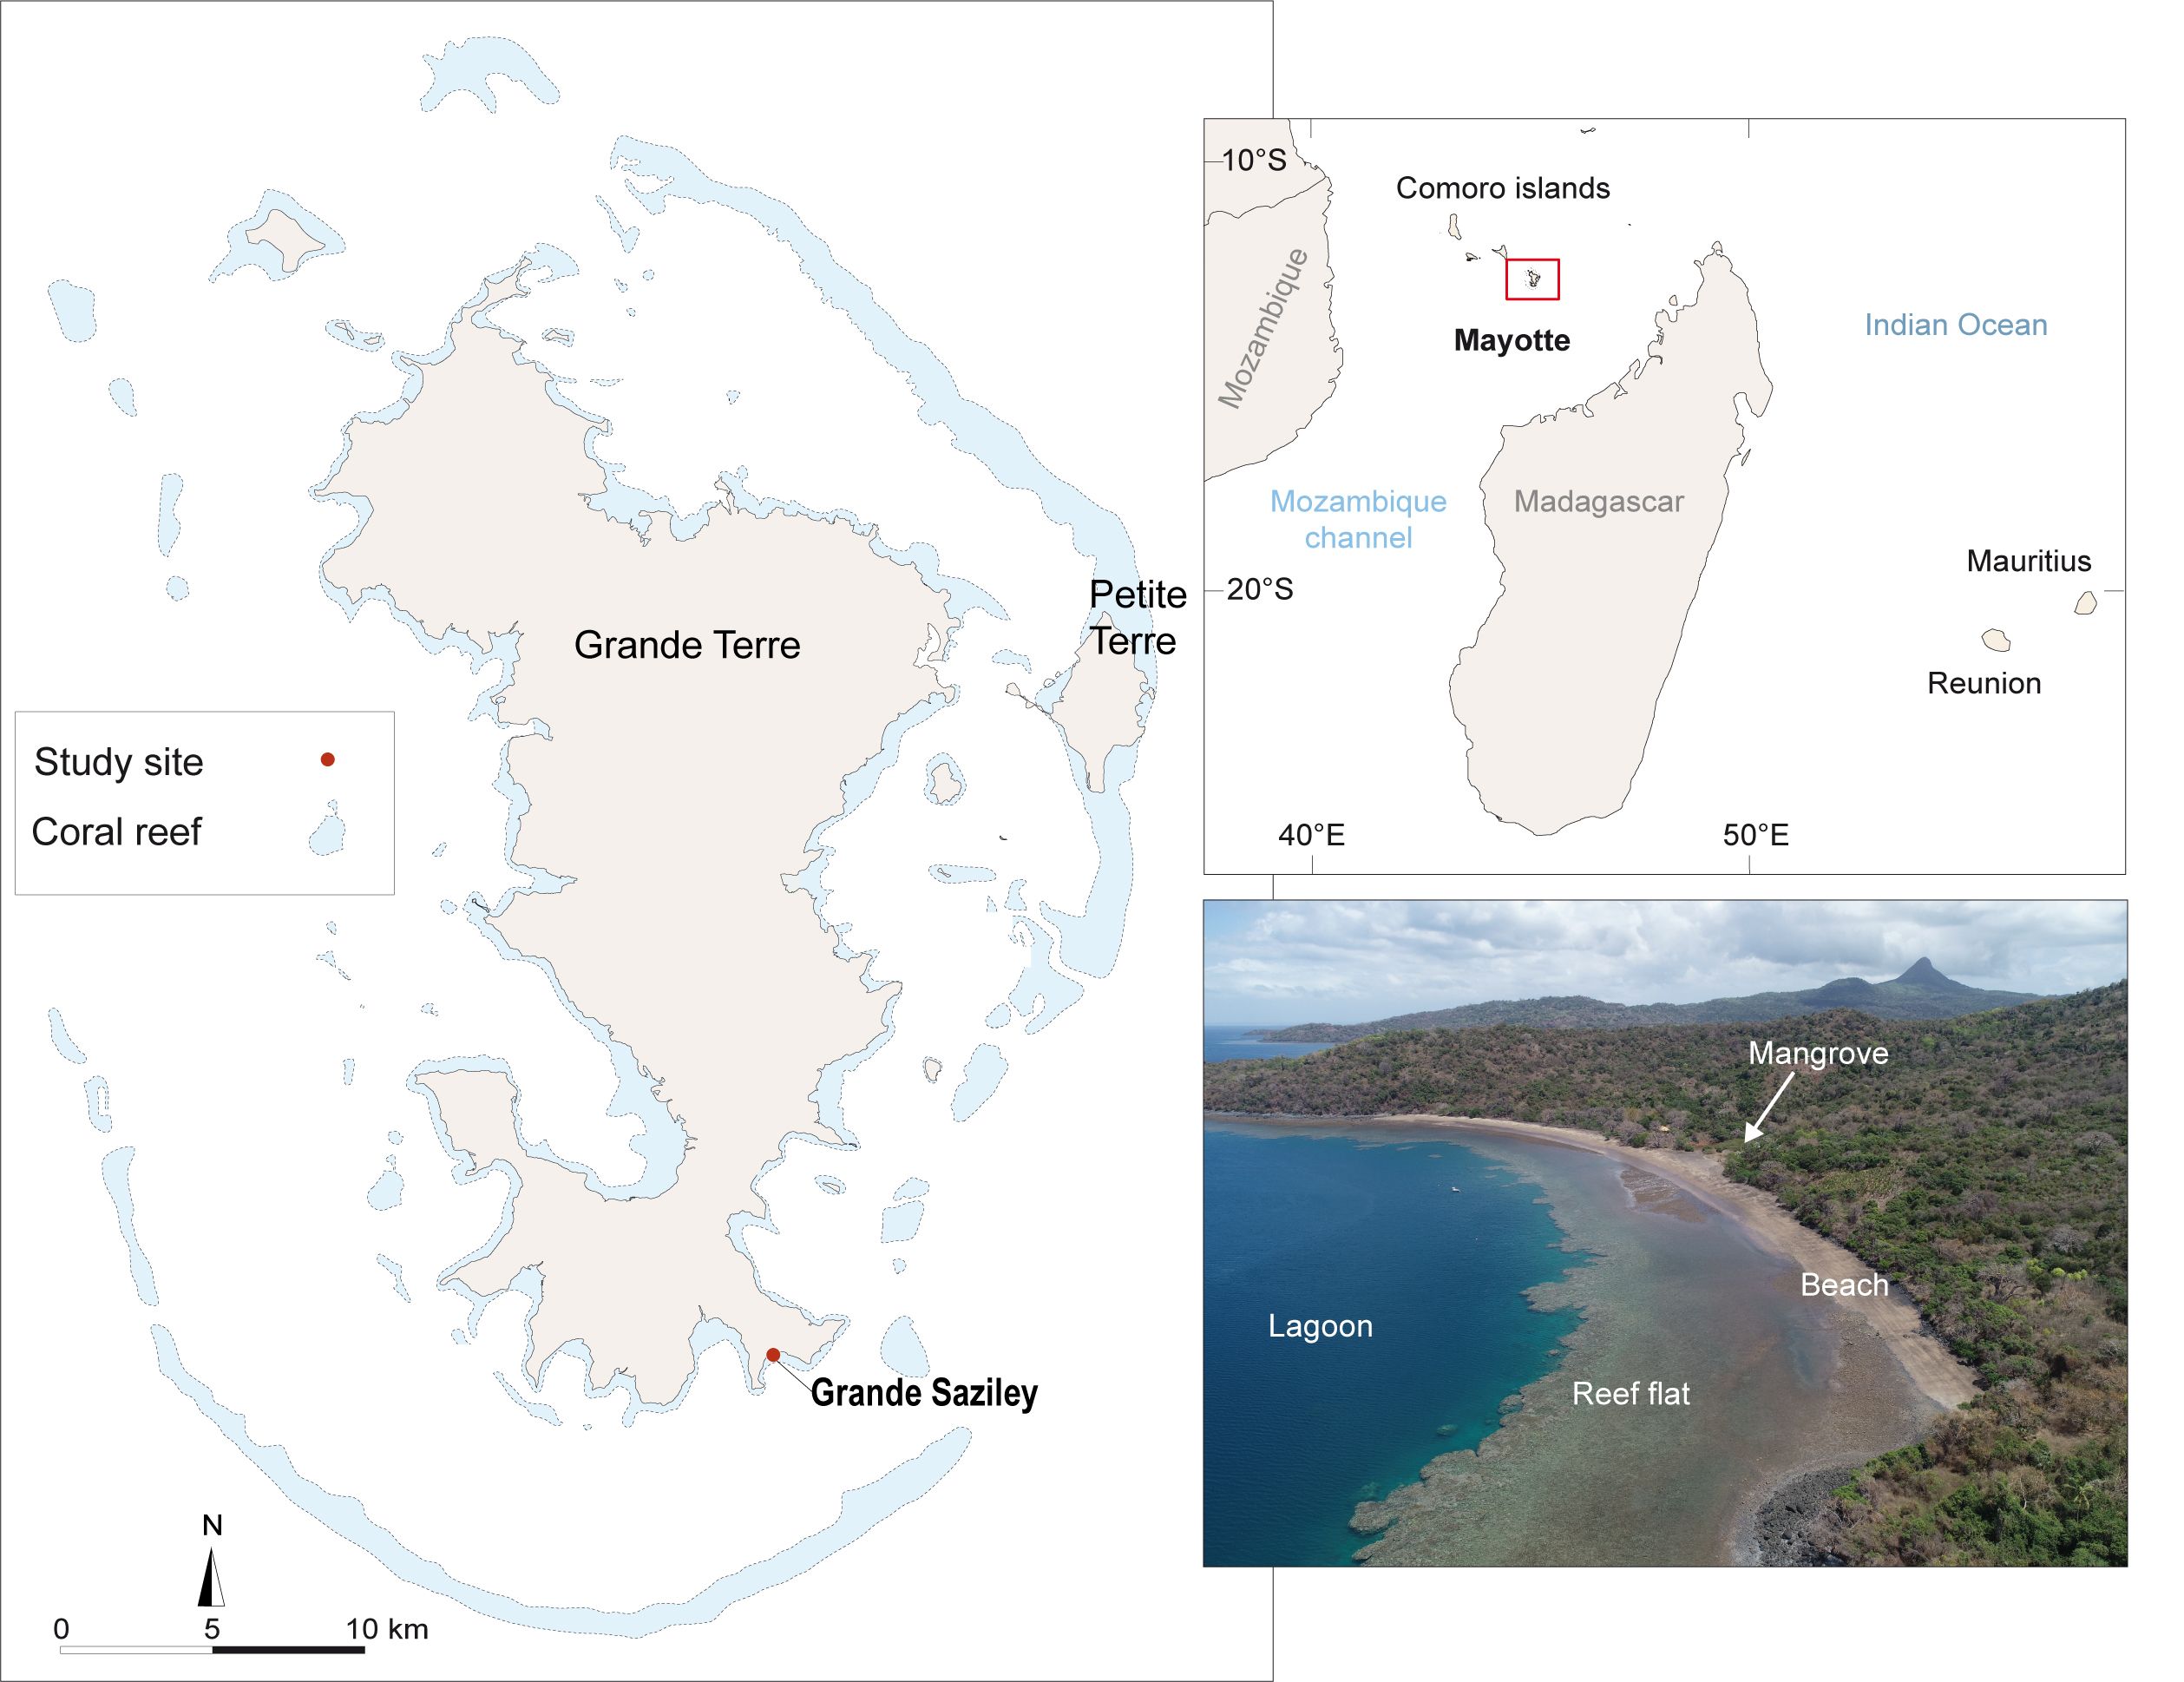
Figure 1. Location of Grande Saziley beach in Mayotte, Mayotte in the southwestern Indian Ocean, and drone image of Grande Saziley beach (shot by Yann Mercky on September 26, 2022). The backshore is composed of a dry forest, in which species such as Adansonia digitata and Mimusops comorensis occur (Traclet et al., 2018). Additionally, the central part of the beach includes a wetland area composed of mangrove trees.
Green turtle monitoring took place during two missions, between July 7 and August 27, 2021, and between March 24 and May 29, 2022, with a total of 25 and 24 monitoring days, respectively. These missions occurred in the dry season during the nesting peak (according to Bourjea et al., 2007). Each night, from 19h00 to 07h00, a patrol located nests and failures, using a GARMIN Montana 650 handheld GPS device, accurate to 3 meters. We use the term “nest” to refer to a nest in which eggs have been laid. Nesting failure were recorded for five possible behaviors: (1) return to water without digging, (2) abandonment of a body cavity and return to water, (3) abandonment of a body cavity followed by another nesting attempt resulting in egg laying, (4) abandonment of nest digging and return to water, and (5) abandonment of nest digging followed by another nesting attempt resulting in egg laying. The crawling tracks associated with the failed body cavity were not recorded; only the cavity itself was counted. Thus, 69 failures and 185 nests were recorded in 2021 and 391 failures and 198 nests in 2022. Not all failures were recorded in 2021 due to technical problems (approx. 80% not included). During these missions, the same handheld GPS was used to measure the tide line, i.e. foreshore, each morning. The depth of 71 nests (i.e., the depth of the egg chamber) was measured before the first eggs were laid, using a weighted rope and then a tape measure (precision ±0.1 mm) exclusively in 2021. Our study was authorized by the authorities (Arrêté n°2021/DEAL/SEPR/221), following the examination of our application for a derogation for specimens of protected animal species (DEP) by the Mayotte DEALM (Direction de l’Environnement, de l’Aménagement, du Logement et de la Mer de Mayotte) and the CNPN (Conseil National de la Protection de la Nature), as required by procedure. Although authorized, we took particular care to ensure that our practices respected the nesting of the females, by limiting the disturbance caused by our presence as much as possible. Any action deemed to be detrimental to the egg-laying process was stopped.
Two sediment samples, weighing approximately 100 g, were collected from a random subset of nests (8 nests in 2021 and 30 nests in 2022), one at the bottom and the other at the upper limit of the egg chamber. For logistical reasons, additional measurements were made outside of the missions such as collecting surface sediment samples in April 2021 and April 2022 along four transects perpendicular to the beach and distributed from west to east along the beach (four to five samples per transect). All sand samples collected from the nests and the surface were washed with distilled water and then placed in an oven at 60°C for 24 hours before being passed through a sieve shaker with seven sieves (2000 μm, 1000 μm, 500 μm, 250 μm, 125 μm, 63 μm, 40 μm) to obtain sediment classes according to Wentworth (1922). For each sample, the calcium carbonate (CaCO3) content was analyzed using a Bernard calcimeter, exposing three replicates of 0.5 g per sample subjected to the action of 5 ml of hydrochloric acid. As the beach is composed of volcanic and biogenic sand, this analysis provides an indication of sand’s color. Finally, the water mass was calculated only for the nest samples by weighing the samples before and after drying in the oven at 60°C for 24 hours, using the formula of Gardner (1986). This laboratory work provided us with the proportion of CaCO3, gravel, coarse, medium and fine sand, and silt, along with the average grain size, symmetry and sorting index using the equations developed by Folk and Ward (1957) for each sample, and the additional water mass in the samples taken from the nests.
Subsequently, in June 2021 and June 2022, two digital elevation models (DEMs) and orthophotographs were produced by photogrammetric reconstruction using a DJI Phantom 4Pro drone equipped with an onboard camera with a 1-inch 20-megapixel sensor. Initially, 20 to 30 targets were marked on the ground at different elevations (upper, middle, and lower of the beach) and were precisely measured with a Trimble R8s GNSS-RTK (accuracy ±5 cm), thus constituting the ground control points. The drone flights were carried out at an angle of 45° and at a height of 65 m. Images were processed with Agisoft Metashape software following the method of Casella et al. (2016) at a resolution of less than 2 cm. After this initial processing, the elevation under vegetation was then extrapolated based on a classification of pixels by category (vegetation, field, urbanization), which enabled the work to be performed exclusively in the field. Root-mean-square error uncertainties (x,y,z) were calculated based on the ground control points for each DEM using Agisoft Metashape software, while taking into account the GNSS-RTK device margin of error.
To map the distribution of green turtle activities at Grande Saziley, we used QGIS 3.10.11 software and created a grid of 5x5 m grid cells covering the entire available beach area. The boundary of this area was defined as extending from the sandy limit at the lower beach to the furthest point where the last turtle activity nests were located at the upper beach (Turtle Nesting Line). We then systematically recorded turtle activities of green turtles for each cell, including both egg-laying and failures. These turtle activities represented the presence of gravid females on the beach and resulted in a total of 843 turtle activities (460 failures, 383 nests). The data analysis encompassed all the data collected during the two missions conducted in 2021 and 2022 and subsequently for each mission.
Then, we retained only grid cells with at least one turtle activity, i.e. the used distribution by females for nesting. For each of these grid cells, we counted the number of nests to produce maps of the areas with the highest egg-laying density. In addition, we applied the same methodology to map the areas with a high density of failures. We tested various grid cells sizes (10x10 m, 5x5 m, and 3x3 m) with similar results, thus indicating that the spatial aggregations observed later are independent of grid cells size.
Environmental data were then collected from the DEMs and orthophotographs using QGIS 3.10.11 and Arcgis 10.8 with the ET GeoWizards 12 extension, from localized turtle activity GPS points. The elevation of each turtle activity was collected from the DEMs (precision ± 3cm for 2021 and ± 4 cm for 2022) and transects were generated from the location of the features to the beach boundary (sand/reef flat boundary), thus making it possible to obtain the average slope and maximum elevation recorded along the transects. Following this initial work, the distance and slope from the turtle activity to the maximum elevation of the transect and then the slope between the maximum elevation of the transect and the beach boundary were calculated. Next, we wanted to know whether or not turtle activity were behind a berm. To find out, we assumed that if the maximum elevation on the transect was higher than the elevation of the turtle activity, then a berm was present. We created a binary variable in this sense, 1 if the maximum elevation is higher than that of the turtle activity, and 0 if this is not the case. Based on the turtle activities, multiple transects were then generated to obtain the distance to the tide line (foreshore) surveyed during the missions, which changed every day, and then to the limit of the mean high water spring tide level (MHWS) derived from SHOM data (SHOM, 2020). The line of continuous and permanent vegetation was then digitized from the orthophotographs, and the distances to the vegetation were calculated by generating transects. From the vegetation line, turtle activities could be classified into two categories – under the canopy or in open space – and then redivided into three classes: (1) open space, devoid of vegetation, (2) under the canopy, ground devoid of vegetation, and (3) under shrubs or on ground with forest litter. Finally, using IGN (Institut national de l’information géographique et forestière) orthophotography from 2020, the reef front line was digitized, and the distances of each turtle activity were calculated from the newly generated transects.
A total of 42 environmental variables were collected to analyze the environmental preferences of females for egg-laying and the potential effects of these preferences (i.e., surface, nest sand quality, beach morphology, and vegetation; see Appendix 1) on nest depth, representing a total of 515 complete nesting turtle activities (300 failures and 215 nests over the two missions) and 56 depth data. Not all the data could be used for these aspects of the study due to the constraints associated with the use of DEMs, as some of the environmental data collected were aberrant, particularly in terms of elevation and slope, due to overabundant vegetation above certain turtle activities or obstacles on the beach. However, all the selected turtle activities are well distributed across the beach.
Moran I tests were carried out using R 4.1.1 software first to assess the spatial aggregation of the nest and failure data and second to assess the spatial autocorrelation phenomenon that constrains subsequent statistical analyses. Moran I tests were carried out on all turtle activities, both for the totality of data collected between 2021 and 2022 and for each mission in order to determine whether the used distribution by females for nesting is aggregated, then exclusively on nest and then on failures. Subsequently, hotspot analysis was carried out using Arcgis 10.8 software, based on the optimized Getis-Ord Gi* algorithmZ-scores, representing standard deviations, and p-values, corresponding to probabilities, are calculated to identify areas where high or low values are spatially aggregated. Each cell is analyzed in the context of its neighboring entities. For a cell to be considered a statistically significant hotspot, it must have a high value and be surrounded by other cells with similarly high values. Confidence levels of 90%, 95%, and 99% are associated with specific thresholds for z-scores and p-values: for a 90% confidence level, a z-score must be less than -1.65 or greater than +1.65, with a p-value less than 0.10; for a 95% confidence level, a z-score must be less than -1.96 or greater than +1.96, with a p-value less than 0.05; and for a 99% confidence level, a z-score must be less than -2.58 or greater than +2.58, with a p-value less than 0.01. Negative values correspond to cold spots and positive values to hot spots. The Getis-Ord Gi* statistic is represented by Equation 1, where the is the Z-score, is the attribute value for feature j, is the spatial weight between feature i and j, n is equal to the total number of features (Getis and Ord, 1992; Ord and Getis, 1995, ESRI).
This analysis was conducted on grid maps (1) of the beach, i.e. the space available, in order to identify the areas significantly more frequented on the beach, (2) on the space frequented by the females, i.e. the distribution used, in order to identify the areas where the females lay significantly more or less and fail significantly more or less.
Next, to identify the preferred environmental parameters for egg-laying in used distribution, the proportions in sedimentological data were previously normalized by arcsin transformation. Due to the large number of variables, some of which had a high correlation between them, and the problem of spatial autocorrelation present in this dataset, principal component analyses (PCA) were carried out to reduce the number of variables and minimize these issues. A general linear binomial mixed-effect model (GLMM) was run, with the mission variable as the random effect and the binary variable of nesting success, i.e. the female came onto the beach and laid her eggs (1 for nest and 0 for failure) as the response variable with a logit link. It was not possible to compare the two missions due to a data imbalance, and as the results on the hotspots show similar results, it was decided to use the whole dataset. The choice of the model was based on the Akaike information criterion (AIC) and the Akaike weight. The Akaike weight is the probability that the corresponding model is the best among the tested models. A multiple linear model was run to assess the effect of environmental variables on nest depth. The same environmental variables were applied for this part of the study in order to establish the link between the environment chosen by the female and nest depth. Finally, Student’s t-tests were used when variances were similar, otherwise Welch’s tests were performed on significant variables emerging from the models to confirm this.
Based on all turtle activities, it appears that female attendance is significantly spatially aggregated over the total frequentation in both years (I = 0.36, z-score = 30.33, p < 0.001), but also during the 2021 mission (I = 0.27, z-score = 23.04, p < 0.001) and 2022 mission (I = 0.37, z-score = 30.14, p < 0.001).
During the two missions, nesting activity green turtles were observed on 22.5% of the available beach surface. 6.2% of the cells contained only egg-laying, 10.8% contained only failure, and 5.5% had both egg-laying and failure (Supplementary Figures S1, S2). In 2021, females used 9.47% of the available space, compared with 18.10% in 2022.
The hotspots for the overall beach use based on data from the two missions represent 24% of the available space (Figure 2a): 22.9% for the 2021 mission (Figure 2b) and 20.5% for the 2022 mission (Figure 2c). Two distinct hotspots of egg-laying can be identified on the southwestern and northeastern parts of the beach in the data from both missions (Figure 2d). These two areas are also visible for each of the two missions (Figure 2e, f). Higher failure occurred in two areas on both missions’ data sets for 2.31% of available beach in the southwest and northeast (Figure 2g). In 2021, a failure hot spot stands out in the southwest, and in 2022, the two zones described in the data from both missions appear (Figures 2h, i). The failure hot spots are located near the edges of the egg-laying hot spots and extend towards the extremities of the beach, except for 2021, where only one failure hot spot appears and is located at the edge of the egg-laying hot spot located to the southwest and extends towards the center of the beach. However, during the 2022 and 2021 missions, a few cells within the failure hotspots overlapped with the egg-laying hotspots. These overlaps occurred at the edge of the southeast hotspot and extend towards the center of the beach for mission 2021, and for mission 2022, the few overlaps occurred at the edge of the northeast hotspot and extend towards the extremity of the beach. By contrast, some areas did not record any nest turtle activities, namely the center and the extremities of the beach.
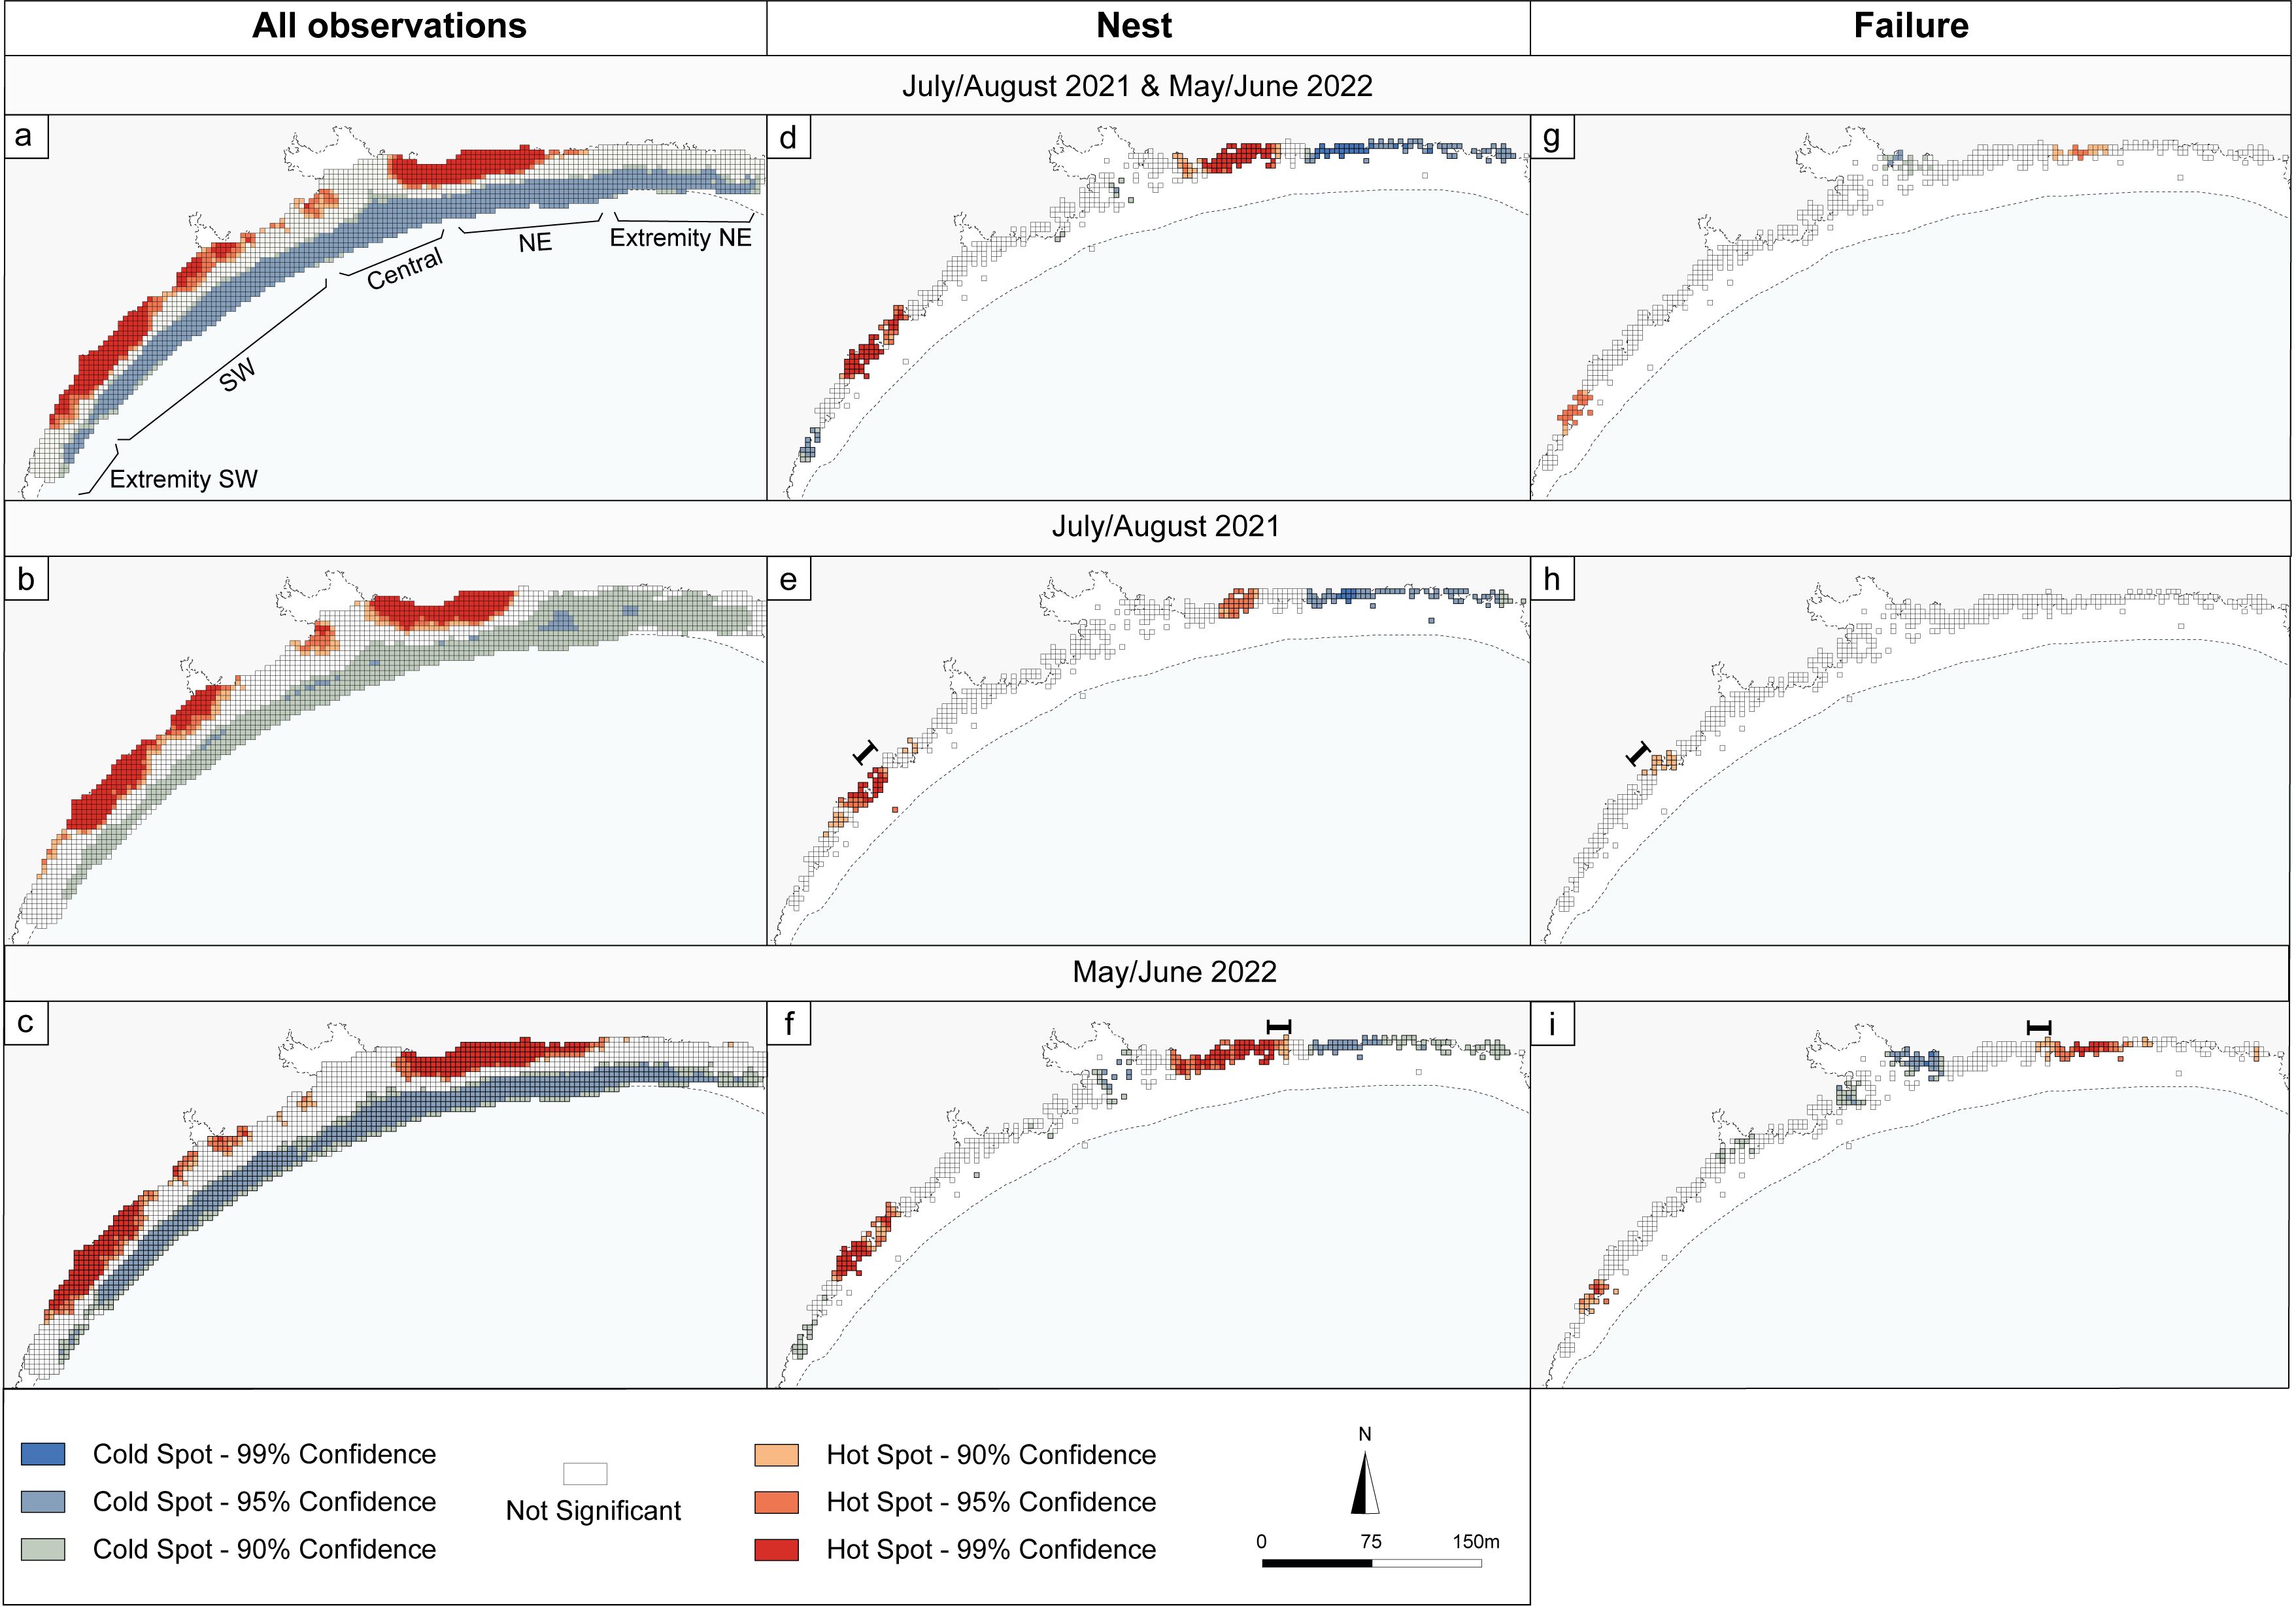
Figure 2. Map of hotspots based on (a) turtle activities recorded in the 2021 and 2022 datasets, (b) turtle activities collected during the 2021 mission, (c) turtle activities collected during the 2022 mission, (d) egg-laying based on data 2021 and 2022 where only cells with at least one green turtle activity were retained for analysis, (e) only egg-laying from the 2021 mission, (f) only egg-laying from the 2022 mission, (g) exclusively failures based on data 2021 and 2022 where only cells with at least one green turtle activity were retained for analysis, (h) only failures recorded in 2021, (i) only failures recorded in 2022. Cold spots correspond to areas of statistically significant lower success or statistically significant higher failure. The black bracket lines visible on maps (e, h, f, i), indicate areas of overlap between egg-laying and failure hot spots: (e) and (h) in 2021, (f) and (i) in 2022.
In the PCA performed on all the variables, we retained four principal components, which collectively represented 54.9% of the total variance (Table 1). The selection of these four components was based on the scree plot of eigenvalues, where we chose to retain only the components located before the elbow point in the graph. The first principal component (PC1) represents mainly surface sand quality variables, notably CaCO3 content. PC2 is mostly represented by maximum elevation and PC3 by nest sand quality variables, primarily the proportion of coarse sand at the bottom of the egg chamber. PC4 mainly represents the grain-sorting index. Several GLMMs were run, and the model with PC1, PC2, and PC3 as fixed effects was selected based on AIC (Appendix 2). These three principal components have a significant effect on nesting success, i.e. egg-laying success (Table 2). Females laid their eggs more in areas where the surface sand has a lower CaCO3 content. Average CaCO3 content is significantly lower for egg-laying (Welch test, t = -6.84, p < 0.001) than for failures, with an average of 8.77% (sd = 5.53%) and 13.81% (sd = 12.39%), respectively. Similarly, egg-laying success is lower in nests with a higher proportion of coarse sand; the average is significantly lower (Student test = -4.31, p < 0.001), being 1.66% (sd = 1.32%) for egg-laying success and 1.99% (sd = 1.41%) for failure. Finally, the probability of successful egg-laying increases with the maximum elevation of the beach. The average is significantly higher for this parameter (Welch test, t = 12.41, p < 0.001), amounting to 3.17 m for egg-laying success (range: -0.22 m – 4.58 m) versus 2.58 m (range: 1.35 m – 3.79 m) for failure. Furthermore, the distance to the MHWS is highly correlated with maximum elevation (Table 1), where the average is significantly higher for egg-laying success (Student test, t = 10.24, p < 0.001), with a distance of 12.41 m (range: 22.28 m – 40.7 m) compared to 6.83 m (range: -34.28 m – 43.87 m) for failure.
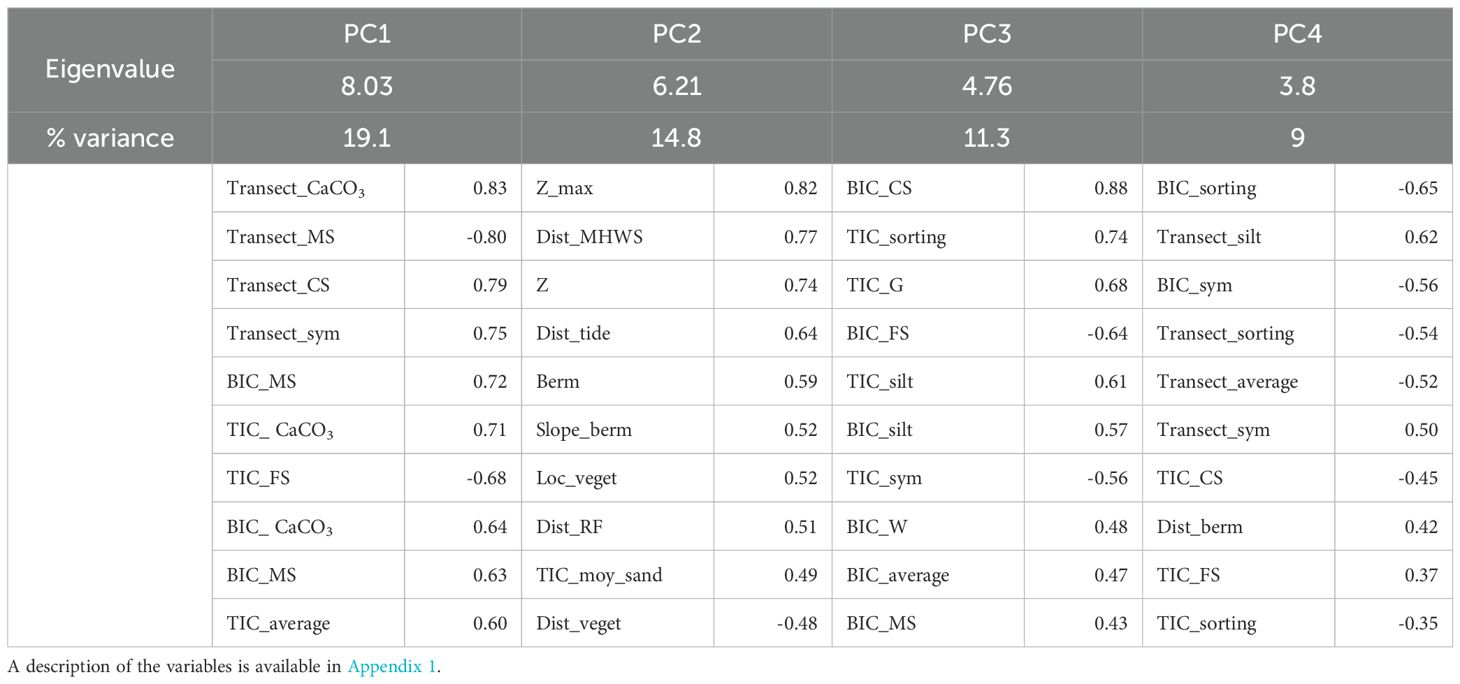
Table 1. Principal component analysis on the set of environmental variables derived from both nest failure and nest success data, with only the top 10 variables being represented for each component.
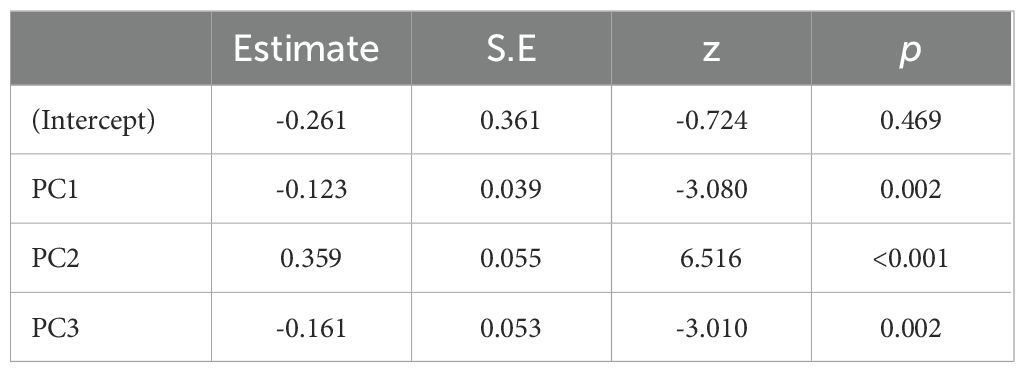
Table 2. Binomial GLMM model with mission as the random effect and nesting success as the response variable.
To make the link between the main significant variables and the subsequent distribution of egg-laying, it is necessary to map and spatialize some of the variables. The DEMs recorded in June 2021 and 2022 and associated with the MWHS, the vegetation limit, and the available distribution space were thus mapped (Figure 3). The elevation is not linear at the upper beach, and some areas have a lower elevation, without a berm, notably in the northeast part, which does not exceed 2.3 m, and part of the center of the beach, which reaches a maximum of 3 m. The rest of the beach has a berm, rising to an average of 3 m. Finally, there are two central areas where the backshore is less constrained by the relief than the rest of the beach, and where the vegetation no longer follows the overall line. A marked altitudinal difference in the center of this zone indicates the presence of a channel, linked to the mangrove zone described above.
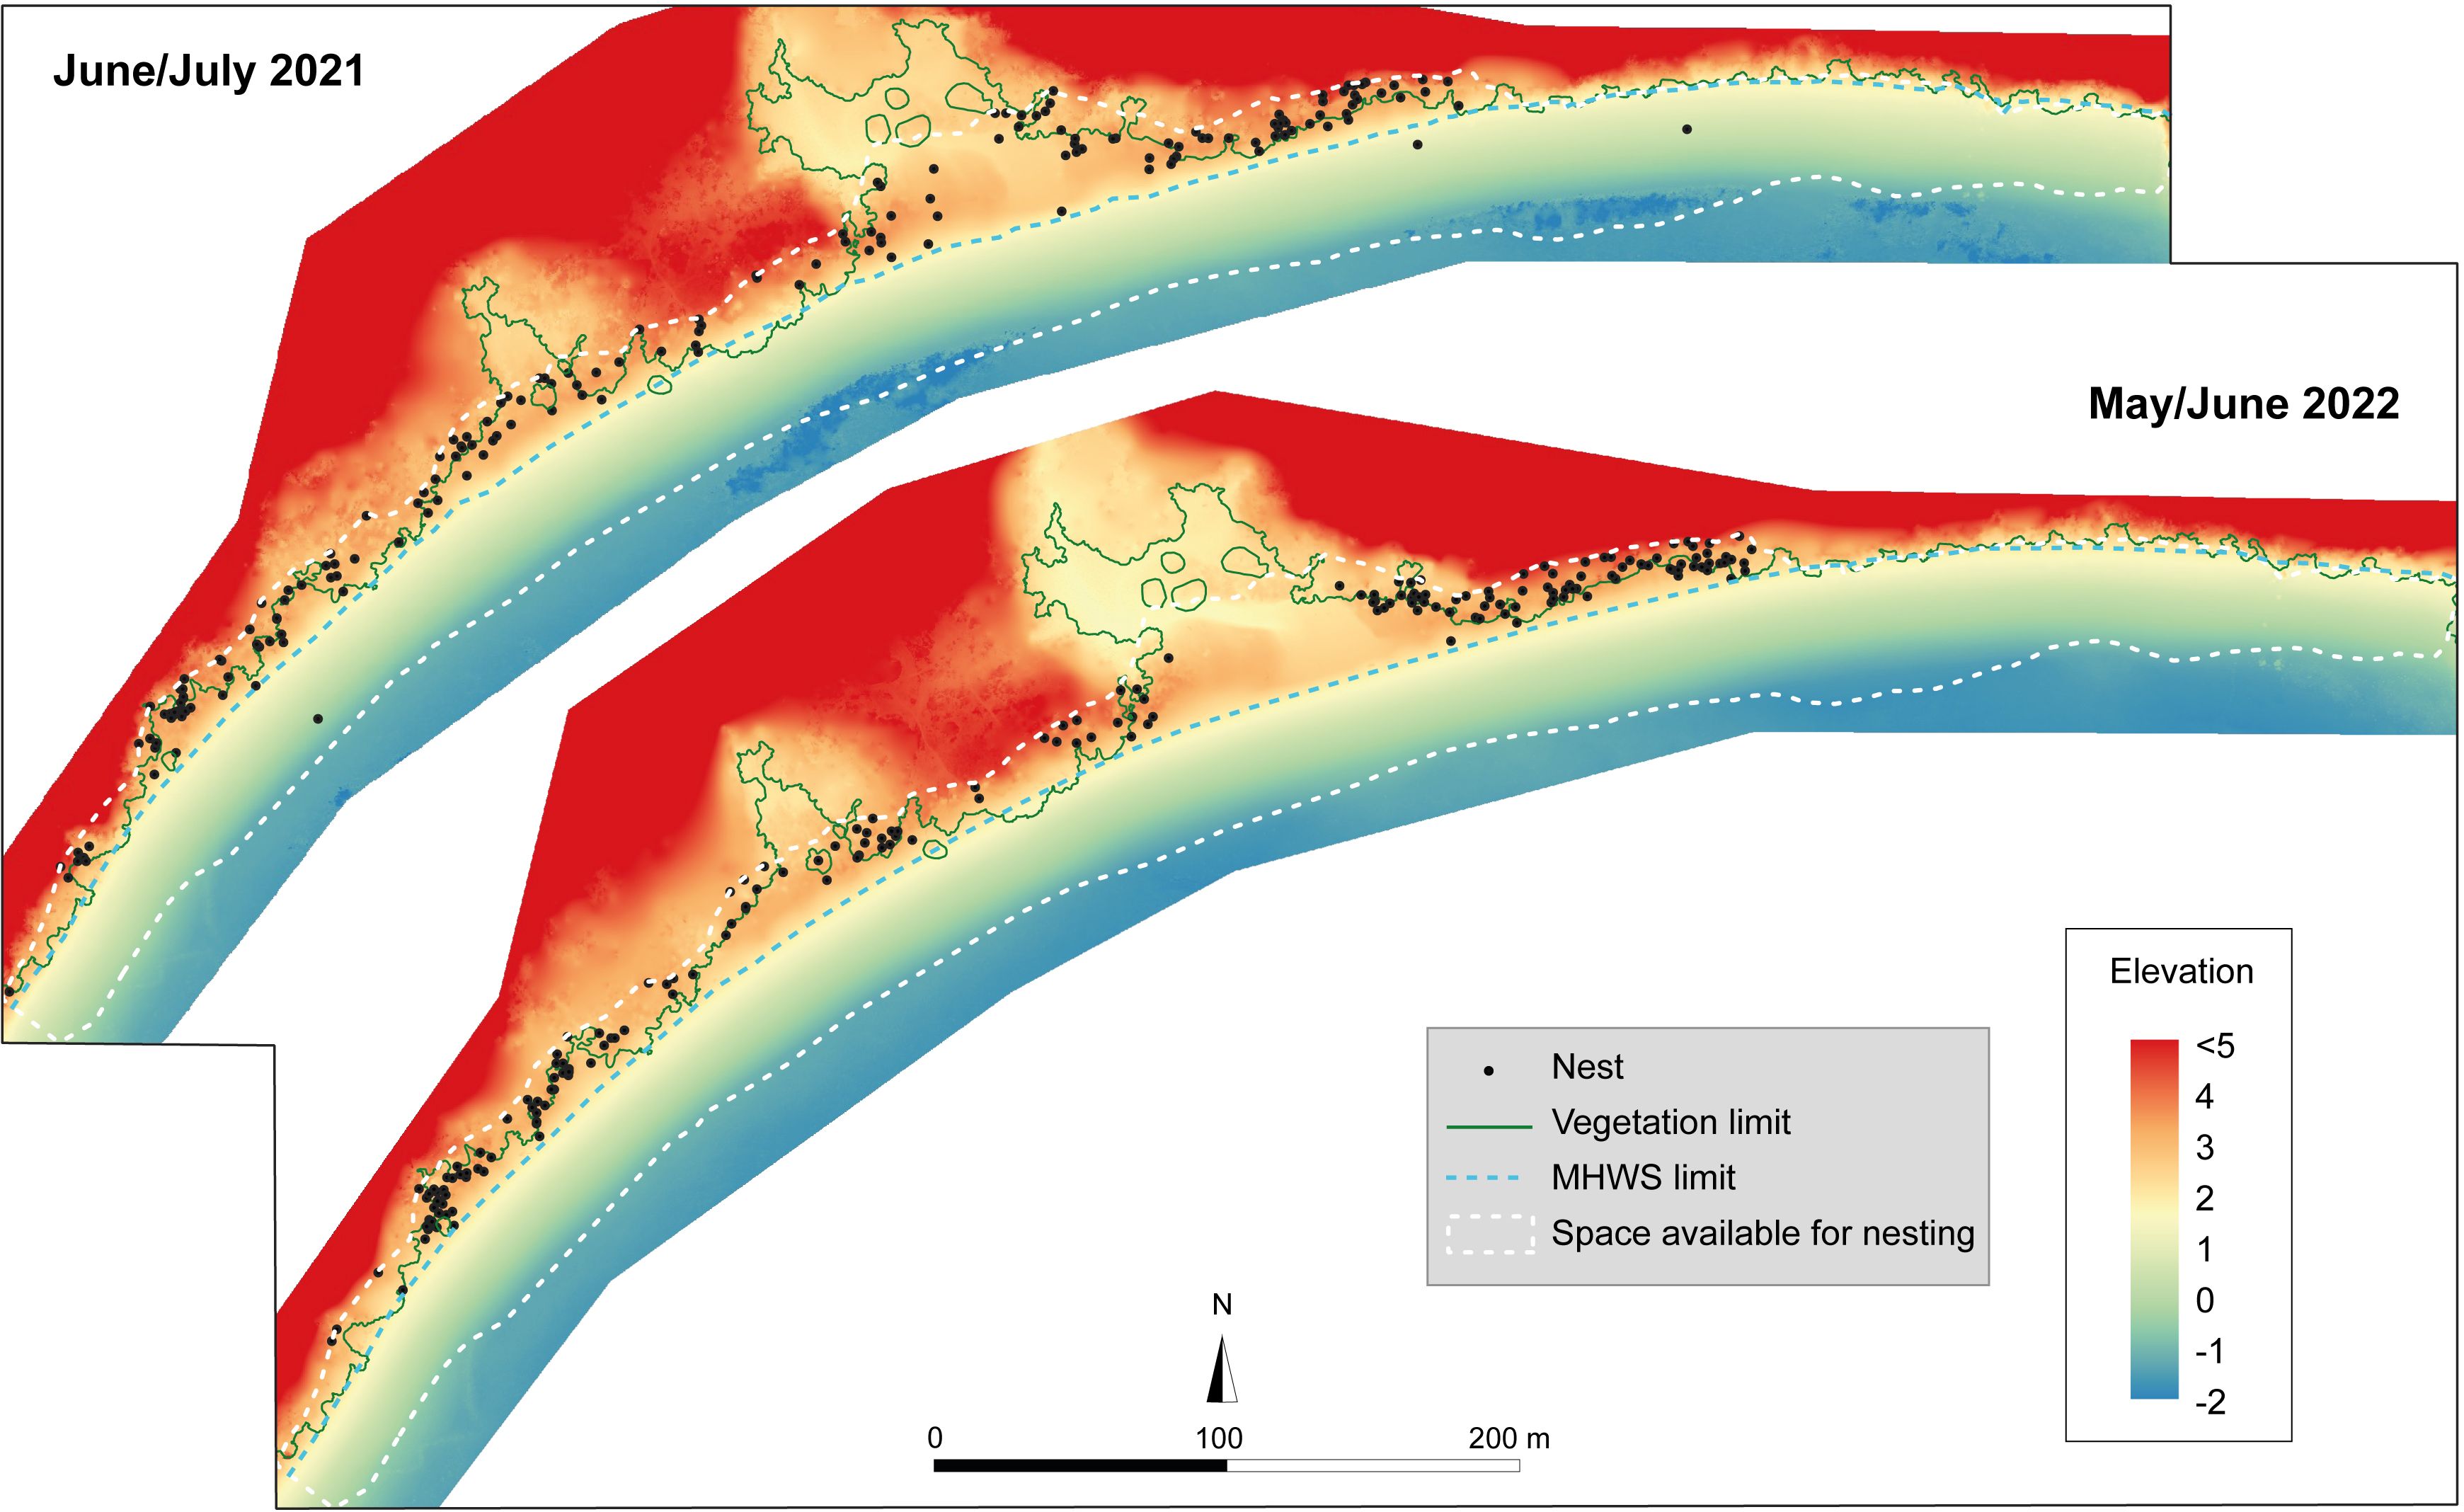
Figure 3. Digital elevation models carried out in June 2021 and 2022 on Grande Saziley. Nest turtle activities are localized, as are the vegetation limit, which is similar across the two years of the missions, and the mean high water spring tide (MHWS) limit.
Next, the beach features poorly sorted fine sand (D50 = 0.17 mm) that is of both volcanic and bioclastic origin (about 24%), heterogeneously distributed throughout the beach. We found evidence for the presence of both a longitudinal and a vertical gradient (Figure 4). First, on each transect, the samples taken at the upper beach have a lower proportion of CaCO3 than those taken at the bottom. For example, transect 1 shows a low proportion of 0-10% CaCO3 in the first two samples taken at the upper beach, followed by a concentration of 20-30% in the middle. At the other end of the range (i.e., transect 4), the upper range contains 20-30% CaCO3 and the middle and lower range 40-55% CaCO3. In addition, the western part of the beach (i.e., transects 1 and 2) has a lower overall CaCO3 content along the transects than the eastern part (i.e., transects 3 and 4). The samples taken from the upper beach at transects 1 and 2 contain between 0 and 10% CaCO3, while this proportion is between 10 and 30% for transects 3 and 4.
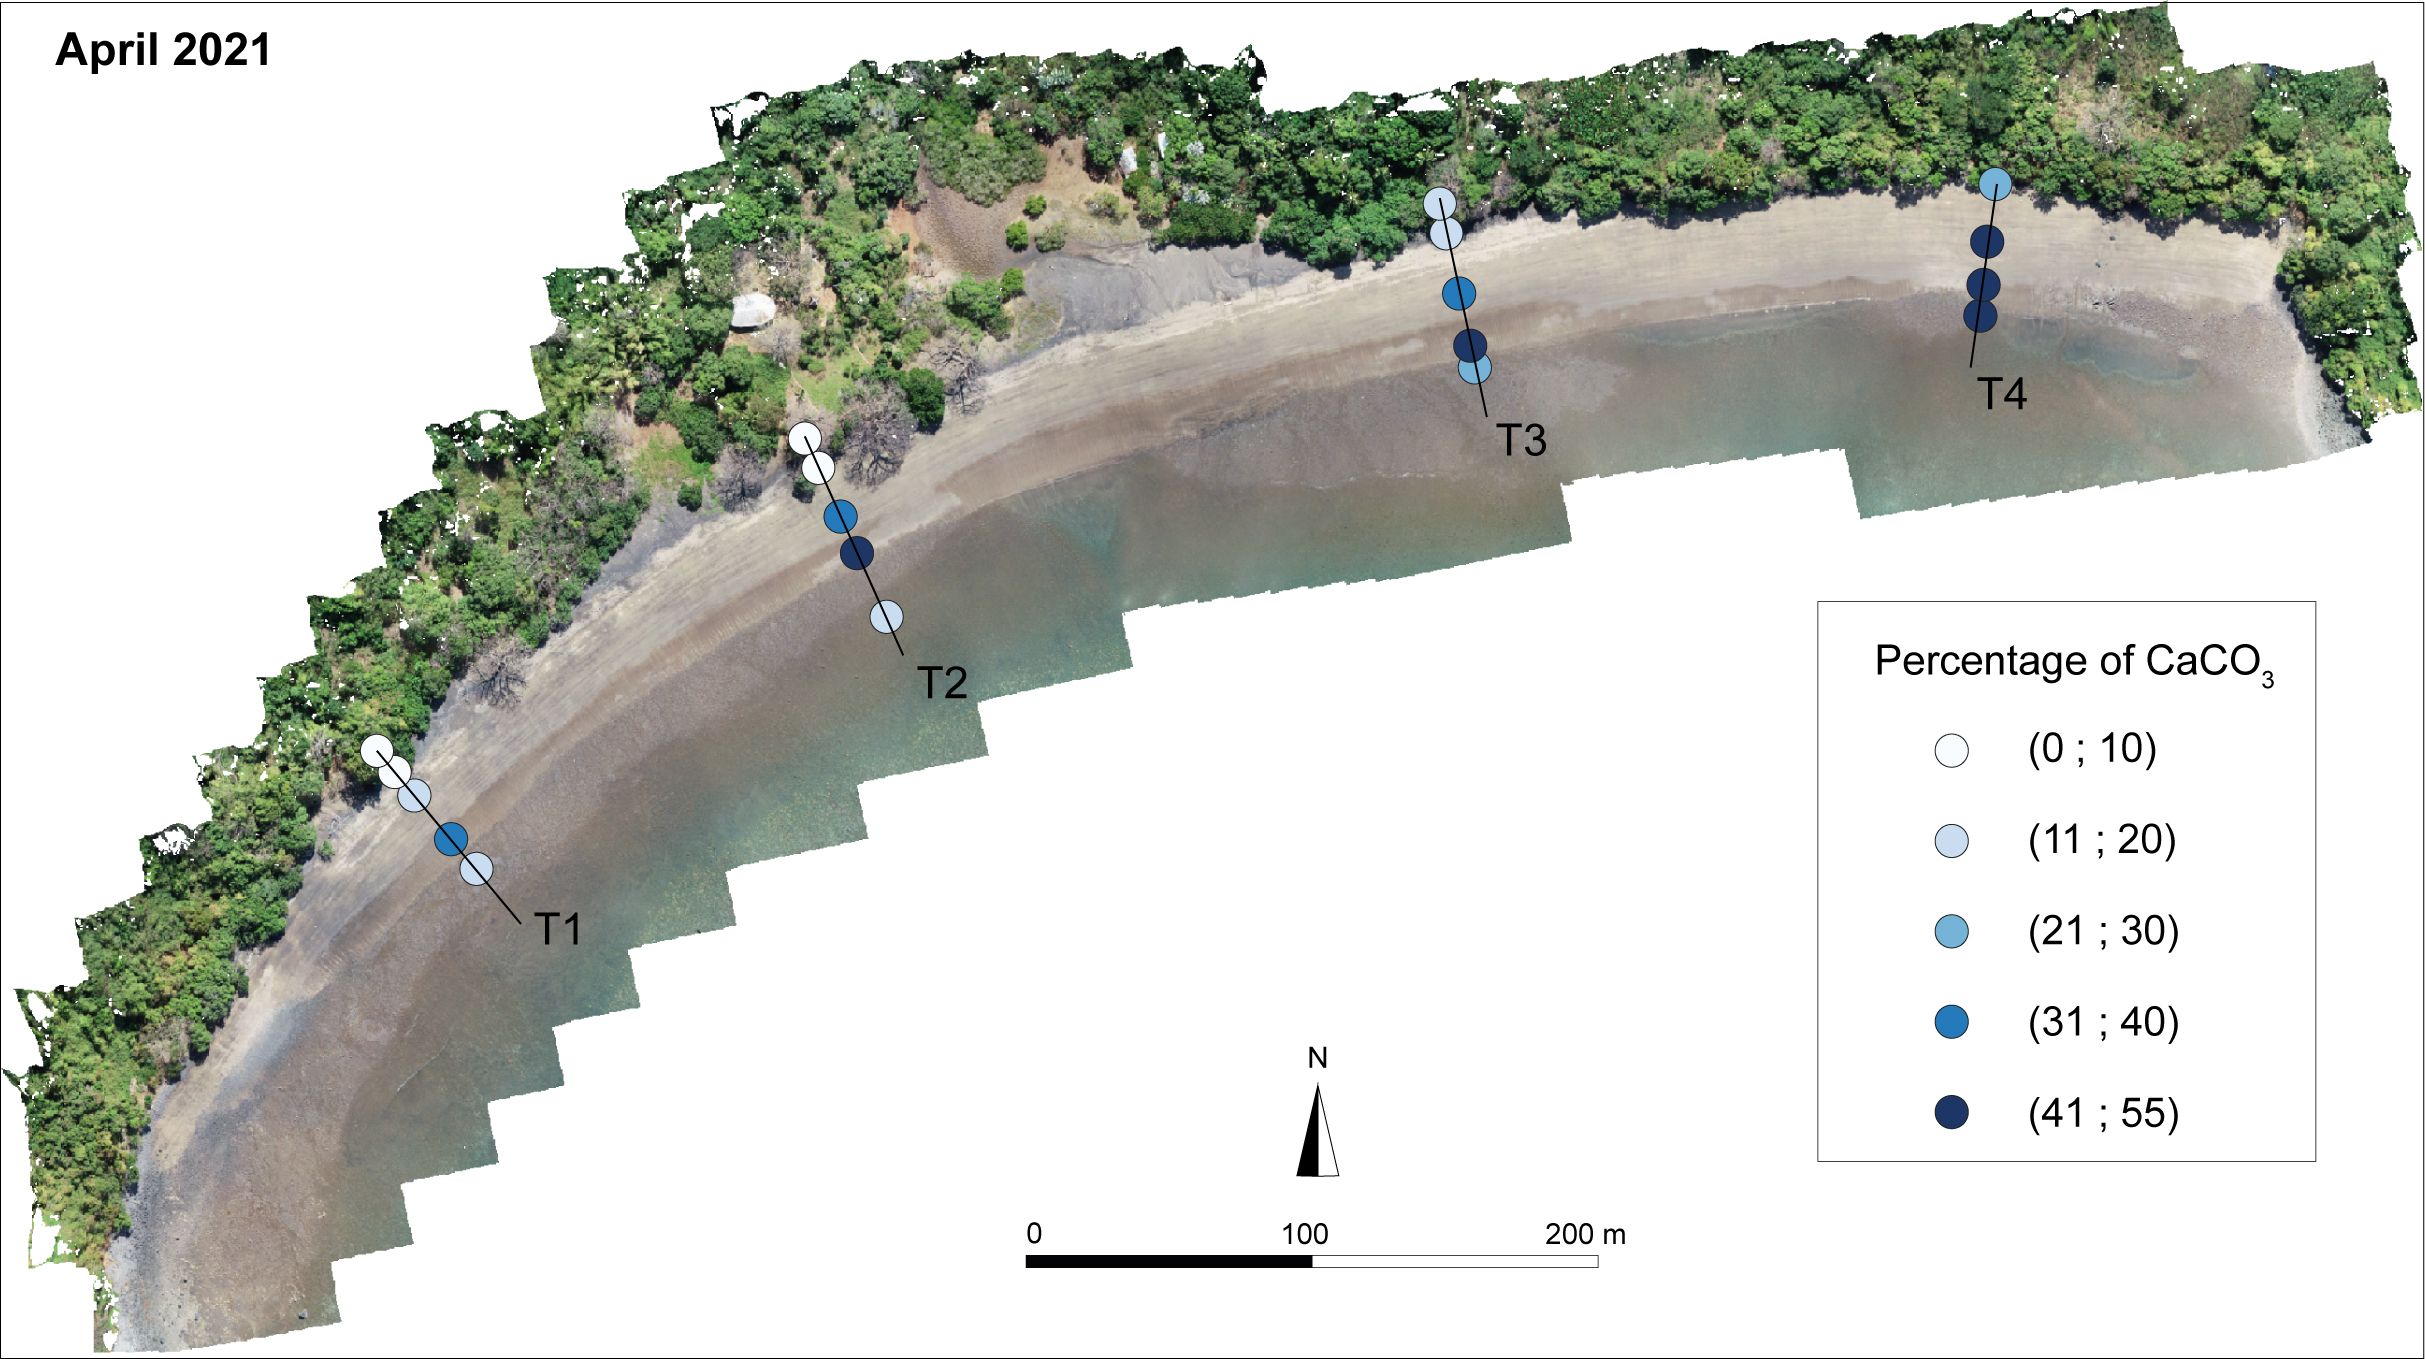
Figure 4. Mapping of transects on Grande Saziley and the location of the surface sand samples associated with calcium carbonate content. Orthophoto by drone.
The depths of nests (i.e., egg chamber depths) averaged 35.5 cm (sd = 4.81 cm, range: 24 cm – 50 cm). A new PCA was performed on the 42 environmental variables associated with the nest depth data. Three principal components were retained, representing 64.1% of the variance (Table 3). PC1 is represented by the sand quality data taken from the top of the egg chamber, notably the proportion of CaCO3. PC2 is represented by the proportion of silt in samples taken mainly from the bottom of the nest egg chamber. Lastly, maximum elevation is the variable that most closely represents PC3 in conjunction with beach top vegetation variables. A linear model was run to measure the effect of environmental parameters on nest depth with an identical link. The model revealed that none of the principal components were significant in explaining the depth variations (Table 4).
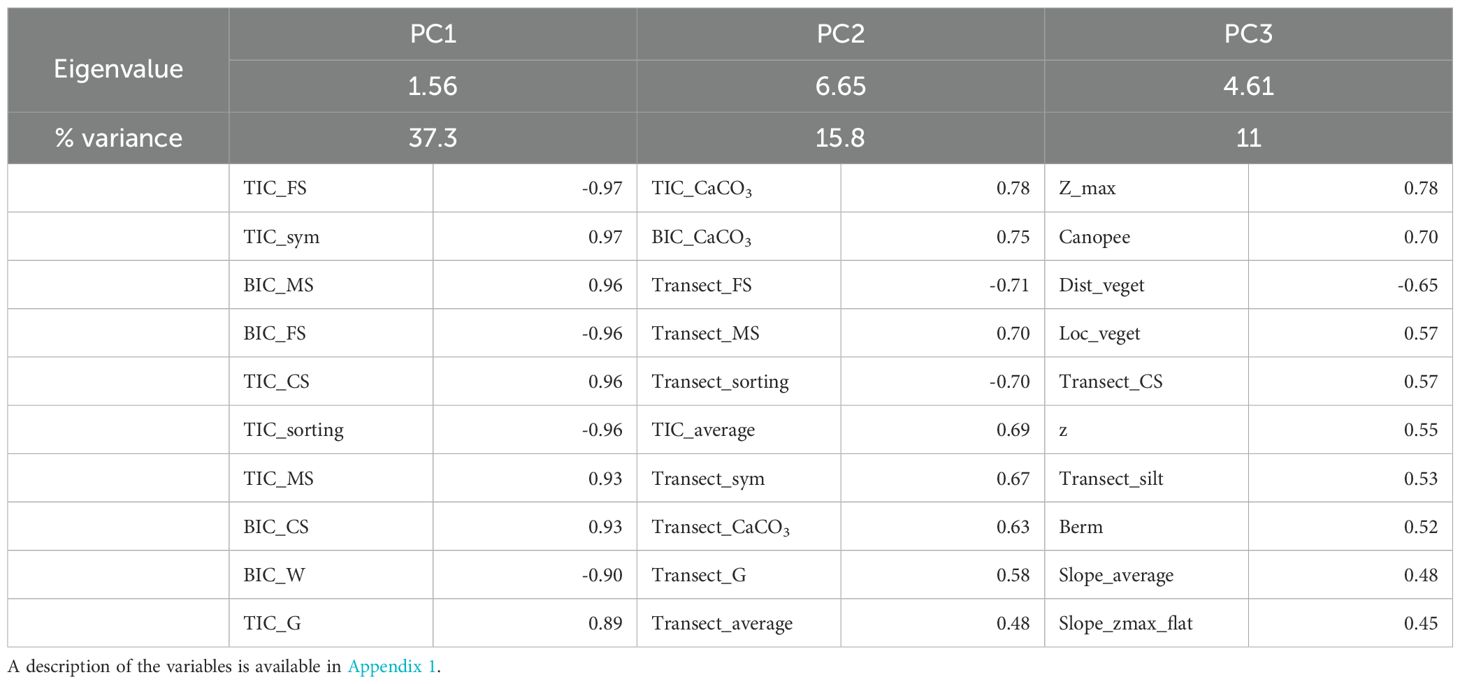
Table 3. Principal component analysis of the set of environmental variables derived from the nest depth data, with only the top 10 variables being represented for each component.
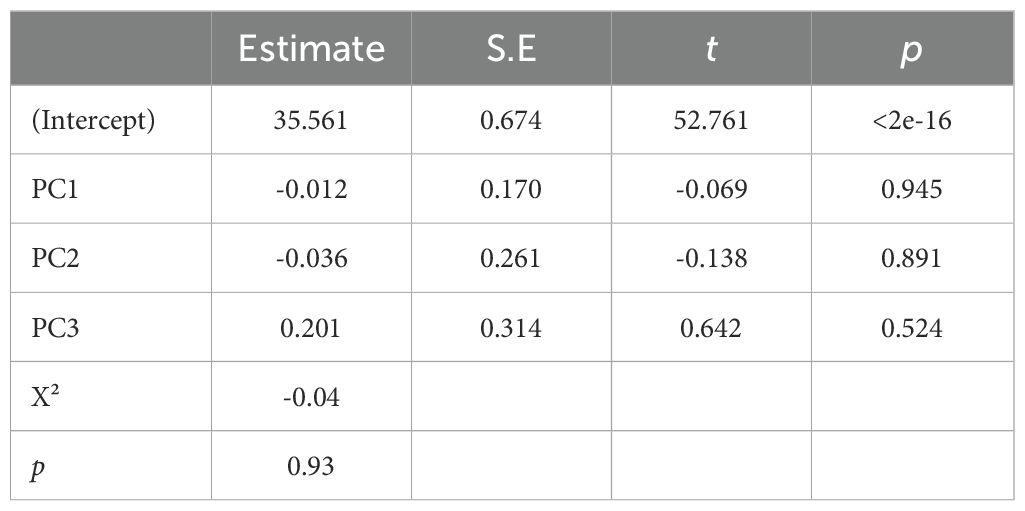
Table 4. Multiple linear model based on the principal component analysis results, with nest depth as the response variable.
This study is one of the few to use such a large number of environmental parameters to assess environmental preferences by green turtles for lay and the effect of the choice of egg-laying site on nest depth. This work improves our knowledge of the environmental preferences of females for egg-laying and proposes a new data extraction methodology based on GIS and photogrammetric production from a drone. In addition, it provides a solid basis for identifying the sites used by green turtles and identify the parameters favorable to egg-laying thus improving their conservation, at the Grande Saziley site.
Green turtles mainly frequented the upper beach and the used distribution area was smaller than the available distribution. In addition, within the used distribution, the egg-laying space is smaller. This was true throughout the 2 years of monitoring during which time the hotspots of egg-laying were similar. Different individuals most probably laid in 2021 and 2022. According to the literature, green turtles egg-laying an average of six times (between 2 and 9) during a breeding season with the mean interval of re-sightings being 5.9 years (Esteban et al., 2017; Mortimer et al., 2022). A large part of the used distribution and available distribution is not used by females for laying their eggs. It is also interesting to note that 5.5% of the areas used by the females recorded both failures and egg-laying, which means that these areas are highly frequented, but also that females succeed and fail in laying eggs on the same areas of the beach (Figure 5). However, when comparing the hot spots for failures and egg-laying, only a few cells overlap (0.4% in 2021 and 1.3% in 2022 of the area used), which means that the hot spots for failures and egg-laying are statistically separate but close to each other.
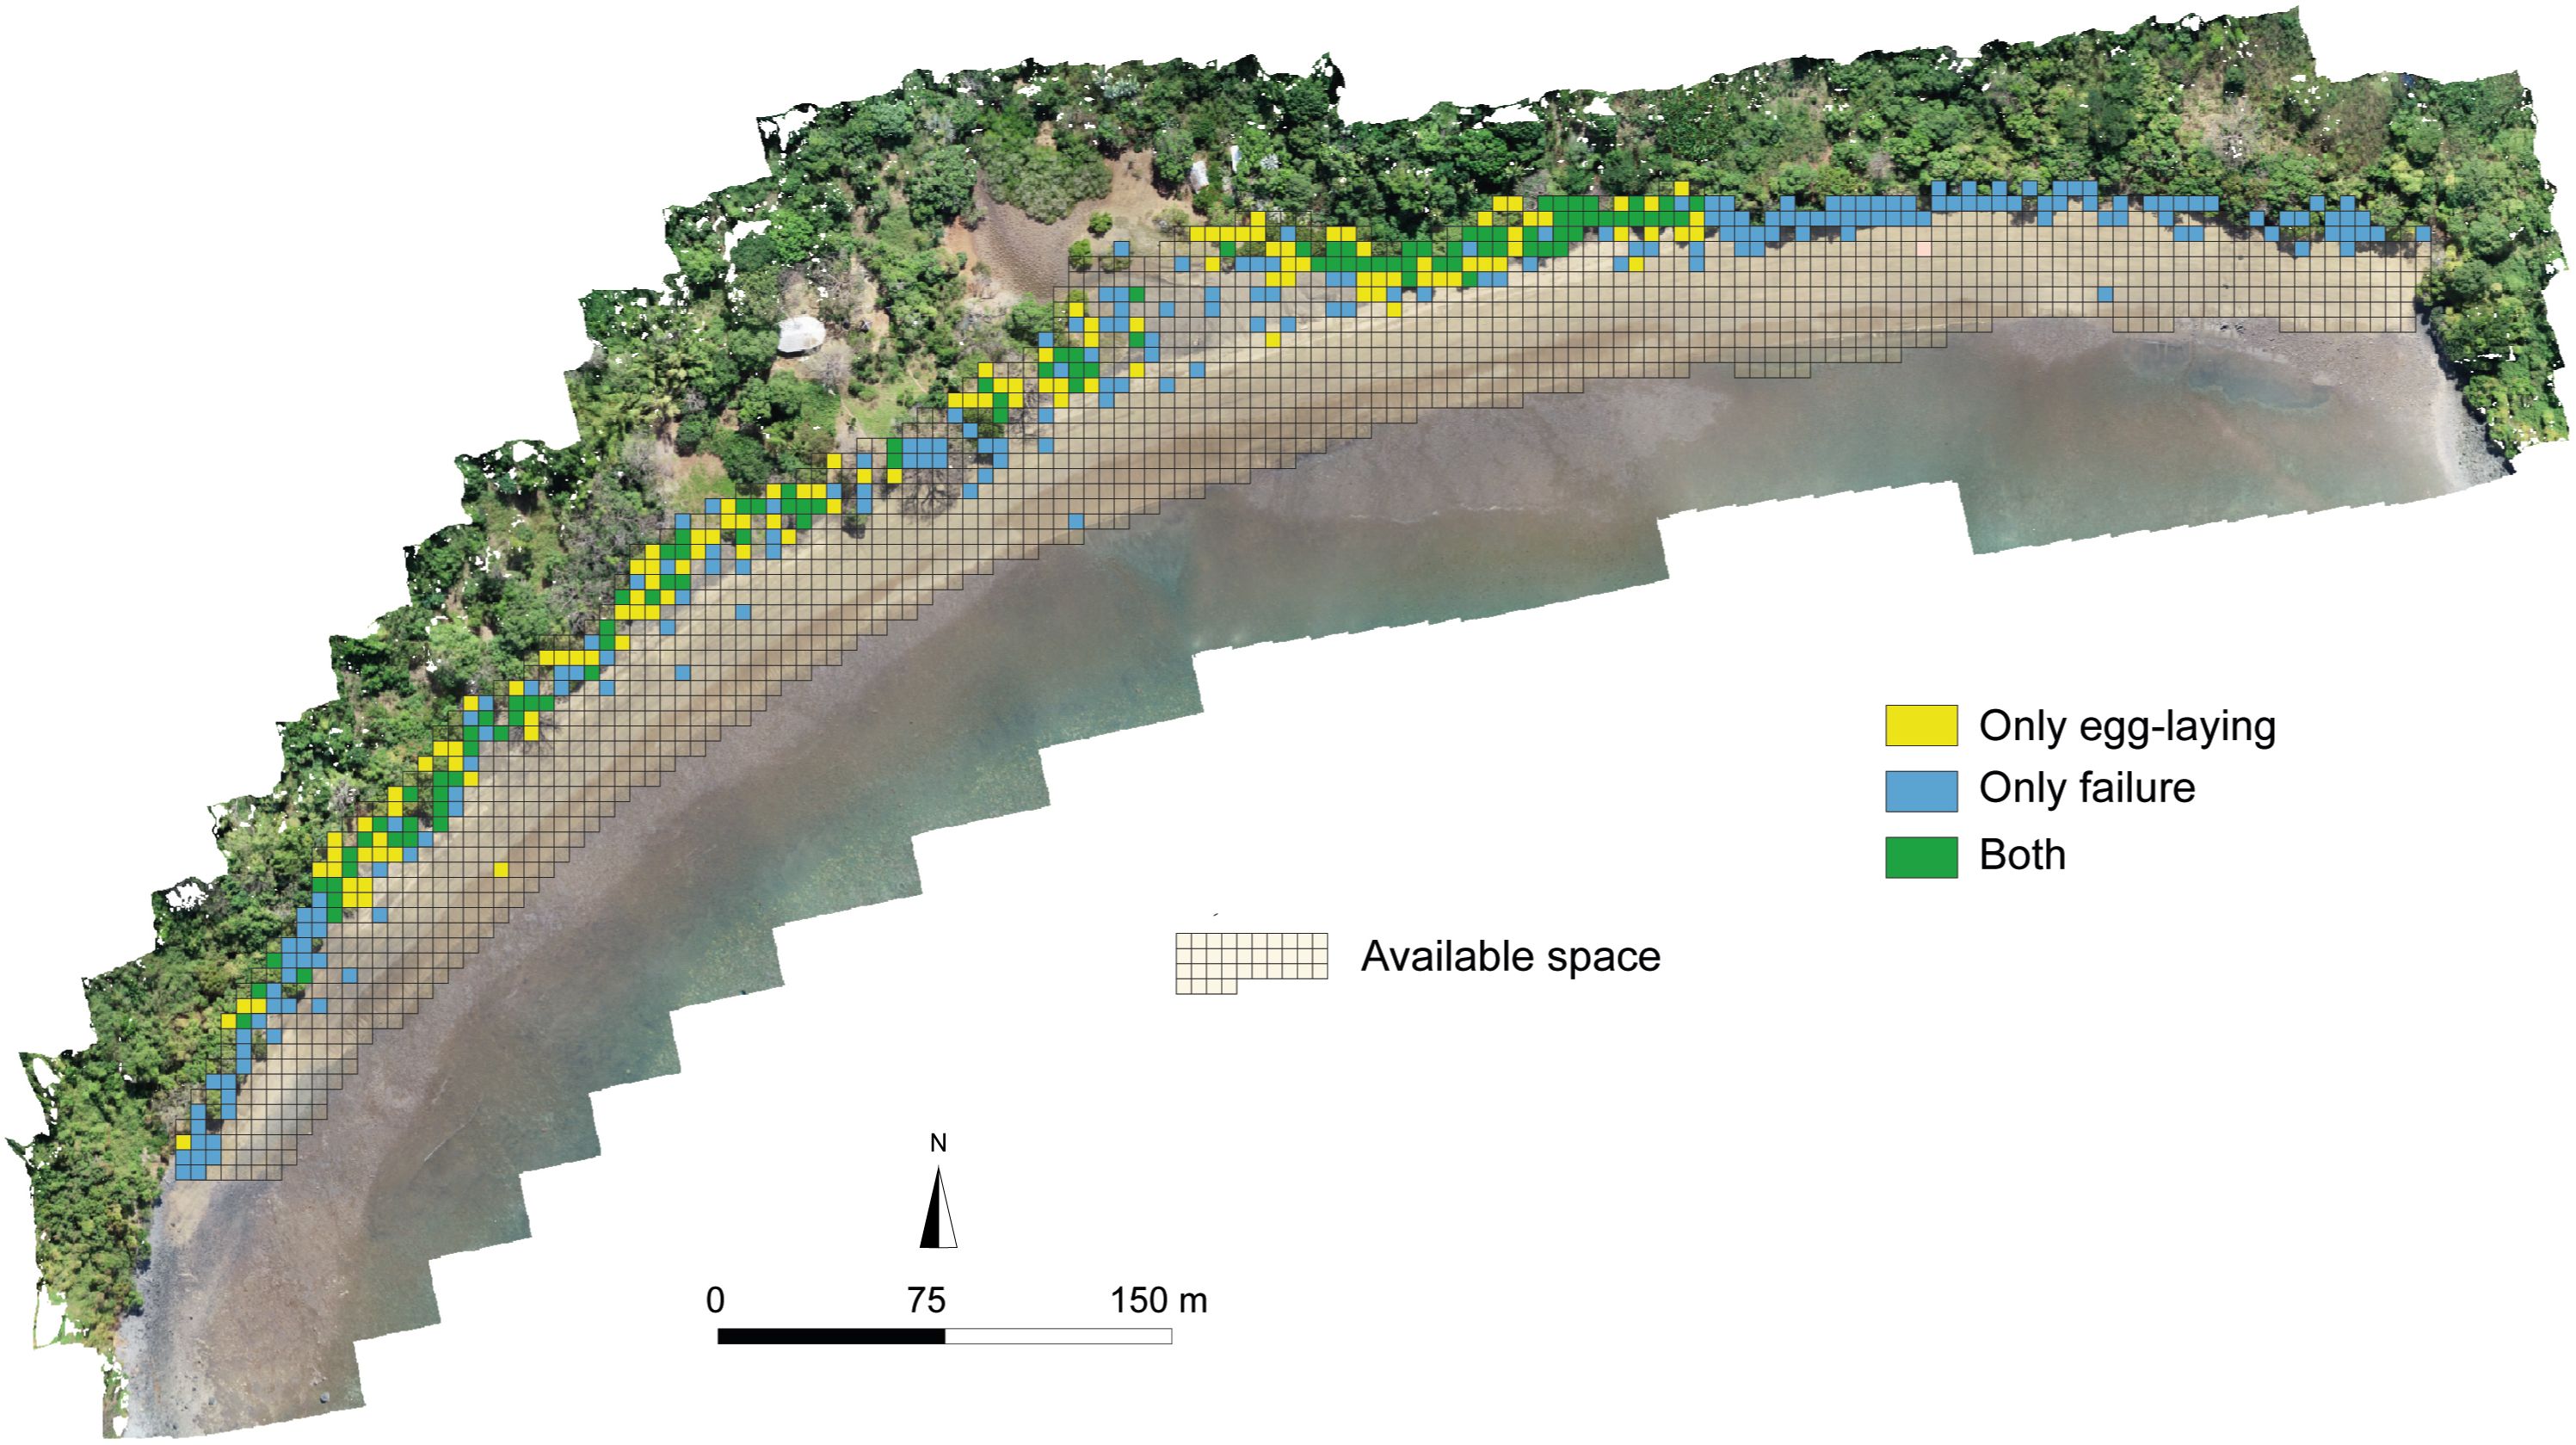
Figure 5. Map of the available space, showing cells for egg-laying, failure and both behaviors. These results include all data collected between 2021 and 2022. Orthophoto by drone.
The choice of egg-laying site appears to be governed by beach elevation, particularly the maximum elevation. Either the females preferred to lay at the maximum elevation at the upper beach or they sought to exceed a certain elevation and lay behind a berm, which partly explains the rather localized distribution of egg-laying on the beach. In particular, the northeastern part of the beach did not record any egg-laying, as the maximum elevation on the upper part of the beach was much below the average altitude preferred by females (on average 3.12 m); the same was true for the southwestern extremity of the beach. This preference was in agreement with the literature (Horrocks and Scott, 1991; Zavaleta-Lizárraga and Morales-Mávil, 2013; Santos et al., 2017; Patrício et al., 2018) and was consistent with the search for a location far enough from the tide for nesting (Wood and Bjorndal, 2000), which is also supported by the strong correlation with the average high tide (12.41 m average tidal distance for success) variable obtained in our study. Indeed, the outer sides of the beach were regularly submerged by the tide due to their low slope, as was a central part of the beach. The fact that some areas of the beach remained unused despite the presence of supposedly favorable conditions could be related to frequent elevation changes due to the presence of backshore mangroves. In the rainy season, the wetland fills with water and the sand barrier can break, with a channel being visible in the center of the beach. Although June is a dry season month, the return of the sand to its initial state is not stable from one year to another depending on the marine weather conditions (pers.Comm).
Females also preferred laying in sand with a lower CaCO3 content, which may probably be explained by the presence of longitudinal and vertical gradients related to the hydrodynamic conditions of the site. The upper part of the beach had a low proportion of CaCO3, particularly for transects 1, 2 and 3. Green turtles preferentially lay their eggs at the upper beach, as elevations increases. Consequently, they lay their eggs where CaCO3 concentrations are lowest on the beach, and failures occur in areas where the concentration of coral sand is higher, at lower elevation. Intentional laying in sand with a low CaCO3 content seems unlikely, but rather linked to their preference for laying at higher beach elevation. Finally, more nest were dug in areas where the proportion of coarse sand at the bottom of the nest decreased. This result is consistent with the literature (Mortimer, 1990).
The Grande Saziley site thus represents a heterogeneous site for gravid females. As it does not offer preferential environmental conditions over its entire length, this leads to a concentrated distribution of nesting and egg-laying. This fact explains the finding that the egg-laying space is smaller than the used distribution and probably the reason that used distribution is smaller than available distribution too. However, a further study comparing the environmental characteristics of the presence and absence of the females would enable this hypothesis to be verified. Besides, other parameters, were not considered due to logistical limitation, may also explain this distribution of hotspots. The choice of egg-laying site by sea turtles may be linked to the size of the female (Martins et al., 2022) and to intra-individual preferences (Kamel and Mrosovsky, 2005; Patrício et al., 2018). The arrival of the female on the beach site can also be influenced by physical constraints such as hydrodynamics and coastal currents (Fretey and Girondot, 1989; Barik et al., 2014; Lamont and Houser, 2014) as well as the bathymetry, which may restrict access to certain beach areas (Spanier, 2010). Some females may opt to increase their chances of survival by nesting closer to the sea, thus reducing their vulnerability to predation and desiccation. The width of the beach is greater in the center, which could serve as one explanation. Furthermore, the temporal scales investigations are limited. Nesting site can change according to the seasons such as differences in vegetation. In addition, sedimentary movements of Mayotte beaches can occur at various scales (Jeanson et al., 2013, 2019), thus modifying the morphology of the beach in terms of elevation or slope. For these reasons, hotspot zones can spatially change.
Two important points highlighted by this study allow us to better evaluate the choice of egg-laying site: 1) the detailed description of the beach and its configuration makes it possible to evaluate the relevance of the significant variables that emerged; and 2) the multiparametric approach of this analysis, made possible by the use of GIS, means that there is no a priori about the environmental characteristics conditioning the selection, which in turn reveals the most significant ones. It is interesting to note also that although we used a large number of parameters, our results are similar to the literature (Horrocks and Scott, 1991; Zavaleta-Lizárraga and Morales-Mávil, 2013; Santos et al., 2017; Patrício et al., 2018). Besides, although GIS can be used to collect a significant amount of data from drone photogrammetry (DEM and orthophotography), thereby reducing field time, it does have its limitations. Due to dense vegetation at the upper beach, where most females lay their eggs, not all turtle activities locations could be used to study environmental preference. Artefacts resulting from vegetation removal distorted elevation and slope measurements.
Habitat selection is not always ideal, as animals cannot always distinguish the best available habitat (Kolbe and Janzen, 2002; Arlt and Pärt, 2007; Frei et al., 2013). Therefore, to improve the effectiveness of conservation measures, it is important to distinguish and study animals’ use of unsuitable habitats, that is, their behavior in habitats that do not offer favorable conditions for reproductive survival, and suitable habitats, which are conducive to survival.
In this study, females choose their egg-laying site, but did they do it in an adaptive or maladaptive way? Although this work cannot currently answer this question, our multiparametric analysis makes it possible to identify variables that could be important to explore. For example, beaches have sedimentological characteristics that can strongly influence hatching and emergence success, not to mention sex ratios and hatchling fitness. Notably, laying eggs in black sand would result in a higher temperature than in light-colored sand due to the greater absorption of incident solar radiation (Hays et al., 1995, 2001), leading to reduced hatching success (Patino-Martinez et al., 2022). Some egg-laying located below the MHWS line may have been at risk of flooding, with this factor possibly resulting in embryonic mortality (Pike et al., 2015).
Variations in nest depth should also be taken into consideration given the non-negligible amplitude of this parameter measured in this study. The nest depth parameter strongly contributes to the variations of biotic factors such as temperature and humidity (Ackerman, 1997; Van De Merwe et al., 2006; Marco et al., 2018; Visconti et al., 2022). Thus, our study investigated whether the choice of microhabitat by females to lay their eggs could be linked to depth variations. However, no variable emerged as significant in this study. In 2018, Marco et al. identified this parameter as the key for future nest reburial conservation programs, because females could reduce the impact of global warming by digging deeper nests. Studies should therefore endeavor to better understand variations in nest depth.
Beyond the environmental parameters that may affect incubation conditions, density-dependent mortality may become a detrimental factor for egg-laying concentrated in specific areas. At the scale of an incubation period, as more sea turtles come to lay at the hotspots, they risk digging up other egg-laying (confirmed by field observations). Although such cases remain rare, it seems relevant to measure this phenomenon in the future, because density-dependent mortality can have an effect on long-term population dynamics (Girondot et al., 2002; Honarvar et al., 2008).
Continuous monitoring is crucial not only for sea turtles but also for their nesting habitats. Rising sea levels and coastal urbanization are progressively reducing beach availability and degrading nesting sites, posing potential threats to sea turtle conservation (Varela et al., 2019; Veelenturf et al., 2020; Sönmez et al., 2021). In Mayotte, coastal development on nesting beaches remains relatively limited but the formation of an underwater volcano in May 2018 caused the island to subside by 10 to 19 cm, depending on the coastal areas, leading to a corresponding relative rise in sea level (Grandin et al., 2019; Cesca et al., 2020; Lemoine et al., 2020; REVOSIMA, 2024). While signals no longer show any displacement, this phenomenon could restrict nesting areas. Field observations have shown a large number of females attempting to nest in the earth higher up the beach but often failing to do so because the soil does not allow for digging. However, current and ongoing studies have not yet established a direct link due to the lack of pre-subsidence data, but this remains a point to be closely monitored.
Our study illustrates that green turtles exhibit a distinct preference for choosing their egg-laying sites along Grande Saziley beach. Among the factors considered here, the elevation of the beach emerges as the most pivotal element. Females show a tendency to favor higher elevations for laying their eggs. This preference is also linked to the inherent sedimentological traits of the beach, meaning that they primarily lay in black sand with a notably low CaCO3 content. Furthermore, it was observed that females more frequently lay in places with a lower proportion of coarse sand. The Grande Saziley site provides a diverse environment for females, featuring a notable concentration of egg-laying in two specific hotspots, both characterized by similar patterns. Intriguingly, fluctuations in nest depth recorded across the beach cannot be explained solely by the microhabitat selected by gravid females. This study marks a pioneering effort by its extensive examination of multiple environmental parameters to gain a deeper understanding of choice of egg-laying site by green turtles and the resulting implications on nest depth. The comprehensive nature of this multiparametric study also brings into focus certain environmental variables that have the potential to influence hatching success and hatchling emergence, a consideration that should be factored into forthcoming investigations that seek to evaluate environment quality in terms of reproductive viability. The use of GIS with the high resolution of photogrammetric outputs allows for a considerable amount of data extraction, though not without limitations; nevertheless, it still proves to be a satisfactory method. Lastly, this study underscores the necessity of adopting a geographical perspective to fully interpret the results and to accurately gauge the significance of variables identified as noteworthy.
The raw data supporting the conclusions of this article will be made available by the authors, without undue reservation.
The animal study was approved by Direction de l’Environnement, de l’Aménagement, du Logement et de la Mer de Mayotte and Conseil National de la Protection de la Nature. The study was conducted in accordance with the local legislation and institutional requirements.
SM: Conceptualization, Data curation, Formal Analysis, Investigation, Methodology, Software, Visualization, Writing – original draft. MJ: Conceptualization, Funding acquisition, Investigation, Project administration, Resources, Supervision, Validation, Writing – review & editing. SC: Investigation, Writing – review & editing. YM: Data curation, Investigation, Software, Writing – review & editing. CL: Investigation, Writing – review & editing. MC: Investigation, Writing – review & editing. LL: Investigation, Methodology, Writing – review & editing. CD: Investigation, Methodology, Writing – review & editing. MG: Formal Analysis, Methodology, Validation, Writing – review & editing. ES: Conceptualization, Funding acquisition, Investigation, Methodology, Project administration, Resources, Validation, Writing – review & editing. DC: Conceptualization, Investigation, Methodology, Project administration, Resources, Supervision, Validation, Writing – review & editing.
The author(s) declare that financial support was received for the research and/or publication of this article. This work was supported by The Office Française de la Biodiversité (n°20-0367), Direction de l’Environnement, de l’Aménagement, du Logement et de la Mer de Mayotte (DEALM) (n°2020-025, n°2020-027), and the University of Mayotte.
The authors would like to thank the Direction de l’Environnement, de l’Aménagement, du Logement et de la Mer de Mayotte (DEALM) and the Parc Naturel Marin de Mayotte (Office Français de la Biodiversité) for funding this project. The authors also express their gratitude to the University of Mayotte for the substantial resources made available to us and the association Les Naturalistes de Mayotte for their help in the field.
The authors declare that the research was conducted in the absence of any commercial or financial relationships that could be construed as a potential conflict of interest.
The author(s) declared that they were an editorial board member of Frontiers, at the time of submission. This had no impact on the peer review process and the final decision.
The author(s) declare that no Generative AI was used in the creation of this manuscript.
All claims expressed in this article are solely those of the authors and do not necessarily represent those of their affiliated organizations, or those of the publisher, the editors and the reviewers. Any product that may be evaluated in this article, or claim that may be made by its manufacturer, is not guaranteed or endorsed by the publisher.
The Supplementary Material for this article can be found online at: https://www.frontiersin.org/articles/10.3389/fmars.2025.1506101/full#supplementary-material
Aarts G., MacKenzie M., McConnell B., Fedak M., Matthiopoulos J. (2008). Estimating space-use and habitat preference from wildlife telemetry data. Ecography 31, 140–160. doi: 10.1111/j.2007.0906-7590.05236.x
Ackerman R. A. (1977). The respiratory gas exchange of sea turtle nests (Chelonia, Caretta). Respir. Physiol. 31, 19–38. doi: 10.1016/0034-5687(77)90062-7
Ackerman R. (1997). “The nest environment and the embryonic development of sea turtles,” in The Biology of Sea Turtles, ed. Lutz P., Musick J. (Boca Raton, FL: CRC Press), 83–106.
Arlt D., Pärt T. (2007). Nonideal breeding habitat selection: a mismatch between preference and fitness. Ecology 88, 792–801. doi: 10.1890/06-0574
Barik S. K., Mohanty P. K., Kar P. K., Behera B., Patra S. K. (2014). Environmental cues for mass nesting of sea turtles. Ocean Coast. Manag. 95, 233–240. doi: 10.1016/j.ocecoaman.2014.04.018
Beerens J. M., Frederick P. C., Noonburg E. G., Gawlik D. E. (2015). Determining habitat quality for species that demonstrate dynamic habitat selection. Ecol. Evol. 5, 5685–5697. doi: 10.1002/ece3.1813
Bloom P. M., Clark R. G., Howerter D. W., Armstrong L. M. (2013). Multi-scale habitat selection affects offspring survival in a precocial species. Oecologia 173, 1249–1259. doi: 10.1007/s00442-013-2698-4
Booth D. T., Astill K. (2001). Incubation temperature, energy expenditure and hatchling size in the green turtle (Chelonia mydas), a species with temperature-sensitive sex determination. Aust. Jf Zool. 49, 389–396. doi: 10.1071/ZO01006
Bourjea J., Dalleau M. (2023). Chelonia mydas (Southwest Indian Ocean subpopulation). (The IUCN Red List of Threatened Species 2023). doi: 10.2305/IUCN.UK.2023-1.RLTS.T220970396A220970430.en
Bourjea J., Frappier J., Quillard M., Ciccione S., Roos D., Hughes G., et al. (2007). Mayotte Island: another important green turtle nesting site in the southwest Indian Ocean. Endanger Species Res. 3, 273–282. doi: 10.3354/esr00053
Casella E., Rovere A., Pedroncini A., Stark C. P., Casella M., Ferrari M., et al. (2016). Drones as tools for monitoring beach topography changes in the Ligurian Sea (NW Mediterranean). Geo-Mar. Lett. 36, 151–163. doi: 10.1007/s00367-016-0435-9
Catlin D., Gibson D., Friedrich M. J., Hunt K. L., Karpanty S. M., Fraser J. D. (2019). Habitat selection and potential fitness consequences of two early-successional species with differing life-history strategies. Ecol. Evol. 9, 13966–13978. doi: 10.1002/ece3.5834
Cesca S., Letort J., Razafindrakoto H. N. T., Heimann S., Rivalta E., Isken M. P., et al. (2020). Drainage of a deep magma reservoir near Mayotte inferred from seismicity and deformation. Nat. Geosci. 13, 87–93. doi: 10.1038/s41561-019-0505-5
Cowell P. J., Thom B. G. (1994). “Morphodynamics of coastal evolution,” in Coastal Evolution: Late Quaternary Shoreline Morphodynamics, eds. Carter R. W. G., Woodroffe C. D. (Cambridge, UK: Cambridge Univ. Press), 33–86.
ESRI. How Hot Spot Analysis Getis-Ord Gi* works. Available online at: https://pro.arcgis.com/en/pro-app/3.3/tool-reference/spatial-statistics/h-how-hot-spot-analysisgetis-ord-gi-spatial-stati.htm (Accessed March 3, 2023).
Esteban N., Laloë J.-O., Mortimer J. A., Guzman A. N., Hays G. C. (2016). Male hatchling production in sea turtles from one of the world’s largest marine protected areas, the Chagos Archipelago. Sci. Rep. 6, 20339. doi: 10.1038/srep20339
Esteban N., Mortimer J. A., Hays G. C. (2017). How numbers of nesting sea turtles can be overestimated by nearly a factor of two. Proc. R. Soc. B.: Biol. Sci. 284, 20162581. doi: 10.1098/rspb.2016.2581
Fieberg J., Matthiopoulos J., Hebblewhite M., Boyce M. S., Frair J. L. (2010). Correlation and studies of habitat selection: problem, red herring or opportunity? Philos. Trans. R. Soc. Lond. B. Biol. Sci. 365, 2233–2244. doi: 10.1098/rstb.2010.0079
Folk R. L., Ward W. C. (1957). Brazos River bar [Texas]; a study in the significance of grain size parameters. JSediment Res. 27, 3–26. doi: 10.1306/74D70646-2B21-11D7-8648000102C1865D
Frei B., Fyles J. W., Nocera J. J. (2013). Maladaptive habitat use of a north american woodpecker in population decline. Ethology 119, 377–388. doi: 10.1111/eth.12074
Fretey J., Girondot M. (1989). "Hydrodynamic factors involved in choice of nesting site and time of arrivals of leatherbacks in French Guiana," in Ninth Annual Workshop on Sea Turtle Conservation and Biology, eds. Eckert S., Eckert K., Richardson T. (Miami, FL: NOAA Technical Memorandum NMFS SEFC-232), 227–229.
Fretwell S. D., Lucas H. L. (1969). On territorial behavior and other factors influencing habitat distribution in birds. Acta Biotheor. 19, 16–36. doi: 10.1007/BF01601953
Gardner W. H. (1986). “Water content,” in Methods of Soil Analysis. Part I: physical and mineralogical methods, (2nd edn). ed. Klute A.. (Madison, WI:American Society of Agronomy-Soil Science Society of America), 493–544. doi: 10.2136/sssabookser5.1.2ed.c21
Getis A., Ord J. K. (1992). The analysis of spatial association by use of distance statistics. Geogr. Anal. 24, 189–206. doi: 10.1111/j.1538-4632.1992.tb00261.x
Girondot M., Tucker A. D., Rivalan P., Godfrey M. H., Chevalier J. (2002). Density-dependent nest destruction and population fluctuations of Guianan leatherback turtles. Anim. Conserv. Forum 5, 75–84. doi: 10.1017/S1367943002001099
Grandin R., Beauducel F., Peltier A., Ballu V., Chanard K., Valty P., et al. (2019). Surface deformation during the 2018-19 Mayotte seismo-volcanic crisis from Gnss, synthetic aperture radar and seafloor geodesy. Am. Geophys Union 2019, V52D–V503.
Hamann M., Godfrey M., Seminoff J., Arthur K., Barata P., Bjorndal K., et al. (2010). Global research priorities for sea turtles: informing management and conservation in the 21st century. Endang Species Res. 11, 245–269. doi: 10.3354/esr00279
Hays G. C., Jones E. L., Ashworth J. S., Barnsley M. J., Broderick A. C., Emery D. R., et al. (2001). The importance of sand albedo for the thermal conditions on sea turtle nesting beaches. Oikos 93, 87–94. doi: 10.1034/j.1600-0706.2001.930109.x
Hays G. C., Mackay A., Speakman J. R., Adams C. R., Mortimer J. A., Boerema M. (1995). Nest site selection by sea turtles. J. Mar. Biol. Assoc. UK 75, 667–674. doi: 10.1017/S0025315400039084
Heredero Saura L., Jáñez-Escalada L., López Navas J., Cordero K., Santidrián Tomillo P. (2022). Nest-site selection influences offspring sex ratio in green turtles, a species with temperature-dependent sex determination. Clim. Change 170, 39. doi: 10.1007/s10584-022-03325-y
Honarvar S., O’Connor M. P., Spotila J. R. (2008). Density-dependent effects on hatching success of the olive ridley turtle, Lepidochelys olivacea. Oecologia 157, 221–230. doi: 10.1007/s00442-008-1065-3
Horrocks J. A., Scott N. M. (1991). Nest site location and nest success in the hawksbill turtle Eretmochelys imbricata in Barbados, West Indies. Mar. Ecol. Prog. Ser. 69, 1–8. doi: 10.3354/meps069001
Jeanson M., Anthony E. J., Dolique F., Aubry A. (2013). Wave characteristics and morphological variations of pocket beaches in a coral reef-lagoon setting, Mayotte Island, Indian Ocean. Geomorphology 182, 190–209. doi: 10.1016/j.geomorph.2012.11.013
Jeanson M., Dolique F., Anthony E. J., Aubry A. (2019). Decadal-scale dynamics and morphological evolution of mangroves and beaches in a reef-lagoon complex, Mayotte Island. J. Coast. Res. 88, 195–208. doi: 10.2112/SI88-015.1
Kamel S. J. (2013). Vegetation cover predicts temperature in nests of the hawksbill sea turtle: Implications for beach management and offspring sex ratios. Endanger Spe Res. 20, 41–48. doi: 10.3354/esr00489
Kamel S. J., Mrosovsky N. (2005). Repeatability of nesting preferences in the hawksbill sea turtle, Eretmochelys imbricata, and their fitness consequences. Anim. Behav. 70, 819–828. doi: 10.1016/j.anbehav.2005.01.006
Kolbe J. J., Janzen F. J. (2002). Impact of nest-site selection on nest success and nest temperature in natural and disturbed habitats. Ecology 83, 269–281. doi: 10.1890/0012-9658(2002)083[0269:IONSSO]2.0.CO;2
Lamont M. M., Houser C. (2014). Spatial distribution of loggerhead turtle (Caretta caretta) emergences along a highly dynamic beach in the northern Gulf of Mexico. J. Exp. Mar. Biol. Ecol. 453, 98–107. doi: 10.1016/j.jembe.2013.11.006
Lemoine A., Briole P., Bertil D., Roullé A., Foumelis M., Thinon I., et al. (2020). The 2018-2019 seismo-volcanic crisis east of Mayotte, Comoros islands: Seismicity and ground deformation markers of an exceptional submarine eruption. Geophy J. Int. 223, 22–44. doi: 10.1093/gji/ggaa273
Marco A., Abella E., Martins S., López O., Patino-Martinez J. (2018). Female nesting behaviour affects hatchling survival and sex ratio in the loggerhead sea turtle: implications for conservation programmes. Ethol. Ecol. Evol. 30, 141–155. doi: 10.1080/03949370.2017.1330291
Maresh Nelson S. B., Coon J. J., Miller J. R. (2020). Do habitat preferences improve fitness? Context-specific adaptive habitat selection by a grassland songbird. Oecologia 193, 15–26. doi: 10.1007/s00442-020-04626-8
Martins S., Patrício R., Clarke L. J., De Santos Loureiro N., Marco A. (2022). High variability in nest site selection in a loggerhead turtle rookery, in Boa Vista Island, Cabo Verde. J. Exp. Mar. Biol. Ecol. 556, 151798. doi: 10.1016/j.jembe.2022.151798
Mayor S. J., Schneider D. C., Schaefer J. A., Mahoney S. P. (2009). Habitat selection at multiple scales. Écoscience 16, 238–247. doi: 10.2980/16-2-3238
Mazaris A. D., Matsinos G., Pantis J. D. (2009). Evaluating the impacts of coastal squeeze on sea turtle nesting. Ocean Coast. Manag. 52, 139–145. doi: 10.1016/j.ocecoaman.2008.10.005
McGehee M. A. (1979). Factors affecting the hatching success of loggerhead sea turtle eggs (Caretta caretta caretta). (Master’s thesis) University of Central Florida, Orlando, FL.
McGehee M. A. (1990). Effects of moisture on eggs and hatchlings of loggerhead sea turtles (Caretta caretta). Herpetologica 46, 251–258.
Miller J. (1997). “Reproduction in sea turtle,” in The Biology of Sea Turtles. eds. Lutz P., Musick J.. (Boca Raton, FL: CRC Press), 51–81.
Miller J. D., Limpus C. J., Godfrey M. (2003). "Nest site selection, oviposition, eggs, development, hatching, and emergence of loggerhead turtles." in The biology of the Loggerhead Turtle, ed. Bolten A., Witherington B. (Smithsonian Institution Press), p.125.
Morris D. W. (2003). How can we apply theories of habitat selection to wildlife conservation and management? Wildl. Res. 30, 303–319. doi: 10.1071/wr02028
Mortimer J. A. (1990). The influence of beach sand characteristics on the nesting behavior and clutch survival of green turtles (Chelonia mydas). Copeia 1990, 802. doi: 10.2307/1446446
Mortimer J. A., Appoo J., Bautil B., Betts M., Burt A. J., Chapman R., et al. (2022). Long-term changes in adult size of green turtles at Aldabra Atoll and implications for clutch size, sexual dimorphism and growth rates. Mar. Biol. 169, 123. doi: 10.1007/s00227-022-04111-1
Northrup J. M., Vander Wal E., Bonar M., Fieberg J., Laforge M. P., Leclerc M., et al. (2022). Conceptual and methodological advances in habitat-selection modeling: guidelines for ecology and evolution. Ecol. Appl. 32, e02470. doi: 10.1002/eap.2470
Ord J. K., Getis A. (1995). Local spatial autocorrelation statistics: distributional issues and an application. Geogr. Anal. 27, 286–306. doi: 10.1111/j.1538-4632.1995.tb00912.x
Patino-Martinez J., Veiga J., Afonso I., Yeoman K., Mangas Viñuela J., Charles G. (2022). Light sandy beaches favour hatching success and best hatchling phenotype of loggerhead turtles. Front. Ecol. Evol. 10. doi: 10.3389/fevo.2022.823118
Patrício A. R., Varela M. R., Barbosa C., Broderick A. C., Ferreira Airaud M. B., Godley B. J., et al. (2018). Nest site selection repeatability of green turtles, Chelonia mydas, and consequences for offspring. Anim. Behav. 139, 91–102. doi: 10.1016/j.anbehav.2018.03.006
Pike D. A., Roznik E. A., Bell I. (2015). Nest inundation from sea-level rise threatens sea turtle population viability. R. Soc. Open Sci. 2, 4–6. doi: 10.1098/rsos.150127
Pontee N. (2013). Defining coastal squeeze: A discussion. Ocean Coast. Manage. 84, 204–207. doi: 10.1016/j.ocecoaman.2013.07.010
REVOSIMA (2024). Bulletin mensuel de l’activité sismo-volcanique Mayotte du au 30 août 2024. IPGP, Université de Paris, OVPF, BRGM, Ifremer, CNRS. https://www.ipgp.fr/actualites-du-revosima/.
Rivas M. L., Rodríguez-Caballero E., Esteban N., Carpio A. J., Barrera-Vilarmau B., Fuentes M. M. P. B., et al. (2023). Uncertain future for global sea turtle populations in face of sea level rise. Sci. Rep. 13, 5277. doi: 10.1038/s41598-023-31467-1
Santos K. C., Livesey M., Fish M., Lorences A. C. (2017). Climate change implications for the nest site selection process and subsequent hatching success of a green turtle population. Mitig. Adapt. Strateg. Glob Change 22, 121–135. doi: 10.1007/s11027-015-9668-6
Serafini T. Z., Lopez G. G., Luís P., Rocha B. D. (2009). Nest site selection and hatching success of hawksbill and loggerhead sea turtles (Testudines, Cheloniidae) at Arembepe Beach, northeastern Brazil. Phyllomedusa: J. Herpetol. 8, 3–17. doi: 10.11606/ISSN.2316-9079.V8I1P03-17
SHOM (2020). Références Altimétriques Maritimes. Ports de France métropolitaine et d’outre-mer. Cotes du zéro hydrographique et niveaux caractéristiques de la marée, Édition SHOM, 120 p.
Sönmez B., Karaman S., Turkozan O. (2021). Effect of predicted sea level rise scenarios on green turtle (Chelonia mydas) nesting. J. Exp. Mar. Biol. Ecol. 541, 151572. doi: 10.1016/j.jembe.2021.151572
Spanier M. J. (2010). Beach erosion and nest site selection by the leatherback sea turtle Dermochelys coriacea (Testudines: Dermochelyidae) and implications for management practices at Playa Gandoca, Costa Rica. Rev. Biol. Trop. 58, 1237–1246.
Stewart T. A., Booth D. T., Rusli M. U. (2019). Influence of sand grain size and nest microenvironment on incubation success, hatchling morphology and locomotion performance of green turtles (Chelonia mydas) at the Chagar Hutang Turtle Sanctuary, Redang Island, Malaysia. Aust. J. Zool. 66, 356–368. doi: 10.1071/ZO19025
Stokes H. J., Esteban N., Hays G. C. (2024a). Nest site selection in sea turtles shows consistencies across the globe in the face of climate change. Anim. Behav. 208, 59–68. doi: 10.1016/j.anbehav.2023.12.001
Stokes H. J., Laloë J.-O., Esteban N., Hays G. C. (2024b). Empirical evidence for the extent of spatial and temporal thermal variation on sea turtle nesting beaches. J. Therm Biol. 125, 103965. doi: 10.1016/j.jtherbio.2024.103965
Traclet S., Dimassi A., Valy N. (2018). Cartographie simplifiée de la végétation des presqu’îles de Saziley et Charifou (Mayotte). Conservatoire Botanique National de Mascarin, Mayotte, Rapport technique, version, 2, Vol. 42.
Van De Merwe J., Ibrahim K., Whittier J. (2006). Effects of nest depth, shading, and metabolic heating on nest temperatures in sea turtle hatcheries. Chelonian Conserv. Biol. 5, 210–215. doi: 10.2744/1071-8443(2006)5[210:EONDSA]2.0.CO;2
Varela M. R., Patrício A. R., Anderson K., Broderick A. C., DeBell L., Hawkes L. A., et al. (2019). Assessing climate change associated sea-level rise impacts on sea turtle nesting beaches using drones, photogrammetry and a novel GPS system. Glob Change Biol. 25, 753–762. doi: 10.1111/gcb.14526
Veelenturf C. A., Sinclair E. M., Paladino F. V., Honarvar S. (2020). Predicting the impacts of sea level rise in sea turtle nesting habitat on Bioko Island, Equatorial Guinea. PloS One 15 (7), e0222251. doi: 10.1371/journal.pone.0222251
Visconti G., Scopelliti G., Caldareri F., Agate M., Cambera I., Sulli A., et al. (2022). Hatching success of caretta on a mediterranean volcanic beach: impacts from environmental parameters and substrate composition. J. Coast. Res. 38, 603–612. doi: 10.2112/JCOASTRES-D-21-00064.1
Wallace B. P., DiMatteo A. D., Hurley B. J., Finkbeiner E. M., Bolten A. B., Chaloupka M. Y., et al. (2010). Regional Management Units for Marine Turtles: a novel framework for prioritizing conservation and research across multiple scales. PloS One 5, e15465. doi: 10.1371/journal.pone.0015465
Wallace B., Posnik Z., Hurley B., DiMatteo A., Bandimere A., Rodriguez I., et al. (2023). Marine turtle regional management units 2.0: an updated framework for conservation and research of wide-ranging megafauna species. Endang Species Res. 52, 209–223. doi: 10.3354/esr01243
Wentworth C. K. (1922). A scale of grade and class terms for clastic sediments. J. Geol. 30, 377–392. doi: 10.1086/622910
Whitmore C. P., Dutton P. H. (1985). Infertility, embryonic mortality and nest-site selection in leatherback and green sea turtles in Suriname. Biol. Conserv. 34, 251–272. doi: 10.1016/0006-3207(85)90095-3
Wood D. W., Bjorndal K. A. (2000). Relation of temperature, moisture, salinity, and slope to nest site selection in loggerhead sea turtles. Copeia 2000, 119. doi: 10.1643/0045-8511(2000)2000[0119:ROTMSA]2.0.CO;2
Zare R., Vaghefi M. E., Kamel S. J. (2012). Nest location and clutch success of the Hawksbill sea turtle (Eretmochelys imbricata) at Shidvar Island, Iran. Chelonian Conserv. Biol. 11, 229–234. doi: 10.2744/CCB-1003.1
Zavaleta-Lizárraga L., Morales-Mávil J. E. (2013). Nest site selection by the green turtle (Chelonia mydas) in a beach of the north of Veracruz, Mexico. Rev. Mexicana Biodiversidad 84, 927–937. doi: 10.7550/rmb.31913
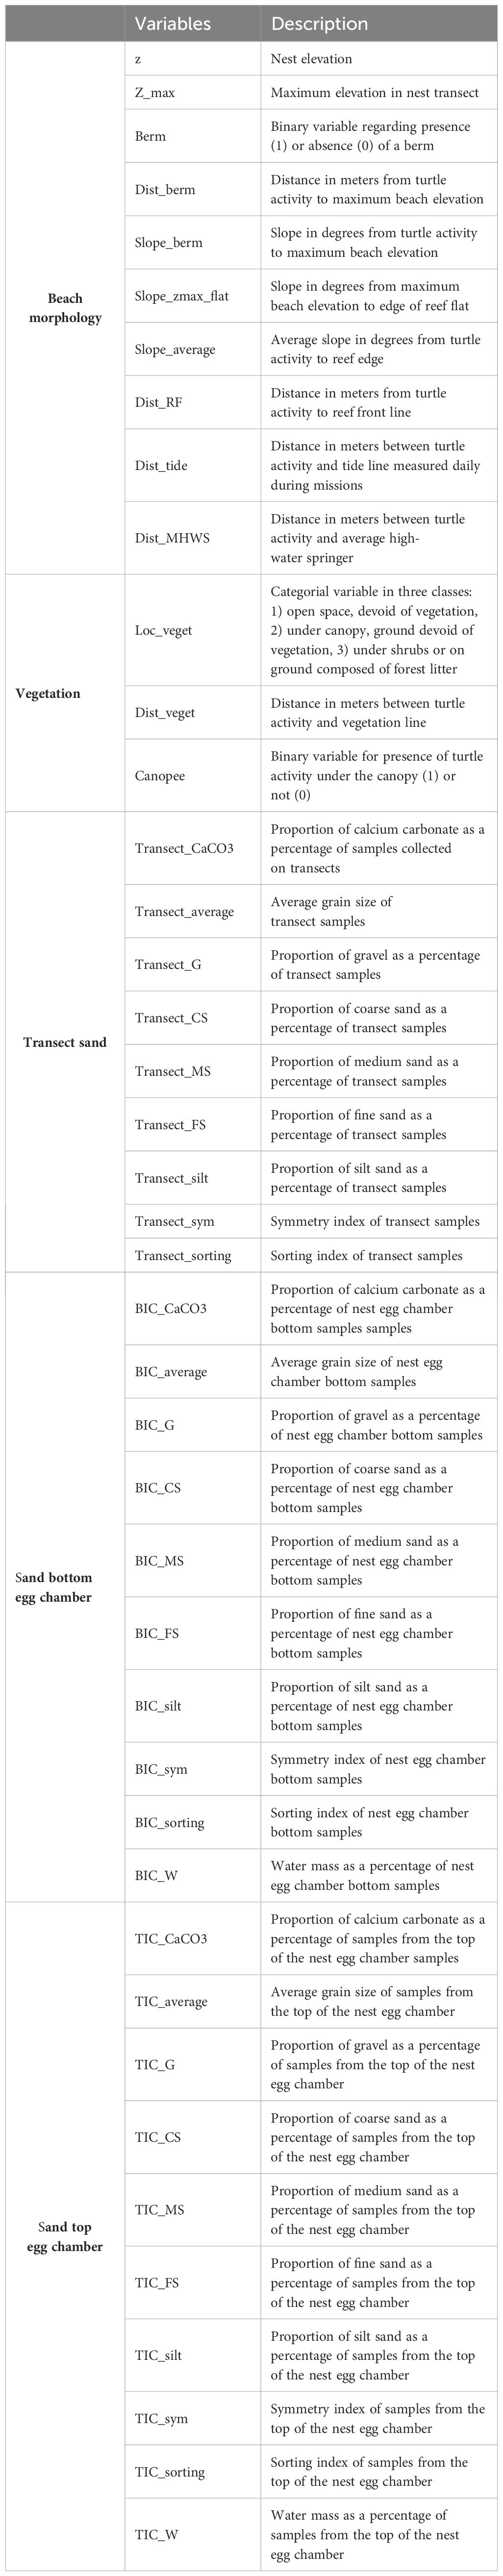
Appendix 1. Description of environmental variables collected for each green turtle nest or failure observation.
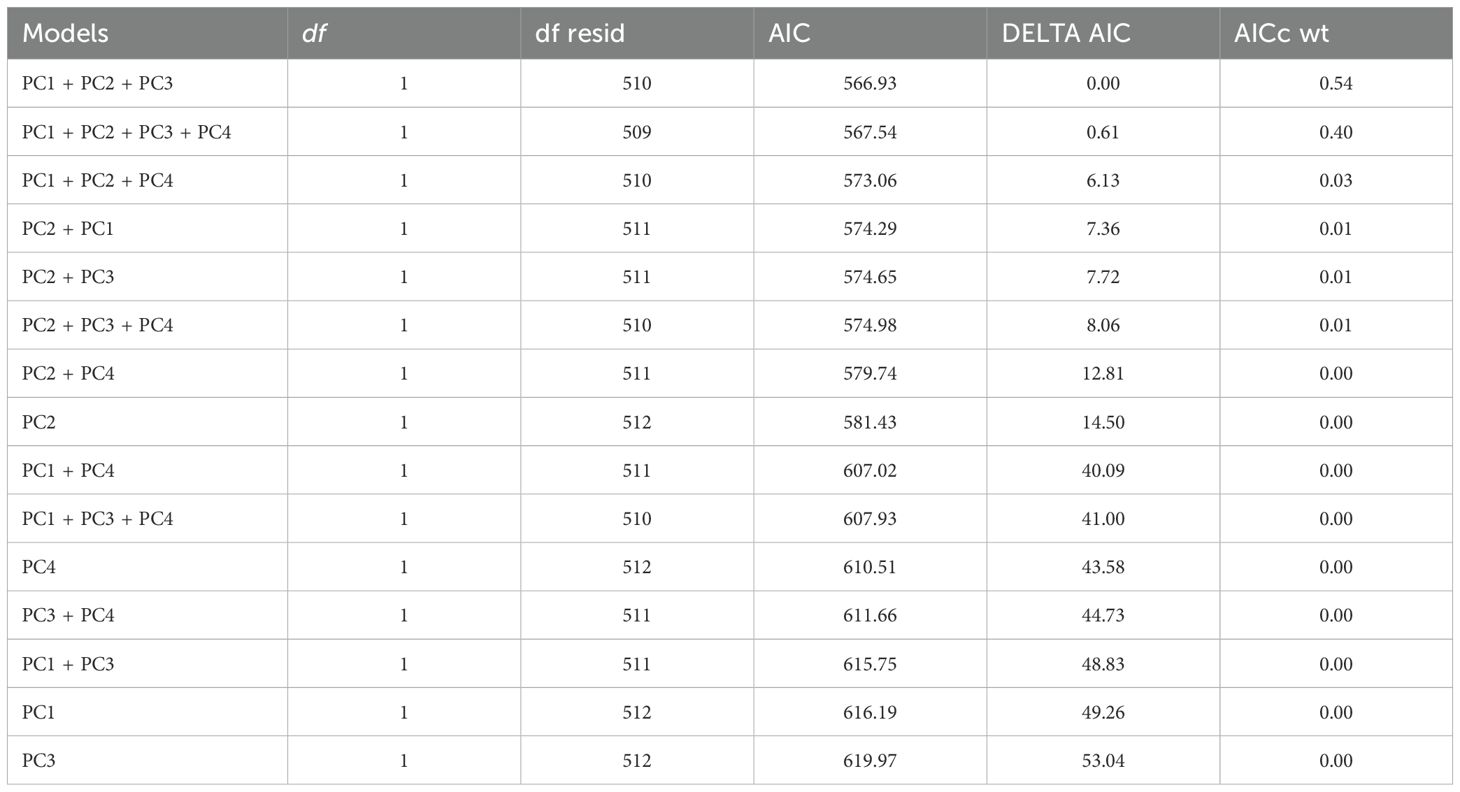
Appendix 2. Comparison of binomial GLMM models with nesting success as response variable.
Keywords: green turtle, nesting, volcanic sand, used distribution, hotspot, GIS, nest depth
Citation: Morisseau S, Jeanson M, Charroux S, Mercky Y, Le Bozec C, Charpentier M, Le Gall L, Delvenne C, Girondot M, Sucré E and Chevallier D (2025) Environmental preferences of green sea turtles (Chelonia mydas) for egg-laying on a fringing reef pocket beach, Mayotte Island. Front. Mar. Sci. 12:1506101. doi: 10.3389/fmars.2025.1506101
Received: 04 October 2024; Accepted: 11 March 2025;
Published: 04 April 2025.
Edited by:
Xuelei Zhang, Ministry of Natural Resources, ChinaReviewed by:
Nicole Esteban, Swansea University, United KingdomCopyright © 2025 Morisseau, Jeanson, Charroux, Mercky, Le Bozec, Charpentier, Le Gall, Delvenne, Girondot, Sucré and Chevallier. This is an open-access article distributed under the terms of the Creative Commons Attribution License (CC BY). The use, distribution or reproduction in other forums is permitted, provided the original author(s) and the copyright owner(s) are credited and that the original publication in this journal is cited, in accordance with accepted academic practice. No use, distribution or reproduction is permitted which does not comply with these terms.
*Correspondence: Sophie Morisseau, c29waGllLm1vcmlzc2VhdUB1bml2LW1heW90dGUuZnI=
Disclaimer: All claims expressed in this article are solely those of the authors and do not necessarily represent those of their affiliated organizations, or those of the publisher, the editors and the reviewers. Any product that may be evaluated in this article or claim that may be made by its manufacturer is not guaranteed or endorsed by the publisher.
Research integrity at Frontiers
Learn more about the work of our research integrity team to safeguard the quality of each article we publish.