
95% of researchers rate our articles as excellent or good
Learn more about the work of our research integrity team to safeguard the quality of each article we publish.
Find out more
ORIGINAL RESEARCH article
Front. Mar. Sci. , 27 March 2025
Sec. Coastal Ocean Processes
Volume 12 - 2025 | https://doi.org/10.3389/fmars.2025.1505633
 Caridad Ballesteros1*
 Daniel Lincke2
 Robert J. Nicholls1
 Jack Heslop1
 Jochen Hinkel2
 Víctor Malagón-Santos3
 Aimée B. A. Slangen3,4
Sea-level rise (SLR) through the twenty-first century and beyond is inevitable, threatening coastal areas and their inhabitants unless there is appropriate adaptation. We investigate coastal flooding to 2100 under the full range of IPCC AR6 (2021) SLR scenarios, assuming plausible adaptation. The adaptation selects the most economically robust adaptation option: protection or retreat. People living in unprotected coastal areas that are frequently inundated (below 1-in-1-year flood level) are assumed to migrate, and the land is considered lost. Globally, across the range of SLR and related socioeconomic scenarios, we estimate between 4 million and 72 million people could migrate over the twenty-first century, with a net land loss ranging from 2,800 to 490,000 km2. India and Vietnam consistently show the highest absolute migration, while Small Island Developing States are the most affected when considering relative migration and land loss. Protection is the most robust adaptation option under all scenarios for 2.8% of the global coastline, but this safeguards 78% of the global population and 91% of assets in coastal areas. Climate stabilisation (SSP1–1.9 and SSP1–2.6) does not avoid all coastal impacts and costs as sea levels still rise albeit more slowly. The impacts and costs are also sensitive to the socioeconomic scenario: SSP3–7.0 experiences higher migration than SSP5–8.5 despite lower SLR, reflecting a larger population and lower GDP. Our findings can inform national and intergovernmental agencies and organisations on the magnitude of SLR impacts and costs and guide assessments of adaptation policies and strategies.
Many people around the world are already migrating, for a variety of reasons: personal, socioeconomic, political, and environmental (Black et al., 2011). In coastal areas, one potential driver of migration is rising mean and extreme sea levels, as coastal land progressively becomes less suitable for living/working and is ultimately lost (Chen and Mueller, 2018; Davis et al., 2018; Lincke and Hinkel, 2021; Nienhuis and van de Wal, 2021). The Low Elevation Coastal Zone (land area hydrologically connected with the ocean below 10 m of elevation) already contains between 750 million and 1.1 billion people, putting more individuals in harm’s way (Macmanus et al., 2021). Sea-level rise (SLR) was stressed by the UN Secretary-General, Antonio Guterres, in February 2023, warning that accelerating sea-level rise threatens “a mass exodus of entire populations on a biblical scale” (UN, 2023). However, the relationship between climate and migration is complex, as it depends not only on the climatic drivers but also on economic, political, demographic, and social factors (McLeman, 2014; Cattaneo et al., 2019), and especially on adaptation. Large populations are currently living at or even below sea level due to extensive protection systems in various coastal locations, such as the Netherlands and China (Han et al., 1995; VanKoningsveld et al., 2008; Fang et al., 2020).
Coastal migration is often assumed to be a major response to SLR, as low-lying areas become flooded more frequently and ultimately uninhabitable. However, coastal protection can be a cost-efficient adaptation option for reducing the impacts of SLR over the twenty-first century, especially in high-risk areas with major assets, such as coastal cities or densely populated deltas (e.g., the Netherlands) (Hallegatte et al., 2013; Lincke and Hinkel, 2018). Protection allows coastal populations and economic activity to remain in situ, as the economic and social benefits of doing so outweigh those of any other form of adaptation (Tol, 2007; Nicholls et al., 2018). However, this is not universal, as in most coastal locations, protection costs exceed the benefits, and there are limits to an accommodation response. Hence, protecting all coastal populations can be more expensive than retreating in some locations (Hinkel et al., 2014), so considering a mixture of adaptation types—such as retreat leading to coastal migration in some places and coastal protection in others—can considerably reduce the total costs of SLR (Desmet et al., 2018; Lincke and Hinkel, 2021). While retreat (leading to migration) is being considered (Hino et al., 2017; Haasnoot et al., 2021), it is important to recognise that people are generally reluctant to abandon their land, livelihood assets, and social networks, and they will seek alternative ways to adapt before considering migration (Esteban et al., 2019; Hauer et al., 2020). Migration, therefore, can be seen as an adaptation option of last resort.
Here, we conduct a global analysis of the impact of SLR on coastal flooding over the twenty-first century, including the effects of plausible protection. In each scenario, we estimate migration, land loss, flood damages, and protection costs, allowing the total costs of SLR to be considered. The approaches are informed by insights from local studies, and there is a strong focus on migration. To do so, we have employed a model of local cost–benefit analysis (CBA) of two adaptation options: coastal protection versus retreat. Retreat leads to inland migration from the coastal floodplain, following the approach of Lincke and Hinkel (2021). We consider a migration scenario as the consequence of coastal retreat, in which land below the 1-in-1-year flood return level is assumed to be lost and abandoned, forcing people to move (Nicholls et al., 2011). We use the Dynamic Interactive Vulnerability Assessment (DIVA) model (Vafeidis et al., 2008) and build on the analysis of Lincke and Hinkel (2021) to assess the implications of the SLR projections from the latest IPCC Sixth Assessment Report (AR6) (Fox-Kemper et al., 2021). These projections provide, for the first time, SLR scenarios with consistency between the socioeconomic families, the shared socioeconomic pathways (SSP), and their resulting emission futures. The SLR projections include a very strong mitigation scenario (SSP1–1.9) (Chen et al., 2023) to explore differential outcomes of approximately 1.5°C warming relative to pre-industrial levels, which is relevant to the Paris Agreement goals (see Supplementary Table S1). A total of five SSP scenarios are assessed, considering the median, 5th, and 95th percentiles of the set of SLR projections that the AR6 report assessed as medium confidence (SSP1–1.9, SSP1–2.6, SSP2–4.5, SSP3–7.0, and SSP5–8.5), plus a high-end SLR scenario of the 17th and 83rd percentiles for the high-emission scenario. This scenario is unlikely but cannot be discounted, and AR6 assessed it as low confidence (SSP5–8.5*) (Fox-Kemper et al., 2021). The global mean SLR projections to 2100 range from 0.21 m (SSP1–1.9 5th percentile) to 1.60 m (SSP5–8.5* 83rd percentile) relative to a baseline of 1995–2014. Relative SLR scenarios, which include vertical land motion (VLM) as interpreted in AR6, are considered in the analysis. Three social discount rates are also considered (0%, 3%, and 6%).
We estimate the number of people migrating and the extent of land loss over the twenty-first century due to SLR and report results at global, country, and coastline segment levels. We assess the cost of SLR, including its individual components—flood damage, protection, and migration costs—and report at all levels. Finally, following the CBA, we identify, for the range of SLR scenarios, the proportion of coasts with economically robust decisions for different coastal adaptation options (protect or retreat).
We evaluate two main coastal adaptation strategies to SLR: coastal protection and retreat, following the method of Lincke and Hinkel (2021). A CBA is used to determine which of these strategies is economically optimal. Accordingly, adaptation costs and the number of people displaced are estimated based on the assumption that the most economically robust option is implemented. To achieve this, we apply the DIVA model (Hinkel et al., 2014) and the DIVA database, which divides the coastline into 12,148 coastal segments of similar and homogenous biophysical and socioeconomic characteristics (Vafeidis et al., 2008). For each segment, the CBA follows three steps: (1) Economic damages from flooding are assessed using the present value of flood risk damages given SLR, accounting for expected existing flood defences. This calculation integrates projected population, GDP, and flood risk with depth-damage functions and discount rates to estimate expected annual damages (EAD). (2) The economic justification for coastal flood protection based on the Net Present Value (NPV) of defence costs (both capital and maintenance costs) compared to flood damage and migration costs. If the benefit–cost ratio exceeds 1, flood protection is implemented. (3) Abandonment and migration occur when there is no economic justification for flood protection, and any population within the 1-in-1-year return period floodplain is assumed to migrate out of the coastal zone. This results in damages due to the loss of assets by the migrating population.
The results from each coastline segment are aggregated at the country level to identify the most affected countries globally while retaining information at regional and national levels. The model operates in 5-year timesteps from 2020 to 2100, accounting for SLR scenarios and related socioeconomic scenarios.
Migration is computed as the number of people living in unprotected coastal areas below a 1-in-1-year flood return period—an indicative threshold at which habitation becomes implausible, leading to inland migration. Migration costs are valued at three times the local GDP per capita per migrant, representing the value of assets on the lost land (2.8 times local GDP per capita per resident) (Hallegatte et al., 2013), plus 7% deconstruction costs (Diaz, 2016). Land loss is estimated using the same flood frequency (1-in-1-year return period), and where no protection exists, land below this level is considered lost (not habitable). If relative sea-level fall occurs, these areas gain land, and no migration takes place. Protection cost is assessed based on the expenses of upgrading and maintaining coastal protection infrastructure. We differentiate between low and high national unit protection costs for rural and urban environments, respectively, using a population density threshold (rural: < 1,000 people/km2; urban: > 1,000 people/km2), with an annual maintenance cost set at 1% of the capital cost, following Nicholls et al. (2019). Flood damages are estimated using the depth-damage approach of Hinkel et al. (2014), which accounts for the exposure of people and assets. This analysis does not consider the loss of ecosystems or land-use changes beyond human settlements. The expected annual damage (EAD) for each coastal segment is calculated as the expected value of damages resulting from extreme water level distributions derived from Muis et al. (2016). These distributions are combined with elevation-based population and asset density from the Multi-Error-Removed Improved-Terrain Digital Elevation Model (MERIT DEM) (Yamazaki et al., 2017) and the Gridded Population of the World (GPW4) dataset (Center for International Earth Science Information Network—CIESIN—Columbia University, 2017). Extreme water levels are assumed to rise uniformly with SLR. Initial protection levels are sourced from a stylised protection model (Sadoff et al., 2015) and supplemented with estimates of protection levels for 136 large coastal cities (Hallegatte et al., 2013). Coastal areas with population densities below 30 people/km2 are assumed to have no protection and no residents living below the 1-in-1-year flood frequency elevation as of 2020. In more densely populated areas, habitation below this elevation is possible where coastal protection exists.
Our SLR projections are based on data developed by the IPCC AR6 using the SSP scenarios SSP1–1.9, SSP1–2.6, SSP2–4.5, SSP3–7.0, and SSP5–8.5 through 2100 (Supplementary Figure S4; Fox-Kemper et al., 2021; Garner et al., 2021; Kopp et al., 2023). The AR6 report provides a set of medium-confidence SLR projections for each SSP scenario, from which we use the 5th, 50th, and 95th percentiles. In addition, AR6 provides a low-confidence scenario (SSP5–8.5*), for which we use the 17th and 83rd percentiles (Fox-Kemper et al., 2021). This low-confidence scenario reflects the potential influence of low-likelihood, high-impact ice sheet processes that are unlikely to occur but cannot be ruled out. The percentile range incorporates data from structured expert judgment and one model that includes Marine Ice Cliff Instability. These projections estimate a global mean SLR in 2100 of 0.21 m (SSP1–1.9 5th percentile) to 1.60 m (SSP5–8.5* 83rd percentile) relative to the 1995–2014 baseline, based on simulations from the CMIP6 Scenario MIP Intercomparison Project (Eyring et al., 2016). This marks the first instance where socioeconomic scenarios (O’Neill et al., 2014) have been integrated to align emission pathways with the most appropriate radiative forcing values projected for 2100 (Chen et al., 2023). Unlike earlier RCP scenarios (e.g., Church et al., 2013; Oppenheimer et al., 2019), the new SSP framework ensures consistency between socioeconomic trajectories and their corresponding emission futures. Another key advancement in AR6 is the inclusion of the SSP1–1.9 scenario, representing a strong mitigation pathway. This scenario enables the assessment of differential outcomes under approximately 1.5°C of warming (see Supplementary Table S1) relative to pre-industrial levels, which is particularly relevant for evaluating the Paris Agreement goals.
The climate-induced SLR scenarios are downscaled to a 1° × 1° grid resolution, incorporating an estimate of VLM. VLM is estimated by comparing tide gauge measurements with consistent climate-induced SLR and extracting the residual, which is interpreted as VLM (Kopp et al., 2014). This is assumed to continue linearly until 2100 (Fox-Kemper et al., 2021). Future coastal population projections are based on the spatially explicit gridded population dataset from Merkens et al. (2016) under the SSPs, while GDP projections are sourced by the SSP database Version 5 (IIASA, 2012; O’Neill et al., 2014). The elevation data used in this analysis is the MERIT DEM (Yamazaki et al., 2017). We consider three social discount rates—0%, 3%, and 6%—which represent interest rates applied to assign present values to future costs and benefits. The combination of SLR scenarios and discount rates provides a total of 51 scenarios.
Our results indicate that between 4 million to 72 million people are expected to migrate due to SLR over the twenty-first century across a range of scenarios. The minimum is associated with the 5th percentile of the lowest SLR scenario (SSP1–1.9), and the maximum with the 95th percentile of the SSP3–7.0 scenario (corresponding to a global mean SLR of 0.21 and 1.11 m, respectively, from the baseline period of 1995–2014 to 2100) (Figures 1, 2; Supplementary Table S4). Global migration numbers show a wide range, as they depend not only on SLR scenarios but also on socioeconomic factors, particularly population change. Under the SSP1–1.9 scenario (“sustainability”), a total of 4–36 million people are projected to migrate by 2100. Under the SSP3–7.0 scenario (“regional rivalry”), which represents the highest population growth and lowest economic growth among the SSPs (KC and Lutz, 2017; O’Neill et al., 2017), the migration reaches its highest values, ranging from 22 to 72 million people by 2100. Figure 2 also presents the cumulated number of migrants versus global mean sea levels, highlighting the influence of socioeconomic scenarios on the results, particularly under the SSP3–7.0 scenario. The scenarios with the highest increase in sea levels, represented by SSP5–8.5 95th percentile and SSP5–8.5* 83rd percentile (“fossil fuel-driven”), show a maximum of 57 and 67 million people migrating, respectively (Figure 2).
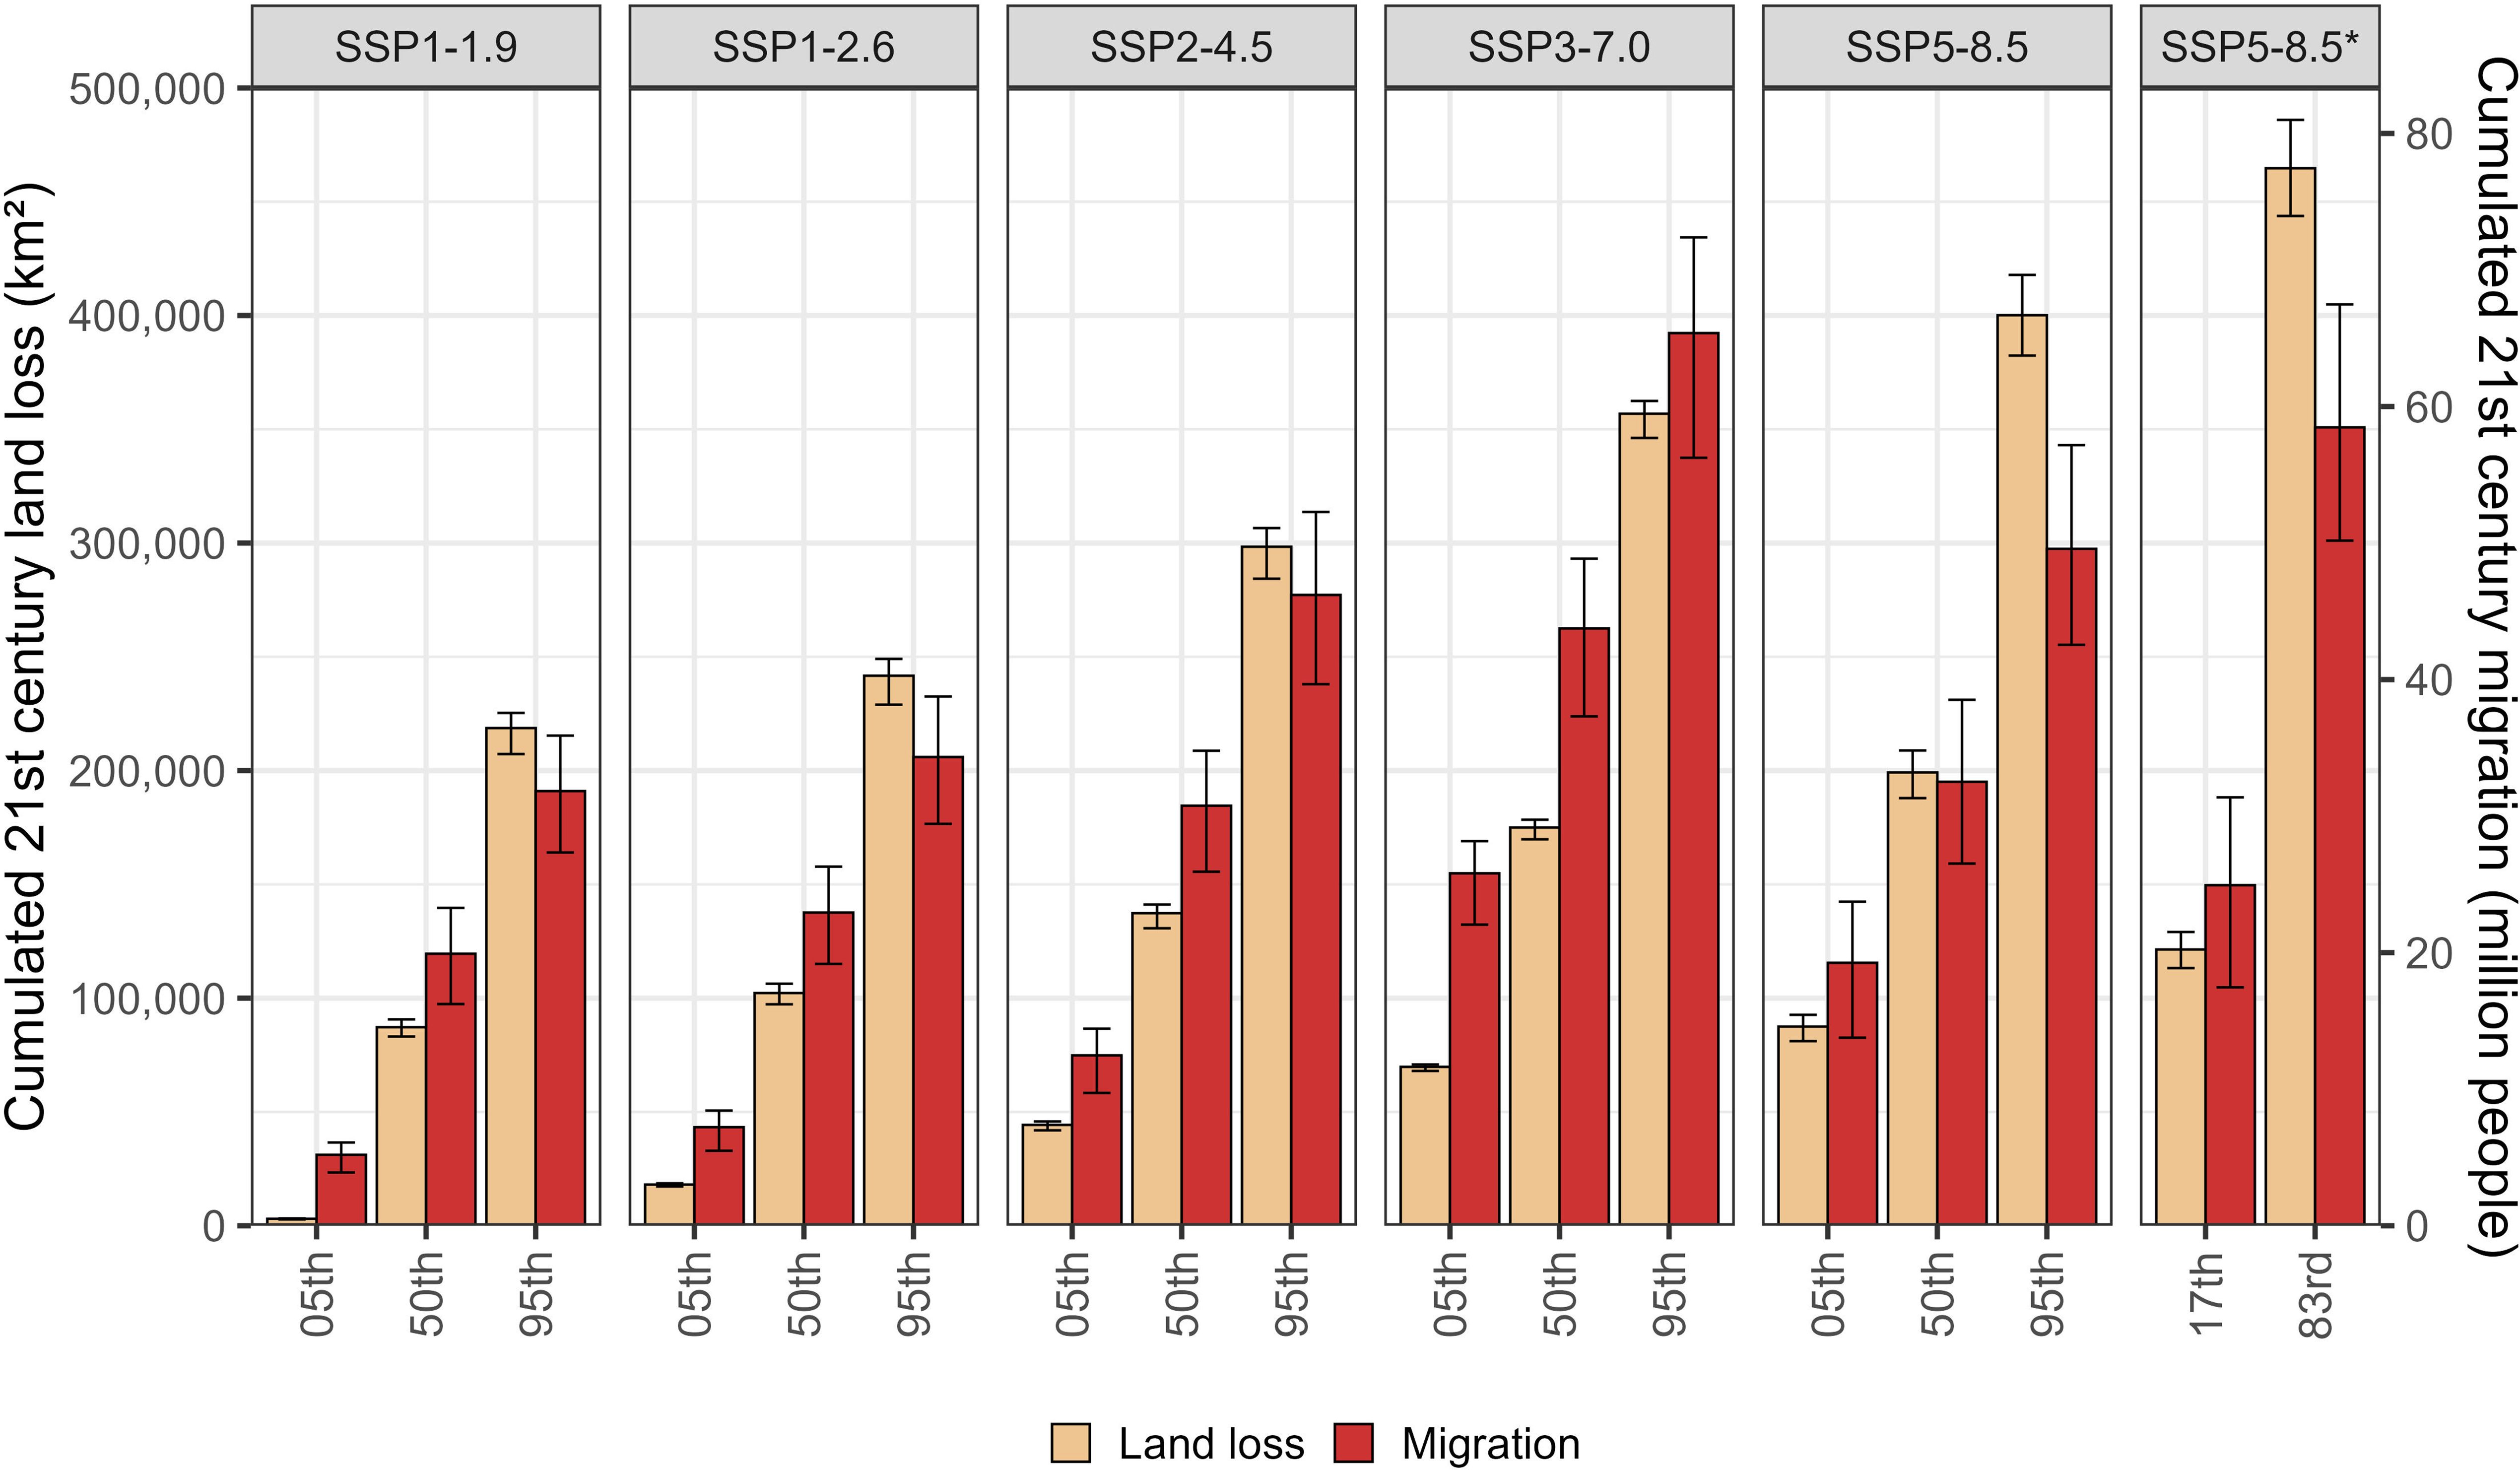
Figure 1. Global cumulative migration (million people, right axis) and net land loss (km2, left axis) over the twenty-first century (2020 to 2100) under different SSP scenarios. Bars represent mean values across all discount rates, with error bars indicating the minimum and maximum values.
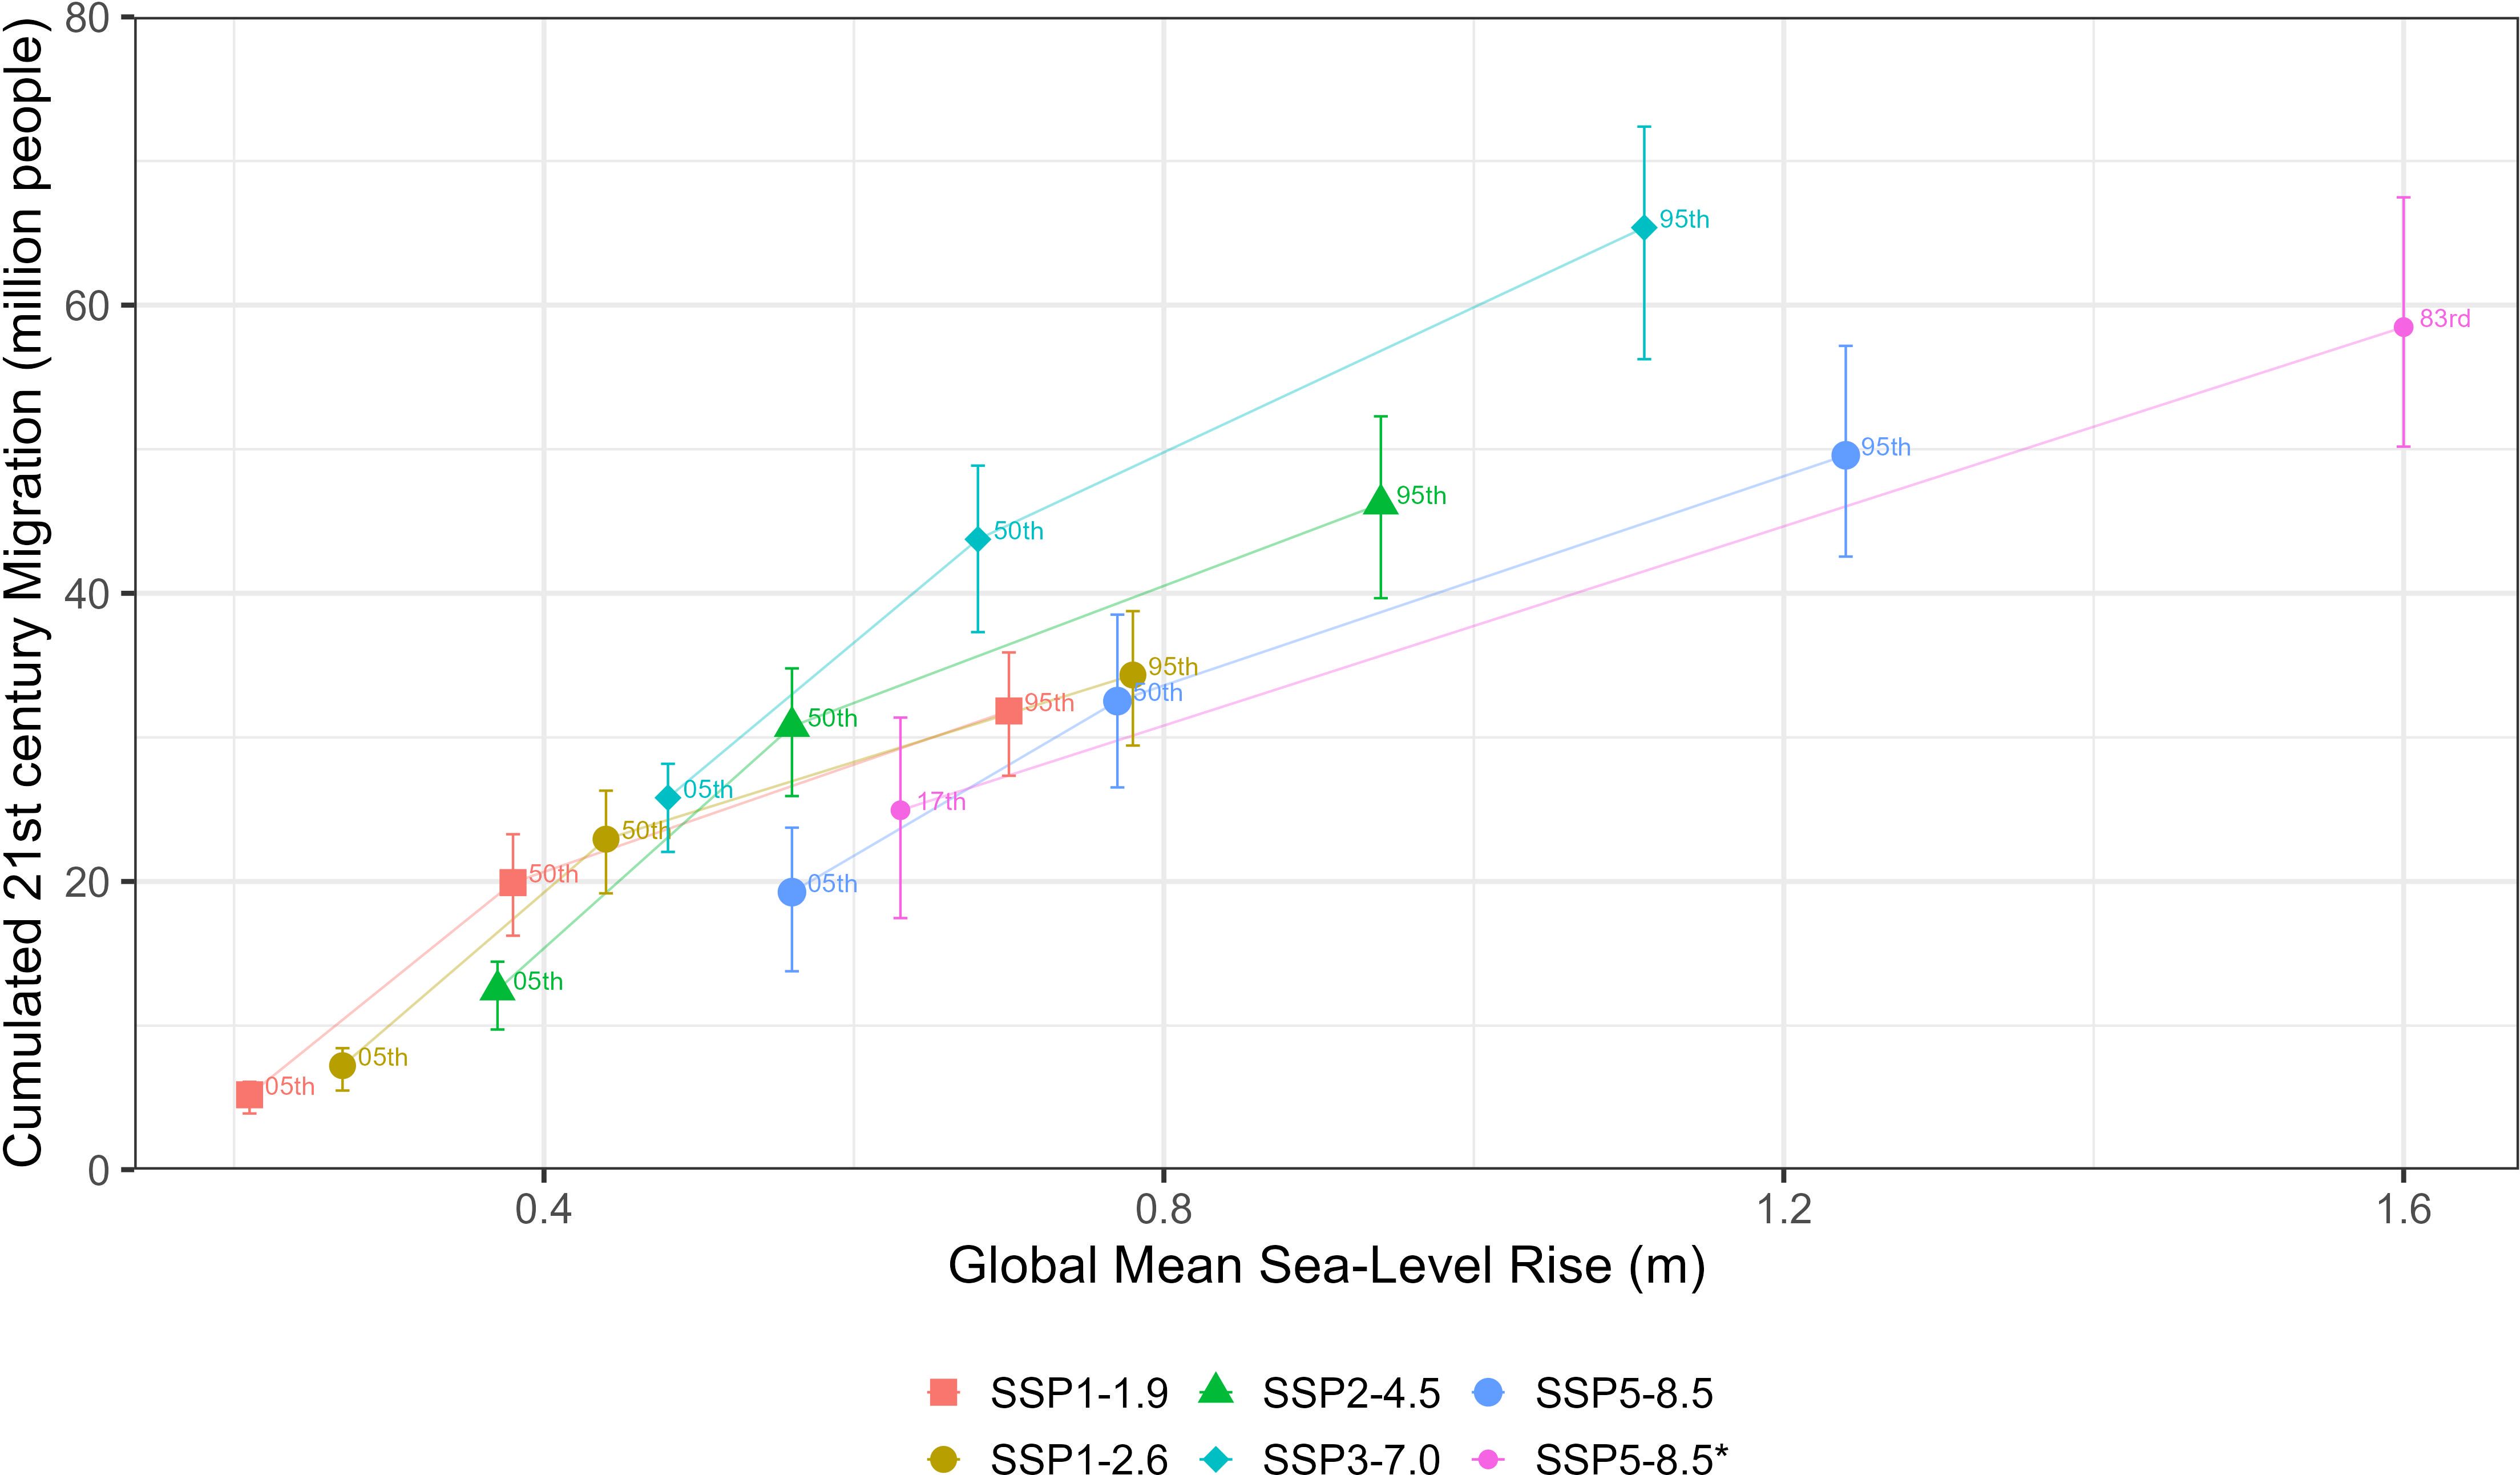
Figure 2. Global cumulative migration (million people) over the twenty-first century (2020 to 2100) for the different SSP scenarios, with percentiles shown against global-mean SLR (m) in 2100. Symbols represent mean values across all discount rates, with error bars indicating the minimum and maximum values.
Global net land loss across all scenarios ranges from 2,800 to 490,000 km2 (Figure 1), showing a steady increase from the smallest (SSP1–1.9) to the largest (SSP5–8.5) SLR scenario. Unlike migration, global land loss is much less influenced by socioeconomic factors, as only a small portion of land in coastal floodplains is protected. Consequently, land loss primarily depends on the magnitude of SLR (Lincke and Hinkel, 2018; 2021).
The migration trends over time for different SSP scenarios (Figure 3) vary, reflecting differences in SLR projections and socioeconomic evolution throughout the twenty-first century, which influence population dynamics and adaptation decisions. Under SSP1–1.9 and SSP1–2.6, which project the smallest SLR, migration trends decline over time for all percentiles in SSP1–1.9 and SSP1–2.6 95th, whereas SSP1–2.6 5th and 50th show a slight increase until 2050 followed by a decline. This trend results from population decreases after 2050 and continued wealth growth, while protection costs remain constant, making protection more favourable than migration. For SSP2–4.5, SSP3–7.0, and SSP5–8.5, migration trends across percentiles follow a similar pattern but with different magnitudes. In the 5th percentile, migration increases gradually under SSP2–4.5, while SSP5–8.5 and SSP3–7.0 show a steeper rise, particularly in the latter due to the highest population growth. In the 50th percentile, migration increases until around 2045–2050, with approximately half a million people migrating per year. This trend is driven by moderate sea-level rise and population growth up to 2050. After 2050, migration declines more sharply under SSP2–4.5 until the end of the century, whereas a new increase is observed from 2085, driven by continued population growth under SSP3–7.0 and SLR exceeding 0.4 m under SSP5–8.5. The opposite trend is observed for the 95th percentiles, which represent the highest increases in SLR for each scenario. In these cases, the number of people migrating per year declines until 2050, followed by an increase thereafter. The SSP3–7.0 scenario shows the highest migration, with around a million people per year by 2100. This scenario is unique in that global population growth continues until the end of the century, reaching an estimated 12 billion, while GDP remains the lowest (Supplementary Figure S1). Discount rates on migration contribute to a wider range in the 50th and 95th percentiles for medium-confidence SLR scenarios and in both percentiles for the low-confidence SLR scenario (SSP5–8.5*).
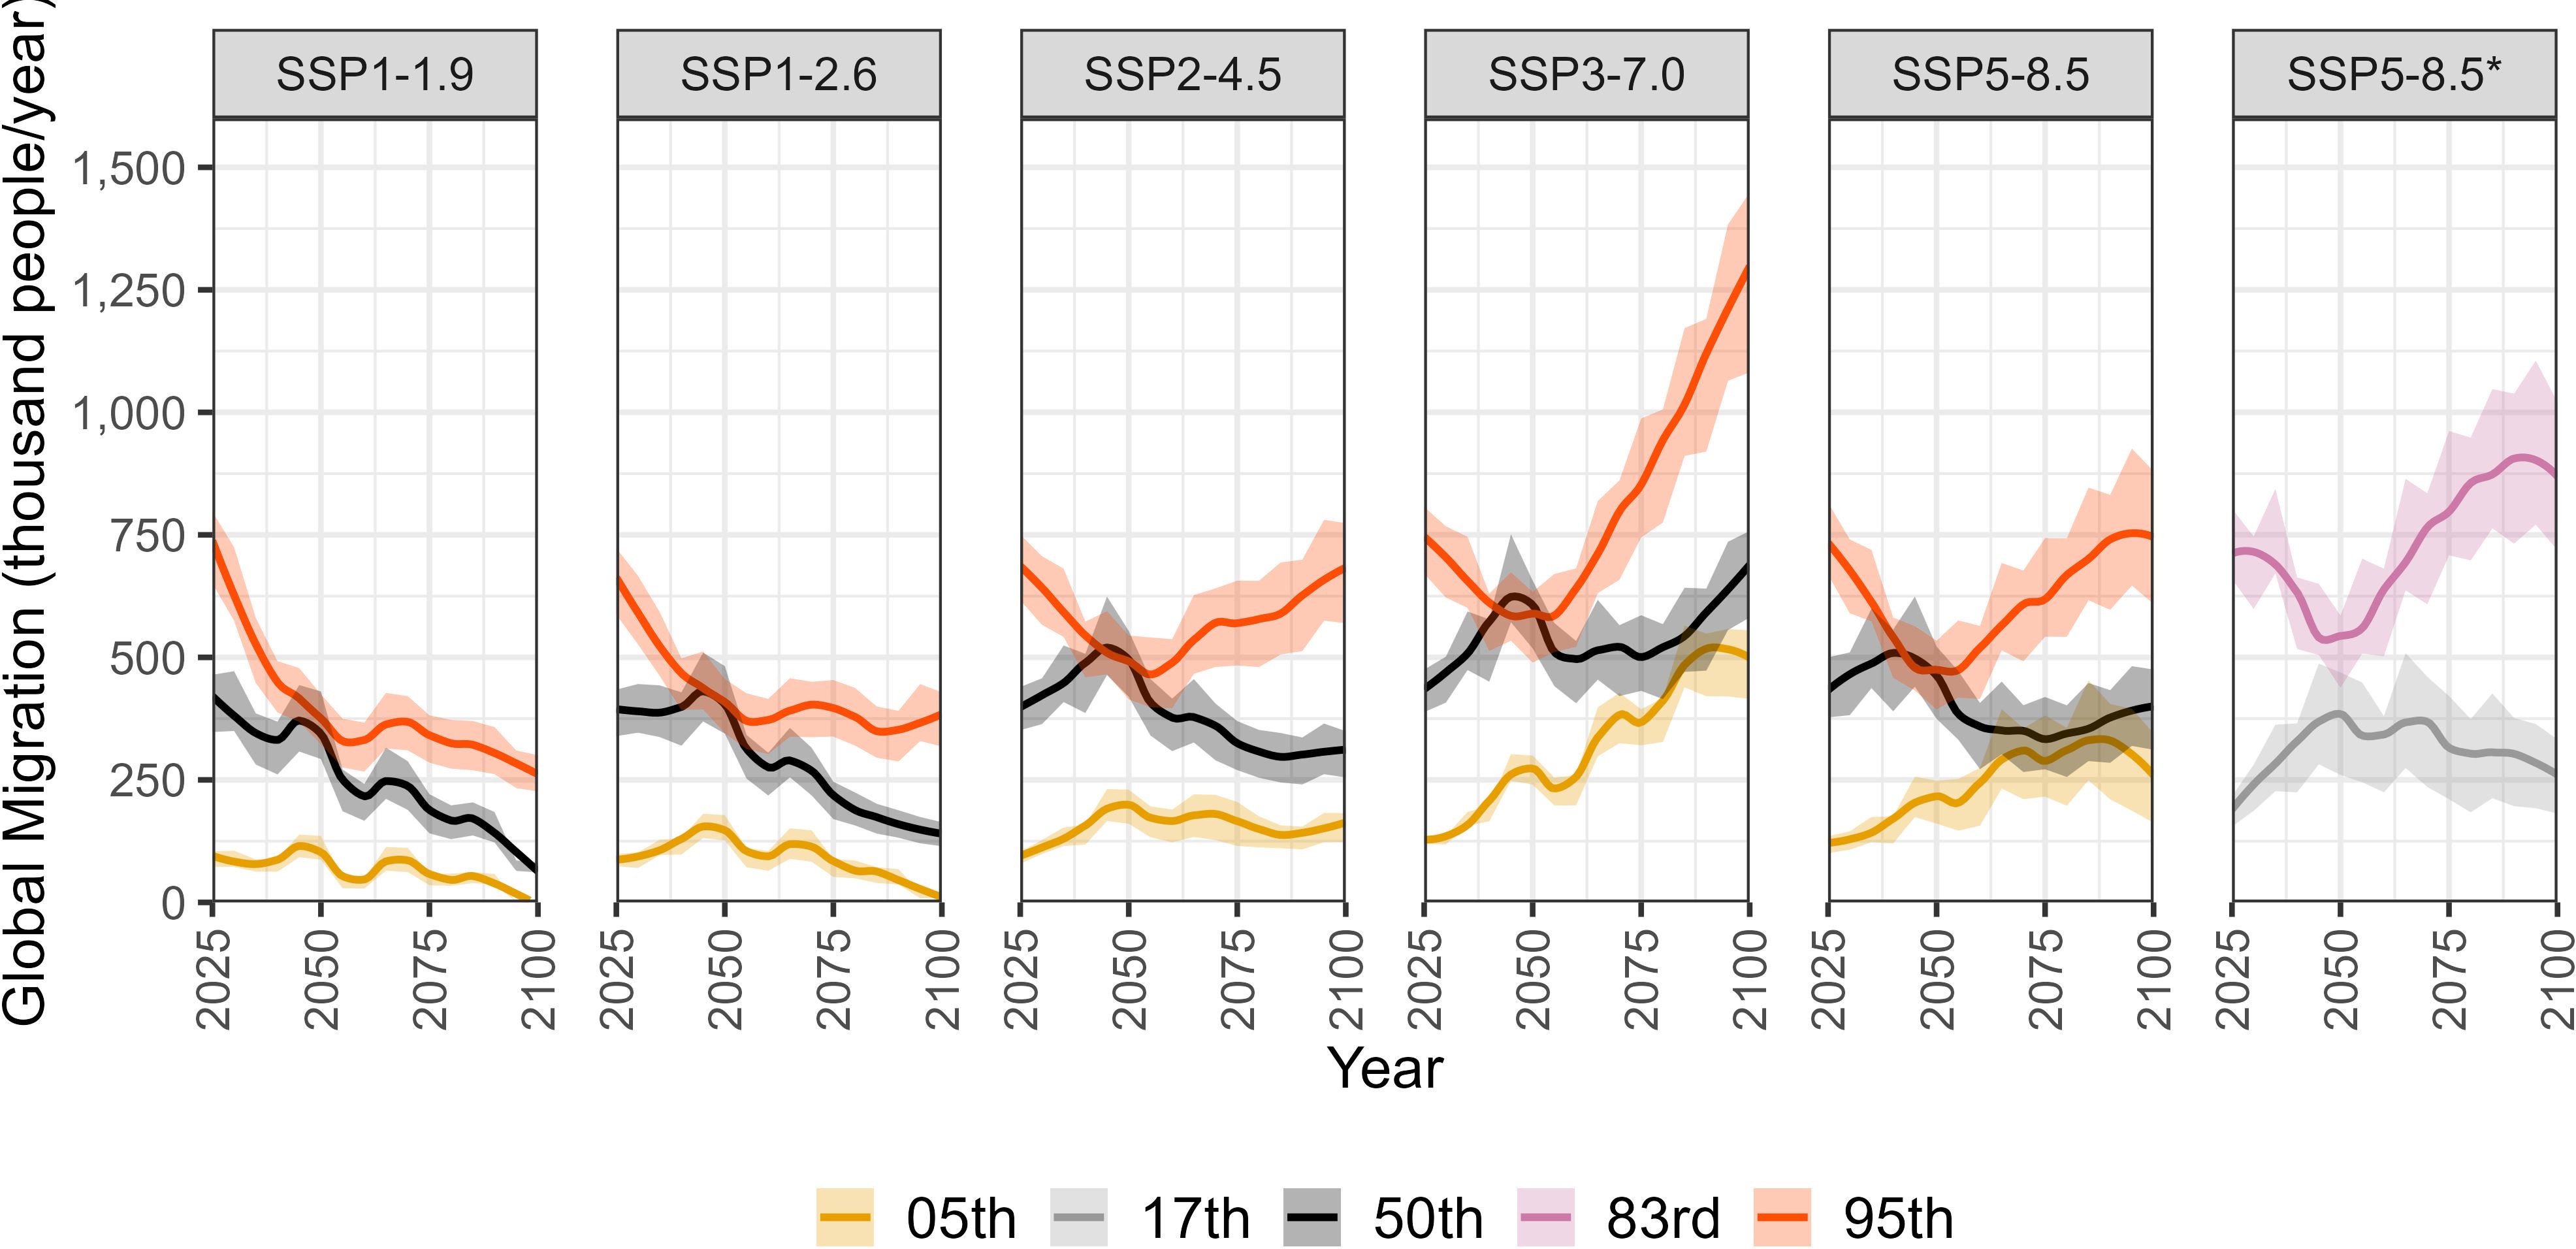
Figure 3. Global migration over time under different SSP scenarios. The line represents the average values, while the shaded area indicates the minimum and maximum values across the three discount rates.
Figure 4 illustrates the countries with more than one million migrants over the twenty-first century. Apart from SSP1 5th percentile, India and Vietnam experience the highest migration under all scenarios, reaching a maximum of 14 and 12 million migrants by 2100, respectively, both associated with the SSP3–7.0 95th percentile scenario. Under SSP1 scenarios at the 5th percentile, the Philippines (for both SSP1–1.9 and SSP1–2.6) and Nigeria (for SSP1–2.6) exhibit the highest migration. India, Vietnam, Nigeria, the Philippines, and Indonesia appear across all other scenarios and percentiles, while Myanmar is present in all but the 5th percentile and SSP1–1.9 50th percentile. For these countries, the highest migration by 2100 occurs under the SSP3–7.0 95th percentile scenario, with mean values of 5.1 million in Nigeria, 4.0 million in the Philippines, 3.6 million in Indonesia, and 3.2 million in Myanmar. Bangladesh, Mozambique, and China follow with the next highest migration under the same scenario. In contrast, Brazil and the USA experience the highest migration under the SSP5–8.5* 83rd percentile scenario, highlighting the significance of population projections alongside their dependence on high SLR (1.7 and 1.5 m, respectively). The Philippines faces the highest national relative SLR under the SSP5–8.5* 83rd percentile scenario, with an average national SLR of 1.90 m by 2100, resulting in 3.8 million migrants.
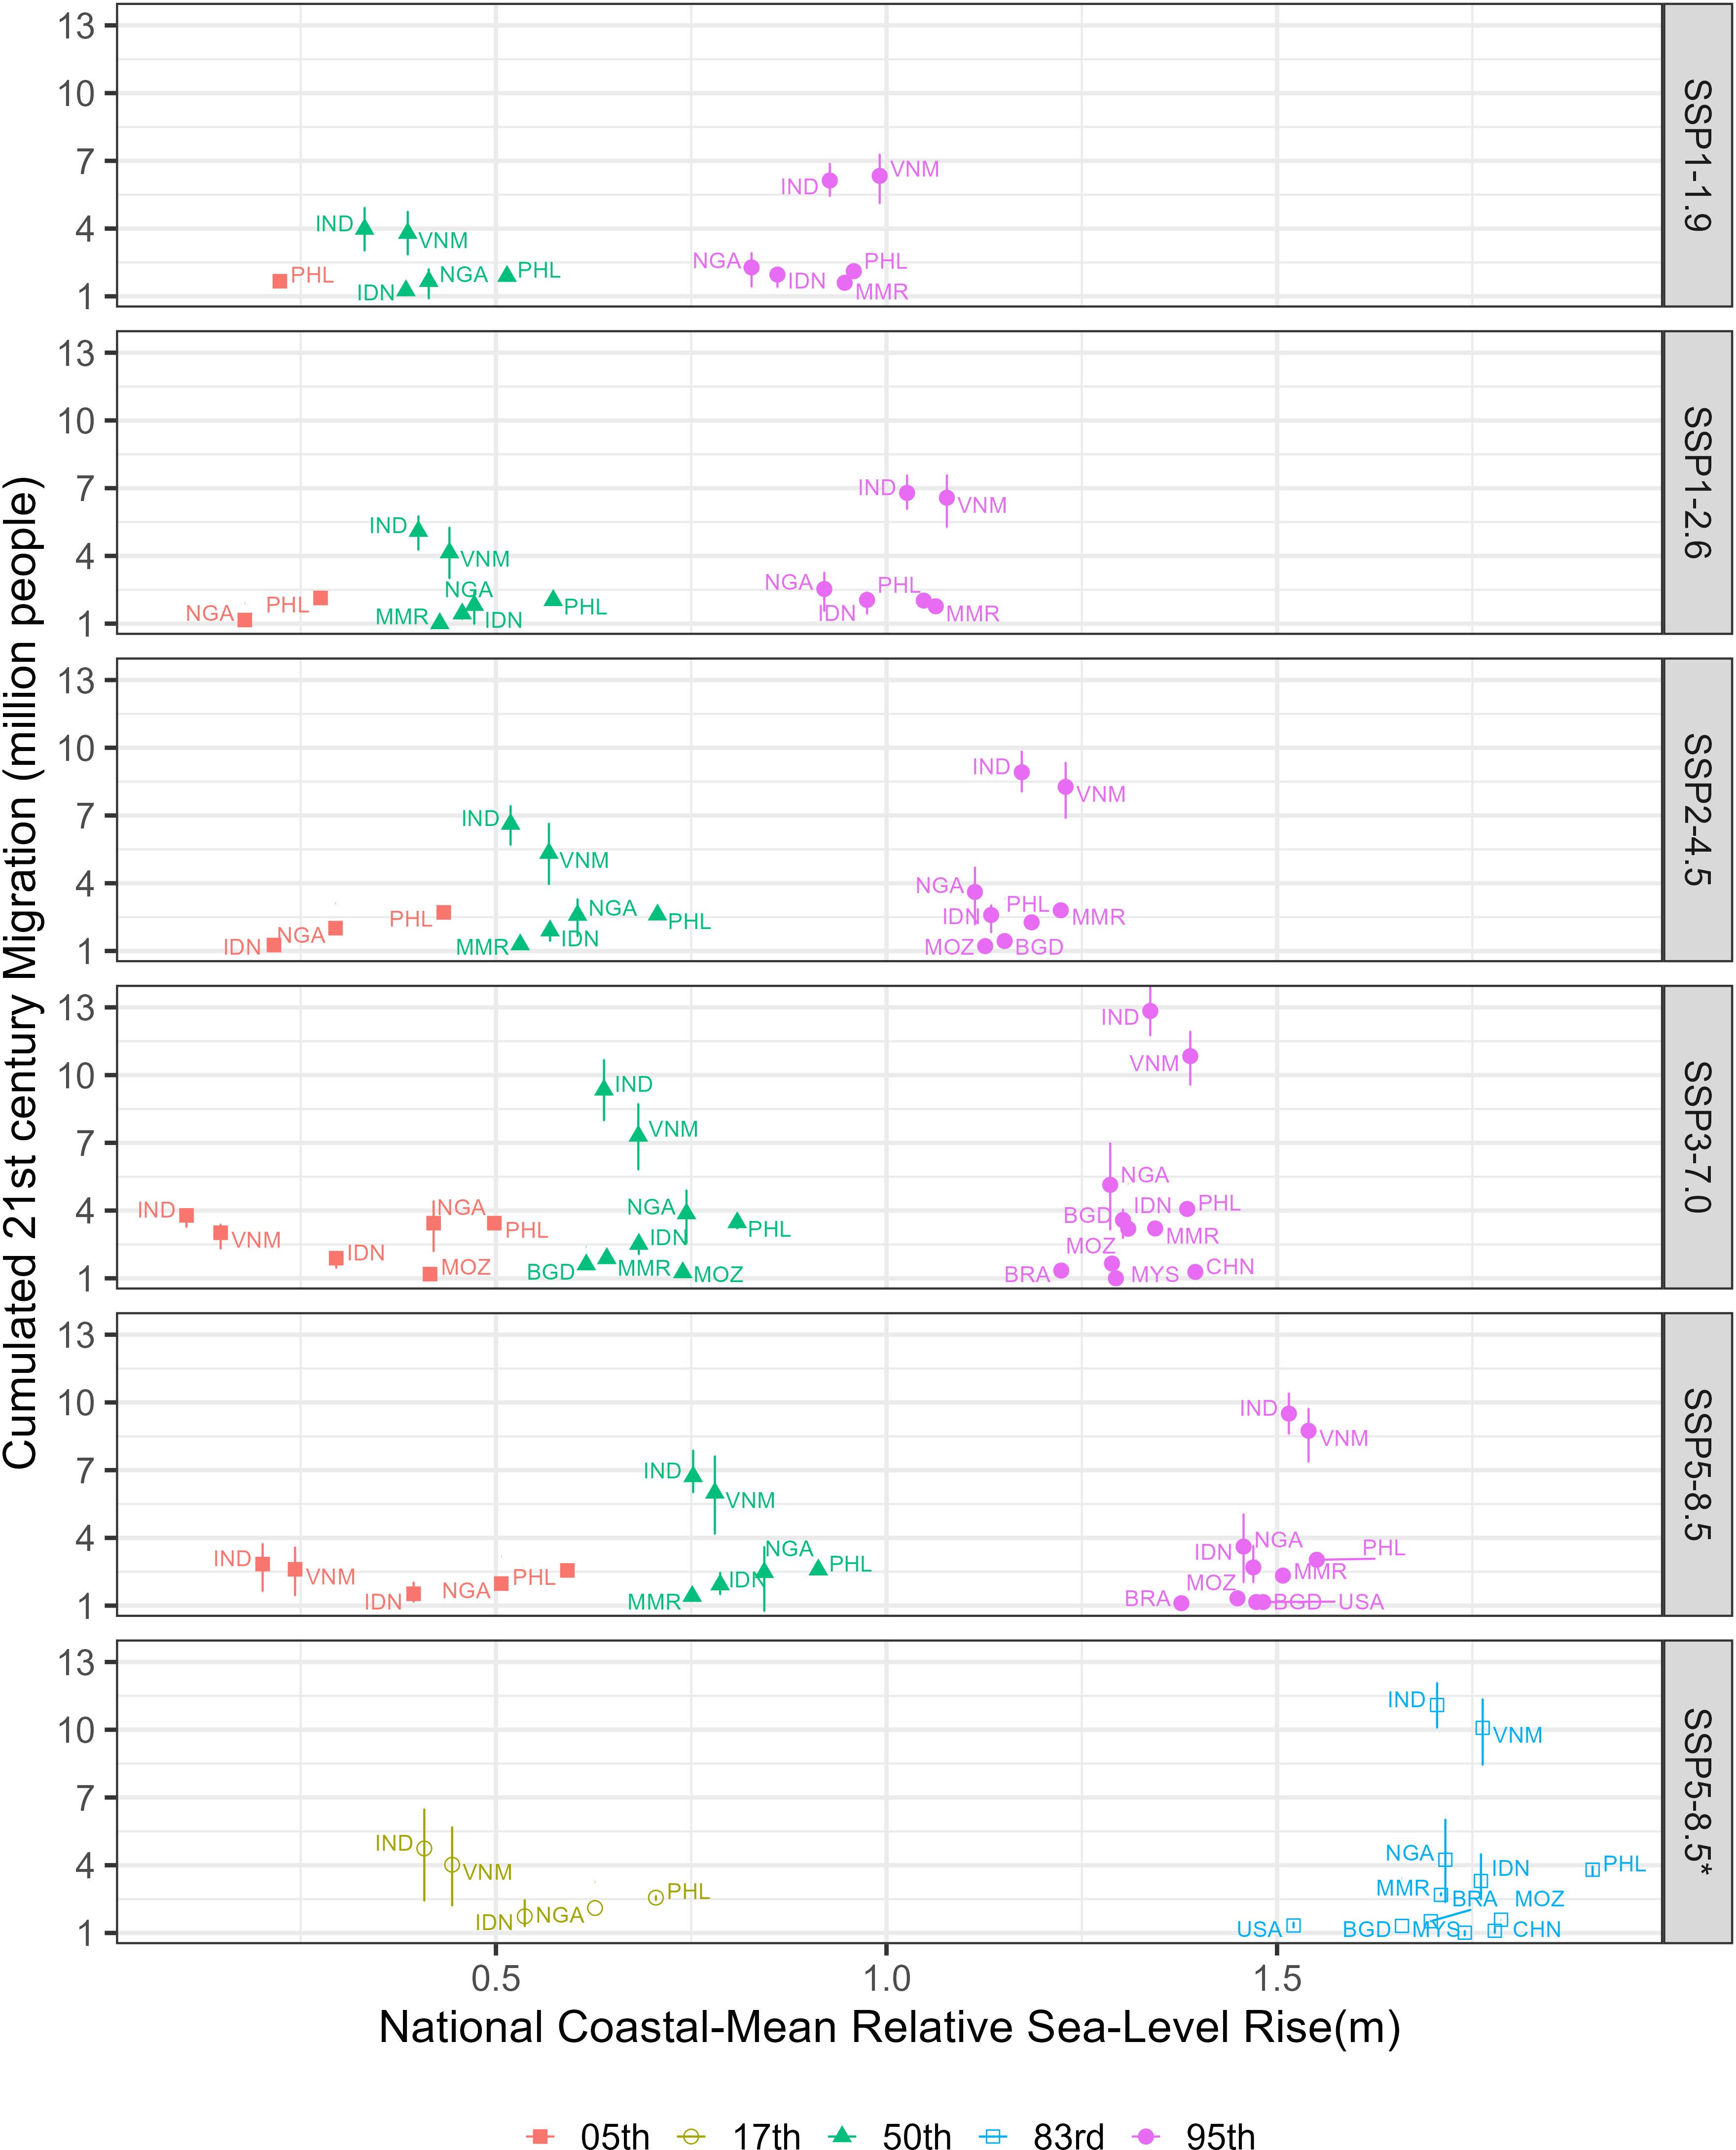
Figure 4. Countries with more than one million people migrating over the twenty-first century (2020 to 2100) under different SSP scenarios in 2100. Sea-level rise is expressed as coastal-mean relative SLR at the country level, as calculated in DIVA. Symbols represent mean values for different percentiles (red/square 5th percentile, green/triangle = 50th percentile, pink/circle = 95th percentile, yellow/hollow circle = 17th percentile, blue/hollow square = 83rd percentile), with error bars indicating the minimum and maximum values across different discount rates. Countries are denoted by their ISO 3166-1 alpha-3 codes: IND, India; VNM, Vietnam; PHL, Philippines; NGA, Nigeria; IDN, Indonesia; MMR, Myanmar; MOZ, Mozambique; CHN, China; USA, United States; BGD, Bangladesh; BRA, Brazil; MYS, Malaysia.
Figure 5 shows the countries projected to lose more than 10,000 km2 of land over the twenty-first century under the SSP scenarios. The USA, Russia, Indonesia, Brazil, and Australia are the top five countries affected. These countries have extensive coastlines and large floodplains, much of which is uninhabited or sparsely populated, making protection less optimal. As SLR scenarios intensify, land loss increases, with a stronger dependence on migration than socioeconomic projections. Indonesia and Vietnam exhibit the widest range of land loss across scenarios, indicating greater sensitivity to the effects of different discount rates on protection decisions. This is due to the high concentration of people and assets in affected areas, which is also reflected in the highest number of migrants (Figure 4). Two other countries with significant potential for land loss–China and Canada—do not feature in the top five. China implements high levels of coastal protection to safeguard its large coastal population, thereby reducing land loss. Without such measures, China would face a maximum land loss of 93,000 km2 by 2100 due to SLR. However, coastal protection limits this loss to just 4,600 km2, a reduction of over 95% (see Supplementary Data). In contrast, Canada experiences significant areas of sea-level fall, leading to land gains that offset net land loss at the national scale (see Supplementary Tables S2, S5; Supplementary Figure S4).
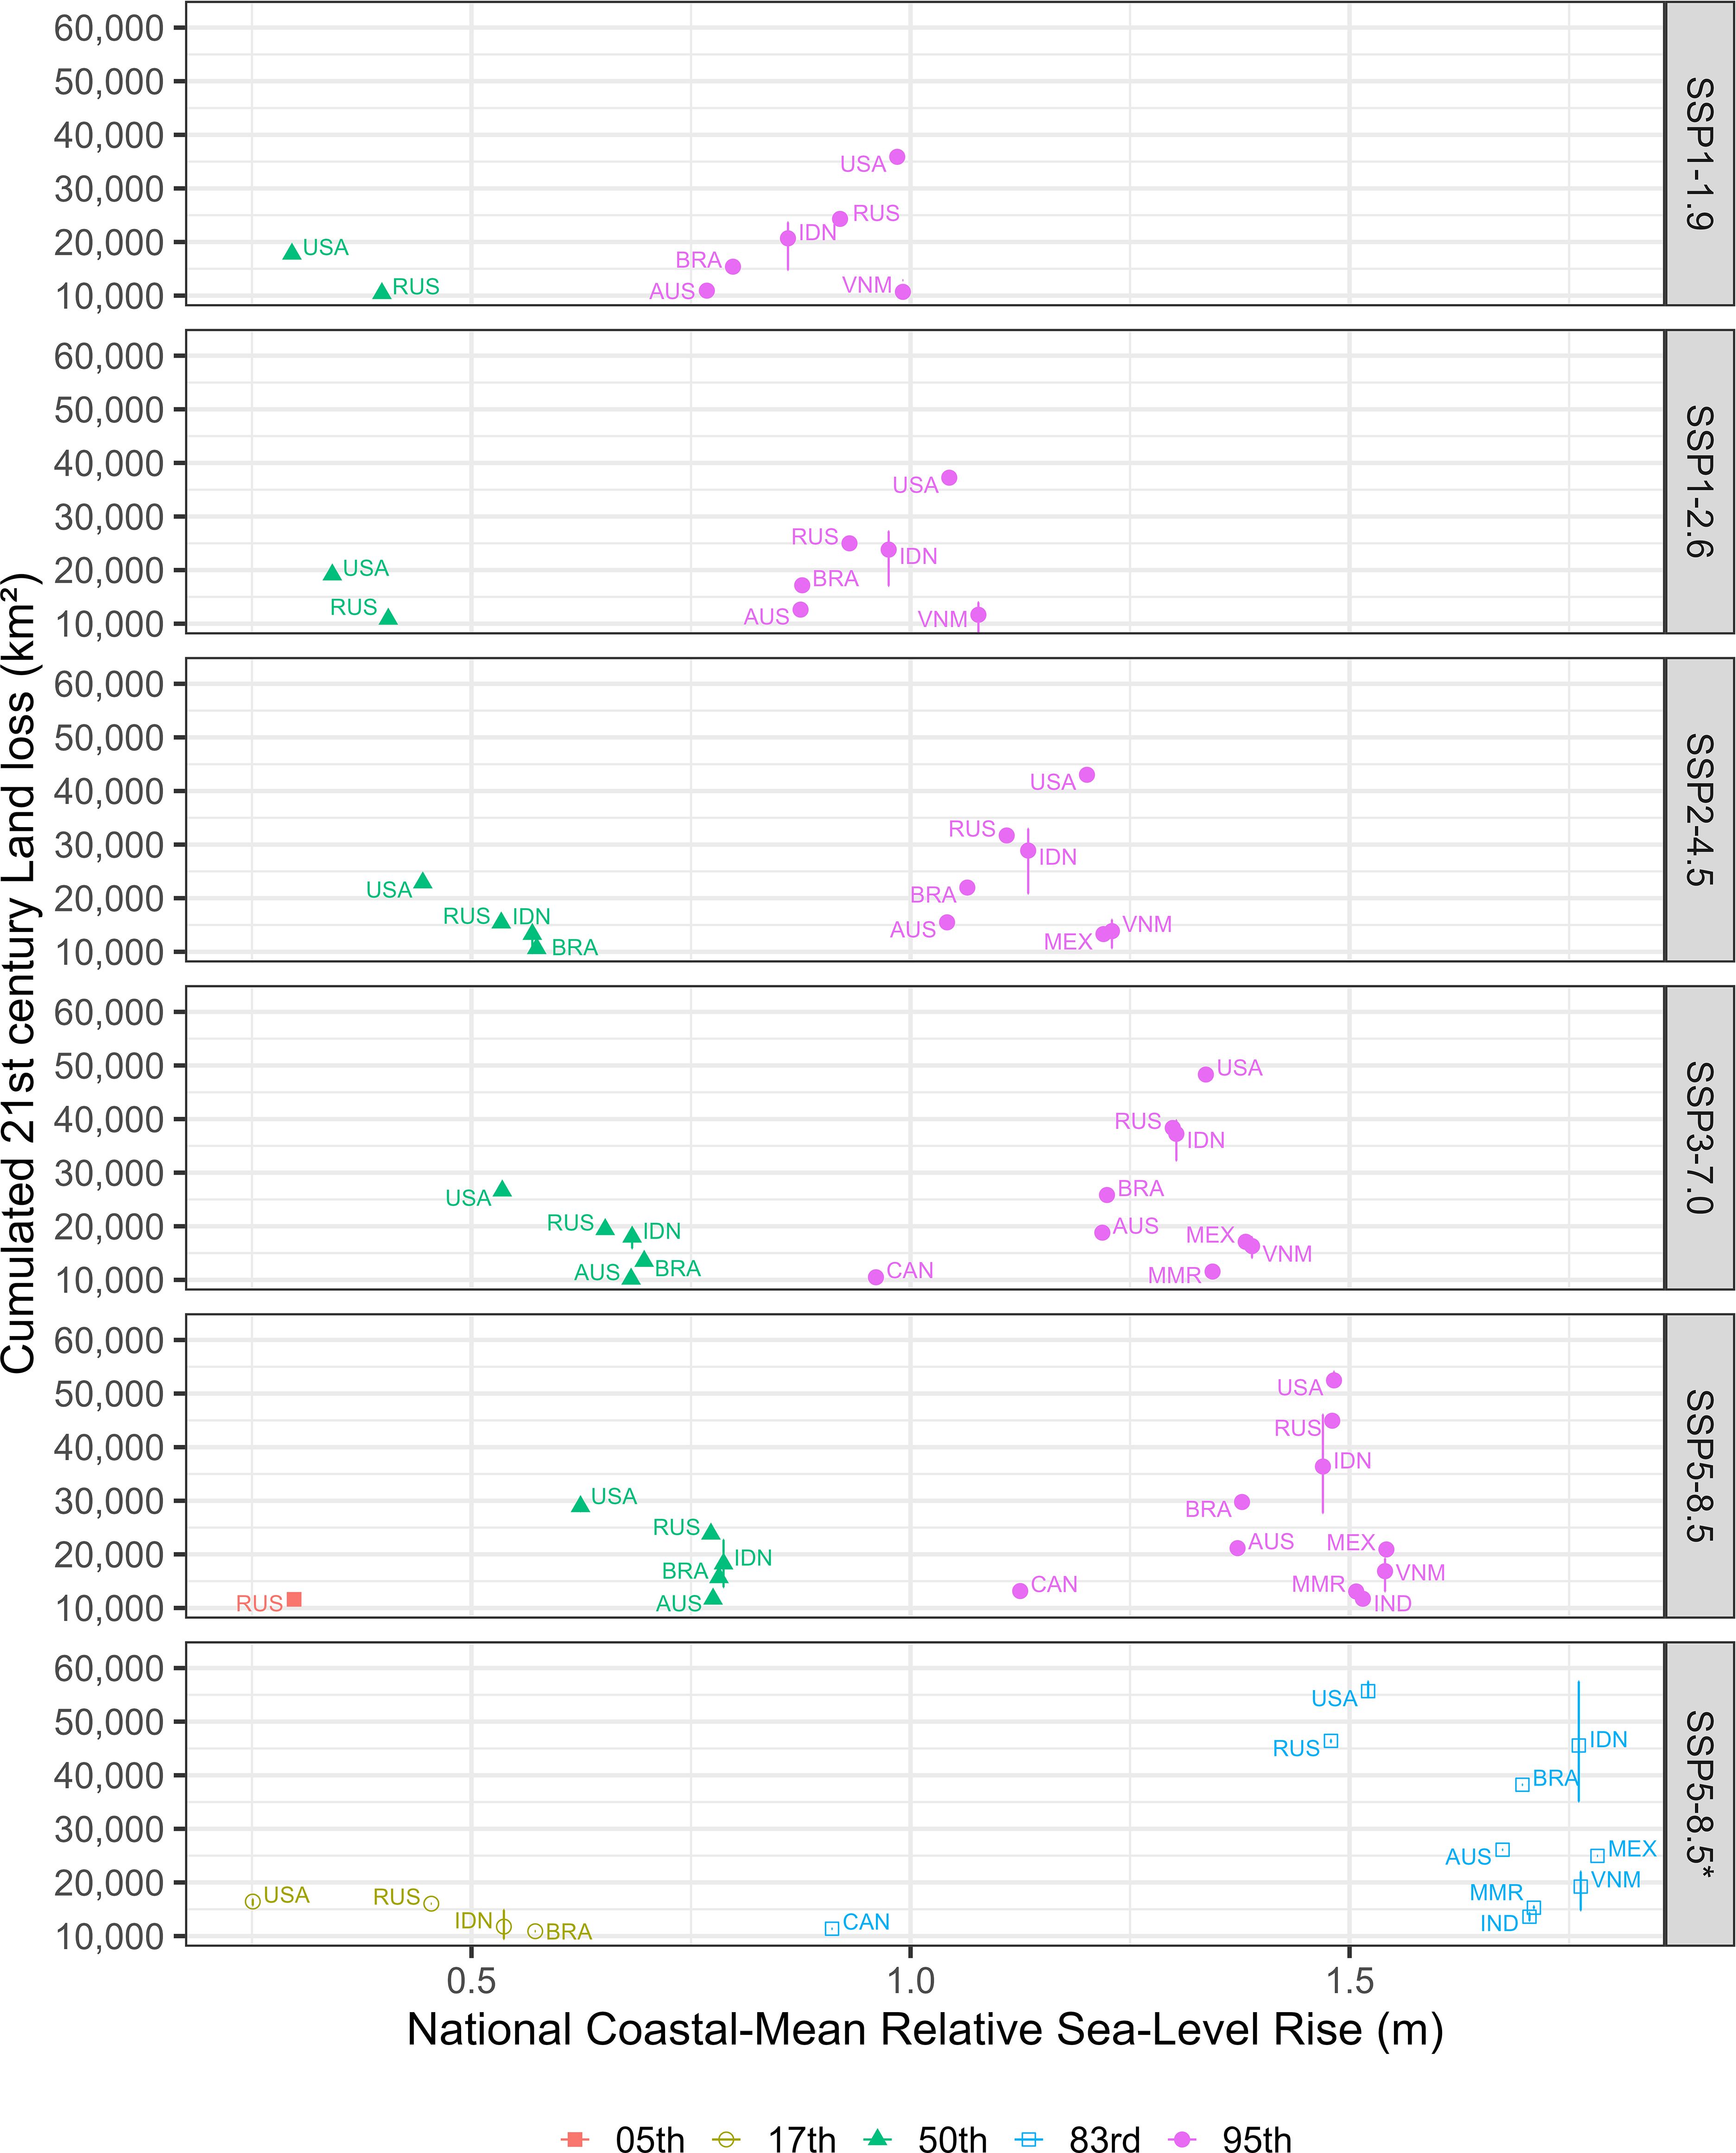
Figure 5. Countries with more than 10,000 km2 of land loss over the twenty-first century (2020 to 2100) under different SSP scenarios in 2100. Sea-level rise is expressed as coastal-mean relative sea level at the country level, as calculated in DIVA. Symbols represent mean values for different percentiles (red/square 5th percentile, green/triangle = 50th percentile, pink/circle = 95th percentile, yellow/hollow circle = 17th percentile, blue/hollow square = 83rd percentile), with error bars indicating the minimum and maximum values across different discount rates. Countries are denoted by their ISO 3166-1 alpha-3 codes: USA, United States; RUS, Russia; IDN, Indonesia; BRA, Brazil; AUS, Australia; VNM, Vietnam; MEX, Mexico; IND, India; MMR, Myanmar; CAN, Canada.
When considering the level of migration relative to the national population in 2020 for each SSP scenario, countries highly exposed to rising sea levels, particularly those with a large proportion of people living in low-lying coastal areas and Small Island Developing States, are the most affected (Table 1). Guyana exhibits the highest relative migration under all scenarios (Supplementary Figure S2). Similarly, when assessing land loss relative to total land surface, Small Islands are the most affected, with the Marshall Islands experiencing the greatest relative land loss (Table 2).
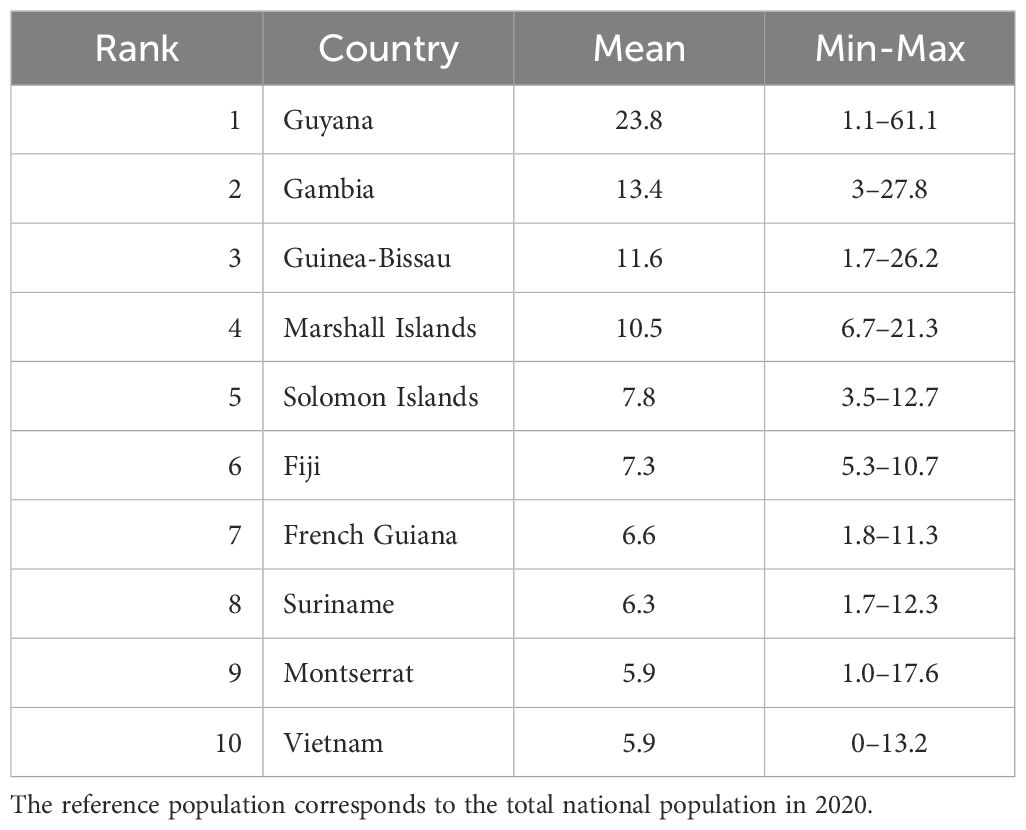
Table 1. Relative migration (%) over the twenty-first century (2020 to 2100) across all SSP scenarios and discount rates.
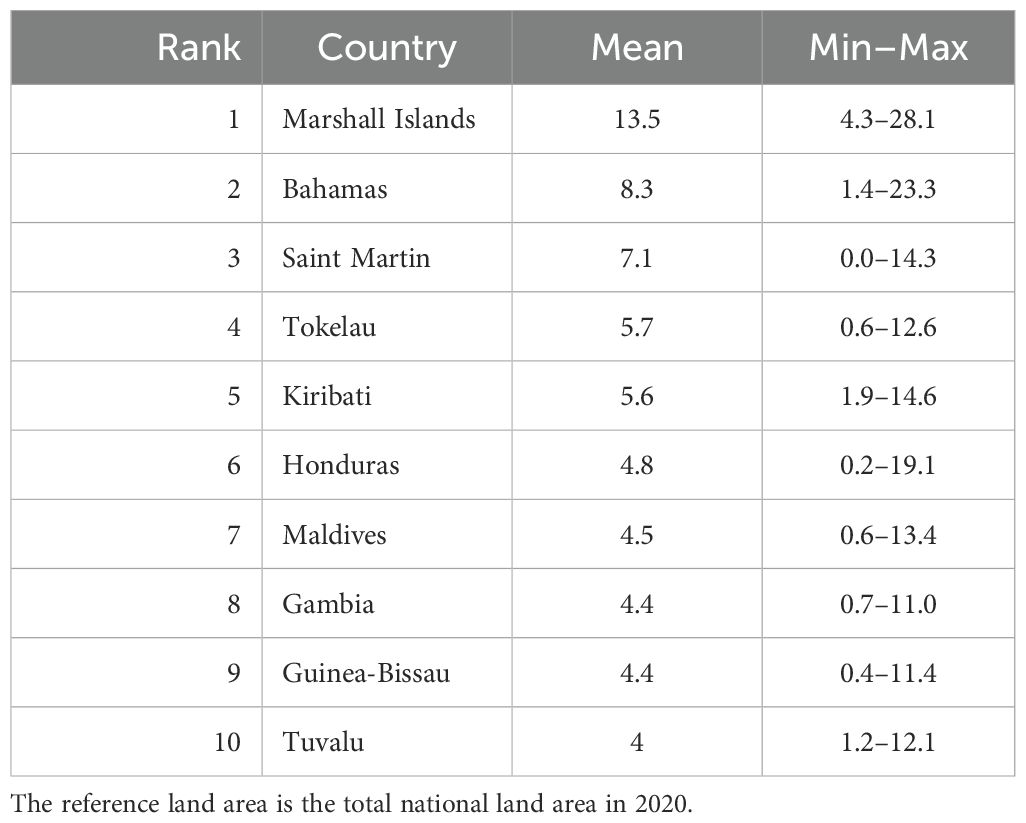
Table 2. Relative land loss (%) over the twenty-first century (2020 to 2100) across all SSP scenarios and discount rates.
Sea-level rise costs are modelled as the sum of three components: protection costs, migration costs, and flood damages (see Methods section). The total cost of SLR, considering a combination of protection and retreat strategies, is projected to range between 2,500 and 15,400 billion US$ across the AR6 IPCC scenarios over the twenty-first century (Figure 6). In general, little difference is observed between SSP1 and SSP2 regarding total costs (with mean values for the 50th percentiles of SSP1–1.9, SPP1–2.6, and SSP2–4.5 estimated at 4,500, 4,700 and 4,800 billion US$, respectively), and similar cost proportions. However, as SLR increases, total costs rise due to higher protection and migration costs, with migration costs becoming the dominant factor. Thus, migration costs become the largest contributor to total costs for the 95th percentile scenario in all SSPs, highlighting the dependence on SLR. However, under the SSP3–7.0 scenario, both the total cost and its proportion are lower (4,000 billion US$ mean at the 50th percentile) due to the scenario’s lower economic growth, which results in reduced asset values and, consequently, lower damages compared to other scenarios. This underscores the dependence of risks/costs not only on SLR scenarios but also on socioeconomic factors. SSP5–8.5 scenarios represent the highest total SLR cost: with a mean value of 8,000 billion US$ (medium confidence) for the 50th percentile and up to 13,100 billion US$ for the 83rd percentile (low confidence), driven by the greatest rise in sea levels occurring in a wealthier world (Figure 6; Supplementary Figure S1). Protection costs constitute the largest share of total costs, particularly for smaller increases in sea levels (5th and 50th percentiles) across all scenarios except SSP5–8.5 medium and low confidence (SSP5–8.5*). Migration costs represent the largest under higher SLR (95th percentile and SSP5–8.5 scenarios).
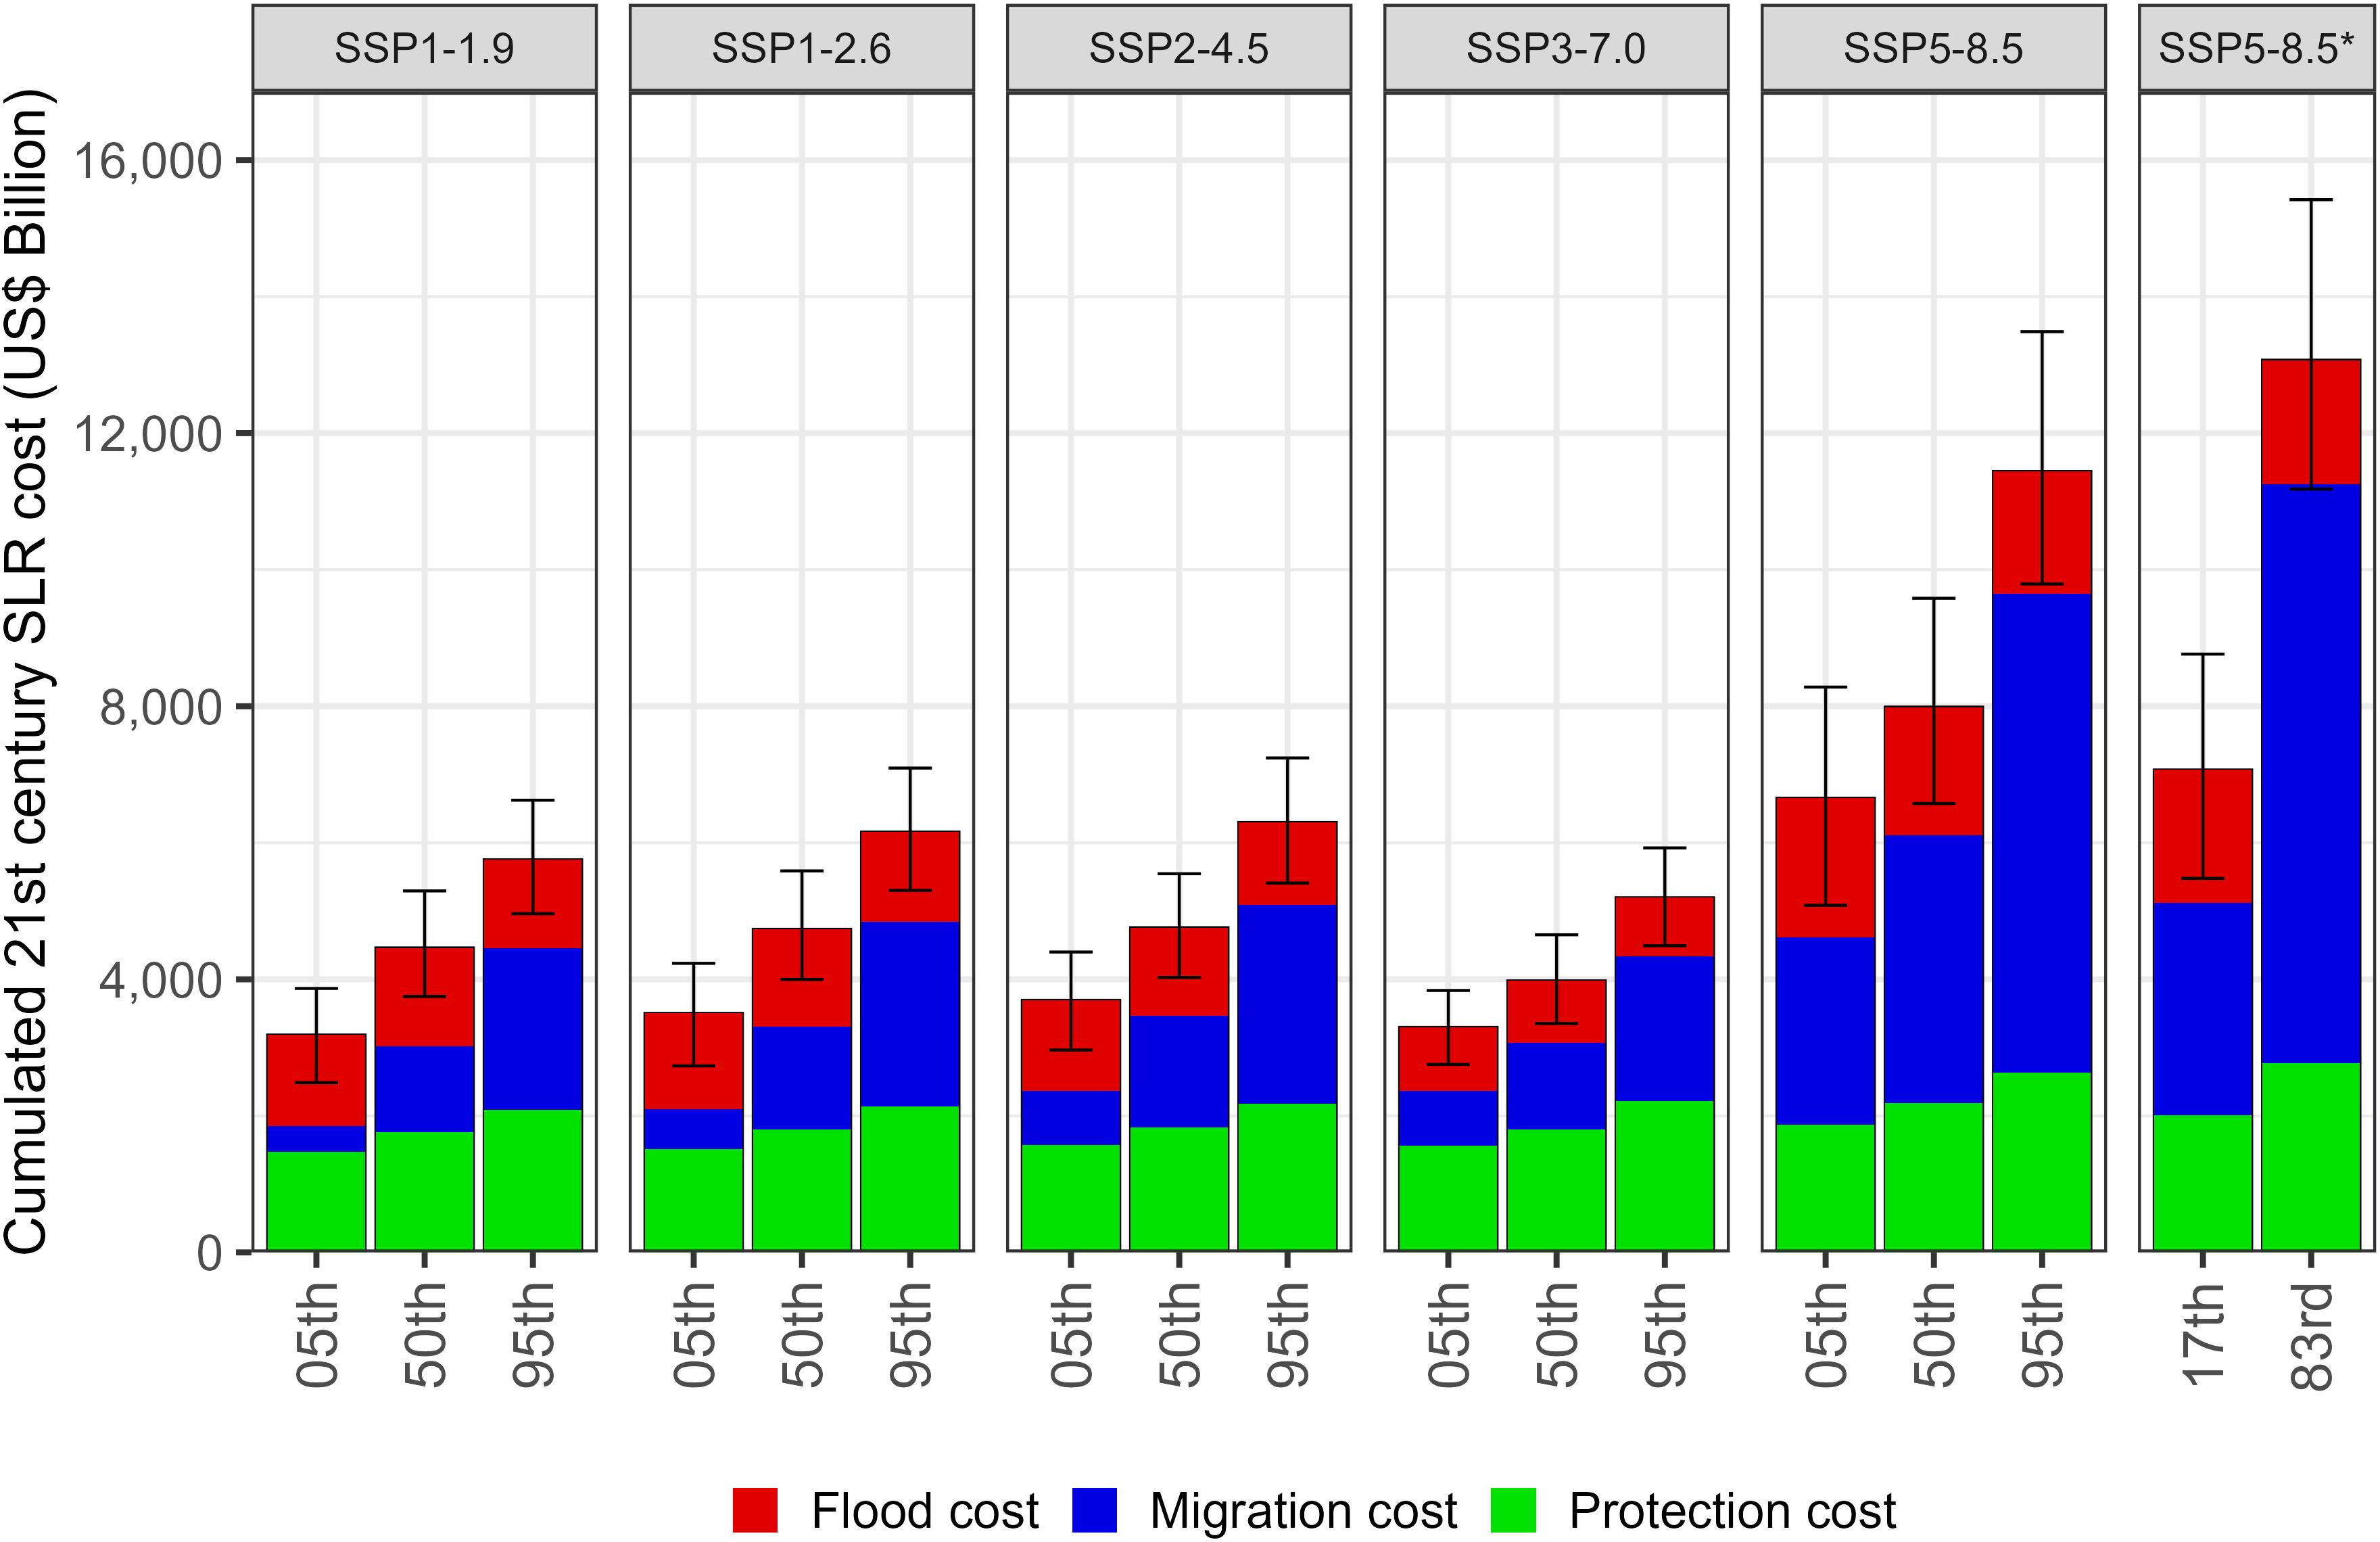
Figure 6. Cumulative total costs of SLR for all SSP scenarios and their components from 2020 to 2100. Bars represent mean values for all discount rates, and error bars indicate the minimum and maximum values.
The top 10 countries with the highest total cost of SLR under the SSP1–1.9 50th percentile scenario are China, India, Indonesia, the USA, Vietnam, Nigeria, the UK, Japan, Germany, and Bangladesh (Figure 7). Under the SSP3–7.0 scenario, the highest total SLR costs are observed in China, the USA, India, Indonesia, Vietnam, Japan, Nigeria, the UK, the Netherlands, and Germany. While protection is the predominant component of SLR costs in Europe and some parts of Asia, such as China and Japan—due to high urbanisation and stringent protection standards—migration costs are the most dominant component in southern countries. Under a high-emission scenario (SSP5–8.5* 83rd percentile), the total cost of SLR increases significantly for all countries, with migration costs being particularly high in southern countries and the USA (Figure 7).
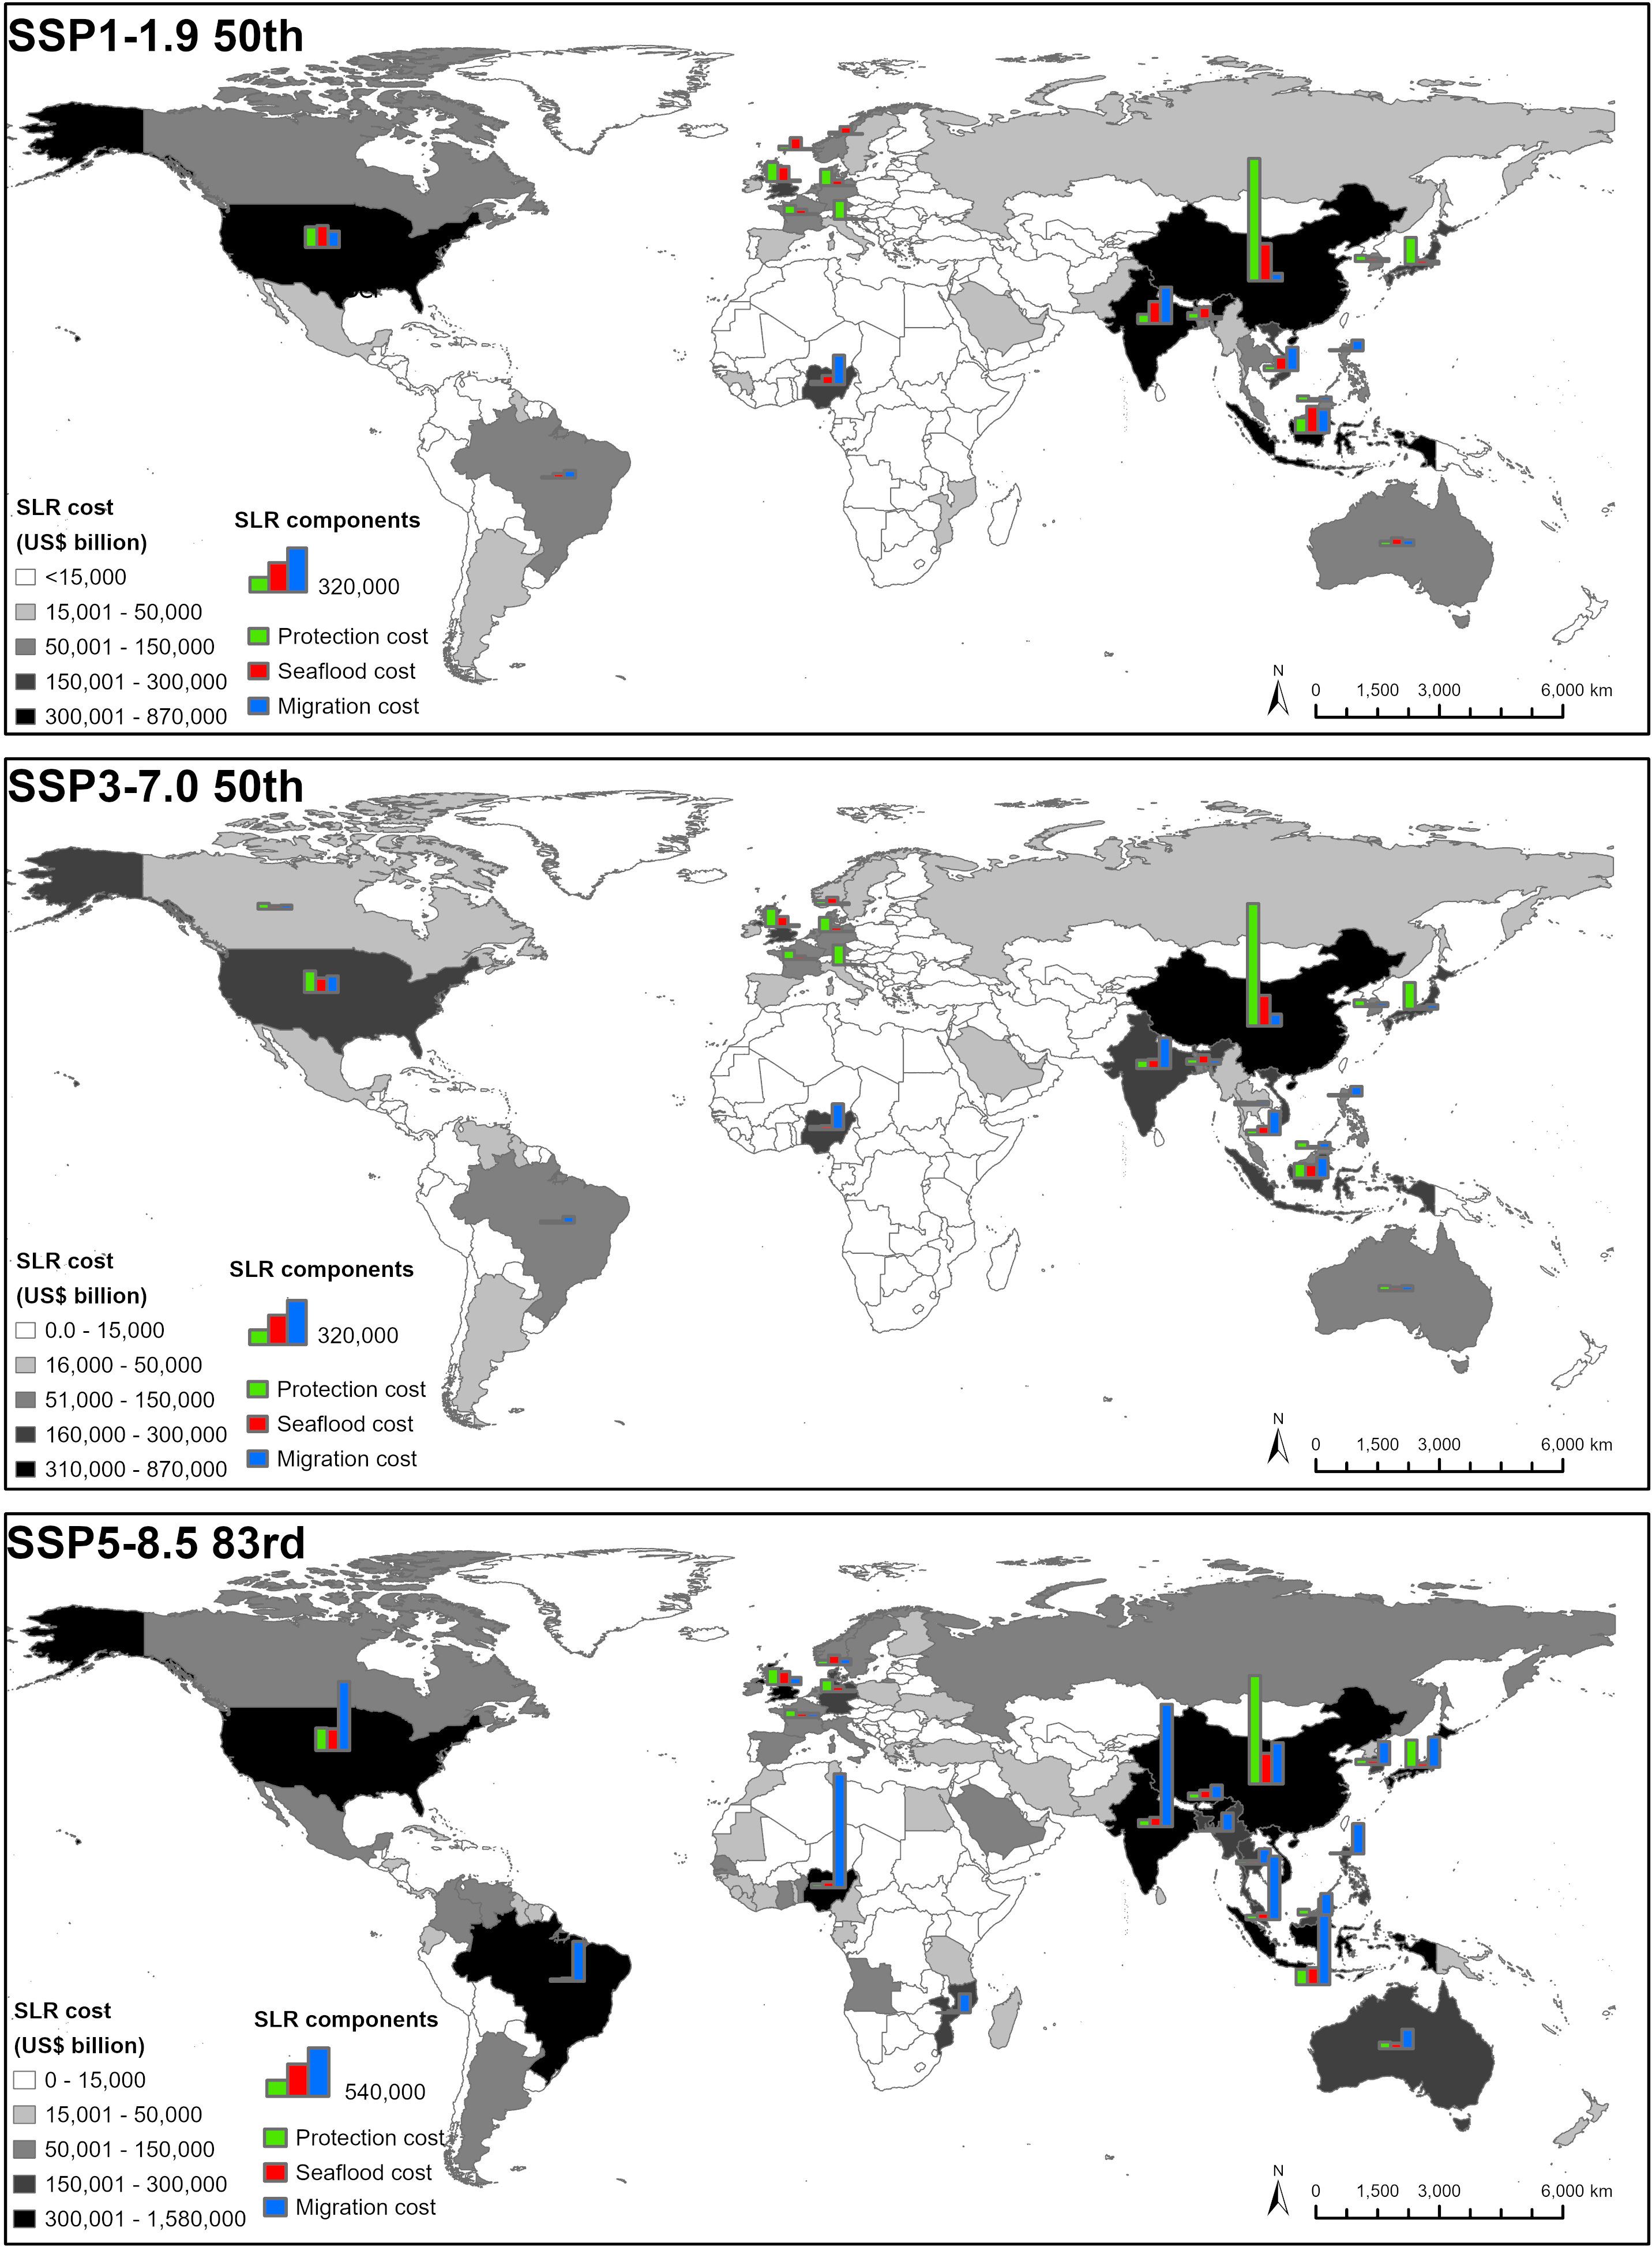
Figure 7. SLR cost and their components for all countries under three selected SSP scenarios (SSP1–1.9/SSP3–7.0/SSP5–8.5*) from 2020 to 2100. Bar plots represent the share of each SLR cost component for the top 20 countries with the highest costs under each scenario.
Under the cost–benefit analysis, 2.8% of the world’s coastline has a positive NPV for protection across all scenarios (SSPs and discount rates). This protected coastline encompasses 78.5% of the population residing in coastal floodplains (below the 1-in-100-year flood frequency) and 90.7% of the assets, as these areas tend to be wealthier (Table 3). In contrast, 91.9% of the coastline is not protected under any scenario, making retreat the most economically efficient option, affecting only 7.4% of the global coastal population. When considering individual SSP scenarios, the length of protected coastline decreases slightly with increasing SLR (Figure 8) and increases with GDP/capita. Under SSP5 scenarios (both medium and low confidence), the highest percentage of global coastline protected is 5.6% (SSP5–8.5 5th and SSP5–8.5* 17th), based on the mean value of the three discount rates. This reflects the socioeconomic conditions and increased wealth associated with the SSP5 scenario compared to the other scenarios (Supplementary Figure S1). However, as SLR increases, the proportion of coastline designated for protection declines, while the extent of retreat expands. This shift occurs because retreat, leading to migration, becomes the most economically viable adaptation strategy to SLR (Figure 8).
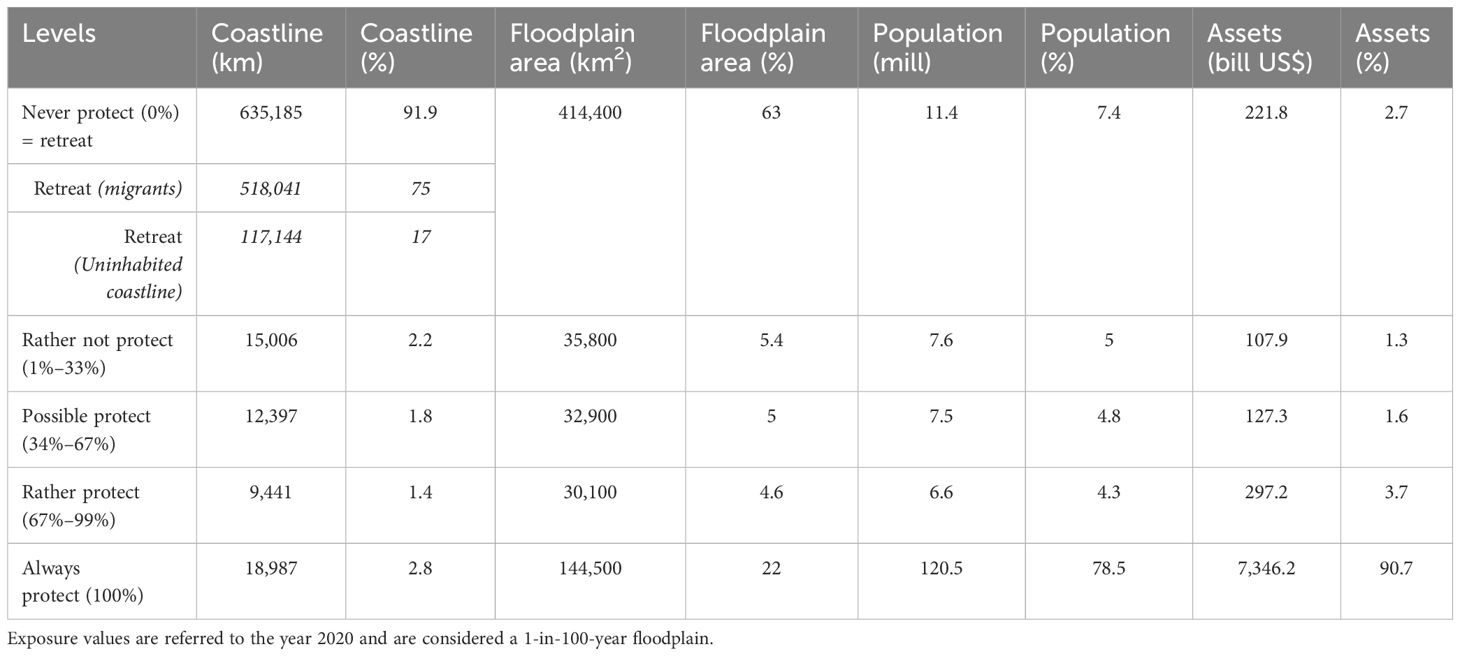
Table 3. Proportion of coastline and exposure for different levels of protection under all scenarios (SSP and discount rates) from 2020 to 2100.
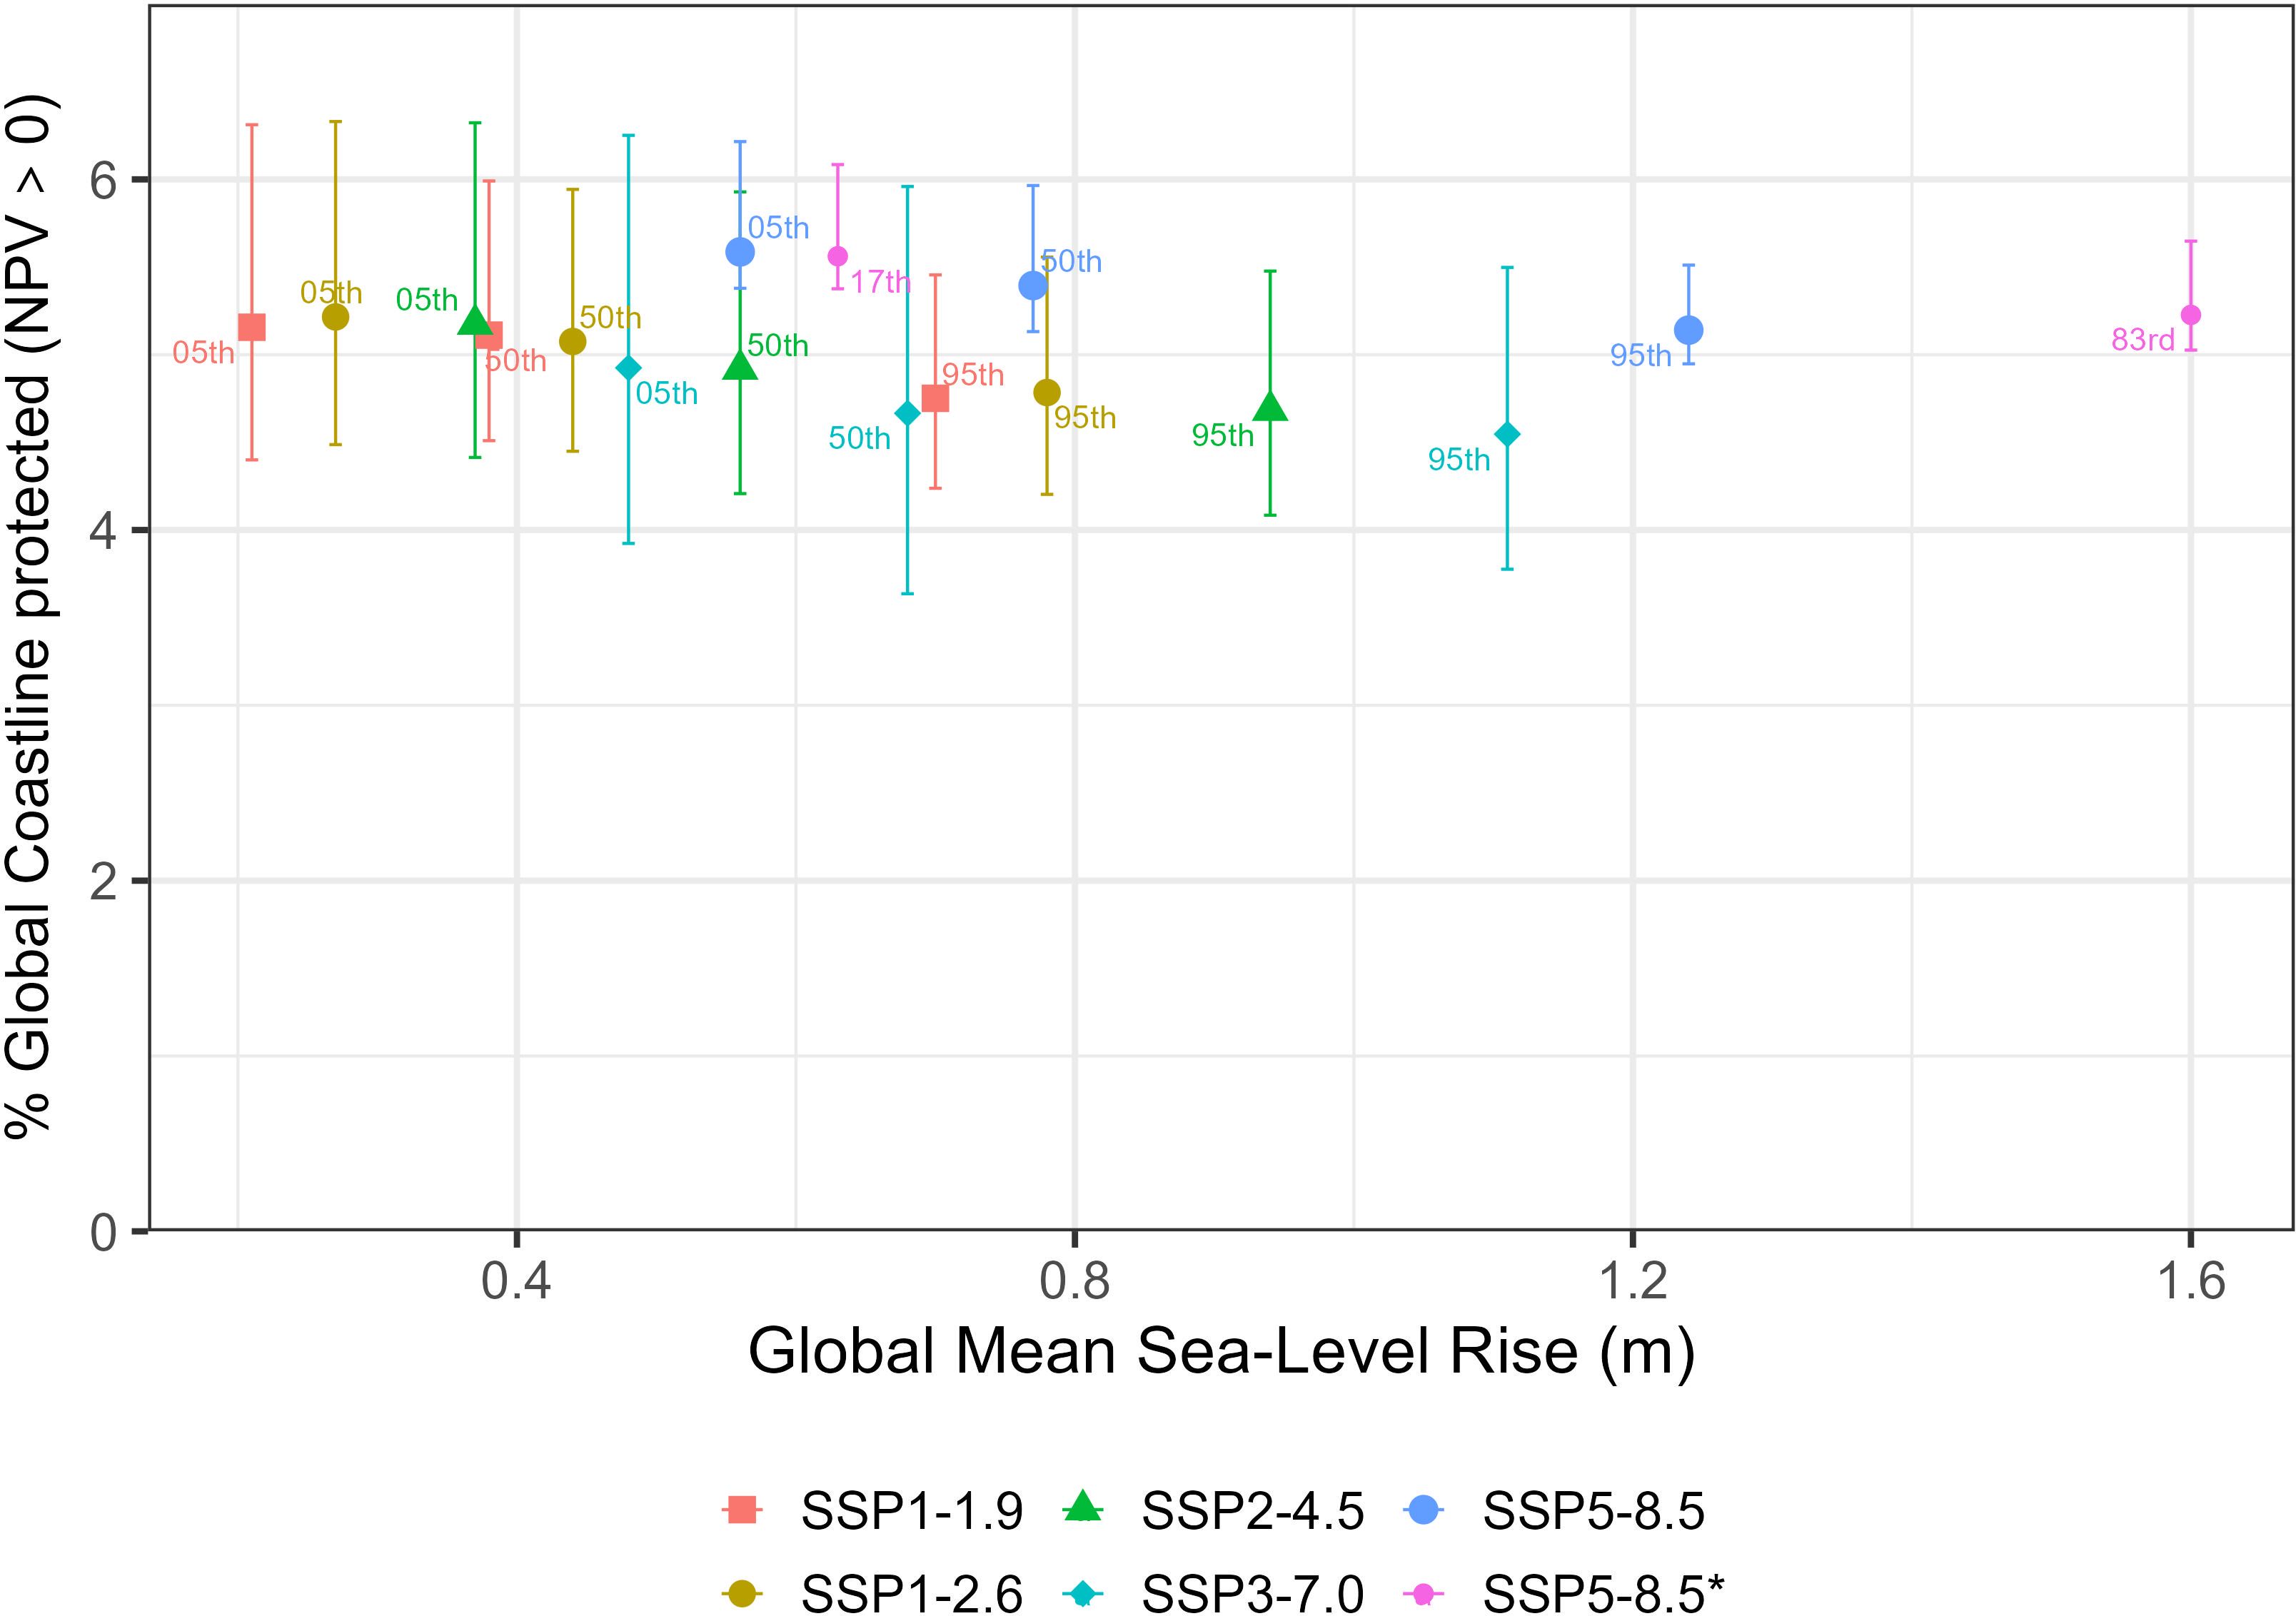
Figure 8. Percentage of the global coastline with robust protection responses (NVP > 0) under different SSP scenarios, shown as mean values considering three discount rates. Error bars represent the minimum and maximum values across different discount rates.
Most of the countries where protection is widespread are located in Europe and Asia (Figure 9; Supplementary Table S5). Countries or territories with very short coastlines that consistently show robust decisions to protect in all cases include Belgium, Bermuda, Gibraltar, Iraq, Macau, and Monaco (Supplementary Table S5). Countries or territories with more than 50% of the coastline designated for protection under all scenarios include Singapore, Hong Kong, the Netherlands, and Bahrain, while those with 30%–50% protected coastlines include Brunei Darussalam, China, Lebanon, Bangladesh, Slovenia, and Qatar (Figure 9; Supplementary Table S5). For the vast majority of the global coastline, retreat remains the most optimal adaptation option under all scenarios (Figure 9, red contours).
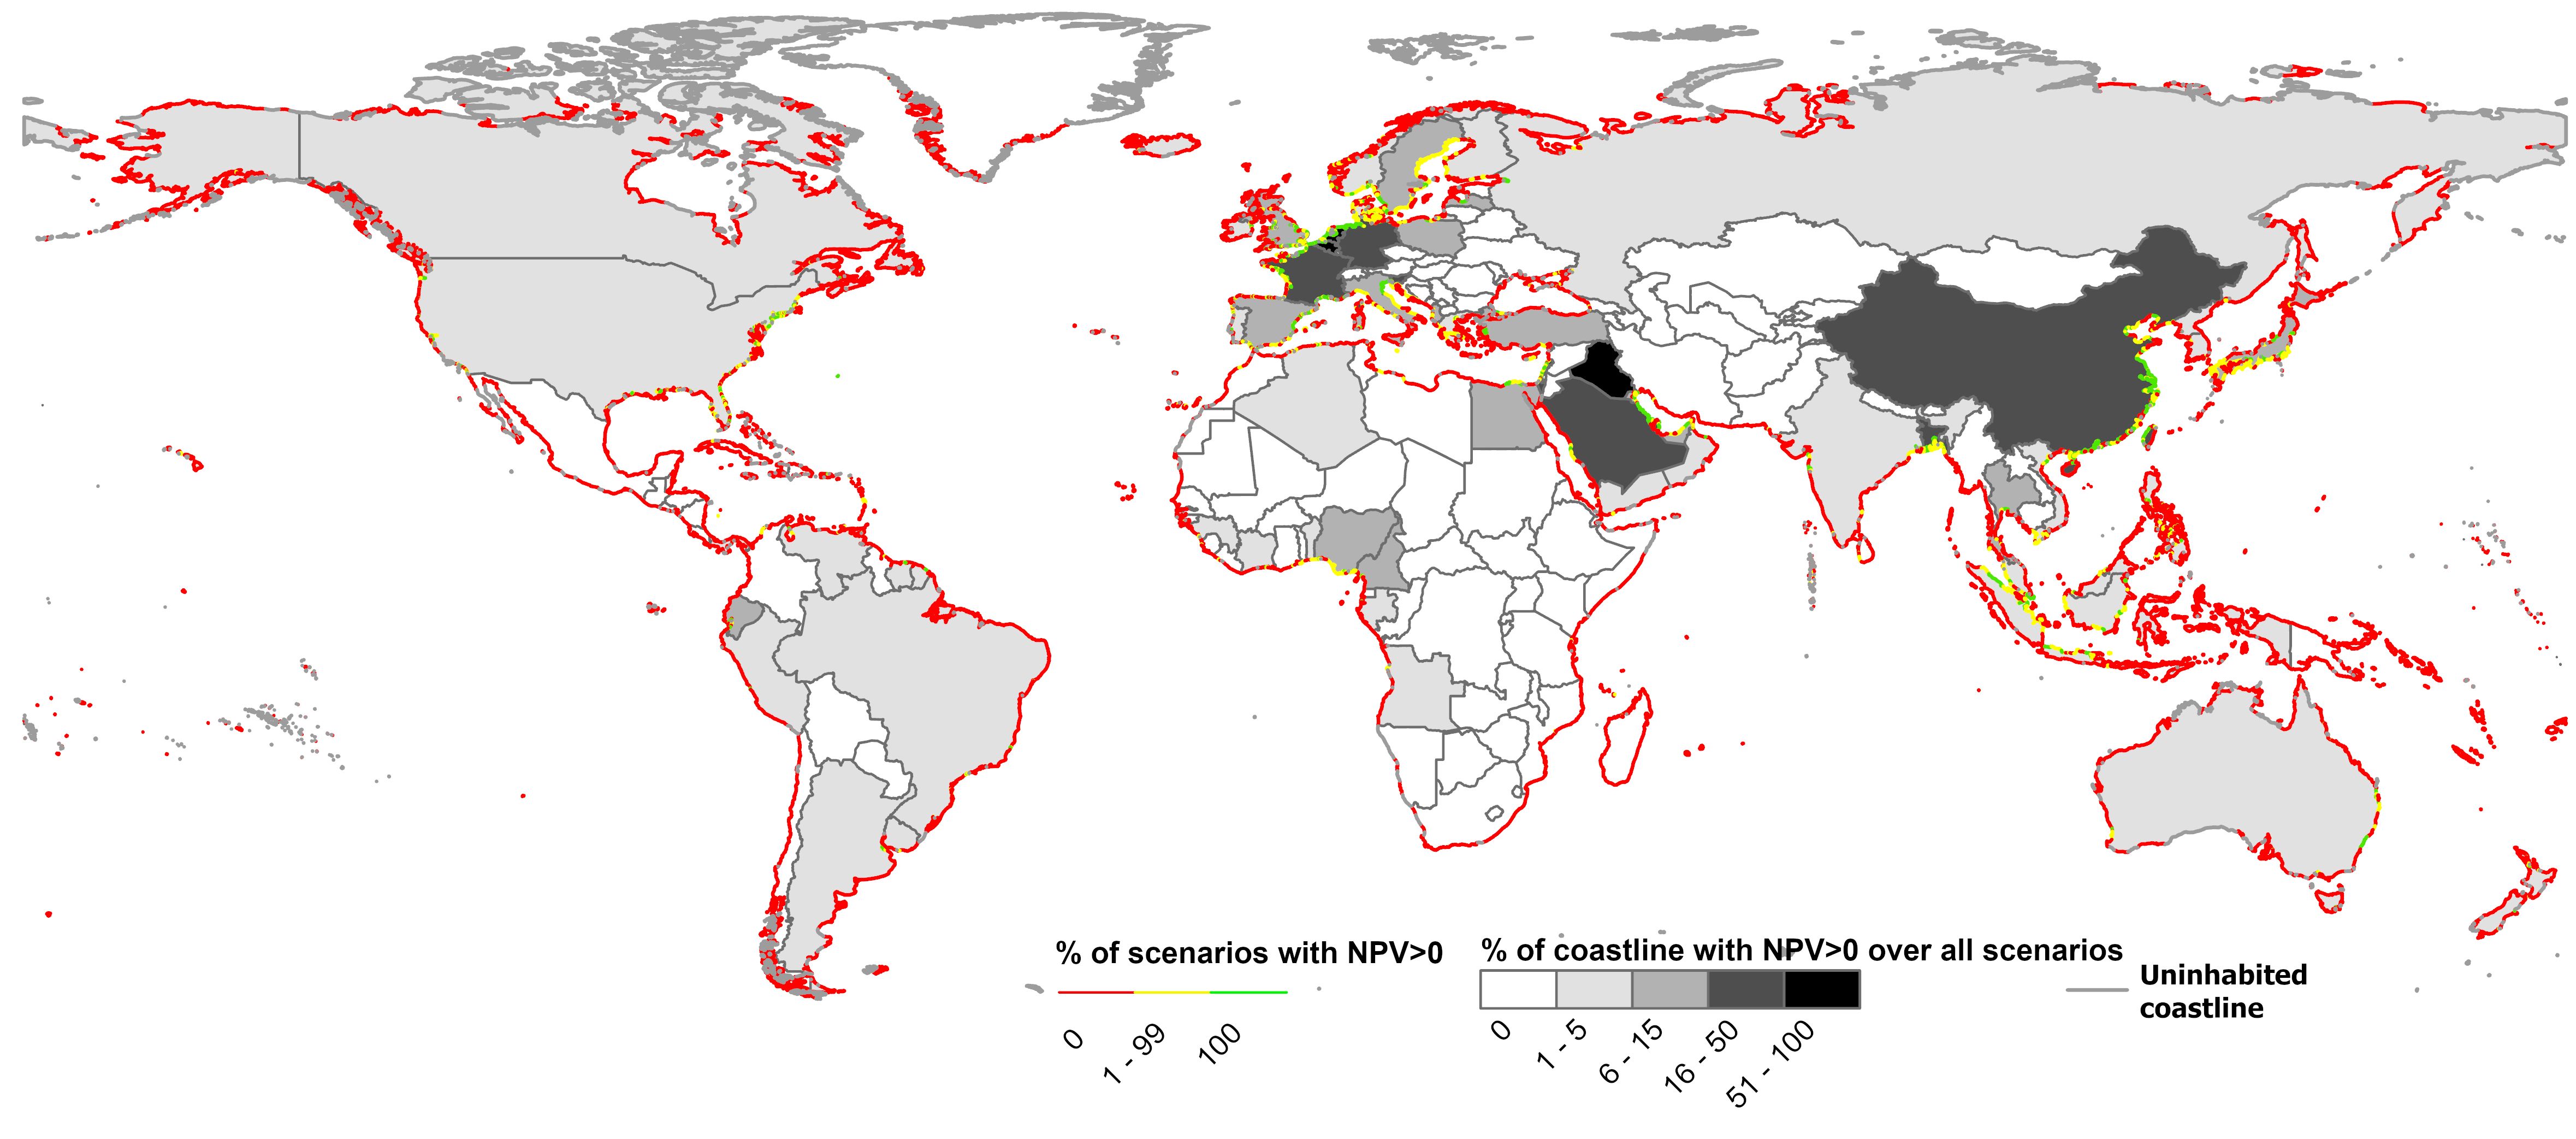
Figure 9. Net present value (NPV) for protection decisions. Coloured contour borders indicate the percentage of total scenarios (SSP and discount rates, totalling 51 scenarios) that show robust protection decisions (NPV > 0). Migration due to retreat occurs in red and yellow contours, while green contours represent fully protected areas. Grey contours denote unpopulated areas where retreat happens without migration. The greyscale shading of countries represents the percentage of coastline at the county level with NPV > 0 across all scenarios.
Global assessments of migration due to SLR often overestimate their numbers (e.g., Milliman et al., 1989; Myers, 2002), as most studies consider only exposure to SLR and do not account for adaptation options that reduce migration (Myers, 2002; Nicholls et al., 2011; Lincke and Hinkel, 2018, 2021). Here, we have estimated the number of people migrating on a global scale while considering coastal retreat, which leads to migration when it becomes the most robust economic adaptation option for coastal populations impacted by SLR, rather than protection. We have adopted a local CBA framework, one of the most common methods governments use to estimate coastal damages and determine whether to invest in new coastal defence infrastructure (e.g., Penning-Rowsell et al., 2014). One of the limitations of the CBA is the discount rates considered, as they reflect various societal perspectives, uncertainties, and time preferences related to the costs and benefits of a project (Goulder and Williams, 2012; Hinkel et al., 2018). To address this, we have included three discount rates (0%, 3% and 6%), presenting the results with mean, minimum, and maximum values to account for this uncertainty. There are multiple types of protection that prevent or reduce flooding, such as natural (e.g., dunes) and artificial (e.g., dikes) approaches. Although there is a growing interest in nature-based solutions (NbS) due to their reduced impacts and potential benefits for the natural environment, we have considered only artificial/hard protection. This is one of the most widely employed adaptation options, providing the most predictable levels of safety against coastal extremes and SLR (Oppenheimer et al., 2019; Vousdoukas et al., 2020), as well as a generally well-understood form of protection. Other potential costs, such as ecosystem loss from coastal squeeze due to increased coastal protection against flooding, are not included in the analysis. Moreover, coastal flooding due to SLR is considered to have the largest potential human impact, including coastal migration, and we have the data and methods to conduct a global analysis. Other SLR impacts, such as erosion, saltwater intrusion, and degradation of coastal resources (Chen and Mueller, 2018; van de Wal et al., 2024), have not been included in this analysis, as they are more complex hazards for which global data and models are not available. Furthermore, their impacts are expected to be much smaller than those of flooding. This analysis considers coastal flooding due to extreme water levels produced by the combination of tides, surges, and a rising sea level, as these factors are well understood and available homogeneously at the global scale. Additional coastal flooding could occur due to compound events (van de Wal et al., 2024; Wu et al., 2025), but suitable global datasets for analysing this are not currently available.
The approach used here generalises assumptions about migration, such as local decision-making, the social context, and environmental, cultural, and livelihood factors that cannot be fully captured within a CBA (Hinkel et al., 2018). While we recognise that these are complex and localised phenomena, adopting assumptions for adaptation and future socioeconomic scenarios, this framework provides an informative representation of the potential number of displaced people, with calculations performed at a relatively detailed scale (DIVA segments averaging ~ 60 km in length) and integrated and presented here at global, national, and subnational levels. Under the SLR scenarios presented in the IPCC AR6 report (Fox-Kemper et al., 2021), with global-mean SLR projections between 0.21 and 1.6 m, we find that between 4 and 72 million people could be displaced during this century. By considering protection and retreat in our assessment, we have refined the estimated number of people migrating compared to results obtained when no coastal protection assumptions are made. If no protection was considered, the number of people assumed to migrate by 2100 would increase significantly, totalling between 49 and 250 million (population below 1-in-1-year return period floodplain) (Figure 10). Significant migration is projected even under the lowest SSP scenarios, highlighting the benefits of protection across the entire SLR scenario range. Depending on the SSP scenario, only 11% to 32% of the total potential migrants would migrate if CBA protection is implemented as considered here (Figure 10).
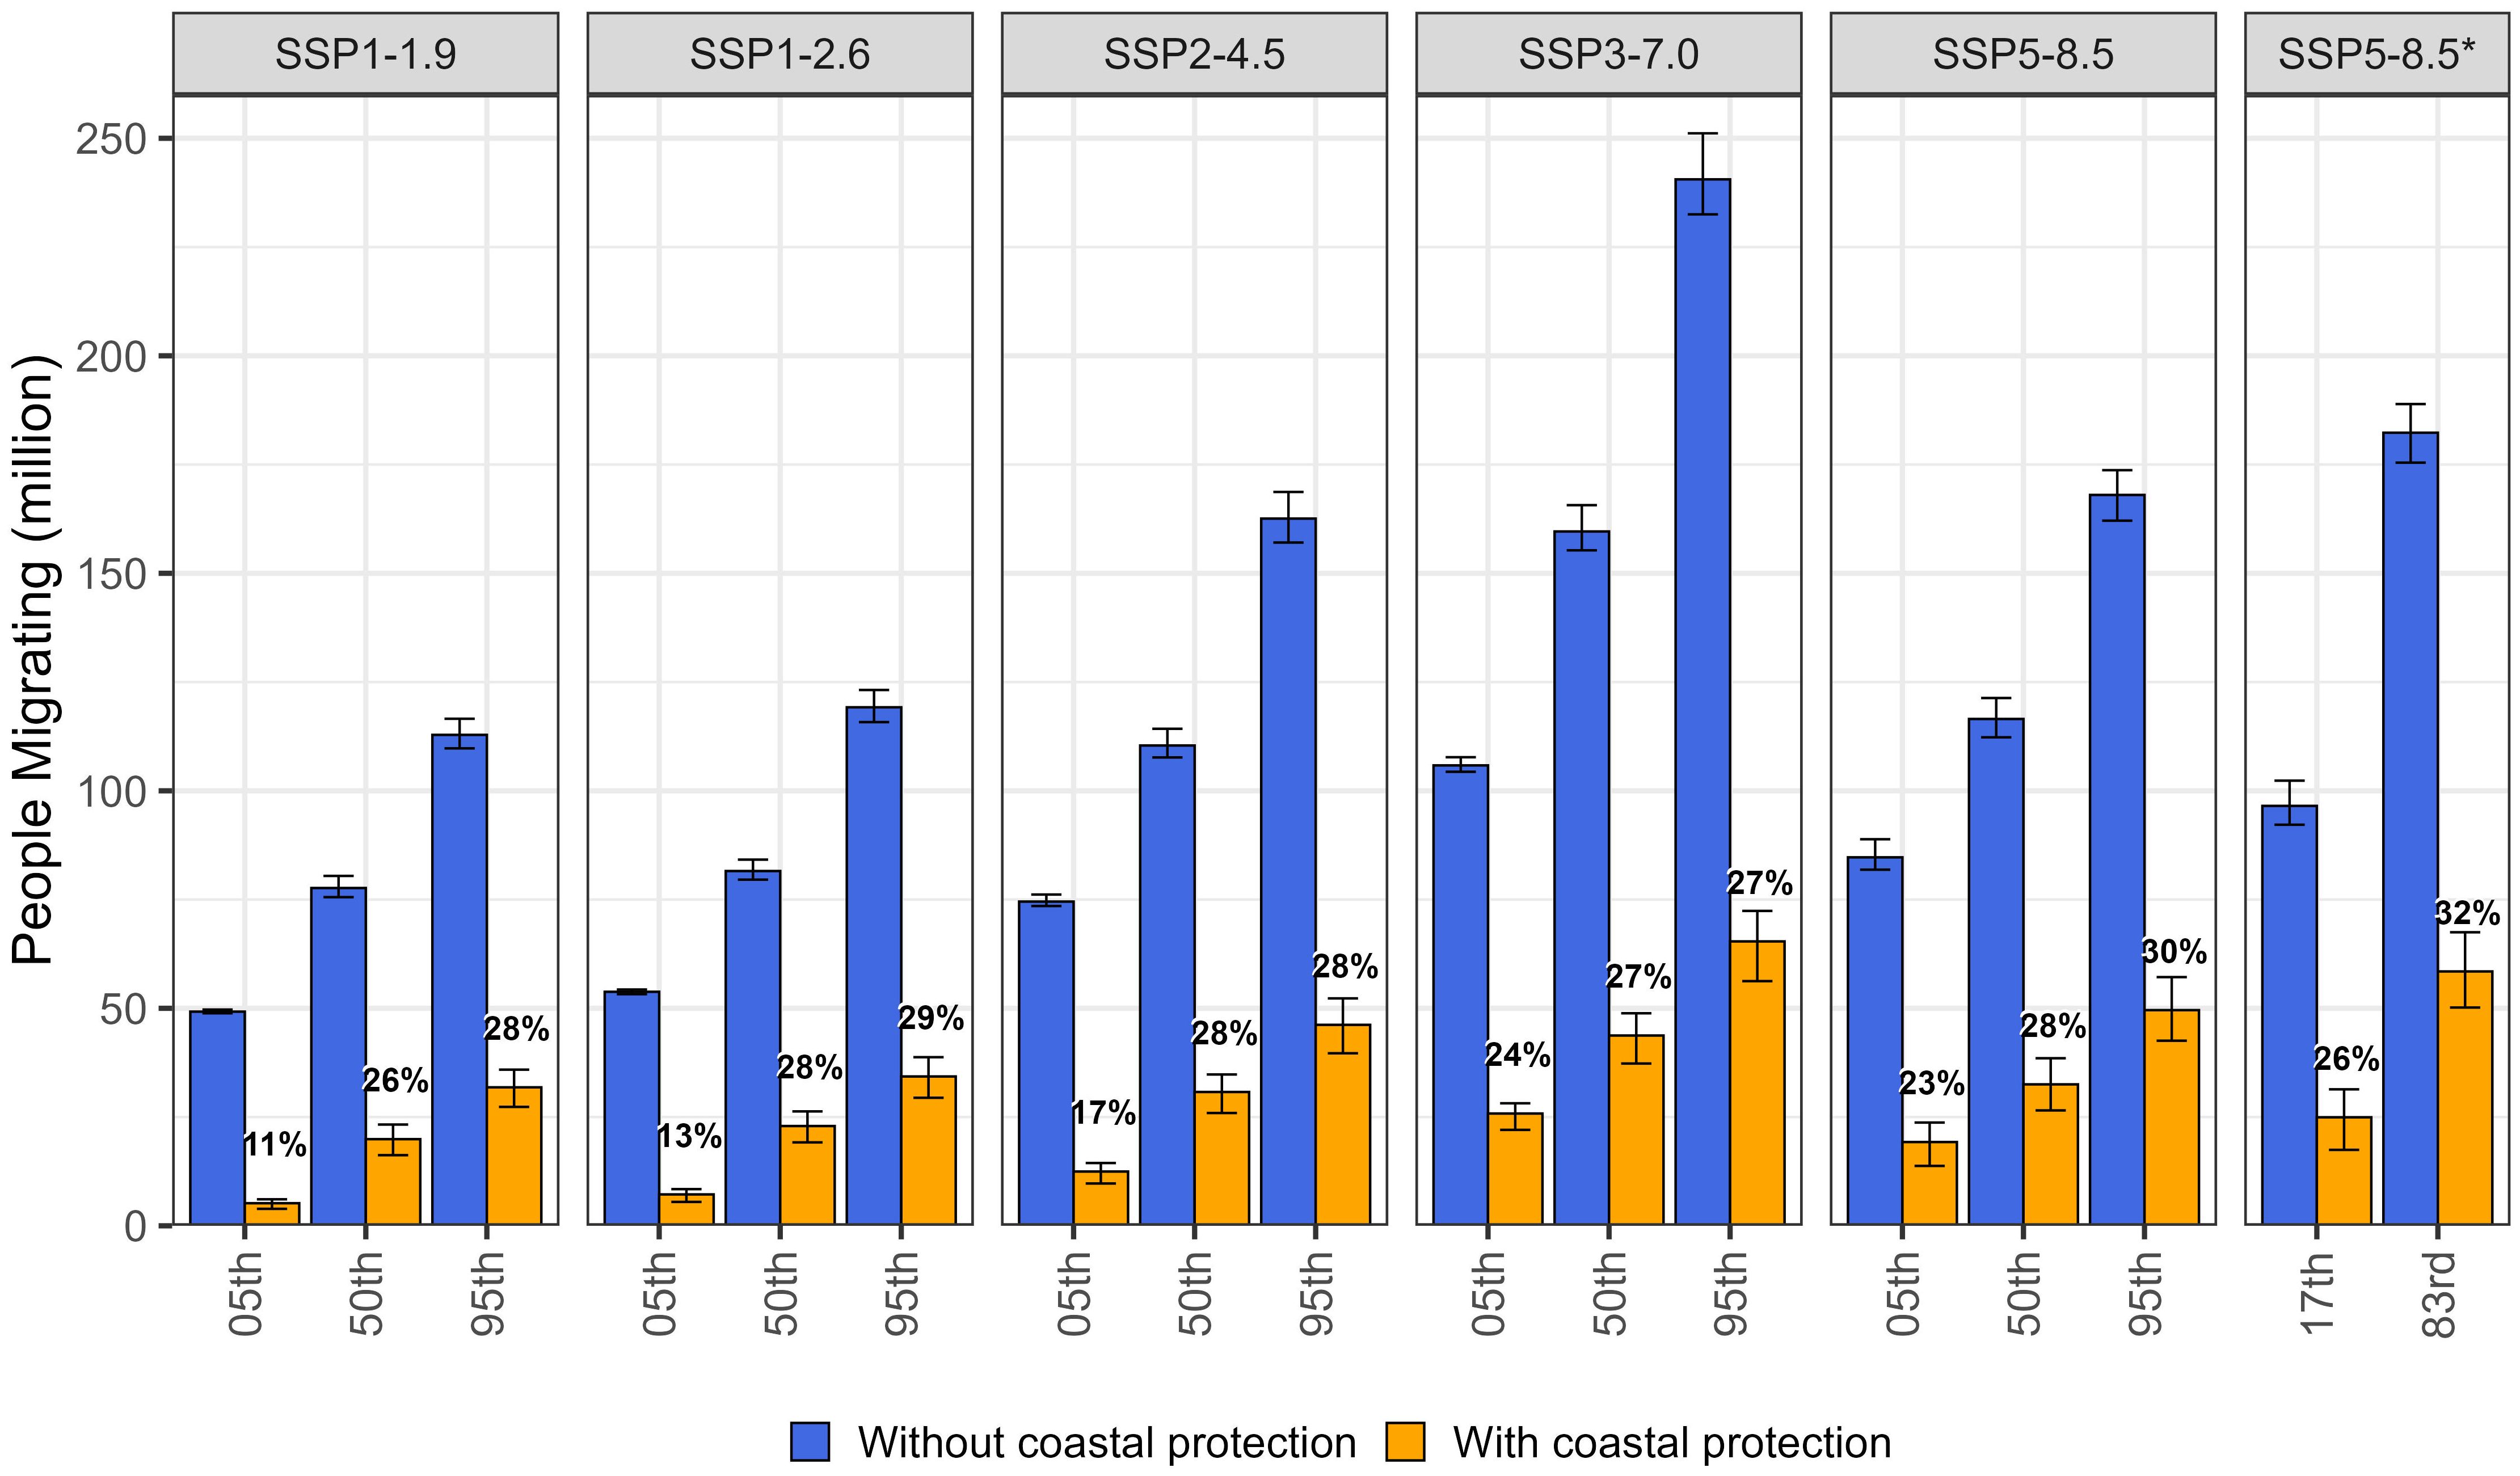
Figure 10. Cumulative number of people migrating under SSP scenarios by 2100, considering cost–benefit-based protection (this study, orange bars) and no protection (maximum migration, blue bars). Numbers indicate the percentage of migrants relative to the total number of potential migrants (without protection).
Here, we have assessed the implications of the new IPCC AR6 SLR scenarios, which considered, for the first time, a very strong mitigation scenario, SSP1-1.9, in line with the Paris Agreement goals. Our results show that even under this scenario, where SLR is relatively low (0.21–0.70 m), SLR will still have significant impacts on coastal areas globally over the twenty-first century, with a minimum of 4 million to a maximum of 36 million migrants and a total cost between 3.3 and 5.8 × 10³ billion US$. This supports earlier analyses and shows that, in coastal areas, the best climate policy is a combination of strong mitigation and adaptation to the residual risks (Nicholls et al., 2018; Lincke et al., 2022; Le Cozannet et al., 2023).
Importantly, the magnitude of global coastal migration is influenced by the SLR scenarios and the socioeconomic scenarios. The effect of future socioeconomic development influences flood risks in terms of population exposure, their vulnerability to SLR, and their ability to provide protection (Nicholls, 2004; Dada et al., 2023), as reflected here by the total number of migrants. Coastal population projections for the different scenarios are markedly affected by global regions, with higher increases under the SSP3–7.0 scenario for African countries, Latin America, and Asia, whereas under SSP5–8.5, higher increases are observed in North America, Oceania, and Europe (Merkens et al., 2016; Reimann et al., 2023b). This influences the number of migrants.
It is also worth noting that while 2.8% of the world’s coastline is protected under all SSP scenarios, this protects 78% of the population and 91% of assets in coastal areas. This shows how coastal residents and the associated economy are strongly concentrated in a few areas. Hence, a relatively small amount of protection, in terms of length at a global scale, can protect most coastal residents (Lincke and Hinkel, 2018). This analysis shows that during the twenty-first century, most coastal residents can plausibly be protected from SLR, while simultaneously, the bulk of the world’s coast can be allowed to retreat.
We also acknowledge that there are uncertainties. For example, we use protection costs from Nicholls et al. (2019). These draw on country cost factors from Dronkers et al. (1990) and Hoozemans et al. (1993), informed by more recent cost estimates from the Netherlands. These estimates are still highly uncertain, and more empirical research is needed to improve unit costs and understand different country cost factors. Migration has been costed at three times the local GDP per capita per migrant. This is supported by sensitivity analyses and literature reviews of local cases where retreats have taken place (Lincke and Hinkel, 2021). These can be seen as the minimum cost of migration, mainly representing the value of assets lost per person. However, more empirical justification for these costs would improve future assessments. Predicting migration is sensitive to the assumed migration cost and protection cost. While the number used is considered a robust estimate within the range of other studies (e.g., Lincke and Hinkel, 2021; Nicholls et al., 2019; Tiggeloven et al., 2020; Vousdoukas et al., 2020), if migration costs rose and protection costs fell, more people would migrate, and vice versa.
There are also limitations associated with the use of global datasets (Hinkel et al., 2021; Li et al., 2023), such as the DEM, as vertical accuracy remains a major source of uncertainty (Gesch, 2018), particularly for small islands and territories (McMichael et al., 2020). Here, the MERIT DEM, available at a horizontal resolution of 3 arcsec (~ 90 m at the equator) and a vertical resolution of 1 m (i.e., decimal values) has been used. When analysing different population data, accuracy issues also seem to arise, particularly in small-scale assessments, due to variations in spatial population distributions (Li et al., 2023). However, while known errors can affect absolute impact numbers, the relative impacts in terms of exposure and risks are much less sensitive to the DEM and population data used, as shown in other coastal flooding and adaptation assessments (e.g., Kirezci et al., 2023; Lincke et al., 2022; Reimann et al., 2023a; Wolff et al., 2023).
Comparing these results directly with similar studies at global and regional scales (e.g., Lincke and Hinkel, 2021; Tiggeloven et al., 2020; Vousdoukas et al., 2020) to evaluate adaptation strategies or to calculate coastal migration (Smith et al., 2023) is not straightforward. In all cases, different assumptions for adaptation and datasets are considered. Vousdoukas et al. (2020) protect more of the European coast than our assessment. This appears consistent, as our analysis also considers retreat, which can offer lower costs—an option not available in the Vousdoukas analysis. Apart from protection, Lincke and Hinkel (2021) include retreat as another adaptation option, making their analysis the most similar to this study. However, different datasets (such as DEM) are considered in this analysis while stressing the impact of different SSP scenarios (Fox-Kemper et al., 2021). Nonetheless, our estimates are close to those obtained by Lincke and Hinkel (2021), who assessed RCP2.6 (5th and 95th), RCP8.5 (5th and 95th), and a high-end scenario (Jevrejeva et al., 2016), covering a global-mean SLR range of 0.3–1.7 m. They predict the total number of people migrating to be between 17 and 72 million, with similar results to this analysis for the upper band. However, our results add a lower SLR scenario (SSP1–1.9), with as few as four million migrants. In this assessment, we have employed MERIT DEM data (Yamazaki et al., 2017). This results in a total of 2,800 to 490,000 km2 of global net land loss during the twenty-first century, a range larger than that obtained by Lincke and Hinkel (2021) using Shuttle Radar Topography Mission (SRTM), with a total estimate of 60,000 to 415,000 km2 of global land loss. This is also reflected in the total land loss at the country level, almost double that estimated by Lincke and Hinkel (2021) for Indonesia, the USA, Brazil, Australia, Vietnam, and Mexico while reducing by more than half the land loss estimated in Canada and Russia. In Canada, land loss is lower than in Lincke and Hinkel (2021) as the new SLR projections are significantly lower there and often show relative sea-level fall, especially around Hudson Bay (see Supplementary Figure S4).
These results should be considered indicative as they allow us to explore potential outcomes that help to inform national governments, intergovernmental agencies, and other interested parties about the scale of future risks. They also serve as a starting point for analysing and implementing adaptation strategies at more detailed scales. In practise, many adaptation options are available at any location, but the choice between protection and retreat, as considered here, is fundamental and informative. As the results show, adaptation strategies will vary by location, and protection is the most cost-beneficial strategy in some areas, depending on physical and socioeconomic characteristics. Where protection is not favoured, migration can be an efficient response to SLR and socioeconomic pressures (Bachner et al., 2022). This assessment helps governments and related organisations recognise the need for proactive planning for coastal adaptation at the national scale, including planned relocation where appropriate (see, e.g., McMichael and Katonivualiku, 2019) and targeting adaptation investments in more vulnerable locations. This is already happening in some countries, such as several Small Island States—Maldives, Micronesia, the Marshall Islands, Kiribati and Fiji—where migration and planned relocation of vulnerable populations are included in their national adaptation policies (Hauer et al., 2020).
Data on the number of people displaced due to conflicts and disasters are collected annually in The Global Report on Internal Displacement (GRID) (IDMC, 2024). This report highlights that, although disasters can result in high numbers of displaced people from a single event (e.g., an earthquake) in a given year, multiple disasters, floods, and storms (cyclones and others) are the primary causes of displacement worldwide. In 2023, the East Asia and Pacific region accounted for the highest number of people displaced due to floods and storms, totalling nine million (IDMC, 2024). Although this figure represents the consequence of disasters—primarily extreme events, most of which are attributed to cyclones—we found that the coastal countries most affected worldwide (e.g., China, the Philippines, Bangladesh, Myanmar, Brazil, Pakistan, Mozambique, Kenya, Indonesia, and Malaysia) are also the top countries identified in our analysis. Although China is not within the top 10 countries for people migrating due to SLR (it ranks 11th) (see Supplementary Table S3), it has the highest total cost of SLR, driven by significant investment in protection, which limits the need for migration. Similarly, Bangladesh has relatively low migration compared to its potential for migration, as protection remains the preferred response (see Supplementary Data). With climate change and SLR, the frequency and intensity of these weather-related hazards will increase (IPCC, 2023), making these countries more vulnerable to their impacts. Without adequate planning, migration as a last resort is likely to increase, with critical consequences for their populations (Bardsley and Hugo, 2010).
We have evaluated the implications of coupled sea-level rise and SSP scenarios presented in the IPCC AR6 assessment on land and population, considering optimal protection versus retreat as a realistic choice for coastal adaptation. Across the SSP scenarios, we estimate that between 4 and 72 million people will migrate, with land loss ranging from 2,800 to 490,000 km2 over the twenty-first century (2020 to 2100). A strong mitigation scenario (SSP1–1.9), which limits global warming to approximately 1°C–1.8°C in line with the Paris Agreement goals, would considerably reduce migration numbers (4–36 million migrants). However, slow SLR will persist, impacting coastal areas worldwide and necessitating continued adaptation. Socioeconomic scenarios play a crucial role in migration projections and influence the extent of coastal areas where protection remains optimal. Notably, the highest migration occurs under the SSP3–7.0 scenario rather than the higher-emissions SSP5–8.5 scenario, as the former assumes larger global population projections and benefit-cost economic constraints that limit cost-effective coastal protection. Consequently, up to 72 million migrants may be expected under SSP3–7.0.
India, Vietnam, Nigeria, the Philippines, and Indonesia are the top migrant-producing countries across all scenarios. In contrast, land loss primarily affects countries with extensive low-lying coastal areas, even in regions with smaller or unpopulated coastlines, such as the USA, Russia, Indonesia, Brazil, and Australia. In relative terms, considering the national population and total land area, Small Island Developing States experience the greatest impact, with the highest proportions of migrants and land loss. The highest national costs of SLR are observed in China, India, Indonesia, the USA, and Nigeria. These costs vary in composition: in China, they are predominantly driven by extensive coastal protection efforts, whereas in Nigeria, migration constitutes the primary cost.
The CBA shows that 91.9% of the world’s coastline has a robust decision to retreat across all scenarios, impacting a total of 7.4% of the coastal population. In contrast, for 2.8% of the coastline, the economically robust decision is consistent protection. However, this protected area encompasses 78% of the coastal population and 91% of assets, highlighting the strong concentration of people and economic value in select coastal regions. Thus, while protection is spatially limited at a global scale, it effectively safeguards the majority of people, whereas more dynamic adaptation strategies, such as retreat, dominate in terms of coastal length. Protection responses mainly occur in wealthy countries with short coastlines and also in Europe and Asia. As SLR increases, the extent of protected coastline slightly decreases, leading to greater reliance on retreat and, consequently, more widespread migration.
The impact of SLR will inevitably persist throughout the twenty-first century and beyond. Identifying the most effective adaptation strategy is crucial to supporting vulnerable communities worldwide. While protection will be viable for many locations, migration should also be considered where appropriate. When planned in advance and supported by sound development policies and targeted investments, migration can serve as a sensible component of a national adaptation strategy to SLR.
The original contributions presented in the study are included in the article/Supplementary Material. Further inquiries can be directed to the corresponding author.
CB: Conceptualization, Formal analysis, Investigation, Methodology, Resources, Validation, Visualization, Writing – original draft, Writing – review & editing. DL: Data curation, Investigation, Software, Supervision, Visualization, Writing – review & editing. RN: Conceptualization, Funding acquisition, Investigation, Project administration, Supervision, Validation, Writing – review & editing. JHe: Writing – review & editing. JHi: Conceptualization, Data curation, Investigation, Writing – review & editing. VM-S: Data curation, Visualization, Writing – review & editing. AS: Data curation, Visualization, Writing – review & editing.
The author(s) declare that financial support was received for the research and/or publication of this article. This publication was supported by PROTECT. This project has received funding from the European Union’s Horizon 2020 research and innovation programme under grant agreement number 869304, PROTECT contribution number 155.
All authors were supported under the PROTECT Project. We thank the projection authors for developing and providing the sea-2level rise projections, as well as multiple funding agencies for supporting their development. We also acknowledge the NASA Sea Level Change Team for developing and hosting the IPCC AR6 Sea Level Projection Tool. The authors would like to thank Vanessa Völz, Jonas Haas, and Sebastiano Bacca from GCF for their valuable discussions on the paper.
The authors declare that the research was conducted in the absence of any commercial or financial relationships that could be construed as a potential conflict of interest.
The author(s) declare that no Generative AI was used in the creation of this manuscript.
All claims expressed in this article are solely those of the authors and do not necessarily represent those of their affiliated organizations, or those of the publisher, the editors and the reviewers. Any product that may be evaluated in this article, or claim that may be made by its manufacturer, is not guaranteed or endorsed by the publisher.
The Supplementary Material for this article can be found online at: https://www.frontiersin.org/articles/10.3389/fmars.2025.1505633/full#supplementary-material
Bachner G., Lincke D., Hinkel J. (2022). The macroeconomic effects of adapting to high-end sea-level rise via protection and migration. Nat. Commun. 13. doi: 10.1038/s41467-022-33043-z
Bardsley D. K., Hugo G. J. (2010). Migration and climate change: Examining thresholds of change to guide effective adaptation decision-making. Popul. Environ. 32, 238–262. doi: 10.1007/s11111-010-0126-9
Black S. R., Bennett S. R. G., Thomas S. M., Beddington J. R. (2011).Migration as adaptation Mobility can bring opportunities for coping with environmental change. Available online at: http://go.nature.com/pugh4r (Accessed January 08, 2024).
Cattaneo C., Beine M., Fröhlich C. J., Kniveton D., Martinez-Zarzoso I., Mastrorillo M., et al. (2019). Human migration in the era of climate change. Rev. Environ. Econ. Policy 13, 189–206. doi: 10.1093/reep/rez008
Center for International Earth Science Information Network—CIESIN—Columbia University (2017). Gridded population of the world, Version 4 (GPWv4): population count adjusted to match 2015 revision of UN WPP country totals, Revision 10 (Palisades, NY: NASA Socioeconomic Data and Applications Center (SEDAC). Available at: https://sedac.ciesin.columbia.edu/data/collection/gpw-v4 (Accessed November 02, 2022).
Chen J., Mueller V. (2018). Coastal climate change, soil salinity and human migration in Bangladesh. Nat. Clim. Chang. 8, 981–987. doi: 10.1038/s41558-018-0313-8
Chen D., Rojas M., Samset B. H., Cobb K., Diongue Niang A., Edwards P., et al. (2023). “Framing, context, and methods,” in Climate Change 2021 – The Physical Science Basis (Cambridge University Press), 147–286. doi: 10.1017/9781009157896.003
Church J. A., Clark P. U., Cazenave A., Gregory J. M., Jevrejeva S., Levermann A., et al. (2013). Sea Level Change: Chapter 13. In Stocker T. F., Qin D., Plattner G.-K., Tignor M., Allen S. K., Boschung J., et al (Eds.), The Physical Science Basis: Contribution of Working Group I to the Fifth Assessment Report of the Intergovernmental Panel on Climate Change Cambridge University Press.
Dada O. A., Almar R., Morand P., Bergsma E. W. J., Angnuureng D. B., Minderhoud P. S. J. (2023). Future socioeconomic development along the West African coast forms a larger hazard than sea level rise. Commun. Earth Environ. 4. doi: 10.1038/s43247-023-00807-4
Davis K. F., Bhattachan A., D’Odorico P., Suweis S. (2018). A universal model for predicting human migration under climate change: Examining future sea level rise in Bangladesh. Environ. Res. Lett. 13. doi: 10.1088/1748-9326/aac4d4
Desmet K., Kopp R. E., Kulp S. A., Krisztián Nagy D., Oppenheimer M., Rossi-Hansberg E., et al. (2018). “Evaluating the economic cost of coastal flooding,” in NBER Working paper series. Available at: http://www.nber.org/papers/w24918 (Accessed January 10, 2024).
Diaz D. B. (2016). Estimating global damages from sea level rise with the Coastal Impact and Adaptation Model (CIAM). Clim. Change 137, 143–156. doi: 10.1007/s10584-016-1675-4
Dronkers J., Gilbert J. T. E., Butler L. W., Carey J. J., Campbell J., James E., et al. (1990). Strategies for adaptation to sea level rise. Report of the IPCC Coastal Zone Management Subgroup: Intergovernmental Panel on Climate Change (Geneva: Intergovernmental Panel on Climate Change).
Esteban M., Jamero M. L., Nurse L., Yamamoto L., Takagi H., Thao N. D., et al. (2019). Adaptation to sea level rise on low coral islands: Lessons from recent events. Ocean Coast. Manag. 168, 35–40. doi: 10.1016/j.ocecoaman.2018.10.031
Eyring V., Bony S., Meehl G. A., Senior C. A., Stevens B., Stouffer R. J., et al. (2016). Overview of the Coupled Model Intercomparison Project Phase 6 (CMIP6) experimental design and organization. Geosci. Model. Dev. 9, 1937–1958. doi: 10.5194/gmd-9-1937-2016
Fang J., Lincke D., Brown S., Nicholls R. J., Wolff C., Merkens J. L., et al. (2020). Coastal flood risks in China through the 21st century – An application of DIVA. Sci. Total Environ. 704. doi: 10.1016/j.scitotenv.2019.135311
Fox-Kemper B. ,. H. T., Hewitt C., Xiao G., Aðalgeirsdóttir S. S., Drijfhout T. L., Edwards N. R., et al. (2021). “Ocean, cryosphere and sea level change,” in Climate Change 2021: The Physical Science Basis. Contribution of Working Group I to the Sixth Assessment Report of the Intergovernmental Panel on Climate Change. Masson-Delmotte V., Zhai P., Pirani A., Connors S. L., Péan C., Berger S., et al (eds.). (Cambridge University Press, Cambridge, United Kingdom and New York, NY, USA), 1211–1362. doi: 10.1017/9781009157896.011
Garner G. G., Hermans T., Kopp R. E., Slangen A. B. A., Edwards T. L., Levermann A., et al. (2021). IPCC AR6 Sea Level Projections. Version 20210809. doi: 10.5281/zenodo.5914709
Gesch D. B. (2018). Best practices for elevation-based assessments of sea-level rise and coastal flooding exposure. Front. Earth Sci. 6. doi: 10.3389/feart.2018.00230
Goulder L. H., Williams R. C. III (2012). The choice of discount rate for climate change policy evaluation (Cambridge: NBER Working Paper No. 18301). Available at: http://www.nber.org/papers/w18301 (Accessed June 21, 2023).
Haasnoot M., Lawrence J., Magnan A. K. (2021). Pathways to coastal retreat. Science (1979) 372, 1284–1287. doi: 10.1126/science.abh4283
Hallegatte S., Green C., Nicholls R. J., Corfee-Morlot J. (2013). Future flood losses in major coastal cities. Nat. Clim. Chang. 3, 802–806. doi: 10.1038/nclimate1979
Han M., Hou J., Wu L. (1995). Potential impacts of sea-level rise on China’s coastal environment and cities: a national assessment. J. Coast. Res. Special Issue 14, 79–95.
Hauer M. E., Fussell E., Mueller V., Burkett M., Call M., Abel K., et al. (2020). Sea-level rise and human migration. Nat. Rev. Earth Environ. 1, 28–39. doi: 10.1038/s43017-019-0002-9
Hinkel J., Aerts J. C. J. H., Brown S., Jiménez J. A., Lincke D., Nicholls R. J., et al. (2018). The ability of societies to adapt to twenty-first-century sea-level rise. Nat. Clim. Chang. 8, 570–578. doi: 10.1038/s41558-018-0176-z
Hinkel J., Feyen L., Hemer M., Le Cozannet G., Lincke D., Marcos M., et al. (2021). Uncertainty and bias in global to regional scale assessments of current and future coastal flood risk. Earth’s Future 9. doi: 10.1029/2020EF001882
Hinkel J., Lincke D., Vafeidis A. T., Perrette M., Nicholls R. J., Tol R. S. J., et al. (2014). Coastal flood damage and adaptation costs under 21st century sea-level rise. Proc. Natl. Acad. Sci. U.S.A. 111, 3292–3297. doi: 10.1073/pnas.1222469111
Hino M., Field C. B., Mach K. J. (2017). Managed retreat as a response to natural hazard risk. Nat. Clim. Chang. 7, 364–370. doi: 10.1038/nclimate3252
Hoozemans F. M. J., Marchand M., Pennekamp H. A. (1993). Sea level rise: A global vulnerability assessment. Vulnerability assessments for population, coastal wetlands and rice production on a global scale (The Hague: Delft Hydraulics/Rijkswaterstaat).
IDMC (2024). Global Report on Internal Displacement (GRID) (Norwegian Refugee Council (NRC)). Available online at: https://www.internal-displacement.org/global-report/grid2024/ (Accessed July 2024).
IIASA (2012).SSP Database. Available online at: https://secure.iiasa.ac.at/web-apps/ene/SspDb (Accessed July 14, 2020).
IPCC (2023). Summary for Policymakers. In: Climate Change 2023: Synthesis Report. Contribution of Working Groups I, II and III to the Sixth Assessment Report of the Intergovernmental Panel on Climate Change. Eds. Core Writing Team, Lee H., Romero J. (Geneva, Switzerland: IPCC), 1–34. doi: 10.59327/IPCC/AR6-9789291691647.001
Jevrejeva S., Jackson L., Riva R., Grinsted A., Moore J. (2016). Coastal sea level rise with warming above 2 °C. Proceedings of the National Academy of Sciences of USA 113 (47), 13342–13347. doi: 10.1073/pnas.1605312113
Kc S., Lutz W. (2017). The human core of the shared socioeconomic pathways: Population scenarios by age, sex and level of education for all countries to 2100. Global Environ. Change 42, 181–192. doi: 10.1016/j.gloenvcha.2014.06.004
Kirezci E., Young I. R., Ranasinghe R., Lincke D., Hinkel J. (2023). Global-scale analysis of socioeconomic impacts of coastal flooding over the 21st century. Front. Mar. Sci. 9. doi: 10.3389/fmars.2022.1024111
Kopp R. E., Garner G. G., Hermans T. H. J., Jha S., Kumar P., Reedy A., et al. (2023). The Framework for Assessing Changes to Sea-Level (FACTS) v1.0: A platform for characterizing parametric and structural uncertainty in future global, relative, and extreme sea-level change. Geoscientific Model. Dev. 16, 7461–7489. doi: 10.5194/gmd-16-7461-2023
Kopp R. E., Horton R. M., Little C. M., Mitrovica J. X., Oppenheimer M., Rasmussen D. J., et al. (2014). Probabilistic 21st and 22nd century sea-level projections at a global network of tide gauge sites. Earth’s Future 2, 383–406. doi: 10.1002/2014EF000239
Le Cozannet G., Nicholls R. J., Durand G., Slangen A., Lincke D., Chapuis A. (2023). Adaptation to multi-meter sea-level rise should start now. Environ. Res. Lett. 18(9), 91001. doi: 10.1088/1748-9326/acef3f
Li F., Yao C., Fu J., Yang X. (2023). Uncertainty analysis of potential population exposure within the coastal lowlands of mainland China. Environ. Res. Lett. 18. doi: 10.1088/1748-9326/ad059d
Lincke D., Hinkel J. (2018). Economically robust protection against 21st century sea-level rise. Global Environ. Change 51, 67–73. doi: 10.1016/j.gloenvcha.2018.05.003
Lincke D., Hinkel J. (2021). Coastal migration due to 21st century sea-level rise. Earth’s Future 9. doi: 10.1029/2020EF001965
Lincke D., Hinkel J., Mengel M., Nicholls R. J. (2022). Understanding the drivers of coastal flood exposure and risk from 1860 to 2100. Earth’s Future 10. doi: 10.1029/2021EF002584
Macmanus K., Balk D., Engin H., Mcgranahan G., Inman R. (2021). Estimating population and urban areas at risk of coastal hazards 1990-2015: How data choices matter. Earth Syst. Sci. Data 13, 5747–5801. doi: 10.5194/essd-13-5747-2021
McLeman R. A. (2014). Climate and human migration: past experiences, future challenges (Cambridge University Press). doi: 10.1017/CBO9781139136938
McMichael C., Dasgupta S., Ayeb-Karlsson S., Kelman I. (2020). A review of estimating population exposure to sea-level rise and the relevance for migration. Environ. Res. Lett. 15. doi: 10.1088/1748-9326/abb398
McMichael C., Katonivualiku M. (2019). Thick temporalities of planned relocation in Fiji. Geoforum 108. doi: 10.1016/j.geoforum.2019.06.012
Merkens J. L., Reimann L., Hinkel J., Vafeidis A. T. (2016). Gridded population projections for the coastal zone under the Shared Socioeconomic Pathways. Glob. Planet Change 145, 57–66. doi: 10.1016/j.gloplacha.2016.08.009
Milliman J. D., Broadus J. M., Gable F. (1989). Environmental and economic implications of rising sea level and subsiding deltas: the Nile and Bengal examples. Ambio 18, 340–345.
Muis S., Verlaan M., Winsemius H. C., Aerts J. C. J. H., Ward P. J. (2016). A global reanalysis of storm surges and extreme sea levels. Nat. Commun. 7. doi: 10.1038/ncomms11969
Myers N. (2002). Environmental refugees: A growing phenomenon of the 21st century. Phil. Trans. R. Soc B: Biol. Sci. 357, 609–613. doi: 10.1098/rstb.2001.0953
Nicholls R. J. (2004). Coastal flooding and wetland loss in the 21st century: Changes under the SRES climate and socio-economic scenarios. Global Environ. Change 14, 69–86. doi: 10.1016/j.gloenvcha.2003.10.007
Nicholls R. J., Brown S., Goodwin P., Wahl T., Lowe J., Solan M., et al. (2018). Stabilization of global temperature at 1.5°C and 2.0°C: Implications for coastal areas. Phil. Trans. R. Soc A: Mathematical Phys. Eng. Sci. 376. doi: 10.1098/rsta.2016.0448
Nicholls R. J., Hinkel J., Lincke D., van der Pol T. (2019). Global investment costs for coastal defense through the 21st century (Washington, DC: Policy Research Working Paper; No. 8745. © World Bank).
Nicholls R. J., Marinova N., Lowe J. A., Brown S., Vellinga P., De Gusmão D., et al. (2011). Sea-level rise and its possible impacts given a “beyond 4°C world” in the twenty-first century. Phil. Trans. R. Soc A: Mathematical Phys. Eng. Sci. 369, 161–181. doi: 10.1098/rsta.2010.0291
Nienhuis J. H., van de Wal R. S. W. (2021). Projections of global delta land loss from sea-sevel rise in the 21st century. Geophys. Res. Lett. 48. doi: 10.1029/2021GL093368
O’Neill B. C., Kriegler E., Ebi K. L., Kemp-Benedict E., Riahi K., Rothman D. S., et al. (2017). The roads ahead: Narratives for shared socioeconomic pathways describing world futures in the 21st century. Global Environ. Change 42, 169–180. doi: 10.1016/j.gloenvcha.2015.01.004
O’Neill B. C., Kriegler E., Riahi K., Ebi K. L., Hallegatte S., Carter T. R., et al. (2014). A new scenario framework for climate change research: The concept of shared socioeconomic pathways. Clim. Change 122, 387–400. doi: 10.1007/s10584-013-0905-2
Oppenheimer M., Glavovic B. C., Hinkel J., van de Wal R., Magnan A. K., Abd-Elgawad A., et al. (2019). “Sea level rise and implications for low-lying islands, coasts and communities,” in IPCC Special Report on the Ocean and Cryosphere in a Changing Climate (Cambridge University Press). doi: 10.1017/9781009157964.006
Penning-Rowsell E., Priest S., Parker D., Morris J., Tunstall S., Viavattene C., et al. (2014). Flood and Coastal Erosion Risk Management (London: Routledge). doi: 10.4324/9780203066393
Reimann L., Jones B., Bieker N., Wolff C., Aerts J. C. J. H., Vafeidis A. T. (2023a). Exploring spatial feedbacks between adaptation policies and internal migration patterns due to sea-level rise. Nat. Commun. 14. doi: 10.1038/s41467-023-38278-y
Reimann L., Vafeidis A. T., Honsel L. E. (2023b). Population development as a driver of coastal risk: Current trends and future pathways. Cambridge Prisms: Coast. Futures 1. doi: 10.1017/cft.2023.3
Sadoff C., Hall J. W., Grey D., Aerts J. C. J. H., Ait-Kadi M., Brown C., et al. (2015). Securing water, sustaining growth: report of the GWP/OECD task force on water security and sustainable growth (UK: University of Oxford), 180pp.
Smith R., Nicholls R. J., Tebboth M. G. L., Kent A. (2023). “The impact of sea-level rise on existing patterns of migration,” in Environmental Migration in the Face of Emerging Risks: Historical Case Studies, New Paradigms and Future Directions (Palgrave Macmillan, Cham: Springer International Publishing), 99–118. doi: 10.1007/978-3-031-29529-4_6
Tiggeloven T., De Moel H., Winsemius H. C., Eilander D., Erkens G., Gebremedhin E., et al. (2020). Global-scale benefit-cost analysis of coastal flood adaptation to different flood risk drivers using structural measures. Natural Hazards Earth System Sci. 20, 1025–1044. doi: 10.5194/nhess-20-1025-2020
Tol R. S. J. (2007). The double trade-off between adaptation and mitigation for sea level rise: An application of FUND. Mitig. Adapt. Strateg. Glob. Chang. 12, 741–753. doi: 10.1007/s11027-007-9097-2
UN (2023). Secretary-General’s remarks to the Security Council Debate on “Sea-level Rise: Implications for International Peace and Security (United Nations). Available online at: https://www.un.org/sg/en/content/sg/statement/2023-02-14/secretary-generals-remarks-the-security-council-debate-sea-level-rise-implications-for-international-peace-and-security (Accessed June 26, 2024).
Vafeidis A. T., Nicholls R. J., McFadden L., Tol R. S. J., Hinkel J., Spencer T., et al. (2008). A new global coastal database for impact and vulnerability analysis to sea-level rise. J. Coast. Res. 24, 917–924. doi: 10.2112/06-0725.1
van de Wal R., Melet A., Bellafiore D., Camus P., Ferrarin C., Oude Essink G., et al. (2024). Sea level rise in Europe: impacts and consequences. State Planet 3, 1–33. doi: 10.5194/sp-3-slre1-5-2024
VanKoningsveld M., Mulder J. P. M., Stive M. J. F., VanDerValk L., VanDerWeck A. W. (2008). Living with sea-level rise and climate change: A case study of the Netherlands. J. Coast. Res. 2008, 367–379. doi: 10.2112/07A-0010.1
Vousdoukas M. I., Mentaschi L., Hinke lJ., Ward P. J., Mongelli I., Ciscar J-C., et al. (2020). Economic motivation for raising coastal flood defenses in Europe. Nat Commun 11, 2119. doi: 10.1038/s41467-020-15665-3
Wolff C., Bonatz H., Vafeidis A. T. (2023). Setback zones can effectively reduce exposure to sea-level rise in Europe. Sci. Rep. 13. doi: 10.1038/s41598-023-32059-9
Wu H., Zhang M., He Y., Chen P., Pasquier U., Hu H., et al. (2025). Scenario-based flood adaption of a fast-developing delta city: Modeling the extreme compound flood adaptations for shanghai. Int. J. Disaster Risk Reduct. 117. doi: 10.1016/j.ijdrr.2025.105207
Keywords: migration, sea-level rise, adaptation, coastal protection, coastal retreat, cost-benefit analysis
Citation: Ballesteros C, Lincke D, Nicholls RJ, Heslop J, Hinkel J, Malagón-Santos V and Slangen ABA (2025) Migration, land loss and costs to 2100 due to coastal flooding under the IPCC AR6 sea-level rise scenarios and plausible adaptation choices. Front. Mar. Sci. 12:1505633. doi: 10.3389/fmars.2025.1505633
Received: 03 October 2024; Accepted: 26 February 2025;
Published: 27 March 2025.
Edited by:
Paolo Ciavola, University of Ferrara, ItalyReviewed by:
Ivan Sekovski, Priority Actions Programme/Regional Activity Centre (PAP/RAC), CroatiaCopyright © 2025 Ballesteros, Lincke, Nicholls, Heslop, Hinkel, Malagón-Santos and Slangen. This is an open-access article distributed under the terms of the Creative Commons Attribution License (CC BY). The use, distribution or reproduction in other forums is permitted, provided the original author(s) and the copyright owner(s) are credited and that the original publication in this journal is cited, in accordance with accepted academic practice. No use, distribution or reproduction is permitted which does not comply with these terms.
*Correspondence: Caridad Ballesteros, Yy5iYWxsZXN0ZXJvcy1tYXJ0aW5lekB1ZWEuYWMudWs=
Disclaimer: All claims expressed in this article are solely those of the authors and do not necessarily represent those of their affiliated organizations, or those of the publisher, the editors and the reviewers. Any product that may be evaluated in this article or claim that may be made by its manufacturer is not guaranteed or endorsed by the publisher.
Research integrity at Frontiers
Learn more about the work of our research integrity team to safeguard the quality of each article we publish.