 Jinze Du1,6†Meiqin Huang3†
 Zhenjun Kang1,4,6†
 Yichao Tian2,5,6*Jin Tao2,5Qiang Zhang2,5Yutong Xie1,2,5Jinying Mo2,5LiYan Huang1,6Yusheng Feng1,6
- 1College of Marine Sciences, Beibu Gulf University, Qinzhou, China
- 2College of Resources and Environment, Beibu Gulf University, Qinzhou, China
- 3Radiation Environment Analysis and Testing Center, Radiation Environment Management and Monitoring Station of Guangxi Zhuang Autonomous Region, Nanning, China
- 4Beibu Gulf Marine Ecological Environment Field Observation and Research Station of Guangxi, Beihai, China
- 5Key Laboratory of Marine Geographic Information Resources Development and Utilization in the Beibu Gulf, Beibu Gulf University, Qinzhou, China
- 6Guangxi Key Laboratory of Marine Environmental Change and Disaster in Beibu Gulf, Beibu Gulf University, Qinzhou, China
Pile culture is a breeding method commonly used for oyster seedlings in the intertidal zone of southern China. Artificial visual interpretation serves as the primary monitoring approach for oyster seedling cultivation in marine areas. Manual visual interpretation is often time-consuming, inefficient, and does not provide spatially continuous information about the structure. Consequently, obtaining data on oyster pile columns and oyster seedling culture areas presents certain limitations. This study focuses on Shajing Town, Qinzhou City, Guangxi Zhuang Autonomous Region, China, as its research area. It utilizes multi-spectral image data from unmanned aerial vehicles (UAVs), light detection and ranging (LiDAR) point cloud technology, and deep learning algorithms to extract representative oyster pile columns in Maowei Sea within Beibu Gulf. By employing band features and texture indices extracted from UAV’s multi-spectral images as data sources and combining them with a classification and prediction model based on deep learning convolutional neural networks (CNN), we successfully extract the desired oyster pile columns. The results demonstrate that: 1) By comparing three machine learning models and integrating the LiDAR point cloud oyster pile column height model (OPCHM) into the S3 scenario, the convolutional neural network (CNN) attains an impressive overall classification accuracy (OA) of 96.54% and a Kappa coefficient of 0.9593, significantly enhancing and optimizing the CNN’s predictive accuracy for classification tasks; 2) In comparison with conventional machine learning algorithms, deep learning exhibits remarkable feature extraction capability.
1 Introduction
As a globally distributed group, oysters are found in tropical, subtropical, and temperate marine regions. In 2022, oyster aquaculture dominated the global shellfish aquaculture production with an overall yield of approximately 600,000 tons (Food and Agriculture Organization of the United Nations, 2022). Over the past decade or so, China has witnessed a remarkable increase of 56.1% in its oyster production along with a surge in annual output value from $1.88 billion to $5.255 billion. Furthermore, China’s international market share has grown by 32.3%, establishing oysters as the leading category within Chinese mariculture production (Zhang et al, 2020). Common methods employed for oyster cultivation encompass raft culture, rope culture, trellis culture, and pile post culture techniques. The use of artificial attachment bases known as oyster pile columns is integral to pile column culture for collecting young oyster seedlings. The average spacing between these pile columns measures around 2 meters each and consists of approximately 20 leaning oyster columns that form a conical structure collectively. Tidal flats rank among the most dynamic coastal environments globally (Clark et al, 2024), and the adjacent mangrove ecosystems enrich these areas with essential nutrients that benefit oysters. Research conducted by Clara Mackenzie et al (Mackenzie et al, 2024). reveals that oysters cultivated in the intertidal zone exhibit enhanced resistance to summer mortality stress, resulting in prolonged survival and reduced mortality rates compared to those reared in deep water. Consequently, investigating the spatial distribution of oyster pile columns in aquaculture and accurately extracting these columns is of paramount importance for estimating oyster economic output and enhancing regulatory efficiency. Investigating the spatial distribution of oyster pile cultures and accurately extracting data on individual pile columns holds immense significance for estimating economic yields and enhancing supervision efficiency.
Traditional monitoring of oyster pile columns relies mainly on manual visual interpretation (Zhang et al, 2021). With the advancement of remote sensing technology, remote sensing imagery has been widely utilized in aquaculture. Compared to traditional sample plot surveys, remote sensing technology offers high efficiency, accuracy and non-destructiveness, making it an important technical tool for monitoring oyster culture. Currently, remote sensing technology is applied in monitoring marine raft culture areas (Cao et al, 2016; Liu et al, 2020; Zhang et al, 2022, as well as intertidal oyster reefs and oyster rack culture areas (Windle et al, 2019, Windle et al, 2022; Román et al, 2023), Numerous domestic and foreign scholars have conducted studies on the inversion of oyster culture areas using different satellite sensors and remote sensing technology. Cao et al (Cao et al, 2016), for instance, employed high-resolution optical images from passive remote sensing WorldView-2 satellite to extract floating rafts used in aquaculture. Fan et al (Fan et al, 2014). utilized high-resolution SAR satellite remote sensing data to extract information on floating-rafts, and combined it with field investigations for mutual verification of the extracted breeding information. High spatial resolution remote sensing plays a crucial role in extracting structural parameter information of floating-raft culture due to its abundant details and superior spatial resolution. Although passive optical remote sensing image data exhibits certain advantages in capturing horizontal floating-raft structure information, the extraction of oyster pile columns within the complex intertidal zone environment can be influenced by surrounding phenology and weather conditions, resulting in issues such as “different spectra for the same object” and “foreign objects appearing similar” (Tan et al, 2023)
The active synthetic aperture radar remote sensing data can be utilized for inverting the structural parameters of floating-raft cultured oysters, which are characterized by their ability to operate under all-day and all-weather conditions. Chu et al (Chu et al, 2008). employed active remote sensing Synthetic Aperture Radar (SAR) satellites to monitor floating-raft culture. The Sentinel-1 satellite served as a high-resolution active SAR satellite, while the Sentinel-2 satellite functioned as a high-resolution passive multi-spectral imaging satellite. Numerous scholars have demonstrated through research that fusing data from both Sentinel-1 and Sentinel-2 satellites can significantly enhance the accuracy of estimating aquaculture floating rafts (Wang et al, 2023). Although the aforementioned methods enable monitoring of ground object features over large areas, oyster pile columns pose distinct challenges compared to floating-rafts and oyster reefs due to their small size, limited spatial resolution of satellite remote sensing that hampers accurate extraction, and a similar habitat appearance (i.e., oyster pile columns exhibit color resemblance with adjacent mudflats), which may potentially confound classification techniques.
Although satellite images with high spatial resolution have the capability to identify and classify intertidal oyster racks (Grizzle et al, 2018; Regniers et al, 2016), limitations such as fixed acquisition times, cloud cover, haze effects, and coarse image resolution hinder their ability to accurately and efficiently monitor oyster pile columns (Yang et al, 2018). In this context, Unmanned Aerial Vehicles (UAVs) offer significant advantages, particularly in terms of high timeliness and flexibility in data acquisition, as well as their ability to record images with spatial resolution reaching the centimeter level (Jiang S. et al, 2021). This capability compensates for the insufficient spatial resolution of satellite remote sensing (Hong et al, 2008). UAV remote sensing is becoming an important tool for marine fishery monitoring due to its flexibility, efficiency, and low cost, enabling the generation of systematic data with high spatial and temporal resolution (Yang et al, 2018). Low-altitude remote sensing data obtained by UAVs are also increasingly utilized for image refinement and classification. For instance, Yang et al (Yang et al, 2018). used drone images for efficient classification and quantitative evaluation of oyster racks. Alejandro Roman et al. conducted a case study in the Bay of Bourgneuf (France), evaluating potential high-resolution UAV multispectral data using a novel GIS-based analysis method, successfully exploring the spatial information structure of oyster culture (Román et al, 2023). Furthermore, Stephanie M. Dohner et al (Dohner et al, 2020). combined biological data with aerial UAV-derived positive digital elevation models to accurately and rapidly map the coastline in a characterization study of the worm reef (Sabellaria vulgaris) in Delaware Bay, United States. Notably, optical remote sensing systems typically capture only two-dimensional information, excluding highly correlated stratigraphic vertical structures. Unlike marine floating-raft culture, oyster pile columns exhibit a more three-dimensional conical structure. Airborne Lidar enables the acquisition of detailed and spatially explicit three-dimensional information (Cao et al, 2019). Lian et al (Lian et al, 2022). successfully classified tree species by integrating UAV multi-spectral classification data with laser point cloud data, while Michael C. Espriella et al (Espriella et al, 2022). monitored structural changes in oyster reefs using LiDAR-UAV data. The utilization of LiDAR point cloud technology carried by UAVs presents a novel solution for precise 3D spatial data acquisition in monitoring oyster pile columns within the intertidal zone.
In addition to selecting hyperspectral and high spatial resolution remote sensing data sources, the choice of an appropriate classification model is crucial. Currently, common methods for ground object classification using UAV hyperspectral and multispectral images include traditional supervised and unsupervised classification (Jiang Y. F. et al, 2021), object-oriented image classification (Sun et al, 2010), traditional machine learning classification (Huang et al, 2024), and deep learning classification (Sharan et al, 2021). Hou et al (Hou et al, 2022). utilized the decision tree algorithm to extract and analyze hyperspectral remote sensing images of marine floating-raft culture. Chen et al (Chen et al, 2022). employed novel datasets to explore the recognition and generalization ability of their model in identifying complex features in marine pasture areas. These findings highlight the potential of machine learning algorithms in achieving improved results compared to traditional statistical methods for image multivariate feature classification based on a machine learning algorithm (Liu et al, 2016). However, most existing methods are limited to specific conditions or scenario, resulting in suboptimal interpretation accuracy due to target feature diversity in high-resolution remote sensing images as well as interactions between features in complex scenario like intertidal zones. In recent years, Convolutional Neural Networks (CNN), a prominent representative of deep learning methods, have garnered considerable attention. Compared to traditional machine learning approaches, deep learning boasts intricate network architectures and superior feature learning capabilities, demonstrating its proficiency in extracting deep features from raw images (Xu et al, 2022). Diab et al (Diab et al, 2022). discovered through their research that deep learning has achieved remarkable performance in data classification and segmentation using 3D data points, particularly in the form of point clouds, with CNNs exhibiting the utmost efficacy across various remote sensing applications. Furthermore, Everton Castelao Tetila et al (Tetila et al, 2020). conducted a comparison of five deep learning frameworks for image classification against other conventional extraction techniques, including SIFT, SURF, the Bag-of-Visual Words method, the semi-supervised OPFSEMImst method, and supervised methods like SVM, k-NN, and random forest. Following training, deep learning achieved an impressive accuracy rate of 93.82%, significantly outperforming other machine learning algorithms. Further exploration is needed regarding the applicability of deep learning algorithms for monitoring oyster seedling breeding facilities within intertidal zones.
The Maowei Sea in Qinzhou, Guangxi, stands out as a significant oyster production region in China. The oysters cultivated there, scientifically known as “Hong Kong oysters” (Crassostrea hongkongensis), are the primary species grown along the coastal areas of South China, including the provinces of Guangdong and Guangxi, as well as in Vietnam. These warm-water, nearshore-dwelling bivalves hold immense economic value (Li et al, 2020). Hong Kong oysters exhibit a relatively broad salinity tolerance, with a greater adaptation to low-salinity environments compared to high-salinity ones (Liu et al, 2024). Research conducted by Shijun Xiao et al (Xiao et al, 2018). reveals that Hong Kong oysters typically flourish within a salinity range of 5 to 30 parts per thousand (ppt), with an optimal salinity range of approximately 10 to 25 ppt. Maowei Sea serves as a semi-enclosed inland sea that receives inflows primarily from Qinjiang River and Maoling River, creating a unique water environment where saline and freshwater converge harmoniously - a perfect habitat for oyster reproduction and growth—making it a natural breeding ground. The Maowei Sea is the largest natural oyster seedling picking area in China, with an annual output of approximately 100 billion seedlings. However, there is currently a lack of research on the effectiveness of UAVs in retrieving spatial information regarding oyster seedling culture distribution. Furthermore, remote sensing technology has not been utilized for classifying oyster pile column cultures. To address these gaps, this study focuses on typical pile columns in the Maowei Sea and employs low altitude remote sensing technology using UAVs to capture multi-spectral images and obtain laser point cloud data of the oyster sprout pile column culture area. By combining band characteristics, texture indices, and height models of the oyster pile columns with a CNN classification prediction model, accurate classification of oyster pile columns can be achieved. This study has four main research objectives:
1. To explore the potential of using UAV ortho-projective images and laser point clouds for the classification of oyster pile columns;
2. To analyze the influence of various variables on the construction of a Convolutional Neural Network (CNN) classification prediction model for the classification of oyster pile columns;
3. To investigate the potential of retrieving spatial information on the distribution of oyster seedling culture in the intertidal zone, providing a reliable scientific basis for rational planning of intertidal aquaculture, controlling the deterioration of the aquaculture environment, and preventing aquaculture diseases.
2 Materials and methods
2.1 Study area
The research area is situated in Shajing Town, Qinzhou City, Guangxi Zhuang Autonomous Region, China (Figure 1). Its geographical coordinates fall within the oyster seedling cultivation zone of Shajing Oyster (108°34’50’’E-108°35’30’’E, 21°51’10’’N-21°51’40’’N), which is located in a subtropical region. This region exhibits typical characteristics of a subtropical monsoon climate with an average annual temperature of approximately 22°C (Tian et al, 2019). It experiences intense solar radiation and features mangroves flanking both sides of the tidal flat. These natural geographical factors create favorable conditions for oyster seedling attachment and growth by providing gentle sea tides, suitable sea temperature and salinity levels, as well as conducive soil and sediment properties. The surrounding environment near the oyster pile pillars is complex, encompassing various ground objects such as mangroves, mudflats, rocks, water etc., with increasing difficulty closer to the Bund area. Consequently, we have chosen to conduct field sample investigations during low tide periods when there is optimal solar illumination angle.
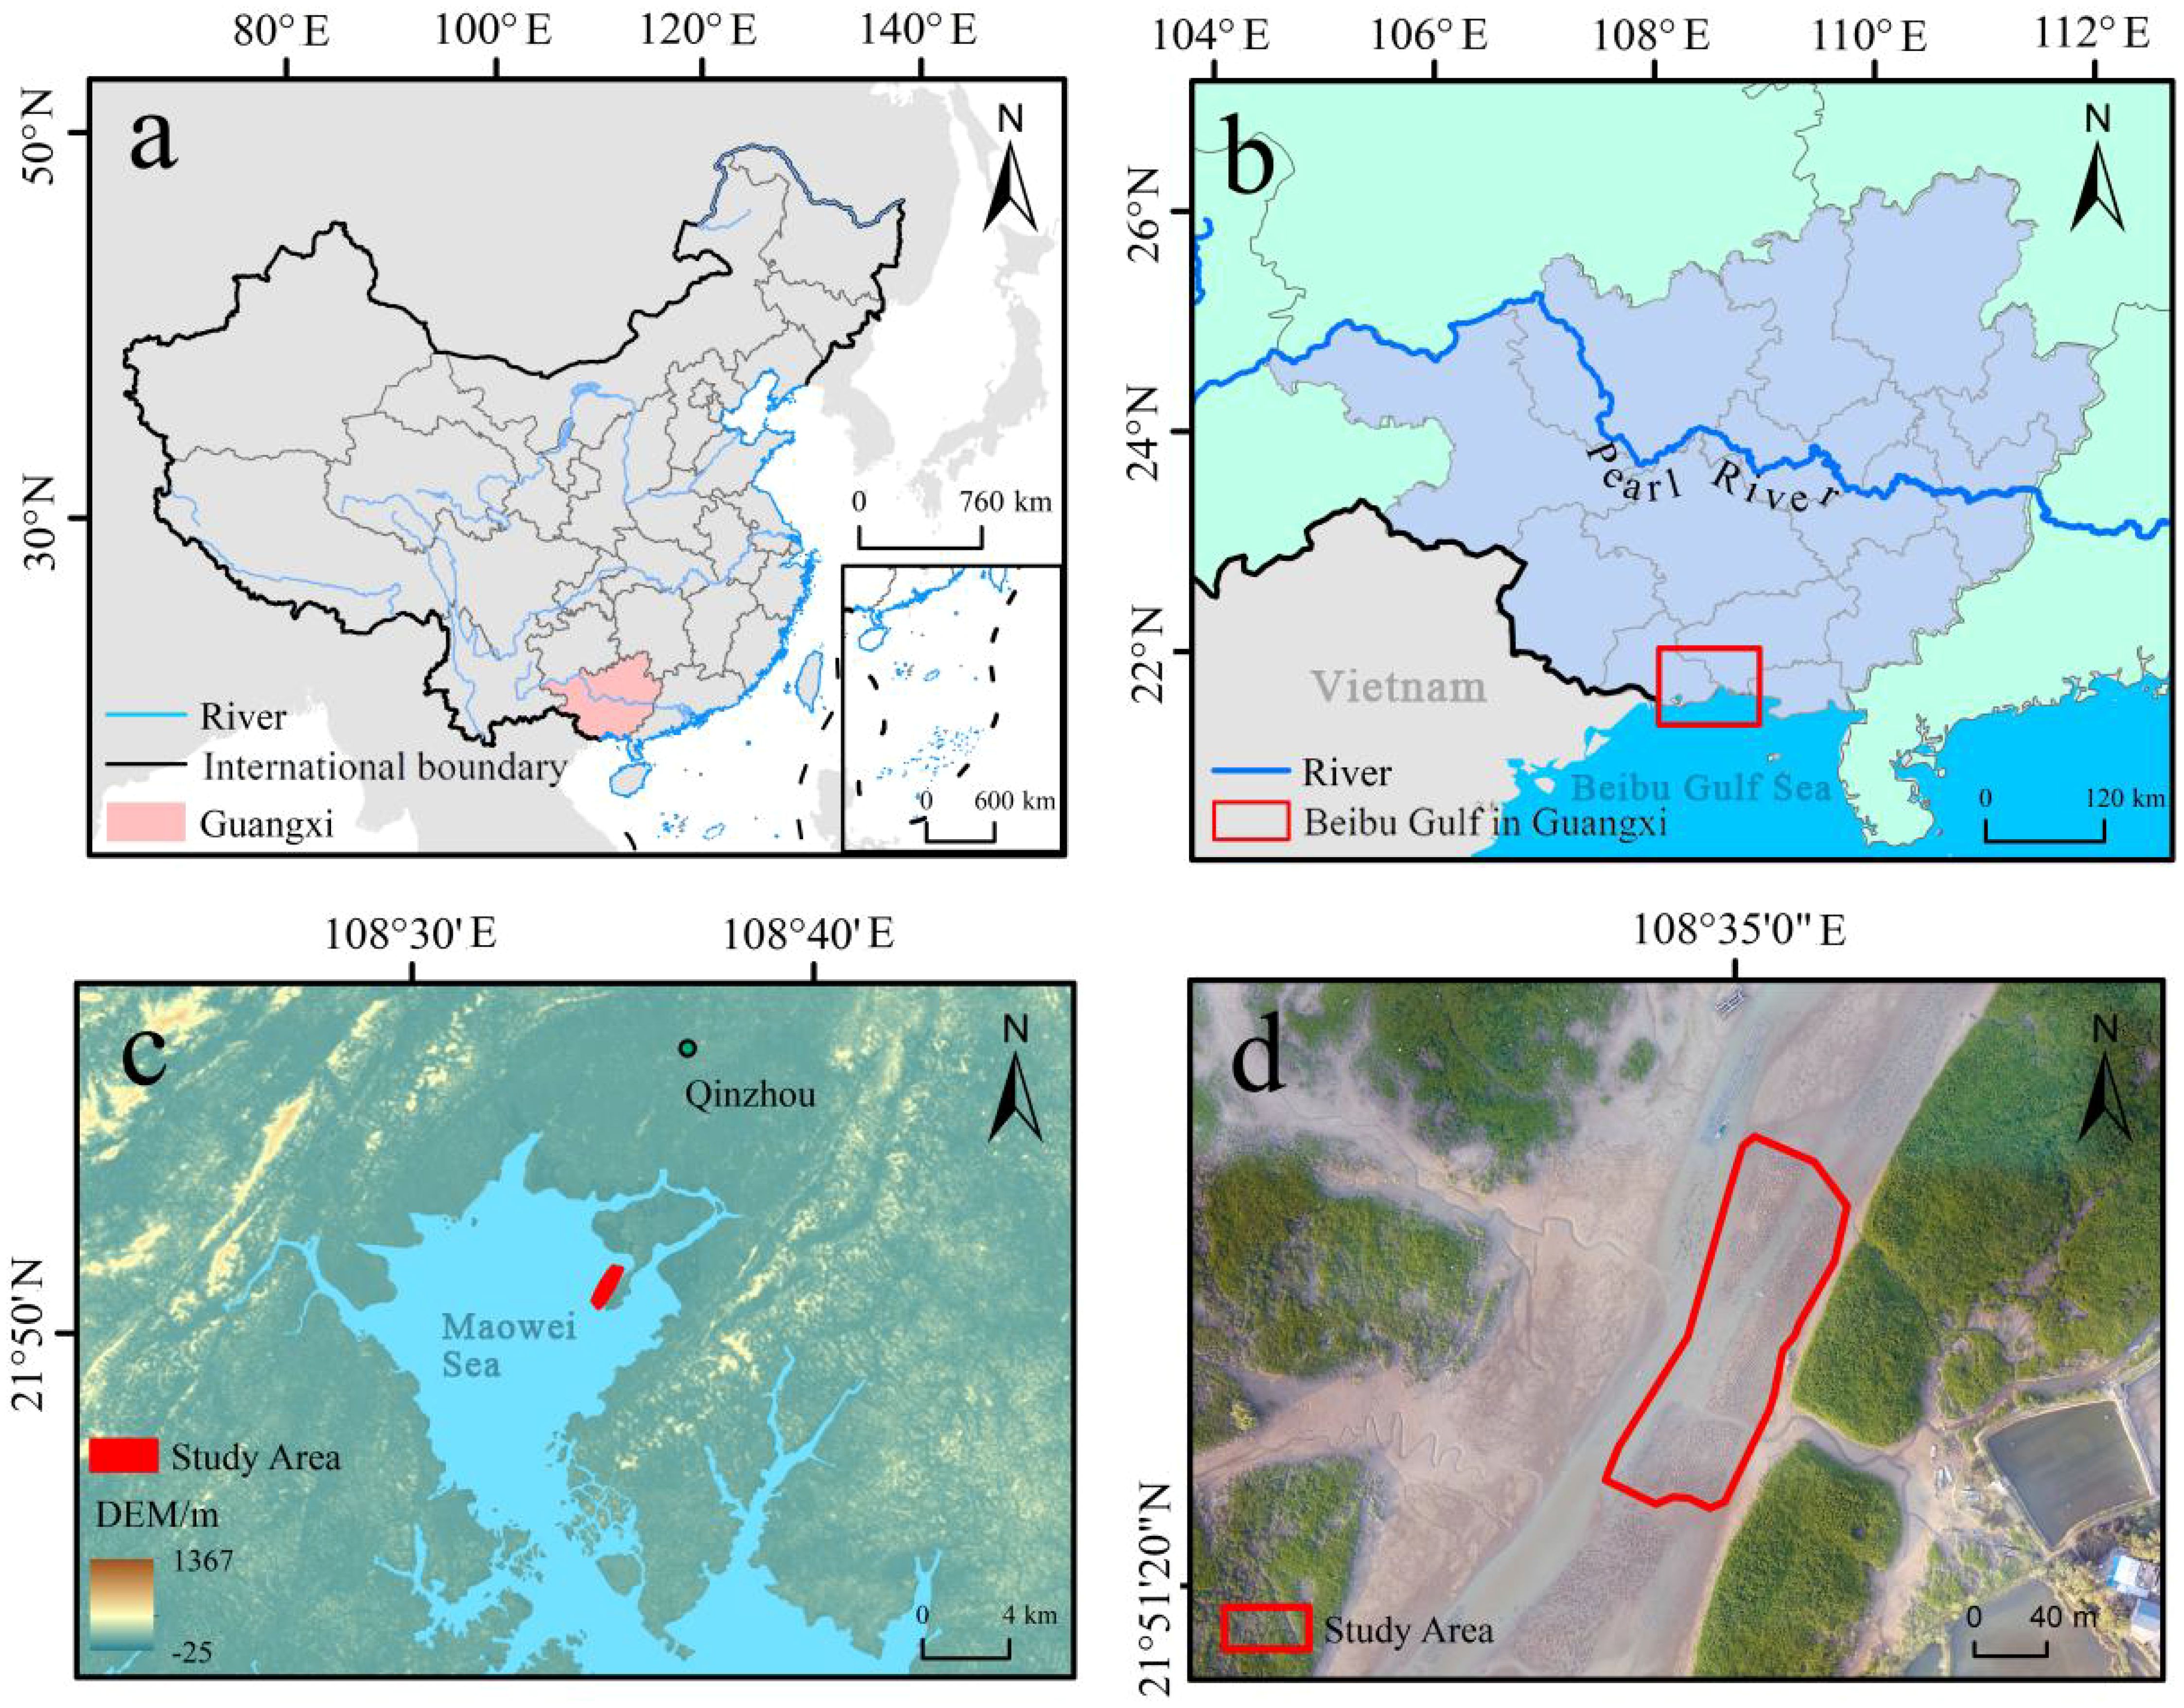
Figure 1. (A) The study area is located in the coastal area of Guangxi, China; (B) Beibu Gulf in Guangxi; (C) The study area is located in Maowei Sea which is belong to the coastal area of Guangxi; (D) Multi-spectral intertidal imagery of oyster pile columns acquired by UAV.
2.2 UAV data acquisition
In this study, data acquisition was conducted on November 18, 2023 using a DJI M300 RTK drone equipped with an ordinary camera and an HS400P laser sensor. The hardware system integrated a LiDAR scanner, Global Navigation Satellite System (GNSS), and Inertial Measurement Unit (IMU). To mitigate potential deviations caused by tidal flat surface changes, weather conditions, and lighting variations during the radiometric calibration aerial survey, the UAV flew at an average height of 80 m between 15:00 to 16:00 when local tide levels were low, weather was clear, and sunlight incident angle was optimal. Both course overlap rate and side overlap rate were set at 80%. Simultaneous acquisition of multi-spectral data from the UAV and LiDAR point cloud data were achieved. By utilizing Novatel Intertial Explorer along with IMU and GNSS data to process the original oyster pile column echo information, three-dimensional LiDAR point cloud information within the study area could be obtained. Figure 2 illustrates the drone aerial map of the oyster seedling culture area.
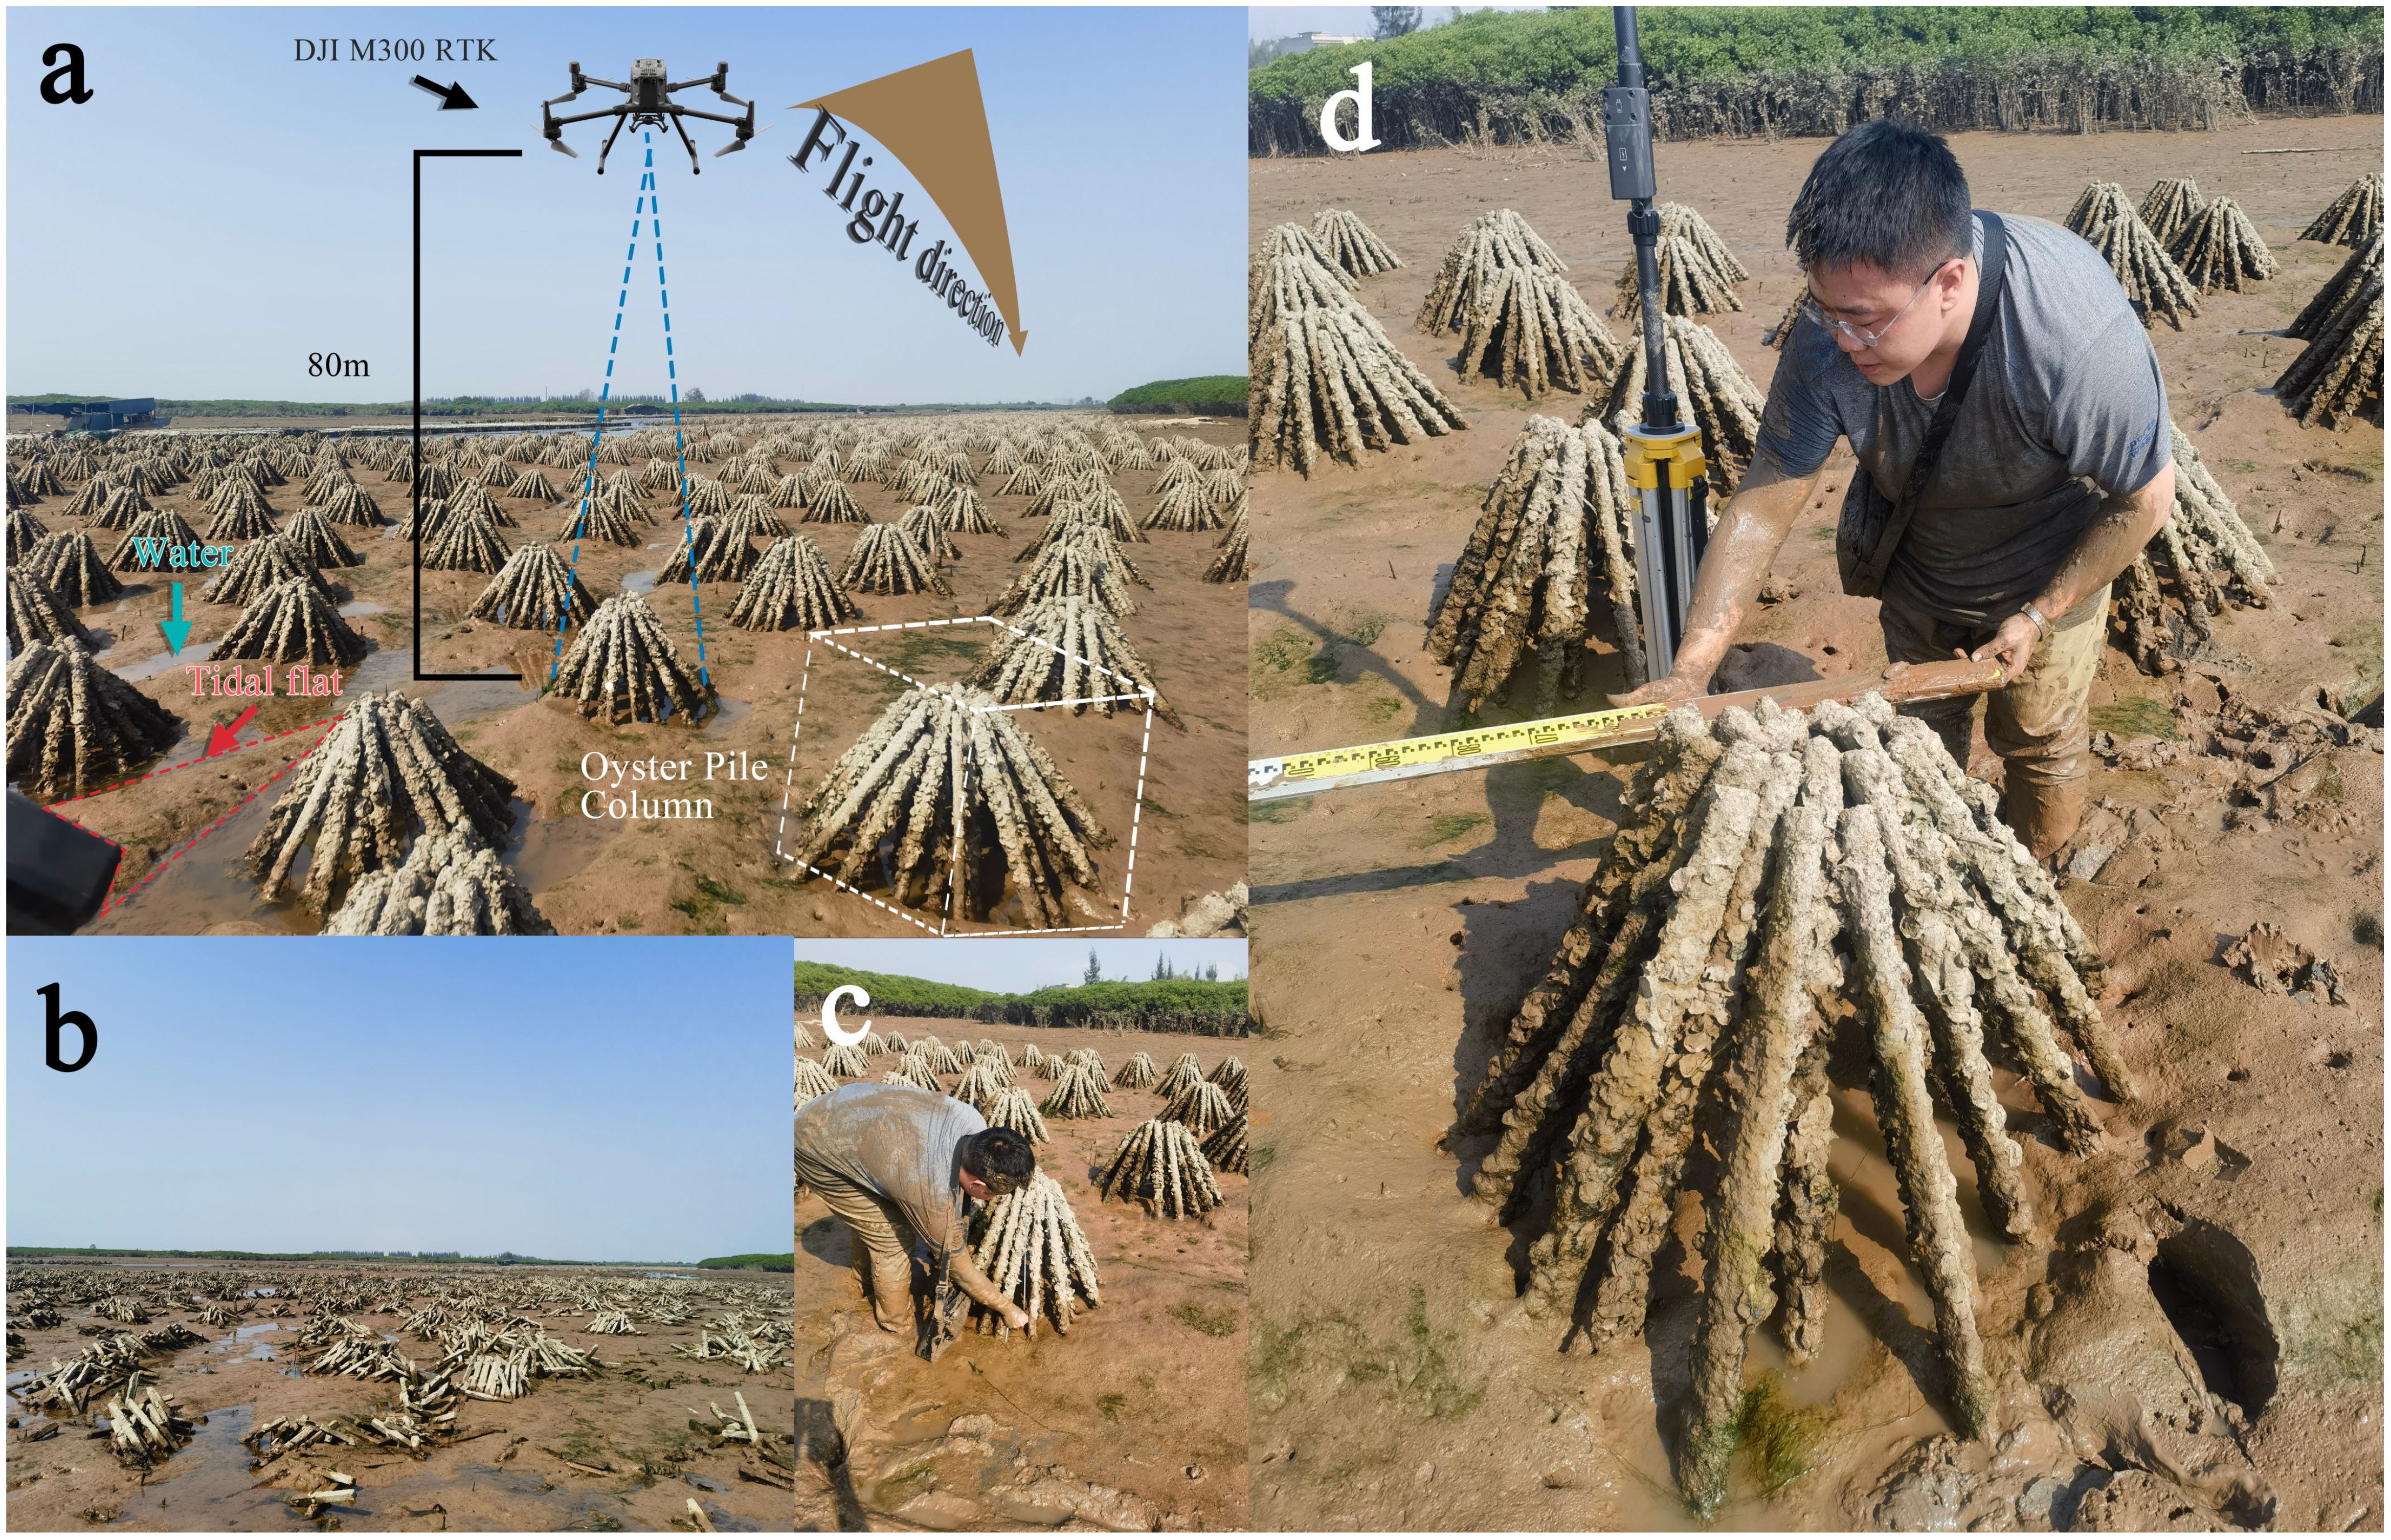
Figure 2. (A) UAV multispectral data and laser point cloud aerial survey. (B) Damaged portion of oyster pile column. (C) Mean height of oyster pile column measured on field tidal flats. (D) Measured diameter of oyster pile column and mean spacing distance between oyster pile column.
2.3 UAV data preprocessing
This study utilizes the Oyster Pile Column Height Model (OPCHM) to represent the height of oyster pile columns. The OPCHM data for these columns is derived from laser point cloud data. Prior to extracting the OPCHM using Lidar360, it is essential to obtain the Digital Surface Model (DSM) and Digital Elevation Model (DEM) of the study area. The OPCHM is then computed by subtracting the DEM from the DSM. Traditional atmospheric correction techniques are primarily suited for high-altitude satellite remote sensing data. However, in this study, the DJI M300 RTK drone operates at an altitude of 80 meters. Given the thin atmosphere at such low altitudes, the impact on sensor data is negligible, obviating the need for atmospheric correction. The M300 RTK is equipped with an RTK positioning system that provides centimeter-level accuracy (1 cm horizontally and 1.5 cm vertically), ensuring precise recording of flight trajectories and sensor attitudes.
The data collected by the UAV originally had a resolution of 0.02 m/pixel. To align with hardware performance capabilities, the data was resampled, resulting in a reduced resolution of 0.04 m/pixel. This study centered on pixel-level classification of 2D multispectral image feature maps. Initially, texture features were computed, and OPCHM data, derived from LiDAR point clouds, was obtained. Further feature values were generated through calculations involving spectral bands. For this purpose, we utilized ENVI, a professional software developed by Harris Geospatial for spectral image analysis and geospatial remote sensing. Version 5.3 of ENVI introduced significant updates, including enhanced support for a wider range of sensors and data formats, along with a more user-friendly interface. Using ENVI 5.3, we cropped the research area and labeled three distinct regions of interest (ROIs): oyster pile columns, tidal flats, and water, as samples. These samples were then imported into ArcGIS 10.7 for raster-to-point conversion, yielding a total of 476,031 selected pixels as sample points. The “Extract Multi Values to Points” tool in ArcGIS 10.7 was employed to assign various feature variable parameters to the attribute tables of these sample points, thereby creating a comprehensive dataset of feature variables that could reconstruct the characteristics of oyster piles. The dataset was randomly split into 70% for model training and 30% for testing. A CNN-based classification prediction model was used to iteratively optimize network parameters. Ultimately, all 6,842,238 pixels in the multispectral imagery of the study area were classified, and the model with the highest overall training accuracy was applied to generate a classification map of oyster seed aquaculture areas.
2.4 Technology roadmap
This study developed a dataset comprising four distinct feature variable scenarios to classify oyster reef aquaculture areas. By extracting single-band features, band combination features, texture indices, and the Oyster Pile Column Height Model (OPCHM) from remote sensing images, we constructed this comprehensive dataset. We then analyzed the significance of these feature variables and identified the optimal scenario based on classification performance. To classify this optimal feature variable scenario, we employed a CNN model and compared its prediction accuracy and classification performance to three conventional machine learning models: Decision Tree (DT), Support Vector Machine (SVM), and Random Forest (RF). This comparison allowed us to determine the most effective classification model diagram is illustrated in Figure 3.
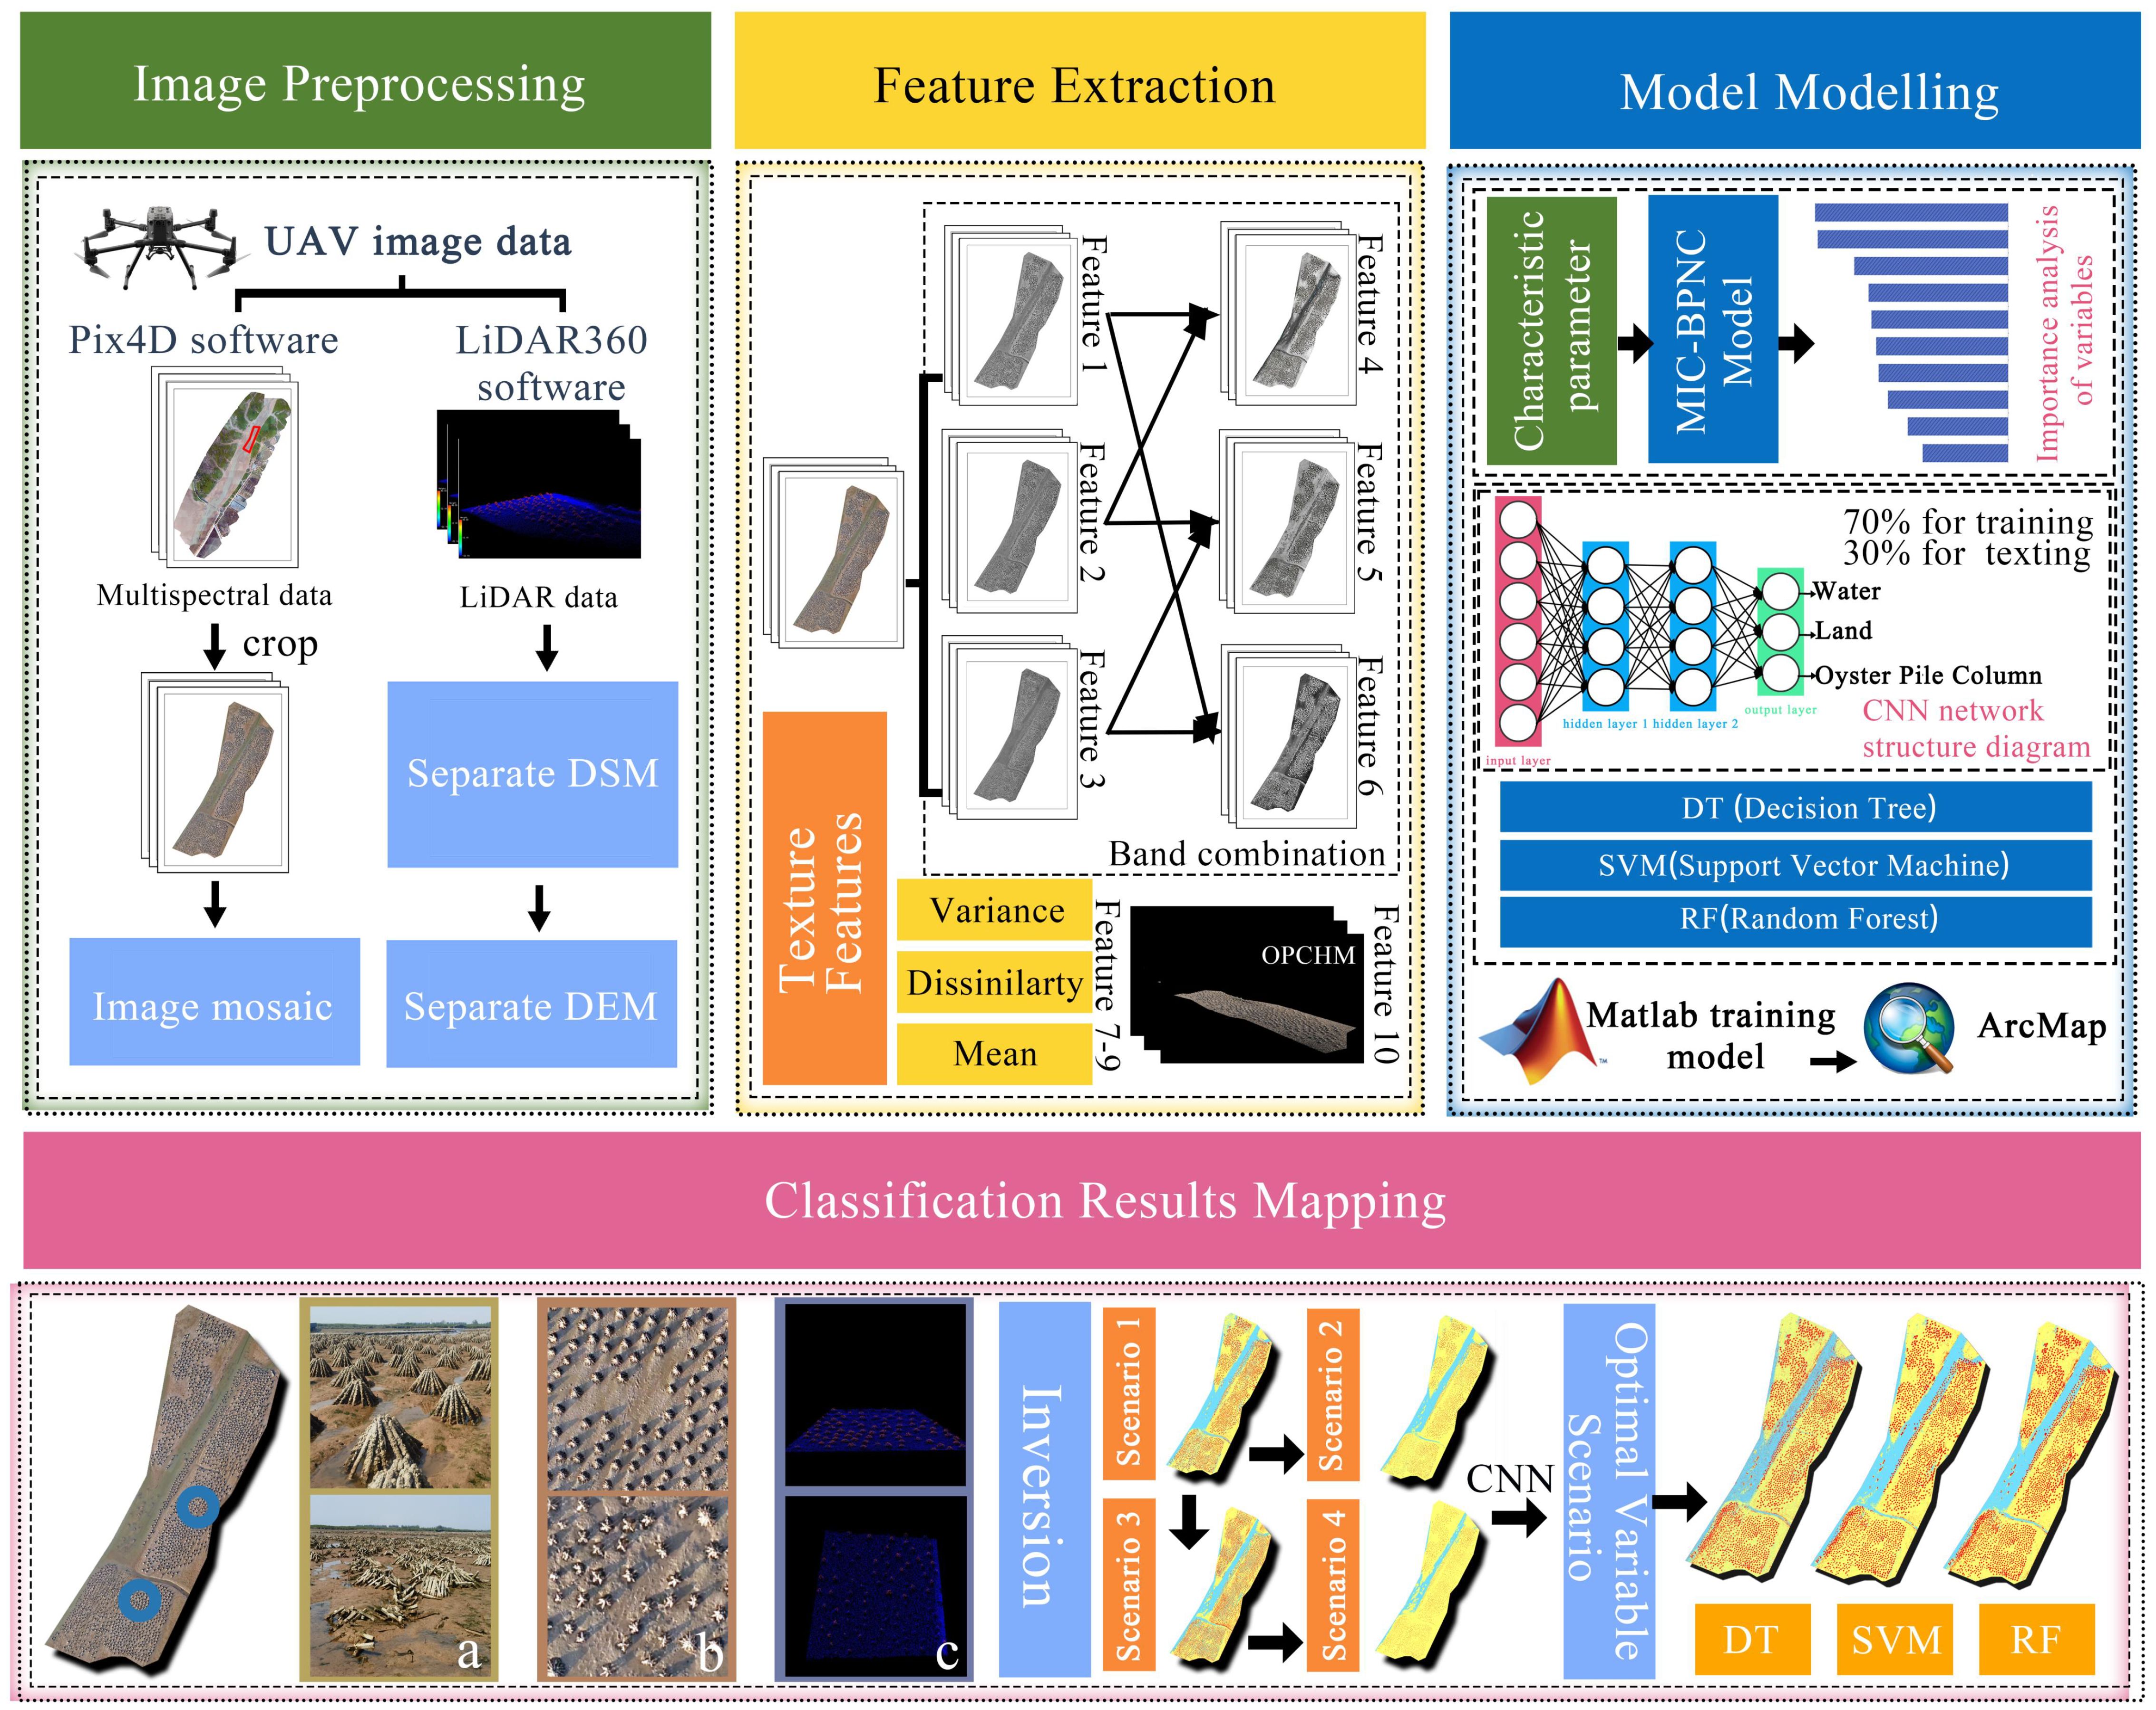
Figure 3. Flowchart of classification technology for oyster pile column farming areas based on unmanned aerial vehicle laser point cloud and deep learning algorithm.
2.5 Feature variable extraction
This study investigates the classification prediction accuracy under different variable scenarios by utilizing various variables for classification prediction. A classification prediction model for oyster pile columns is constructed using ENVI 5.3 and ArcGIS 10.7 software platforms, incorporating ten feature variables including three single band variables, three new combined band variables obtained through band calculation, three texture features extracted using the gray level covariance matrix (GLCM) method (Iqbal et al, 2021), and OPCHM data (Table 1), where the OPCHM was obtained by subtracting the DEM from the DSM of the laser point cloud. Specifically, scene S1 includes multispectral three single-band variables as well as the three combined band variables; scenario S2 and S3 add the three new combined-band variables respectively to scene S1 along with the texture features and OPCHM data; while scene S4 incorporates all ten variables as feature values for classification prediction. By comparing the classification prediction accuracies of these four-variable scenarios (S1-S4), optimal parameters for oyster pile column classification model are determined, along with an evaluation of the effects of single and fused features on oyster pile column classification. The results are presented in Table 2.
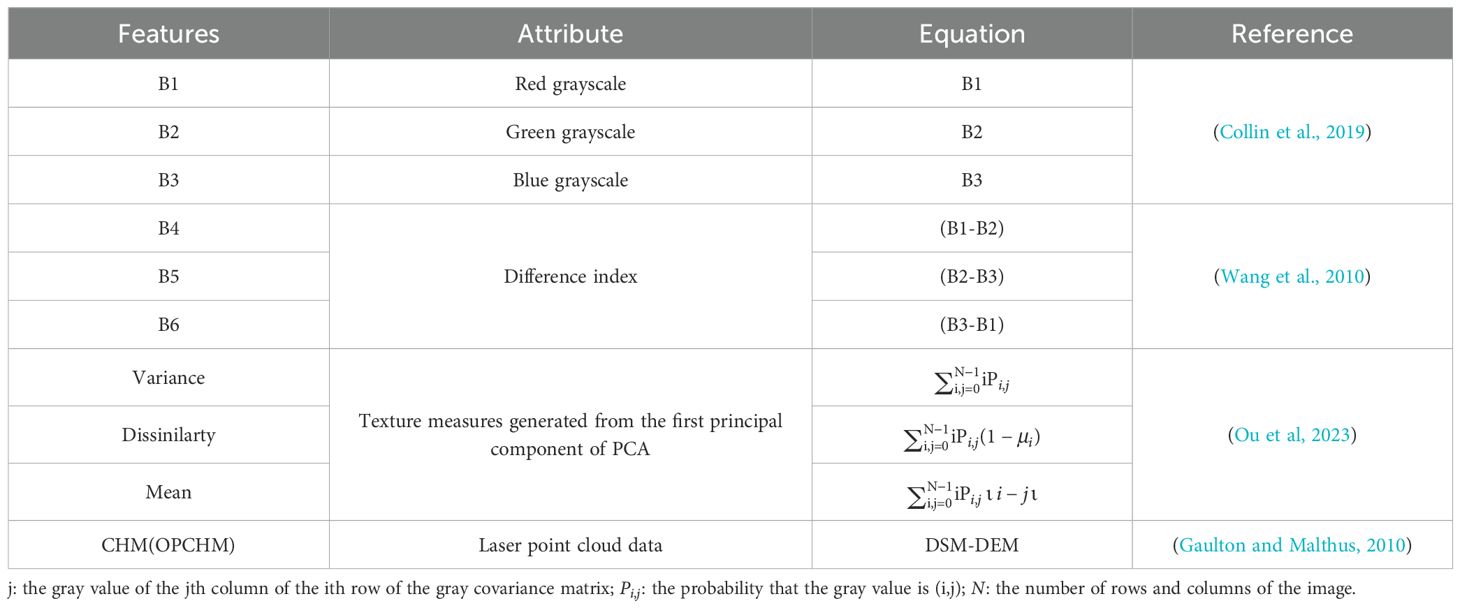
Table 1. Construction of feature dataset for classification model of oyster pile column culture areas.
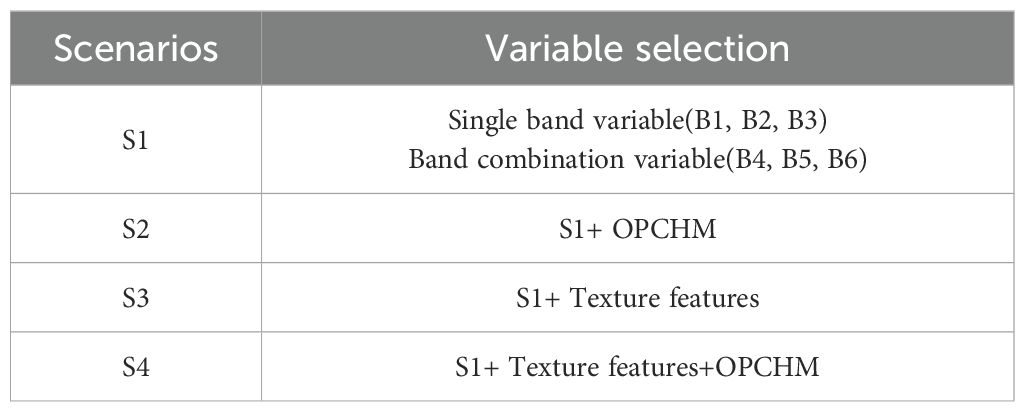
Table 2. Scenarios with different variables.
2.6 Maximum information coefficient
The Maximal Information Coefficient (MIC) was employed in this study. MIC partitioned the scatter plot of a variable pair (x, y) and utilized dynamic programming to calculate and search for the maximum mutual information value achieved under different segmentation methods. Subsequently, the maximum mutual information value was standardized to obtain MIC. With a range of [0, 1], MIC exhibits symmetry, universality, and fairness (Reshef et al, 2011). It discretizes the relationship between two variables in a two-dimensional space and represents it through a scatter plot. Specifically, the current two-dimensional space is divided into intervals along both x and y directions, followed by an examination of how current scatter points fall within each square to compute joint probability.
MIC calculation equation shows as follows (Li et al, 2019):
In the framework of supervised learning, the task of classification is to predict class labels that consist of unseen observations of a set of measured attributes or features based on the experience gathered through the learning process (Brankovic et al, 2017). In this study, the difficulty of finding joint probability in mutual information is solved. MIC is suitable for feature variable screening in data sets with large sample size, and output the importance ranking results of variable features, which can be used for the importance analysis of the feature variables of oyster pile columns. Matlab realizes multi-classification prediction model based on MIC-BPNC maximum trust coefficient feature selection algorithm combined with BP neural network to identify the importance of feature variables.
2.7 The selection of classification models
The Convolutional Neural Network (CNN) can be decomposed into an input layer, convolutional layers, fully connected layers, and an output layer. The multi-layer network architecture progressively integrates low-level image features through convolution operations to form high-level features. It extracts high-level semantic information from local details, facilitating a multi-layer transmission and gradual fusion process that connects feature extraction with classification recognition. Consequently, this enables the accomplishment of image recognition and classification tasks. The CNN network structure diagram is illustrated in Figure 4.
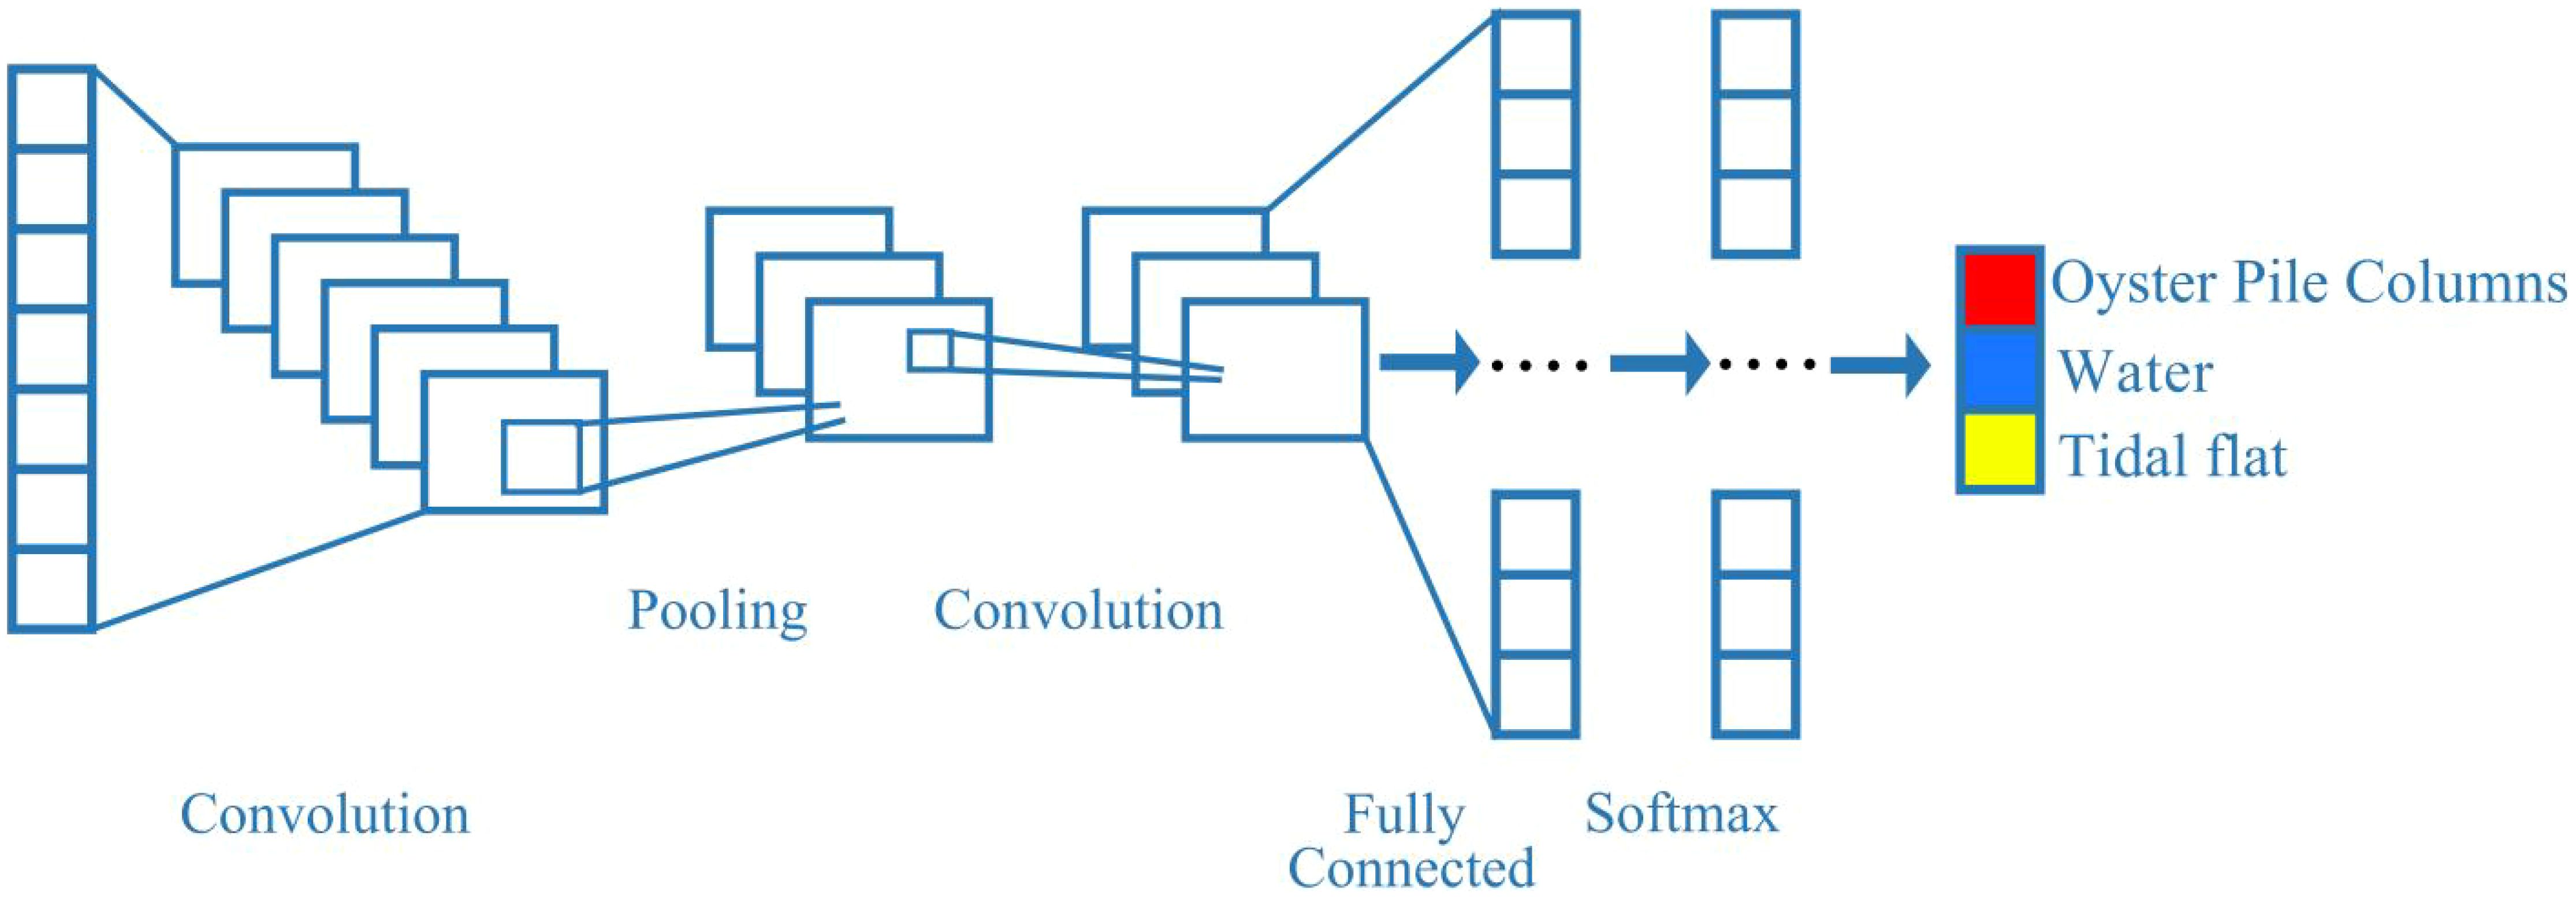
Figure 4. Diagram of CNN network structure.
Decision Tree (DT): The Decision Tree, a simple yet potent machine learning model, traces its origins back to 1966 when Earl Hunt and colleagues (Hunt et al, 1966) first proposed it. The Hunt algorithm serves as the bedrock for numerous decision tree algorithms, and in the 1980s, Quinlan introduced the ID3 algorithm. A Decision Tree recursively partitions the dataset into subsets until a predetermined stopping condition is satisfied. It is versatile, being applicable to both classification and regression tasks.
Support Vector Machine (SVM): Proposed by Vapnik et al (Cortes and Vapnik, 1995). in 1995, the Support Vector Machine (SVM) is grounded in statistical learning theory. Its objective is to identify a hyperplane that maximizes the margin between different classes. SVM excels in managing small sample sizes, non-linear, and high-dimensional pattern recognition problems. It also accommodates a certain level of misclassification to enhance generalization performance.
Random Forest (RF): Random Forest is an ensemble learning technique that stems from the random decision forests concept introduced by Tin Kam Ho (Ho, 1995) in 1995. This algorithm attains the final prediction by constructing multiple decision trees and averaging or voting on their outputs. Random Forest is extensively used in classification and regression problems and demonstrates robust performance in handling high-dimensional data and missing values.
2.8 Accuracy assessment
The confusion matrix is a widely utilized tool for assessing the performance of both traditional machine learning models and deep learning models, as it effectively illustrates the comparison between the model’s predicted classifications across various categories and the corresponding actual labels. To quantitatively assess the model’s performance, this study employs four metrics: Overall Accuracy (OA), User’s Accuracy for Evaluation (UA), Producer’s Accuracy (PA), and Kappa coefficient. The specific calculation equations are presented in Table 3. These evaluation criteria range from 0 to 1, with higher values indicating greater consistency in classification.
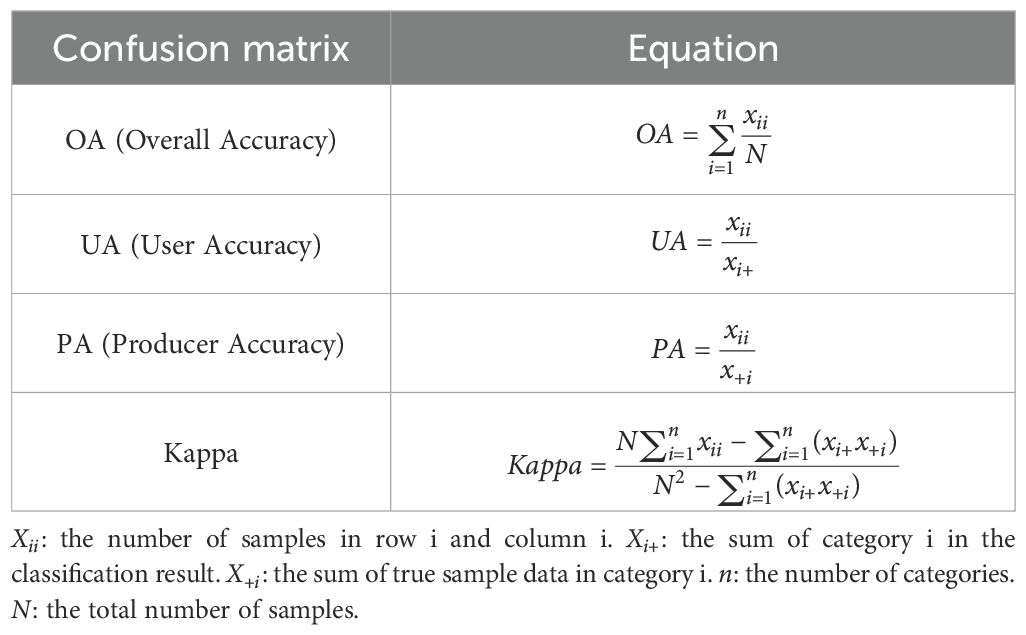
Table 3. Confusion matrix of overall accuracy, user accuracy, producer accuracy and kappa coefficient of the classification model for oyster pile column culture areas.
3 Results
3.1 Spatial distribution of oyster pile columns
The three-dimensional structure and spatial distribution of oyster pile columns can be observed through the LiDAR point cloud data obtained by UAV (Figure 5). Figure 5A1 represents the orthorectified image collected by UAV. In the red area, the shore side is designated as a mangrove protection area, while in the middle part of this region, a natural tidal trench forms during low tide. The study area exhibits higher terrain on both sides with lower elevation in its central portion. For this research, a section with relatively dense oyster pile columns was selected as the focal area (Figure 5A2). Subsequently, specific portions of LiDAR point cloud data were analyzed (Figure 5B), revealing profiles under RGB (Figure 5C1) and elevation (Figure 5C2) display for this particular region. It is evident that oyster pile columns are predominantly distributed between tidal gullies and mangroves; partial profiles of oyster pile column point cloud data are depicted in Figure 5D and Figure 5E respectively. Notably, these profiles demonstrate that the maximum height of an oyster pile column reaches 1.2m; however, at lower-middle elevations within this area exists a tidal trench formed by receding water during ebb tide conditions where some oyster piles near it remain partially submerged over extended periods potentially leading to their collapse due to high flow velocities.
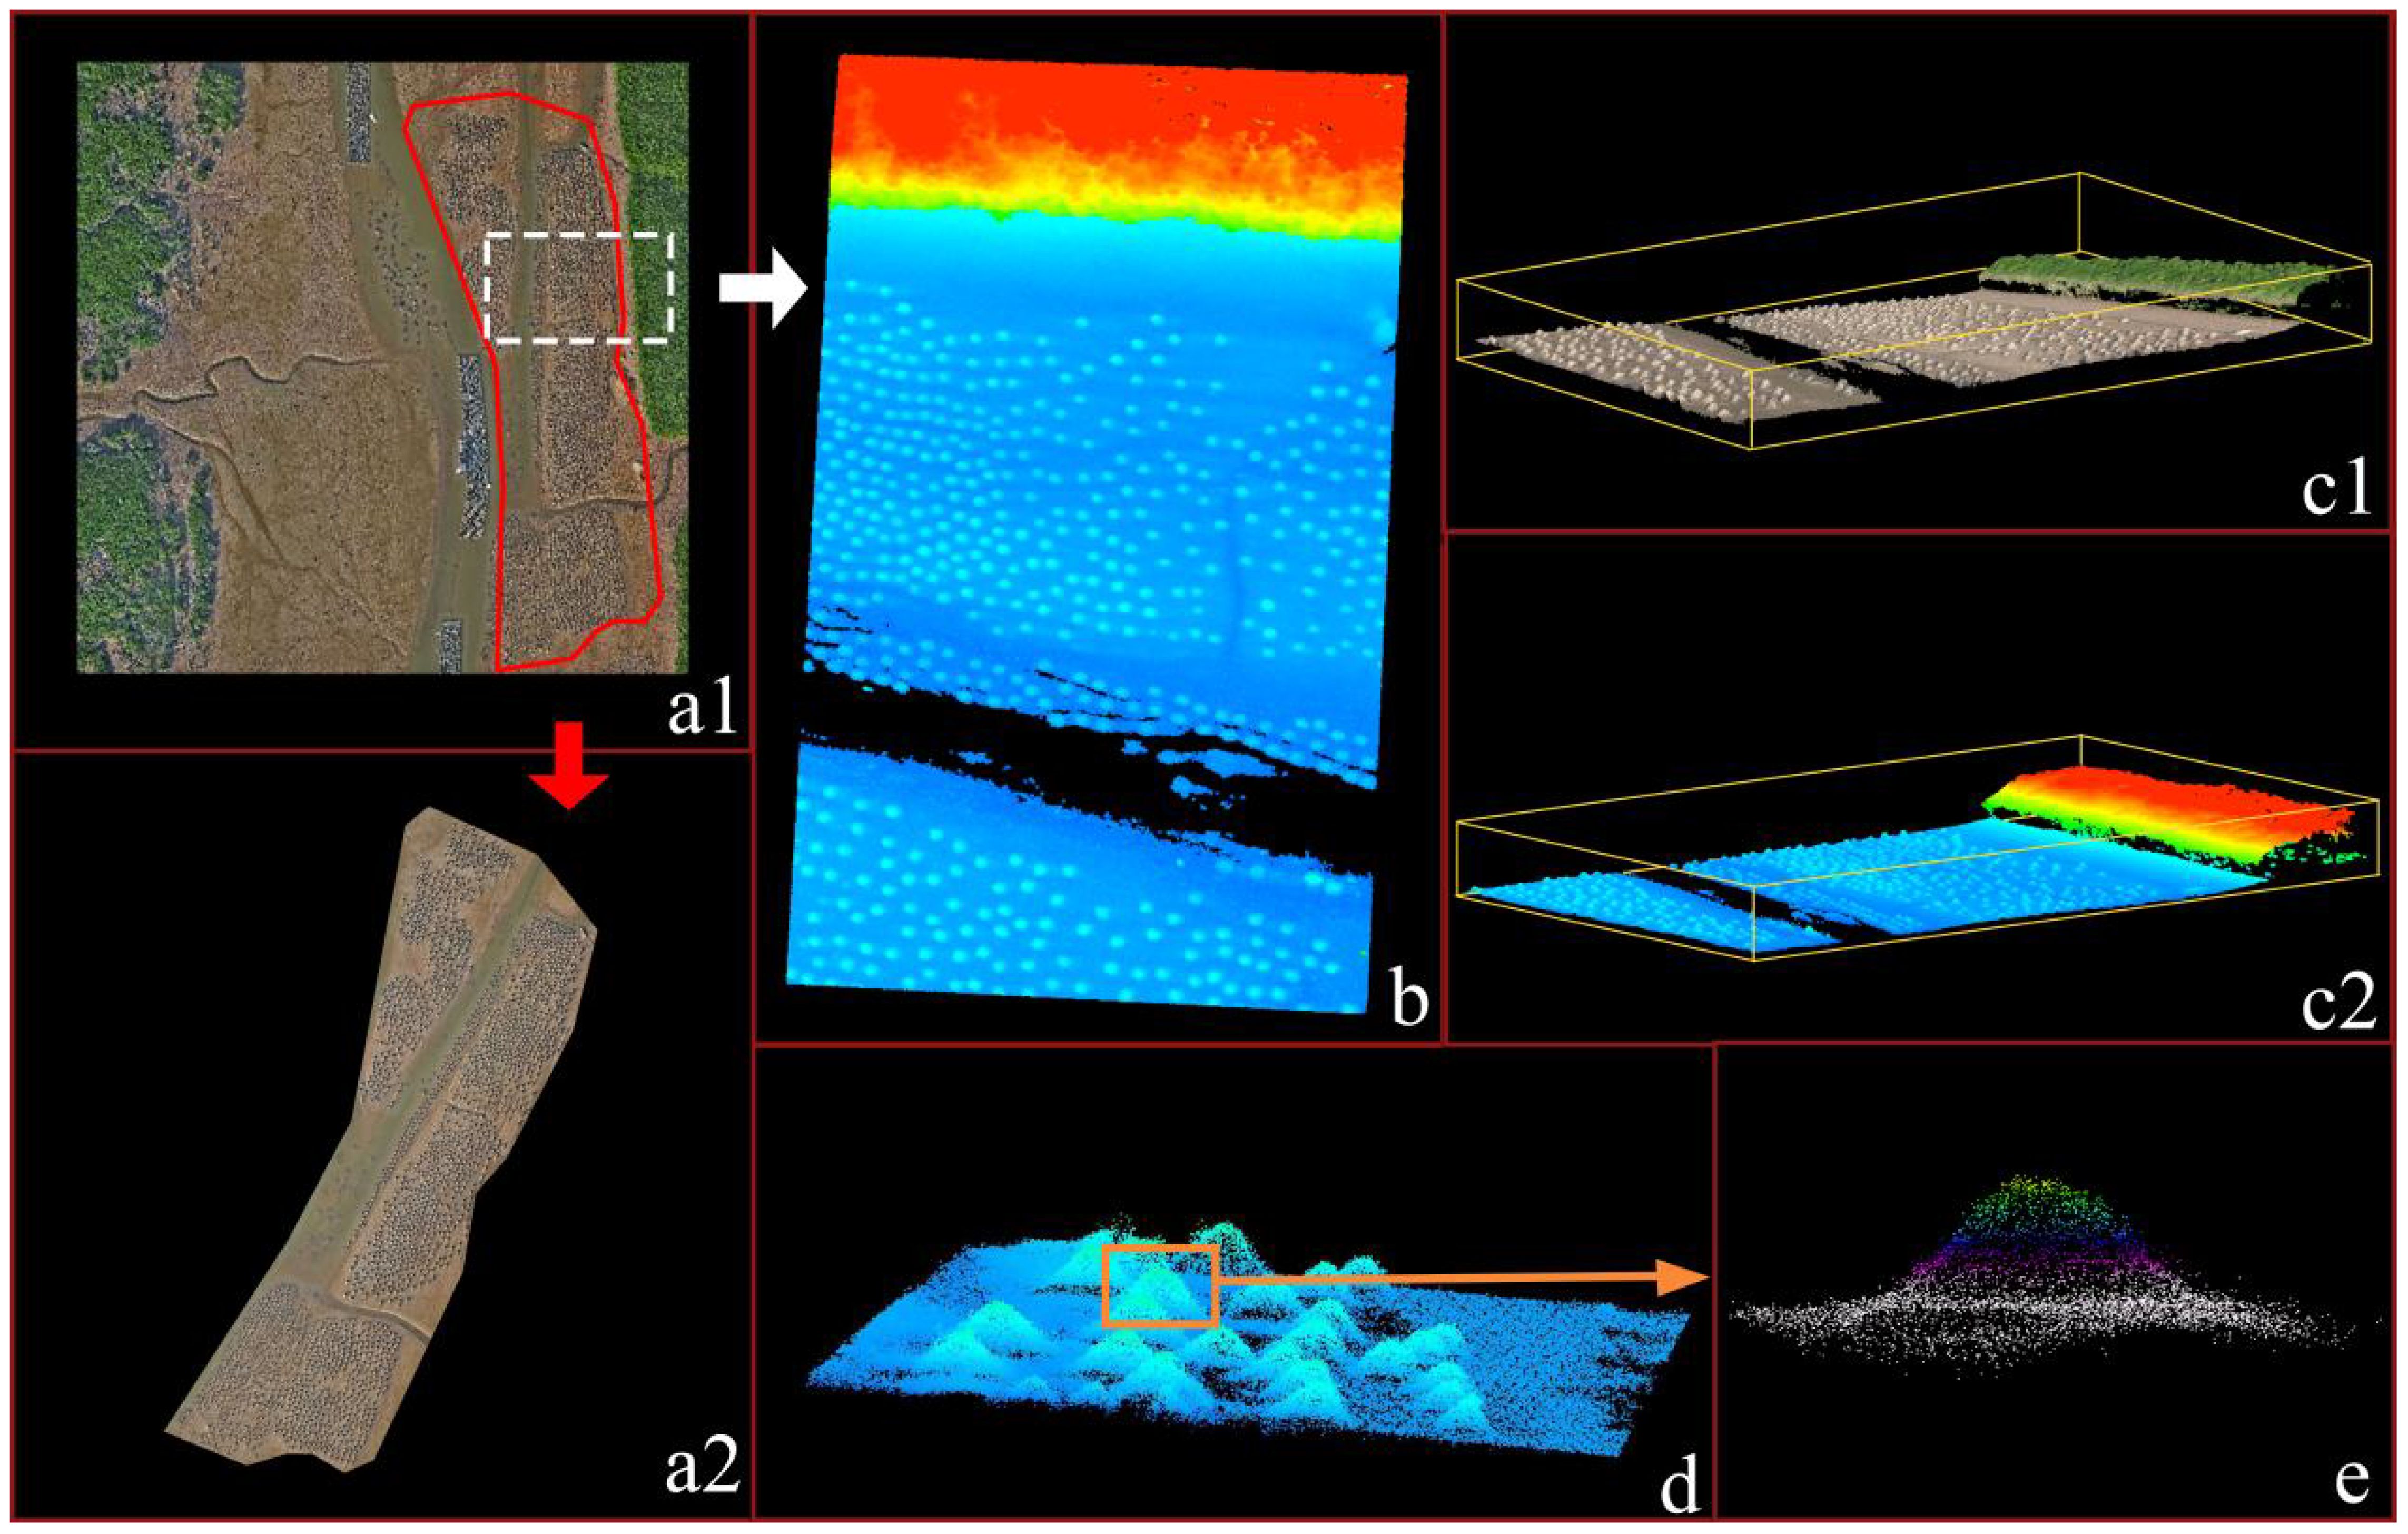
Figure 5. (A1) UAV-acquired orthophoto. (A2) Cropped orthophoto of the study area. (B) UAV-acquired LiDAR point cloud data. (C1) Laser point cloud RGB profile. (C2) Laser point cloud elevation profile. (D) Localized oyster pile column point cloud data features. (E) Individual oyster pile column point cloud profile image.
The LiDAR point cloud data acquired by the UAV (Figure 5) enables the observation of the three-dimensional structure and spatial distribution of oyster pile columns. Figure 5A1 presents an orthophoto image collected by the UAV, where the red area along the shore represents a mangrove reserve. In this area, a natural tidal trench forms during low tide, while the topography exhibits two high sides and a low middle section. For this study, a portion with relatively dense oyster piles was selected as the study area (Figure 5A2). Analyzing part of the LiDAR point cloud data in Figure 5B reveals that most oyster pile columns are distributed between the tidal ditch and mangrove forests. Additionally, Figure 5D, E display profiles of local oyster pile column point cloud data and individual oyster pile column points respectively, indicating that their maximum elevation reaches 1.2 m. However, it should be noted that within this region there exists a lower elevation tidal channel formed during ebb tide periods which causes some oyster pile columns to remain partially submerged for extended durations under high current speeds; consequently, increasing their susceptibility to collapse.
3.2 Analysis of the importance of variables
In this study, all 10 variables were incorporated into the MIC-BPNC model to assess the importance of classification features in oyster pile columns. The results are depicted in Figure 6. Regarding the inversion model for classifying oyster pile columns, the contribution ranking reveals that texture features such as Variance and Dissimilarity hold primary significance, followed by single band B2 and band combination variable B4. Additionally, variable OPCHM is ranked fifth. Considering the findings presented in Table 2 these outcomes suggest that incorporating texture features alongside band feature variables and OPCHM significantly influences the classification process.
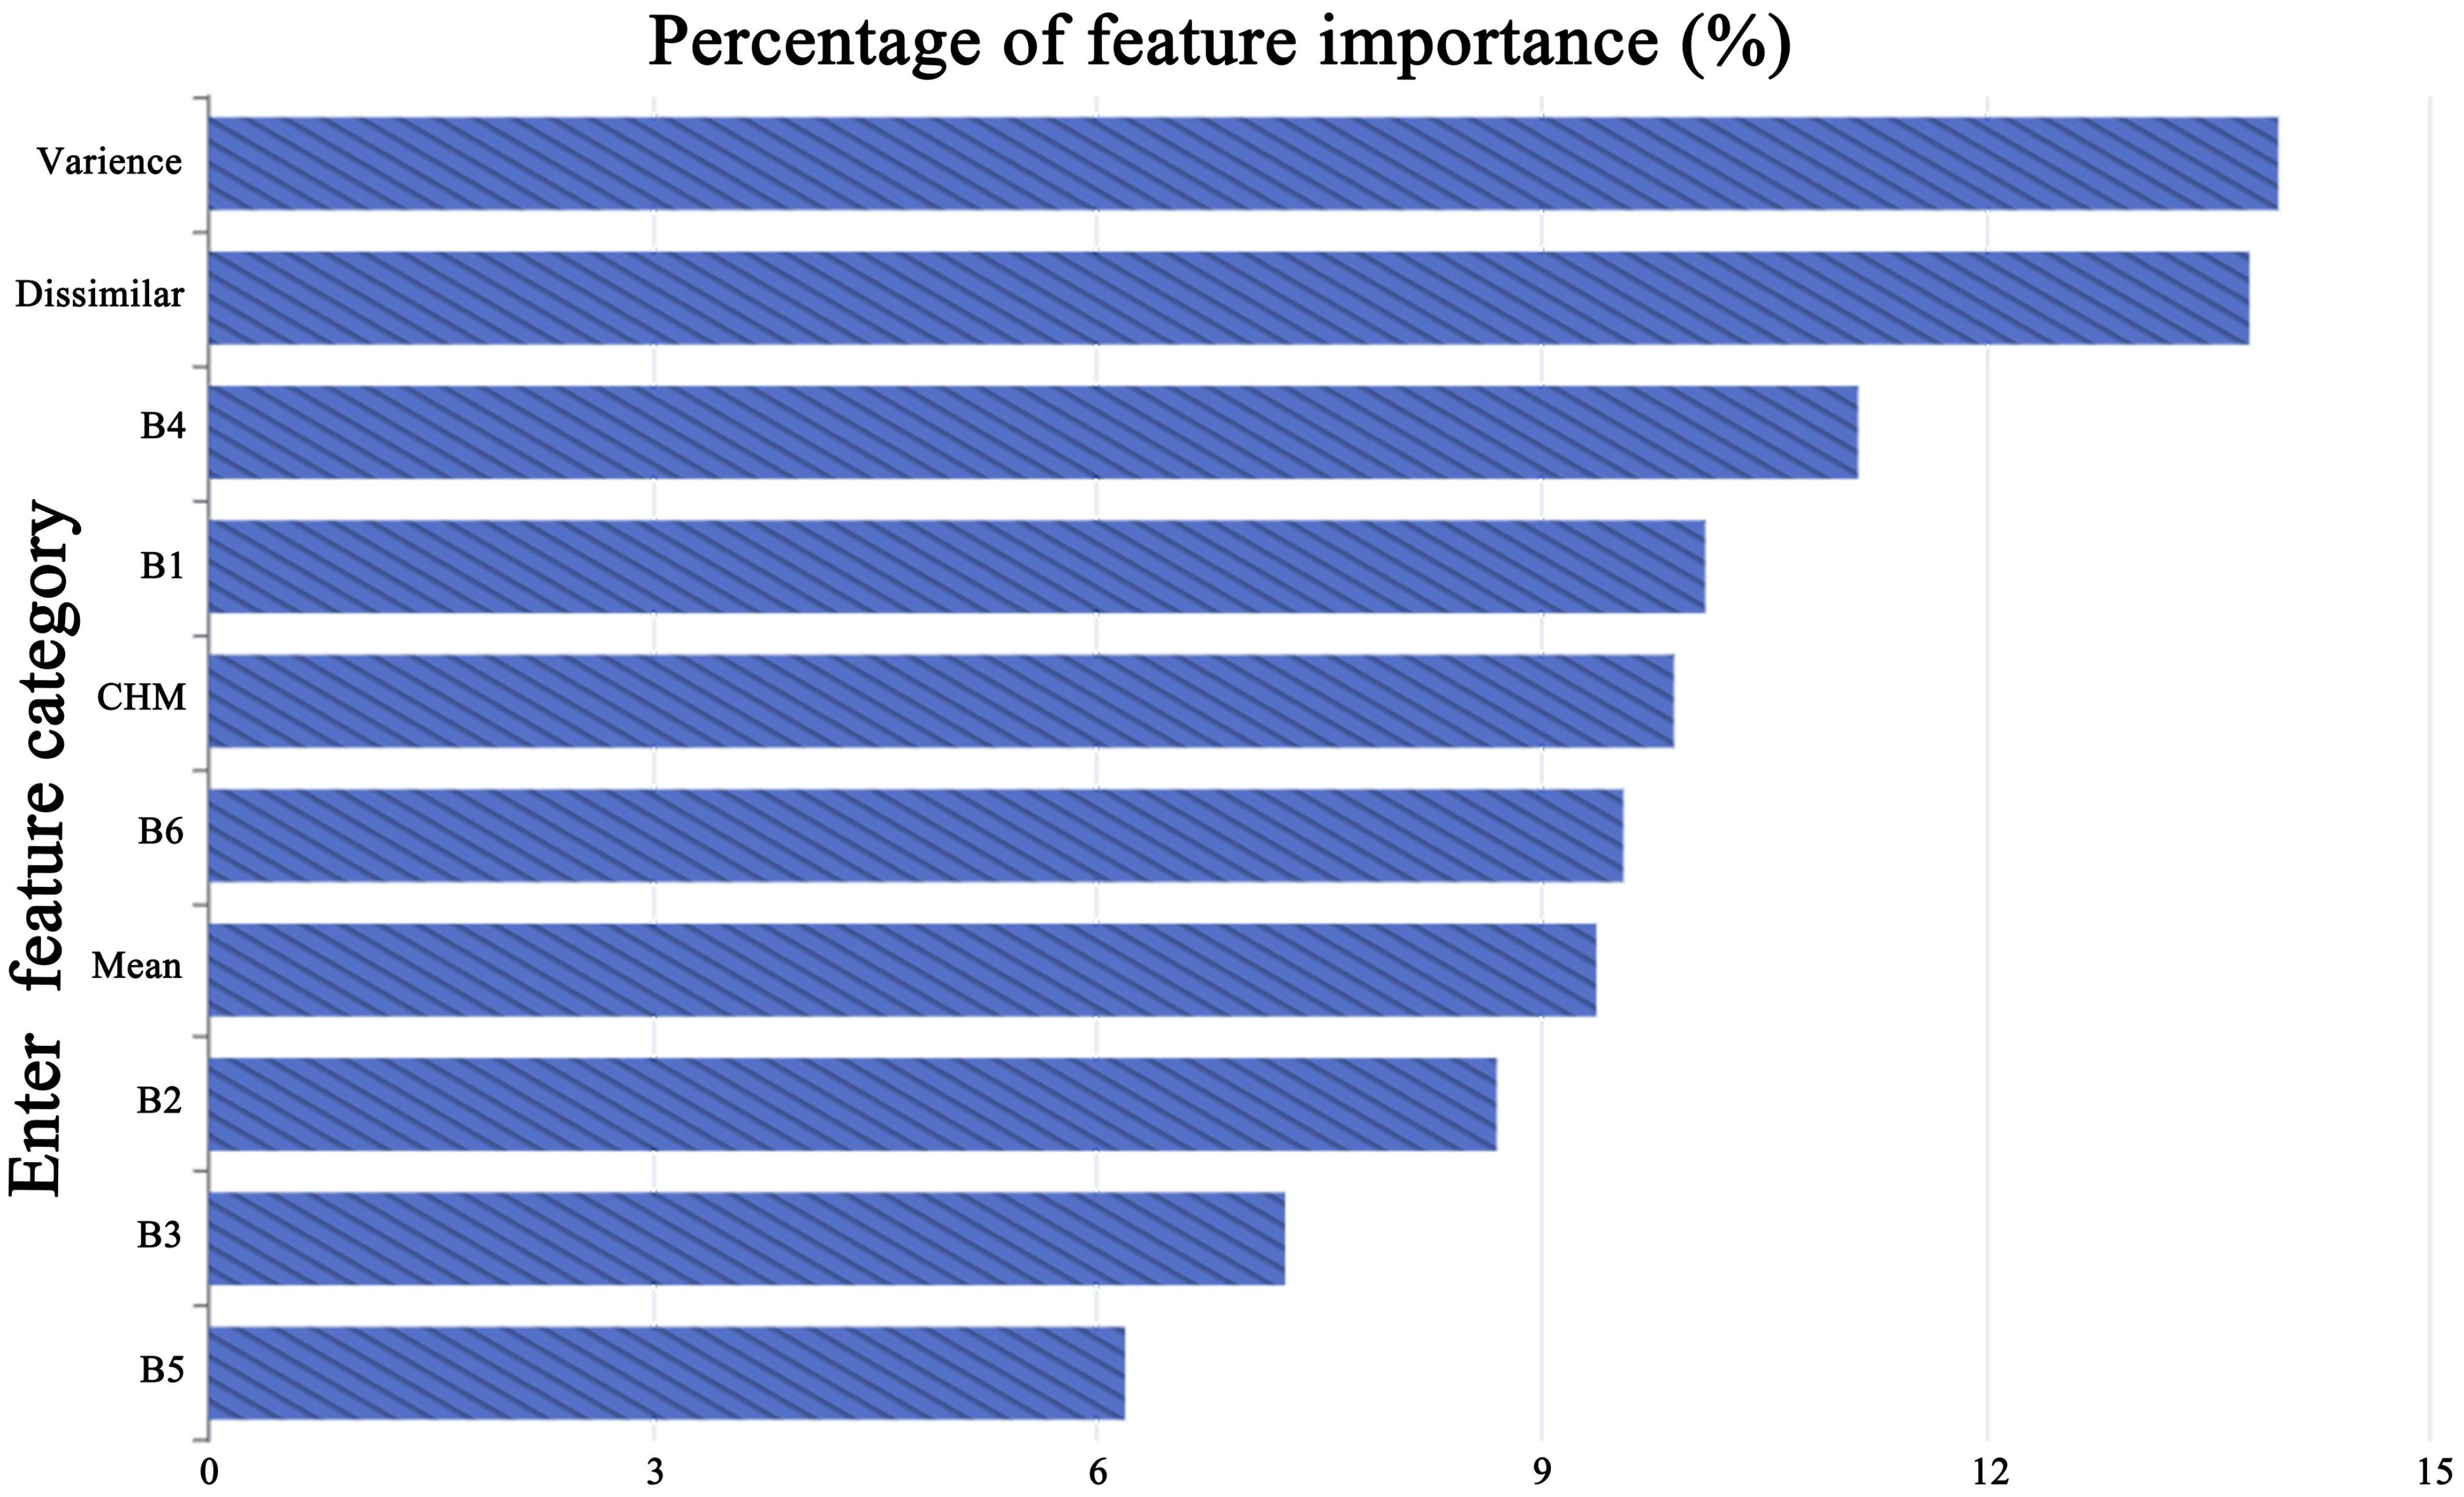
Figure 6. Importance ranking of all feature variables in the MIC model.
3.3 Evaluation of classification accuracy based on multi-feature variable scenarios
According to the results obtained from the CNN algorithm, Figure 7 presents the accuracy verification results of the confusion matrix model evaluated by test samples after comparing four variable scenarios (Table 2). The overall accuracy (OA) and Kappa Coefficient (KC) values are shown in Figure 8. Among the four feature variable scenarios investigated in this study, multi-feature fusion variable scenario S4 exhibited the highest overall accuracy (OA=96.54%, KC=95.93%), surpassing S1’s OA and KC by 6.24% and 7.44% respectively. In Figure 8, scene S2 demonstrated similar OA and KC values with a negligible difference of only 0.09 between them. Consequently, it can be concluded that there is a positive correlation between overall accuracy and Kappa coefficient for all feature scenario examined, with their ranking being as follows: S4 > S3 > S2 > S1.
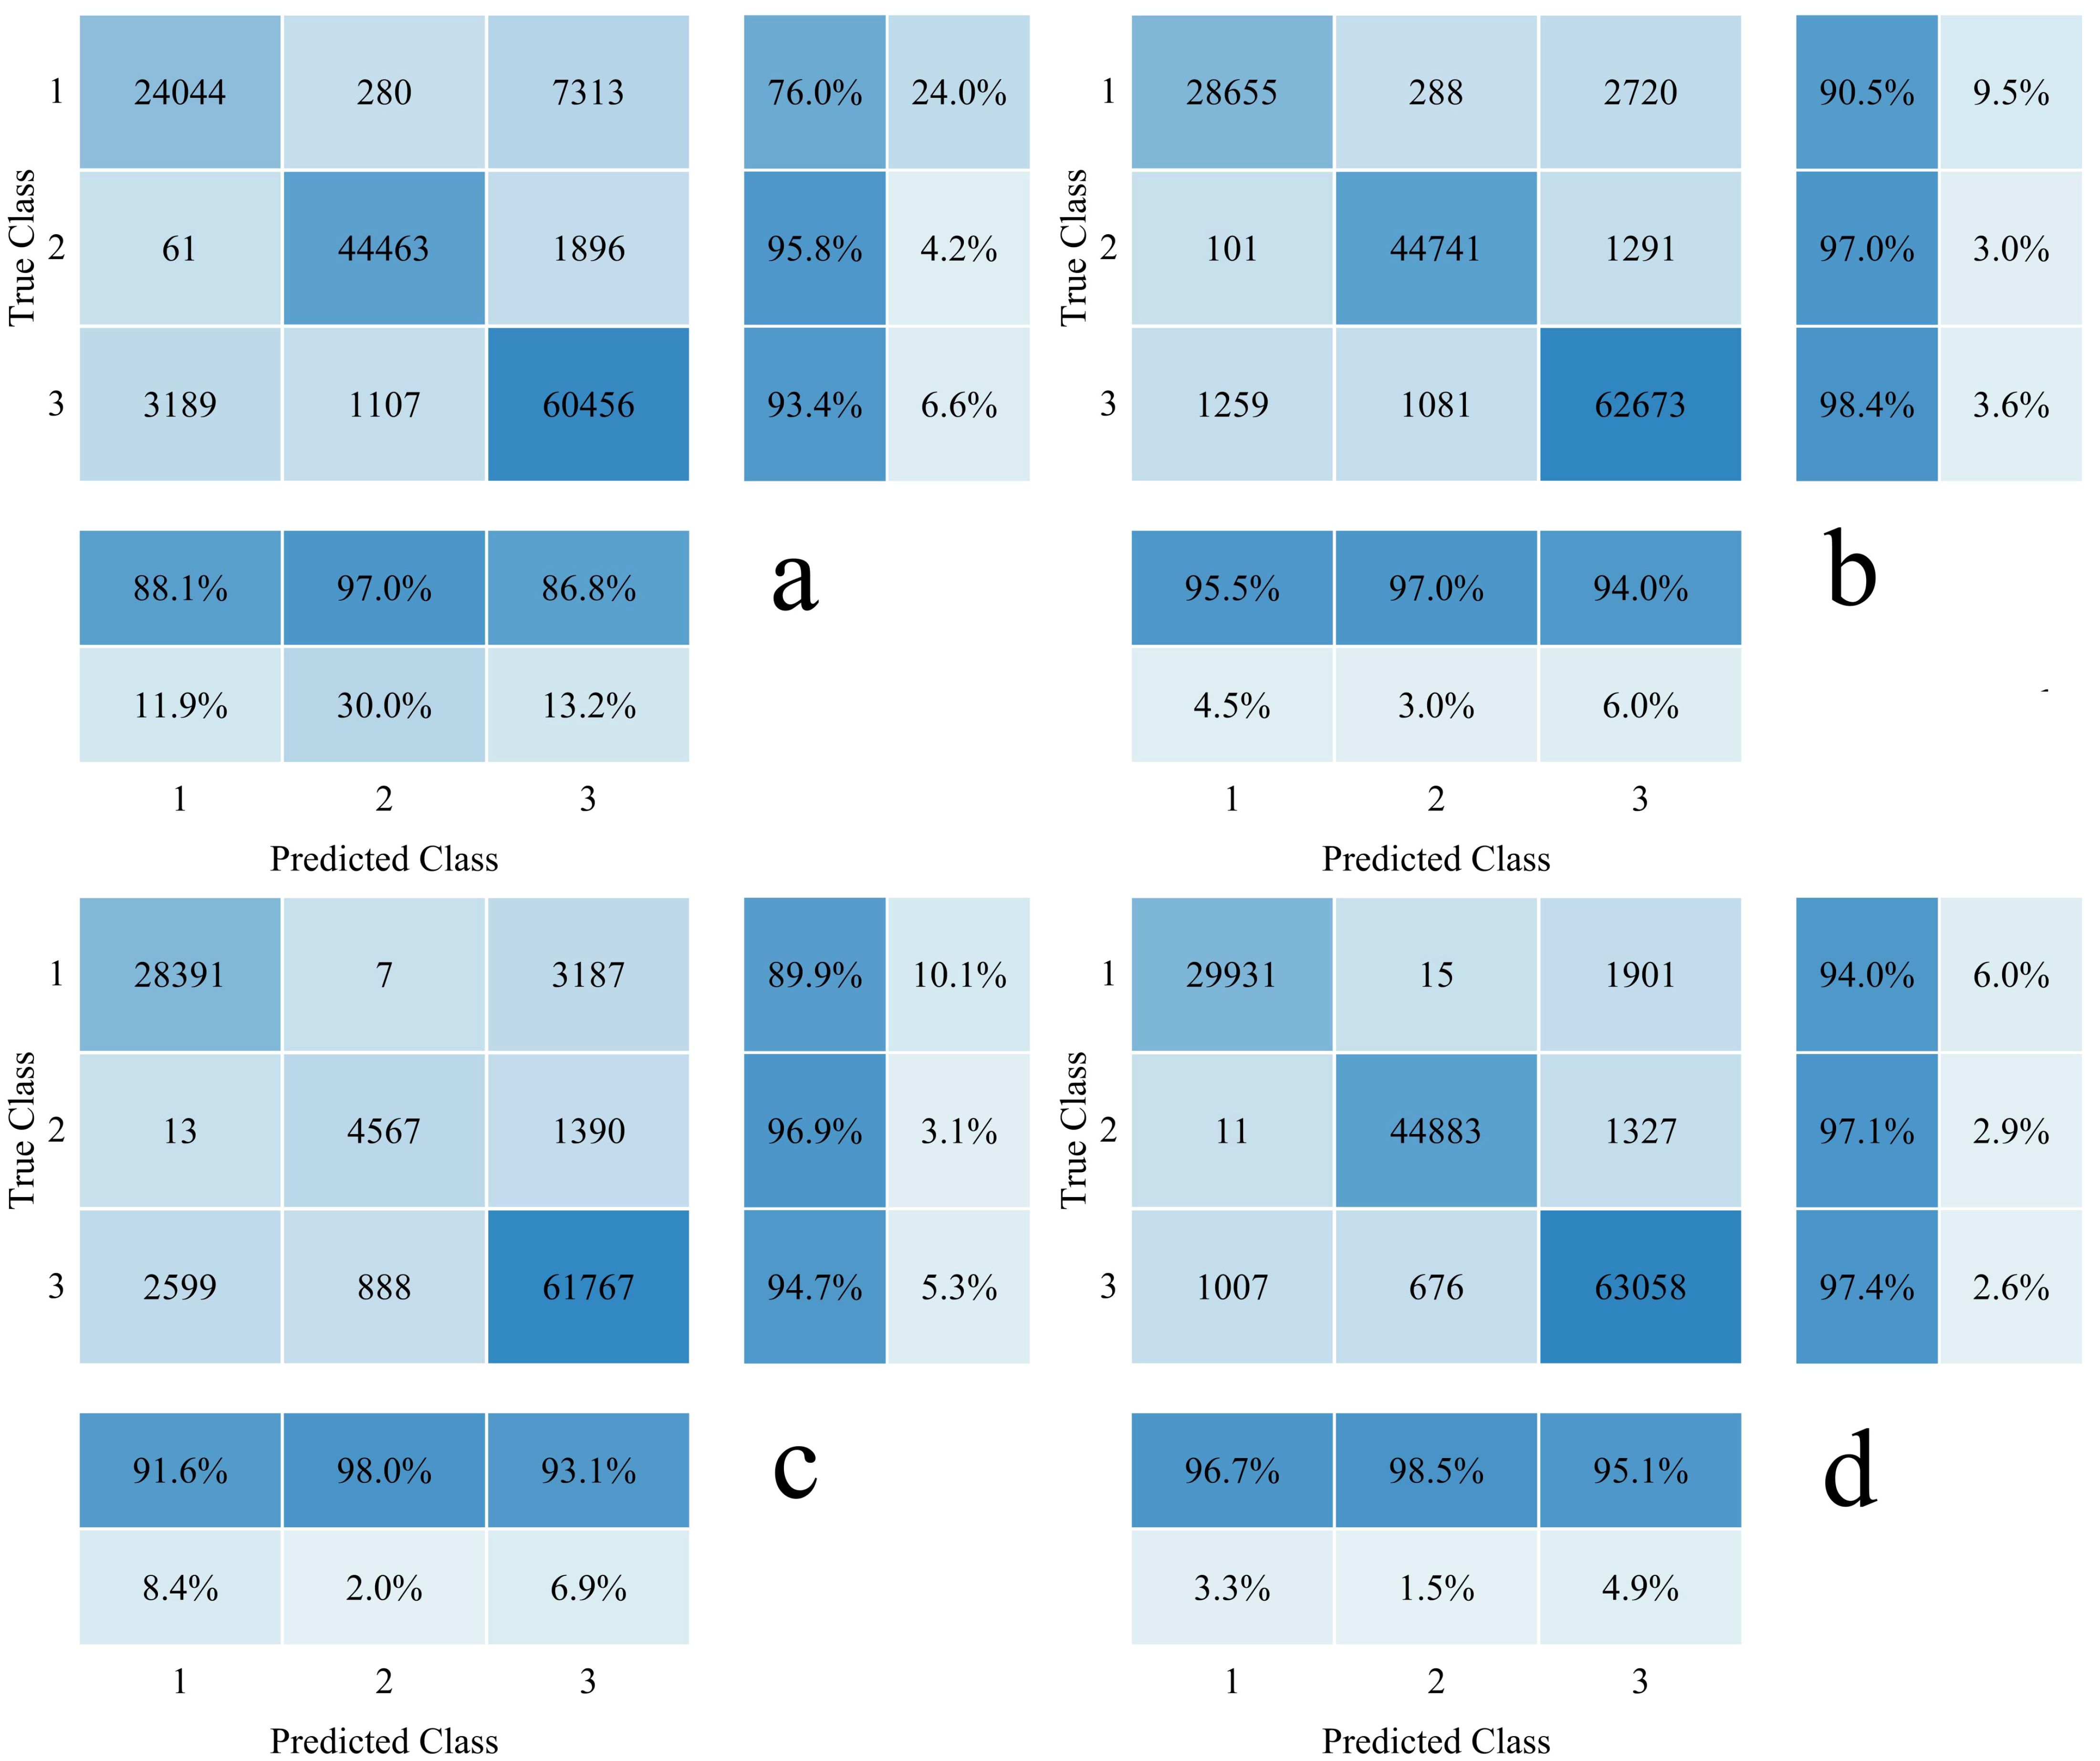
Figure 7. Confusion matrices of different scenario (A) S1 variable scenario;(B) S2 variable scenario;(C) S3 variable scenario; (D) S4 variable scenario.
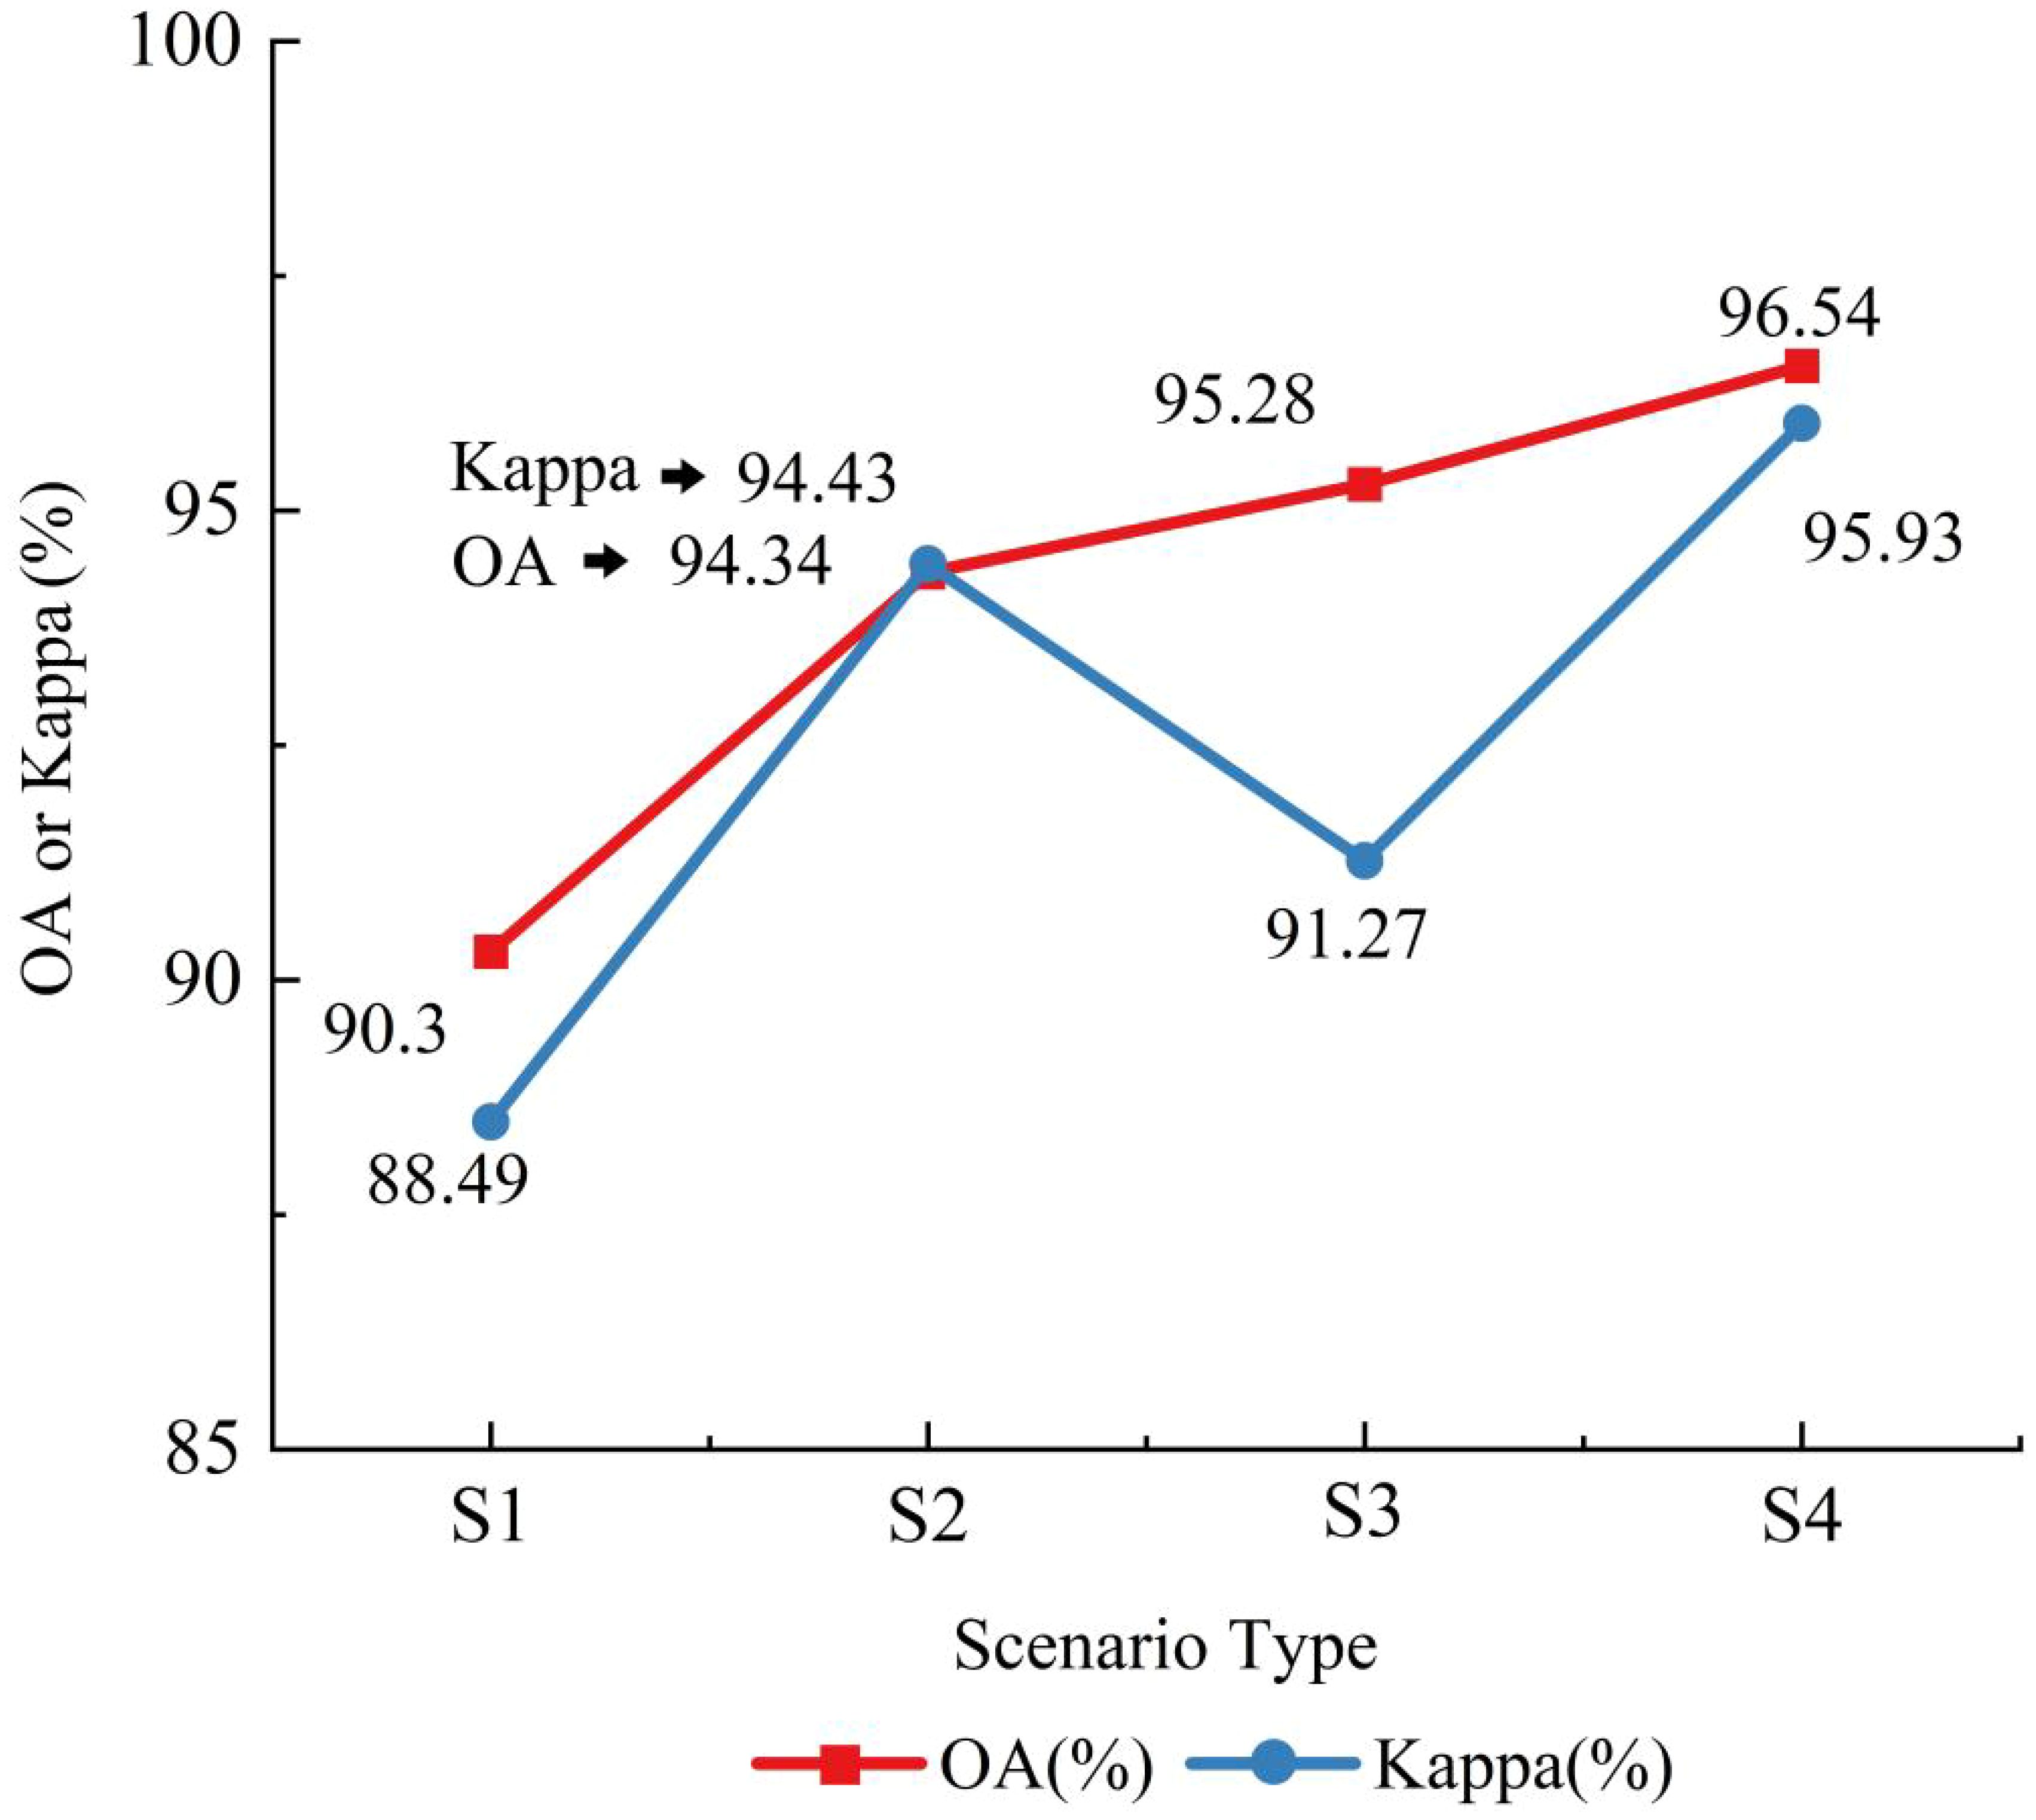
Figure 8. Overall accuracy and Kappa coefficients of models for scenario S1-S4.
The user accuracy and producer accuracy of the classification results were determined using the confusion matrix (Table 4). In Figure 7A, although the model trained solely on single band and band combination variables achieved an overall accuracy of 90.3% as characteristic values, Table 4 reveals that the user accuracy for the oyster pile column was only 76%. By incorporating three texture features based on S1, however, S2 exhibited an improved overall accuracy of 94.34%, with a corresponding producer accuracy and user accuracy of 95.5% and 90.5% respectively for the oyster pile column (Figure 7C). Furthermore, when OPCHM features were added to single band and single band combination variable features in Figure 7C, the overall accuracy also reached 95.28%, accompanied by a producer accuracy and user accuracy of 91.6% and 89.9% respectively for the oyster pile column.
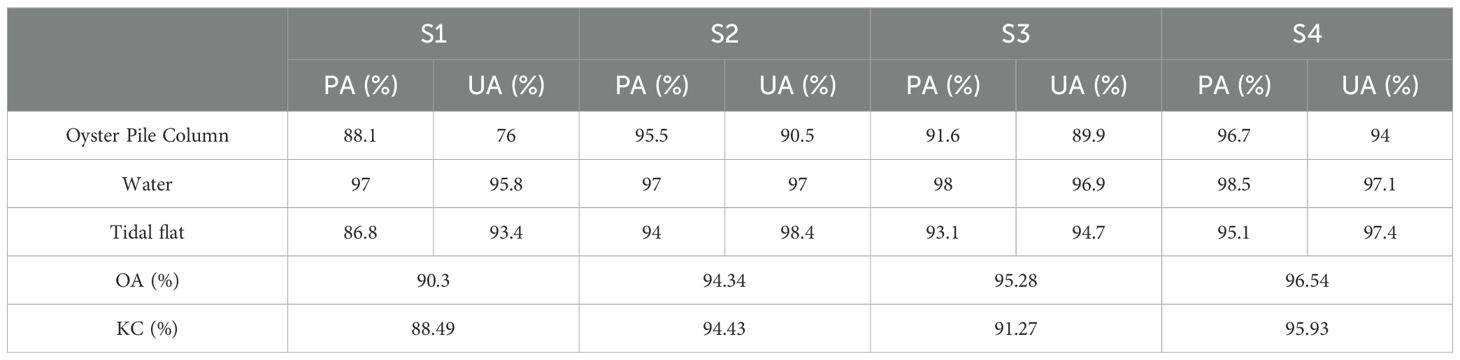
Table 4. The verification results of the classification accuracy of the CNN model for the S1-S4 variable scenarios.
In this study, all ten feature values were incorporated into the model as depicted in Figure 7D. In the S4 scene, OPCHM features were added based on S3, resulting in improved accuracy of extracting three distinct ground object features due to the inclusion of elevation data at various points. The classification accuracy and Kappa coefficient for oyster pile column reached their highest levels at 96.54% and 95.93 respectively, while producer accuracy and user accuracy both achieved 96.7% and 94%, as presented in Table 4, further validating our conclusions.
3.4 Visualization classification results of scenario with diverse characteristics
Based on the classification results of the multi-spectral orthophoto image acquired from UAV (Figure 9), we visualized the classification outcomes for four different scenes (Figure 10). Upon examining the locally enlarged map of classification results (Figure 11), it is evident that while oyster pile columns were accurately classified in scene S1, a portion of tidal flat was misclassified as oyster pile columns and tidal flats due to complex geomorphologic features present in the intertidal zone, such as numerous sunken gullies and similar multispectral colors shared by oyster pile columns and tidal flats. In scene S2, OPCHM features were incorporated based on S1 scene, effectively mitigating misclassification issues. Furthermore, considering the verification results of CNN model presented in Table 4, overall accuracy improved by 4.04%. To enhance the model’s ability to classify image details, three texture features were added in S3 scene building upon S1 scene. As depicted in Figure 11, the S3 scene exhibits superior classification efficacy in distinguishing between water and tidal flats, effectively demarcating their boundary. In conjunction with the confusion matrix presented in Figure 7, the incorporation of three texture features based on scene S1 significantly enhances the accuracy of oyster column classification. However, there remains an issue where shadows cast by oyster pile columns are misclassified as tidal areas. To address this concern, we introduce OPCHM features to the S4 scenario. Comparative analysis among all four scenario reveals that the S4 scene adeptly captures three distinct classification characteristics while enabling clearer and more intuitive observation of oyster pile column distribution. Moreover, it yields an overall accuracy of 96.54% (as shown in Table 4). The inclusion of OPCHM derived from LiDAR data effectively resolves classification confusion arising from different features. Although OPCHM aids in retrieving spatial information regarding oyster seedling culture distribution within intertidal zones, complete classification of oyster pile columns is yet to be achieved. Consequently, further investigation into the potential application of UAV multi-spectral data combined with deep learning algorithms for extracting oyster pile columns will be pursued.
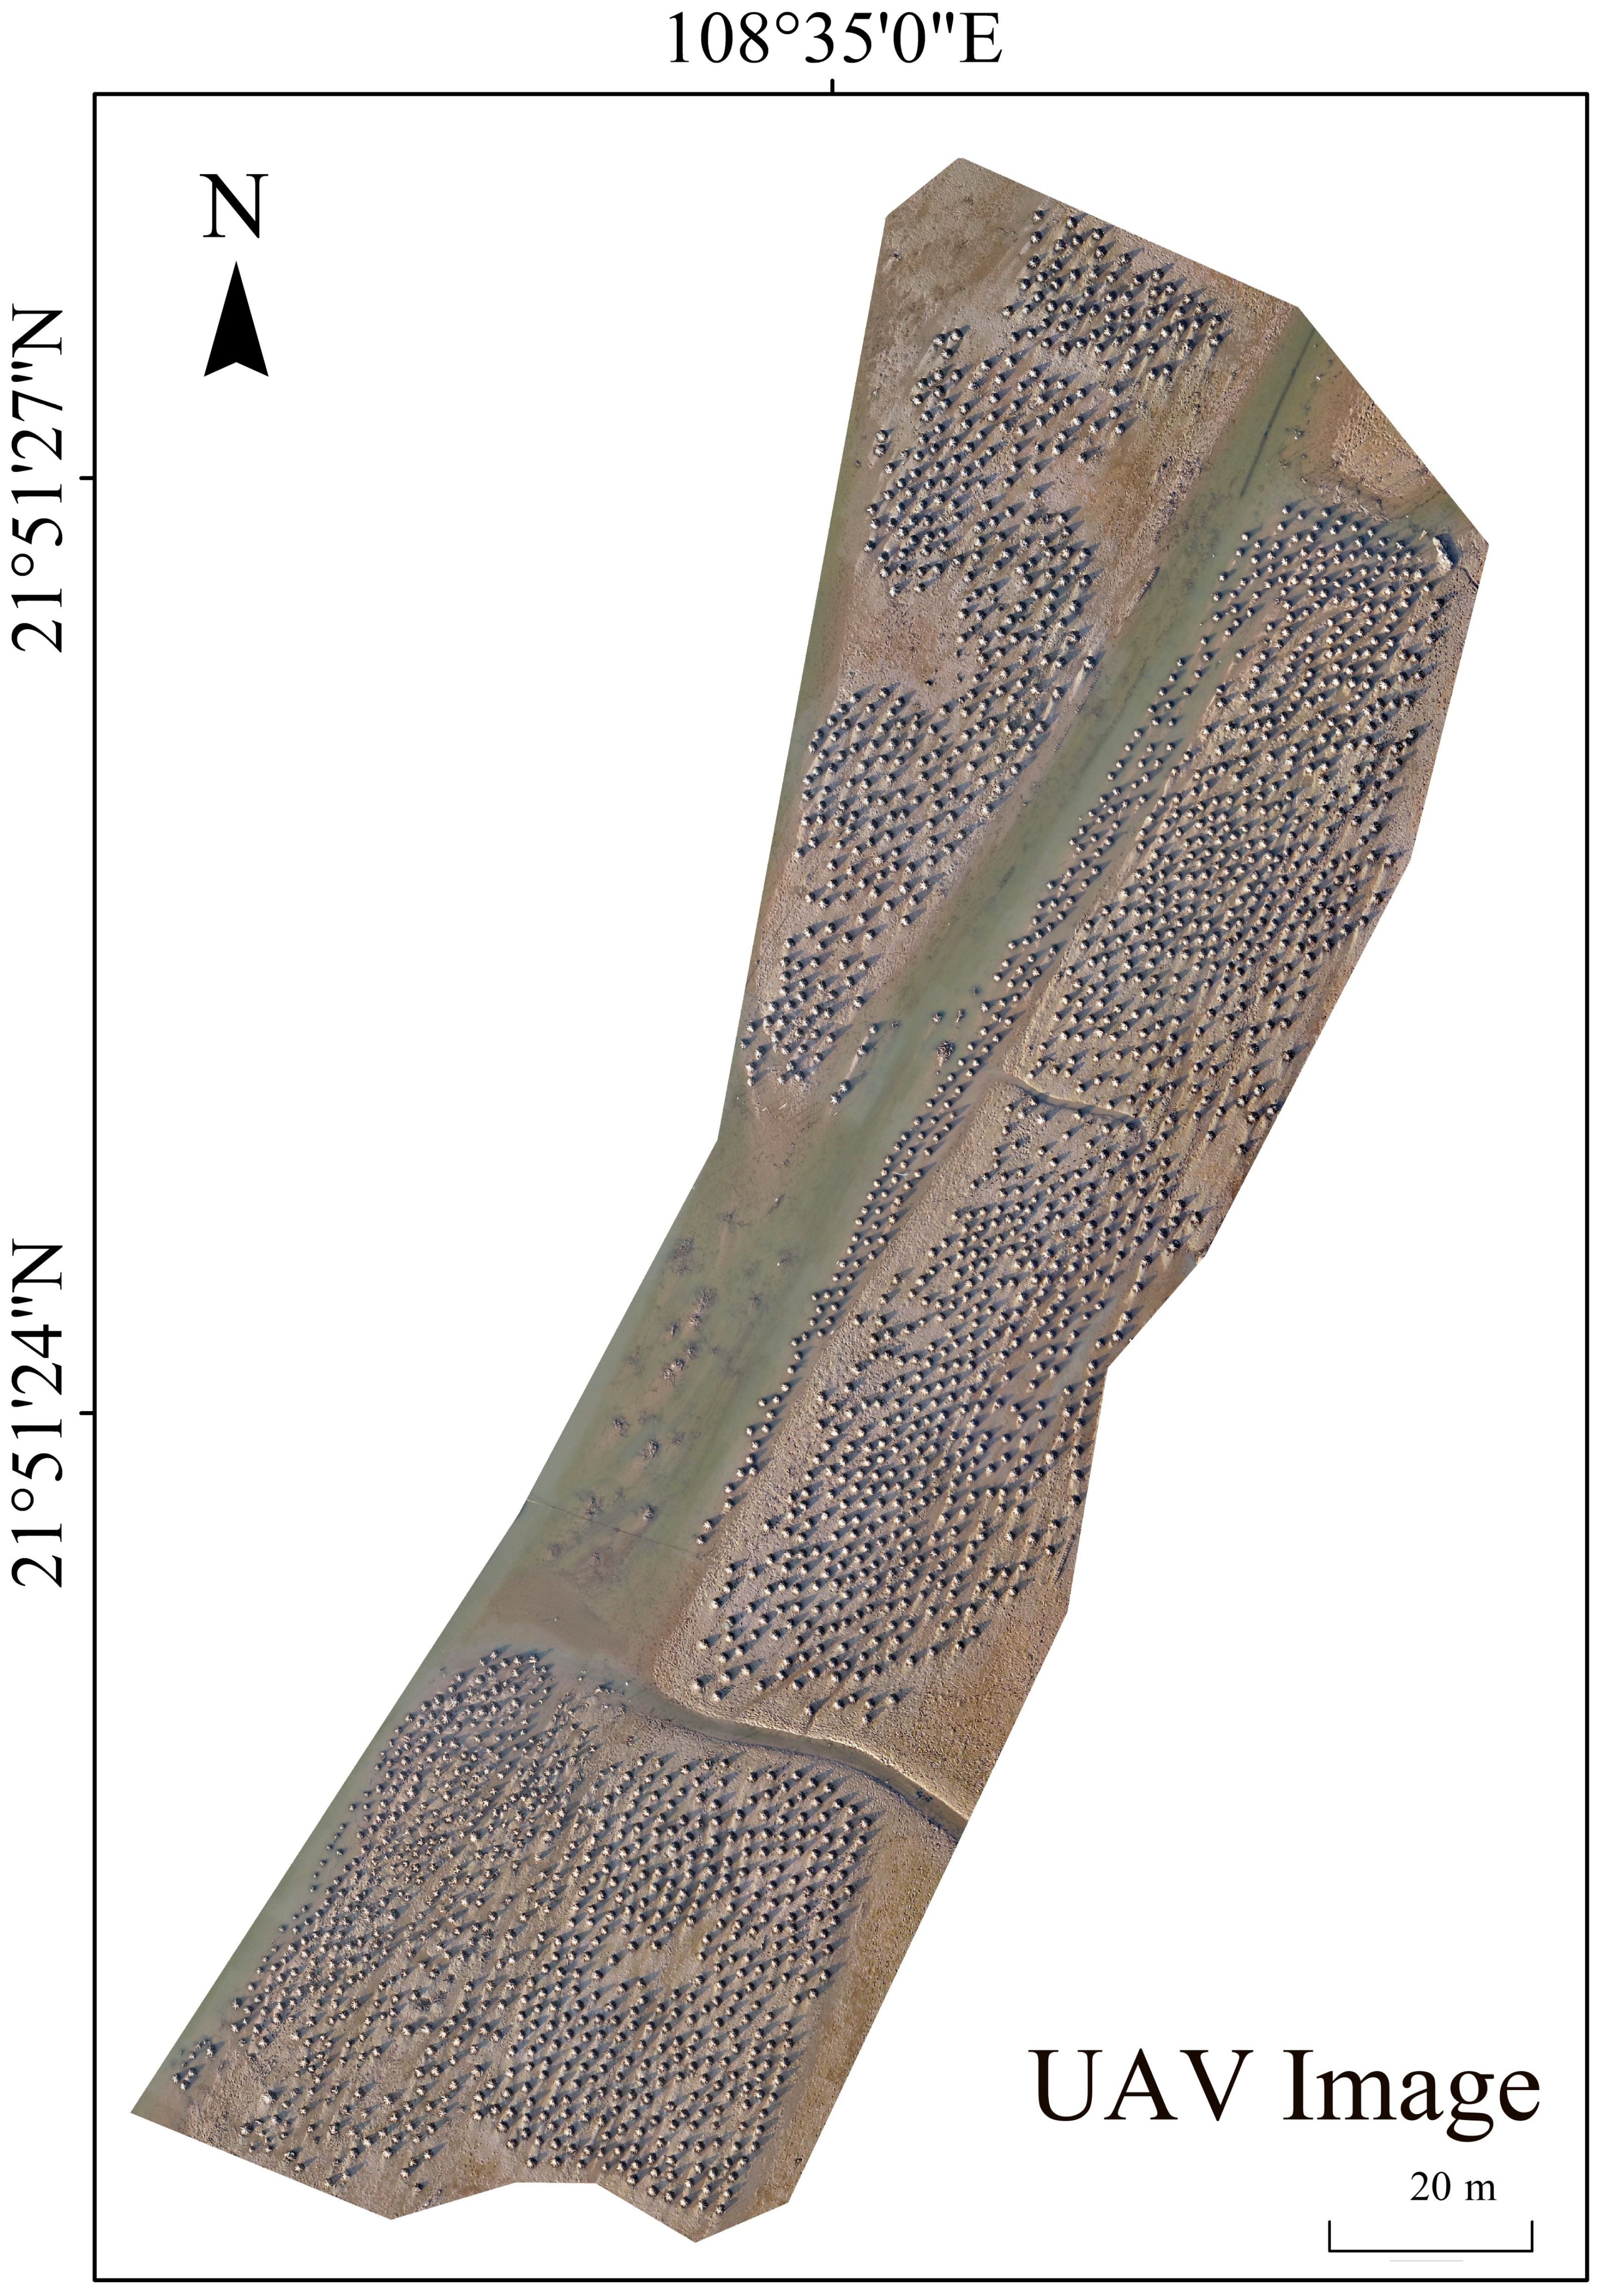
Figure 9. UAV multispectral images of the oyster pile column culture area.
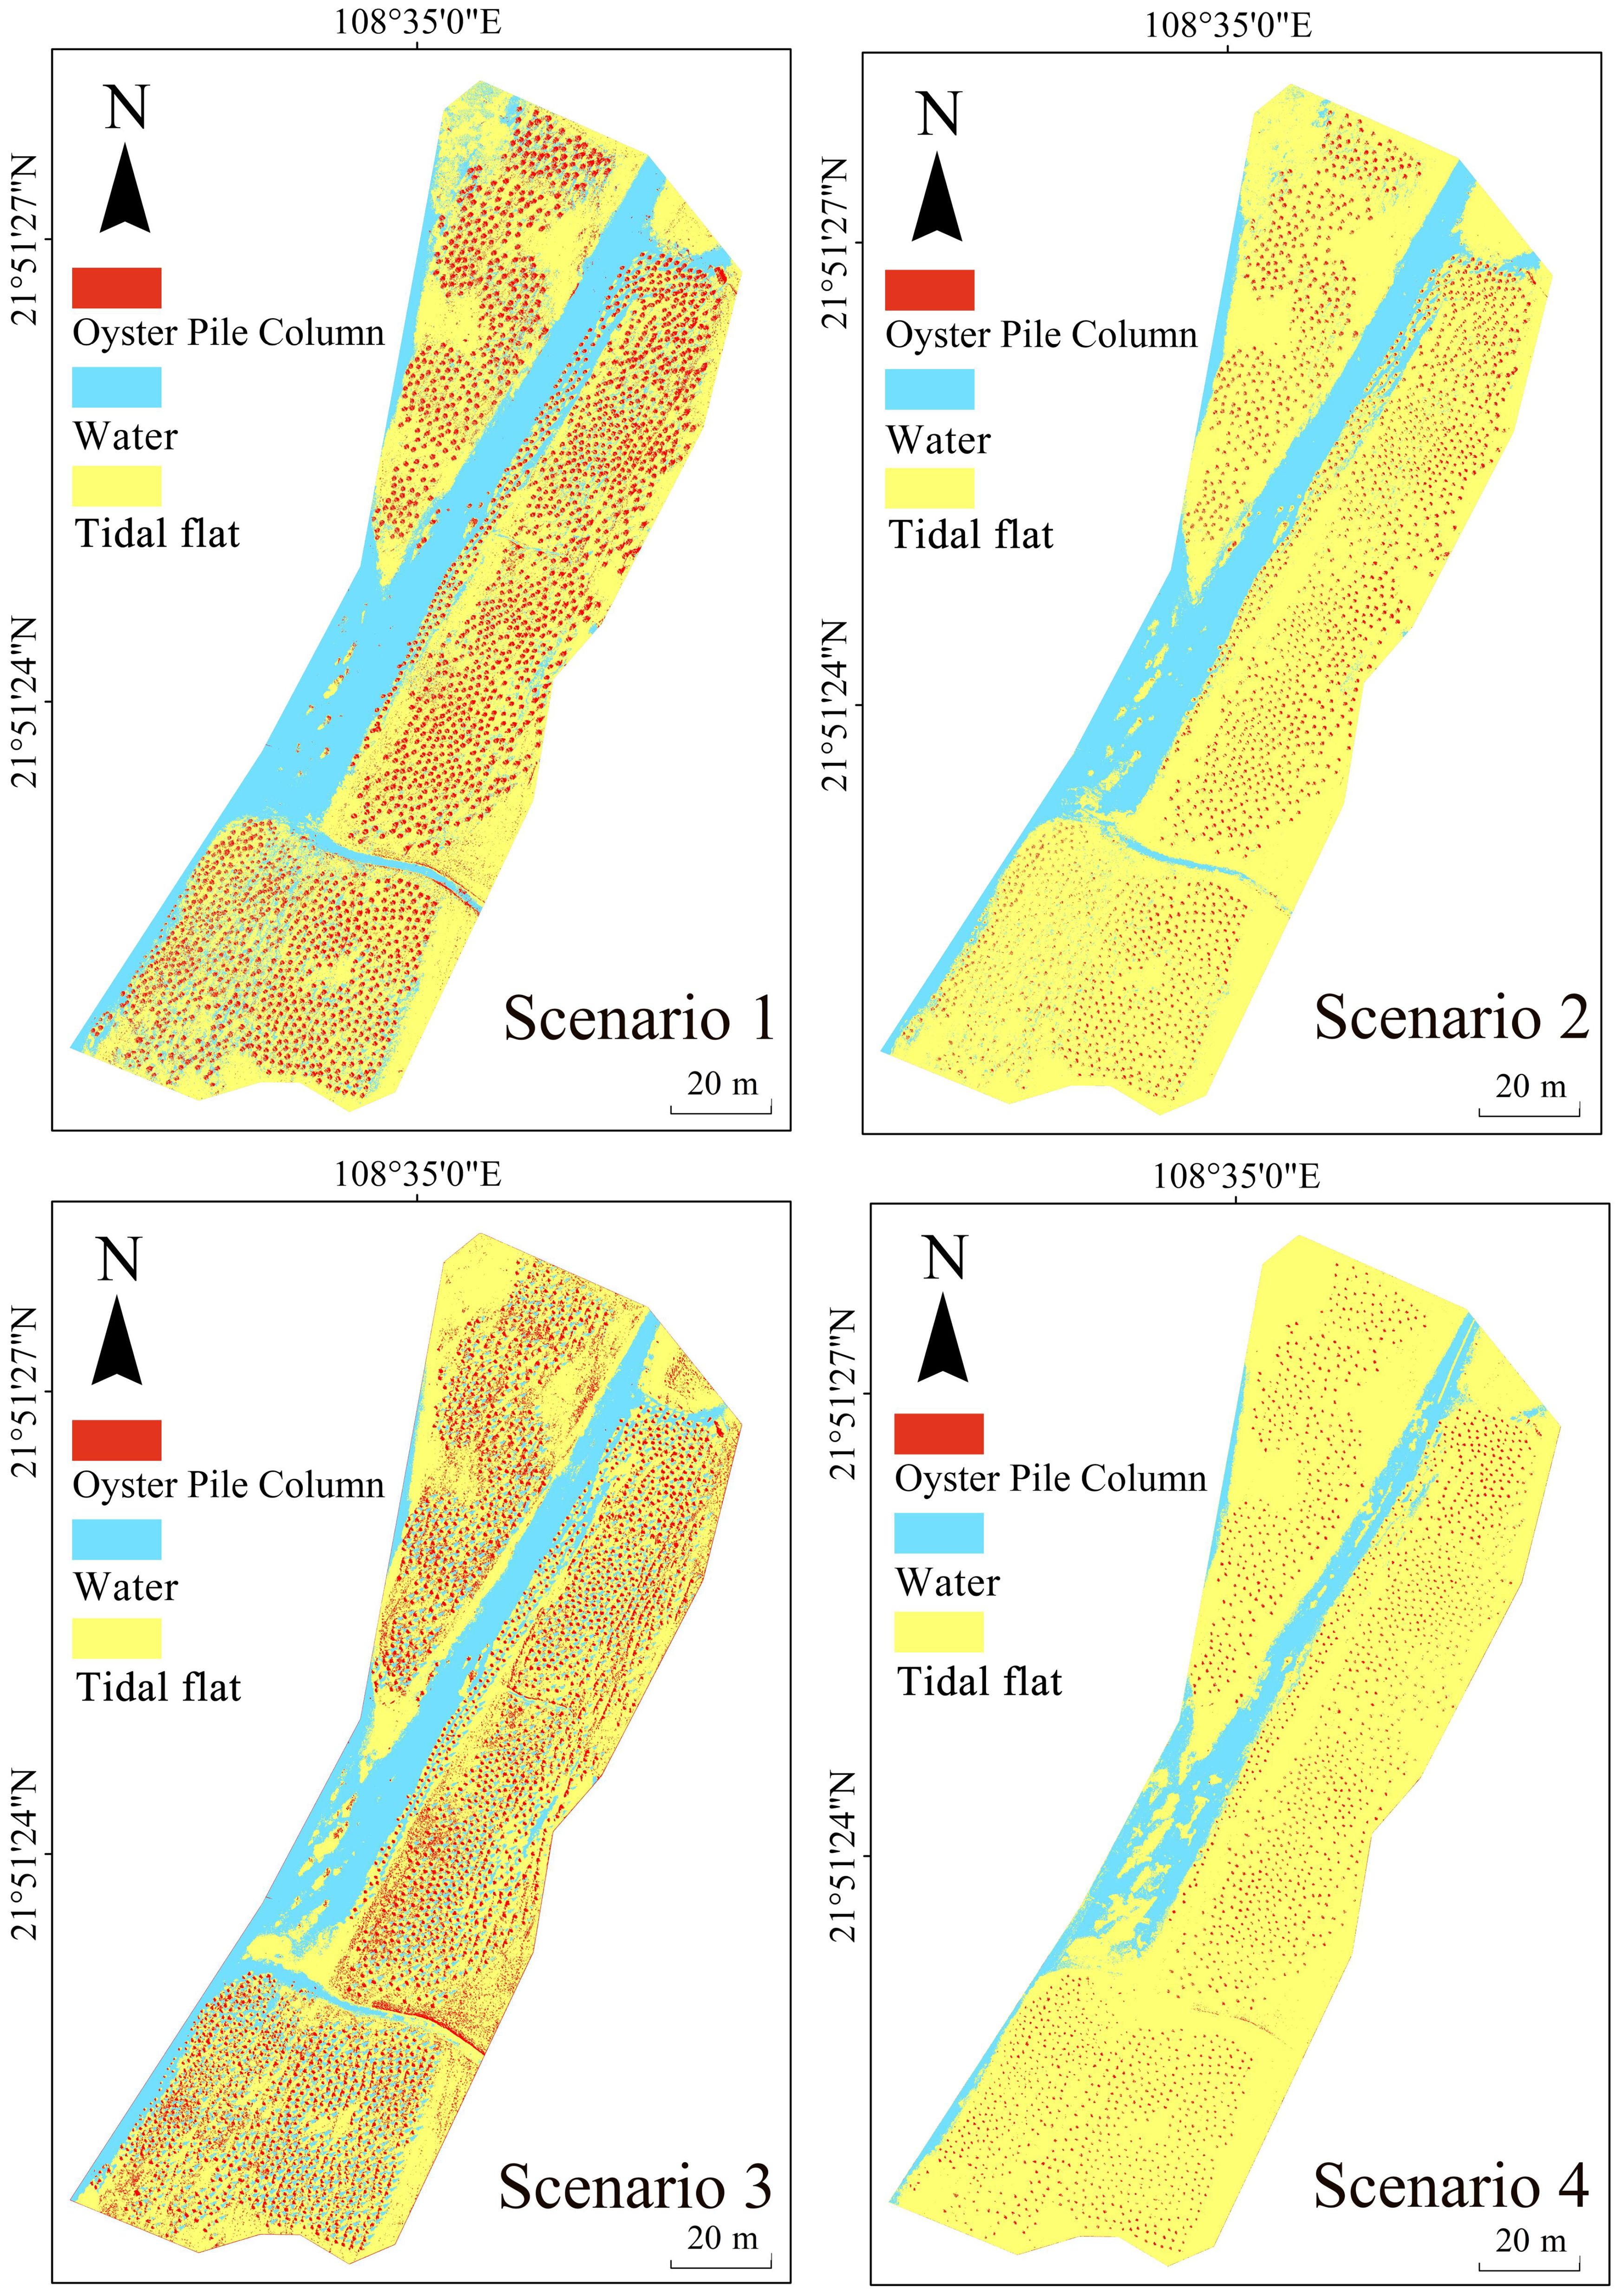
Figure 10. The three-classification result graphs of scenarios S1-S4.
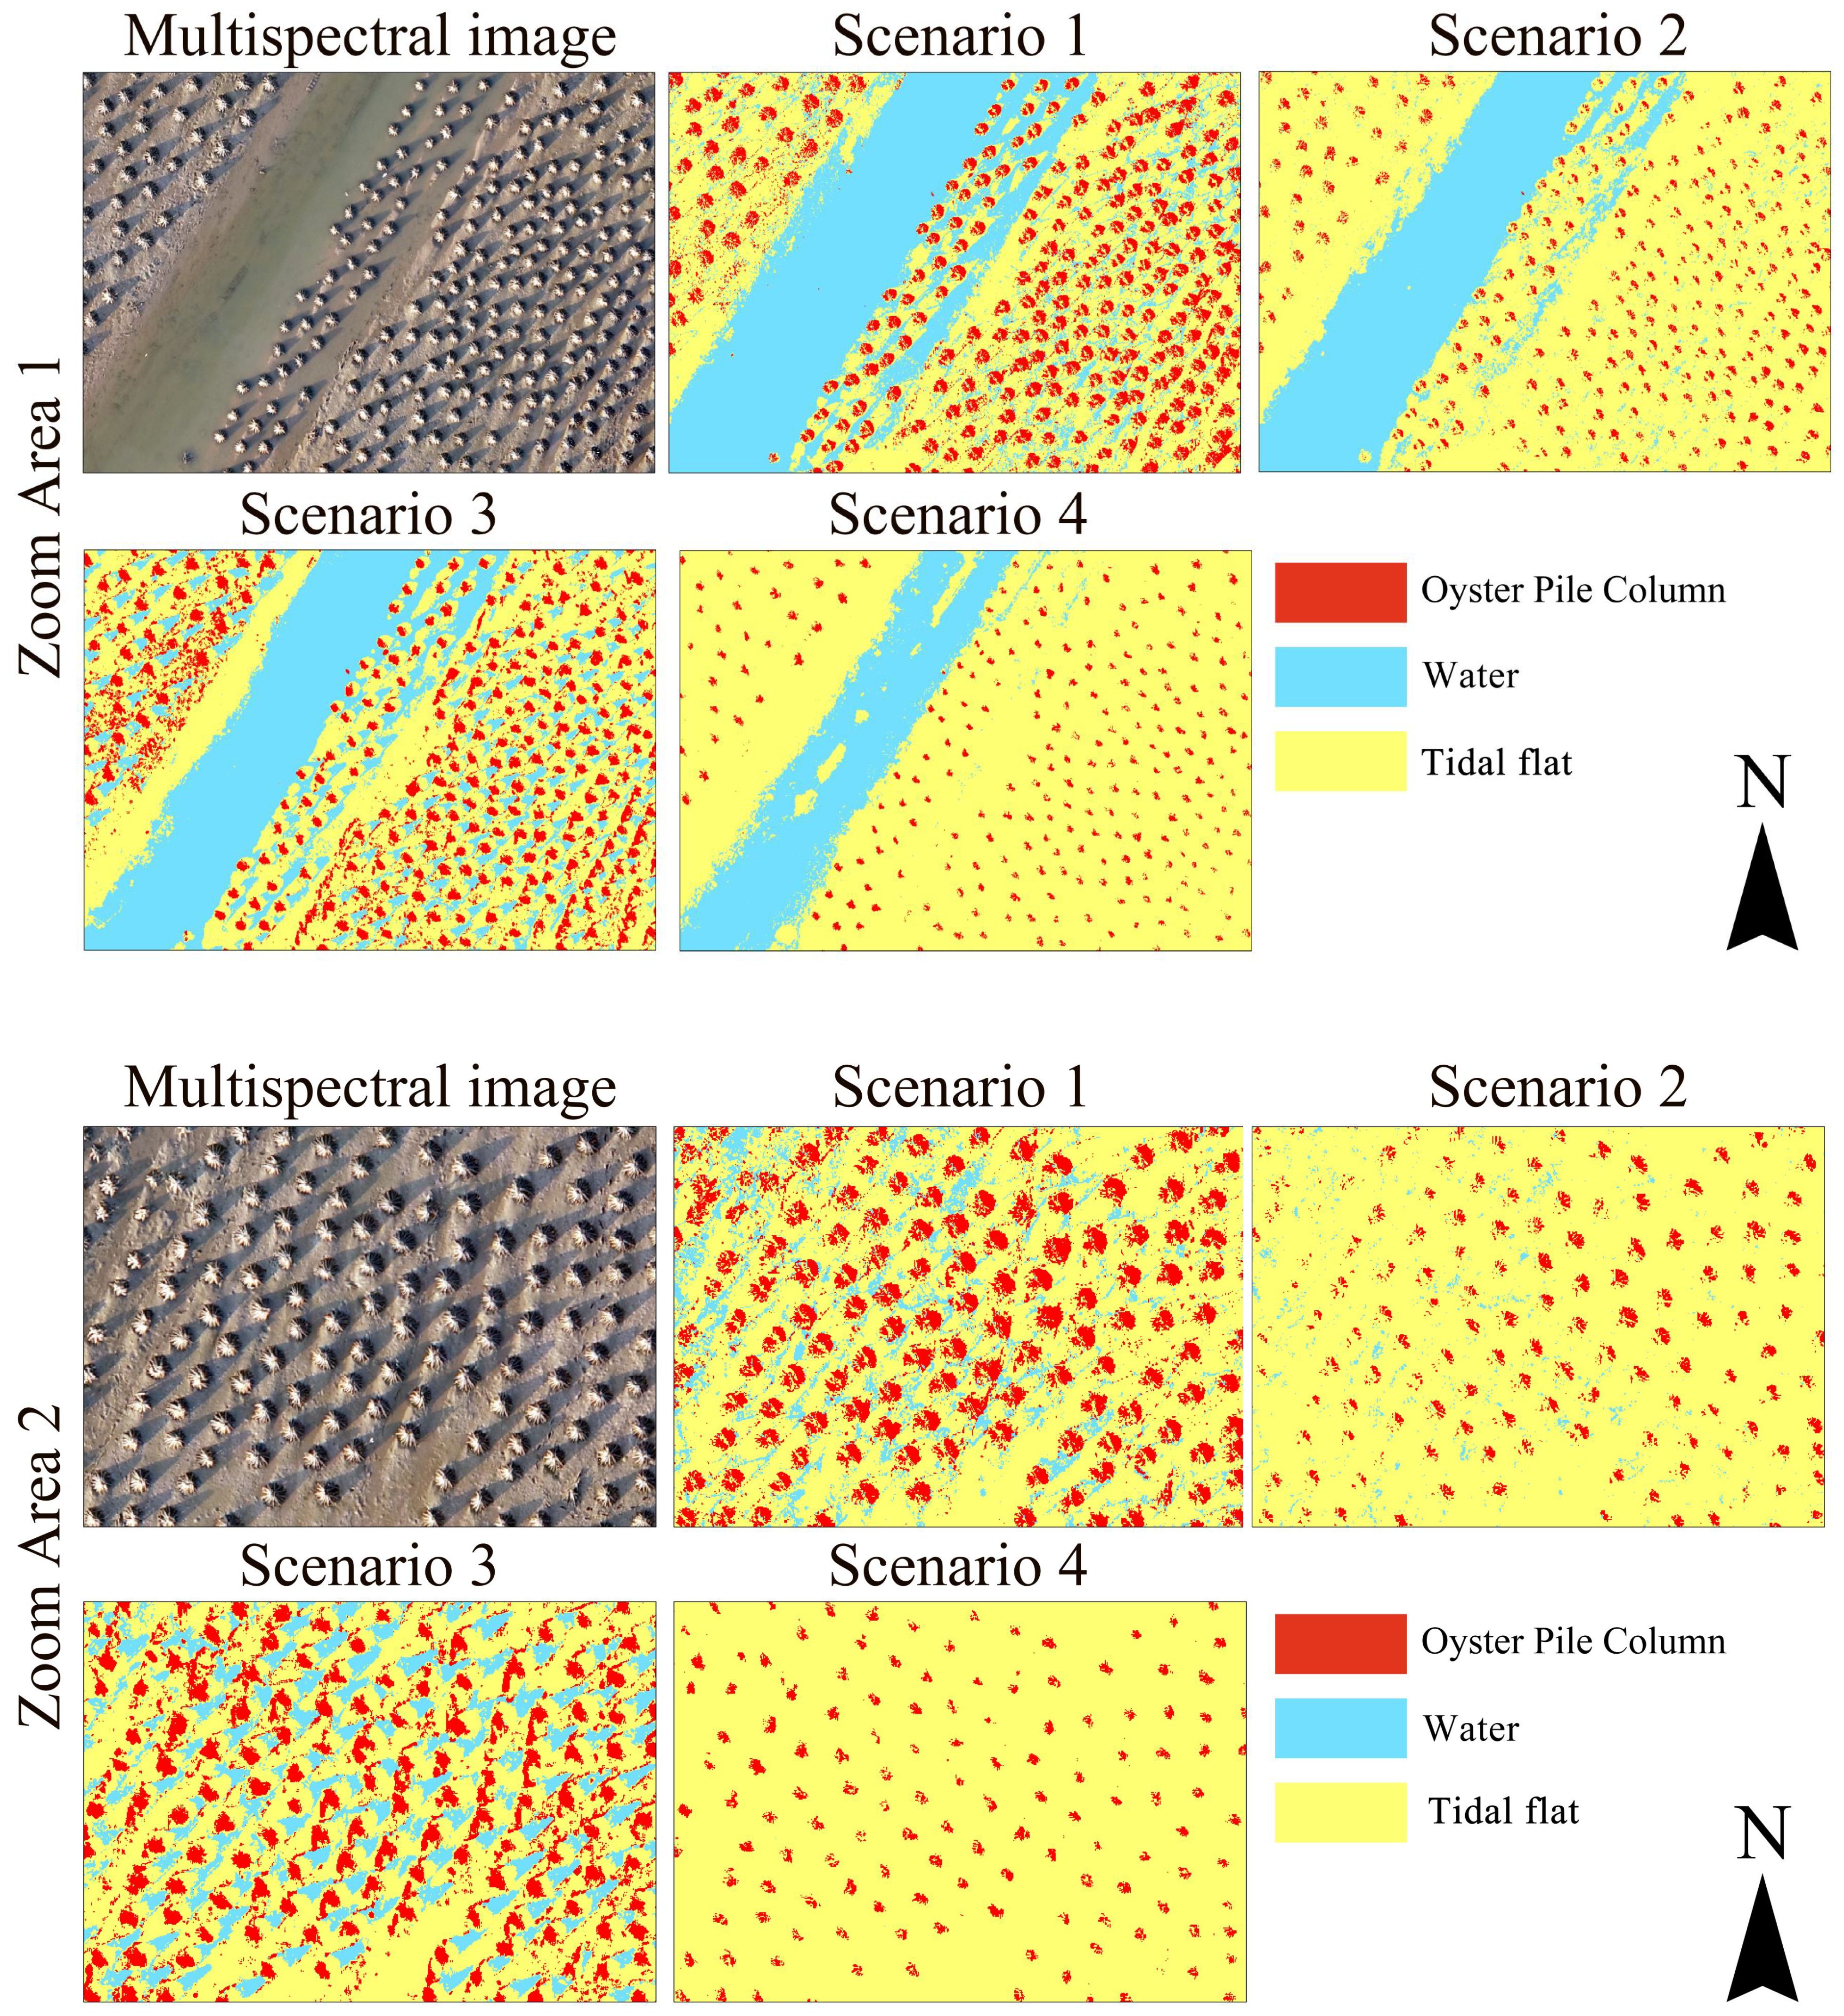
Figure 11. Localized zoomed-in view of classification results, zoomed-in area 1 and zoomed-in area 2.
3.5 Accuracy evaluation of different classification models
The overall accuracy, Kappa coefficient, user accuracy, and producer accuracy of the classification results were computed using the confusion matrices generated for different models (see Table 4). A comparative analysis was conducted between the convolutional neural network (CNN) and three machine learning algorithms. The findings revealed that the CNN outperformed the other models in terms of overall accuracy, followed by RF, SVM, and DT in descending order. Specifically, the CNN deep learning model exhibited the highest classification accuracy for the three features: oyster pile columns, water, and tidal flats, highlighting its superior classification capabilities. Notably, the classification accuracy for water was the highest, with producer accuracy and user accuracy reaching 98.5% and 97.1%, respectively.
3.6 Visualization classification results of different models
Based on the model results, along with the visual representation in Figure 10, it is evident that the inclusion of the OPCHM feature yields inversion results that surpass the CNN classification outcomes for scenarios S1-S3. When considering the S4 feature scenario, the CNN deep learning model exhibits superior classification inversion capabilities for the three types of ground objects compared to the other models. Figure 12 illustrates that the classification inversion results of the three machine learning algorithms are all impacted to varying degrees by “salt and pepper noise,” with the decision tree algorithm being the most significantly affected. Despite successfully classifying the three types of ground objects, the machine learning algorithms struggle with poor classification performance at the boundaries between these objects, often misclassifying the shadow areas around the pile columns as part of the main column body. This issue is exacerbated in dense aquaculture pile column areas where shadows are more concentrated, leading to suboptimal classification results. When compared to the machine learning algorithms, the CNN deep learning algorithm, as illustrated in Table 5 and Figure 13, not only boasts high classification accuracy but also excels in preserving the texture and spatial distribution of the pile columns. Furthermore, it effectively mitigates the impact of “salt and pepper noise.” In particular, when it comes to processing and classifying edge areas where the colors of different ground object categories are similar and prone to confusion, the CNN algorithm outperforms the three machine learning models.
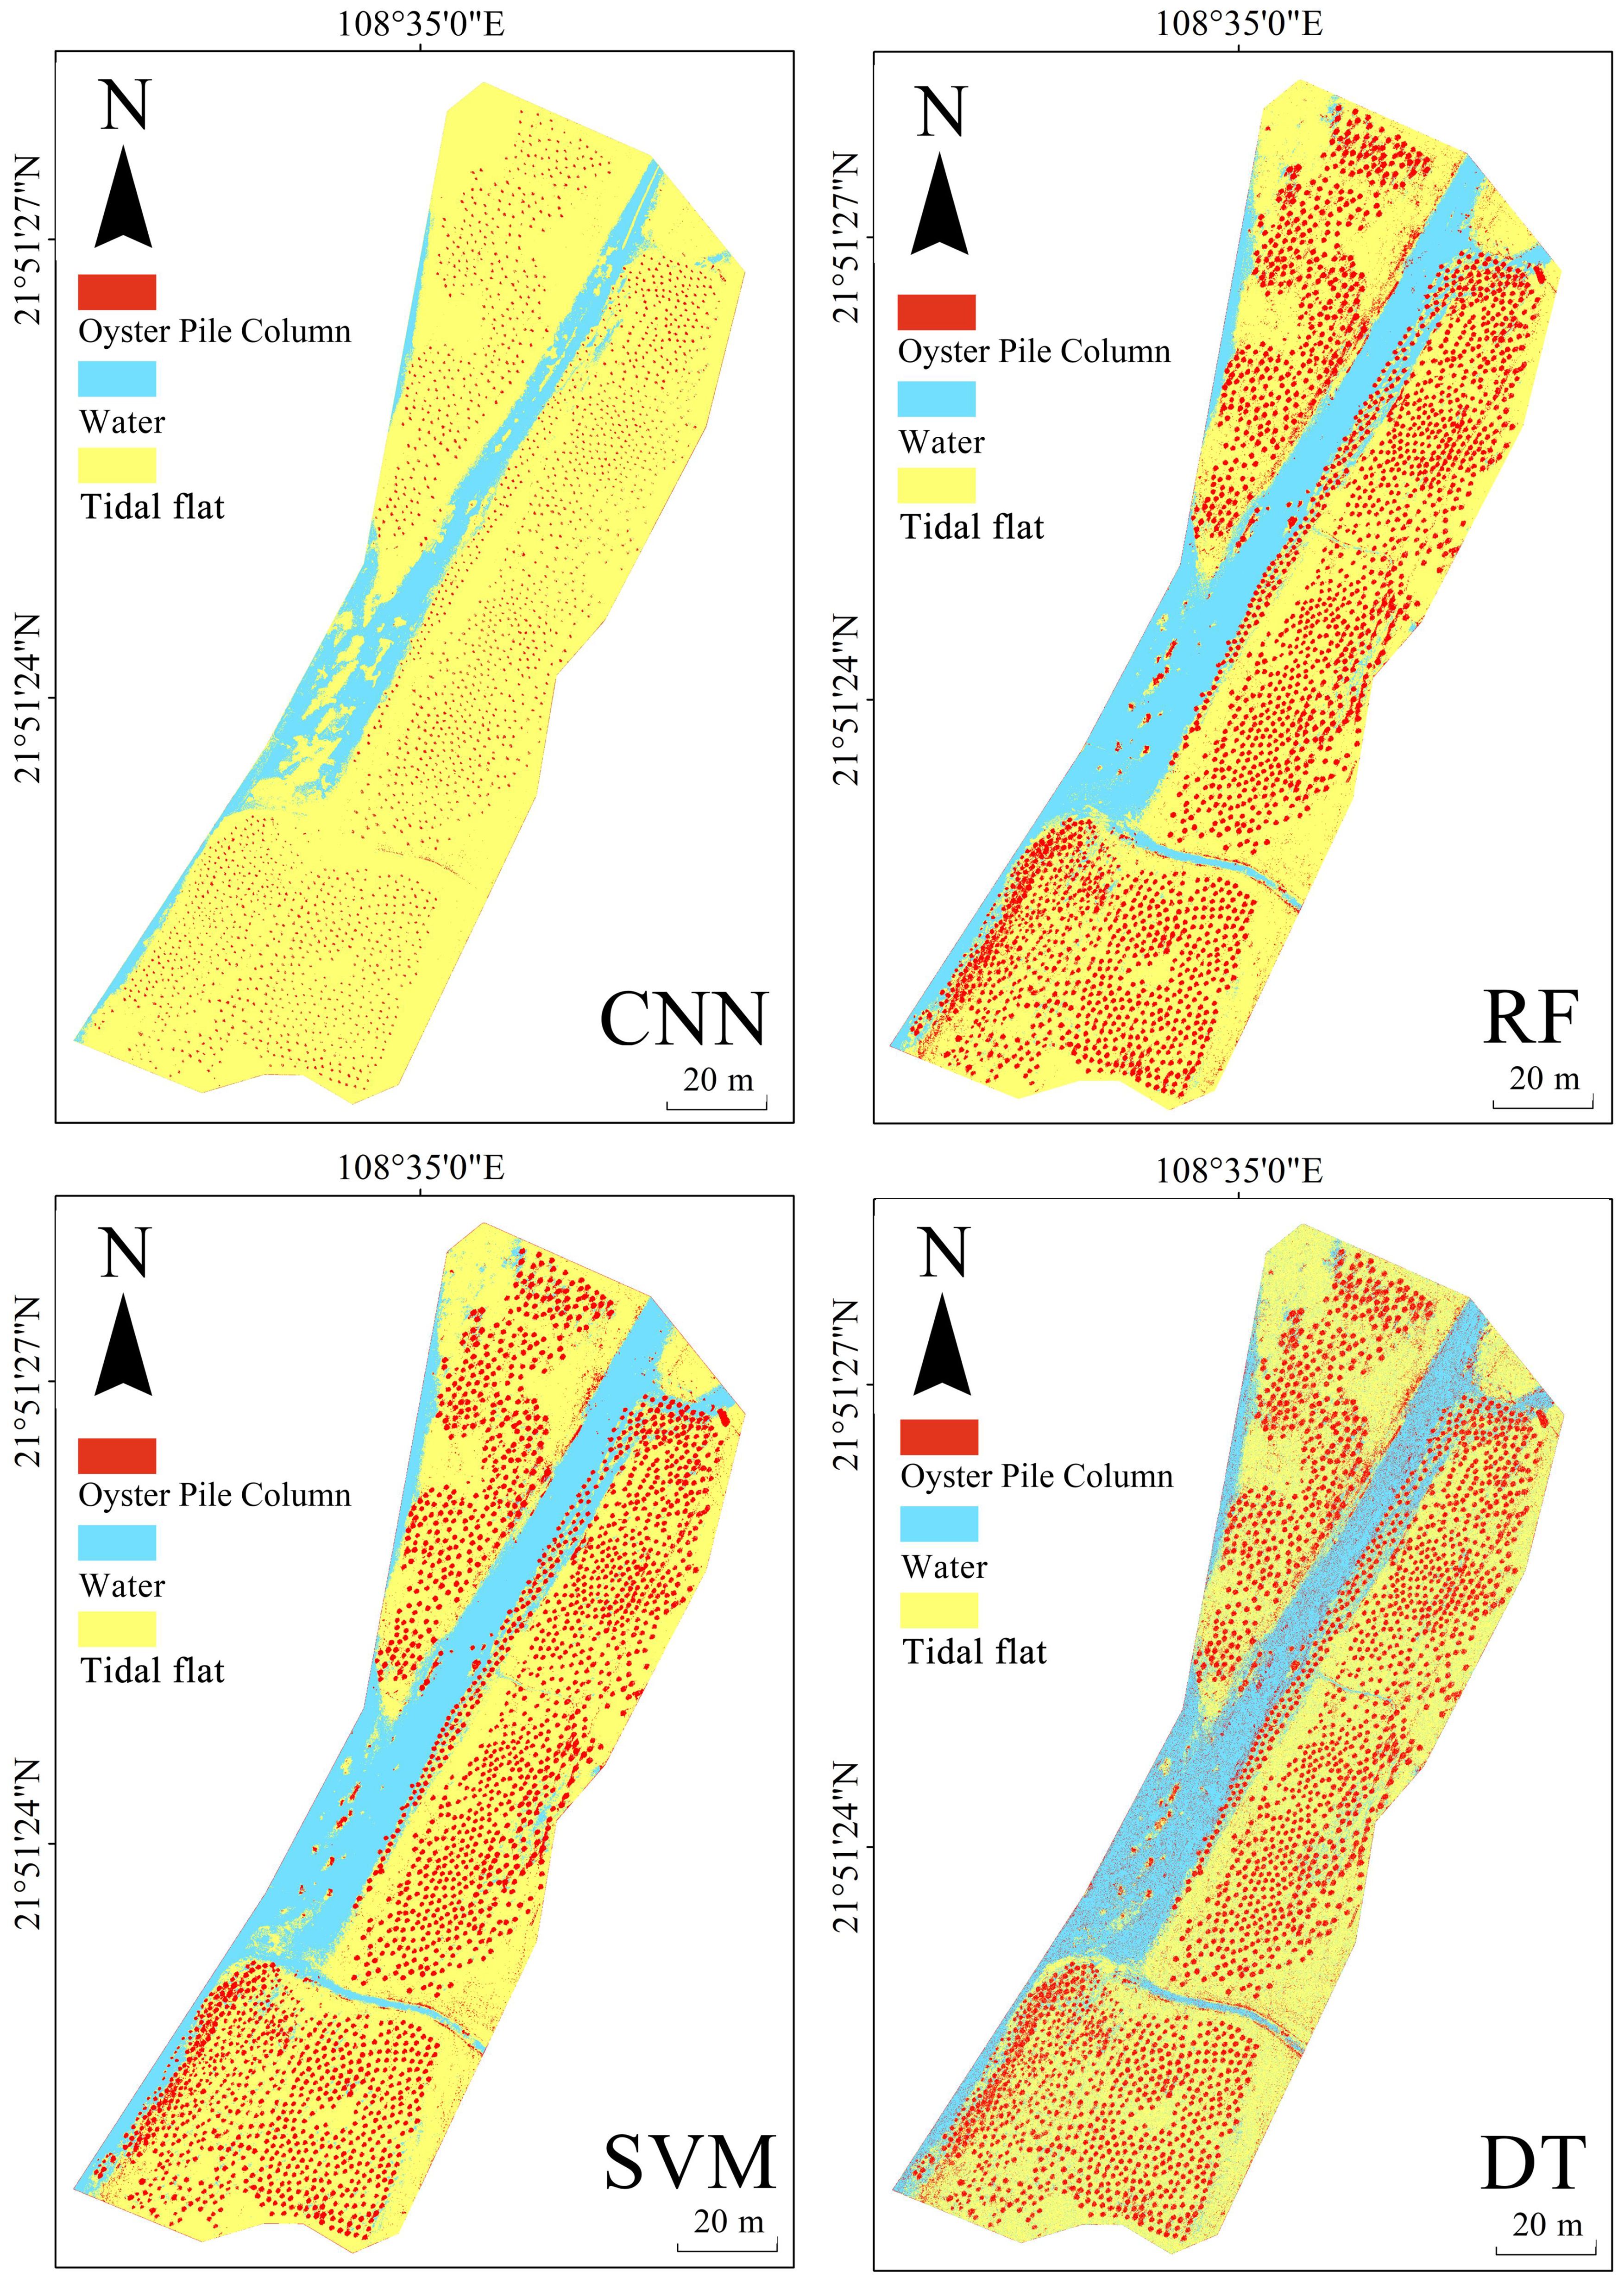
Figure 12. The three-classification result graphs of different models.
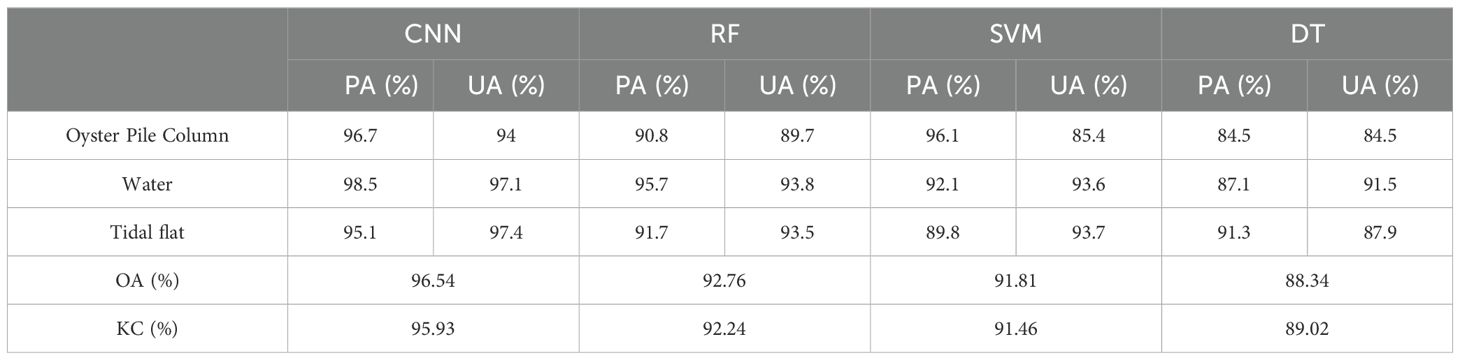
Table 5. Validation results for classification performance of various model.
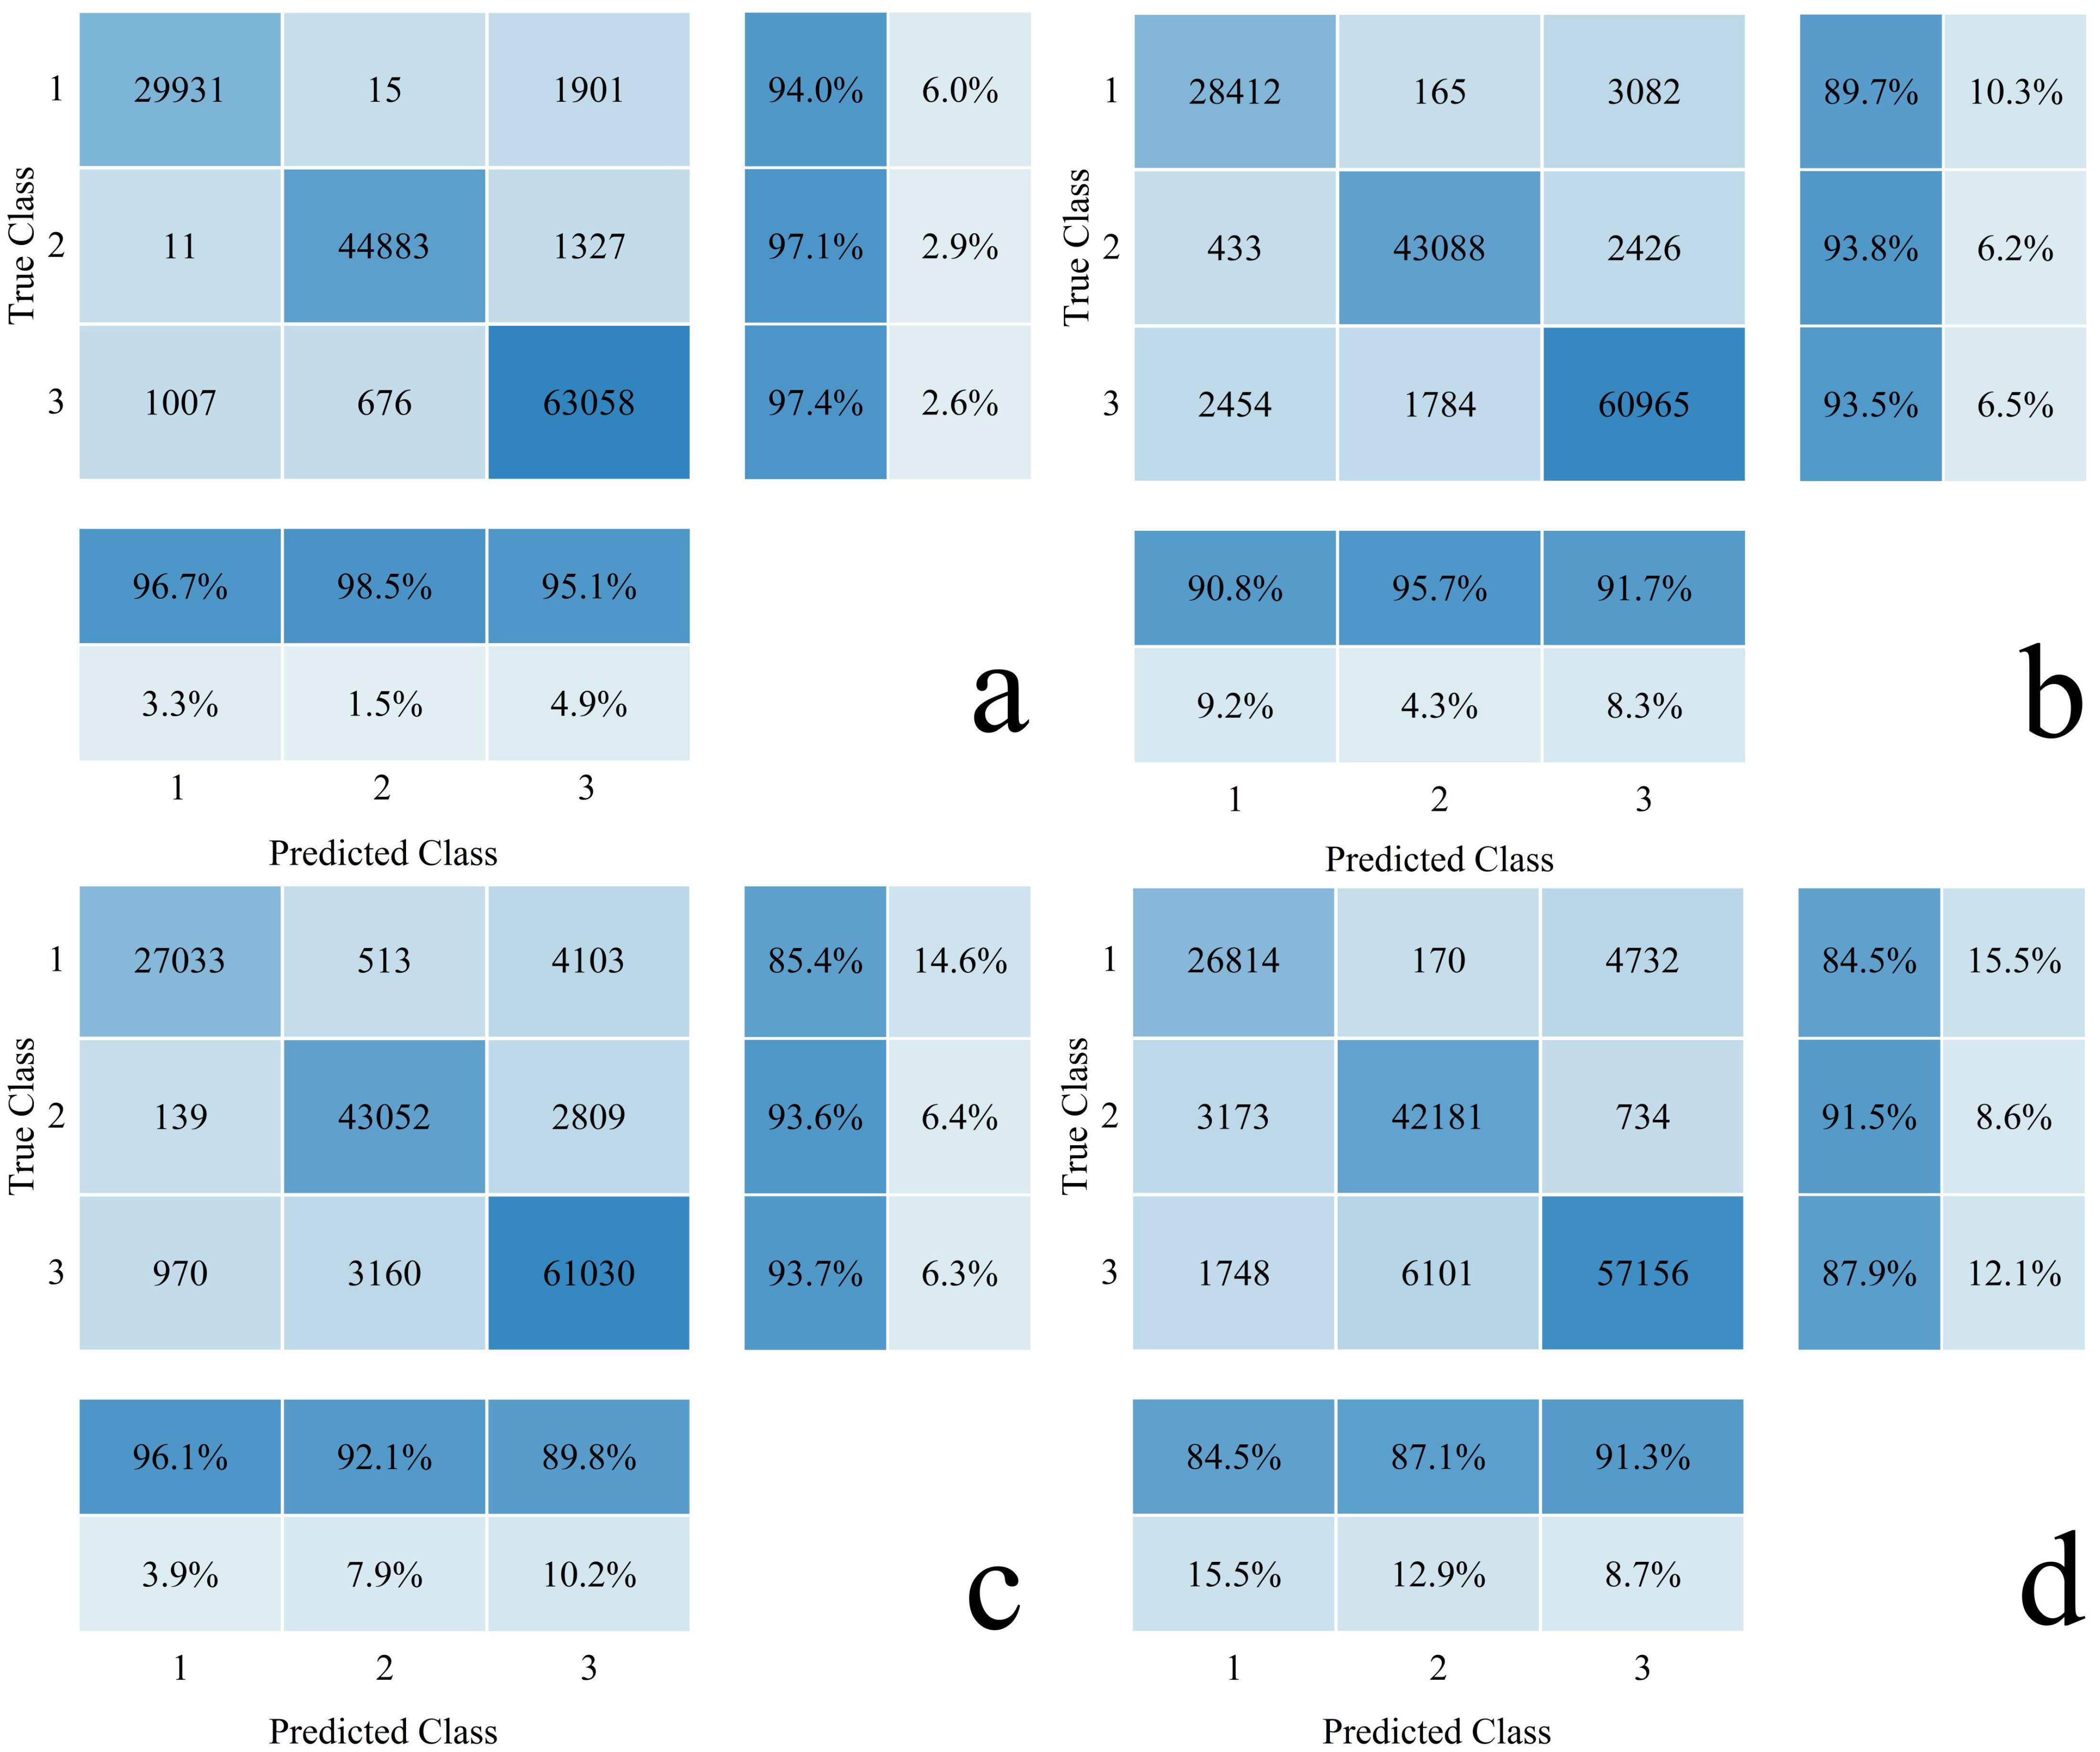
Figure 13. Confusion matrices of different models: (A) CNN classification prediction model; (B) RF classification prediction model; (C) SVM classification prediction model; (D) DT classification prediction model.
4 Discussion
4.1 Selection of oyster pile column classification algorithm
In recent years, a growing number of machine learning algorithms have been employed in the classification of fishery aquaculture facilities, yielding promising results. This study leveraged multi-spectral data captured by unmanned aerial vehicles (UAVs) and evaluated four algorithm models: the CNN deep learning model and three traditional machine learning models. These models were applied to classify ground objects in a typical pile column aquaculture area of Maowei Sea. Upon comparing the outcomes of the four models, it was evident that the CNN deep learning model excelled in ground object classification inversion, achieving an overall accuracy of 96.54% and a Kappa coefficient of 95.93%. This performance surpassed that of Guillaume Brunierd et al.’s (Brunier et al, 2022) study, which utilized UAVs combined with the RF machine learning algorithm for intertidal flat ground object classification (overall accuracy 93.12%; Kappa 91.6%). It also outperformed the raft classification model established by Tingting Hou et al (Hou et al, 2022). in Fengwei Town, Fujian Province, using decision trees (overall accuracy 95.5%; Kappa 90%), as well as the SVM model employed during the research process (overall accuracy 90.81%; Kappa 0.83%). Although the decision tree algorithm demonstrated superior accuracy and classification results compared to the SVM in the extraction of raft aquaculture facilities after water-land classification and subsequent binary classification of water and aquaculture facilities, Table 5 reveals that in the context of three-class ground object classification within the complex intertidal zone background, the decision tree algorithm’s accuracy lagged behind that of the SVM and the other two algorithms. The superior performance of the CNN over the other three machine learning algorithms affirms that deep learning models offer higher accuracy and better classification effectiveness than traditional machine learning models in this classification task.
However, the classification prediction accuracy of the deep learning model employed in this study is marginally lower than the peak model classification accuracy reported by Alejandro Roman et al (Román et al, 2023), which utilized decision trees (overall accuracy = 97.99%; Kappa = 95%). This discrepancy can be primarily attributed to the resolution of the UAV imagery and the complexity of the ground object features. Roman et al.’s research meticulously investigated the impact of varying flight heights on the accuracy of ground object extraction. At a flight height of 12 meters, the reflected orthophoto boasted a resolution of 0.0083 m/pix, yielding the highest extraction accuracy. In contrast, this study opted for a flight height of 80 meters, resulting in an orthophoto resolution of 0.02 meters/pixel, which was subsequently resampled to 0.04 m/pix for the research. Although this approach is adequate for covering a large area, it falls short of the high-resolution images obtained from Alejandro Roman’s (Román et al, 2023) low-altitude flights in terms of model classification accuracy. Furthermore, Roman’s research utilized the MicaSense RedEdge-MX multi-spectral dual sensor, capable of capturing up to ten spectral bands of light information, providing a richer spectral feature set compared to the three-band data source used in our study. This spectral diversity is pivotal for enhancing classification accuracy. In future large-scale ground object classification studies, considering the adoption of a hyperspectral sensor as an additional dataset for the model could potentially improve training accuracy. Regarding point cloud data, Roman et al. successfully generated three-dimensional point clouds of oyster tables using SFM (Structure from Motion) technology, a technique commonly employed for intertidal zone ground object classification (Windle et al, 2022; Bertin et al, 2022; Hitzegrad et al, 2022). However, the more intricate three-dimensional structure of oyster pile columns presents higher complexity and challenges in three-dimensional modeling and ground object classification. To capture the detailed geometric features of oyster pile columns more accurately and streamline the data processing procedure, this study employed a drone equipped with a LiDAR (Light Detection and Ranging) sensor to directly obtain high-resolution three-dimensional structural information. Compared to the SfM technique, LiDAR provides more precise point cloud data, particularly suitable for the three-dimensional reconstruction of complex terrains and dense objects, thereby offering a more reliable foundation for subsequent object classification and analysis. Notably, the overall accuracy of the CNN deep learning classification model in this study reached 96.54% in the S4 scenario (Table 4), significantly surpassing the 92.37% achieved by the optimized hyperparameter CNN model constructed by S. Pan et al (Pan et al, 2020).
This study further confirms that deep learning exhibits superior feature learning capabilities and achieves better classification outcomes when compared to conventional machine learning algorithms. Justin T. Ridge et al (Ridge et al, 2020). successfully developed and trained a convolutional neural network (CNN) to rapidly and accurately classify and quantify intertidal oyster reef areas using high-resolution UAS images. Nevertheless, it should be noted that the volume of the artificially constructed oyster pile columns in this study is significantly smaller than that of most natural oyster reefs, necessitating the incorporation of additional training data and more valuable feature parameters during the model training process. The CNN outperformed the random forest, SVM model, and decision tree algorithm by 3.78%, 4.73%, and 8.2% respectively, in terms of overall accuracy within the same feature scenario. As illustrated in Figure 12, which compares the classification results of the CNN with those of the three traditional machine learning algorithms, the CNN classification prediction model demonstrates higher accuracy and more pronounced classification performance in the identification of oyster pile columns. This finding opens up new avenues for utilizing model algorithms to analyze the spatial distribution and structure of oyster pile columns.
4.2 Selection of model feature parameters
In this study, four different input variable scenarios were established to evaluate the classification accuracy of the S1-S4 scenario model individually (Figure 7). It was observed that when only three single-band variables and single-band combination variables were used as input, the model’s performance in the S1 scenario was suboptimal (the user accuracy for oyster pile column samples was merely 76%, while the producer accuracy reached 88.1%). However, in scenario S4, significant improvements in classification prediction were achieved by incorporating texture index and liDAR OPCHM variables separately, resulting in an increase of 18% and 8.6% respectively for both user accuracy and producer accuracy in oyster pile column classification. This may be attributed to the confusion in classification techniques arising from the similarity between original single band and band combination variables with ground features in this study, as well as the low correlation coefficient. Michael C. Espriella et al (Espriella et al, 2020). employed ten distinct segmentation features for classifying mudflat, marsh, and coral reef habitats; however, their classification was limited to a broad habitat area and did not encompass specific ground object features. Instead, texture features were utilized which can better capture the texture, shape, spatial structure, and other characteristics of surface ground objects. The variable OPCHM directly reflects the height of oyster pile columns compared to other indirect parameters; these two variable pieces of information significantly contribute to enhancing model accuracy. Ou et al (Ou et al, 2023). and Cao et al (Cao et al, 2021)employed UAV hyperspectral data in conjunction with LiDAR point cloud height data to accurately classify mangrove species, thereby validating the high accuracy of extracting LiDAR OPCHM information for classification purposes. Furthermore, the analysis of all characteristic variables’ importance in the MIC model further supports this assertion. In comparison to Michael C. Espriella et al.’s study, our research not only successfully classified individual oyster pile columns within the study area but also achieved an overall classification accuracy of 96.54%, surpassing Michael C. Espriella et al.’s (Espriella et al, 2020) overall accuracy rate of 79%.
In this study, the MIC model was utilized to rank the significance of all feature variables, and the ranking results are illustrated in Figure 6. It can be observed from Figure 6 that image texture features have a positive impact on enhancing the accuracy of the model. Texture information reveals the horizontal structure of the image, reflects spatial variation and gray spatial correlation, thereby improving the accuracy of predicting oyster pile column classification models. Apart from texture features, both B4 band and B1 band exhibit a strong correlation with model classification and prediction. Due to the intricate geomorphic environment and the similar features present in intertidal zones, numerous scholars frequently opt for hyperspectral images, which offer more extensive band information, in comparable scenarios. For example, Wendy Diruitd et al (Diruit et al, 2022). employed hyperspectral unmanned aerial vehicle (UAV) images to classify and identify various types of large algae in intertidal zones using maximum likelihood classification (MLC) and spectral angle mapping (SAM), attaining an overall accuracy of 95.1%. Despite the fact that the multispectral images utilized in this study do not possess the same wealth of spectral information as hyperspectral images, a superior classification accuracy was achieved by integrating deep learning algorithms with a multitude of feature variables, including OPCHM. Subhash Chand et al., through multi-spectral low altitude remote sensing of wild oyster reefs, demonstrated that visible light bands play a crucial role in detecting such reefs in intertidal zones by achieving an 85% classification accuracy using SVM (Chand and Bollard, 2021). Based on Figure 7 and Table 4, we employ image visible band variables as well as band combination variables as feature values for CNN classification prediction models resulting in an overall accuracy rate of 90.3%. In the task of classifying features within intertidal zones, the incorporation of three-dimensional information plays a crucial role in enhancing classification accuracy. Andree De Cockd et al (De Cock et al, 2023). gathered multispectral unmanned aerial vehicle (UAV) images and utilized the automated photogrammetry software Agisoft Metashape to generate 3D point clouds. Subsequently, they employed the Spectral Angle Mapping (SAM) method in QGIS to classify the intertidal zone features, achieving an overall accuracy of 77%. Nevertheless, LiDAR technology offers a distinct advantage as it can directly generate 3D point clouds without the need for image overlap and feature point matching, which are necessary in photogrammetry. Furthermore, point cloud data obtained through LiDAR is typically denser and capable of capturing more intricate details. LiDAR has been effectively employed for mapping oyster reef habitats in intertidal zones (Hogan and Reidenbach, 2019); Lyukasz Janowski et al (Janowski et al, 2022), also proved its capability to distinguish various landforms; although OPCHM variable features hold slightly less importance compared to certain texture variables and visible light band variables; however, this study demonstrates that incorporating OPCHM can significantly enhance the ability of models to differentiate complex surrounding structures while improving their classification prediction accuracy.
The incorporation of texture feature variables enhances the overall spatial distribution of oyster pile columns in the model. While the use of LiDAR point cloud data for extracting forest structure parameters (Sheng et al, 2024; Zhang et al, 2023; Lu et al, 2019) and pavement building structures (Biçici, 2023; Dey et al, 2021; Wang et al, 2023) has been a research hotspot, there is a lack of studies related to culture. In this study, by adding texture features and laser point cloud OPCHM features, we were able to significantly improve classification accuracy and effectiveness between oyster pile column water and tidal flat in the inversion result map. Despite an image resolution of 0.4m/pix, a vast area totaling 6,842,238 pixels with huge amounts of data volume was used; however, our CNN classification and prediction model remained stable while providing good feature representation and classification decision-making abilities that yielded high-precision results. This approach shows great potential for broad application prospects in classifying and predicting oyster pile columns.
4.3 The uncertainty of model evaluation results and future research directions
Mapping the distribution of intertidal oysters is of paramount importance for the scientific management and sustainable development of coastal regions. The extensive cultivation of oyster seed in intertidal oyster pile columns has fueled economic growth; however, there is compelling evidence indicating that such aquaculture practices may pose potential negative impacts on coastal ecosystems, particularly with regard to habitat modification and water quality. To fully comprehend these impacts, especially in habitats with optimal salinity conditions conducive to oyster growth, it is imperative to conduct further research grounded in the monitoring and management of large-scale marine aquaculture facilities. In this study, we propose a deep learning model that combines UAV and laser point cloud technology to classify and extract columns of oyster piles. During the model training stage, ENVI was utilized to label a large dataset, and a CNN classification prediction model was employed for data classification and inversion with an overall accuracy of 96.54%. Figure 7C incorporates OPCHM variable features based on the S3 scenario, significantly improving accuracy while minimizing misclassification in training models as eigenvalues. Moreover, this method enables us to understand how oyster aquaculture interacts with surrounding ecosystems, providing regulators with actionable information for intelligent regulation of aquaculture practices. The high spatial resolution dataset could serve as an important source for restoring and enhancing the overall health of oyster aquaculture habitats and understanding spatial dynamics within intertidal marine environments. In future studies, we aim to enhance the classification accuracy of oyster pile columns by addressing the following aspects. Firstly, we will refine the existing classification prediction model by appropriately augmenting the number and scale of convolutional layers, optimizing model parameters, and other related techniques to elevate its accuracy. Secondly, we will investigate the optimal altitude at which drones can effectively extract information from oyster pile pillars. Thirdly, due to current data limitations, our research area was confined to a small region in Maowei Sea that encompasses oyster pile column breeding areas. Subsequently, our objective is to expand our investigation into additional regions and develop a more precise and practical monitoring framework. Lastly, building on this foundation, we will undertake further research to ascertain the quantity of oyster reef columns and the extent of intertidal aquaculture coverage. Additionally, we will estimate the oyster biomass and assess the oyster carbon sink capacity.
5 Conclusion
The research area is situated in the oyster seedling culture region of Shajing oyster in Maowei Sea, Beibu Gulf, Guangxi, China. Utilizing multi-spectral positive imagery and LiDAR point cloud data acquired through low altitude remote sensing using unmanned aerial vehicles (UAVs), a CNN pile column classification prediction model was established by employing various feature scenario as training parameters. Furthermore, the classification results of typical oyster pile columns in Maowei Sea of Beibu Gulf were analyzed before and after incorporating LiDAR OPCHM data into the CNN classification prediction model to explore the optimal method for extracting oyster pile columns. The key findings are summarized as follows:
The multi-feature combination exhibits a significantly high classification accuracy, thereby harnessing the diverse characteristics of pile columns to enhance the classification accuracy of oyster pile columns. In this study, an overall classification accuracy of 96.54% was achieved, accompanied by a Kappa coefficient of 95.93%. Furthermore, users and producers attained respective accuracies of 94% and 96.7% in classifying oyster pile columns.
The inclusion of LiDAR OPCHM data in the CNN deep learning algorithm, both with single band variables and band combination variables, resulted in a 14.7% improvement in user accuracy for oyster pile column classification. This finding demonstrates the significant positive impact of LiDAR OPCHM data on the classification performance of oyster pile columns, while also reducing the possibility of misclassifying intertidal features with similar spectral characteristics
The texture index of the oyster pile column ranks first in importance within the MIC-BPNC model, followed by the combination variable associated with the red band and subsequently, the red band itself. Additionally, the laser point cloud height variable holds significance. By considering changes observed before and after incorporating the laser point cloud height variable, we validate both texture features and laser point cloud variables as influential factors for classification inversion results.
By comparing the model accuracy evaluation and classification effect of three commonly used machine learning algorithms in the S4 scenario with the addition of OPCHM features, CNN has better classification prediction performance than RF, SVM, and DT. The ranking of model performance from high to low is CNN > RF > SVM > DT.
Data availability statement
The original contributions presented in the study are included in the article/supplementary material. Further inquiries can be directed to the corresponding author.
Ethics statement
Written informed consent was obtained from the individual(s) for the publication of any identifiable images or data included in this article.
Author contributions
JD: Project administration, Validation, Writing – original draft, Writing – review & editing. ZK: Project administration, Supervision, Writing – original draft, Funding acquisition, Writing – review & editing. YT: Data curation, Methodology, Project administration, Supervision, Writing – review & editing. JT: Writing – review & editing. QZ: Writing – review & editing. JM: Conceptualization, Formal Analysis, Resources, Writing – review & editing. YX: Writing – review & editing. YF: Writing – review & editing. MH: Data curation, Funding acquisition, Writing – original draft, Writing – review & editing. LH: Data curation, Formal analysis, Writing – review & editing.
Funding
The author(s) declare financial support was received for the research, authorship, and/or publication of this article. This work was supported in part by the National Natural Science Foundation of China (Grant No. 42261024 and U20A20104), in part by the Marine Science First-Class Subject, Beibu Gulf University under Grant TTB004, TRA004, in part by scientific research capacity building project for Beibu Gulf Marine Ecological Environment Field Observation and Research Station of Guangxi under Grant No. 23-026-271, in part by the Guangxi Science and Technology Base and Talent Special Project (Guike AD24010008), in part by the 2024 Guangxi University Middle-aged and Young Teachers’ Basic Research Capacity Enhancement Project (2024KY0445), in part by the Guangxi Forestry Science and Technology Promotion demonstration project (Guilin scientific research (2022) No. 4), in part by Key Research Base of Humanities and Social Sciences in Guangxi Universities “Beibu Gulf Ocean Development Research Center” (Grant No. BHZKY2202), in part by major projects of key research bases for humanities and social sciences in Guangxi universities (Grant JDZD202214).
Conflict of interest
The authors declare that the research was conducted in the absence of any commercial or financial relationships that could be construed as a potential conflict of interest.
Generative AI statement
The author(s) declare that no Generative AI was used in the creation of this manuscript.
Publisher’s note
All claims expressed in this article are solely those of the authors and do not necessarily represent those of their affiliated organizations, or those of the publisher, the editors and the reviewers. Any product that may be evaluated in this article, or claim that may be made by its manufacturer, is not guaranteed or endorsed by the publisher.
References
Bertin S., Stéphan P., Ammann J. (2022). Assessment of RTK Quadcopter and structure-from-motion photogrammetry for fine-scale monitoring of coastal topographic complexity. Remote Sens. 14, 1679. doi: 10.3390/rs14071679
Biçici S. (2023). “Effectiveness of different machine learning algorithms in road extraction from UAV-Based point cloud,” in Lecture Notes in Networks and Systems. Ben Ahmed M., Boudhir A. A., El Meouche R., Karaș İ.R. (Cham: Springer), 65–74.
Brankovic A., Falsone A., Prandini M., Piroddi L. (2017). A feature selection and classification algorithm based on randomized extraction of model populations. IEEE Trans. Cybern. 48, 1151–1162. doi: 10.1109/TCYB.2017.2682418
Brunier G., Oiry S., Lachaussée N., Barillé L., Le Fouest V., Méléder V. (2022). A machine-learning approach to intertidal mudflat mapping combining multispectral reflectance and geomorphology from UAV-based monitoring. Remote Sens. 14, 5857. doi: 10.3390/rs14225857
Cao L., Coops N. C., Sun Y., Ruan H., Wang G., Dai J., et al. (2019). Estimating canopy structure and biomass in bamboo forests using airborne LiDAR data. ISPRS J. Photogramm. Remote Sens. 148, 114–129. doi: 10.1016/j.isprsjprs.2018.12.006
Cao L., Gu W. J., Li X. S., Hua C. J., Zhou W. F. (2016). Remote sensing investigation on the distribution of oyster culture based on WorldView Satellite data in the Iron Bay of Zhejiang Province. Mod. Fish. Inform. 31, 286–292. doi: 10.13233/j.cnki.fishis.2016.04.007
Cao J., Liu K., Zhuo L., Liu L., Zhu Y., Peng L. (2021). Combining UAV-based hyperspectral and LiDAR data for mangrove species classification using the rotation forest algorithm. Int. J. Appl. Earth Obs. Geoinform. 102, 102414. doi: 10.1016/j.jag.2021.102414
Chand S., Bollard B. (2021). Multispectral low altitude remote sensing of wild oyster reefs. Global Ecol. Conserv. 30, e01810. doi: 10.1016/j.gecco.2021.e01810
Chen Y., He G., Yin R., Zheng K., Wang G. (2022). Comparative study of marine ranching recognition in multi-temporal high-resolution remote sensing images based on DeepLab-v3+ and U-Net. Remote Sens. 14, 5654. doi: 10.3390/rs14225654
Chu J. L., Zhao D. Z., Zhang F. S., Wei B. Q., Li C. M., Suo A. N. (2008). Monitor method of rafts cultivation by remote sense——A case of Changhai. Mar. Environ. Sci. 27, 35–40. doi: 10.3969/j.issn.1007-6336.2008.z2.007
Clark R. A., Mcgrath C. N., Werkmeister A. A., Lowe C. J., Gibbons G., Macdonald M. (2024). Finding navigable paths through tidal flats with Synthetic Aperture Radar. Remote Sens. 16, 1057. doi: 10.3390/rs16061057
Collin A., Dubois S., James D., Houet T. (2019). Improving intertidal reef mapping using UAV surface, red edge, and near-infrared data. Drones 3, 67. doi: 10.3390/drones3030067
Cortes C., Vapnik V. (1995). Support-vector networks. Mach. Learn. 20, 273–297. doi: 10.1023/A:1022627411411
De Cock A., Vandeputte R., Bruneel S., De Cock L., Liu X., Bermúdez R., et al. (2023). Construction of an orthophoto-draped 3D model and classification of intertidal habitats using UAV imagery in the Galapagos Archipelago. Drones 7, 416. doi: 10.3390/drones7070416
Dey E. K., Awrangjeb M., Kurdi F. T., Stantic B. (2021). “Building boundary extraction from liDAR point cloud data,” in 2021 Digital Image Computing: Techniques and Applications (DICTA) (New York: IEEE), 1–6.
Diab A., Kashef R., Shaker A. (2022). Deep learning for LiDAR point cloud classification in remote sensing. Sensors 22, 7868. doi: 10.3390/s22207868
Diruit W., Le Bris A., Bajjouk T., Richier S., Helias M., Burel T., et al. (2022). Seaweed habitats on the shore: Characterization through hyperspectral UAV imagery and field sampling. Remote Sens. 14, 3124. doi: 10.3390/rs14133124
Dohner S. M., Stockwell C. L., Miller D. C., Trembanis A. C. (2020). “Characterization of worm reefs (Sabellaria vulgaris) in Delaware Bay, United States,” in Seafloor geomorphology as benthic habitat, 2nd ed. Eds. Harris P. T., Baker E. (Amsterdan: Elsevier), 163–174.
Espriella M. C., Lecours V., Frederick P. C., Camp E. V., Wilkinson B. (2020). Quantifying intertidal habitat relative coverage in a Florida estuary using UAS imagery and GEOBIA. Remote Sens. 12, 677. doi: 10.3390/rs12040677
Espriella M. C., Lecours V., Lassiter H. A., Wilkinson B. (2022). “Using UAS-based LiDAR data to quantify oyster reef structural characteristics for temporal monitoring,” in The 24th EGU General Assembly (Vienna: Austria and Online), EGU22–10513.
Fan J. C., Zhang F. S., Zhao D. Z., Wen S. Y., Wei B. Q. (2014). “Extracting information on marine floating raft aquaculture based on high-resolution satellite remote sensing SAR images,” in Proceedings of the Second Symposium on Disaster Risk Analysis and Management in ;Chinese Littoral Regions (Haikou: Risk Analysis Council of China Association for Disaster Prevention), 78–82.
Food and Agriculture Organization of the United Nations (2022). The state of world fisheries and aquaculture 2022: towards a blue transition (Rome: Food and Agriculture Organization of the United Nations).
Gaulton R., Malthus T. J. (2010). LiDAR mapping of canopy gaps in continuous cover forests: A comparison of canopy height model and point cloud based techniques. Int. J. Remote Sens. 31, 1193–1211. doi: 10.1080/01431160903380565
Grizzle R., Ward K., Geselbracht L., Birch A. (2018). Distribution and condition of intertidal eastern oyster (Crassostrea virginica) reefs in Apalachicola Bay Florida based on high-resolution satellite imagery. J. Shellfish Res. 37, 1027–1038. doi: 10.2983/035.037.0514
Hitzegrad J., Brohmann L., Pfennings K., Hoffmann T. K., Eilrich A. K., Paul M., et al. (2022). Oyster reef surfaces in the central Wadden Sea: Intra-reef classification and comprehensive statistical description. Front. Mar. Sci. 9. doi: 10.3389/fmars.2022.808018
Ho T. K. (1995). “Random decision forests,” in Proceedings of 3rd international conference on document analysis and recognition (New York: IEEE), 278–282.
Hogan S., Reidenbach M. A. (2019). Quantifying and mapping intertidal oyster reefs utilizing LiDAR-based remote sensing. Mar. Ecol. Prog. Ser. 630, 83–99. doi: 10.3354/meps13118
Hong Y., Gong J. H., Hu S. R., Huang M. X. (2008). Discussion on UAV remote sensing image capture and disposal. Remote Sens. Technol. Appl. 23, 462–466. doi: 10.11873/j.issn.1004-0323.2008.4.462
Hou T., Sun W., Chen C., Yang G., Meng X., Peng J. (2022). Marine floating raft aquaculture extraction of hyperspectral remote sensing images based decision tree algorithm. Int. J. Appl. Earth Obs. Geoinform. 111, 102846. doi: 10.1016/j.jag.2022.102846
Huang B. X., Xu J., Zhang X. T., Chen C. (2024). Wetland information extraction from GF-6 WFV multispectral imagery based on feature optimization. Geospat. Inform. 22, 39–44. doi: 10.3969/j.issn.1672-4623.2024.04.010
Iqbal N., Mumtaz R., Shafi U., Zaidi S. M. H. (2021). Gray level co-occurrence matrix (GLCM) texture based crop classification using low altitude remote sensing platforms. PeerJ Comput. Sci. 7, e536. doi: 10.7717/peerj-cs.536
Janowski L., Wroblewski R., Rucinska M., Kubowicz-Grajewska A., Tysiac P. (2022). Automatic classification and mapping of the seabed using airborne LiDAR bathymetry. Eng. Geol. 301, 106615. doi: 10.1016/j.enggeo.2022.106615
Jiang S., Jiang W., Wang L. (2021). Unmanned Aerial Vehicle-Based Photogrammetric 3D Mapping: A survey of techniques, applications, and challenges. IEEE Geosci. Remote Sens. Mag. 10, 135–171. doi: 10.1109/MGRS.2021.3122248
Jiang Y. F., Qi J. G., Chen B. W., Yan M., Huang L. J., Zhang L. (2021). Classification of mangrove species with UAV Hyperspectral imagery and machine learning methods. Remote Sens. Technol. Appl. 36, 1416–1424. doi: 10.11873/j.issn.1004-0323.2021.6.1416
Li H. W., Wang S. J., Bai X. Y., Cao Y., Wu L. H. (2019). Temporal and spatial evolution of carbon sinks in Chinese limestone by chemical weathering. Sci. Sin. 49, 986–1003. doi: 10.1360/N072018-00174
Li W., Zhang L., Peng J. X., He P. P., Wei P. Y., Zhang X. Z., et al. (2020). Investigation and analysis of death of Qinzhou oyster in Spring in Guangxi. J. Aquacult. 41, 7–13. doi: 10.3969/j.issn.1004-2091.2020.06.002
Lian X., Zhang H., Xiao W., Lei Y., Ge L., Qin K., et al. (2022). Biomass calculations of individual trees based on unmanned aerial vehicle multispectral imagery and laser scanning combined with terrestrial laser scanning in complex stands. Remote Sens. 14, 4715. doi: 10.3390/rs14194715
Liu R. Y., Gao L., Zhang X. Z., Yang W. W., Zhao J. Y., Zhao B., et al. (2024). Analysis of environment of Dafeng River in Beihai,Guangxi and health status of cultivated Hong Kong oyster(Crassostrea hongkongensis). J. Dalian Ocean Univ. 39, 551–558. doi: 10.16535/j.cnki.dlhyxb.2023-275
Liu D. W., Han L., Han X. Y. (2016). High spatial resolution remote sensing image classification based on deep learning. Acta Opt. Sin. 36, 298–306. doi: 10.3788/AOS201636.0428001
Liu Y., Wang Z., Yang X., Zhang Y., Yang F., Liu B., et al. (2020). Satellite-based monitoring and statistics for raft and cage aquaculture in China’s offshore waters. Int. J. Appl. Earth Obs. Geoinform. 91, 102118. doi: 10.1016/j.jag.2020.102118
Lu X. Y., Yun T., Xue L. F., Xu Q. F., Cao L. (2019). Effective feature extraction and identification method based on tree laser point cloud. Chin. J. Lasers 46, 403–414. doi: 10.3788/CJL201946.0510002
Mackenzie C. L., Raap M. R., Leduc S., Walker C. Y. V., Green T. J., Kim E., et al. (2024). Development of a nature-based solution for mitigation of Pacific oyster summer mortality: Use of the intertidal zone to improve resilience to environmental stressors. Front. Mar. Sci. 11. doi: 10.3389/fmars.2024.1345493
Ou J., Tian Y., Zhang Q., Xie X., Zhang Y., Tao J., et al. (2023). Coupling UAV Hyperspectral and LiDAR data for mangrove classification using XGBoost in China’s Pinglu canal estuary. Forests 14, 1838. doi: 10.3390/f14091838
Pan S., Guan H., Chen Y., Yu Y., Gonçalves W. N., Junior J. M., et al. (2020). Land-cover classification of multispectral LiDAR data using CNN with optimized hyper-parameters. ISPRS J. Photogramm. Remote Sens. 166, 241–254. doi: 10.1016/j.isprsjprs.2020.05.022
Regniers O., Bombrun L., Lafon V., Germain C. (2016). Supervised classification of very high resolution optical images using wavelet-based textural features. IEEE Trans. Geosci. Remote Sens. 54, 3722–3735. doi: 10.1109/TGRS.2016.2526078
Reshef D. N., Reshef Y. A., Finucane H. K., Grossman S. R., Mcvean G., Turnbaugh P. J., et al. (2011). Detecting novel associations in large data sets. Science 334, 1518–1524. doi: 10.1126/science.1205438
Ridge J. T., Gray P. C., Windle A. E., Johnston D. W. (2020). Deep learning for coastal resource conservation: Automating detection of shellfish reefs. Remote Sen. Ecol. Conserv. 6, 431–440. doi: 10.1002/rse2.134
Román A., Prasyad H., Oiry S., Davies B. F., Brunier G., Barillé L. (2023). Mapping intertidal oyster farms using unmanned aerial vehicles (UAV) high-resolution multispectral data. Estuar. Coast. Shelf Sci. 291, 108432. doi: 10.1016/j.ecss.2023.108432
Sharan S., Kininmonth S., Mehta U. V. (2021). Automated CNN based coral reef classification using image augmentation and deep learning. Int. J. Eng. Intell. Syst. 29, 253–261. Available online at: https://www.ije.ir/contacts?_action=loginForm
Sheng Y., Zhao Q., Wang X., Liu Y., Yin X. (2024). Tree diameter at breast height extraction based on mobile laser scanning point cloud. Forests 15, 590. doi: 10.3390/f15040590
Sun X. Y., Su F. Z., Zhou C. H., Xue Z. S. (2010). Analyses on spatial-temporal changes in aquaculture land in coastal areas of the Pearl River Estuarine. Resour. Sci. 32, 71–77. Available online at: https://www.resci.cn/CN/home
Tan Y. X., Tian Y. C., Huang Z. M., Zhang Q., Tao J., Liu H. X., et al. (2023). Aboveground biomass of Sonneratia apetala mangroves in Mawei Sea of Beibu Gulf based on XGBoost machine learning algorithm. Acta Ecol. Sin. 43, 4674–4688. doi: 10.5846/stxb202201140141
Tetila E. C., MaChado B. B., Astolfi G., De Souza Belete N. A., Amorim W. P., Roel A. R., et al. (2020). Detection and classification of soybean pests using deep learning with UAV images. Comput. Electron. Agric. 179, 105836. doi: 10.1016/j.compag.2020.105836
Tian Y., Huang Y., Zhang Q., Zhang Y., Huang H., Liang M., et al. (2019). A comparative study of spatial heterogeneity of ecosystem service value in typical islands in Beibu Gulf. Mar. Sci. 43, 60–68. doi: 10.11759/hykx20180610001
Wang F. Y., Wang K. R., Li S. K., Chen B., Chen J. L. (2010). Estimation of chlorophyll and nitrogen contents in cotton leaves using digital camera and imaging spectrometer. Acta Agrono. Sin. 36, 1981–1989. doi: 10.3724/SP.J.1006.2010.01981
Wang Y., Hu X., Zhou T., Ma Y., Li Z. (2023). Efficient building facade structure extraction method using image-based laser point cloud. Trans. GIS 27, 1145–1163. doi: 10.1111/tgis.13063
Wang S., Huang C., Li H., Liu Q. (2023). Synergistic integration of time series optical and SAR satellite data for mariculture extraction. Remote Sens. 15, 2243. doi: 10.3390/rs15092243
Windle A. E., Poulin S. K., Johnston D. W., Ridge J. T. (2019). Rapid and accurate monitoring of intertidal Oyster Reef Habitat using unoccupied aircraft systems and structure from motion. Remote Sens. 11, 2394. doi: 10.3390/rs11202394
Windle A. E., Puckett B., Huebert K. B., Knorek Z., Johnston D. W., Ridge J. T. (2022). Estimation of intertidal oyster reef density using spectral and structural characteristics derived from unoccupied aircraft systems and structure from motion photogrammetry. Remote Sens. 14, 2163. doi: 10.3390/rs14092163
Xiao S., Wong N. K., Li J., Lin Y., Zhang Y., Ma H., et al. (2018). Analysis of in situ transcriptomes reveals divergent adaptive response to hyper-and hypo-salinity in the Hong Kong oyster, Crassostrea hongkongensis. Front. Physiol. 9. doi: 10.3389/fphys.2018.01491
Xu C., Zhang S., Zhao B., Liu C., Sui H., Yang W., et al. (2022). SAR image water extraction using the attention U-net and multi-scale level set method: Flood monitoring in South China in 2020 as a test case. Geo-Spat. Inf. Sci. 25, 155–168. doi: 10.1080/10095020.2021.1978275
Yang M. D., Huang K. S., Wan J., Tsai H. P., Lin L. M. (2018). Timely and quantitative damage assessment of oyster racks using UAV images. IEEE J. Sel. Top. Appl. Earth Obs. Remote Sens. 11, 2862–2868. doi: 10.1109/JSTARS.2018.2839767
Zhang G. F., Li L., Que H. Y. (2020). An evolution of oyster mariculture industry in China: New knowledge, variety and product. Oceans Lakes 51, 740–749. doi: 10.11693/hyhz20200300092
Zhang W., Peng X., Cui G., Wang H., Takata D., Guo W. (2023). Tree branch skeleton extraction from drone-based photogrammetric point cloud. Drones 7, 65. doi: 10.3390/drones7020065
Zhang J., Wang Z., Bai L., Song G., Tao J., Chen L. (2021). “Deforestation detection based on U-net and LSTM in optical satellite remote sensing images,” in 2021 IEEE international geoscience and remote sensing symposium IGARSS (New York: IEEE), 3753–3756.
Keywords: deep learning, Light Detection and Ranging (lidar), multispectral data, oyster pile columns, unmanned aerial vehicle (UAV), Beibu Gulf
Citation: Du J, Huang M, Kang Z, Tian Y, Tao J, Zhang Q, Xie Y, Mo J, Huang L and Feng Y (2025) Extraction of typical oyster pile columns in the Maowei Sea, Beibu Gulf, based on unmanned aerial vehicle laser point cloud orthophotos. Front. Mar. Sci. 12:1502123. doi: 10.3389/fmars.2025.1502123
Received: 26 September 2024; Accepted: 24 January 2025;
Published: 05 March 2025.
Edited by:
Pablo Presa, University of Vigo, SpainReviewed by:
Gulnihal Ozbay, Delaware State University, United StatesBinbin Jiang, Zhejiang University of Science and Technology, China
Copyright © 2025 Du, Huang, Kang, Tian, Tao, Zhang, Xie, Mo, Huang and Feng. This is an open-access article distributed under the terms of the Creative Commons Attribution License (CC BY). The use, distribution or reproduction in other forums is permitted, provided the original author(s) and the copyright owner(s) are credited and that the original publication in this journal is cited, in accordance with accepted academic practice. No use, distribution or reproduction is permitted which does not comply with these terms.
*Correspondence: Yichao Tian, dGlhbnlpY2hhbzEzMTRAaG90bWFpbC5jb20=
†These authors have contributed equally to this work and share first authorship