 Aitziber Olano-Arbulu
- 1AZTI, Marine Research, Basque Research and Technology Alliance (BRTA), Pasaia, Spain
- 2Research Centre for Experimental Marine Biology & Biotechnology, University of the Basque Country (UPV/EHU), Plentzia, Bizkaia, Spain
Marine ecosystem services provide multiple benefits and hold significant economic value; however, the capacity of the marine environment to provide ecosystem services can be compromised by anthropogenic pressures. To ensure proper environmental conditions and human well-being, it is necessary to study the functioning of marine ecosystem services. In this context, the aim of this study is to test whether the Common International Classification of Ecosystem Services (CICES) cascade framework is adequate to explain the flow between the natural and the socio-economic domains and identify its limitations. To this end, the study was divided in two parts: (i) review, compilation and classification of CICES Ecosystem Services Cascade model indicators, for three marine ecosystem service examples (provisioning, regulation and maintenance, and cultural), together with the analysis of the number of indicators and the match of the classification undertaken by the authors in the literature and CICES proposal; and (ii) the application of the CICES Ecosystem Services Cascade model to the practical case study of the anchovy fishery in the Bay of Biscay. The results obtained show that many indicators were incorrectly assigned in the literature to the different components of the CICES Ecosystem Services Cascade model. This study highlights the need to develop a standardized classification and understanding of the marine ecosystem services. Significant correlations between the different five steps of the CICES Ecosystem Services Cascade model were obtained, suggesting that this cascade is effective at explaining the links between a healthy environment and the sustainable supply of ecosystem services and benefits.
1 Introduction
Coastal and marine environments play a crucial role in maintaining the ecological equilibrium of our planet and supplying human communities with ecosystem services (Peterson and Lubchenco, 1997). These environments are under continuous transformation and protecting service flows require preserving sufficient natural capital stock (both in terms of quality and quantity) (Martínez et al., 2007), as well as the interconnections of the ecosystem components and their relationship with the abiotic environment (Buonocore et al., 2021). The viability of these marine ecosystem services and the benefits they provide to humans are significantly affected by both anthropogenic and natural stressors, and their cumulative effects (Outeiro et al., 2017). Understanding how marine ecosystem services are supplied is essential for the sustainable management of socio-ecological systems (i.e., Ecosystem-Based Management) (Atkins et al., 2011).
From the beginning of the 21st century, several ecosystem services classification frameworks have been developed by different organizations and initiatives. The first one was the Millenium Ecosystem Assessment (MEA, 2005), an international initiative undertaken between 2001 and 2005, conducted by the United Nations and involving over 1,300 experts from 95 countries. The main purpose was the evaluation of the ecosystem’s state, the services provided by these ecosystems to humans, and the implications for human well-being. After this, the European Commission, supported by various countries and organizations, created “The Economics of Ecosystems and Biodiversity” (TEEB, 2010). This assessment provided comprehension about the economic value of ecosystem services, emphasizing the undervaluation of these services in the conventional economic and decision-making processes.
Numerous more recent classifications [e.g., The UK National Ecosystem Assessment (NEA) (Watson et al., 2011), Final Ecosystem Goods and Services (FEGS-CS) (Landers and Nahlik, 2013), Nature´s Contribution to People (NCP) (Pascual et al., 2017)], have been developed upon the initial groundbreaking works. Some of the new ecosystem services classifications are specifical for the marine environment (e.g., Atkins et al., 2011; Böhnke-Henrichs et al., 2013; Liquete et al., 2013; Turner et al., 2015). The most accepted classification nowadays in Europe would be the Common International Classification of Ecosystem Services (CICES) (Haines-Young and Potschin, 2012), used by several European Union (EU) agencies and many Member States. The aim of all these different classifications is universal; however, all of them have a particular background, and favor specific contexts and goals (Czúcz et al., 2018).
CICES was developed to have an internationally recognized and standardized approach for ecosystem services assessment and provides a systematic categorization and description of ecosystem services (Haines-Young and Potschin, 2012). This classification was based on the ecosystem services groups defined by the MEA classification, together with a literature review, survey results, workshops, and direct experience from European projects (Culhane et al., 2018; Grima et al., 2023). The result is a classification that is structured into five hierarchical levels (from higher to lower level: Section, Division, Group, Class, Class type), in line with the “best practices” proposed by the UNSD (1999). The utilization of the CICES framework helps scientists, policymakers, and other stakeholders to better understand how ecosystems benefit human well-being, enabling them to make well informed choices regarding ecosystem preservation and management. CICES classification is a dynamic and constantly evolving tool, regularly updated (last version: CICES V5.1) (Haines-Young and Potschin, 2018). There are three different ecosystem services according to CICES, provisioning services, regulation and maintenance services, and cultural services. The three ecosystem service sections are interconnected and collectively contribute to the overall benefits that ecosystems provide to humans (Grima et al., 2023).
In this context, the Ecosystem Services Cascade model, which will be referred in this paper as CICES cascade (Potschin and Haines-Young, 2017) establishes a connection between natural systems and various aspects of human well-being, resembling a production chain, between the natural environment to the socio-economic system (Figure 1 illustrates an example). It starts with the ecological structures and processes created by ecosystems and culminates in the provision of services and benefits that ultimately serve human needs.
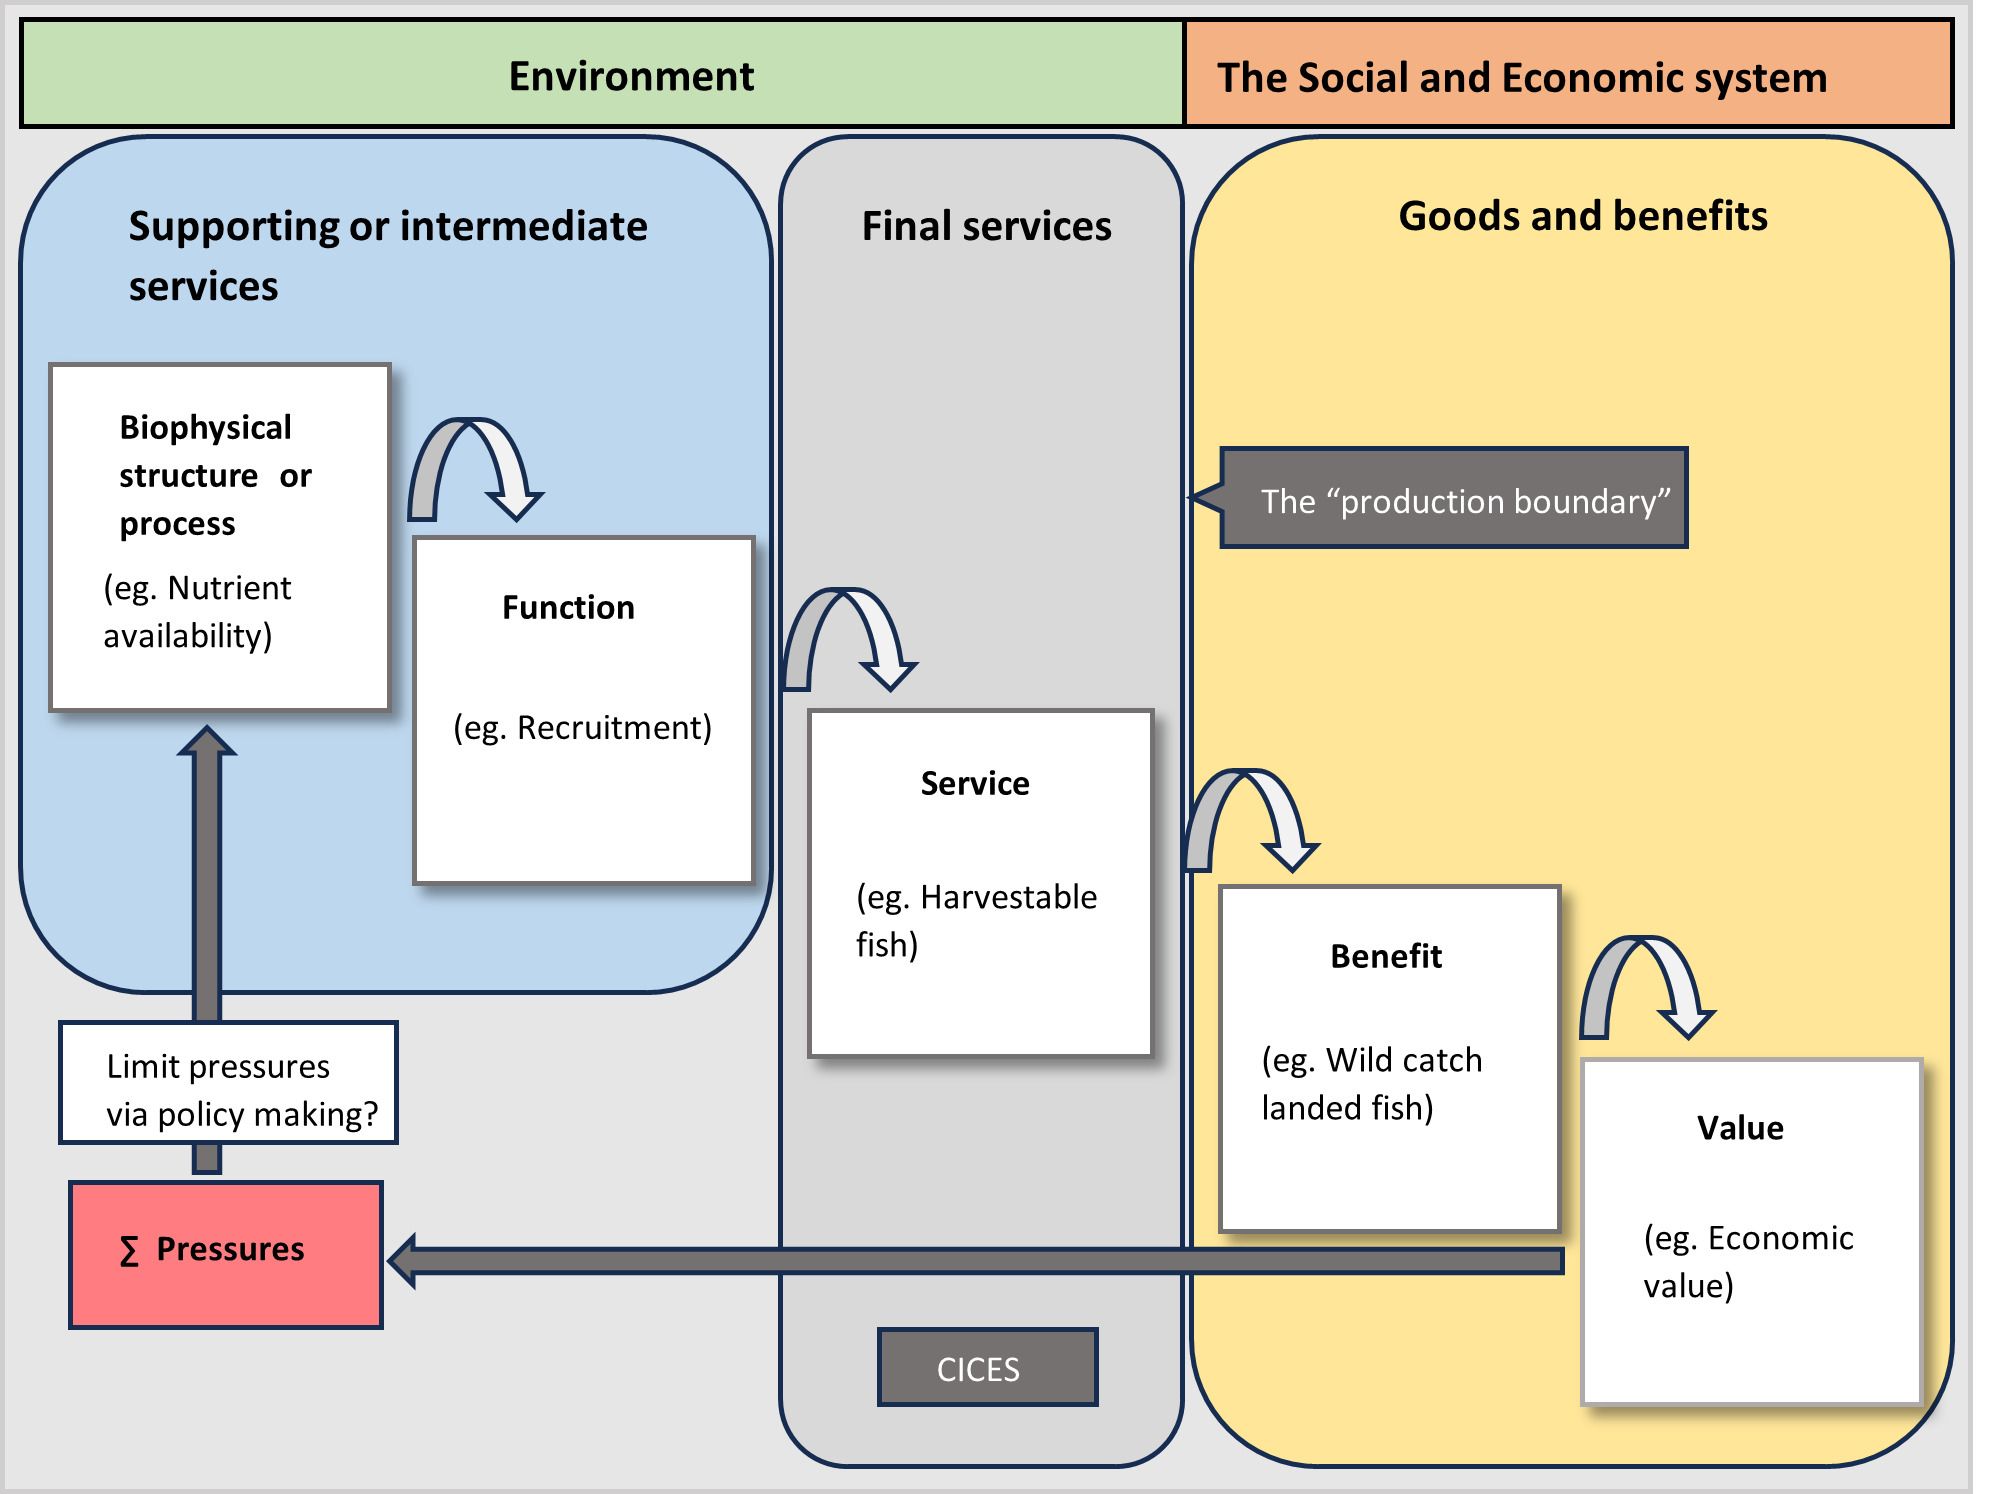
Figure 1. Cascade diagram: from structure to functions, to services to benefits to value, showing as example of ecosystem service wild fish for nutrition. Adapted from the Common International Classification of Ecosystem Services (CICES) cascade (Potschin and Haines-Young, 2017).
Nevertheless, following the CICES cascade model, multiple different frameworks have emerged with the purpose of explaining the environment-human benefit transition. Costanza et al. (2017) argued that a “linear cascade”, referring to the CICES cascade, was too simple to explain the connections between ecosystem processes, functions, and benefits to humans, as these links are complex, non-linear, and dynamic. In this study, a diagram with higher complexity was developed, describing those services equal benefits, and the many interactions and feedback that “are required” between the natural capital and other forms of capital to produce the ecosystem services (Costanza et al., 2017). More recent studies have also proposed modifications to the initial model. Elliott (2023) discussed that the cascade diagram produces overlaps between the different concepts involved, adding more confusion to the understanding of the ecosystem service flow. In his model, the ecosystem structure and functioning are considered at the same level within the natural domain (equivalent to environment, in Figure 1). The natural capital flows into the ecosystem services, classified as “provisioning aspects” and “regulating processes” (in this model, cultural services are considered as “provisioning aspects”). Then, there is a transition to the “human domain” (equivalent to social and economic system, in Figure 1), that considers the human capital and assets necessary to provide societal goods and benefits, classified as “extracted provisions”, “environmental regulation, hazard and risk reduction including safety”, and “cultural, aesthetic and health benefits”.
On the other hand, different frameworks have also been developed, without considering the CICES classification or cascade (Barbier, 2017; Culhane et al., 2020). For example, in the scheme presented by Barbier (2017), the ecosystem service is separated from the natural domain and is not distinguished from the benefit concept. This model considers the economic system to be the production of the goods and services that lead to human well-being. Although all these different models have varying perspectives, everyone concurs that there exists a - “pathway” through which ecosystem services are delivered, connecting ecological structures and processes at one end to the well-being of people at the other.
Apart from being classified, ecosystem services need to be quantified and monitored to understand their characteristics and trends (Layke et al., 2012). This is usually done using indicators. Indicators are necessary to describe not only the ecosystem services, but the ecological functions responsible for delivering them, the benefits that ecosystem services offer, and the interconnected relationships between all these elements (de Groot et al., 2010). However, direct quantification of ecosystem services is often not possible, and a significant portion of the required data lacks systematic organization and interpretation of the flow between the natural and the socio-economic systems (Balvanera et al., 2022).
Indicators for the environmental domain of the “ecosystem service production chain” are defined as physical elements of the ecosystem measurable with available tools and knowledge (Grima et al., 2023). Indicators for ecosystem benefits and value should demonstrate the realized human use of the service and its economic outcomes of the same (Hattam et al., 2015). These indicators should be understandable for decision-makers and practitioners and serve as a base for establishing an effective monitoring system for the study of ecosystem services (Feld et al., 2009).
Several authors have compiled indicators of ecosystem services, using different terminology and classifications to describe the flow between the environment and the socio-economic system (e.g. Böhnke-Henrichs et al., 2013; Liquete et al., 2013; Atkins et al., 2015; Hattam et al., 2015; Lillebø et al., 2016; Broszeit et al., 2017). Thenen et al. (2020) carried out an exhaustive compilation of marine ecosystem service indicators, following the CICES classification. In this study, the terms that did not follow the CICES criteria were adapted with the objective of having a harmonized set of indicators for each step of the CICES cascade. Also, this review groups all the indicators of the environmental part into one category (ecosystem service capacity), instead of differentiating between biophysical structure or processes and function steps of the cascade.
The difficulty to agree upon appropriate indicators, single classification system and flow models, makes it challenging to compare and provide comprehensive ecosystem service overviews (Busch et al., 2012), compromising the adoption of the whole ecosystem service concept in policies and management of marine systems (Nahlik et al., 2012). Therefore, there is an urgent need to reconcile them to consistently evaluate how the relationships between nature and society evolve, facilitating the efficient integration of these concepts into management and policymaking (McDonough et al., 2017).
In this context, the aim of this study is to test whether the CICES cascade framework is adequate to explain the flow between the natural and the socio-economic domains and identify its limitations. For proving this, firstly, we compiled and classified indicators according to the different components of the CICES cascade, for the three most studied marine ecosystem service types (Thenen et al., 2020). Secondly, to check if the CICES framework allows to explain the ecosystem service flow between the environment and the socio-economic system, the relationship between the cascade components was tested with available data from a provisioning service: the anchovy (Engraulis encrasicolus) fishery in the Bay of Biscay. This example was considered optimal for the exercise because of the large dataset available (data from 1987 to 2022), including data for each cascade step indicator, and because of the management adaptation to sustainable fisheries after a historical collapse of the species population in the Bay of Biscay and the fishery closure (Uriarte et al., 2023).
2 Materials and methods
2.1 CICES cascade indicators
The objective of this part of the study was to review indicators suitability for the CICES cascade and identify inconsistences and incoherences in their classification and implementation for three marine ecosystem services examples, one for each section (provisioning, regulation and maintenance, and cultural).
To identify the indicators, a literature search was carried out within the bibliographic Elsevier’s database “Science Direct” and grey literature, focusing on documents published between 2000 and 2024. Articles including marine ecosystem services indicator sets, for “marine ecosystem services” in general and more specifically, for the three examples of ecosystems services selected: fish for nutrition (class: “Wild animals used for the nutritional purposes” – Provisioning), carbon sequestration by marine environments (class: “Regulation of chemical composition of atmosphere and oceans” – Regulation and maintenance) and recreational marine mammal watching (class: “Characteristics of living systems that enable activities promoting health, recuperation or enjoyment through passive or observational interactions” – Cultural). The selection process began with the identification of papers using a specific set of search criteria, with the following search terms: “Marine” or “Ecosystem services” or “Indicators” or “Ecological status” or “Environmental status” or “Provisioning ecosystem service” or “Regulation and maintenance ecosystem service” or “Cultural ecosystem service” or “Fisheries” or “Carbon sequestration” or “Marine mammal recreational watching”. All articles selected were read for extraction of indicators that could fit any step of the CICES cascade.
We have followed the most updated CICES classification (Haines-Young and Potschin, 2018) to select the indicators, but also the terminology within the European Marine Strategy Framework Directive (MSFD; European Commission, 2008). Merging both terminologies, allow to link ocean health (= “good environmental status”, within the MSFD) to the human activities and pressures that compromise it, and ultimately to the services and benefits available. Hence, the indicators were classified as shown below (Table 1).

Table 1. Common International Classification of Ecosystem Services (CICES) cascade step term followed by its definition and one indicator example: MSFD, Marine Strategy Framework Directive.
Indicators identified in the literature are collated in Appendix Tables A1–A3. First, they were assigned to a step of the CICES cascade, according to the reference from which they had been extracted (Appendix, columns A, “Original classification”). Then, each indicator was cross-checked with the CICES cascade definitions (Table 1) and reclassified, if needed (Appendix, columns B, “Proposed classification in the CICES framework”). For indicators accounting for same or similar concepts, harmonization was carried out using common criterion between the different ways of describing what the indicators represent. For example, in the case of the original indicators: “Fish catch” (Appendix Table A1, line 160) and “Amount of fish captured” (Appendix Table A1, line 162), considering that both indicators make reference to the same concept we thought that “Fish catch” was a more accurate and simple description for that example, so we used it to harmonize both indicators. The first classification of indicators was carried out by the main author (AOA) and afterwards reviewed by all co-authors.
Each indicator was assigned to one of these three categories: (i) “correct”, when the indicator was originally classified according to CICES criteria, and assigned to the correct step of the cascade (in Appendix Tables A1–A3, cells highlighted in green); (ii) “incorrect”, when the indicator was originally classified according to CICES criteria, but assigned to an incorrect step of the cascade (e.g., a function indicator incorrectly classified in the original source as a service indicator) (in Appendix Tables A1–A3, cells highlighted in red); and (iii) “other terms”, for indicators extracted from articles that did not follow the CICES classification (e.g., ecosystem service flow, ecosystem service capacity, essential ecosystem service variables) (in Appendix Tables A1–A3, cells highlighted in blue).
The total number and corresponding percentage of indicators classified as “correct”, “incorrect” and “other terms” were calculated, considering the ecosystem service section and the step of the cascade that they belong to.
2.2 Practical application to the anchovy fishery
The study area of the anchovy stock, the Bay of Biscay, is an open oceanic bay in the northeastern part of the Atlantic Ocean (Figure 2). Its complex hydrological regime and weather pattern exhibit both temporal and geographical heterogeneities (Borja et al., 2019). An average weak oceanic circulation characterizes this bay, cyclonic and anticyclonic eddies, a poleward flow along the slope driven by wind and density gradients, tidally induced currents over the continental shelf, and freshwater runoff and river plumes, especially from the large French rivers, such as the Garonne (Koutsikopoulos and Le Cann, 1996). Moreover, the seasonality is very evident, and mean sea surface temperature varies between 12°C at the end of winter and over 20°C at the beginning of summer (Koutsikopoulos and Le Cann, 1996), showing an increasing trend of the temperature because of global climate change (Chust et al., 2022).
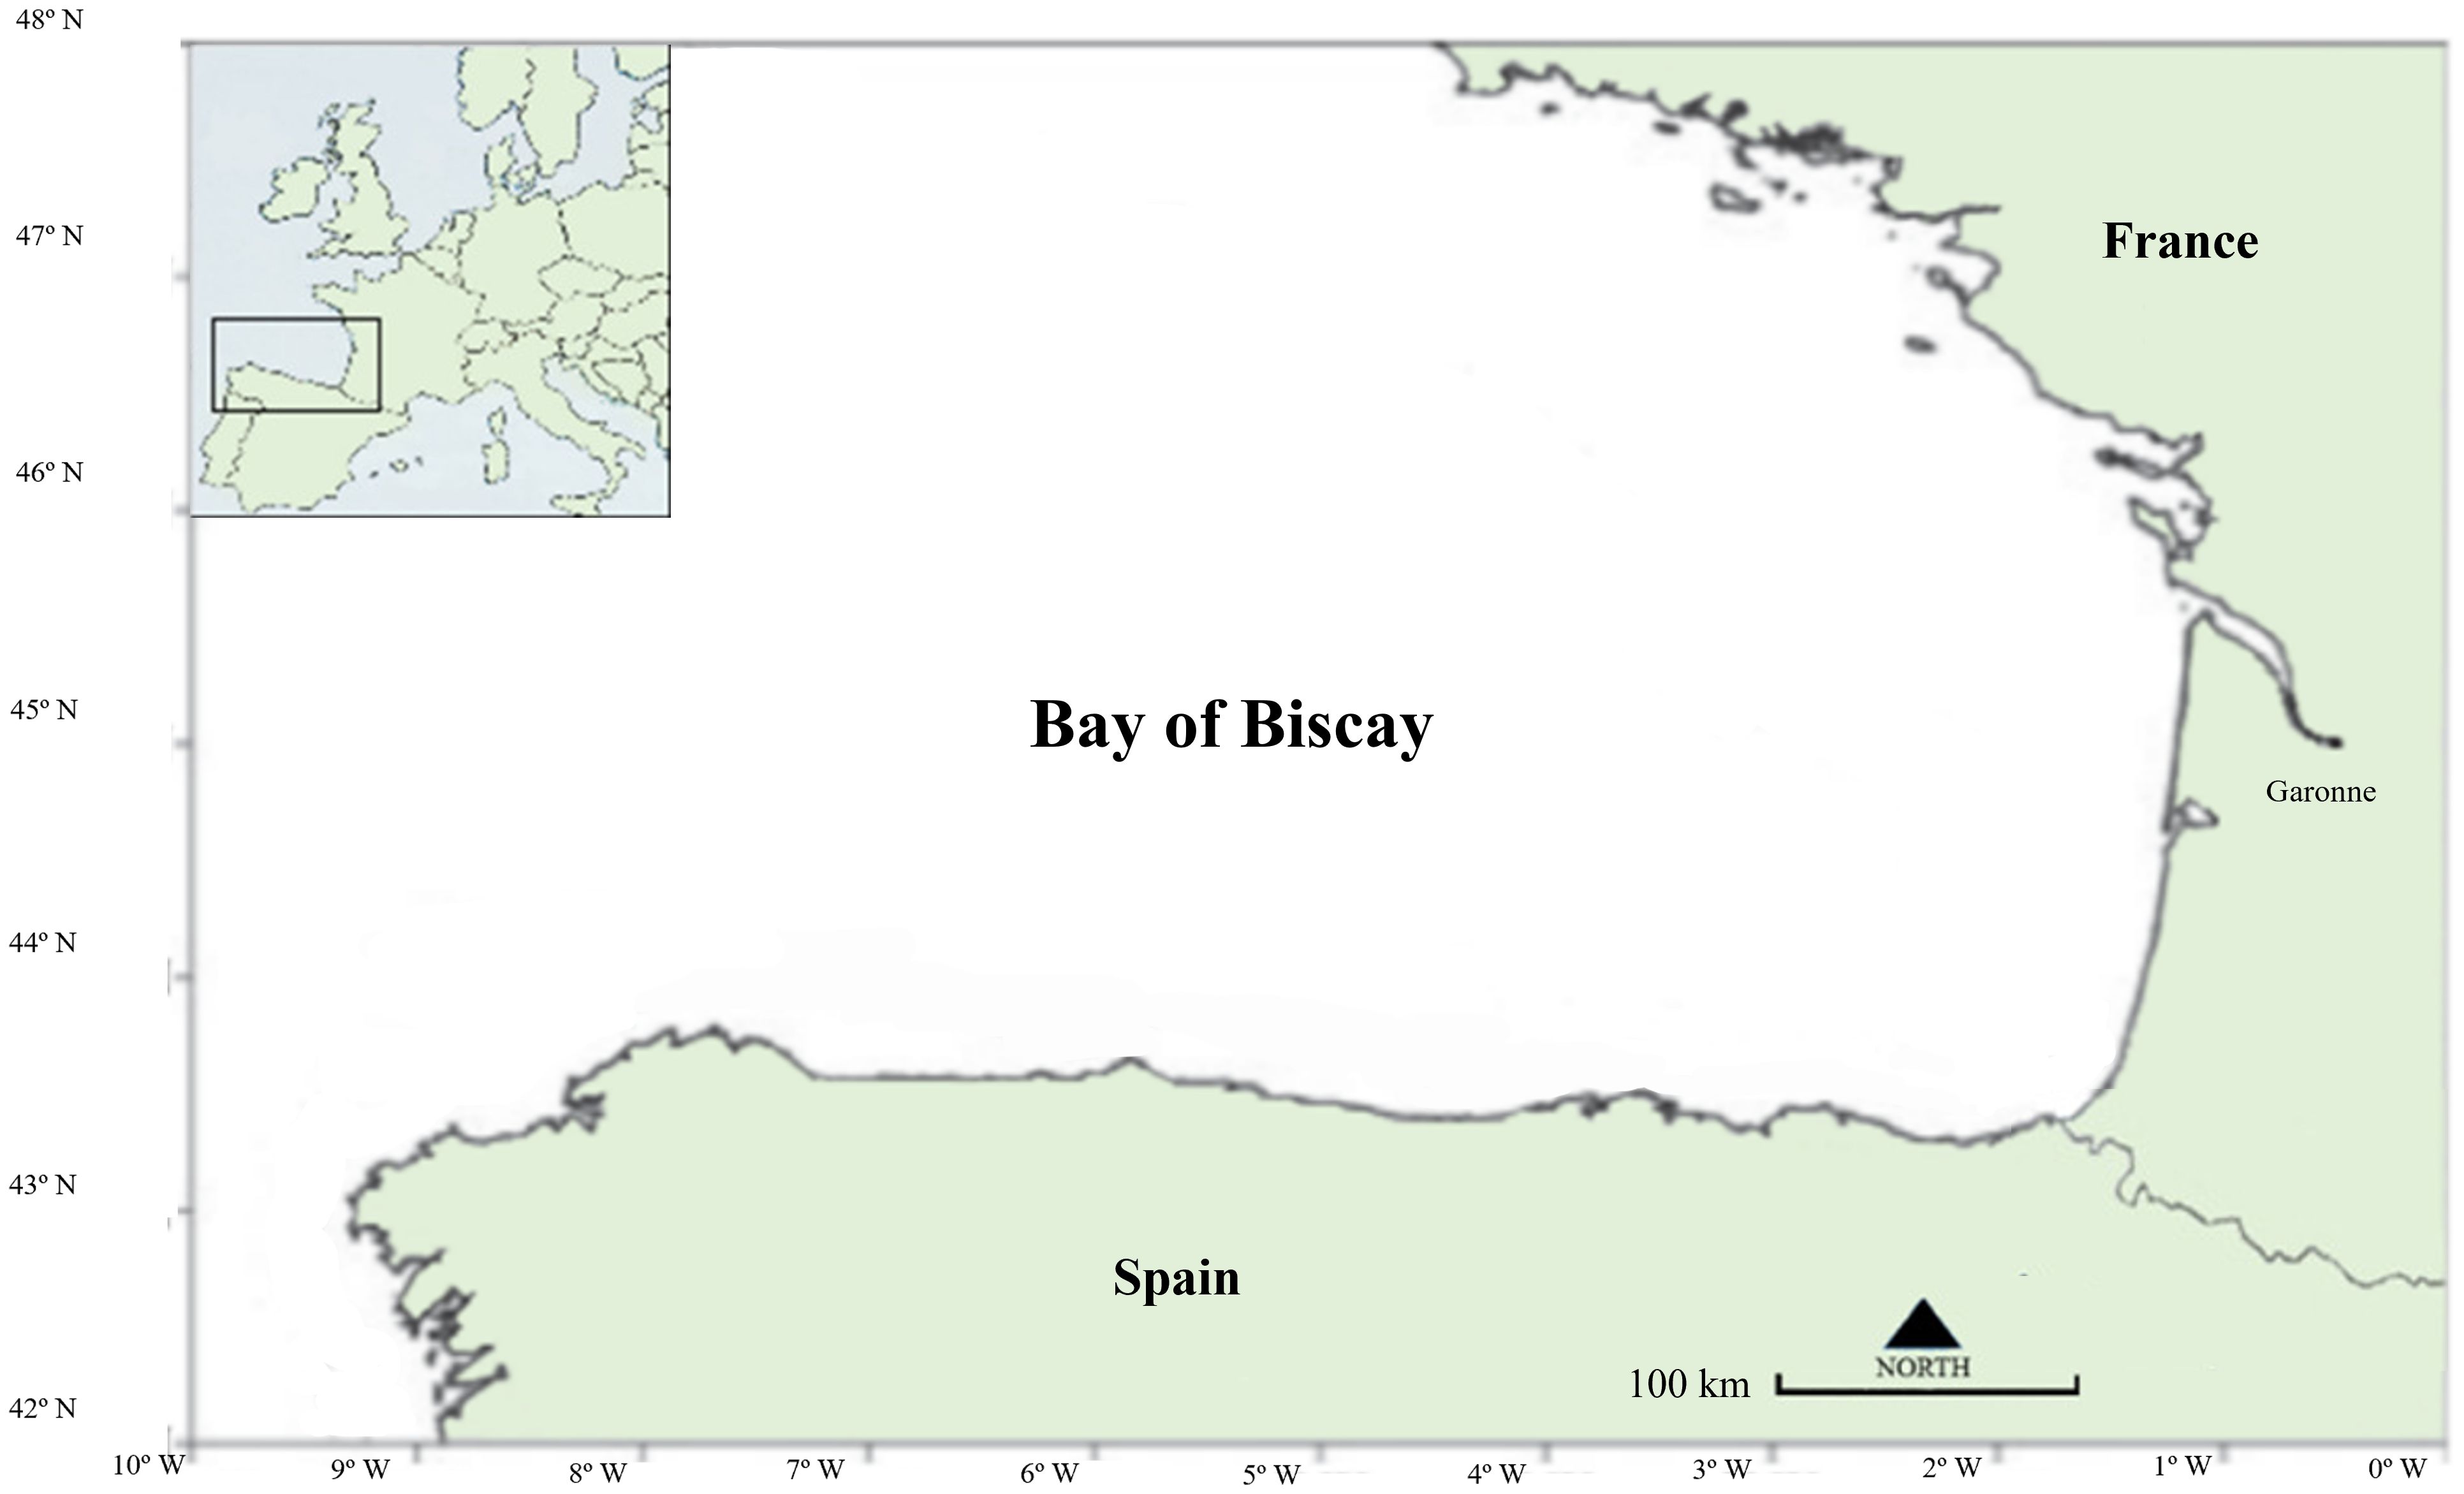
Figure 2. Study area within the Bay of Biscay, to demonstrate with a practical case the Common International Classification of Ecosystem Services (CICES cascade).
The European anchovy (Engraulis encrasicolus) is a small pelagic fish with a short life cycle and a maximum lifespan of 4 years (Motos, 1996; Petitgas et al., 2013; Uriarte et al., 2016). This species is characterized by rapid growth, high fecundity, and mortality (Motos, 1996). The distribution of this species extends from NW Africa in the south to the North Sea and the Baltic Sea in the north, as well as the Mediterranean Sea, Black Sea, and Azov Sea (Reid, 1966). E. encrasicolus has a wide distribution with differentiated populations, and one of these populations is located in the Bay of Biscay (Motos, 1996). The peak of anchovy spawning tends to occur in spring when the environment experiences rapid change. According to Koutsikopoulos and Le Cann (1996) and Sanz and Uriarte (1989), this peak can be brought on by changes in the amount of daylight, the direction of the wind, a decline in freshwater runoff, or a rise in atmospheric and seawater temperatures. The spawning season takes place between March and August (Motos, 1996).
The one-year-old anchovy of the Bay of Biscay recruits support, on average, 60% of the spawning stock biomass (SSB) and most of the annual catch (25-87%) (ICES, 2021). After several years of recruitment failures under a constant capture regime, the fishery collapsed and was closed (2005–2009) (Vermard et al., 2008). Due to the inability to anticipate the size of the population during the first half of the year, when the main fishery occurred, precautionary advice was neglected (Uriarte et al., 2023). In 2008, the EU implemented a long-term management strategy in response to the collapse. The biological risk was reduced in the absence of a recruitment indication by closely coordinating evaluation, guidance, and management, and shifting the management year to begin immediately following the adult spring surveys (Roel, 2009; Uriarte et al., 2023). The addition of an early recruitment indicator from a fall acoustic study on juveniles (Boyra et al., 2013) marked significant progress in 2014 (Uriarte et al., 2023). This permitted further resource utilization at comparable risk levels. As a result, Total Allowable Catches (TACs) are now set on a management calendar basis following the recruit survey. This strategy was unanimously approved and established a successful participatory fishery management approach (Uriarte et al., 2023).
For the anchovy case study, indicators for each different step of the CICES cascade were selected. For the pressure, harvest rate (Table 1) was chosen as the ratio between landings and total stock abundance, which is estimated from the stock assessment with SSB (Ibaibarriaga et al., 2011). The median SSB estimates are considered similar to the true population i.e. the complete stock abundance (Uriarte et al., 2023). Regarding the cascade steps, for the biophysical structure or processes, upwelling index was chosen as the indicator (Table 1). Upwelling is an oceanographic phenomenon that involves wind-driven motion of dense, cooler, and usually nutrient-rich water from deep water towards the ocean surface. Upwelling, and the associated turbulence, have been identified in small pelagic fishes as one of the biophysical processes that can explain the success in recruitment (Bakun and Parrish, 1982), also including the European anchovy (Borja et al., 1998). For the function step, recruitment at age 0 (Table 1), which is the most determinant factor that regulates the anchovy population size, and in general fish population, is their recruitment. Recruitment is the process through which small, juvenile fish advance to an older, larger life stage (Camp et al., 2020). The data available for anchovy recruitment were “Recruitment at age 1”, in tonnes, which is the recruitment that can be caught, when the anchovy reaches its legal size for fishing (Uriarte et al., 1996). One-year-old anchovy supports on average 60% of the total SSB. However, for the needs of the CICES cascade, the indicator used was the recruitment at age 0. To estimate it, natural mortality was applied to the data of age 1, and the tonnes available one year earlier were calculated. In the case of service, SSB (Table 1), that can be defined as the combined weight of all individuals in a fish stock that have reached sexual maturity and are capable of reproducing. The estimation of SSB is accomplished by applying the Daily Egg Production Method (DEPM) (Lasker, 1985). For the benefit step the total catch landed of the anchovy was chosen, while for the value, the economic value of the catch, obtained by the fleets of first sale after landings, was selected.
The statistical analysis was carried out using R studio. Linear regression analysis was carried out to check whether these indicators statistically determined the state of the following step of the CICES cascade and how. The linear regressions were performed for three periods: The complete period (1987-2022), before the anchovy fisheries collapse (1987-2004) and after the collapse period (2010-2022). The temporal series was studied separately because the patterns of the links were different, due to the fisheries collapse. The collapse period (2005-2009) was not taken into account as some data were missing due to the fisheries closure. The relationships were analyzed for normality and linearity, respectively. In the case where the regression distribution was not normal (catch vs SSB 1987-2021; Economic value (EV) vs catch 2010-2022), skewness test was carried out to check which variable was asymmetric, and a logarithmic transformation was applied in these cases.
3 Results
3.1 CICES cascade indicators
In total, 84 articles were initially identified, from which only 21 were used finally to extract indicators (Appendix Tables A1–A3). In most cases, the discarded articles either did not include indicators or the indicators included were considered not useful as in relation to the CICES cascade.
The total number of indicators identified in the selected articles was 313. The number of indicators found differed between each ecosystem service type, with provisioning services having the highest number (“wild fish for nutrition”; n: 213), followed by regulation and maintenance services (“carbon sequestration by marine environments”; n: 153), and cultural services (“recreational marine mammal watching”; n: 116) (Figure 3). Despite the differences in number, the proportion of indicators classified across the three different categories (e.g., CICES cascade indicators, “incorrectly” classified and other terms) was similar between the three ecosystem service examples. The indicators correctly classified, according to CICES cascade, represented 39%, 39% and 43%, for provisioning, regulation and maintenance, and cultural, respectively. Similarly, 41%, 32%, and 45% of the provisioning, regulation and maintenance, and cultural indicators were identified by the authors as having been incorrectly classified in the original source. Finally, the indicators classified as other terms were 20% (provisioning), 29% (regulation and maintenance), and 11% (cultural).
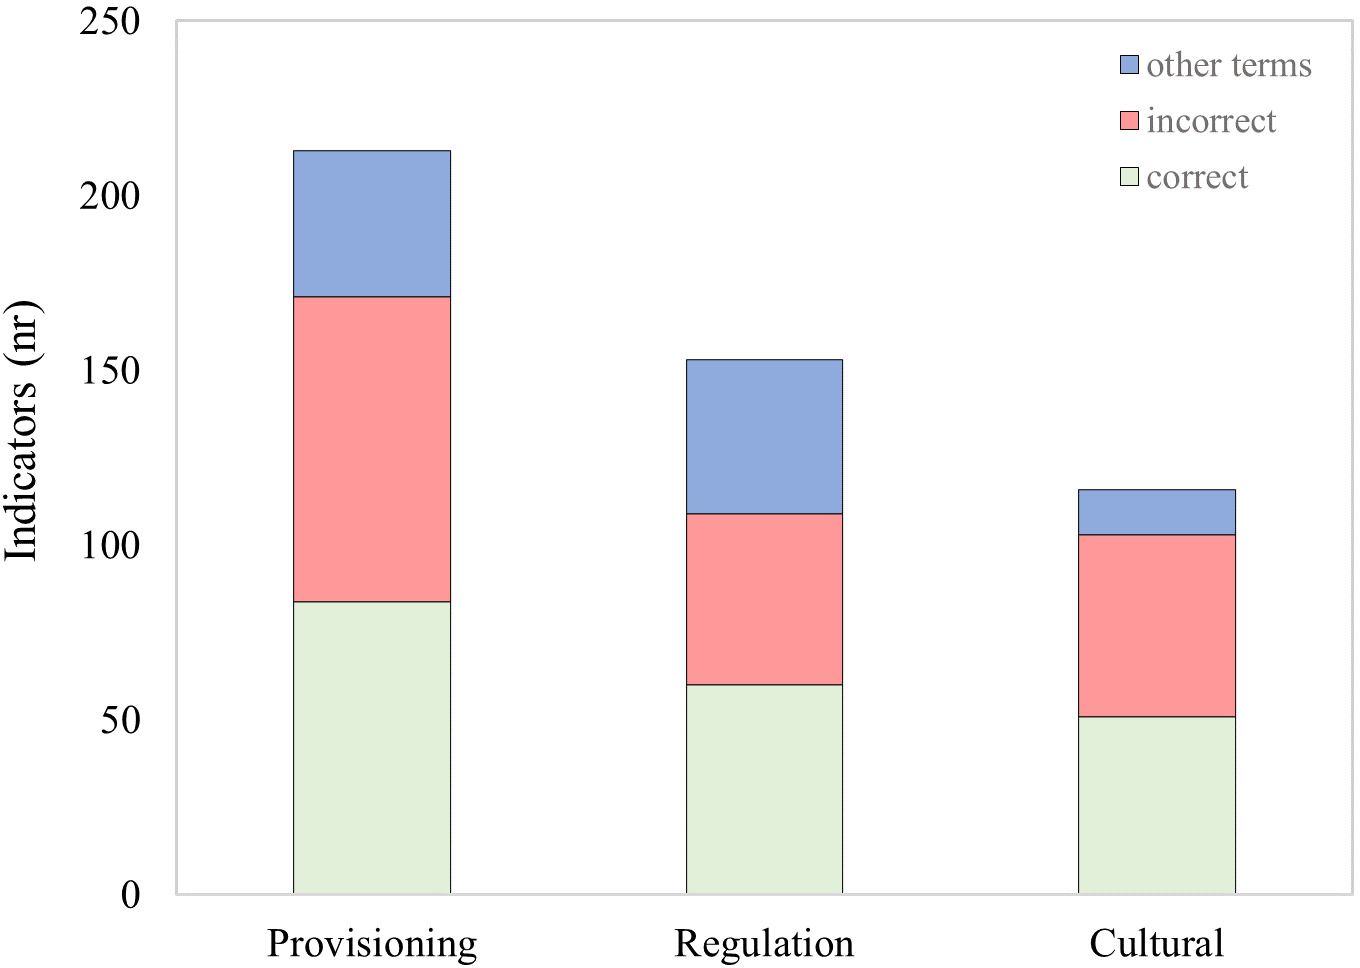
Figure 3. Total number of indicators for the three ecosystem services (ES) studied: provisioning (wild fish for nutrition), regulation and maintenance (carbon sequestration by marine environments), and cultural (recreational marine mammal watching). Different colors represent the number of indicators that the authors considered that are correctly classified according to CICES (Common International Classification of Ecosystem Services) in the literature (green), the incorrectly classified ones (red) and other terms (e.g. ecosystem service flow, ecosystem service capacity, essential ecosystem service variables) (blue).
The distribution of indicators across different CICES cascade components was not homogeneous within the selected ecosystem services (Figure 4). The total number of indicators regarding the cascade steps was: Biophysical structure and processes (54), Function (76), Service (14) Benefit (72), and Value (69).
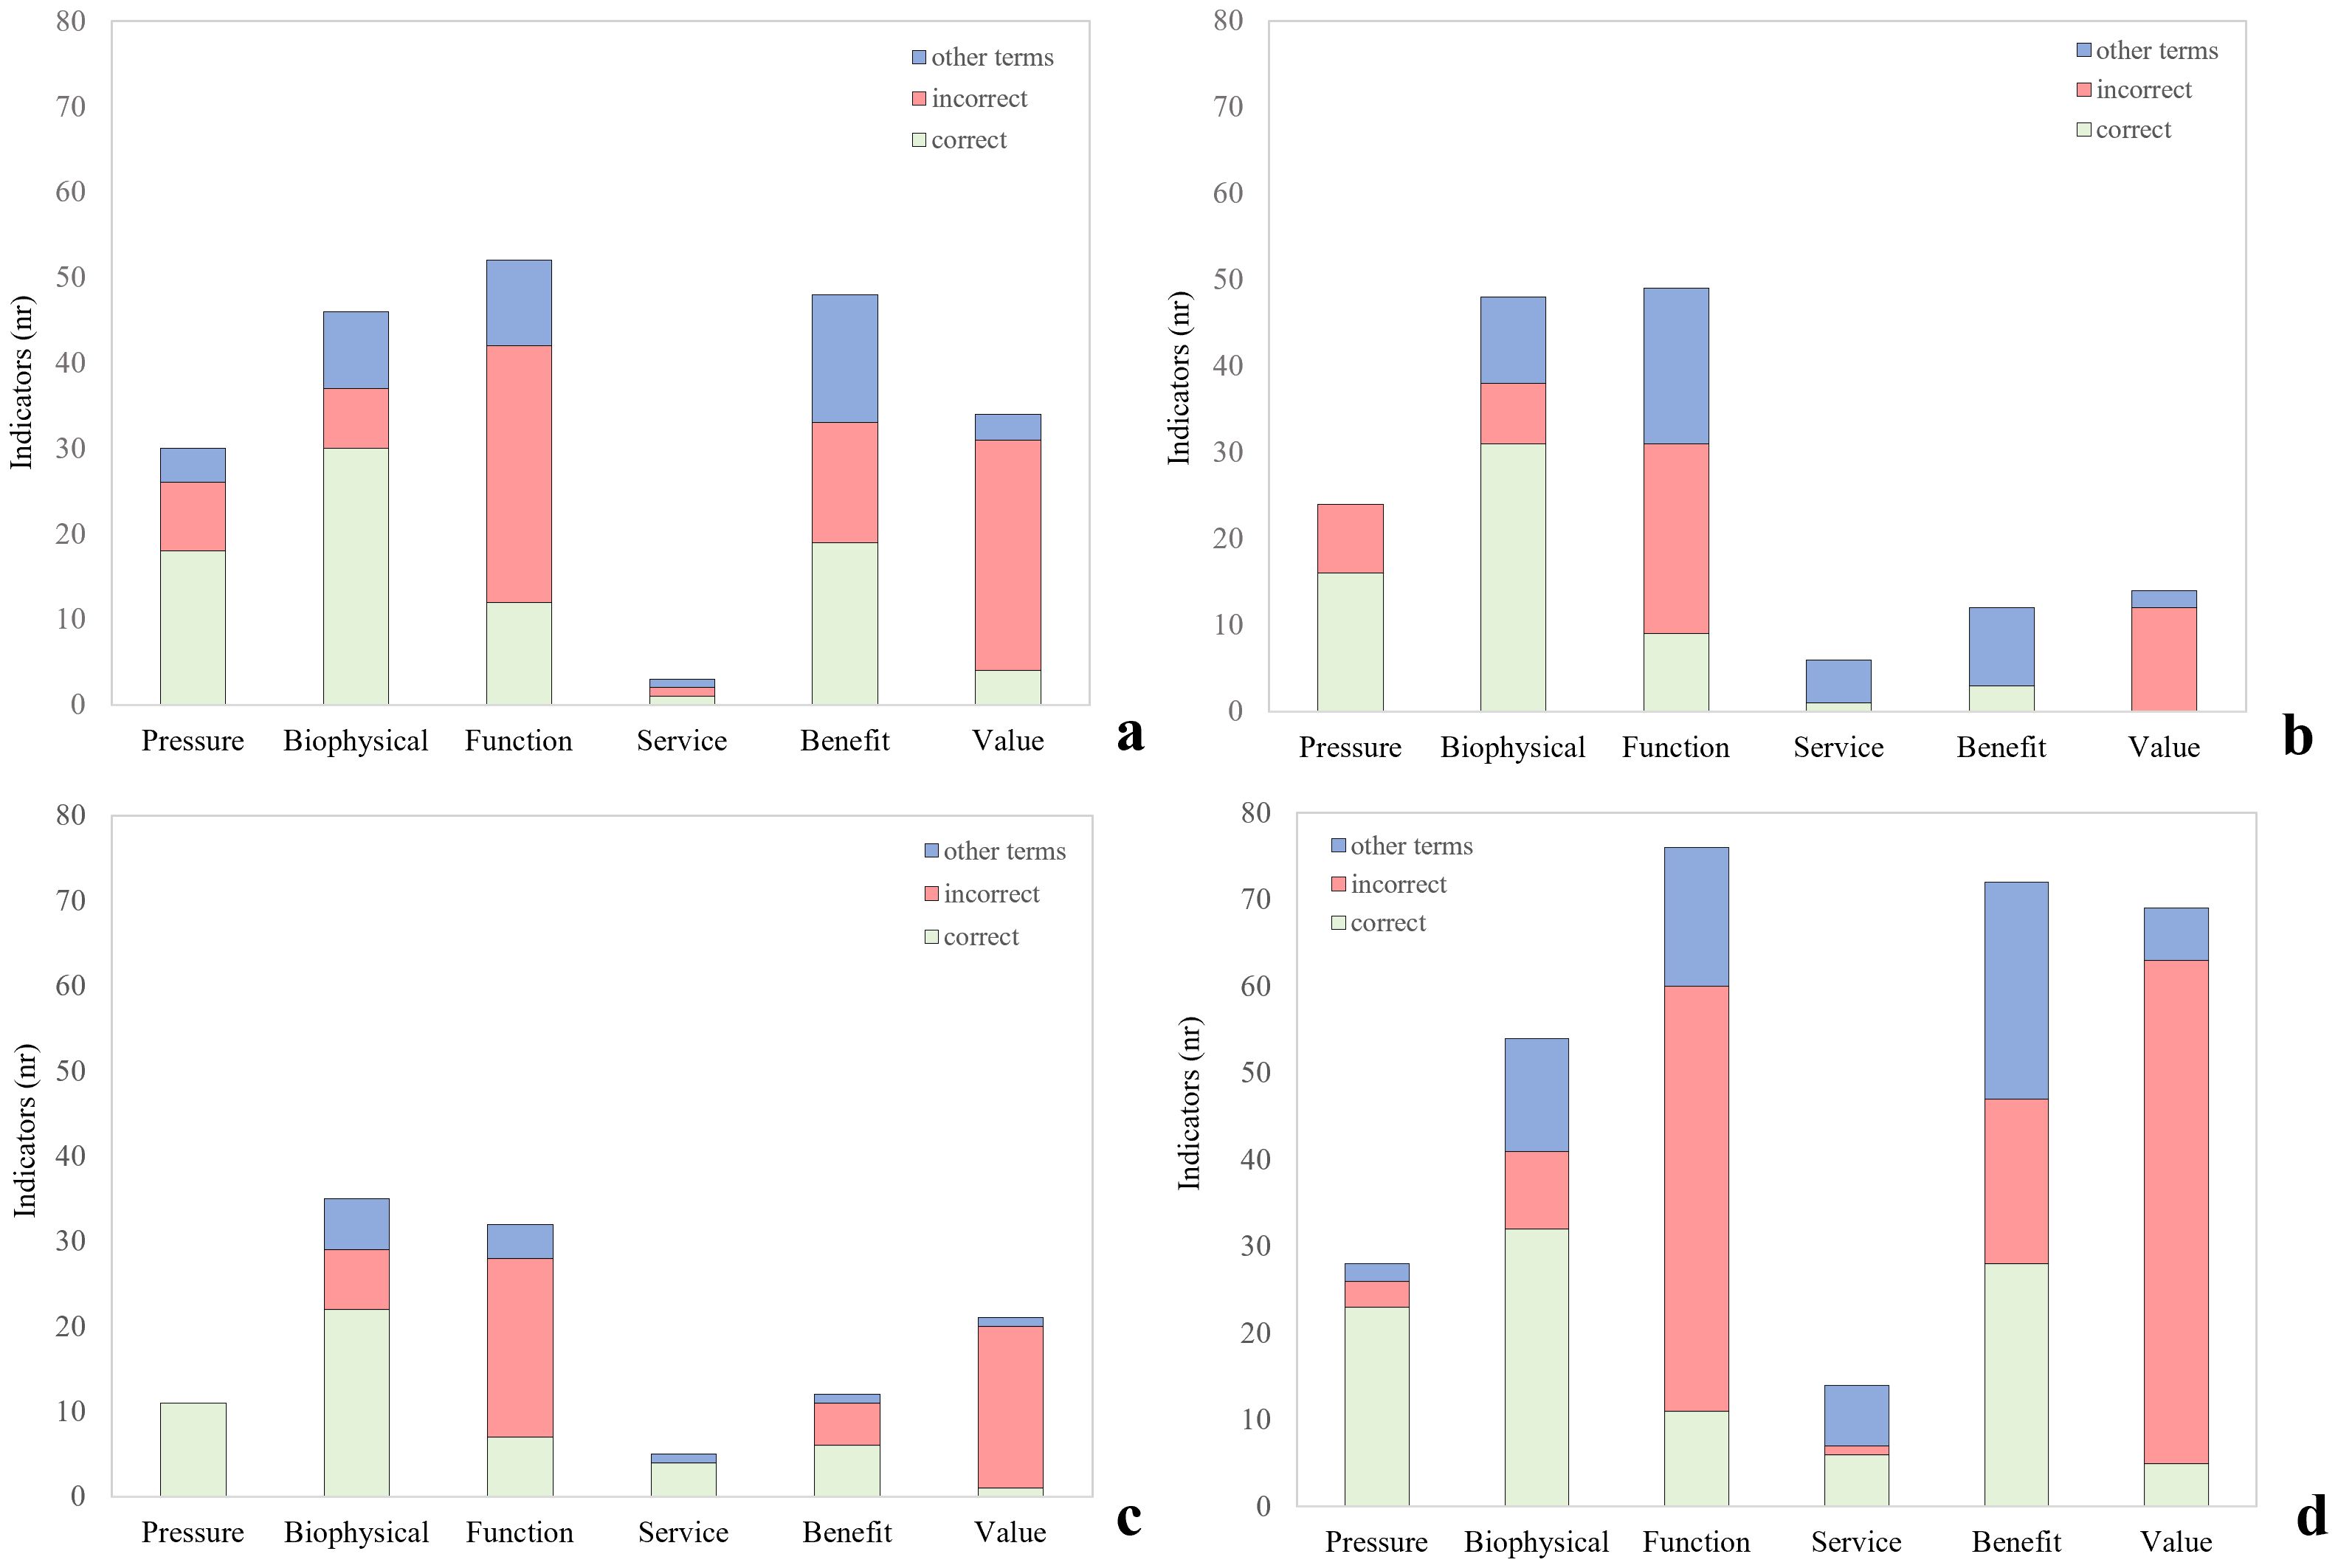
Figure 4. Number of indicators found in the literature for three ecosystem services (ES) examples [(a) provisioning; (b) regulation and maintenance; (c) cultural; (d) the total indicator number for the three examples], assigned to the different CICES (Common International Classification of Ecosystem Services) cascade components (i.e., pressure, biophysical structure or processes, function, service, benefit, and value) Indicators classified according to CICES in the literature consulted, the ones incorrectly classified, and the ones classified as ecosystem service variables are represented.
Most “biophysical” indicators were adequately classified according to the CICES framework provisioning (65%), regulation and maintenance (62%) and cultural (63%). Comparing the three ecosystem service examples (Figures 4a–c) with the graph showing the total amount of indicators (Figure 4d), it can be observed that the number of indicators for this cascade component did not vary much: provisioning (46), regulation and maintenance (50) and cultural (35).
However, in the case of the “functioning” indicators, more than 50% of the indicators found in the literature had not been adequately classified (i.e., observe blue/red ratios, for function bars, in Figure 4d). In this case, provisioning, regulation and maintenance, and cultural indicators (33%, 27% and 59%, respectively) had been classified at the biophysical structure and processes step, instead of at the functioning step Appendix Tables A1–A3.
The lowest number of indicators corresponded to “service” indicators, for which only 14 were found (Figure 4d). In this case only 25% of the indicators were correctly classified, 25% incorrectly classified and the remaining 50% as other terms. Those 43 indicators that had been incorrectly classified in their sources, 25 related to provisioning service, 10 to regulation and maintenance, and 8 to cultural ecosystem services.
In the benefit and value boxes of the CICES cascade, the indicators found for provisioning were much higher than the ones for regulation and maintenance or cultural services (Figures 4a–c). In the case of the provisioning service, 48 benefit and 34 value indicators were found, in the case of regulation and maintenance 12 benefit and 14 value indicators, and for cultural, 12 benefit and 21 value indicators. All the indicators were unique for each ecosystem service. In the case of provisioning, most of the indicators found for value were incorrectly classified as benefit or service or classified as ecosystem service indicators.
In the case of pressure, the provisioning service has the highest number of indicators (30), followed by regulation and maintenance (24), being the cultural service again the one with less indicators (11) (Figures 4a–c). In this case, the majority of the indicators were correctly classified according to MSFD, i.e. provisioning (60%), regulation and maintenance (67%) and cultural (100%) (Figures 4a–c).
3.2 Practical application to the anchovy fishery
The relationship between pressure on anchovy fishery (measured as harvest rate) and two of the CICES cascade components (Function, as Recruitment at age 0, and Service, as SSB) was determined using linear regression analysis (Table 2). The results showed a negative and statistically significant regression for the complete period (1987-2022) for both relationships (recruitment vs harvest rate, p-value: 0.009; and SSB vs harvest rate, p-value < 0.001). However, when exploring the Pressure effect separately before and after the anchovy fisheries collapse, this relationship was not significant for either the function or the service components (Table 2).
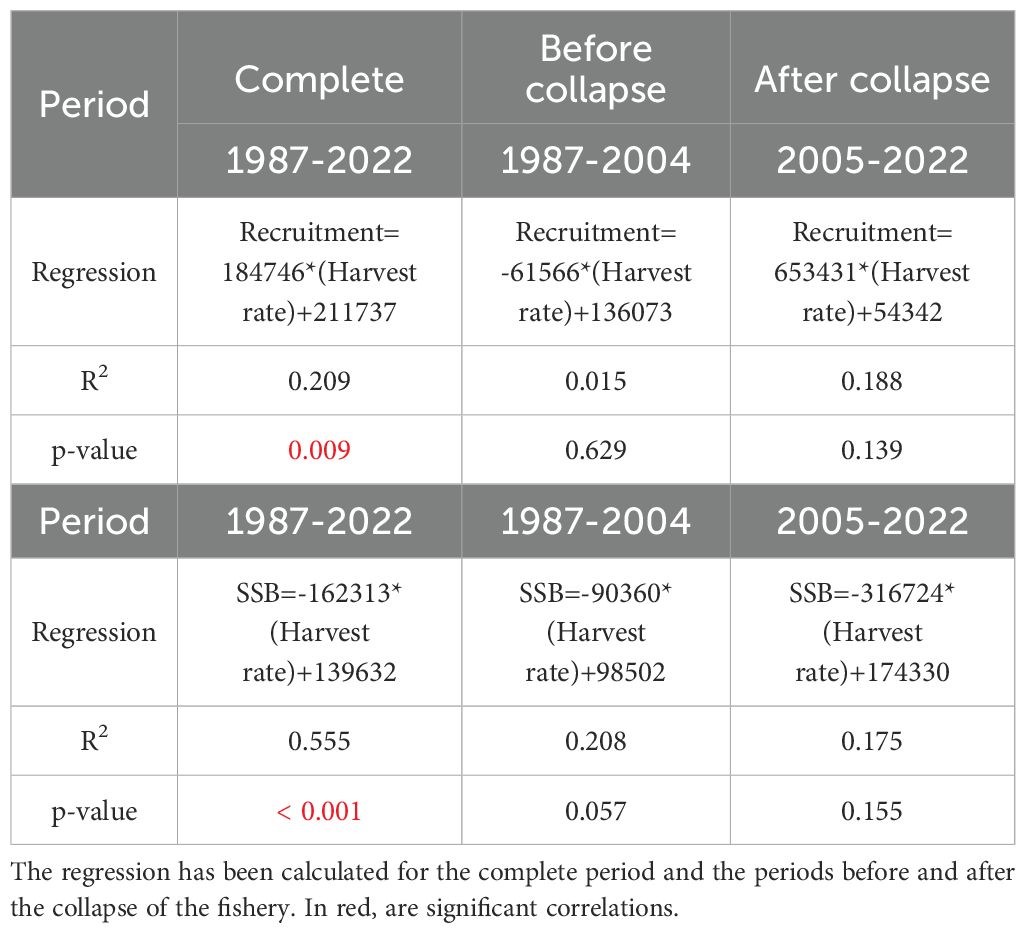
Table 2. Pressure effect, as harvest rate of anchovy, on Function (Recruitment at age 0) and Service (Spawning Stock Biomass, SSB), represented by linear regression and p-value.
This temporal variation of recruitment and SSB as in relation to harvest rate is graphically represented in Figure 5. Several periods can be identified: (i) between 1987 and 1996, the pressure values were very high, (i.e., harvest rates ranging between 0.5 and 0.74), the recruitment values ranged from 20,080 to 193,041 t and the SSB values from 14,917 to 72,428; (ii) this was followed by a period (1998-2004) with moderate harvest values, that ranged between 0.35 and 0.54, which coincide with a dramatic drop in the recruitment (from 204,823 to 9,394 t) and the SSB (from 89,496 to 29,989 t); (iii) the third period, extends from 2005 to 2009, which coincides with the anchovy fisheries collapse, in which the harvest rate values suffered a dramatic decrease (<0.1) and with very low recruitment and SSB values; and, finally, (iv) the period after the collapse (2010-2022), characterized by low-pressure values (harvest rate between 0.15 and 0.3), and increasing recruitment and SSB values, reaching the maximum of the series.
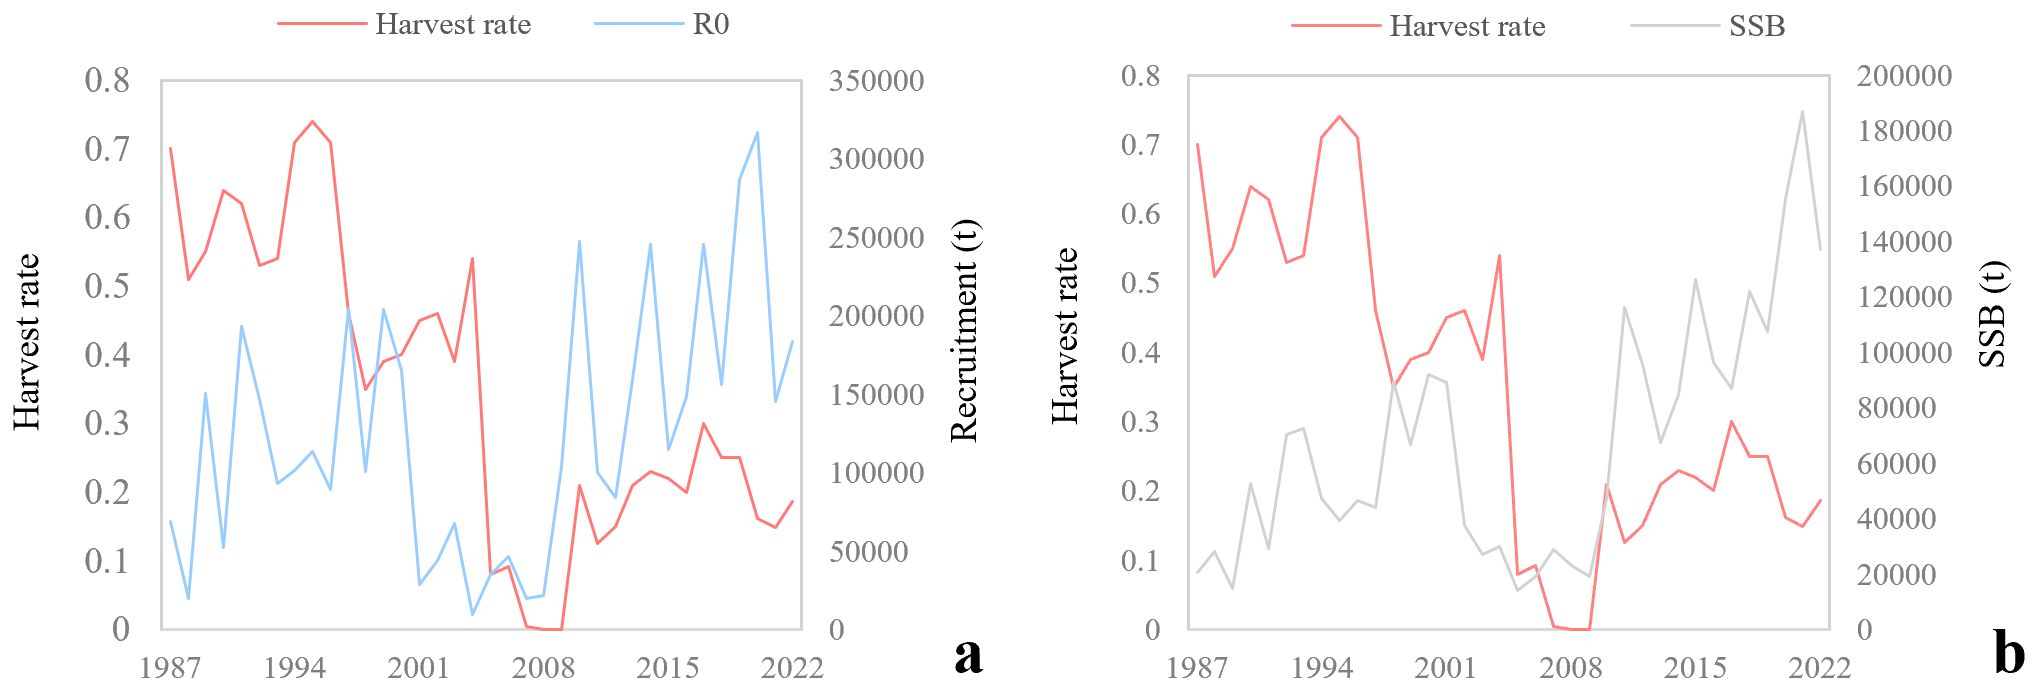
Figure 5. Temporal variation of pressure (harvest rate) with (a) function (recruitment at age 0) and (b) service (spawning stock biomass, SSB).
As a second step, when exploring the links between the different parts of the CICES cascade (i.e., Biophysical components or processes – Function; Function – Service; Service – Benefit; Benefit – Value), the Biophysical components or processes (Upwelling index) did not significantly determine the Function (Recruitment) (Table 3). However, the Function (Recruitment) significantly determined the service (SSB) (p-value < 0.001) (Table 3). The service (SSB, t) showed to affect the anchovy fisheries benefit (Catch, t) significantly and positively for the three periods too (Table 3). The service (SSB) explained for 70% of the catch before-collapse period and after-collapse the relationship seems to be weaker. Finally, the relationship between the benefit (catch, t) and value (€) was only significantly positive for the after-collapse period (p-value: 0.008).
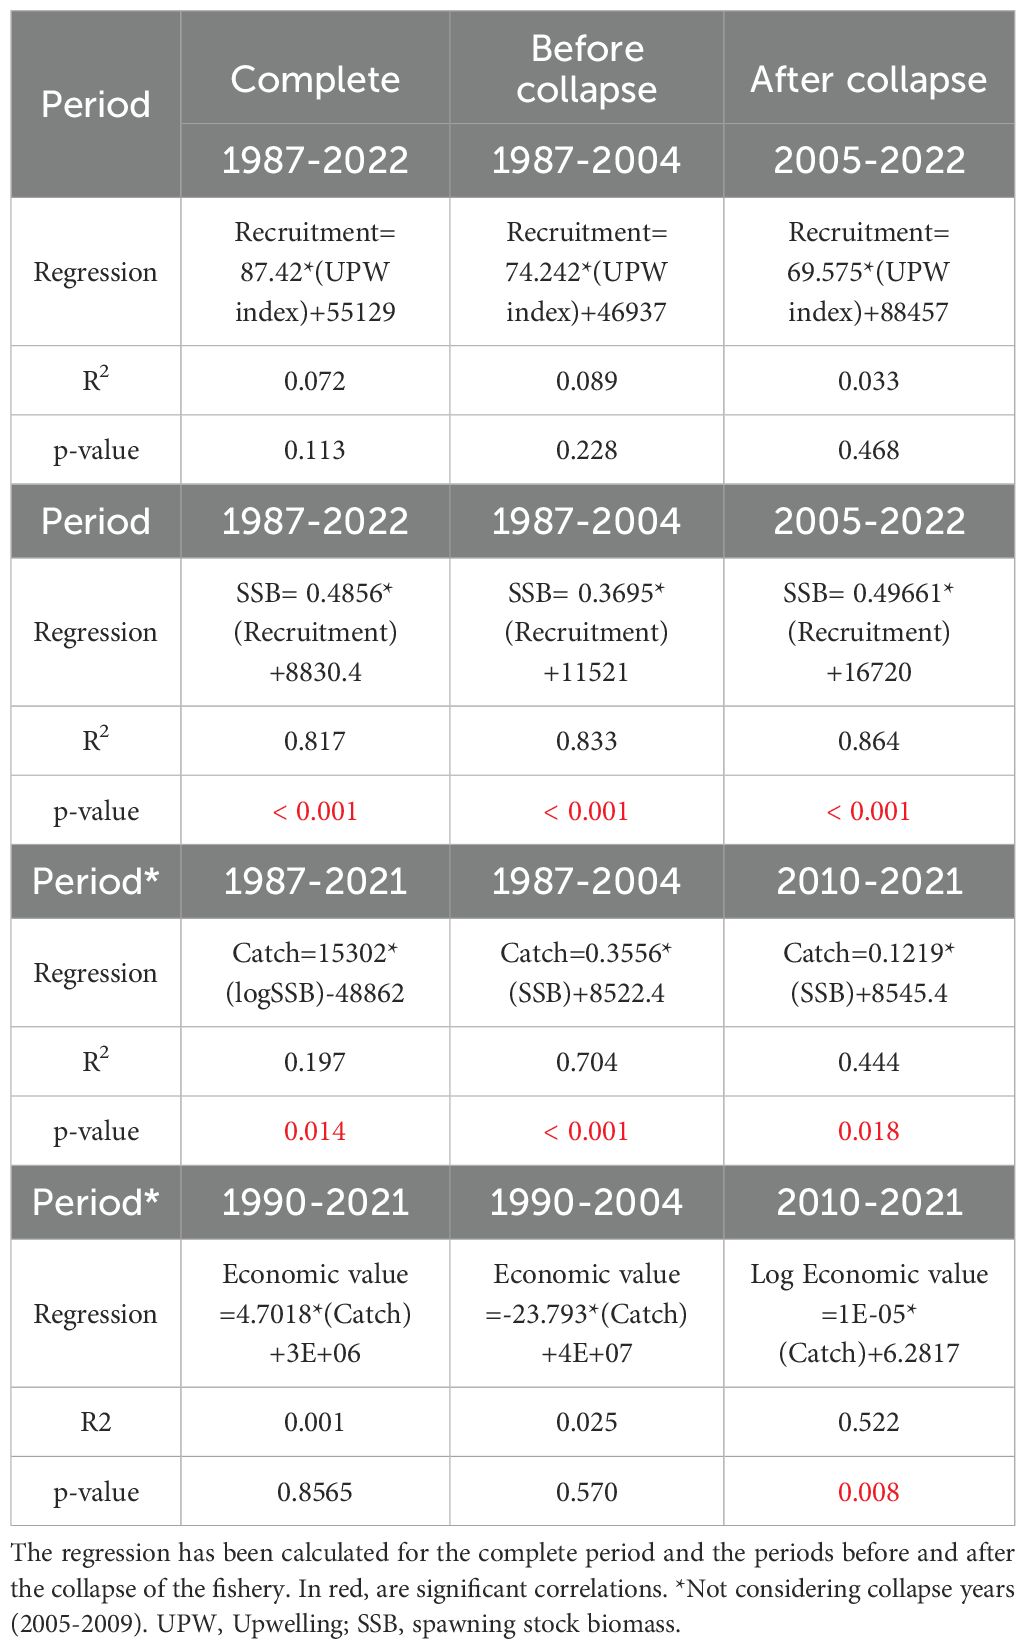
Table 3. CICES (Common International Classification of Ecosystem Services) cascade component relationships represented by linear regression and p-value.
A representation of these links between the different pairs of CICES cascade components can be observed in Figure 6. Although the relationship between the upwelling index and recruitment was not significant, certain similarities in the evolution pattern can be seen (Figure 6a). Periods of higher upwelling values (i.e., 1989-1997 and 2010-2021) corresponded to higher recruitment values, whilst lower upwelling values (1998-2009) matched with lower recruitment (Figure 6a).
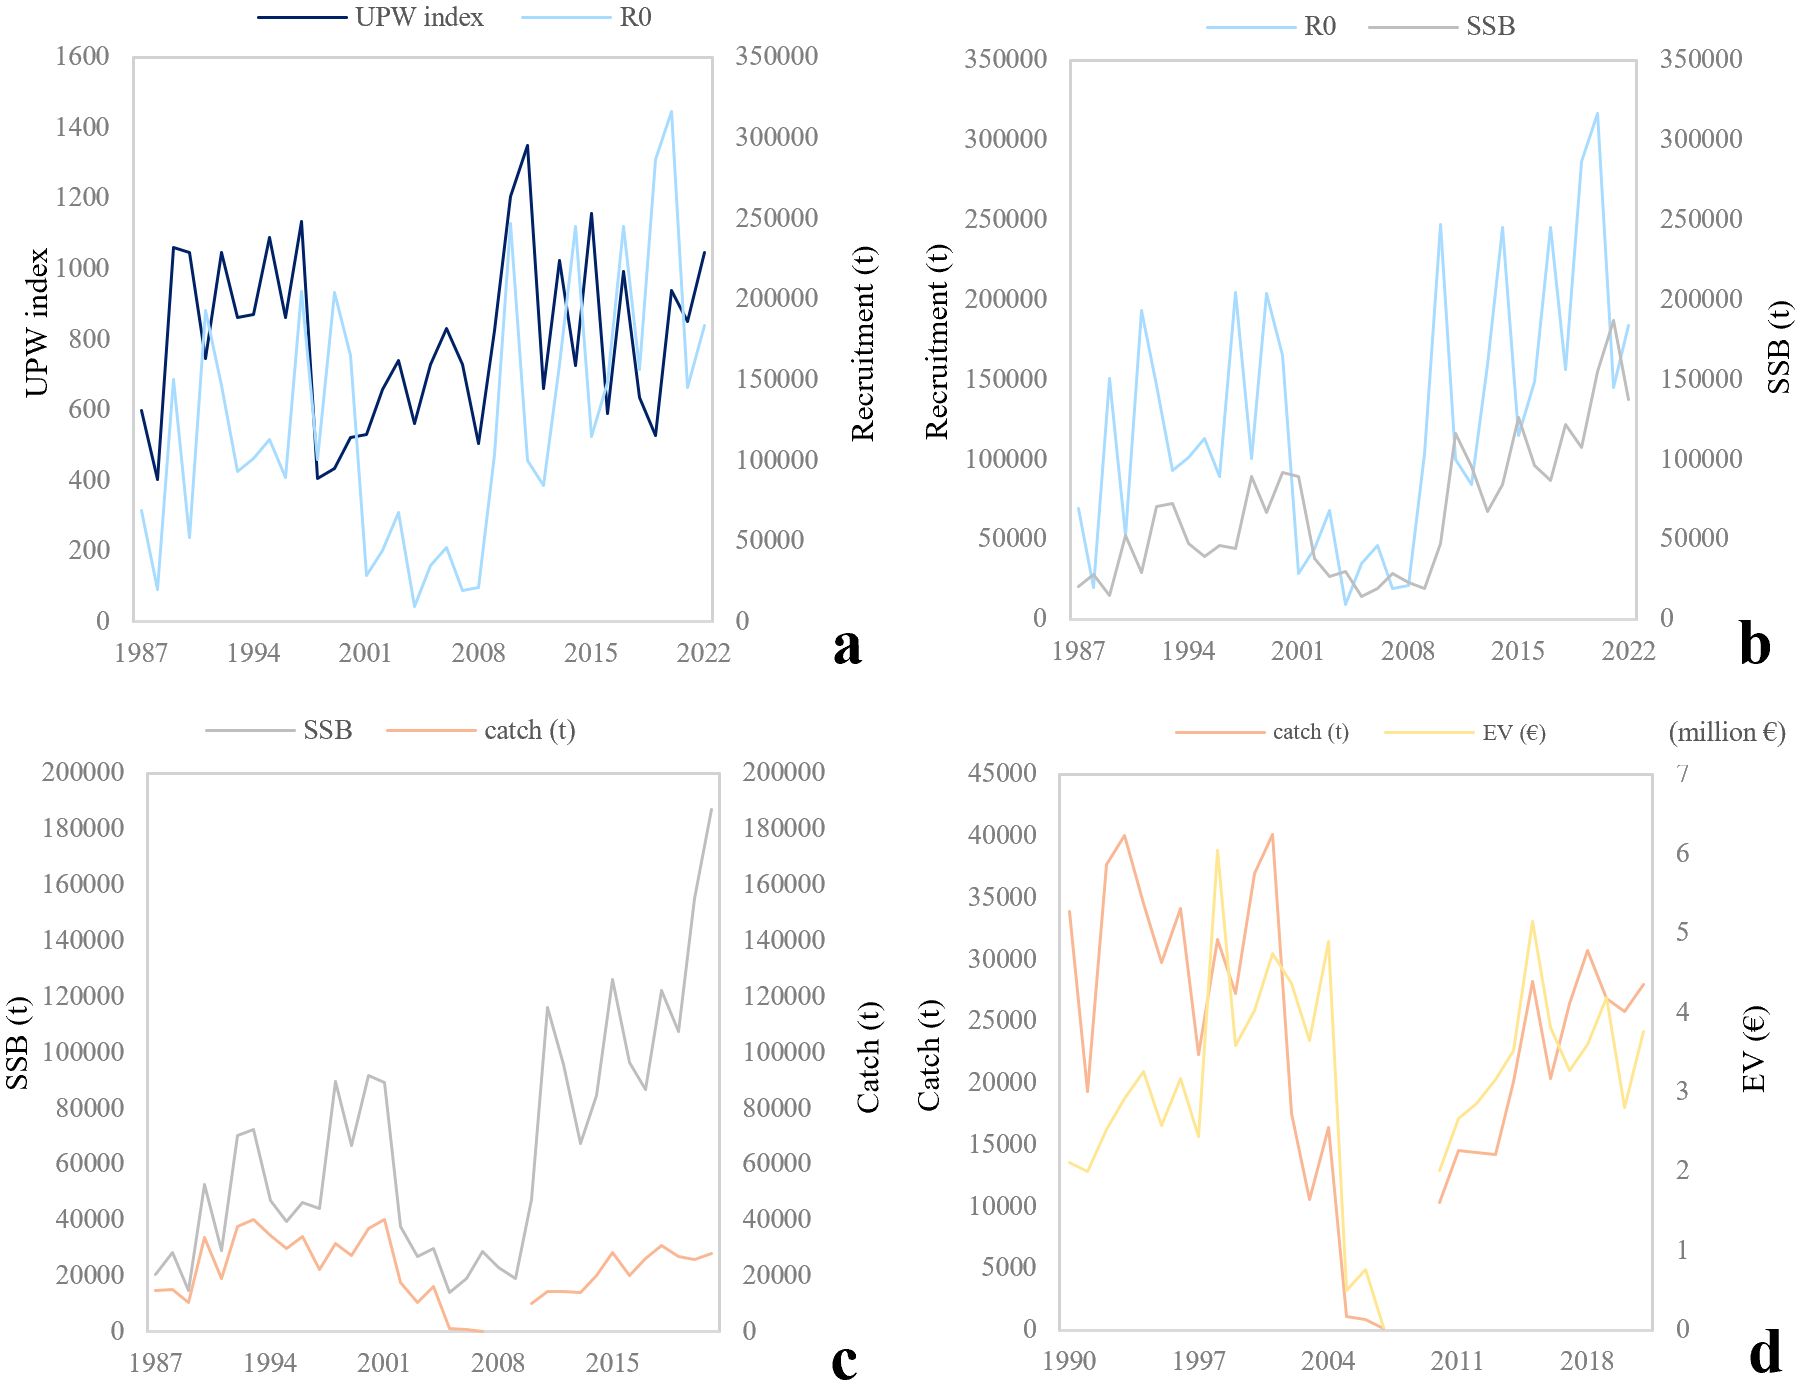
Figure 6. Temporal variation of the links between pairs of CICES (Common International Classification of Ecosystem Services) cascade components: (a) Biophysical components or processes (UPW, Upwelling index) - Function (Recruitment at age 0 (R0)); (b) Function (R0) with Service (SSB, Spawning Stoc Biomass); (c) Service (SSB) with Benefit (Catch); and (d) Benefit (Catch) with Economic value (EV, in euros).
As observed before, the recruitment and SSB covaried and were related with a year lap difference (Figure 6b).
Before the fishery collapse, a high proportion of the SSB was caught, being the captures in this period more than 50% of the SSB (Figure 6c). Between 1987 and 1993 the catch followed the SSB evolution, ranging from the minimum catch in 1989 (10,374 t), with also a minimum value for SSB (observed before), and a maximum for both components in 1993 (catch: 40,087 t) (SSB: 72,428 t). After this, SSB had a decreasing pattern for the next five years (1994- 1998) (minimum SSB: 39,486 t, 1995). Catches followed the same pattern as the period before, the captures exceeded the half of the SSB all the years, and decreased in values, reaching the minimum in 1997 (22,337 t). As mentioned before, SSB showed an increasing pattern from 1997 to 2000, doubling in some cases the values reached the period before (maximum SSB: 91,838 t); however, the captures maintained the values around 30,000 t during this period. When the SSB started decreasing its values in 2001, catch followed the same evolution reaching a minimum of captures in 2005, with 1,128 t, when the fishery collapsed (Figures 6c, d). In turn, after the collapse, the SSB (service) increased dramatically, but the catches (benefit component) remained at a low level, with a slight increase, and not far from the before-collapse levels, reaching a maximum in 2018, with 30,773 t caught (Figures 6c, d).
Despite these fluctuations in the catches (benefit), the economic value of anchovy landings has been maintained without dramatic changes between 1992 and 1997 (mean value 2.8 million €) (Figure 6d). In 1998, even if catch did not increase its values significantly, the value reached its maximum (6.03 million €), before falling to 3.58 million €, in 1999. The next two years (2000 and 2001), both catches and economic value showed a slightly increasing pattern (Figure 6d). Even if captures decreased sharply, the following years (2002-2004) the economic value maintained its values around 4.5 million €. When the fishery collapsed, the economic value reached its minimum (0.5 million €). After that, the economic value started to increase, following the captures pattern, and maintaining values of around 4 million € (Figure 6d).
4 Discussion
4.1 CICES cascade indicators
Previous studies (e.g. Böhnke-Henrichs et al., 2013; Liquete et al., 2013; Thenen et al., 2020) have listed indicators to determine marine ecosystem services flows, and many others reviewed indicators for investigating ecosystem services in general (de Groot et al., 2010; Egoh et al., 2012; Hernández-Morcillo et al., 2013; Grima et al., 2023). Among all the literature reviewed for this study, Thenen et al. (2020) was the only one that assessed the CICES cascade components for marine ecosystem services. However, they did not follow the CICES cascade terminology strictly, as they grouped the biophysical structure and processes and function steps into “ecosystem service capacity”. Other studies focused on marine ecosystem services, but did not follow the CICES cascade classification (Liquete et al., 2013; Atkins et al., 2015).
In our study, the principal problem faced was the terminology used for the assessment of ecosystem services in the literature, which is neither normalized nor standardized across the different frameworks (i.e., MEA, 2005; TEEB, 2010; Atkins et al., 2011; Böhnke-Henrichs et al., 2013; Liquete et al., 2013; Turner et al., 2015; Balvanera et al., 2022; Costanza et al., 2017; Haines-Young and Potschin, 2018; Culhane et al., 2020; Barbier, 2017; Chalkiadakis et al., 2022). This issue has been tackled by assessing the current status of indicators, for the three ecosystem service sections (i.e., provisioning, regulation and maintenance, and cultural) and the steps of the cascade flow (i.e., biophysical structure or process, functioning, service, benefit, and value), where the main confusions for these indicators’ classification and the principal gaps have been identified. The different interpretations of this flow and the numerous terminologies led to a general confusion of the terms and the links of the CICES cascade components (Lillebø et al., 2016; Czúcz et al., 2018; Chalkiadakis et al., 2022; Grima et al., 2023; Thenen et al., 2020).
This was observed in our study when looking at the three ecosystem services chosen and the components of the cascade. Considering the different frameworks and proposals around the flows, it was not surprising that more than 30% of indicators were incorrectly classified in their original source according to the CICES cascade. The lack of a unified framework and issue of ecosystem services terminology hindrance the research and interpretation of outcomes in this field (Grima et al., 2023). However, the effects are not the same across ecosystem services (Czúcz et al., 2018)., and each has been explored to a different extent.
In line with previous studies (Thenen et al., 2020), we found that out of the three ecosystems services analysed, the provisioning service was the one with the highest number of indicators, specially concerning the benefit and value components of the cascade. This is not surprising since this service primarily relies on fisheries, which is a crucial industry for the global economy, supplying with livelihoods and food to millions of people worldwide (Golden et al., 2021). Moreover, it has been largely studied, and there is a specific science to study the fish populations and dynamics for the fisheries management (Munro and Scott, 1985). Furthermore, food provisioning indicators are relatively easy to measure (Hattam et al., 2015), and broad efforts have been made to assess fish stocks (e.g., ICES stock assessment database) (Froese et al., 2018). Provisioning services are also easier to assign an economic value to, as they are directly linked to market activities and resource extraction (Liu et al., 2010). The massive amount of data related to fisheries can explain the higher number of indicators for each step of the cascade in provisioning, when compared to the other two examples explored. In contrast, much less indicators were found for regulation and maintenance services. This type of services are more challenging to quantify and value, due to their indirect and often non-market nature (Abson and Termansen, 2011). The example chosen for literature indicators assessment, carbon sequestration, has been a hot topic for the last decade and multiple studies had been carried out (Duarte, 2016; Macreadie et al., 2021). Assessing the significance of carbon storage has become increasingly important in recent times, leading to the establishment of the carbon market (Calel, 2013), although these markets have been recently criticised for their impacts on biodiversity (Pascual et al., 2023). Despite the growing interest and the considerable high number of publications on the topic, determining the indicators for the different cascade steps was not easy. The fact that carbon storage is a process complicates the application of the CICES cascade, as it was not clear which indicators should be allocated to each step (more information can be seen in Appendix Tables A1–A3).
The understanding of cultural service nature is even more complicated as they are the least studied ecosystem services (Ghermandi et al., 2012; Martin et al., 2016; Rodrigues et al., 2017; Thenen et al., 2020), and measuring their benefits could be complicated, and so indeed was finding accurate indicators. This may be due to the intangible nature of their resources, which is even more evident for marine environments (Queiroz et al., 2017; Elliott, 2023). The revised literature about marine cultural ecosystem services flows was quite limited, coinciding with other ecosystem service indicators assessments (e.g. Hattam et al., 2015). Moreover, the definitions and measurement procedures for cultural ecosystem service indicators were not clear enough, coinciding with the conclusions also made in other studies (Milcu et al., 2013; Hattam et al., 2015). For example, the boundaries between function and biophysical structure or process are confusing, as both relate to processes that can be important for the ecosystem service delivery (Haines-Young and Potschin, 2018). In our case, we overcame this issue by following the definitions (Table 1) for each cascade step to classify the indicators.
The biophysical structure or process was the first cascade component with the highest number of indicators regarding the cultural service, the second regarding regulation and maintenance and the third regarding the provisioning service. In this case most of the indicators were correctly classified according to CICES. This may be explained as most (>60%) of these indicators were extracted from the same source (Atkins et al., 2015). Despite this research study did not follow the CICES framework, but UK NEAFO WP3b framework (UK NEAFO, 2014), both (CICES and UK NEAFO) shared the first step of the ecosystem service flow (component and processes), and this specific set of indicators was abundant and appropriate (Atkins et al., 2015). Some of the indicators found for this cascade component were equivalent across the three ecosystem service examples as these indicators described general factors of any marine ecosystem (i.e. nutrient concentration or pH) (Appendix Tables A1–A3).
It was surprising that the cascade category with less (accurate) indicators in the literature was indeed the ecosystem services component. This leads to a question: Is it clear what an ecosystem service is? The definition of ecosystem service, according to CICES, is: “Ecological outcomes that particular ecosystem characteristics or processes generate, that can ultimately benefit people” (Haines-Young and Potschin, 2018). It seems that a confusion exists when comes to distinguish what an ecosystem service is, and what flows (determined as other terms in this study) of different components of the cascade for CICES are (Chalkiadakis et al., 2022). This problem has been reported in other ecosystem service indicator assessments (Lillebø et al., 2016; Czúcz et al., 2018; Grima et al., 2023). Lillebø and colleagues (2016) collected indicators from 14 different case studies around Europe and they reported that for the participants the most challenging part was understanding the differences among ecosystem service capacity, flow and benefit. In this study, it was observed that 21% of all the indicators found were originally classified as other terms (i.e., ecosystem service flow, ecosystem service capacity, essential ecosystem service variables), meaning that they follow a logic to classify ecosystem service indicators different to the one used by the CICES cascade. The high number of indicators classified as other terms can be explained because the different frameworks explaining the ecosystem service flows use different terms and concepts (Balvanera et al., 2022; Barbier, 2017; Costanza et al., 2017; Haines-Young and Potschin, 2018; Culhane et al., 2020; Thenen et al., 2020).
One of the steps that creates more confusion is the one from service to benefit. Indeed, some authors do not distinguish between both (Balvanera et al., 2022; Barbier, 2017). In our study, we followed CICES definitions and interpret service and benefit following the definitions in Table 1. In this framework the “production boundary” represents the inputs that a service requires to become a benefit (e.g. harvesting fish for nutrition requires investing energy, time and resources). These inputs have been made explicit in other frameworks, such as Costanza et al. (2017), who highlighted that human and social capital are needed for natural capital to flow (in the form of ecosystem service) and become a human benefit.
The indicator numbers unbalance is especially remarkable concerning the socio-economic side of the cascade (benefit and value). As mentioned before, the provisioning ecosystem service, and in particular, fish stocks have been widely studied for decades in science and managing (Munro and Scott, 1985). The benefit of fisheries can be easily measured, either as wild catch landed fish or employment in fisheries (Appendix Table A1) (Béné et al., 2012; Seitz et al., 2014), while the benefits for regulation and maintenance and cultural services, not only had been less studied, but also are more difficult to measure, as for example healthy climate (regulation and maintenance) or leisure (cultural) (Jarvis et al., 2017; Pouso et al., 2020).
The benefit and the value components of the cascade, which correspond to the socio-economic part of the model, and consequently specific for human, are not really distinguished in the literature (Liquete et al., 2013; Hattam et al., 2015; Atkins et al., 2015; Barbier, 2017). As found in our study, all the value indicators of ecosystem services were originally classified as benefit indicators in the literature; this can be explained because the economic value can be seen as a type of human benefit (Sagoff, 2008).
The differences and mismatches in the classification of indicators into the different steps of the CICES cascade identified in this research calls researchers to once adopted CICES, to be coherent with the meaning of the different terms as used in this classification.
4.2 Practical application to the anchovy fishery
When studying the links within the different steps of the CICES cascade, the relationship between the biophysical structure or process (upwelling index) and the function (recruitment) was not significant. However, previous studies (Borja et al., 1996; Borja et al., 1998; Borja et al., 2008; Planque and Buffaz, 2008; Fernandes et al., 2010; Erauskin-Extramiana et al., 2019) have identified a series of environmental indices affecting the recruitment of anchovy in the Bay of Biscay, including upwelling, turbulence, and stability. It must be noted that the recruitment data used by Borja et al. (2008) were not the same as those used in our study, as the methodology used in the surveys and the estimation of biomass changed (Uriarte et al., 2023). A more recent study (Ibaibarriaga et al., 2023) has concluded that upwelling and turbulence combined are positively related to recruitment, explaining 34.7% of the variability in the recruitment (at age 1).
Due to the biology of the species, the short lifetime and the population concentrations, the factor that mostly determines the recruitment (age 0) biomass is in fact the SSB (ecosystem service), which is used to estimate next year population biomass (Ibaibarriaga et al., 2011). Moreover, data for the recruitment (at age 1) surveys is used to predict the SSB of the next year (Boyra et al., 2013). Thus, these two components are highly correlated, and the results obtained for this link between the two cascade components were expected. Hence, considering that the 1-year-old recruits contribute to about 60% of the total SSB of a year (ICES, 2021), the result of recruitment (at age 0) explaining >80% of the variability of the SSB of the next year can be expected for a short-living species, such as the anchovy of the Bay of Biscay (Motos et al., 1996).
The relationship between SSB and catch was significant and shows that SSB is an appropriated indicator for service, indicating the real capacity of the ecosystem (anchovy population, in this case), to further provide the benefit (anchovy catch). The fact that the relationship between both components was not statistically significant for the complete period, but it was positive and strong when analysing the relationship before and after the collapse individually can be explained by the different fishery management during each period: before the collapse, management was based on a constant TAC of 30,000 t, regardless ICES advice. However, this TAC did not really condition Spanish and French fishery at that moment, so, in practice, it was an unregulated fishery (del Valle et al., 2001; Lazkano et al., 2013). The catch before the collapse was higher than after the collapse, and positively and linearly related to SSB; just after this period the anchovy fishery collapsed, due to repeated recruitment failures (Uriarte et al., 2023). After the collapse, the catches are more constant, independently of the SSB increase, and this leads to a more “asymptotic relationship” of the component. Even if more data are needed to confirm this in coming years, it seems that the management adopted by the European Commission after the collapse, in which the TAC is thoroughly calculated with more exact estimations of recruitment and SSB (Uriarte et al., 2023), has led to a higher anchovy population (SSB), and as consequence to a sustainable anchovy fishery.
All this comes to a last step in the cascade (value), which in this case is the economic value of the ecosystem service and determines how much money can anchovy fishery provide humans with. In this case, the relationship was not as strong as the function-service or service-benefit relationships. The fact that the value of the anchovy per kilogram varies from year in response to catches and other external factors (García del Hoyo et al., 2023) may explain why the economic value was not related to the benefit (catch) considering the complete period and the before the collapse period. There is a peak in the value (euro kg-1) in the years before the collapse, in which the anchovy become scarce and its value increased dramatically (Roel, 2009; García del Hoyo et al., 2023). After the collapse, the relationship between catch and economic value was significant and positive (Table 2). The economic value after 2010 was maintained in relatively high values and can be maintained in time, contributing to the sustainability of the activity.
Some elements and links of the CICES cascade can be affected by natural and anthropogenic pressures, especially through fisheries (i.e., fishing mortality), but also other (Large et al., 2015). This means that both parts of the cascade, the environmental and the socio-economic parts, can be impacted by different pressures. The biophysical part of the cascade may be the one that is more affected by cumulative effect of human pressures (Stelzenmüller et al., 2009). In this study, harvest rate was not relevant as in relation to the upwelling index. However, other natural or human pressures can affect the biophysical part of the cascade. One of the most obvious is the climate change, which can affect the upwelling index intensity and duration, as it has been observed worldwide (Varela et al., 2015; Wang et al., 2015). Studies by Sousa et al. (2017, 2020) have revealed that this may be especially noticeable in the north of the Iberian Peninsula and may probably affect the anchovy population and fishery in the future.
The pressure indicator used in this study (harvest rate) was explained SSB variability when looking at the whole picture (complete period). The harvest rate before the collapse was really high (between 0.5 and 0.8), and the growth of the SSB was limited by the high fishing pressure, consequence of the unregulated fishery (Uriarte et al., 2023). When the stock started to recover after the collapse, together with the implementation of management measures, the harvest rates were maintained around values of 0.3. These values did not increase even if the SSB reached maximum historical levels, and the recovery of SSB is in part explained by these lower harvest levels (Uriarte et al., 2023). Harvest rate would not directly perturb the recruitment age 0 population, as these fish are not harvested, being affected only indirectly by this pressure by the SSB of the same year.
In Figure 7, the application of the CICES cascade, adapted to our case study (anchovy), is represented considering the findings of this research. The cascade results obtained from the component links are represented with their R2 values, indicating empirical demonstration of the relationships between the components. There are multiple pressures in the marine environment that can affect differently each of the cascade components, thus we propose to represent this reality in the cascade diagram. Hence, this Figure 7 represents the real application of data to the cascade components links.
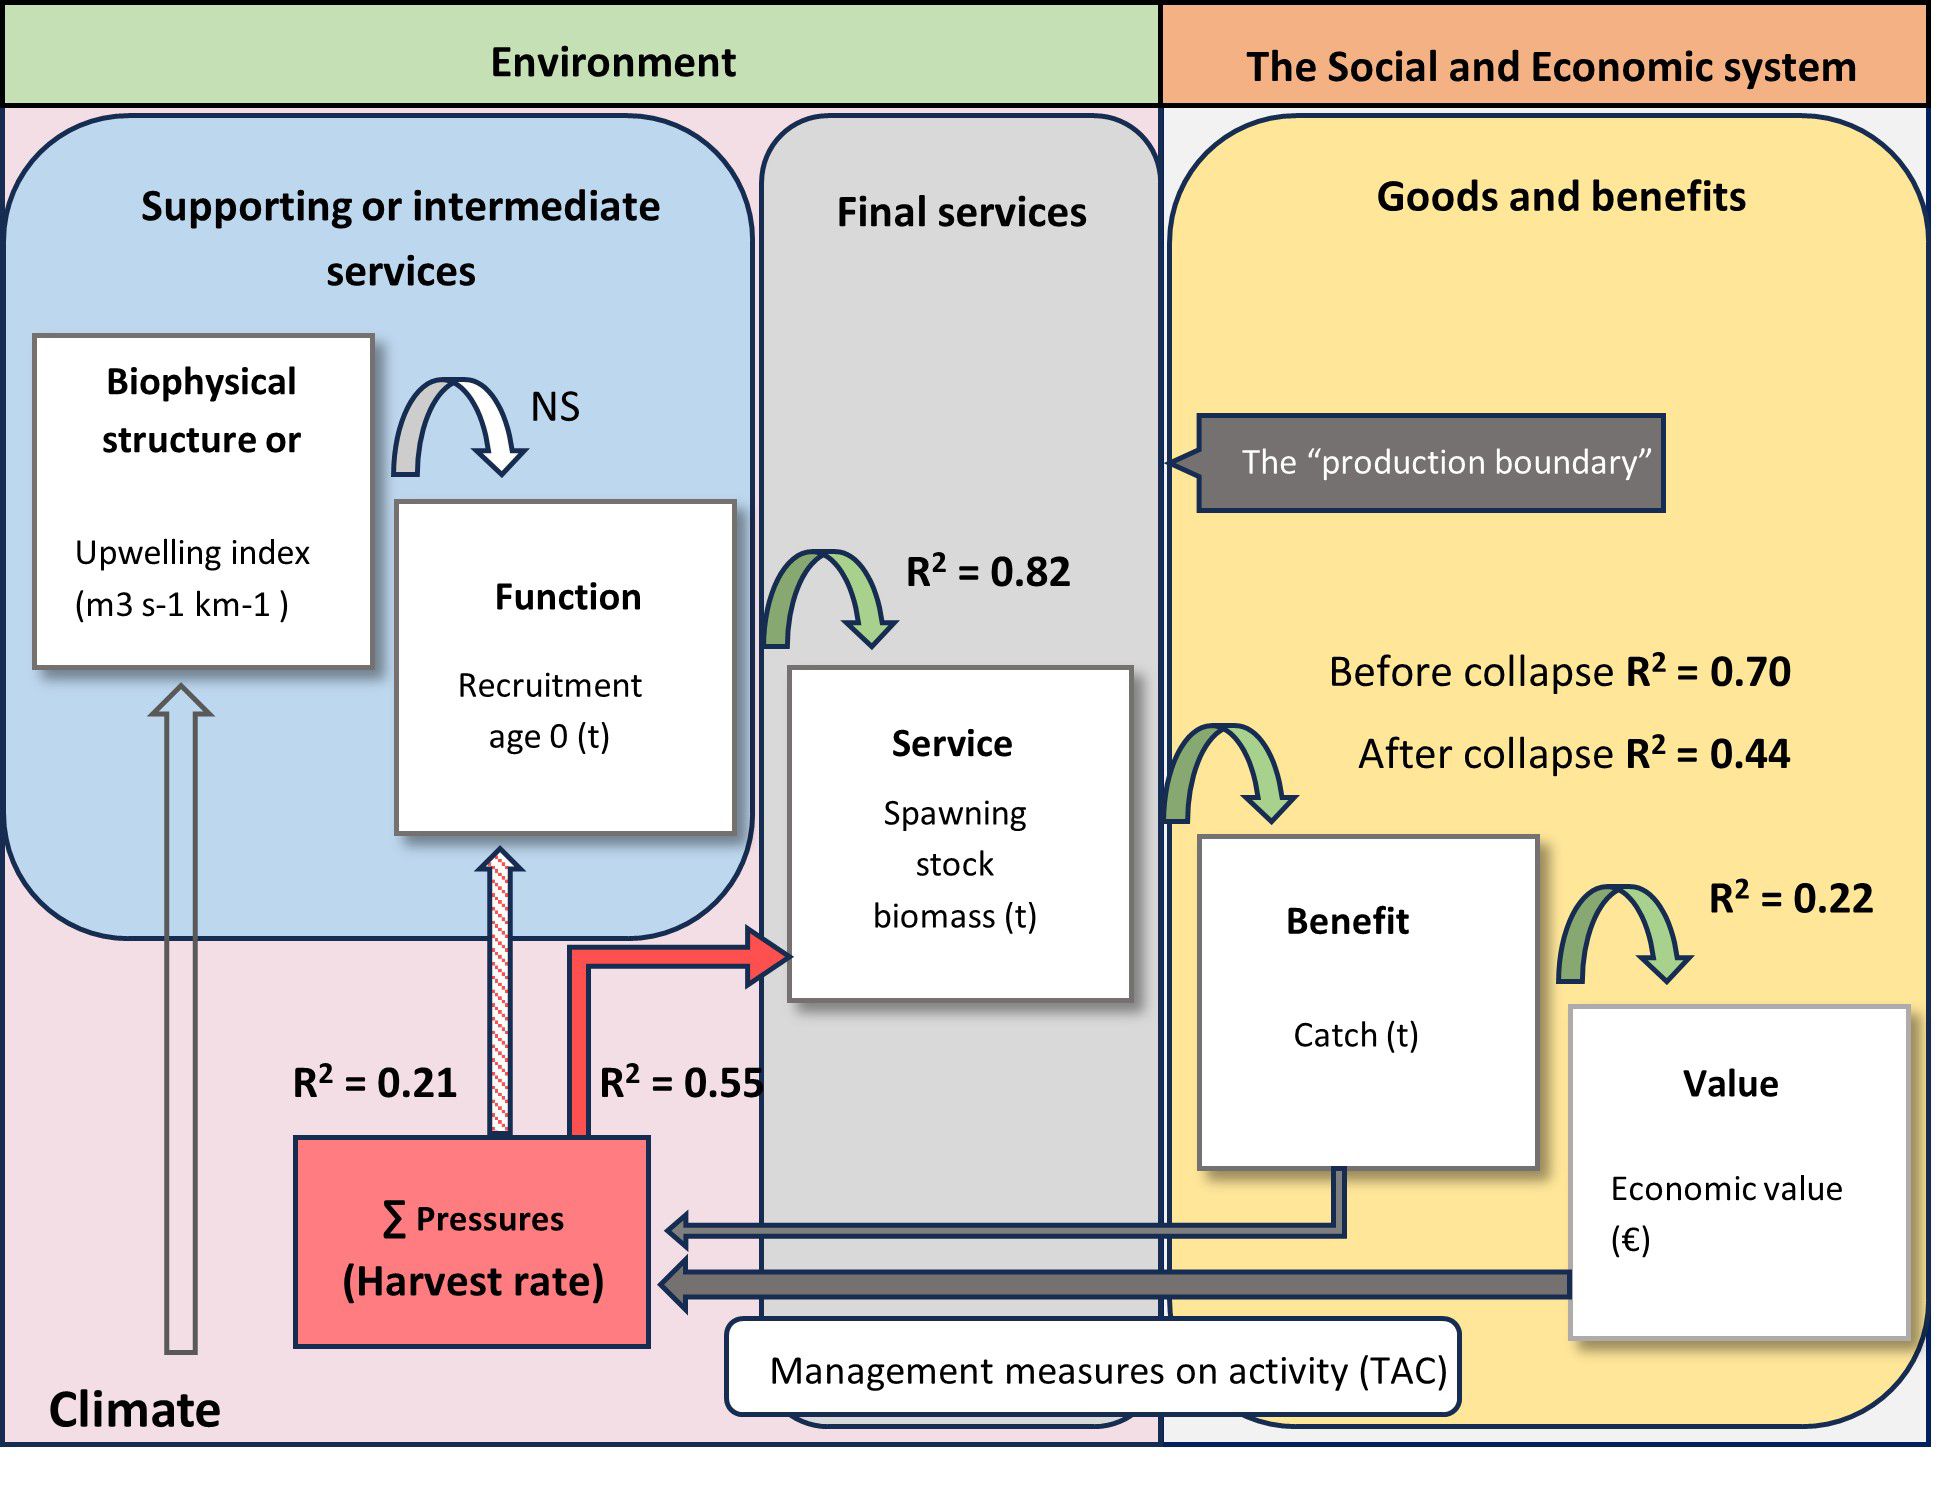
Figure 7. Adaptation of the CICES (Common International Classification of Ecosystem Services) cascade 1243 diagram (Potschin and Haines-Young, 2017) after applying it to a real case study: the anchovy of the Bay 1244 of Biscay. The diagram shows the relationships found for the different components of the cascade. In green: 1245 positive and significant (p<0.05) relationship between components; in red: negative and significant 1246 (p<0.05), in white: not significant (NS; p>0.05). TAC, Total Allowable Catch.
In this study only one species (Engraulis encrasicolus) and one ecosystem service (provisioning) was considered, and the cascade links were tested with one indicator for each component of the CICES cascade. The large data available for a wide temporal series and having a suitable indicator for each cascade step was crucial to carry out this exercise, which otherwise would not have been possible. However, this is not enough, for a comprehensive understanding of ecosystem services flows and their importance to humans, it is also necessary to better understand the multiple relationships of the marine environment components and the socio-economic part of the cascade (Hattam et al., 2015). Hence, studies including multiple species, ecosystem components, indicators, pressures, different flows and relationships (linear, non-linear), including multivariate analyses, should be undertaken in the future to catch the complexity of the marine environment, as well as the interactions between the different ecosystem service sections.
Human welfare is directly and indirectly dependent of the ecosystem services supply, and the sustainable management of the resources is necessary for the sustainable provision of ecosystem services. We are aware that this study has some limitations, as the analysis of the indicators was focused in three examples, and the application of the cascade was only carried out considering one species. However, despite the limitations of the study, the results highlight the need for scientist and stakeholders to careful use the ecosystem service terminology and proves that the CICES cascade links works when applying it with real data. Therefore, management guided towards maintaining these relationships should allow the sustainable provision of ecosystem services and benefits for humans.
5 Conclusions
The lack of a standard terminology and understanding of ecosystem services components and the relationship and flows between the environment and the socio-economic system, leads to general confusion in the studies about this topic. many indicators are incorrectly assigned in the literature to the different components of the CICES cascade, which makes difficult the comparability across studies. Therefore, a standardization of terminology, classification and understanding is necessary for a holistic and sustainable management of the marine environment and its resources.
Such standardization could benefit the study of ecosystem services flows with real and practical cases, as illustrated with the anchovy of the Bay of Biscay. In this case, adequate indicators and sufficient data for each CICES cascade component, have allowed to demonstrate the links between the environmental and the socio-economic part. Future works should try to consider several species, components, and indicators at the same time, as well as several cumulative human pressures, and even climate change effects, under non-linear relationships.
The approach presented here could be applied to other ecosystem services, as well as explore the complex, multivariate, and non-linear relationships among the cascade components flow. In case of being successful, an operational approach can be proposed for policy-makers to take management decisions on marine ecosystem services mapping, assessment and conservation.
Data availability statement
The original contributions presented in the study are included in the article/Supplementary Material, further inquiries can be directed to aolano@azti.es.
Author contributions
AO-A: Conceptualization, Data curation, Formal analysis, Investigation, Methodology, Visualization, Writing – original draft, Writing – review & editing. MU: Funding acquisition, Investigation, Methodology, Project administration, Supervision, Validation, Writing – review & editing, Resources. SP: Investigation, Methodology, Supervision, Validation, Visualization, Writing – review & editing. AB: Conceptualization, Funding acquisition, Investigation, Methodology, Project administration, Supervision, Validation, Writing – review & editing.
Funding
The author(s) declare that financial support was received for the research, and/or publication of this article. This manuscript is a result of GES4SEAS (Achieving Good Environmental Status for maintaining ecosystem services, by assessing integrated impacts of cumulative pressures) project, funded by the European Union under the Horizon Europe program (grant agreement no. 101059877), www.ges4seas.eu. AO-A has been supported by an Education Department PhD grant (PRE_2023_1_0042), from the Basque Government.
Acknowledgments
Two reviewers and the editor provided useful comments, which have improved the initial version of this manuscript. This is contribution nr 1260 from AZTI’s Marine Research, Basque Research and Technology Alliance (BRTA). Andrés Uriarte and Leire Ibaibarriaga (AZTI) provided insightful comments and few calculations to this manuscript.
Conflict of interest
The authors declare that the research was conducted in the absence of any commercial or financial relationships that could be construed as a potential conflict of interest.
Publisher’s note
All claims expressed in this article are solely those of the authors and do not necessarily represent those of their affiliated organizations, or those of the publisher, the editors and the reviewers. Any product that may be evaluated in this article, or claim that may be made by its manufacturer, is not guaranteed or endorsed by the publisher.
Supplementary material
The Supplementary Material for this article can be found online at: https://www.frontiersin.org/articles/10.3389/fmars.2025.1497521/full#supplementary-material
References
Abson D. J., Termansen M. (2011). Valoración de los Servicios del Ecosistema en Términos de Riesgos y Beneficios Ecológicos. Conserv. Biol. 25. doi: 10.1111/j.1523-1739.2010.01623.x
Atkins J. P., Burdon D., Elliott M. (2015). Identification of a Practicable Set of Ecosystem Indicators for Coastal and Marine Ecosystem Services in Turner, R. K., & Schaafsma, M. Coastal zones ecosystem services. Valuation Ecosystem Serv. 9, 59–75.
Atkins J. P., Burdon D., Elliott M., Gregory A. J. (2011). Management of the marine environment: Integrating ecosystem services and societal benefits with the DPSIR framework in a systems approach. Mar. pollut. Bull. 62, 215–226. doi: 10.1016/j.marpolbul.2010.12.012
Bakun A., Parrish R. H. (1982). Turbulence, transport, and pelagic fish in the California and Peru currents. Collected Reprints 77, 98.
Balvanera P., Brauman K. A., Cord A. F., Drakou E. G., Geijzendorffer I. R., Karp D. S., et al. (2022). Essential ecosystem service variables for monitoring progress towards sustainability. Curr. Opin. Environ. Sustainability 54, 101152. doi: 10.1016/j.cosust.2022.101152
Barbier E. B. (2017). Marine ecosystem services. Curr. Biol. 27, R507–R510. doi: 10.1016/j.cub.2017.03.020
Béné C., Phillips M., Allison. E. H. (2012). “The forgotten service: food as an ecosystem service from estuarine and coastal zones. Chapter 8,” in Ecological Economics of Estuaries and Coasts, vol. 12 . Eds. van den Belt M., Costanza R. (Academic Press, Waltham, MA), 147–180.
Böhnke-Henrichs A., Baulcomb C., Koss R., Hussain S. S., de Groot R. S. (2013). Typology and indicators of ecosystem services for marine spatial planning and management. J. Environ. Manage. 130, 135–145. doi: 10.1016/j.jenvman.2013.08.027
Borja A., Amouroux D., Anschutz P., Gómez-Gesteira M., Uyarra M. C., Valdés L. (2019). “The Bay of Biscay,” in World Seas: An Environmental Evaluation Volume I: Europe, the Americas and West Africa (Elsevier, London: Academic Press), 113–152. doi: 10.1016/B978-0-12-805068-2.00006-1
Borja A., Uriarte A., Valencia V., Motos L., Uriarte A. (1996). Relationships between anchovy (Engraulis encrasicholus) recruitment and the environment in the Bay of Biscay. Scientia Marina 60, 179–192.
Borja A., Fontán A., Sáenz J., Valencia V. (2008). Climate, oceanography, and recruitment: The case of the Bay of Biscay anchovy (Engraulis encrasicolus). Fisheries Oceanogr. 17, 477–493. doi: 10.1111/j.1365-2419.2008.00494.x
Borja A., Uriarte A., Egaña J., Motos L., Valencia V. (1998). Relationships between anchovy (Engraulis encrasicolus) recruitment and environment in the Bay of Biscay, (1967-1996). Fisheries Oceanogr. 7, 375–380. doi: 10.1046/j.1365-2419.1998.00064.x
Boyra G., Martínez U., Cotano U., Santos M., Irigoien X., Uriarte A. (2013). Acoustic surveys for juvenile anchovy in the Bay of Biscay: Abundance estimate as an indicator of the next year’s recruitment and spatial distribution patterns. ICES J. Mar. Sci. 70, 1354–1368. doi: 10.1093/icesjms/fst096
Broszeit S., Beaumont N. J., Uyarra M. C., Heiskanen A. S., Frost M., Somerfield P. J., et al. (2017). What can indicators of good environmental status tell us about ecosystem services?: Reducing efforts and increasing cost-effectiveness by reapplying biodiversity indicator data. Ecol. Indic. 81, 409–442. doi: 10.1016/j.ecolind.2017.05.057
Buonocore E., Grande U., Franzese P. P., Russo G. F. (2021). Trends and evolution in the concept of marine ecosystem services: An overview. Water 13 (15), 2060. doi: 10.3390/w13152060
Busch M., La Notte A., Laporte V., Erhard M. (2012). Potentials of quantitative and qualitative approaches to assessing ecosystem services. Ecol. Indic. 21, 89–103. doi: 10.1016/j.ecolind.2011.11.010
Calel R. (2013). Carbon markets: A historical overview. Wiley Interdiscip. Reviews: Climate Change 4, 107–119. doi: 10.1002/wcc.208
Camp E., Collins A. B., Ahrens R. N., Lorenzen K. (2020). Fish population recruitment: what recruitment means and why it matters: FA222, 3/2020 Vol. 2020 (Gainesville, Florida (USA): EDIS), 6–6.
Chalkiadakis C., Drakou E. G., Kraak M. J. (2022). Ecosystem service flows: A systematic literature review of marine systems. Ecosystem Serv. 54, 101412. doi: 10.1016/j.ecoser.2022.101412
Chust G., González M., Fontán A., Revilla M., Alvarez P., Santos M., et al. (2022). Climate regime shifts and biodiversity redistribution in the Bay of Biscay. Sci. Total Environ. 803, 149622. doi: 10.1016/j.scitotenv.2021.149622
Costanza R., de Groot R., Braat L., Kubiszewski I., Fioramonti L., Sutton P., et al. (2017). Twenty years of ecosystem services: How far have we come and how far do we still need to go? Ecosystem Serv. 28, 1–16. doi: 10.1016/j.ecoser.2017.09.008
Culhane F. E., Frid C. L. J., Gelabert E. R., Piet G., White L., Robinson L. A. (2020). Assessing the capacity of European regional seas to supply ecosystem services using marine status assessments. Ocean Coast. Manage. 190, 105154. doi: 10.1016/j.ocecoaman.2020.105154
Culhane F. E., Frid C. L. J., Royo Gelabert E., White L., Robinson L. A. (2018). Linking marine ecosystems with the services they supply: what are the relevant service providing units? Ecol. Appl. 28 (7), 1740–1751. doi: 10.1002/eap.1779
Czúcz B., Arany I., Potschin-Young M., Bereczki K., Kertész M., Kiss M., et al. (2018). Where concepts meet the real world: A systematic review of ecosystem service indicators and their classification using CICES. Ecosystem Serv. 29, 145–157. doi: 10.1016/j.ecoser.2017.11.018
de Groot R. S., Alkemade R., Braat L., Hein L., Willemen L. (2010). Challenges in integrating the concept of ecosystem services and values in landscape planning, management and decision making. Ecol. Complexity 7, 260–272. doi: 10.1016/j.ecocom.2009.10.006
del Valle I., Astorkiza I., Astorkiza K. (2001). Is the current regulation of the VIII division European anchovy optimal? Environ. Resource Economics 19, 53–72. doi: 10.1023/A:1011127610739
Duarte C. M. (2016). “Hidden Forests: The role of vegetated coastal habitats in the ocean carbon budget (Vladimir Ivanovich Vernadsky Medal Lecture),” in EGU General Assembly Conference Abstracts, 17-22 April, 2016, Vienna Austria. EPSC2016–1459.
Egoh B., Drakou E. G., Dunbar M. B., Maes J., Willemen L. (2012). Indicators for mapping ecosystem services: a review (Ispra, Italy: European Commission, Joint Research Centre (JRC), 111.
Elliott M. (2023). Marine Ecosystem Services and Integrated Management: “There’s a crack, a crack in everything, that’s how the light gets in”! Mar. Pollut. Bull. 193, 115177. doi: 10.1016/j.marpolbul.2023.115177
Erauskin-Extramiana M., Alvarez P., Arrizabalaga H., Ibaibarriaga L., Uriarte A., Cotano U., et al. (2019). Historical trends and future distribution of anchovy spawning in the Bay of Biscay. Deep-Sea Res. Part II: Topical Stud. Oceanogr. 159, 169–182. doi: 10.1016/j.dsr2.2018.07.007
European Commission (2008). Directive 2008/56/EC of the European Parliament and of the Council establishing a framework for community action in the field of marine environmental policy (Marine Strategy Framework Directive). Off. J. Eur. Union L164, 19–40.
Feld C. K., Da Silva P. M., Sousa J. P., De Bello F., Bugter R., Grandin U., et al. (2009). Indicators of biodiversity and ecosystem services: A synthesis across ecosystems and spatial scales. Oikos 118, 1862–1871. doi: 10.1111/j.1600-0706.2009.17860.x
Fernandes J. A., Irigoien X., Goikoetxea N., Lozano J. A., Inza I., Pérez A., et al. (2010). Fish recruitment prediction, using robust supervised classification methods. Ecol. Model. 221, 338–352. doi: 10.1016/j.ecolmodel.2009.09.020
Froese R., Winker H., Coro G., Demirel N., Tsikliras A. C., Dimarchopoulou D., et al. (2018). Status and rebuilding of European fisheries. Mar. Policy 93, 159–170. doi: 10.1016/j.marpol.2018.04.018
García-del-Hoyo J. J., Jiménez-Toribio R., Castilla-Espino D. (2023). Price volatility transmission in the value chain of fresh anchovies in Spain. Fisheries Res. 260. doi: 10.1016/j.fishres.2022.106606
Ghermandi A., Nunes P. A. L. D., Portela R., Rao N., Teelucksingh. S. S. (2012). “Recreational, cultural and aesthetic services from estuarine and coastal ecosystems. Chapter 11,” in Ecological Economics of Estuaries and Coasts, vol. 12 . Eds. van den Belt M., Costanza R. (Academic Press, Waltham, MA), 217–237.
Golden C. D., Koehn J. Z., Shepon A., Passarelli S., Free C. M., Viana D. F., et al. (2021). Aquatic foods to nourish nations. Nature 598, 315–320. doi: 10.1038/s41586-021-03917-1
Grima N., Jutras-Perreault M. C., Gobakken T., Ole Ørka H., Vacik H. (2023). Systematic review for a set of indicators supporting the Common International Classification of Ecosystem Services. Ecol. Indic. 147, 109978. doi: 10.1016/j.ecolind.2023.109978
Haines-Young R., Potschin M. (2012). Common international classification of ecosystem services (CICES, Version 4.1) Vol. 33 (Nottingham (UK): European Environment Agency), 107.
Haines-Young R., Potschin M. (2018). Common international classification of ecosystem services (CICES) V5.1 guidance on the application of the revised structure. Available online at: www.cices.eu (Accessed June, 10, 2024).
Hattam C., Atkins J. P., Beaumont N., Börger T., Böhnke-Henrichs A., Burdon D., et al. (2015). Marine ecosystem services: Linking indicators to their classification. Ecol. Indic. 49, 61–75. doi: 10.1016/j.ecolind.2014.09.026
Hernández-Morcillo M., Plieninger T., Bieling C. (2013). An empirical review of cultural ecosystem service indicators. Ecol. Indic. 29, 434–444. doi: 10.1016/j.ecolind.2013.01.013
Ibaibarriaga L., Fernández C., Uriarte A. (2011). Gaining information from commercial catch for a Bayesian two-stage biomass dynamic model: Application to Bay of Biscay anchovy. ICES J. Mar. Sci. 68, 1435–1446. doi: 10.1093/icesjms/fsr094
Ibaibarriaga L., Uriarte A., Citores L., Sarasua I., Fontán A., Sánchez-Maroño S., et al. (2023). Contribution from AZTI to SEAwise Deliverable 3.2 Report on improved predictive models of recruitment under different environmental scenarios.
ICES (2021). Working group on southern horse mackerel, anchovy and sardine (WGHANSA) (Copenhagen: ICES Scientific Reports). doi: 10.17895/ices.pub.8138 (Accessed June, 15, 2024).
ICES (2022). Anchovy (Engraulis encrasicolus) in subarea 8 (Bay of Biscay) (Copenhagen: ICES Advisory Committee) 2022. doi: 10.17895/ices.advice.19772356
Jarvis D., Stoeckl N., Liu H. B. (2017). New methods for valuing, and for identifying spatial variations, in cultural services: A case study of the Great Barrier Reef. Ecosystem Serv. 24, 58–67. doi: 10.1016/j.ecoser.2017.02.012
Koutsikopoulos C., Le Cann B. (1996). Physical processes and hydrological structures related to the Bay of Biscay anchovy. Scientia Marina 60, 9–19.
Landers D. H., Nahlik A. M. (2013). Final ecosystem goods and services classification system (FEGS-CS) (Office of Research and Development, Washington, D.C. (USA): Anonymous EPA United States Environmental Protection Agency).
Large S. I., Fay G., Friedland K. D., Link J. S. (2015). Critical points in ecosystem responses to fishing and environmental pressures. Mar. Ecol. Prog. Ser. 521, 1–17. doi: 10.3354/meps11165
Lasker R. (1985). An egg production method for estimating spawning biomass of pelagic fish: application to the northern anchovy, Engraulis mordax. Washington, D.C. (USA): Office of Research and Development.
Layke C., Mapendembe A., Brown C., Walpole M., Winn J. (2012). Indicators from the global and sub-global Millennium Ecosystem Assessments: An analysis and next steps. Ecol. Indic. 17, 77–87. doi: 10.1016/j.ecolind.2011.04.025
Lazkano I., Nøstbakken L., Prellezo R. (2013). Past and future management of a collapsed fishery: The Bay of Biscay anchovy. Natural Resource Modeling 26, 281–304. doi: 10.1111/j.1939-7445.2012.00138.x
Lillebø A. I., Somma F., Norén K., Gonçalves J., Alves M. F., Ballarini E., et al. (2016). Assessment of marine ecosystem services indicators: Experiences and lessons learned from 14 European case studies. Integrated Environ. Assess. Manage. 12, 726–734. doi: 10.1002/ieam.1782
Liquete C., Piroddi C., Drakou E. G., Gurney L., Katsanevakis S., Charef A., et al. (2013). Current status and future prospects for the assessment of marine and coastal ecosystem services: A systematic review. PloS One 8, e67737. doi: 10.1371/journal.pone.0067737
Liu S., Costanza R., Farber S., Troy A. (2010). Valuing ecosystem services: theory, practice, and the need for a transdisciplinary synthesis. Ann. New York Acad. Sci. 1185, 54–78. doi: 10.1111/j.1749-6632.2009.05167.x
Macreadie P. I., Costa M. D. P., Atwood T. B., Friess D. A., Kelleway J. J., Kennedy H., et al. (2021). Blue carbon as a natural climate solution. Nat. Rev. Earth Environ. 2, 826–839. doi: 10.1038/s43017-021-00224-1
Martin C. L., Momtaz S., Gaston T., Moltschaniwskyj N. A. (2016). A systematic quantitative review of coastal and marine cultural ecosystem services: current status and future research. Mar. Policy 74, 25–32. doi: 10.1016/j.marpol.2016.09.004
Martínez M. L., Intralawan A., Vázquez G., Pérez-Maqueo O., Sutton P., Landgrave R. (2007). The coasts of our world: Ecological, economic and social importance. Ecol. Economics 63, 254–272. doi: 10.1016/j.ecolecon.2006.10.022
McDonough K., Hutchinson S., Moore T., Hutchinson J. M. S. (2017). Analysis of publication trends in ecosystem services research. Ecosystem Serv. 25, 82–88. doi: 10.1016/j.ecoser.2017.03.022
Milcu A. I., Hanspach J., Abson D., Fischer J. (2013). Cultural ecosystem services: a literature review and prospects for future research. Ecol. Soc. 18 (3). doi: 10.5751/ES-05790-180344
Millenium Ecosystem Assessment (2005). Millennium Ecosystem Assessment 2005. Ecosystems and Human Well-being: Biodiversity Synthesis (Washington, DC: World Resources Institute), 1–100.
Motos L. (1996). Reproductive biology and fecundity of the Bay of Biscay anchovy population (Engraulis encrasicolus L.). Scientia Marina 60, 195–207.
Motos L., Uriarte A., Valencia V. (1996). The spawning environment of the Bay of Biscay anchovy (Engraulis encrasicolus L.). Scientia Marina 60, 117–140.
Munro G. R., Scott A. D. (1985). “The economics of fisheries management,” in Handbook of natural resource and energy economics, vol. 2. (North Holland: Elsevier), 623–676.
Nahlik A. M., Kentula M. E., Fennessy M. S., Landers D. H. (2012). Where is the consensus? A proposed foundation for moving ecosystem service concepts into practice. Ecol. Economics 77, 27–35. doi: 10.1016/j.ecolecon.2012.01.001
Outeiro L., Ojea E., Garcia Rodrigues J., Himes-Cornell A., Belgrano A., Liu Y., et al. (2017). The role of non-natural capital in the co-production of marine ecosystem services. Int. J. Biodiversity Sci. Ecosystem Serv. Manage. 13, 35–50. doi: 10.1080/21513732.2017.1415973
Pascual U., Balvanera P., Anderson C. B., Chaplin-Kramer R., Christie M., González-Jiménez D., et al. (2023). Diverse values of nature for sustainability. Nature 620, 813–823. doi: 10.1038/s41586-023-06406-9
Pascual U., Balvanera P., Díaz S., Pataki G., Roth E., Stenseke M., et al. (2017). Valuing nature’s contributions to people: the IPBES approach. Curr. Opin. Environ. Sustainability 26–27, 7–16. doi: 10.1016/j.cosust.2016.12.006
Peterson C. H., Lubchenco J. (1997). Marine ecosystem services (Washington, DC: Island Press), 177–195.
Petitgas P., Rijnsdorp A. D., Dickey-Collas M., Engelhard G. H., Peck M. A., Pinnegar J. K., et al. (2013). Impacts of climate change on the complex life cycles of fish. Fisheries Oceanogr. 22, 121–139. doi: 10.1111/fog.12010
Planque B., Buffaz L. (2008). Quantile regression models for fish recruitment-environment relationships: Four case studies. Mar. Ecol. Prog. Ser. 357, 213–223. doi: 10.3354/meps07274
Potschin M., Haines-Young R. (2017). “Linking people and nature: Socio-ecological systems,” in Ecosystem Services Mapping. Eds. Burkhard B., Maes J. (Pensoft Publishers, Bulgaria), 41–43.
Pouso S., Borja Á., Uyarra M. C. (2020). An interdisciplinary approach for valuing changes after ecological restoration in marine cultural ecosystem services. Front. Mar. Sci. 7. doi: 10.3389/fmars.2020.00715
Queiroz L., de S., Rossi S., Calvet-Mir L., Ruiz-Mallén I., García-Betorz S., et al. (2017). Neglected ecosystem services: Highlighting the socio-cultural perception of mangroves in decision-making processes. Ecosystem Serv. 26, 137–145. doi: 10.1016/j.ecoser.2017.06.013
Reid J. L. (1966). Oceanic environment of the genus Engraulis around the world Vol. 11 (State of California, Department of Fish and Game, Terminal Island, California (USA): CalCOFI Rep), 29–33.
Rodrigues J. G., Conides A. J., Rivero Rodriguez S., Raicevich S., Pita P., Kleisner K. M., et al. (2017). Marine and coastal cultural ecosystem services: knowledge gaps and research priorities. One Ecosystem 2, e12290. doi: 10.3897/oneeco.2.e12290
Roel B. (2009). Scientific, Technical and Economic Committee for Fisheries (STECF)-Long-term Management of Bay of Biscay Anchovy (SGBRE-08-01).
Sagoff M. (2008). On the economic value of ecosystem services. Environ. Values 17, 239–257. doi: 10.3197/096327108X303873
Sanz A., Uriarte A. (1989). Reproductive cycle and batch fecundity of the Bay of Biscay anchovy (Engraulis encrasicholus) in 1987 Vol. 30 (State of California, Department of Fish and Game, Terminal Island, California (USA): CalCOFI Rep), 127–135.
Seitz R. D., Wennhage H., Bergström U., Lipcius R. N., Ysebaert T. (2014). Ecological value of coastal habitats for commercially and ecologically important species. ICES J. Mar. Sci. 71, 648–665. doi: 10.1093/icesjms/fst152
Sousa M. C., deCastro M., Alvarez I., Gomez-Gesteira M., Dias J. M. (2017). Why coastal upwelling is expected to increase along the western Iberian Peninsula over the next century? Sci. Total Environ. 592, 243–251. doi: 10.1016/j.scitotenv.2017.03.046
Sousa M. C., Ribeiro A., Des M., Gomez-Gesteira M., deCastro M., Dias J. M. (2020). NW Iberian Peninsula coastal upwelling future weakening: Competition between wind intensification and surface heating. Sci. Total Environ. 703, 134808. doi: 10.1016/j.scitotenv.2019.134808
Stelzenmüller V., Lee J., South A., Rogers S. I. (2009). Quantifying cumulative impacts of human pressures on the marine environment: A geospatial modelling framework. Mar. Ecol. Prog. Ser. 398, 19–32. doi: 10.3354/meps08345
TEEB (2010). The Economics of Ecosystems and Biodiversity: Mainstreaming the Economics of Nature: A Synthesis of the Approach. Conclusions and Recommendations of TEEB (Malta: The Economics of Ecosystems and Biodiversity).
Thenen M., Frederiksen P., Hansen H. S., Schiele K. S. (2020). A structured indicator pool to operationalize expert-based ecosystem service assessments for marine spatial planning. Ocean Coast. Manage. 187, 105071. doi: 10.1016/j.ocecoaman.2019.105071
Turner R. K., Schaafsma M., Mee L., Elliott M., Burdon D., Atkins J. P., et al. (2015). Conceptual Framework. Switzerland, 11–40. doi: 10.1007/978-3-319-17214-9_2
Uriarte A., Ibaibarriaga L., Sánchez-Maroño S., Abaunza P., Andrés M., Duhamel E., et al. (2023). Lessons learnt on the management of short-lived fish from the Bay of Biscay anchovy case study: Satisfying fishery needs and sustainability under recruitment uncertainty. Mar. Policy 150, 105512. doi: 10.1016/j.marpol.2023.105512
Uriarte A., Prouzet P., Villamor B. (1996). Bay of Biscay and Ibero Atlantic anchovy populations and their fisheries. Scientia Marina 60, 237–255.
Uriarte A., Rico I., Villamor B., Duhamel E., Dueñas C., Aldanondo N., et al. (2016). Validation of age determination using otoliths of the European anchovy (Engraulis encrasicolus L.) in the Bay of Biscay. Mar. Freshw. Res. 67, 951–966. doi: 10.1071/MF15092
Varela R., Álvarez I., Santos F., DeCastro M., Gómez-Gesteira M. (2015). Has upwelling strengthened along worldwide coasts over 1982-2010? Sci. Rep. 5 (1), 10016. doi: 10.1038/srep10016
Vermard Y., Marchal P., Mahévas S., Thébaud O. (2008). A dynamic model of the Bay of Biscay pelagic fleet simulating fishing trip choice: The response to the closure of the European anchovy (Engraulis encrasicolus) fishery in 2005. Can. J. Fisheries Aquat. Sci. 65, 2444–2453. doi: 10.1139/F08-147
Wang D., Gouhier T. C., Menge B. A., Ganguly A. R. (2015). Intensification and spatial homogenization of coastal upwelling under climate change. Nature 518, 390–394. doi: 10.1038/nature14235
Keywords: CICES cascade, indicators, anchovy fishery, ecosystem service value, provisioning ecosystem service
Citation: Olano-Arbulu A, Uyarra MC, Pouso S and Borja A (2025) Does the marine functioning link with the supply of ecosystem services and human benefits? A practical application in the Bay of Biscay. Front. Mar. Sci. 12:1497521. doi: 10.3389/fmars.2025.1497521
Received: 17 September 2024; Accepted: 24 February 2025;
Published: 14 March 2025.
Edited by:
Alberto Basset, University of Salento, ItalyReviewed by:
Patrik Kraufvelin, Swedish University of Agricultural Sciences, SwedenGianfranco D'Onghia, University of Bari Aldo Moro, Italy
Copyright © 2025 Olano-Arbulu, Uyarra, Pouso and Borja. This is an open-access article distributed under the terms of the Creative Commons Attribution License (CC BY). The use, distribution or reproduction in other forums is permitted, provided the original author(s) and the copyright owner(s) are credited and that the original publication in this journal is cited, in accordance with accepted academic practice. No use, distribution or reproduction is permitted which does not comply with these terms.
*Correspondence: Aitziber Olano-Arbulu, aolano@azti.es