 Lu Cao1,2
 Su Li1
 Shuwei Zhang1,2Ning Wu1,2Keke Zhang1,2Wenqing Li1,2Ran Ma1,2Dongzhi Chu1,2
 Ni Wang1,3*Yan Liu1,2*
- 1Qilu University of Technology (Shandong Academy of Sciences), Institute of Oceanographic Instrumentation, Qingdao, China
- 2Ocean Observation and Exploration Research Department, Laoshan National Laboratory, Qingdao, China
- 3Faculty of Information Science and Engineering, Ocean University of China, Qingdao, China
Continuous time series observations of seawater carbon dioxide partial pressure (pCO2) are crucial for documenting temporal variations in air-sea CO2 fluxes. To examine the seawater pCO2 variation and its influence factors at Qingdao coastal waters, a high-resolution observation of seawater pCO2 near the Xiaomaidao Island was conducted from May 29 to July 25 in 2024. Sea surface pCO2 varied from 519 µatm to 717 µatm during this monitoring period, with an obvious decline and rise from July 12 to 21. The variation of seawater pCO2 was mainly affected by the increasing sea surface temperature, except for the period of pCO2 decrease which was caused by Ulva prolifera bloom. Accompanied by the increase of U. prolifera, sea surface pCO2 decreased to 563 µatm, then the coverage of U. prolifera decreased and sea surface pCO2 rose to 669 µatm during period of July 12 to 21. The observation site acted as a source for atmospheric CO2 throughout the monitoring period, with air-sea CO2 flux ranging from less than 1 mmol m-2 d-1 to over 100 mmol m-2 d-1, resulting in a total CO2 release of 334 mmol m-2. Thus, it is essential for high-resolution measurement of pCO2 in coastal areas.
1 Introduction
The ocean is the largest reservoir of carbon, absorbing approximately 30% of the anthropogenic CO2 emitted into the atmosphere (Sabine et al., 2004). This process has induced ocean acidification and variations of carbonate system (Doney et al., 2009; Mostofa et al., 2016). Ongoing global warming and associated climate changes are expected to alter CO2 fluxes at the air–sea interface and the regulatory mechanism. Therefore, regular assessment of the temporal and spatial variabilities of marine pCO2 is urgently needed for research on carbon cycle and carbon budgets (Murata et al., 2022; Regnier et al., 2022; Wu et al., 2024).
The coastal region significantly influences the carbon cycle (Cai, 2011; Dai et al., 2022). Due to the strong terrestrial input and anthropogenic disruptions in coastal regions, the carbonate system and CO2 flux exhibit complex fluctuations (Lin and Lin, 2022; Xue et al., 2016), leading to alteration of coastal waters function as source or sink to atmospheric CO2. The temporal variations of seawater pCO2 influenced by factors such as temperature effects, mixing processes, biological processes and air-sea exchange and other contributing processes (Borges et al., 2006; Xue et al., 2016). As a transition zone connecting the southern Yellow Sea with Jiaozhou Bay, the Qingdao coastal region is strongly affected by anthropogenic activities and green tides. The green tides caused by U. prolifera have occurred annually in the southern Yellow Sea since 2007, usually appearing along the Qingdao coast in June and dissipating in August or early September (Yuan et al., 2022; Shao et al., 2024; Zhang et al., 2019). The U. prolifera bloom has resulted in extensive harm to the ecology and economy of coastal cities and led to significant alterations in the carbon system (Zhang et al., 2019; Xiong et al., 2023). Thus, the time series observation is essential for further understanding the temporal variation in seawater pCO2 and its associated influencing factor. In particular, the impact of U. prolifera on the carbonate system in Qingdao coast was mainly studied previously based on cruises sample collection (Hu et al., 2024; Li et al., 2021; Xiong et al., 2023; Deng et al., 2018; Hu et al., 2015), and lack of continuous high-resolution observations.
In this work, a time serious observation based on buoy near the Xiaomaidao Island at Qingdao coastal area was conducted during May 29 – July 25, 2024. Based on the collected data, we reported the variation in seawater pCO2 and the air–sea CO2 flux, identified the factors affecting the temporal changes in seawater pCO2, and explored the continuous influence of U. prolifera bloom on seawater pCO2.
2 Materials and methods
2.1 Study site
The observation site (120.44°E, 36.05°N) is located at Qingdao coastal area (Figure 1), near Xiaomaidao Island, and is in a transition zone connecting the southern Yellow Sea with Jiaozho Bay. This site is dominated by semi-diurnal currents, with a water depth of about 23 m. The rainfall is highest in summer and lowest in winter, with an average annual precipitation of approximately 660 mm (http://www.qingdao.gov.cn). The investigation area is affected by the southeast monsoon and coastal waters in summer. The sea surface salinity (SSS) is the highest in winter, and the peak sea surface temperature (SST) generally occurs in August. Since 2007, U. prolifera has occurred annually in the southern Yellow Sea, and Qingdao is one of the cities receiving the macroalga.
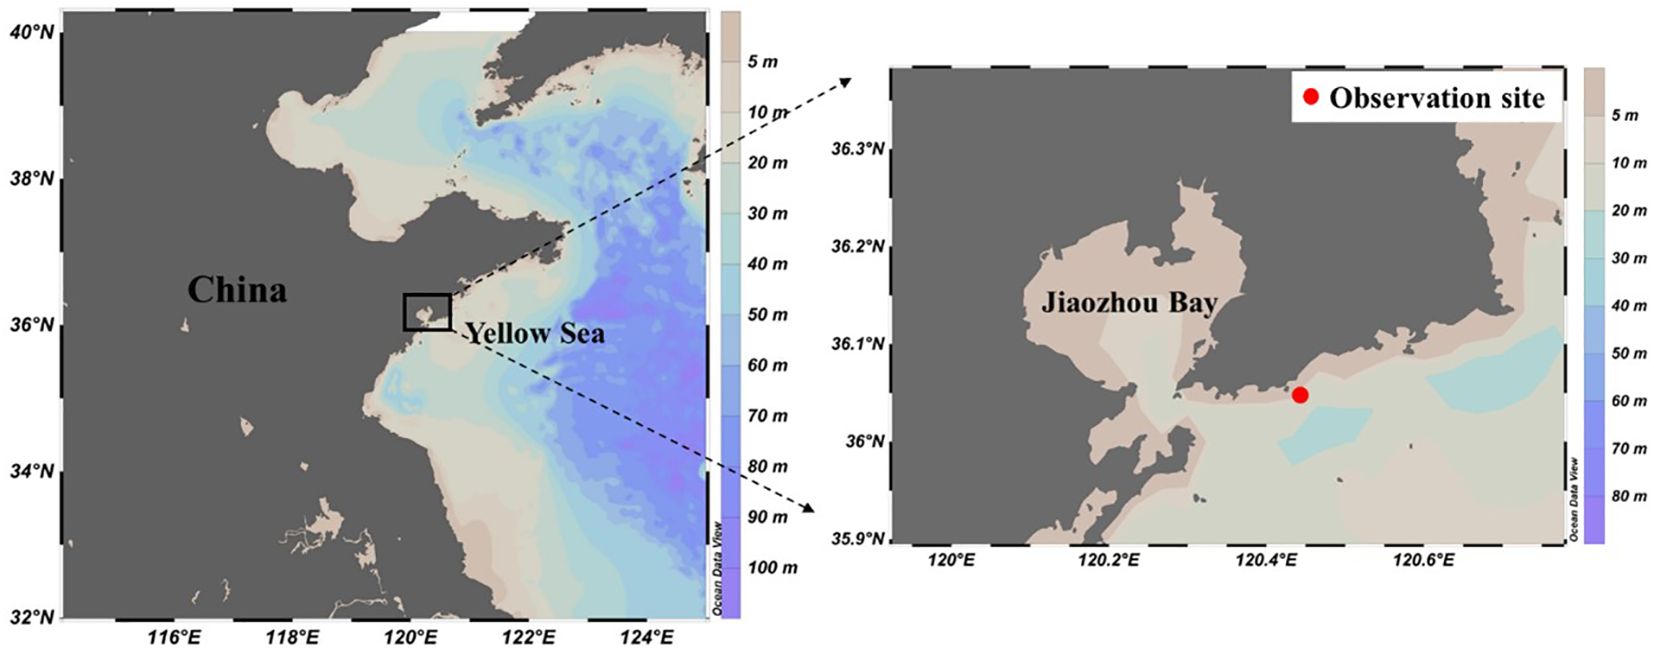
Figure 1. Location of observation site near the Xiaomaidao Island.
2.2 Field observations based on buoy
The 15 m intelligent buoy was deployed at the observation site from May 29 to July 25 in 2024. There was an air-water equilibrator (MAPCO2) (Friederich et al., 1995; Sutton et al., 2014) placed in the buoy shaft floating on the sea surface based on float, and a customized gas control module and standard gas (Figure 2) fixed in the buoy chamber without contact with seawater for pCO2 measurement. During monitoring, the seawater pCO2 was measured with a frequency of 1 h or 2 h and the calibration frequency was 24 h. The atmosphere pCO2 data which was measured at sit on May 29, 2024, was used for air-sea CO2 flux calculation. The sea surface temperature (SST) and sea surface salinity (SSS) were determined by SBE37 (Sea-bird Scientific). The dissolved oxygen saturation (DO%) which refers to the ratio of seawater DO content to its solubility, was measured using the probe developed by the institute of Oceanographic Instrumentation. The wind speed was measured using an ultrasonic anemometer (windmaster pro, Gill Instruments) installed at a height of 10 m.
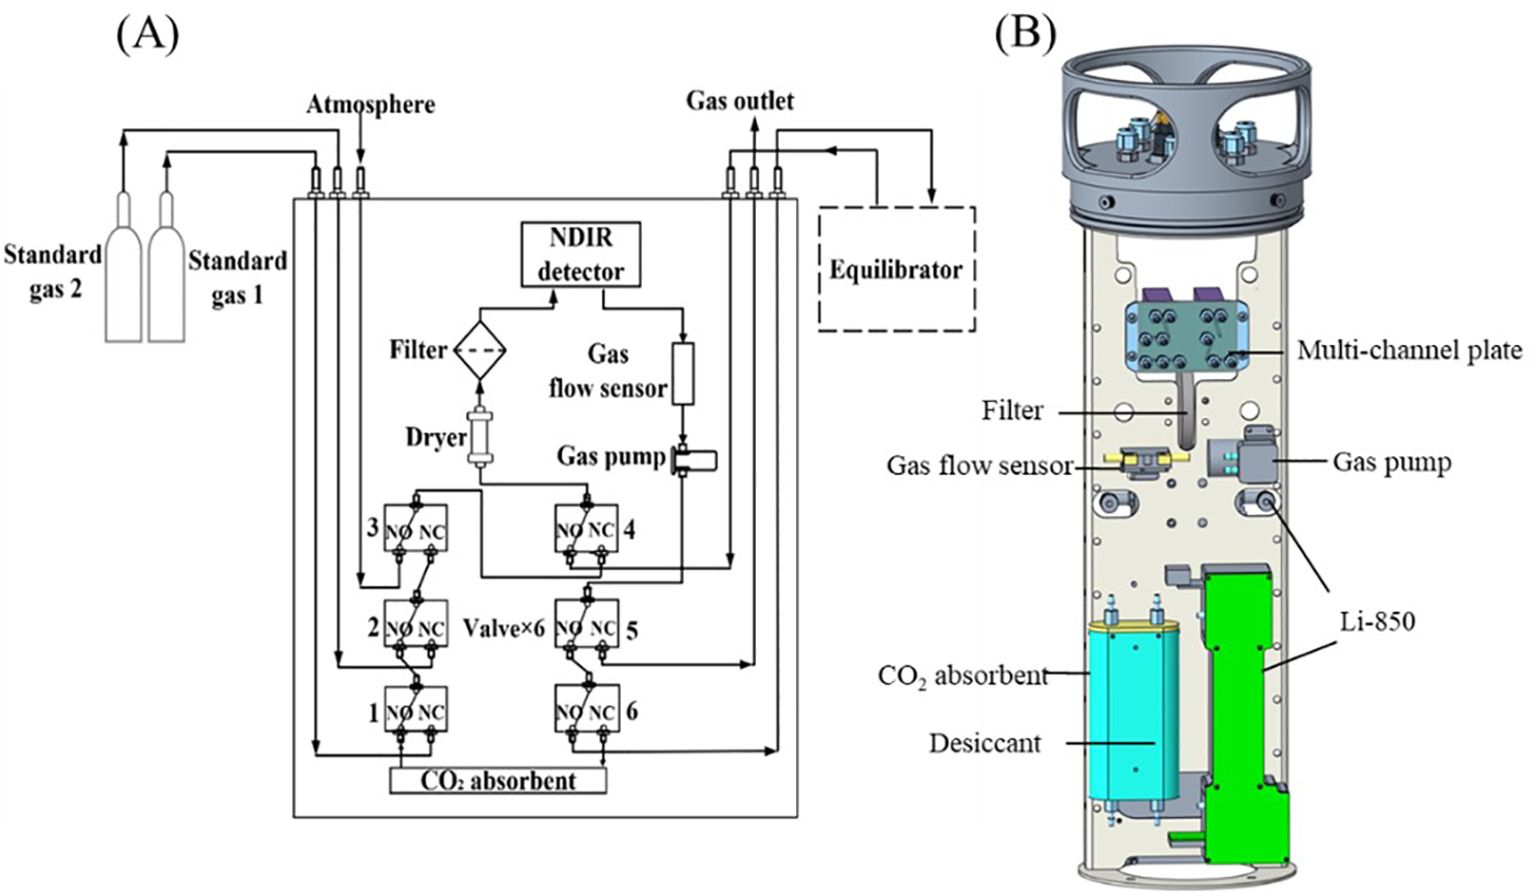
Figure 2. Schematic (A) and machine drawing (B) of the gas control module. NO and NC refer to the normally open and closed three-way valve setting, respectively.
2.3 Determination of pCO2
The in-situ non-dispersive infrared (NDIR) seawater pCO2 instruments (Fietzek et al., 2014; Sutton et al., 2014; Hunt et al., 2017; Ribas-Ribas et al., 2018) are often employed on the buoy to describe the temporal variations of pCO2 and CO2 fluxes at the air-sea interface (Atamanchuk et al., 2015; Xue et al., 2016; Liu Q. et al., 2019). They used the gas-permeable membrane (Fietzek et al., 2014) or continuous bubbling air–water equilibrator (Sutton et al., 2014) to equilibrate the headspace air with seawater. After equilibration, the CO2 composition of headspace air reflects that of seawater. The evaluation and comparison of commercial in-situ pCO2 instruments demonstrated that the system employing bubble equilibration technique (Sutton et al., 2014) had high accuracy and stability (Alliance for Coastal Technologies, 2010a, b, c). Though the commercial in-situ instrument using bubble equilibration (MAPCO2) is widely used, it is sometimes inflexible for installation, inconvenient self-maintenance and expensive. The water quality monitoring buoys have been well developed by integrating biochemical sensors, optical devices for absorption, fluorescence and scattering, and communication devices (Błażejewski et al., 2024, 2023; Agade et al., 2022; Ng et al., 2012) for field applications. Therefore, easily integrated seawater pCO2 instruments are needed for future collaborative observations.
To flexible investigate the seawater pCO2 variations in Qingdao coastal waters, a customized and concise gas control module combined with standard gas (National Standard Material Research Center) and the bubble equilibrator of MAPCO2 (Friederich et al., 1995; Sutton et al., 2014) which connects gas control module with two gas pipelines were deployed on a 15m intelligent buoy in this article. The module operates in three modes: seawater measurement, atmosphere measurement and calibration modes (Figure 2A). During seawater pCO2 measurement, the gas driven by pump circularly goes out from the gas pipe (1.6 mm i.d., 3.2 mm o.d.) beneath seawater surface and continuously bubbles in the equilibrator which floated on the sea surface, then the gas returns to the gas control module through the other pipe (3.2 mm i.d., 6.4 mm o.d.). The equilibrator was made of copper-nickel alloy to prevent biofouling. More details for bubble equilibrator can be found in the paper by Sutton et al. (2014). During monitoring, the control module timed measured standard gas by switching different modes. The 12V voltage for gas control module was provided by buoy’s solar power, and data is transmitted over 3G/4G networks.
The gas control module is housed in a sealed cylindrical cabin, including NDIR detector (Licor850, LI-COR Biotechnology), gas flow sensor (AWM3300, Honeywell Automation & Control, Inc.), desiccant (silica gel), CO2 absorbent (soda lime), filter (1.0 µm), gas pump (KLVP-SB12, Kamoer Fluid Tech Shanghai Co., Ltd., China), electromagnetic three-way valves (LVM105R-6B, SMC), customized multi-channel plate, gas pipe and the control circuit (Figure 2). The NDIR detector measures mole fraction of CO2 (xCO2) and H2O (xH2O) in gas path at about 51.5 °C, and has a thermal insulation cavity outside to ensure the stability and accuracy measurements. The desiccant is used to absorb vapor in the gas path. The soda lime is used to absorb CO2 during zero gas calibration. The gas flow sensor is used to monitor the condition of system during measurement. The three-way valves were connected to the gas pipe through channels (diameter 1.5 mm) inside the multi-channel plate (Figure 2B). The gas control module could be operated in different modes based on the positions of three-way valves, similar to other instruments. The gas control module has the characteristics of simple structure and good integration.
Given the lack of drying methods for long-term autonomous measurements, the determined xCO2 should be converted to dry xCO2. Finally, the pCO2 of seawater at 100% humidity was calculated.
The dry xCO2 was calculated using the following equation:
where the xCO2dry (µmol mol-1) is xCO2 in dry air, and xCO2 (µmol mol-1) and xH2O (mol mol-1) denote the measured concentrations.
The partial pressure of the surface seawater CO2 (pCO2, µatm) is calculated as follows:
where is the corrected xCO2, p denotes the pressure (atm) of atmosphere, and refers to the water vapor pressure at 100% humidity obtained using the in-situ temperature (t, °C) and salinity (S) (Weiss and Price, 1980).
The precision of the pCO2 measurement system was evaluated through repeated measurements of seawater samples, and the results were expressed as standard deviation (SD) of xCO2. The seawater samples were adjusted to various pCO2 values using NaOH and HCl solutions. Table 1 shows the precision of the seawater pCO2 measurement system during repeated measurements of three seawater samples in the laboratory. With xCO2 values in the range of 390–800 µmol mol-1, the measurement system exhibited a precision better than 1 µmol mol-1, with the SD ranging from 0.67 µmol mol-1 to 0.84 µmol mol-1. Good precision here provides a prerequisite for obtaining good accuracy.
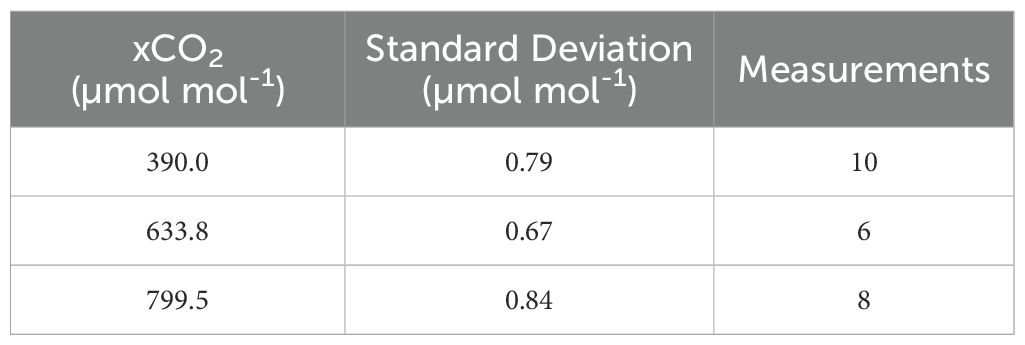
Table 1. Precision test in the laboratory.
The accuracy was evaluated by comparing with an underway seawater pCO2 instrument (GO8050, General Oceanics, INC.). The accuracy was expressed as the relative error of xCO2 (Table 2). Prior to comparison, the underway instrument was calibrated using standard gases. For comparison, equilibrator and water pump of the underway instrument were placed in a thermostatic bath containing the seawater samples. The accuracy was estimated in a xCO2 range of 200 – 1000 µmol mol-1 through adjustment of seawater with HCl and NaOH solutions. The average of 10 continuous measurements obtained by the GO8050 analyzer after equilibrium was considered the true value. In the xCO2 range of 200 – 1000 µmol/mol, the error was -5.1 – 2.3 µmol mol-1, and the relative error was within 1%.
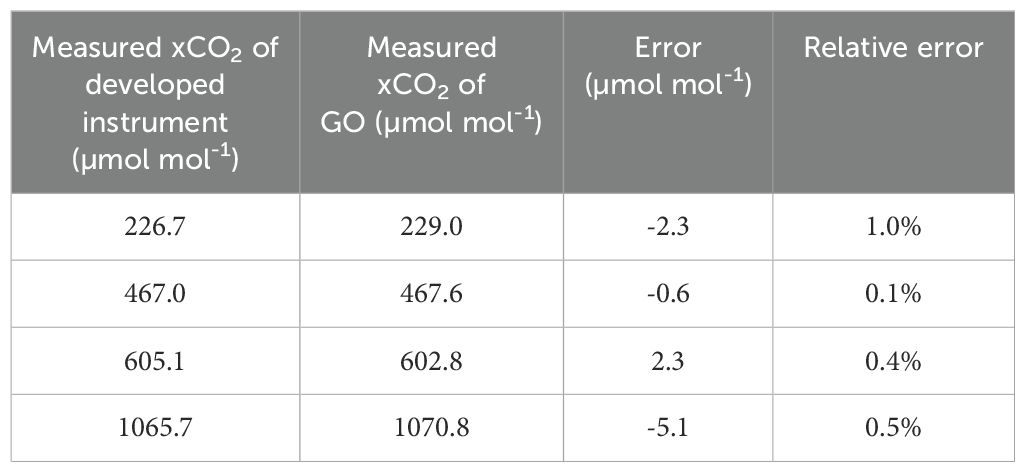
Table 2. Accuracy test in the laboratory.
2.4 Data processing
To eliminate the thermodynamic influence of temperature, we normalized pCO2 to the average temperature of the investigation (npCO2) by Takahashi et al. (1993):
where npCO2 is the normalized pCO2, and tm denotes the average temperature during the time series monitoring. Meanwhile, simulated pCO2 changes solely caused by temperature could be calculated when SST is the initial temperature and tm is the observed temperature.
Air–sea CO2 flux (FCO2, mmol m-2d-1) was estimated according to the following equation:
where k indicates the gas transfer velocity, K0 represents the solubility coefficient of CO2 (Weiss, 1974), and pCO2water and pCO2air are the pCO2 in the surface water and atmosphere, respectively. k was estimated using the formula proposed by Sweeney et al. (2007).
where U10 (m s-1) refers to the wind speed at 10 m height. Sc denotes the Schmidt number of CO2 in seawater (Wanninkhof, 1992). In this paper, a positive value of FCO2 denoted CO2 release from water to the atmosphere.
3 Results and discussion
3.1 Variations of monitoring data at coastal site
During the buoy-based time series observation period of May 29 – July 25, 2024, U. prolifera bloom was observed at Qingdao coastal region based on satellite remote images. Its coverage increased in mid-July and then decreased in late July (Figure 3). The SST increased from approximately 16°C to 22°C (Figure 4A) due to the increase in solar radiation. By contrast, SSS showed a decreased trend and ranged from ~31.0 PSU to ~29.2 PSU (Figure 4A). The sudden decrease in SSS during the observation period was possibly due to rainfall. On the days when the salinity dropped to about 29.2 PSU (July 8, July 16 and July 22), the daily rainfall at the observatory near Xiaomaidao Island was 58 mm, 39 mm and 48 mm, respectively (http://swglj.qingdao.gov.cn). During the observation period, the tidal height varied between 56 cm and 437 cm (Figure 4B). DO% also showed a general downward trend, varying within a range of 112% to 89% during the investigation period, and temporarily high values were observed in July (Figure 4D). Sea surface pCO2 ranged from 519 µatm to 717 µatm, with an average of 615 ± 45 µatm, and the daily average sea surface pCO2 increased by ~110 µatm at the end of observation compared with that in the beginning (Figure 4C). While the npCO2 of seawater showed a slightly decreasing trend, and a ~30 µatm lower daily average npCO2 was observed at the end of observation compared with that in the beginning (Figure 4D). In addition, both surface pCO2 and npCO2 showed a rapid decline and rise from July 12 to 21, and then the values remained stable.
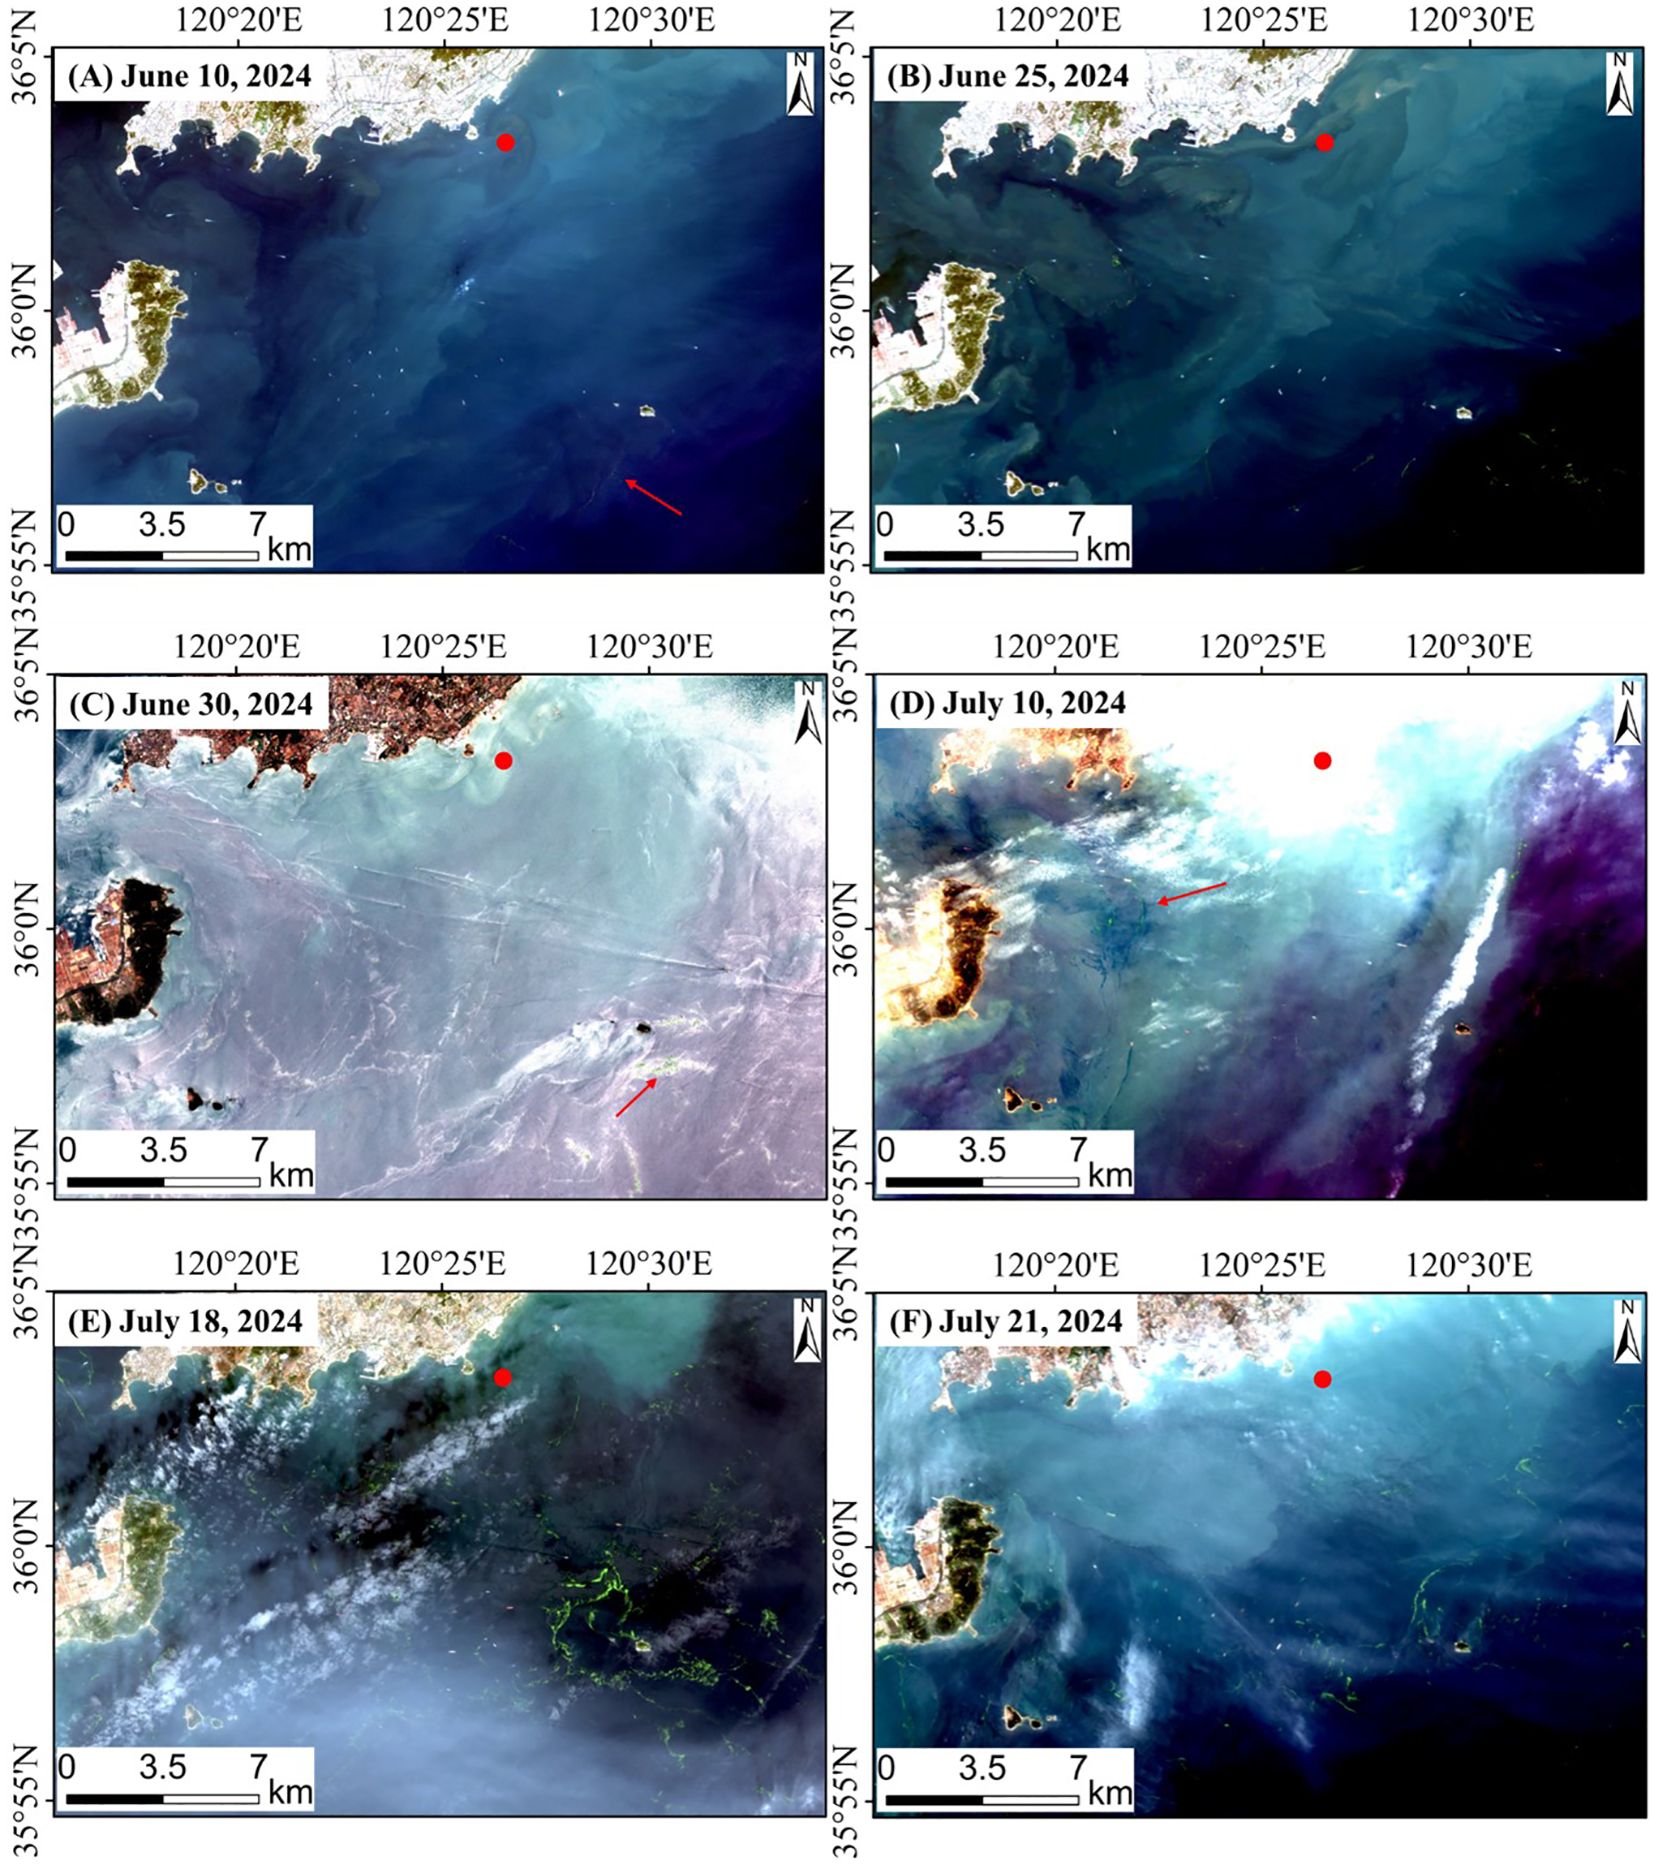
Figure 3. Satellite images of U. prolifera distribution. Panels (A-F) showed the distributions of U. prolifera on June 10, June 25, June 30, July 10, July 18 and July 21, 2024, respectively. These images were obtained using the monitoring data of GF-6 WFV and HJ-2A/2B CCD satellites (https://www.cresda.com/zgzywxyyzx/index.html) with 16m spatial resolution. The U. prolifera on June 10, June 30 and July 10 were indicated by red arrows.
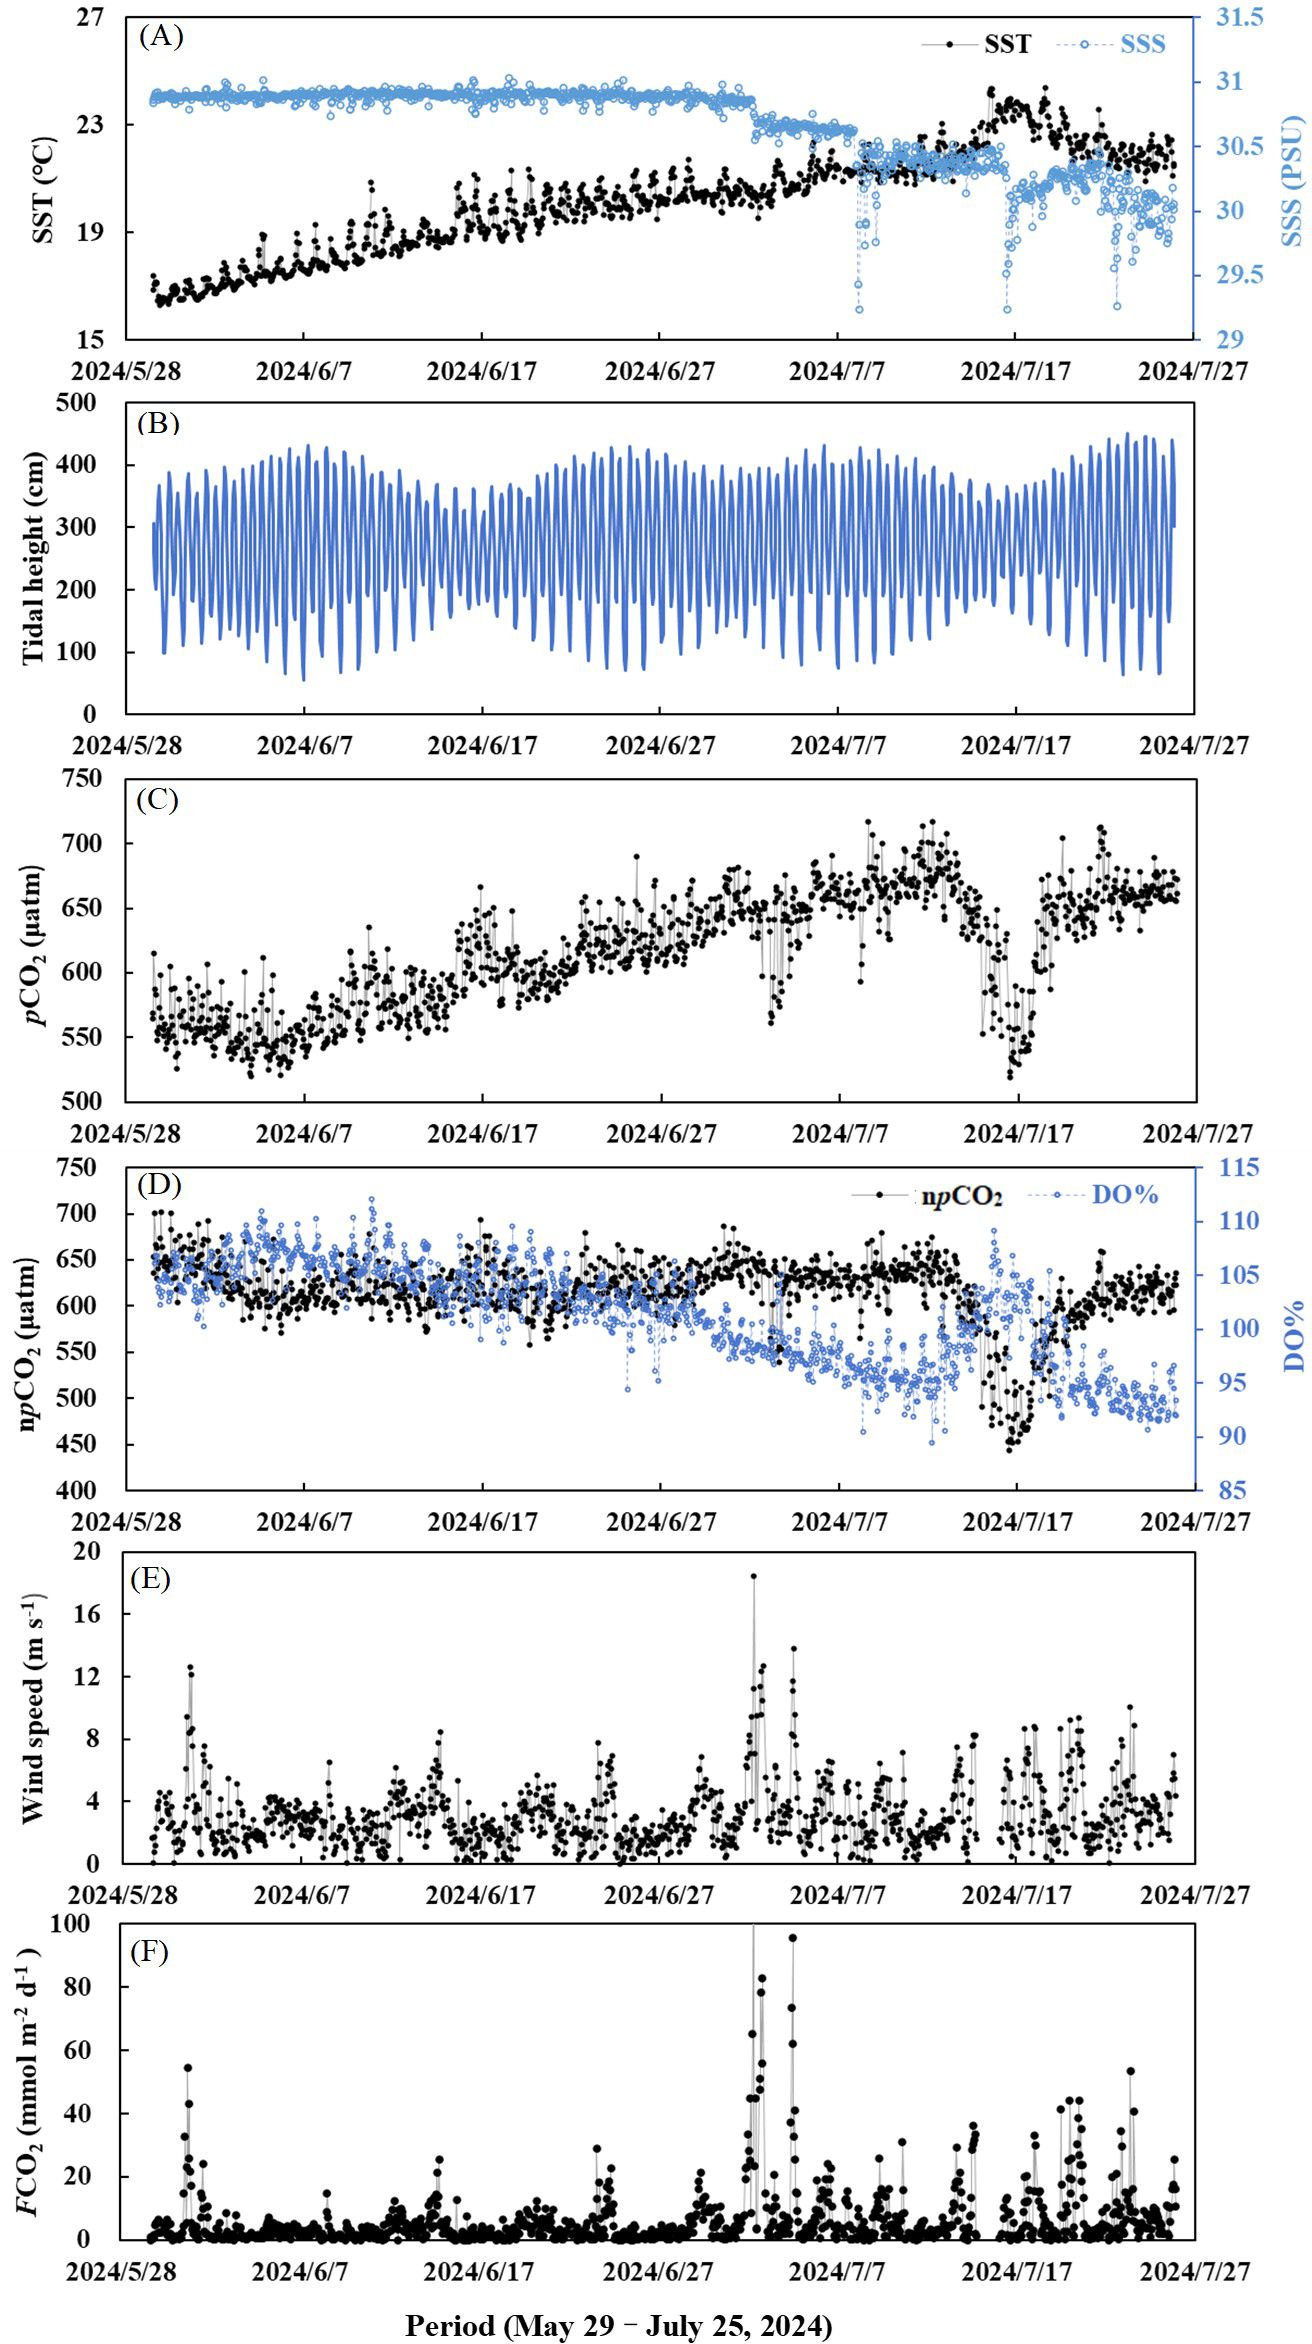
Figure 4. Variations in SST and SSS (A), tidal height (B), surface pCO2 (C), npCO2 and DO% (D), wind speed (E), and FCO2 (F) from May 29 to July 19, 2024.
The atmospheric pCO2 was 417 µatm, which is lower than that of seawater. Thus, this observation site served as a CO2 source for the atmosphere throughout the observation period in 2024. The wind speed ranged from 0.1 m s-1 to 18.5 m s-1, and the average was 3.0 m s-1 (Figure 4E). The large variations in wind speed and seawater pCO2 induced considerable changes in CO2 flux. The influence of wind speed is particularly important. According to Equation 6, the influence of wind speed on CO2 flux is quadratic. The CO2 flux ranged from less than 1 mmol m-2 d-1 to over 100 mmol m-2 d-1, roughly consistent with wind speed, with an average value of 5.9 mmol m-2 d-1 (Figure 4F). Furthermore, the variations in CO2 flux during the observation period demonstrated the importance of high-resolution monitoring in carbon flux estimation. Based on collected data, the seawater at investigation site near Xiaomaidao Island released 334 mmol CO2 m-2 to the atmosphere during May 29 – July 25, 2024.
The data collected in the western part of the southern Yellow Sea which lies approximately between 33°N and 37°N and west of the 50m isobath (Wang and Zhai, 2021) and Jiaozhou Bay (Li et al., 2023) during summer were compared with the investigation results of this study (Table 3). It was shown that the western part of the southern Yellow Sea had relatively lower SST, seawater pCO2, CO2 flux, and higher SSS, while lower SSS accompanied with higher SST, seawater pCO2 and CO2 flux were observed in Jiaozhou Bay compared with this study. During summer the Jiaozhou Bay became a strong source of atmospheric CO2. In addition to the higher SST, terrestrial inputs were also the reason for the high sea surface pCO2 and CO2 flux in Jiaozhou Bay. It was reported that except for the Dagu River, most rivers in Jiaozhou Bay had no pristine runoff and almost became channels of wastewater which was abundant in pCO2, resulting in the high seawater pCO2 values observed in Jiaozhou Bay (Gao et al., 2008; Li et al., 2023). Though there was no freshwater input from rivers near Xiaomaidao Island, the Qingdao coast area was significantly disturbed by human activities (Yang et al., 2018; Liu X. et al., 2019), making its sea surface pCO2 higher than that of the western part of the southern Yellow Sea.
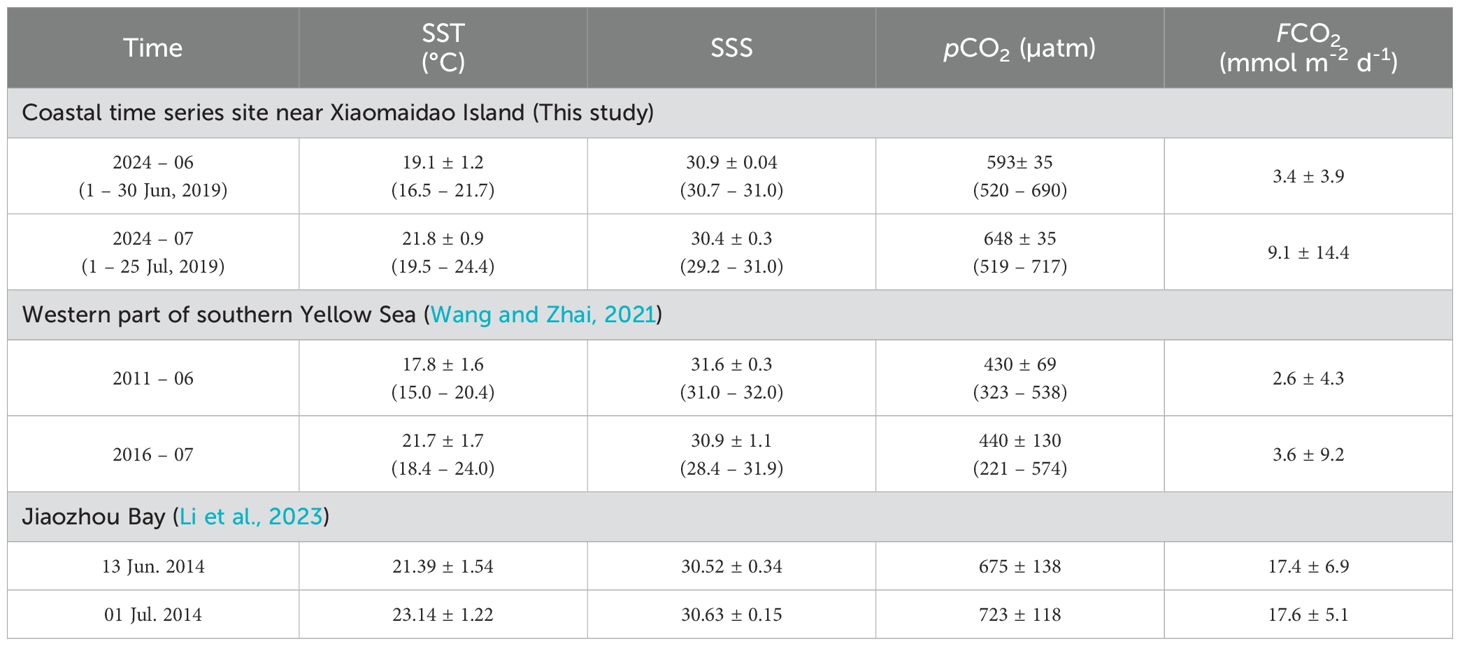
Table 3. Means and ranges (in brackets) of SST, SSS, seawater pCO2, and FCO2 at the time series site during 2024 and comparisons of these data with those obtained on the western part of southern Yellow Sea and the Jiaozhou Bay from literature.
3.2 Factors affecting sea surface pCO2 during time serious observation
The temporal variation of seawater pCO2 in coastal regions resulted from the interaction of multiple processes, at least including temperature effect, air-sea CO2 exchange, mixing processes and phytoplankton activity (Borges et al., 2006; Xue et al., 2016). Consistent with other studies of seawater pCO2 (Xue et al., 2016; Hu et al., 2024; Li et al., 2023), we used Pearson correlation analysis to explore the factors affecting sea surface pCO2 variations, where the square of the correlation coefficient r2 represents relevance and the p-value of less than 0.01 in the analysis results represented 99% confidence level (Figure 5). Consistent with the ~6 °C increase in SST, sea surface pCO2 except for the low values from July 12 – 21 showed an increasing trend during the time series monitoring, and it was strongly positive correlated with SST (r2 = 0.76, p<0.01) (Figure 5A), indicating the important influence of increasing temperature on the variations in pCO2 during this period. In addition, the temperature driven pCO2 values simulated according to the model proposed by Takahashi et al. (1993) were in good agreement with the observed values except for the low values during July 12 – 21 (Figure 5A), also suggesting the major control of SST on seawater pCO2 during this period. However, the daily average temperature simulated pCO2 value on July 25 was 34 μatm higher than that of the observed value, indicating influence of other factors.

Figure 5. Sea surface pCO2 versus SST (A), npCO2 versus SSS (B), and npCO2 versus DO% (C) from May 29 to July 25, 2024. Positive correlation between pCO2 and SST on May 29 – July 11 and July 22 – 25, and negative correlation between npCO2 and DO% on July 12 – 21 were observed. In panel (A), red lines indicate simulated pCO2 driven by temperature variations based on Equation 4.
By normalizing the pCO2 values to the average SST, npCO2 values were obtained to evaluate influence of other factors on sea surface pCO2. SSS showed a decreased trend in this study, while npCO2 did not evidently increase, and no correlation between npCO2 and tide (Figure 5B), suggesting that the influence of terrestrial inputs with abundant pCO2 was offset by other processes, such as biological activity and air-sea CO2 exchange. During the whole observation period, the decreased trend of DO% and a ~30 µatm decrease in npCO2 implied that biological activity was not an important factor controlling the seawater pCO2 change. Considering the slight decrease in the level of npCO2 during the overall period, the release of CO2 from seawater to atmosphere in the air–sea exchange process may also influence the pCO2 variations.
3.3 U. Prolifera blooms affecting sea surface pCO2
Since July 12, both the surface pCO2 and npCO2 showed an obvious decrease and the daily average of seawater pCO2 and npCO2 reached the lowest on July 16 – 17, with values of 563 μatm and ~488 μatm, respectively, which were 116 μatm of pCO2 and 147 μatm of npCO2 lower than those in July 12, and then the daily average pCO2 and npCO2 value increased to 669 μatm and 615 μatm on July 21, respectively. On the contrary, the daily average DO% reached ~102% on July 16 – 17 and then decreased. The npCO2 exhibited a negative correlation with DO% during July 12 – 21 (r2 = 0.51, p<0.01) (Figure 5C), indicating the important influence of biological activity on the variation in pCO2 during this special period.
Based on satellite remote images, U. prolifera was observed to increase obviously on July 18 (Figure 3E), which was roughly consistent with the date of the seawater pCO2 reduction, indicating the influence of U. prolifera bloom on carbonate system. The rapidly decreasing pCO2 and increasing DO% in seawater was caused by the biological production of U. prolifera. It was reported that at the early bloom stage, photosynthesis of macroalga can quickly absorb dissolved inorganic carbon in seawater, leading to a decrease of pCO2 in seawater (Li et al., 2014; Zhang et al., 2019). The cruise investigation at offshore area of Qingdao (Hu et al., 2024) also showed the decreased dissolved inorganic carbon and increased pH in seawater during bloom phase. Subsequently, as shown in satellite image on July 21(Figure 3F), the amount of U. prolifera decreased, which may be caused by manual cleaning and sink of the decaying macroalga. Thus, the rising pCO2 and decreased DO% in seawater after July 17 was related to the decomposition and respiration of decaying algae by microorganisms. Previous studies on the U. prolifera affecting the carbonate system in the Qingdao coastal area usually focused on the late bloom or after bloom period. These reports also found the release of CO2 and reduced DO during the late bloom period (Deng et al., 2018; Xiong et al., 2023). However, previous studies were based on limited sample collection, and the effect of U. prolifera on carbonate system mostly examined vis incubation experiment, lacking in-situ continuous observations (Deng et al., 2018; Xiong et al., 2023). The time series observation in this work captured the significant effect of the continuous changing U. prolifera on seawater pCO2, especially the influence on obvious decrease of seawater pCO2 at early bloom stage, which confirms that the high-resolution measurements are essential for the study of carbonate system during algal blooms and provides a reference for the future study of the U. prolifera blooms influence on carbonate system.
4 Conclusion
The buoy-based time series monitoring seawater pCO2 near Xiaomaidao Island during summer showed the necessity for high-resolution measurement of pCO2 in coastal seawater. During the observation period, the surface seawater pCO2 showed a generally increased trend, with an average value of 615 ± 45 µatm, and it was mainly affected by the increased temperature except for the decreased pCO2 during July 12-21. We captured the rapid decline and rise of seawater pCO2 and npCO2 during this special period which was caused by the U. prolifera bloom, and the daily mean seawater pCO2 and npCO2 decreased by 116 μatm and 147 μatm, respectively, compared with the values before decrease. Jiaozhou Bay was a strong source of atmospheric CO2 during summer, and the observation site was also acted as a CO2 source. The CO2 flux of observation site was greatly affected by wind speed and seawater pCO2, releasing 334 mmol CO2 m-2 throughout the investigation period.
Data availability statement
The raw data supporting the conclusions of this article will be made available by the authors, without undue reservation.
Author contributions
LC: Conceptualization, Data curation, Funding acquisition, Writing – original draft. SL: Formal analysis, Writing – review & editing. SZ: Investigation, Methodology, Writing – review & editing. NWu: Investigation, Writing – review & editing. KZ: Data curation, Writing – review & editing. WL: Investigation, Writing – review & editing. RM: Investigation, Writing – review & editing. DC: Methodology, Writing – review & editing. NWa: Supervision, Writing – review & editing. YL: Supervision, Methodology, Writing – review & editing.
Funding
The author(s) declare financial support was received for the research, authorship, and/or publication of this article. This work was supported by the Natural Science Foundation of China (42106185).
Conflict of interest
The authors declare that the research was conducted in the absence of any commercial or financial relationships that could be construed as a potential conflict of interest.
Publisher’s note
All claims expressed in this article are solely those of the authors and do not necessarily represent those of their affiliated organizations, or those of the publisher, the editors and the reviewers. Any product that may be evaluated in this article, or claim that may be made by its manufacturer, is not guaranteed or endorsed by the publisher.
References
Agade P., Bean E. Z., Dean R. N., Blersch D., Vasconcelos J., Knappenberger T., et al. (2022). GatorByte: A Water-Quality Mapping Buoy for Locating Watershed Pollution Sources. Proceedings of IEEE Sensors, 2022-October. doi: 10.1109/SENSORS52175.2022.9967172
Alliance for Coastal Technologies (ACT) (2010a). Performance demonstration statement for Contros HydroCTM/CO2, ACT DS10-01 UMCES/CBL 10-091.
Alliance for Coastal Technologies (ACT) (2010b). Performance demonstration statement for Pro-Oceanus Systems Inc. PSI CO2-Pro™, ACT DS10-03 UMCES/CBL 10-093.
Alliance for Coastal Technologies (ACT) (2010c). Performance demonstration statement for PMEL MAPCO2/Battelle seaology pCO2 monitoring system, ACT DS10-02 UMCES/CBL 10-092.
Atamanchuk D., Tengberg A., Aleynik D., Fietzek P., Shitashima K., Lichtschlag A., et al. (2015). Detection of CO2 leakage from a simulated sub-seabed storage site using three different types of pCO2 sensors. Int. J. Greenh. Gas Con. 38, 121–134. doi: 10.1016/j.ijggc.2014.10.021
Błażejewski A., Pecolt S., Grunt M., Wieczorek G., Królikowski T. (2024). Multi-domain, Autonomous measurement buoy as an element of the water quality monitoring and early warning system in rivers and water reservoirs. Rocznik Ochrona Środowiska 26, 18–29. doi: 10.54740/ros.2024.002
Błażejewski A., Pecolt S., Królikowski T., Grunt M., Bielicki F. (2023). Project of innovative open multi-domain early warning platform enviwise for adverse events in water bodies and streams. Proc. Comput. Sci. 225, 27433–2753. doi: 10.1016/j.procs.2023.10.266
Borges A. V., Schiettecatte L. S., Abril G., Delille B., Gazeau F. (2006). Carbon dioxide in European coastal waters. Estuar. Coast. Shelf Sci. 70, 375–387. doi: 10.1016/j.ecss.2006.05.046
Cai W. J. (2011). Estuarine and coastal ocean carbon paradox: CO2 sinks or sites of terrestrial carbon incineration? Annu. Rev. Mar. Sci. 3, 123–145. doi: 10.1146/annurev-marine-120709-142723
Dai M., Su J., Zhao Y., Hofmann E. E., Cao Z., Cai W.-J., et al. (2022). Carbon fluxes in the coastal ocean: synthesis, boundary processes and future trends. Annu. Rev. Earth PI. SC. 50, 593–626. doi: 10.1146/annurev-earth-032320-090746
Deng X., Liu T., Liu C. Y., Liang S. K., Hu Y. B., Jin Y. M., et al. (2018). Effects of Ulva prolifera blooms on the carbonate system in the coastal waters of Qingdao. Mar. Ecol. Prog. Ser. 605, 73–86. doi: 10.3354/meps12739
Doney S. C., Fabry V. J., Feely R. A., Kleypas J. A. (2009). Ocean acidification: the other CO2 problem. Annu. Rev. Mar. Sci. 1, 169–192. doi: 10.1146/annurev.marine.010908.163834
Fietzek P., Fiedler B., Steinhoff T., Körtzinger A. (2014). In situ quality assessment of a novel underwater pCO2 sensor based on membrane equilibration and NDIR spectrometry. J. Atmos. Ocean. Tech. 31, 181–196. doi: 10.1175/JTECH-D-13-00083.1
Friederich G. E., Brewer P. G., Herlien R., Chavez F. P. (1995). Measurement of sea surface partial pressure of CO2 from a moored buoy. Deep-Sea Res. Pt. I 42, 1175–1186. doi: 10.1016/0967-0637(95)00044-7
Gao Z., Yang D., Qin J., Xiang L., Zhang K. (2008). The land-sourced pollution in the Jiaozhou Bay. Chin. J. Oceanol. Limn. 26, 229–232. doi: 10.1007/s00343-008-0229-7
Hu Z. X., Li T., Ge T. T., Hu J. W., Wang P., Liu C. Y., et al. (2024). Inter-annual and spatial variations of air-sea CO2 fluxes and acidification meshanism in the coastal waters of Qingdao, China during 2011-2019. Mar. pollut. Bull. 209, 117195. doi: 10.1016/j.marpolbul.2024.117195
Hu Y. B., Liu C. Y., Yang G. P., Zhang H. H. (2015). The response of the carbonate system to a green algal bloom during the post-bloom period in the southern Yellow Sea. Cont. Shelf Res. 94, 1–7. doi: 10.1016/j.csr.2014.12.006
Hunt C. W., Snyder L., Salisbury J. E., Vandemark D., McDowell W. H. (2017). SIPCO2: A simple, inexpensive surface water pCO2 sensor. Limnol. Oceanogr.: Methods 15, 291–301. doi: 10.1002/lom3.10157
Li B. H., Liu C. Y., Deng X., Wang K. K., Han L., Huang Y. H., et al. (2021). Responses of the marine carbonate system to agreen tide: a case study of an Ulva prolifera bloom in Qingdao coastal waters. Harmful Algae 110, 102133. doi: 10.1016/j.hal.2021.102133
Li Y. X., Xue L., Yang X. F., Wei Q. S., Xin M., Xue M., et al. (2023). Wastewater inputs reduce the CO2 uptake by coastal oceans. Sci. Total Environ. 901, 165700. doi: 10.1016/j.scitotenv.2023.165700
Li S. X., Yu K. F., Huo Y. Z., Zhang J. H., Wu H. L., Wu Q., et al. (2014). The photosynthetic physiological characteristics and evaluation of carbon fixation capacity of Ulva prolifera in Binhai sea area, Jiangsu Province. Mar. Fish 36, 306–313. doi: 10.13233/j.cnki.mar.fish.2014.04.005
Lin G., Lin X. (2022). Bait input altered microbial community structure and increased greenhouse gases production in coastal wetland sedimen. Water Res. 218, 118520. doi: 10.1016/j.watres.2022.118520
Liu Q., Dong X., Chen J. S., Guo X. H., Zhang Z. R., Xu Y., et al. (2019). Diurnal to interannual variability of sea surface pCO2 and its controls in a turbid tidal-driven nearshore system in the vicinity of the East China Sea based on buoy observations. Mar. Chem. 216, 103690. doi: 10.1016/j.marchem.2019.103690
Liu X. Y., Yang X. F., Li Y. X., Zang H., Zhang L. J. (2019). Variations in dissolved inorganic carbon species in effluents from large-scale municipal wastewater treatment plants (Qingdao, China) and their potential impacts on coastal acidification. Environ. Sci. pollut. Res. 26, 15019–15027. doi: 10.1007/s11356-019-04871-2
Mostofa K. M. G., Liu C. Q., Zhai W., Minella M., Vione D., Gao K., et al. (2016). Reviews and syntheses: ocean acidification and its potential impacts on marine ecosystems. Biogeosciences 13, 1767–1786. doi: 10.1196/annals.1439.013
Murata A., Inoue J., Nishino S., Yasunaka S. (2022). Early Wintertime CO2 uptake in the western Arctic Ocean. J. Geophys. Res.-Oceans. 127, e2021JC018037. doi: 10.1029/2021JC018037
Ng C. L., Senft-Grupp S., Hemond H. F. (2012). A multi-platform optical sensor for in situ sensing of water chemistry. Limnol. Oceanogr: Methods 10, 978–990. doi: 10.4319/lom.2012.10.978
Regnier P., Resplandy L., Najjar R. G., Ciais P. (2022). The land-to-ocean loops of the global carbon cycle. Nature 603, 401–410. doi: 10.1038/s41586-021-04339-9
Ribas-Ribas M., Kilcher L. F., Wurl O. (2018). Sniffle: A step forward to measure in situ CO2 fluxes with the floating chamber technique. Elem. Sci. Anth. 6. doi: 10.1525/elementa.275
Sabine C. L., Feely R. A., Gruber N., Key R. M., Lee K., Bullister J. L. (2004). The oceanic sink for anthropogenic CO2. Science 305, 367–371. doi: 10.1126/science.1097403
Shao K. S., Gong N., Shen L. Y., Han X., Wang Z. X., Zhou K., et al. (2024). Why did the world’s largest green tides occur exclusively in the southern Yellow Sea? Mar. Environ. Res. 200, 106671. doi: 10.1016/j.marenvres.2024.106671
Sutton A. J., Sabine C. L., Maenner-Jones S., Lawrence-Slavas N., Meinig C., Feely R. A., et al. (2014). A high-frequency atmospheric and seawater pCO2 data set from 14 open-ocean sites using a moored autonomous system. Earth. Syst. Sci. Data. 6, 353–366. doi: 10.5194/essd-6-353-2014
Sweeney C., Gloor E., Jacobson A. R., Key R. M., Mckinley G., Sarmiento J. L., et al. (2007). Constraining global air-sea gas exchange for CO2 with recent bomb 14C measurements. Global Biogeochem. Cy 21, GB2015. doi: 10.1029/2006GB002784
Takahashi T., Olafsson J., Goddard J. G., Chipman D. W., Sutherland S. C. (1993). Seasonal variation of CO2 and nutrients in the high-latitude surface oceans: a comparative study. Global Biogeochem. Cy. 7, 843–878. doi: 10.1029/93GB02263
Wang S. Y., Zhai W. D. (2021). Regional differences in seasonal variation of air-sea CO2 exchange in the Yellow Sea. Cont. Shelf Res. 218, 104393. doi: 10.1016/j.csr.2021.104393
Wanninkhof R. (1992). Relationship between wind speed and gas exchange over the Ocean. J. Geophys. Res. 97, 7373–7382. doi: 10.1029/92JC00188
Weiss R. F. (1974). Carbon dioxide in water and seawater: the solubility of a non-ideal gas. Mar. Chem. 2, 203–215. doi: 10.1016/0304-4203(74)90015-2
Weiss R. F., Price B. A. (1980). Nitrous oxide solubility in water and seawater. Mar. Chem. 8, 347–359. doi: 10.1016/0304-4203(80)90024-9
Wu Z. L., Wang H. J., Liao E. H., Hu C. M., Edwing K., Yan X.-H., et al. (2024). Air-sea CO2 flux in the Gulf of Mexico from observations and multiple machine-learning data products. Prog. Oceanogr. 223, 103244. doi: 10.1016/j.pocean.2024.103244
Xiong T. Q., Li H. M., Yue Y. F., Hu Y. B., Zhai W. D., Xue L., et al. (2023). Legacy effects of late macroalgal blooms on dissolved inorganic carbon pool through alkalinity enhancement in coastal ocean. Environ. Sci. Technol. 57, 2186–2196. doi: 10.1021/acs.est.2c09261
Xue L., Cai W.-J., Hu X., Sabine C., Jones S., Sutton A. J., et al. (2016). Sea surface carbon dioxide at the Georgia time series site, (2006–2007): Air–sea flux and controlling processes. Prog. Oceanogr. 140, 14–26. doi: 10.1016/j.pocean.2015.09.008
Yang X., Xue L., Li Y., Han P., Liu X., Zhang L., et al. (2018). Treated wastewater changes the export of dissolved inorganic carbon and its isotopic composition and leads to acidification in coastal oceans. Environ. Sci. Technol. 52, 5590–5599. doi: 10.1021/acs.est.8b00273
Yuan C., Xiao J., Zhang X. L., Zhou J., Wang Z. L. (2022). A new assessment of the algal biomass of green tide in the Yellow Sea. Mar. pollut. Bull. 174, 113253. doi: 10.1016/j.marpolbul.2021.113253
Keywords: carbon dioxide partial pressure, Qingdao Coast, Ulva prolifera influence, early bloom, CO2 flux
Citation: Cao L, Li S, Zhang S, Wu N, Zhang K, Li W, Ma R, Chu D, Wang N and Liu Y (2025) Buoy-based monitoring of sea surface carbon dioxide partial pressure at Qingdao coastal area. Front. Mar. Sci. 12:1496359. doi: 10.3389/fmars.2025.1496359
Received: 14 September 2024; Accepted: 22 January 2025;
Published: 19 February 2025.
Edited by:
Xianghui Guo, Xiamen University, ChinaReviewed by:
Riza Yuliratno Setiawan, Gadjah Mada University, IndonesiaAndrzej Błażejewski, Koszalin University of Technology, Poland
Copyright © 2025 Cao, Li, Zhang, Wu, Zhang, Li, Ma, Chu, Wang and Liu. This is an open-access article distributed under the terms of the Creative Commons Attribution License (CC BY). The use, distribution or reproduction in other forums is permitted, provided the original author(s) and the copyright owner(s) are credited and that the original publication in this journal is cited, in accordance with accepted academic practice. No use, distribution or reproduction is permitted which does not comply with these terms.
*Correspondence: Ni Wang, bml3YW5nMDYwNkB5ZWFoLm5ldA==; Yan Liu, c2RxZGxpdXlhbkAxMjYuY29t