 Wei Huang
 Jun Zhao
 Mingjie Li
 Quansheng Lou4,5
 Nanyang Yan
 Shaojie Sun
- 1Technology Innovation Center for South China Sea Remote Sensing, Surveying and Mapping Collaborative Application, Ministry of Natural Resources, Guangzhou, China
- 2School of Marine Sciences, Sun Yat-sen University, and Southern Marine Science and Engineering Guangdong Laboratory (Zhuhai), Zhuhai, China
- 3South China Sea Marine Institute of Environmental and Planning, State Oceanic Administration, Guangzhou, China
- 4Nansha Islands Coral Reef Ecosystem National Observation and Research Station, Guangzhou, China
- 5Ocean Centre of Sansha, Ministry of Natural Resources, Sansha, China
- 6Guangzhou Urban Planning & Design Survey Research Institute, Guangzhou, China
- 7Collaborative Innovation Center for Natural Resources Planning and Marine Technology of Guangzhou, Guangzhou, China
Accurate atmospheric correction (AC) is a crucial procedure for monitoring coral reef habitat in shallow waters via remote sensing techniques. In this study, three commonly used AC processors—Dark Spectrum Fitting (DSF), Case 2 Regional Coast Color processor (C2RCC), and Polymer—were applied to evaluate their performance on Sentinel-2 MSI imagery of coral reef areas in the Xisha Islands, South China Sea. Since the latter two processors incorporate a sunglint removal approach, additional procedures were applied to DSF. These include short-wave infrared band Glint Correction (GC), DeGlint (DG), and near-infrared band intercept (DG865) algorithms to enhance glint correction after the DSF processor. The results demonstrate that Polymer outperforms the DSF method (either standalone or with glint corrections) and C2RCC. Polymer-derived remote sensing reflectance showed excellent agreement with in situ measurements, with R2 > 0.95 in 3-hour matches and R2 > 0.65 in 6-hour matches in visible bands (443nm-665nm). It effectively removed most of the glint contamination in the NIR bands (740nm,783nm), while revealing contributions from bottom reflections. Under various image conditions, Polymer consistently delivered the highest bathymetry accuracy (R2: 0.51 - 0.85) and the most stable substrate classifications. This study underscores the critical role of accurate AC in retrieving bathymetry and coral reef substrate information from optically shallow waters using medium- to high-resolution MSI imagery. Polymer proves to be a robust tool for precise remote sensing of coral reefs, offering superior performance even in challenging conditions.
1 Introduction
Coral reefs are crucial ecosystems that support marine life, sustain biodiversity, and fisheries production, demonstrate significant ecological, environmental, and economic value (Connell, 1978; Wang et al., 2014). Optical remote sensing is particularly effective in highly clear, shallow coral reef regions, where it can penetrate water depths, retrieve water column optical properties, and identify coral reef substrates (Hedley et al., 2016). These advantages of optical remote sensing aid in coral reef growth monitoring, detection of coral bleaching events (Ma et al., 2023), delineation of geomorphological zones, and conducting benthic classification (He et al., 2023), making optical remote sensing indispensable for monitoring shallow water coral reef habitats (Lyons et al., 2020).
Originally engineered for terrestrial applications, the Sentinel-2 mission, with its relatively high spatial resolution (10 - 60 m), suitable spectral band configuration, and 5-day revisit period (when combining Sentinel-2A and B), is ideally suited for monitoring shallow water coral reef habitats (Antoine et al., 2016; John-D. et al., 2018). Accurate atmospheric correction (AC) of optical imagery remove signals from the atmosphere and sea surface, ensuring the precise retrieval of properties in the water column and coral reef substrates. As the water leaving radiance usually occupies a small percentage (<10%) of the total radiance, even a small error in the AC procedure would induce large uncertainties in the derivation of the remote sensing reflectance (Rrs) (Goodman et al., 2008; Botha et al., 2016; Wei et al., 2018). For example, a 0.5% error in AC could lead to a 5% error in deriving the water leaving radiance, and consequently affect the subsequent derivation of water column and substrate properties via Rrs (Gordon et al., 1997). Indeed, several difficulties affect the application of medium- to high- resolution optical imagery in shallow water coral reef regions: First, bathymetry estimation and habitat mapping in spatially heterogeneous coastal and reef environments must account for inter-pixel heterogeneity and intra-pixel effects caused by sunglint from individual wave facets or atmospheric adjacency effects (Botha et al., 2016). Second, the low reflectance substrate mimic deep-ocean Rrs, especially for coral reef substrate with depths beyond 2 meters (Botha et al., 2013). Third, medium to high spatial resolution optical sensors usually have fewer spectral bands compared with typical ocean color sensors (e.g., MODIS, VIIRS, OLCI) for retrieval of water column properties and benthic substrates using semi-analytical algorithms (Zoffoli et al., 2014). These challenges highlight the critical importance of accurate AC procedures in enabling effective satellite-based Rrs measurements in shallow coral reef environments.
Common AC algorithms for water color remote sensing include Dark Spectrum Fitting (DSF), Case 2 Regional Coast Color Processor (C2RCC), and Polymer, all of which are widely used in coastal and oceanic waters around the world (Brockmann et al., 2016; Vanhellemont, 2019; Warren et al., 2019; Zhang et al., 2019; Zhang and Hu, 2020). DSF is an image-based approach that automatically selects the most appropriate band, i.e., the band with the lowest atmospheric path reflectance, thus largely avoiding the amplification of sunglint and adjacency effects during the AC processing. After applying the DSF, sunglint reflectance can be estimated from the Short-Wave Infrared (SWIR) bands, and the application of sunglint correction significantly improves data availability for these nadir-viewing sensors (Vanhellemont and Ruddick, 2018; Vanhellemont, 2019). The C2RCC is a extension of the original Case 2 Regional processor (Doerffer and Schiller, 2007) adapted to different multispectral satellites (e.g., Sentinel-2, Landsat-8). The most recent update (available since February 2021) includes a new processor trained for atmospheric correction in complex waters. C2RCC is relatively insensitive to input variations and does not reject pixels, allowing Rrs to be fully recovered for scenes with moderate sunlight (Warren et al., 2019; Caballero and Stumpf, 2020). Polymer uses a polynomial fitting approach to correct for the effects of glints, simplifying the reflectance to a function of chlorophyll-a concentration backscatter variability coefficient (Steinmetz et al., 2011). This effectively eliminates the influence of sunglints on the satellite-received signal, thereby improving the quality and spatial coverage of the derived Rrs. In clear open ocean waters, where the optical properties are mainly determined by chlorophyll-a, the algorithm showed good performance (Steinmetz and Ramon, 2018; Zhang et al., 2018).
While the above AC algorithms are widely used in optically deep waters, their performances in optically shallow coral reef waters is variable. As DSF dynamically identifies the darkest pixels for each band and does not implement adjacency correction, it has been reported to perform worse than other AC algorithms in coral reef waters (Wei et al., 2018; Yan et al., 2023). C2RCC has been shown to underestimate Rrs, likely due to the optical conditions of the training set (Doerffer and Schiller, 2007), raising concerns about its accuracy and stability in shallow coral reef waters (Caballero and Stumpf, 2020). Polymer has been found to underestimate Rrs in turbid coastal waters, where changes in optical properties are not solely dependent on phytoplankton and their appendages (Windle et al., 2022a). Warren et al. (2019) demonstrated that these three algorithms exhibit high uncertainties in optically complex inland and coastal regions of European waters, with R2 less than 0.4, Rrs errors exceeding 100% in the red and 1000% in the near-infrared bands in some cases. Such performance variations raise significant concerns about applying these AC algorithms in the optically shallow waters of coral reefs. While satellite-derived bathymetry (SDB) and inverted substrate types have proven effective in evaluating AC performance in shallow water regions (Goodman et al., 2008; Caballero and Stumpf, 2020; Ma et al., 2020; Caballero and Stumpf, 2021; Duan et al., 2022), the differences in the accuracy of derived SDB and inverted substrate types reflect not only the influence of AC algorthms but also the inherent effectiveness of the algorithms themselves.
Therefore, the primary goal of this study is to access the performance of three commonly used AC algorithms and identify the optimal AC scheme for MSI imagery in optically shallow coral reef waters. The AC methods evaluated include DSF, C2RCC, Polymer, and additional sunglint correction algorithms applied to DSF. The evaluation involves comparing the AC derived Rrs spectra with in situ measurements, as well as assessing the bathymetry and substrate estimates derived from the Rrs in the Xisha Reefs, South China Sea. The findings will provide valuable insights into the application of AC methods in shallow water coral reef regions, offering strategies for precise coral reef monitoring using remote sensing techniques.
2 Materials
2.1 Site description
The Xisha Islands are located in the northwestern part of the South China Sea, primarily between 111°-113°E and 15°40’-17°10’N (Figure 1). A well-developed coral reef ecosystem exists within the area, with sediments composed mainly of biogenic carbonates. The reef structure consists of coral skeletons and frameworks containing both living and dead reef-building corals, while pore spaces within the skeletal frameworks support a wide variety of corals, shell fragments, and biogenic detritus (QiDong, 2014). The water in this area is typically clear, allowing visibility to depths of 20-30 meters. Hydrodynamic mixing is strong in fore- and shore-reef waters, with higher concentrations of suspended particulate matter and higher proportions of inorganic particulate matter than in the lagoon. Chlorophyll concentrations are relatively high in inshore reef waters, often reaching levels up to 10 times higher than those found in lagoons and fore-reef areas (Kai, 2022).
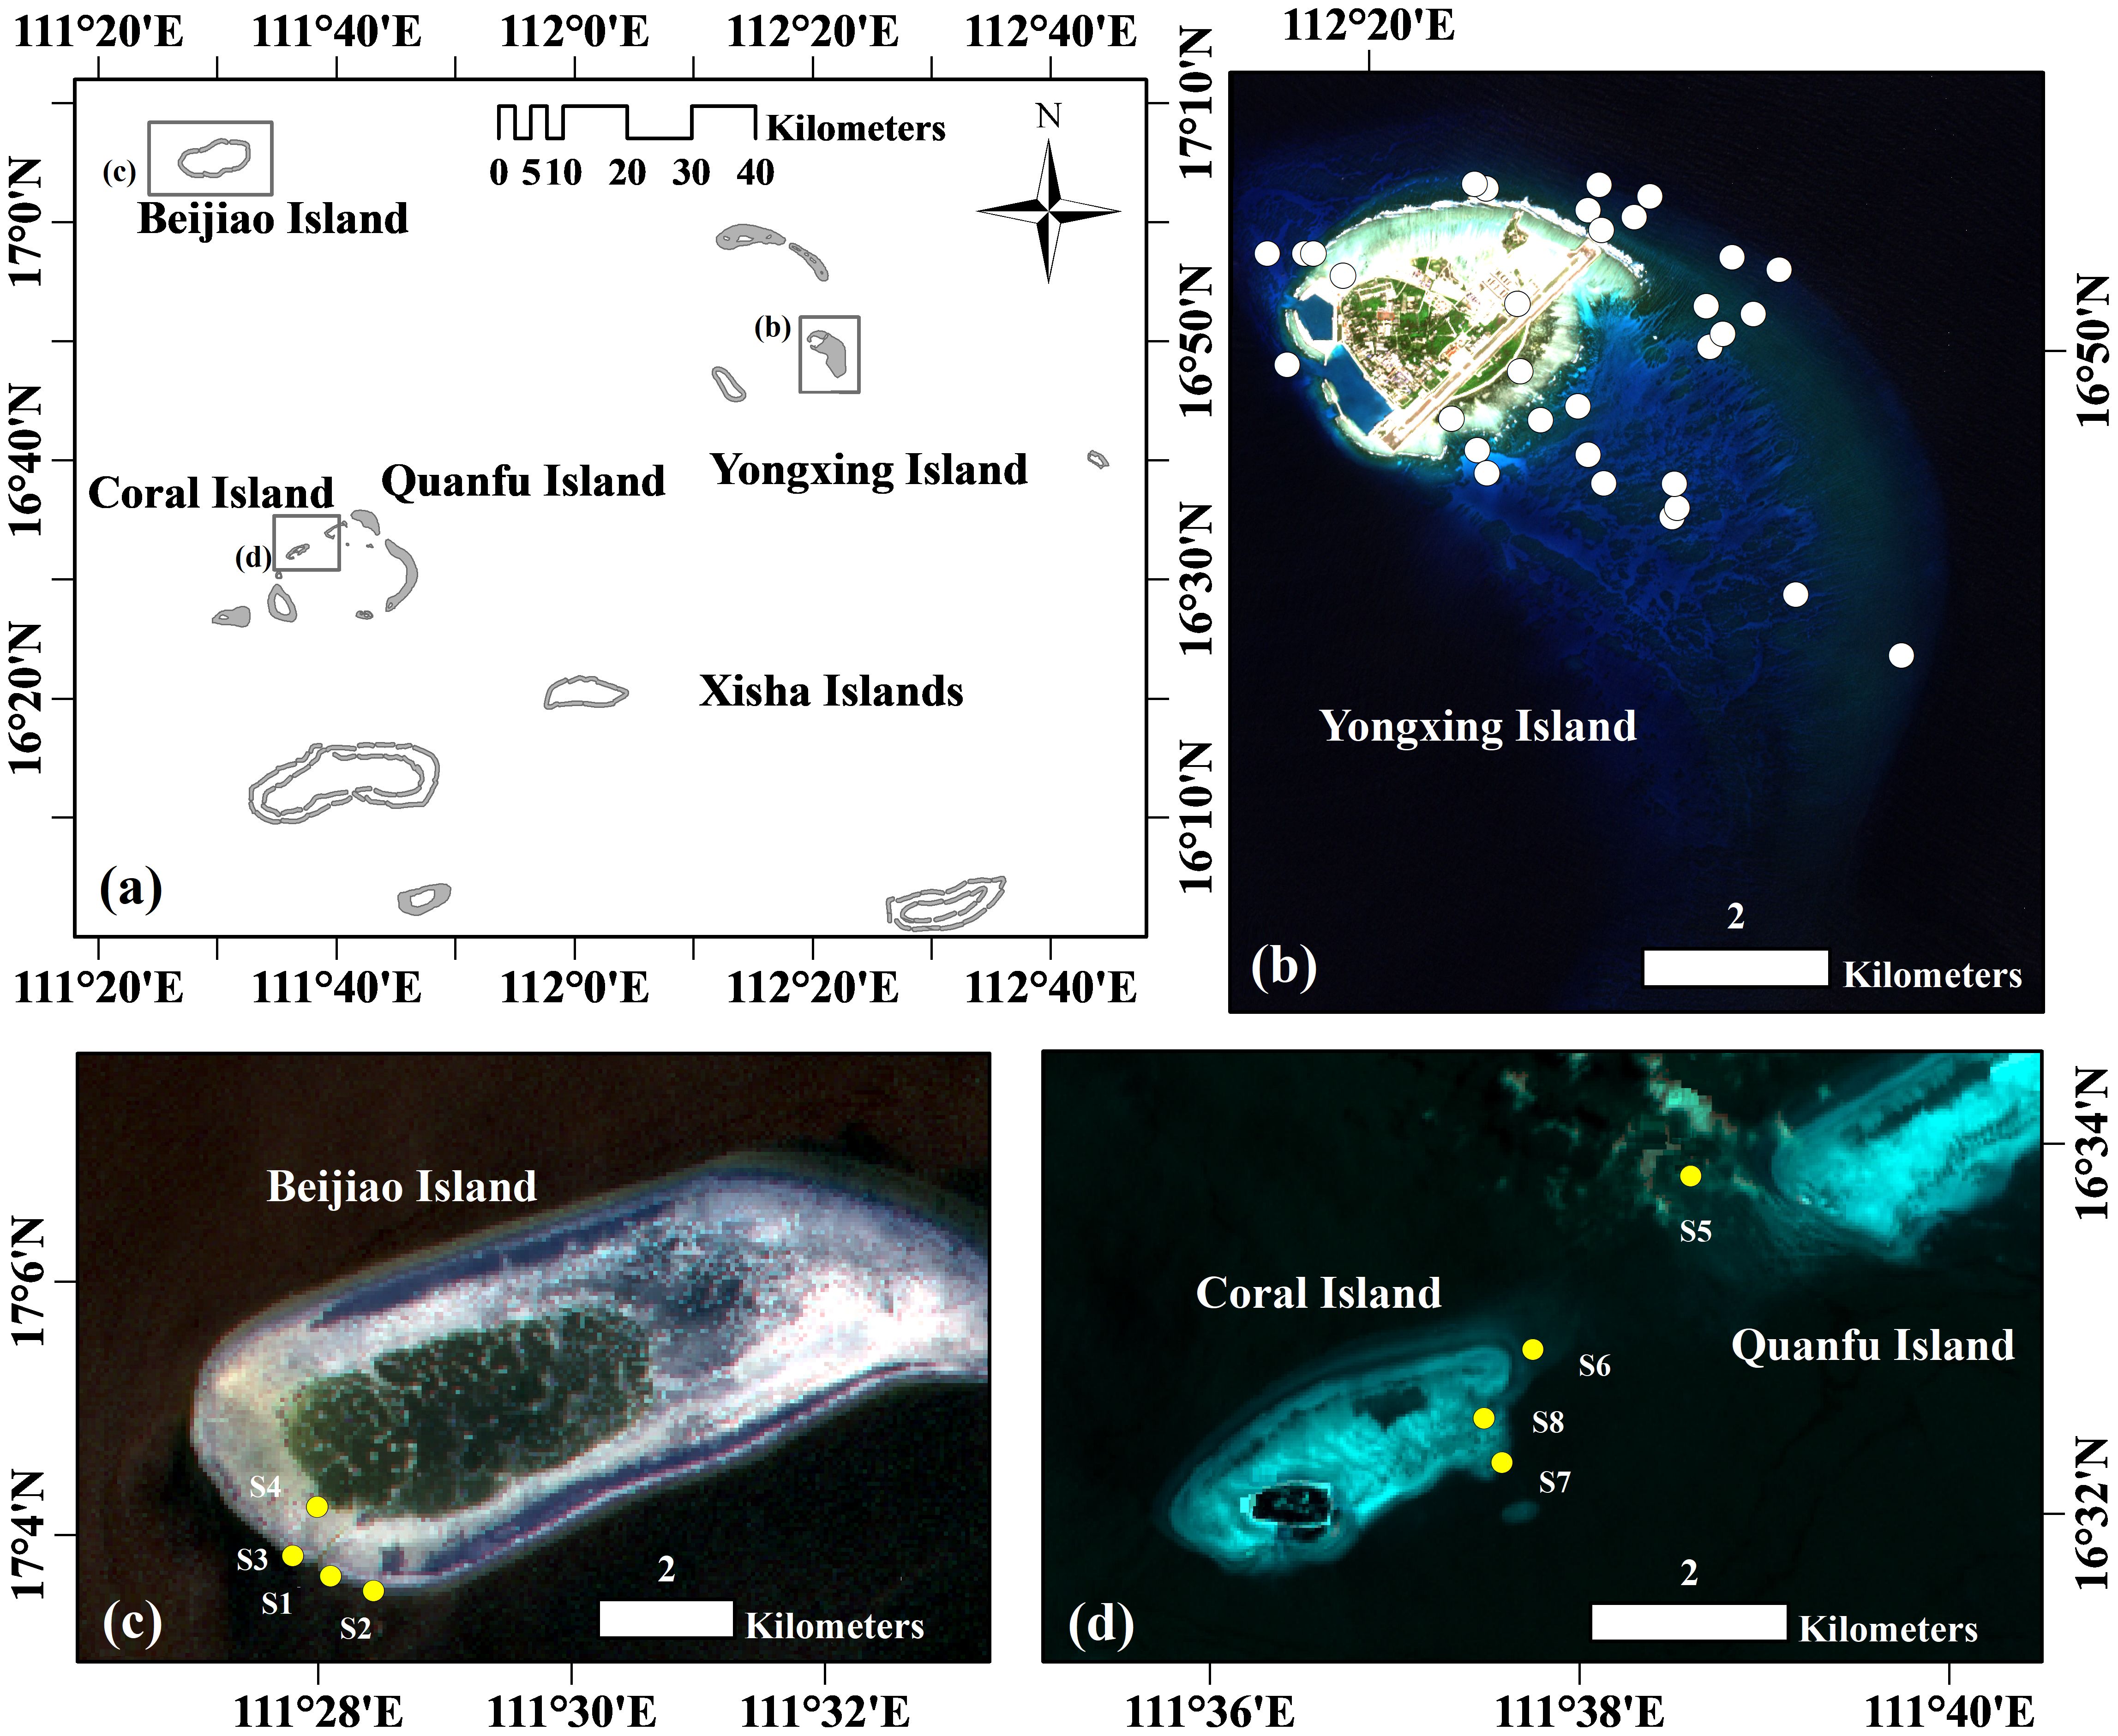
Figure 1. (A) Study area of Xisha Islands, South China Sea. Zoomed in graphs of Yongxing, Beijiao, and Coral Islands are displayed in (B–D) with background of cloud-free Sentinel-2 MSI imagery, respectively. Station numbers S1 to S8 (yellow points) indicate locations for Rrs and bathymetric measurements. White points indicate locations with only bathymetric measurements around Yongxing Island.
2.2 Sentinel-2 MSI imagery and in situ data
The Sentinel-2 mission is part of the European Copernicus Program’s Earth observation missions. It consists of two identical satellites, Sentinel-2A and Sentinel-2B, launched in 2015 and 2017, respectively. Both satellites carry MultiSpectral Instrument (MSI) optical sensors with 13 spectral bands, spanning from visible and near-infrared to short-wave infrared, with spatial resolutions ranging from 10 to 60 meters (Drusch et al., 2012). Six MSI images were used in this study, two of which were matched with same day in situ measurements (Table 1, data assessed via https://dataspace.copernicus.eu/). The others were used for assessment of SDB and substrate types. All MSI spectral bands were resampled to a 10-m spatial resolution and projected to the WGS84/UTM zone 49N coordinate system.
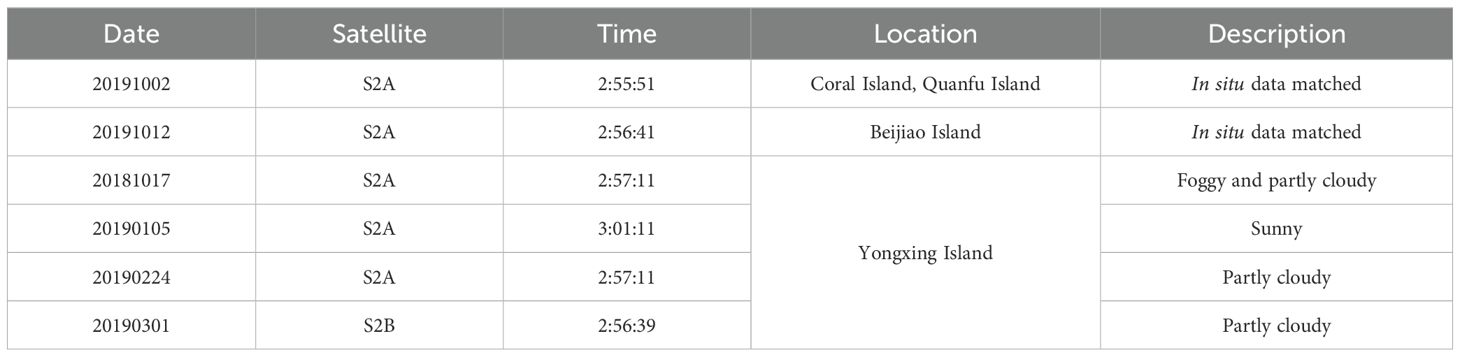
Table 1. Information on Sentinel-2 MSI satellite images used in this study.
In situ measurements of Rrs (see Figure 2) and water depth were utilized to assess the performance of the AC methods (circle points in Figure 1). On October 2, 2019, and October 12, 2019, eight sets of paired points were established on Beijiao, Coral, and Quanfu Islands to correlate the in situ measurements with the corresponding MSI satellite images. The matching process was conducted within 3-hour (four sets) and 6-hour (eight sets) time window. All times used in this paper are given in Coordinated Universal Time. These stations are located at depths ranging from 2.6 to 14.4 meters (Table 2). In addition, the depths of 32 stations around Yongxing Island (see Figure 1) with depths less than 25 meters were measured to assess the performance of the AC process for the other four images (Table 1).
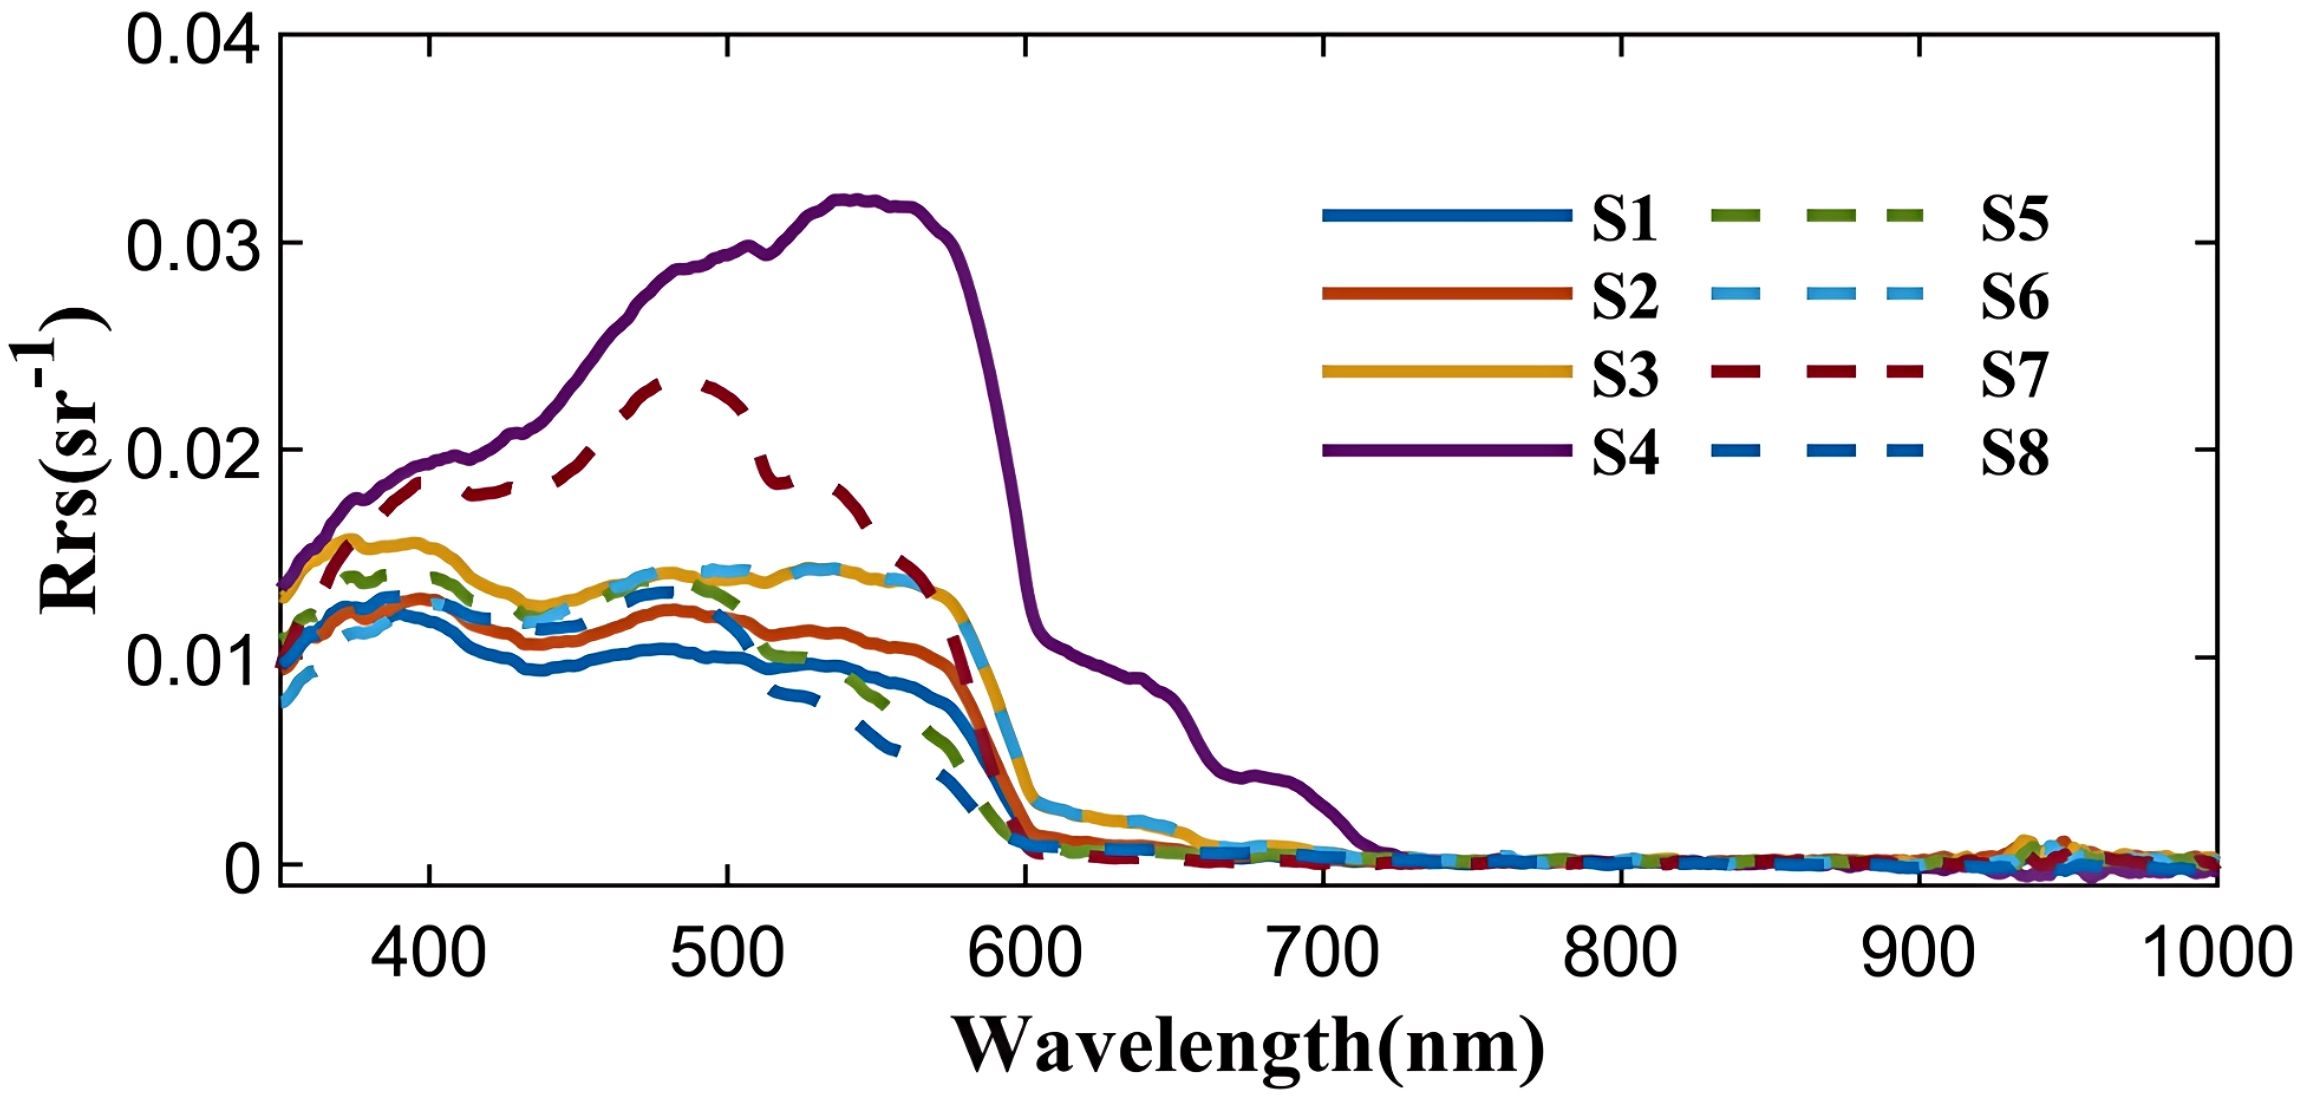
Figure 2. In-situ spectral reflectance measurements from sites S1-S8 (locations shown in Figure 1 and characteristics detailed in Table 1).
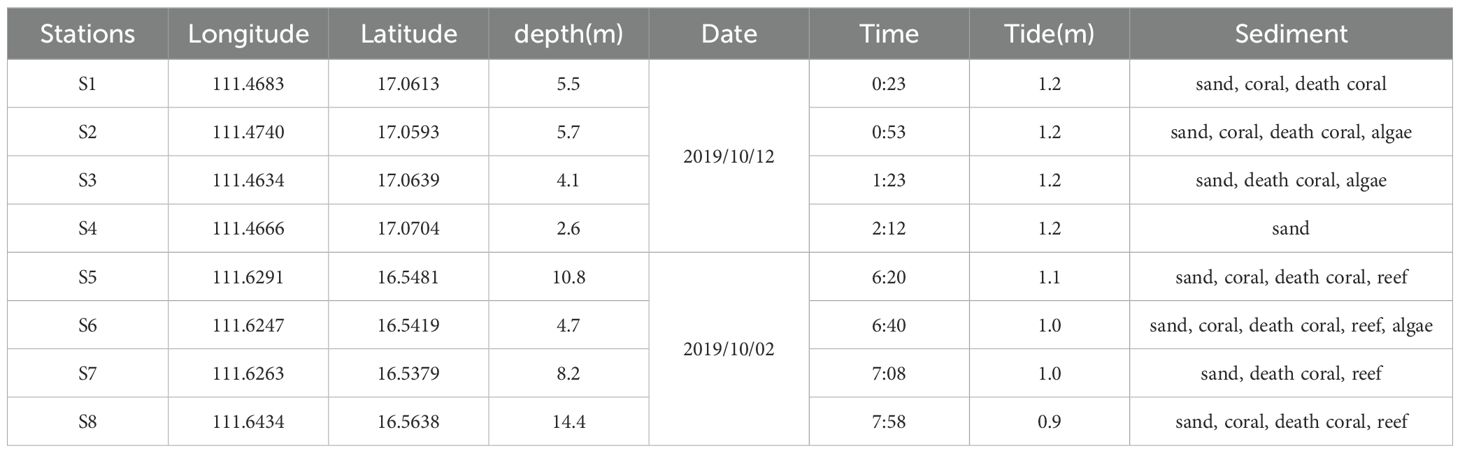
Table 2. Field measurement site information matched to the corresponding MSI image.
In situ Rrs was measured using an ASD FieldSpec 3 Spectroradiometer, following the NASA ocean optics above water measurement protocol (Mueller et al., 2003). The Spectroradiometer has a spectral range from the visible to SWIR band (350 - 2500 nm), with a spectral resolution of 3 nm for 350 -1000 nm. Bathymetry was measured using the shipboard COSCO HD-360 portable sounder, which is capable of measuring bathymetry in a range of 0.3 to 120 meters with an accuracy of 1cm ± 0.1% of depth. In areas where the ship could not access (i.g., near-shore tidal flats), bathymetry was determined using a heavy hammer and a ruler for direct measurement. The measured water depth represents the instantaneous depth from the sea bed to the water surface. Local theoretical datum was used as a reference for tidal correction.
2.3 Methods
2.3.1 Atmospheric correction methods
The DSF algorithm uses multiple dark targets to construct a “dark spectrum” that estimates the atmospheric path reflectance based on a best-fit aerosol model. By selecting the band with the lowest atmospheric path reflectance, the algorithm avoids the influence of pixels and bands with strong sunglint. However, the glint signal is still present in the acquired surface reflectance results (Vanhellemont and Ruddick, 2018; Vanhellemont, 2019). The DSF algorithm is integrated into the ACOLITE software (https://odnature.naturalsciences.be/remsem/software-and-data/acolite). In this study, we used ACOLITE 20210802.0 with all settings as default. Fixed DSF was used, with aerosol model set to ACOLITE-LUT-202102-MOD2, and wavelength for DSF correction set to 400-900 nm. Additional ancillary data were retrieved from the NASA EarthData website.
To correct residual sunglint after the DSF algorithm, ACOLITE software provides an additional GC algorithm, which selects the SWIR band with the lowest value for the correction to prevent negative reflectance in the other SWIR bands (Vanhellemont, 2019). Consequently, the glint derived from these pseudo-dark pixels tends to be underestimated. To remove the residual glint effects in the DSF algorithm more accurately, two additional glint correction methods are introduced in this paper. The first method is the Sen2Coral package in SNAP software, which utilizes the reference band regression algorithm (DeGlint, DG) to remove the glint effects (Hedley et al., 2005; Harmel et al., 2018):
where Rt (λ) is the uncorrected remote sensing reflectance, Rt (λNIR) is the reflectance in the reference NIR band, and α and β are two parameters derived from optically deep water in sunglint area. To implement DG method, the deep-water glint region is first extracted as a sample region, and for all band Rt (λ), the minimum value of Rt (λNIR) in the sample region is taken as β. The slope of the linear regression of Rt (λ) on Rt (λNIR) in the sample region is taken as α (Hedley et al., 2005). This algorithm reduces the sunglint impact of the target band based on the glint distribution of the reference band and the chosen area.
The other glint removal method used in this study is a simplified version of the DG method (DG865), which uses the 865 nm band as the reference band and makes α = 1 and β = 0 in Equation 1:
Though bottom reflectance exists in shallow water due to bottom reflection, it is reasonable to assume zero or negligible Rrs in the NIR band due to high water absorption (Morel and Maritorena, 2001; Lee et al., 2007), especially in the relatively clear water of coral reef regions. As evidenced by the in situ measured Rrs, only station S4 (water depth of 2.7m, sand substrate) exhibited reflectance greater than zero from 700 to 720 nm in the NIR. All sampling locations showed zero reflectance at wavelengths beyond 720 nm. Therefore, the zero-reflectance assumption for the 865-nm band hold true for most cases here. The DG865 algorithm classifies pseudo-off-water signals in real scenes as the glint term, thus avoiding the underestimation of the glint. It also reduces uncertainties and the extra steps associated with manual selecting glint sample areas and making it insensitive to outlier pixels, improving its routine application in image analysis.
The C2RCC algorithm is an artificial neural network approach that uses multi-sensor, single-pixel training and relies on a large database of simulated water-leaving reflectance, and corresponding top-of-atmosphere radiances. The C2RCC thus currently accounts for three processors (i.e., C2-Nets: C2RCC, C2X, and C2X-COMPLEX) using different training datasets within a neural network approach. The most recent update (available since February 2021) includes a new processor trained for atmospheric correction in complex waters (Doerffer and Schiller, 2007). Neural networks are trained to perform the inversion of spectrum for AC, as well as the retrieval of inherent optical properties of the water body (Doerffer and Schiller, 2007; Brockmann et al., 2016). This algorithm has been integrated into the Sentinel Application Platform (SNAP) software, an open-source toolkit for the European Space Agency's earth observation mission. In this study, we used SNAP v8 with all settings as default (see Table 3).
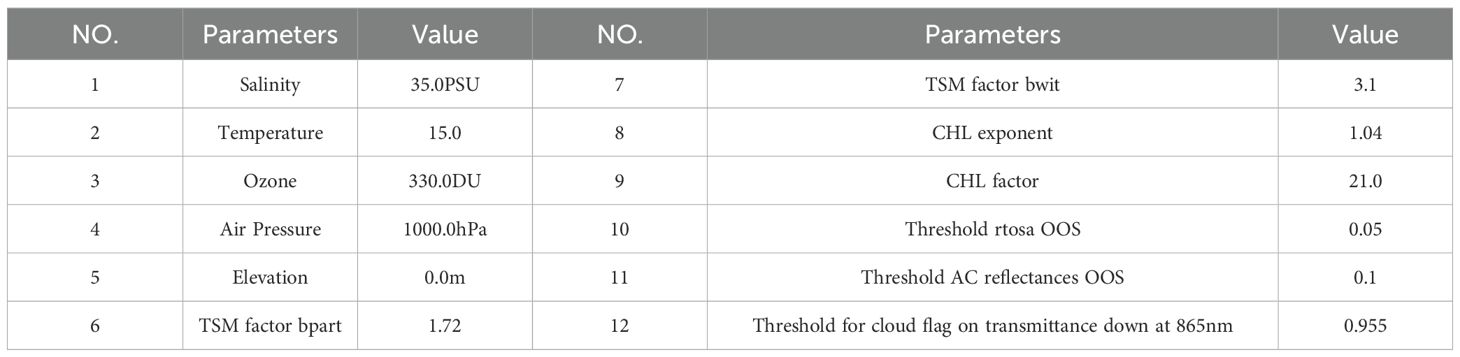
Table 3. Information von C2RCC Parameters settings.
Steinmetz et al. (2011) developed the Polymer algorithm, which uses a polynomial fitting approach to correct for the effects of sunglint residuals, aerosols, and their combined impact on the received satellite signal. By optimizing the parameters of the optical radiation models for the atmosphere and water column, the algorithm obtains optimally fitted spectra and calculates Rrs over the sea surface. The algorithm effectively eliminates the influence of glint on the satellite received signal, thereby improving the quality and spatial coverage of the AC product data. A detailed description of the algorithm can be found at https://www.hygeos.com/Polymer. In this study, we used Polymer v4.14 with all settings set to default (Steinmetz and Ramon, 2018). Ancillary data, such as the ozone concentration, wind speed, and atmospheric pressure at sea level, were obtained from European Centre for Medium-Range Weather Forecasts data (Steinmetz et al., 2011).
2.3.2 Evaluation methods
Considering the wide applicability of the algorithms, the initial default settings were used for all three AC methods. After retrieving the MSI Rrs using AC methods, the evaluation proceeded according to the following three main procedures: a) consistency analysis of MSI Rrs in the 443nm-783nm band for satellite and in situ measurement pairs; b) analysis of residual glint in the near-infrared band; c) evaluation of water depths and coral reef substrates using the SAMBUCA model with Rrs inputs from satellite data. A detailed flowchart illustrating these procedures is provided in Figure 3.
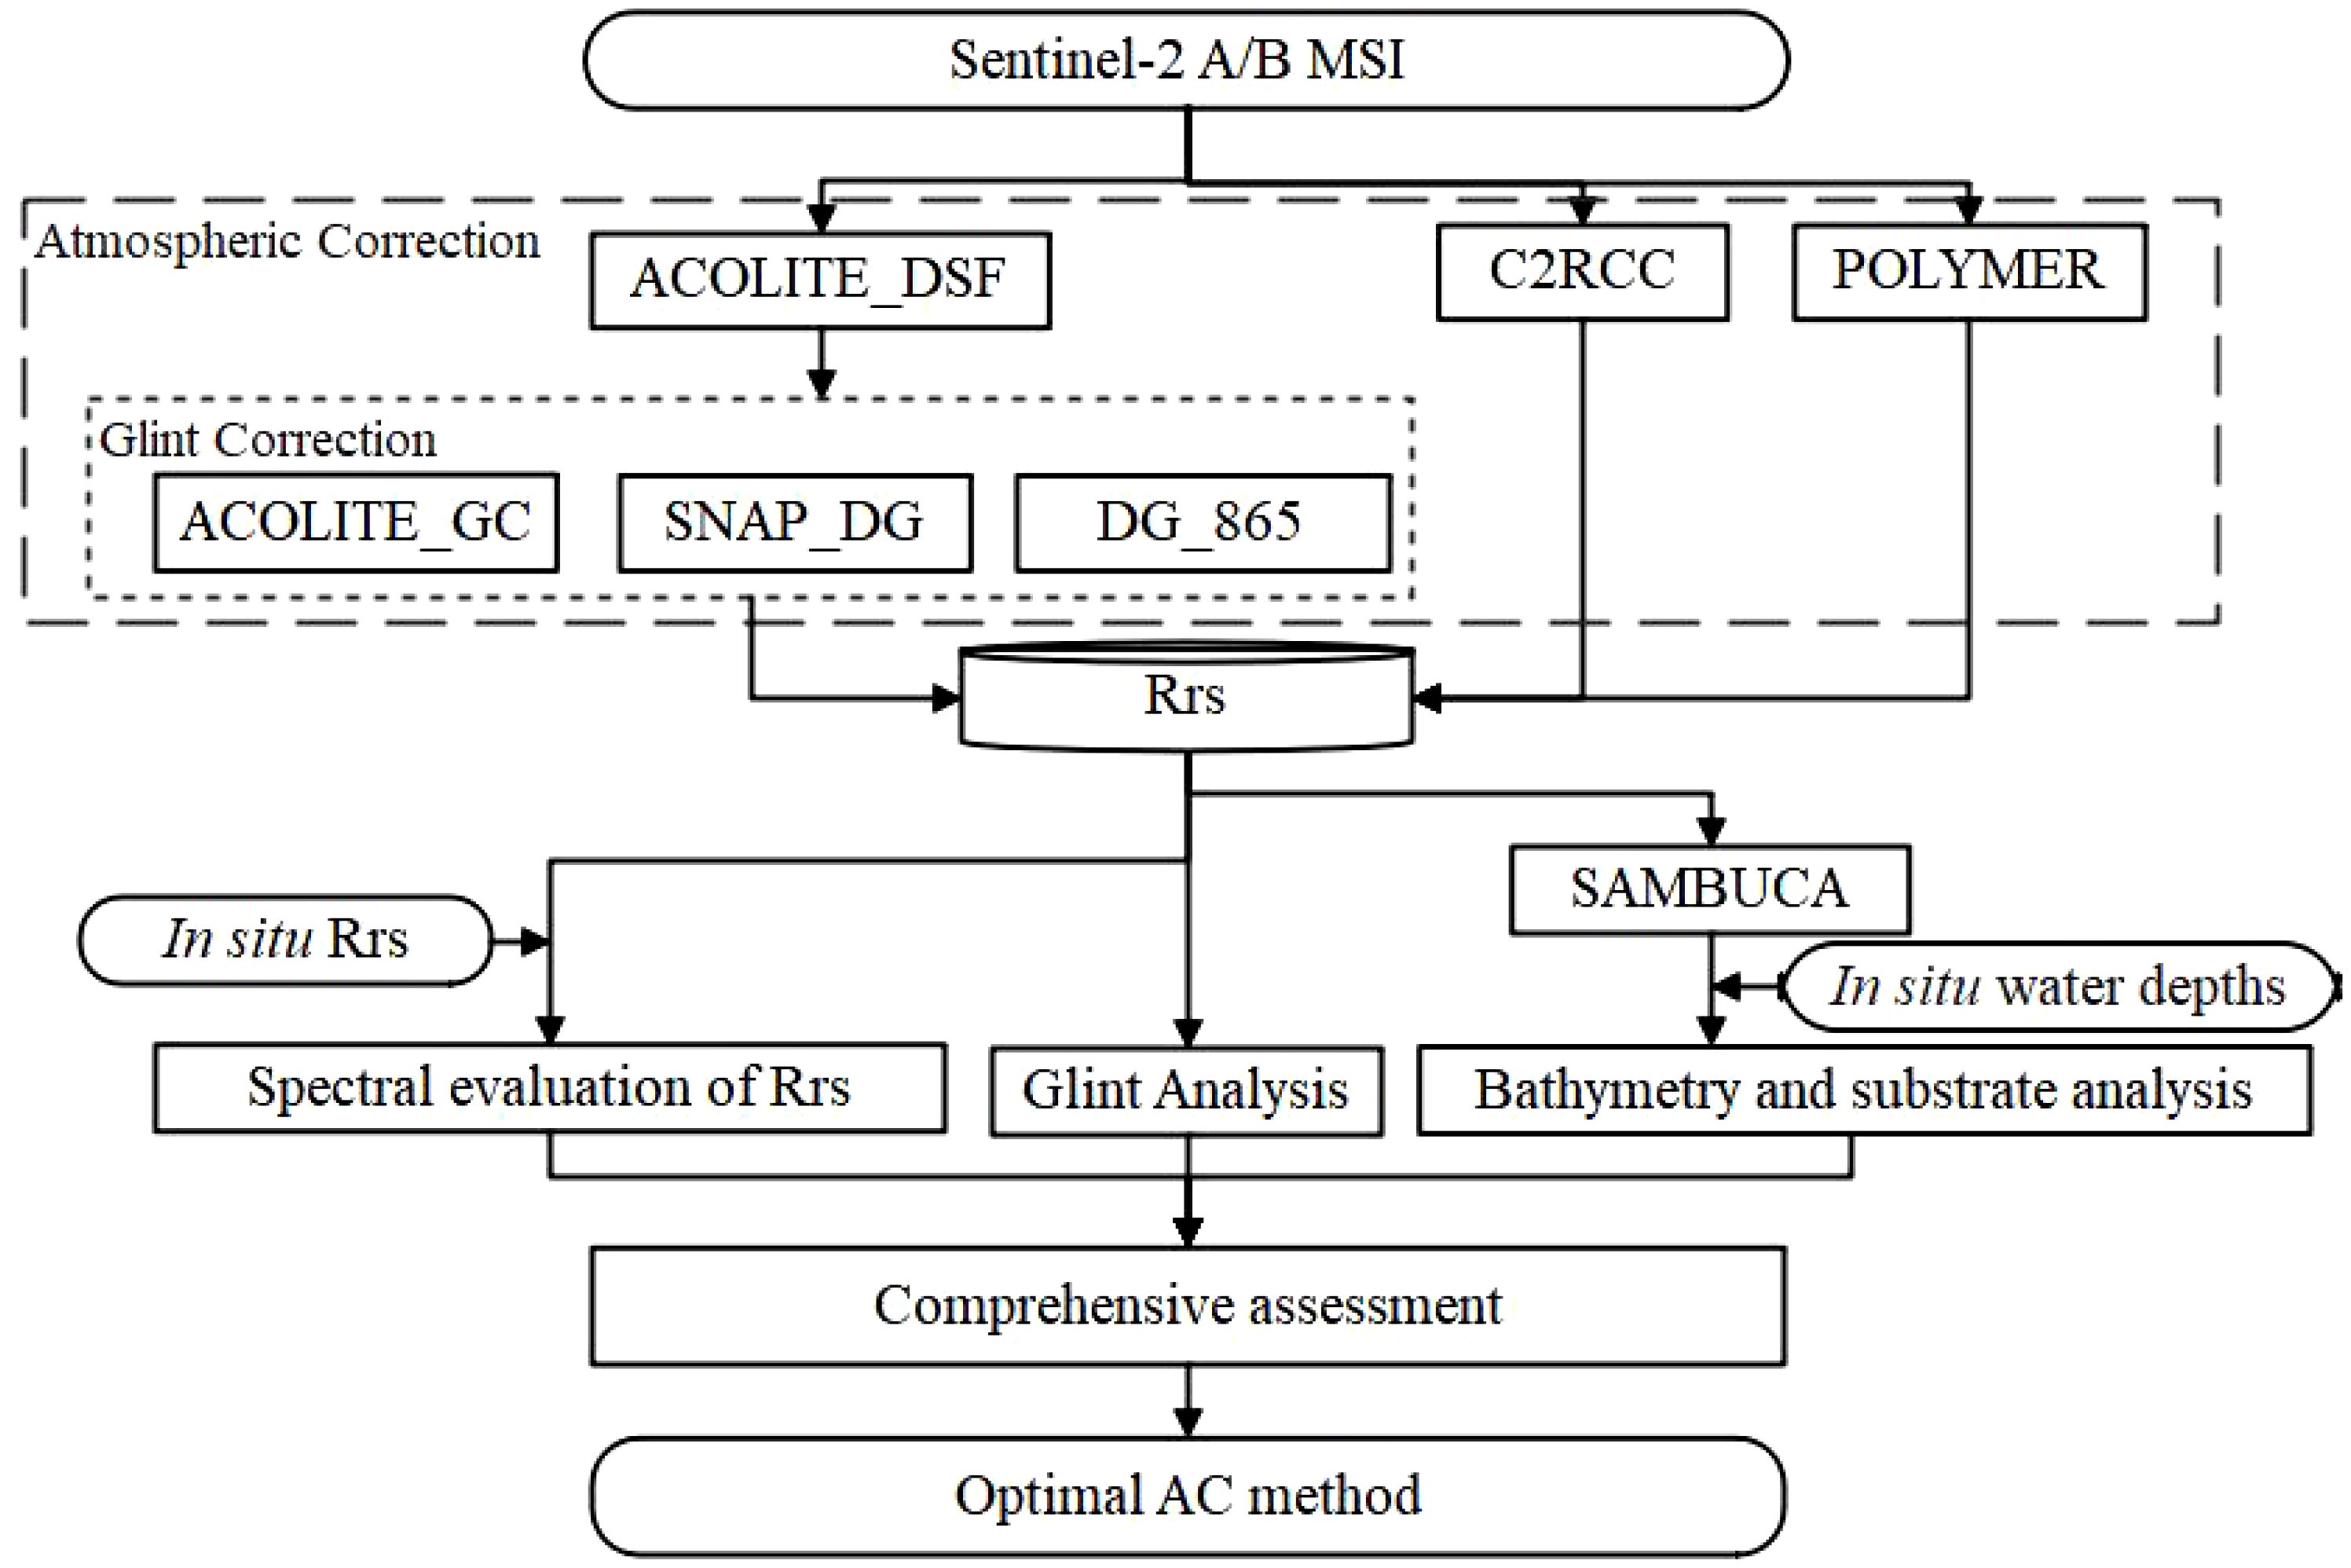
Figure 3. Flow Chart.
2.3.2.1 Spectral evaluation of Rrs
In situ Rrs measurements were resampled to MSI spectral bands using the spectral response function of MSI, with the following equations:
where, Rrs*(λi) is the resampled Rrs in band centered at λi, Rrs(λ) is the in situ measured hyperspectral data, and SRF is the spectral response function of the MSI.
Rrs from satellite data were extracted for a 3 × 3 pixel (equivalent to 30 × 30 m) window centered on the in situ measurement location, and the mean value was calculated. The agreement between satellite and in situ Rrs was evaluated by using relative Root Mean Square Deviation (RMSD), Deviation from the Mean (bias, δ), and unbiased Root Mean Square (uRMS) (Zhang et al., 2018), with the following equation:
where Rrs and Rrs* refer to the values of satellite and in situ measured Rrs in the specified bands, respectively, and N is the number of matched pairs.
2.3.2.2 Glint assessment in the near-infrared band
In shallow coral reef waters, Rrs in the near-infrared band may exhibit a non-zero off-water signal despite strong absorption in this band. This phenomenon can be attributed to clearer water and bottom reflections in optically shallow environments, where clearer water allows a relatively high amount of near-infrared radiation to penetrate the water column and reach the seafloor, resulting in a noticeable Rrs signal. However, separating the contribution of bottom reflections from surface glint in optically shallow waters is challenging. Differences in solar altitude due to time differences between in situ spectra and satellite-matched spectra, variations in spectral acquisition angles, and geographic alignment issues further complicate the applicability of assessment methods based on spectral comparisons. It is generally accepted that Rrs in the near-infrared band is close to zero in optically deep waters, and Rrs at 865 nm is often used as the reference band for glint removal and evaluation (Lin et al., 2023). However, in this paper, since Rrs of 865 nm is used in sunglint removal, while the Rrs of the 783 and 740 nm band were used to evaluate the effectiveness of each AC method on surface sunlight scintillation in optically deep waters.
2.3.2.3 SAMBUCA model
The SAMBUCA model incorporated in the SNAP software is used to invert bathymetry and substrate types from input Rrs to evaluate the performance of different AC methods in the Xisha Reef area. SAMBUCA is an optimization-driven analytical model based on the radiative transfer model, which utilizes spectral matching to estimate the concentration of water column components, bathymetry, and substrate types (Dekker et al., 2011). In the SAMBUCA model, the bottom reflectance term, ρ, is parameterized by the linear combination of three bottom reflectance spectra that represent three key benthic cover classes. The bottom reflectance parameterization is thus expressed as:
where ρ1, ρ2, and ρ3 represent the spectral reflectance of the three substrate types—sand, coral, and seagrass, respectively, within a pixel, and q1, q2, and q3 are the corresponding ratios of substrate spectral reflectance within the pixel, with the constraint that q1+q2+ q3 = 1.
As Rrs is influenced by the combination of chlorophyll concentration (CCHL), concentration of Colored Dissolved Organic Matter (CCDOM), concentration of non-algal particulate matter in the water column (CTR), substrate spectral reflectance (ρ), and bathymetry (H), it can be expressed as a function of these terms:
The SAMBUCA model determines the optimal solution of the above term set by minimizing the sum of the squared residuals (resnorm) between the atmospheric corrected Rrs and model-simulated Rrs (Rrs’ Equation 8). Details of the input settings for the SAMBUCA model are listed in Table 4 (Wettle et al., 2006).
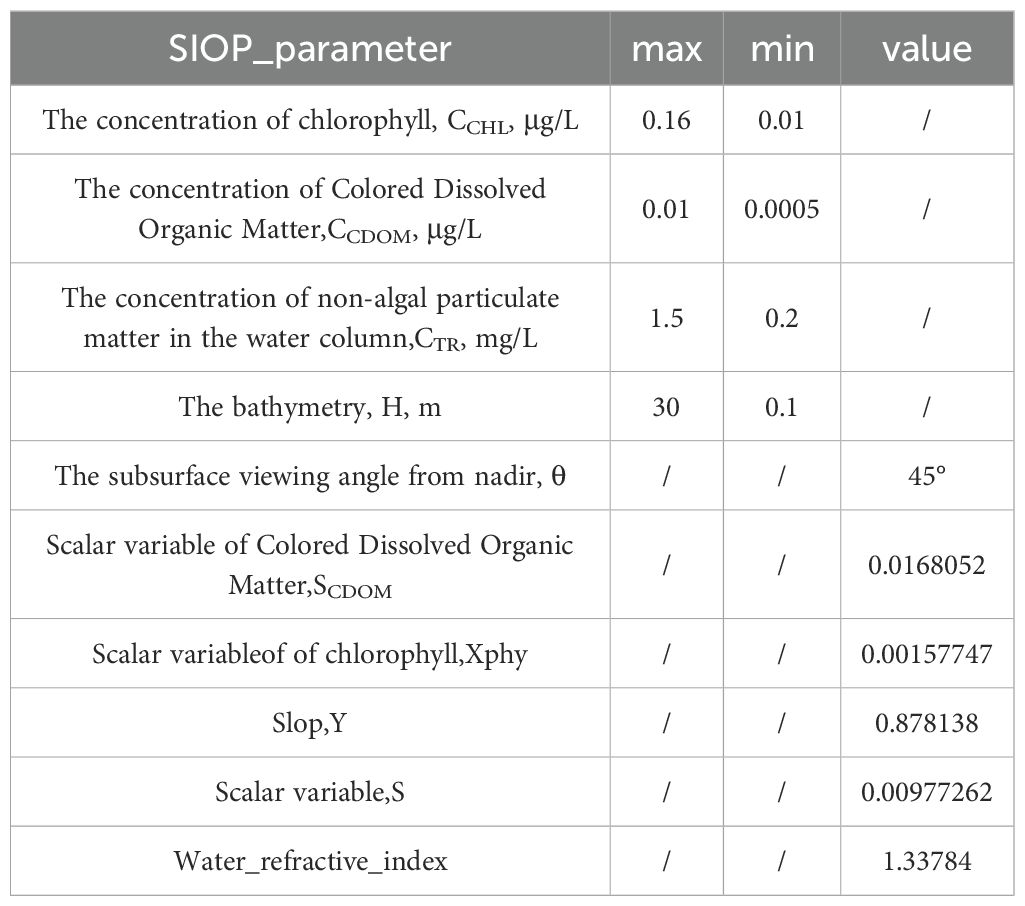
Table 4. SAMBUCA model's SNAP software implementation parameter settings.
As the model output provides the instantaneous bathymetry, tidal correction is performed using the local theoretical base level (Liu et al., 2019):
where H(t) is SDB, H is tide-corrected H(t), and ΔH(t) is the tidal height at the imagery acquisition time t. Tide data were obtained from the National Marine Data and Information Service, China.
In this study, the statistical parameters used to evaluate the inversion bathymetry include the coefficient of determination (R2), slope, intercept, and Mean Absolute Percentage Difference (MAPD), which is calculated as:
where, H and HIn_situ represent the modeled inversion and in situ measured bathymetry, respectively, and n is the number of samples.
3 Result
3.1 Spectral evaluation of the Rrs
Figure 4 illustrates the derived Rrs from MSI after AC and sunglint correction in the bands centered at 443, 492, 560, 665, 704, 740, and 783 nm around Beijiao Island, Coral Island, and Quanfu Island. Overall, the shapes of the MSI-derived Rrs closely resemble the in situ Rrs, although discrepancies are observed in the magnitudes of reflectance. The DSF-derived Rrs are consistently overestimated, and the DG865 method mitigated this overestimation more effectively than the DG and GC methods. For C2RCC, both overestimation and underestimation are observed, with the spectral waveforms showing relatively greater distortion. The Polymer method shows good agreement with in situ Rrs, at most sites (6 out of 8). Specifically, the Rrs obtained using the DSF-DG865 method show the greatest similarity to the in situ Rrs in both magnitude and shape for the 3-hour and 6-hour match windows (Figure 4A) when comparing DSF to DSF supplemented by additional sunglint correction algorithms. When comparing DSF-DG865, Polymer and C2RCC with in situ measurements, the Rrs obtained by DSF-DG865 and Polymer are generally similar to the in situ in both magnitude and shape. Although some of the Rrs derived using C2RCC are close to the in situ Rrs in terms of spectral reflectance values, they exhibit distinct spectral shapes compared to in situ Rrs (Figure 4B).

Figure 4. (A) Rrs derived from in-situ and MSI data using DSF AC and DSF combined with GC, DG, DG865 glint corrections. (B) Rrs derived from in-situ and MSI data using DSF-DG865, Polymer and C2RCC AC algorithms. “In-situ” and MSI data were matched within a 3/6 hour window.
As shown in Figure 5A, all methods (DSF and DSF combined with the three glint correction algorithms) achieved high R2 value (all above 0.95) in the bands centered at 443nm to 655nm within the 3-hour match. However, in the 6-hour match, the DSF-GC method showed the lowest performance, with R2< 0.4 in the bands centered at 665nm to 783nm. Based on the assessments of R2, Bias, RMSD, and uRMS, the DSF-DG865 method clearly outperforms both the DSF-GC and DSF-DG methods. As shown in Figure 5B, Polymer method demonstrates the best performance, achieving high R2 value (all above 0.95) in the bands centered at 443nm to 655nm within the 3-hour match. In the 6-hour match, Polymer continues to excel, achieving high R2 value (all above 0.65) in the bands centered at 443nm to 655nm. Notably, R2 values range from 0.73 to 0.85 in the bands centered at 443nm to 560nm, outperforming C2RCC (R2 values: 0.41-0.71) and DSF-DG865 (R2 values: 0.31-0.74). Additionally, Polymer exhibits the most favorable metrics in Bias, RMSD, and uRMS, all of which are the smallest among the methods considered. As can be seen, the Polymer method performs well across all metrics and demonstrates superior consistency in the 6-hour match, achieving the highest R2 values and smallest deviations in key metrics. Overall, the Polymer method demonstrates superior performance in Rrs derivation, showing the best agreement with in situ measurements compared to the other AC methods evaluated in this study.
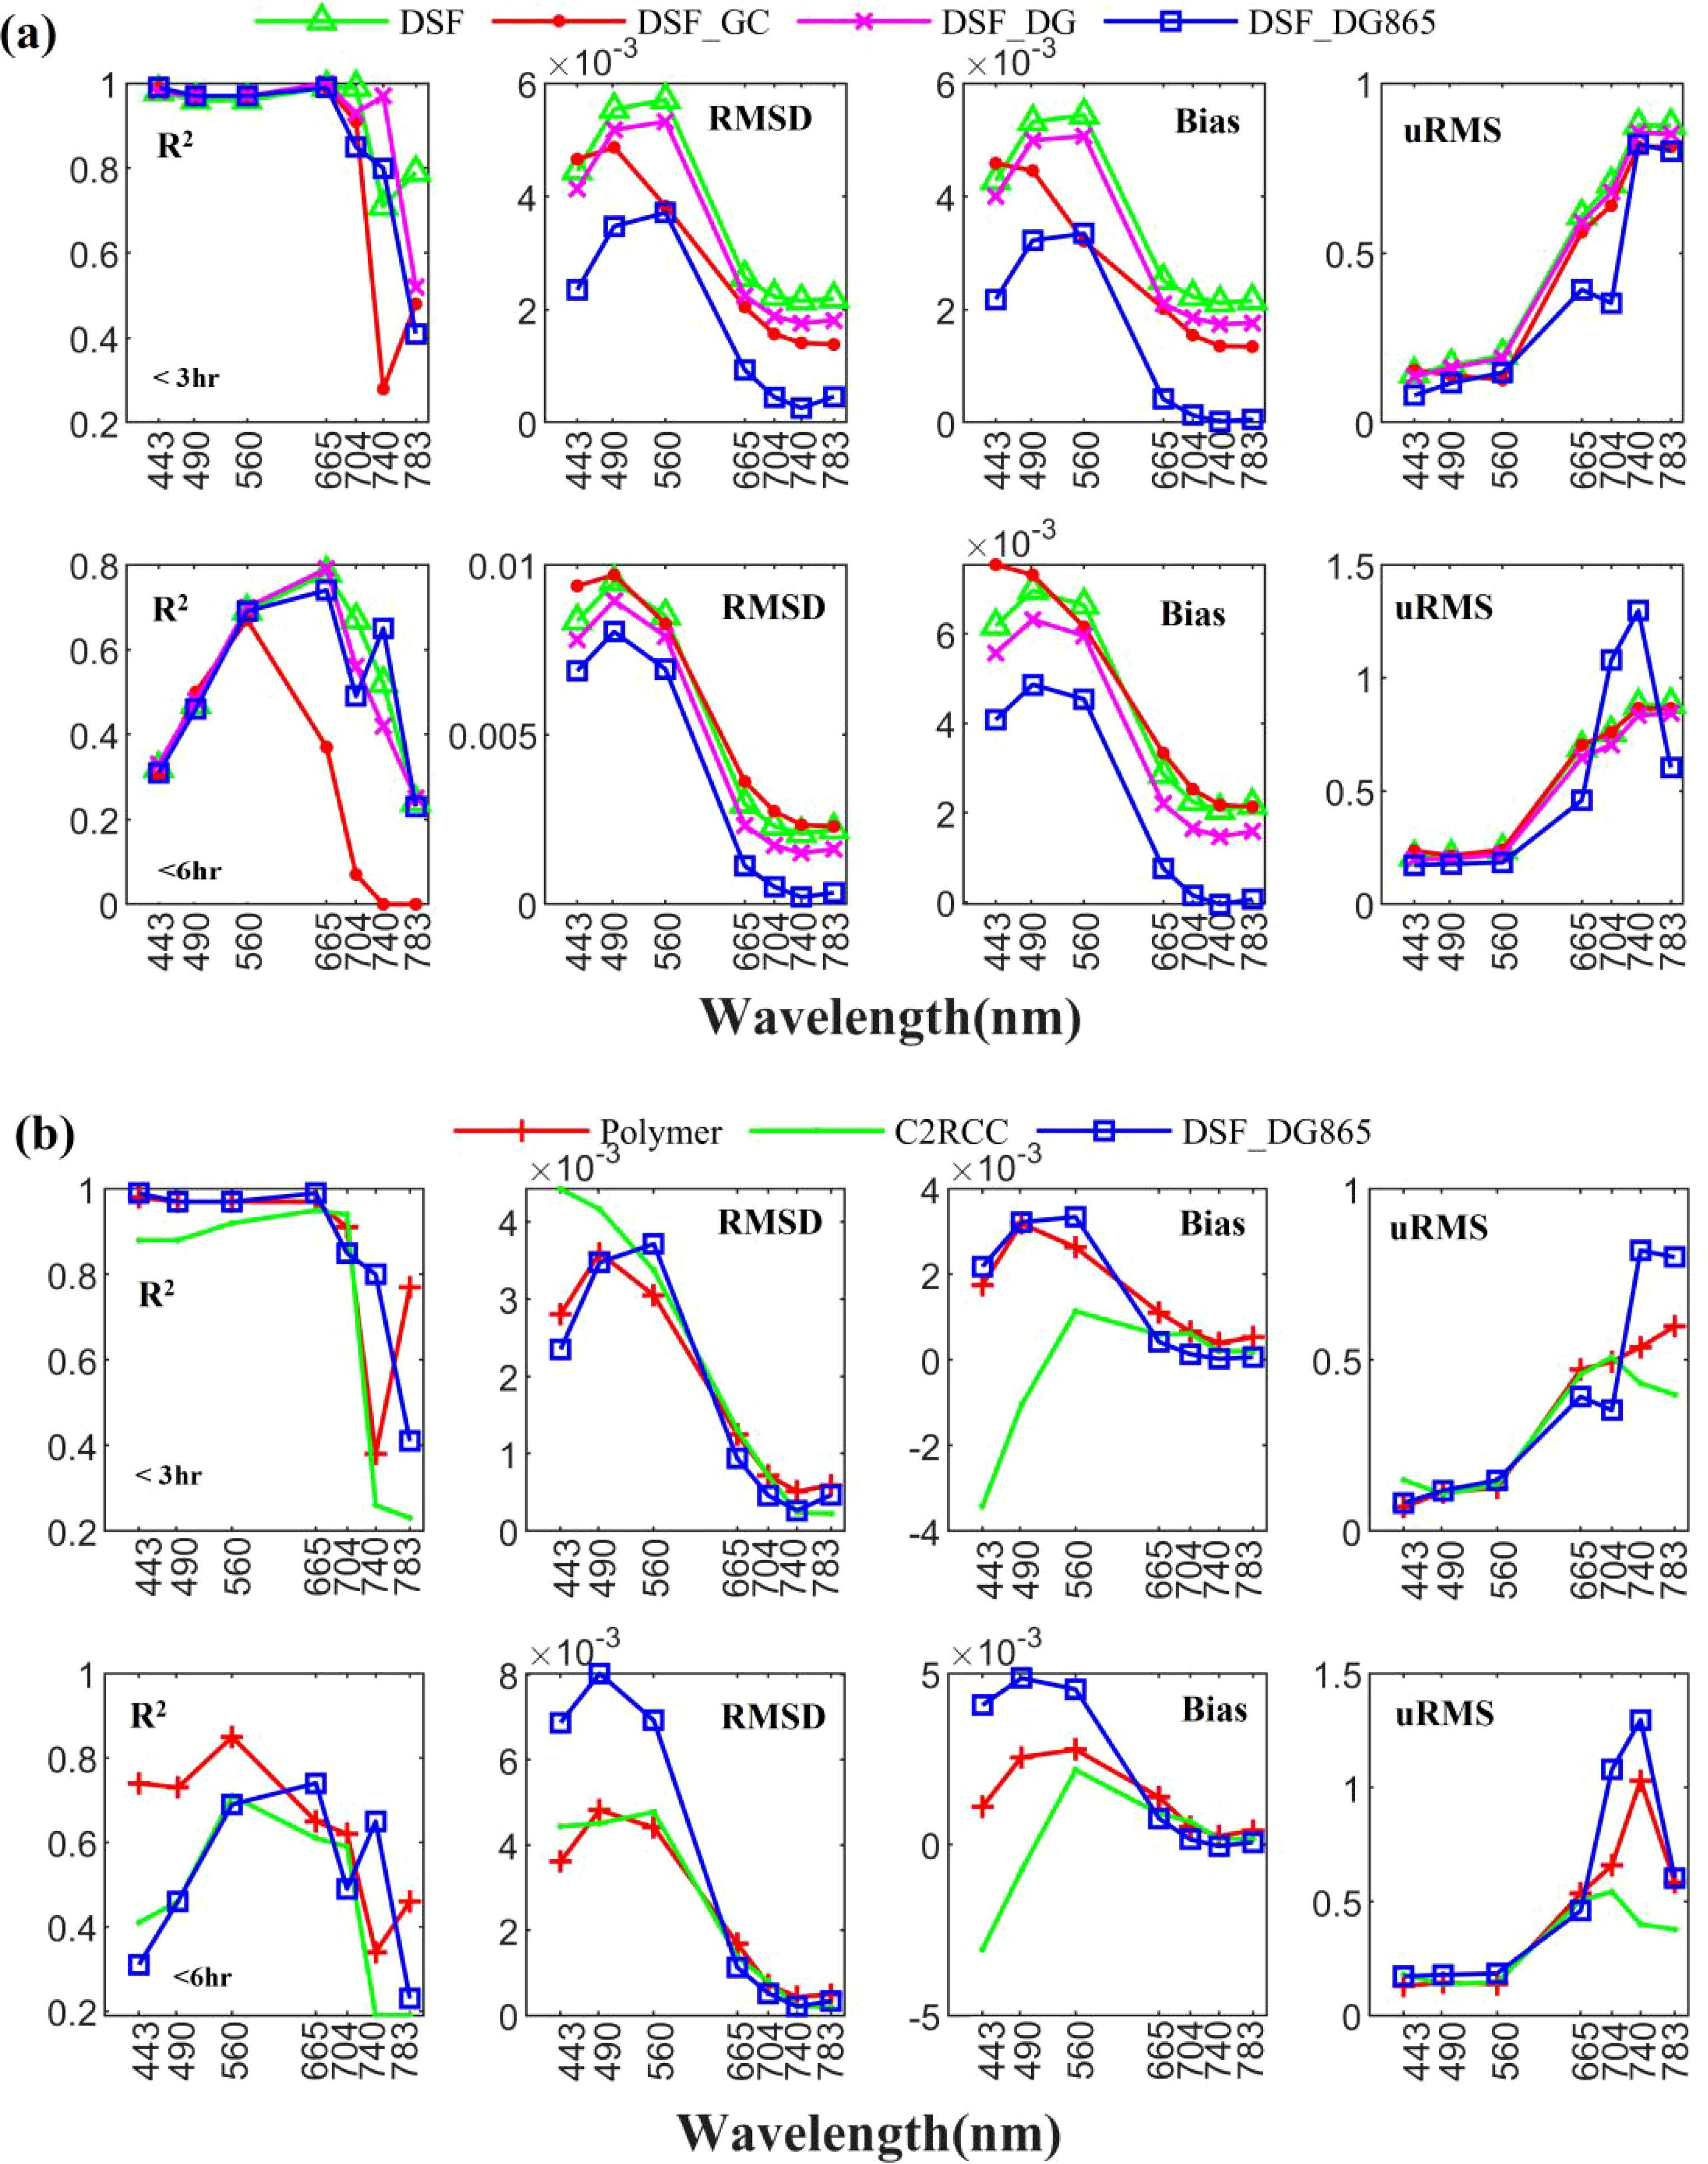
Figure 5. Evaluation metrics (R2, RMSD, Bias, uRMS) between Rrs derived from in-situ and AC algorithms from (A) DSF, and DSF combined with GC, DG, DG865 glint corrections, and (B) DSF-DG865, C2RCC and Polymer. “In-situ” and MSI data were matched within a 3/6 hour window.
3.2 Residual glint evaluation
The residual glint corrections from the various AC methods were evaluated using the NIR bands centered at 740 and 783nm (see Figures 6, 7). The derived Rrs from both bands consistently highlight the differences among the AC methods. Without glint correction, the DSF method produced relatively high values across the image. The three glint correction methods (GC, DG, and DG865) improved the results by reducing outliers and aligning specific regions closer to zero. Among these, the GC method was the least effective at minimizing deviations. In contrast, the DG865 method showed superior performance, yielding Rrs values closest to zero and maintaining consistency across different time periods. Polymer and C2RCC demonstrated effective corrections, yielding reflectance values above zero in shallower waters due to bottom reflections and values closer to zero in deeper waters. These results remained stable across two time periods (20181017 and 20190105). Notably, the Rrs distribution derived from Polymer and C2RCC reveal clearer bottom topography feature compared to all DSF methods. This suggests that Polymer and C2RCC excel at removing the glint effect while preserving the bottom reflection contribution. However, negative Rrs values in Polymer results (see Figures 6, 7) indicates some limitations. C2RCC exhibited optimal performance in NIR bands (740 nm and 783 nm) based on uRMS values (Figure 5), demonstrating effective sunglint removal (Figures 6, 7). However, its superior performance was confined to the NIR region, as its accuracy in visible bands was comparable to or lower than Polymer’s (Figure 5B). Additionally, C2RCC showed limited consistency with in situ measurements, yielding R² values below 0.3 for 3-hour matches and below 0.2 for 6-hour matches. In contrast, Polymer achieved significantly higher R² values (0.3-0.77), particularly in visible wavelengths. Since bathymetry and substrate mapping in shallow water coral reefs primarily rely on visible wavelength bands, Polymer emerges as the superior choice for these applications.
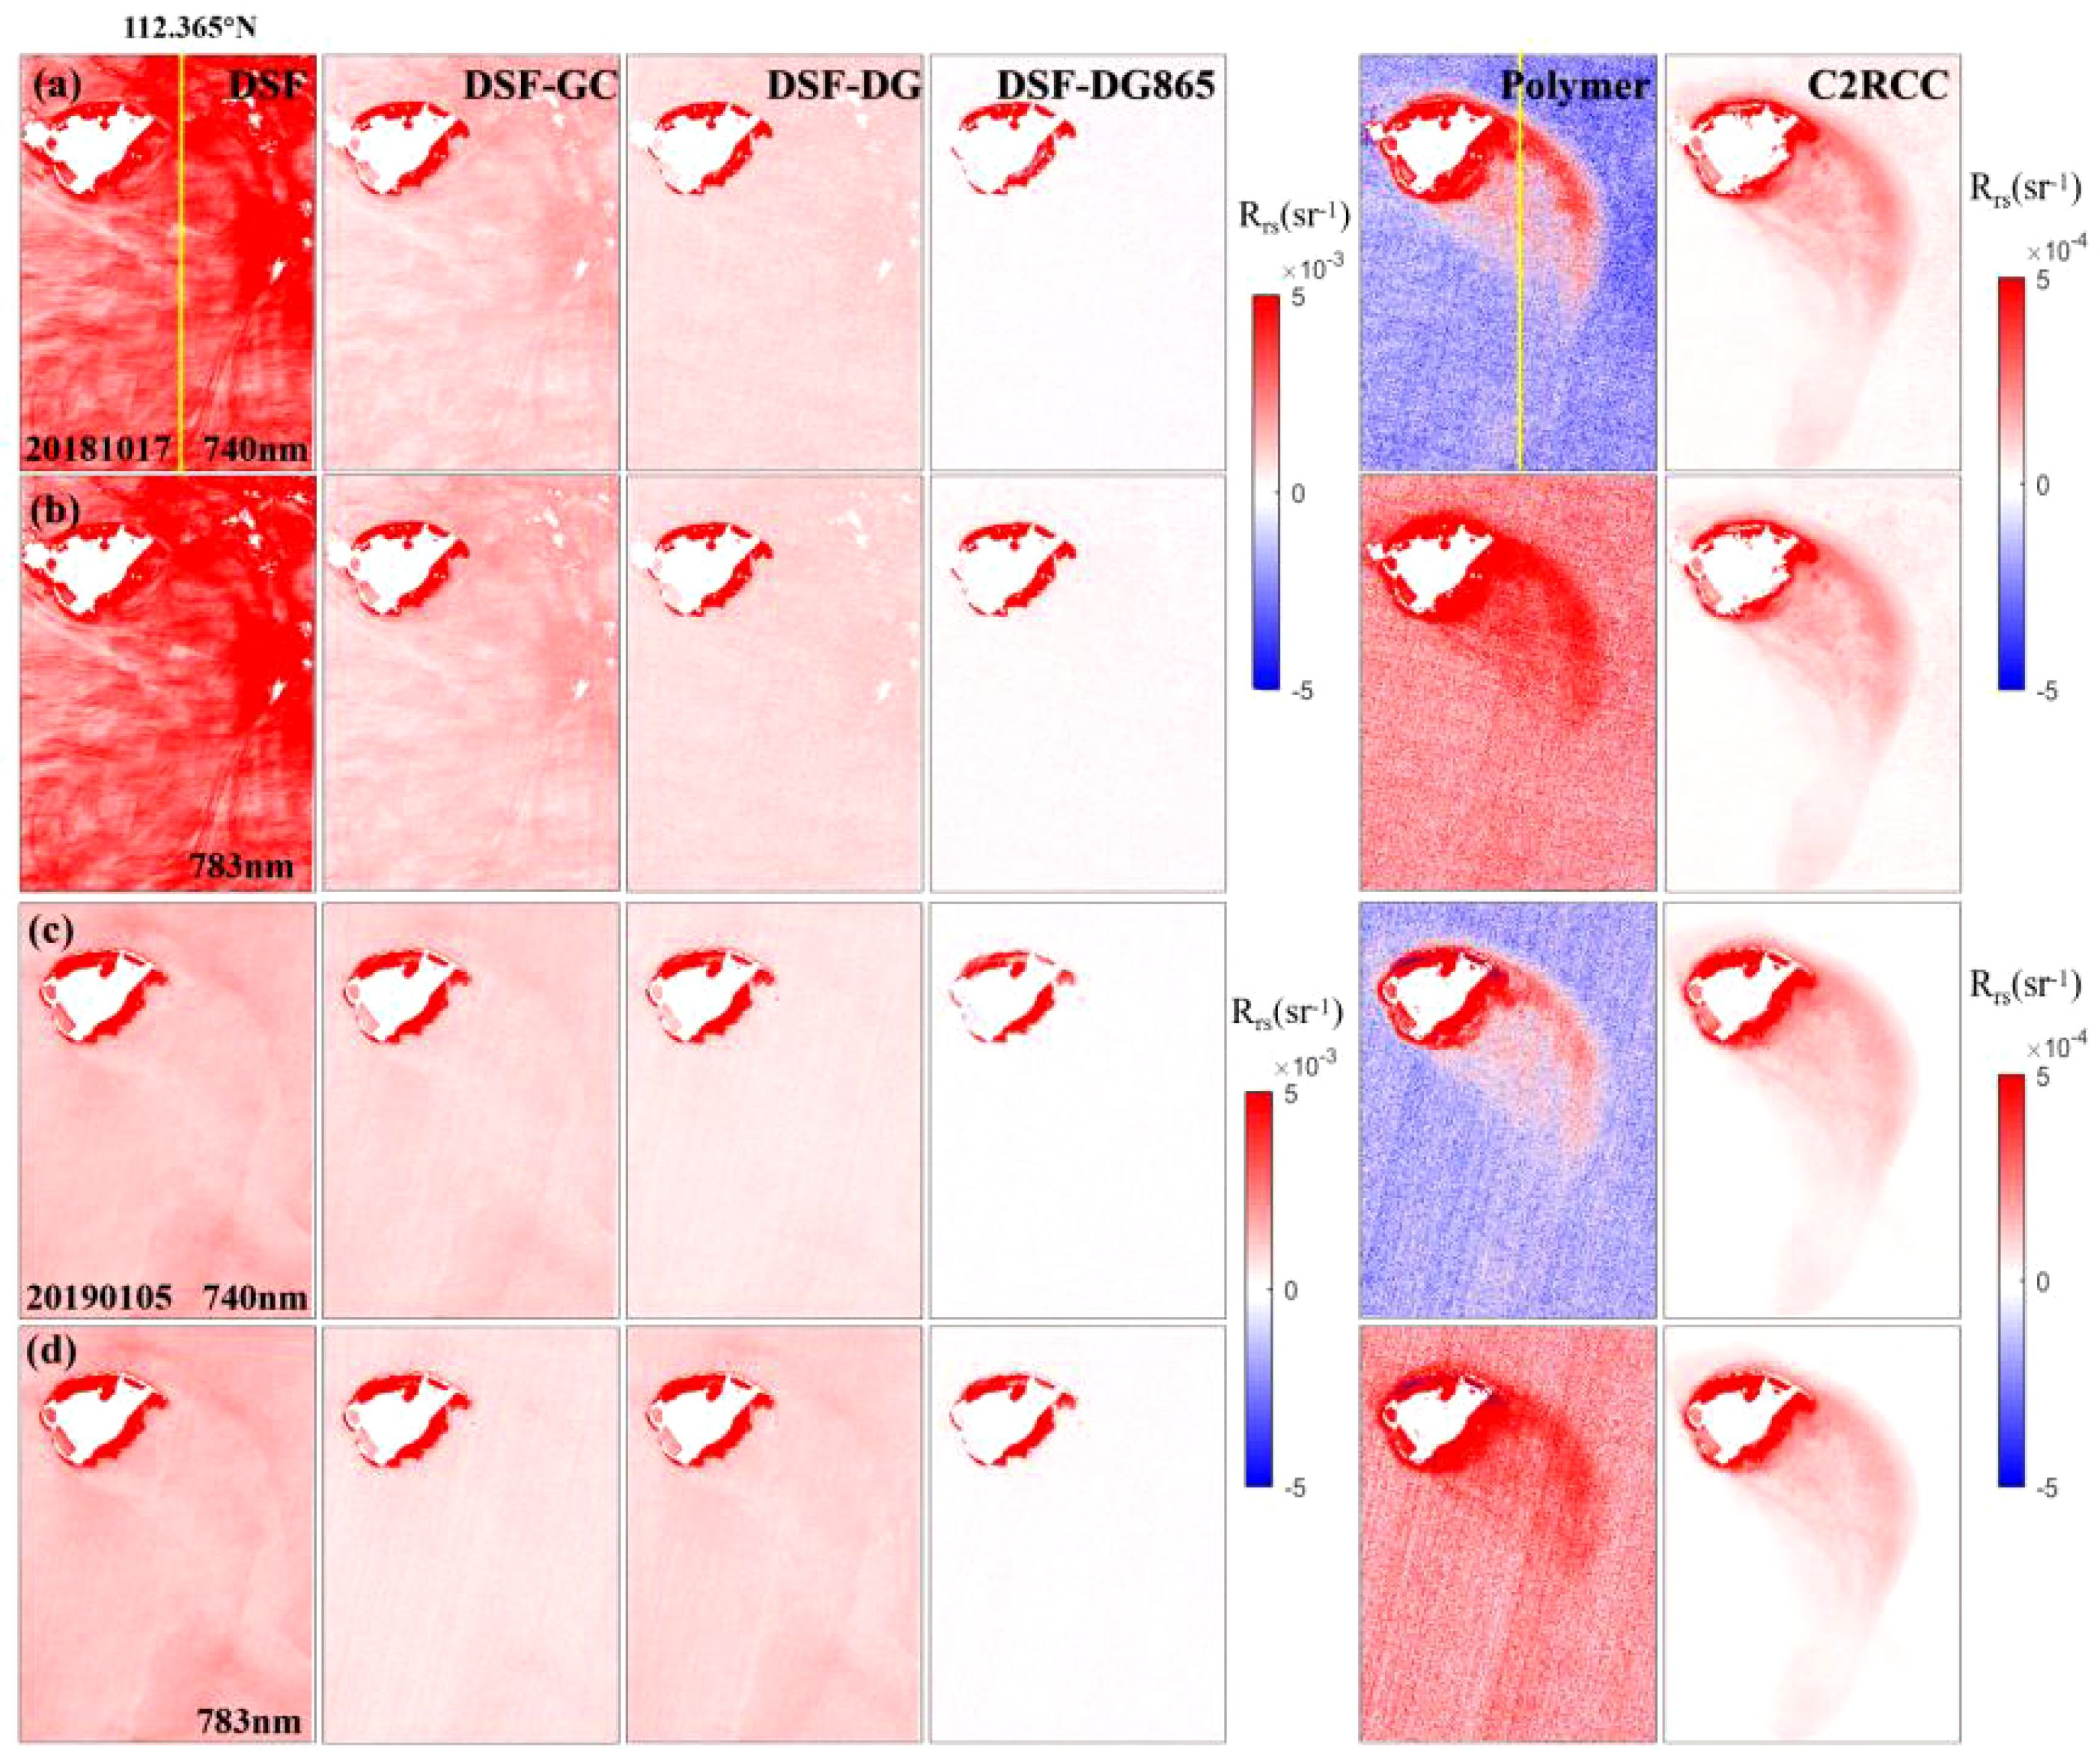
Figure 6. (A–D) Rrs_740nm, Rrs_783nm map of the MSI image (20181017,20190105) derived from the AC algorithm of DSF, Polymer, C2RCC and DSF combined with GC, DG, DG865 glint corrections. The Rrs_740nm, Rrs_783nm (20181017) on the yellow line at 112.365°E were showed in Figure 7.
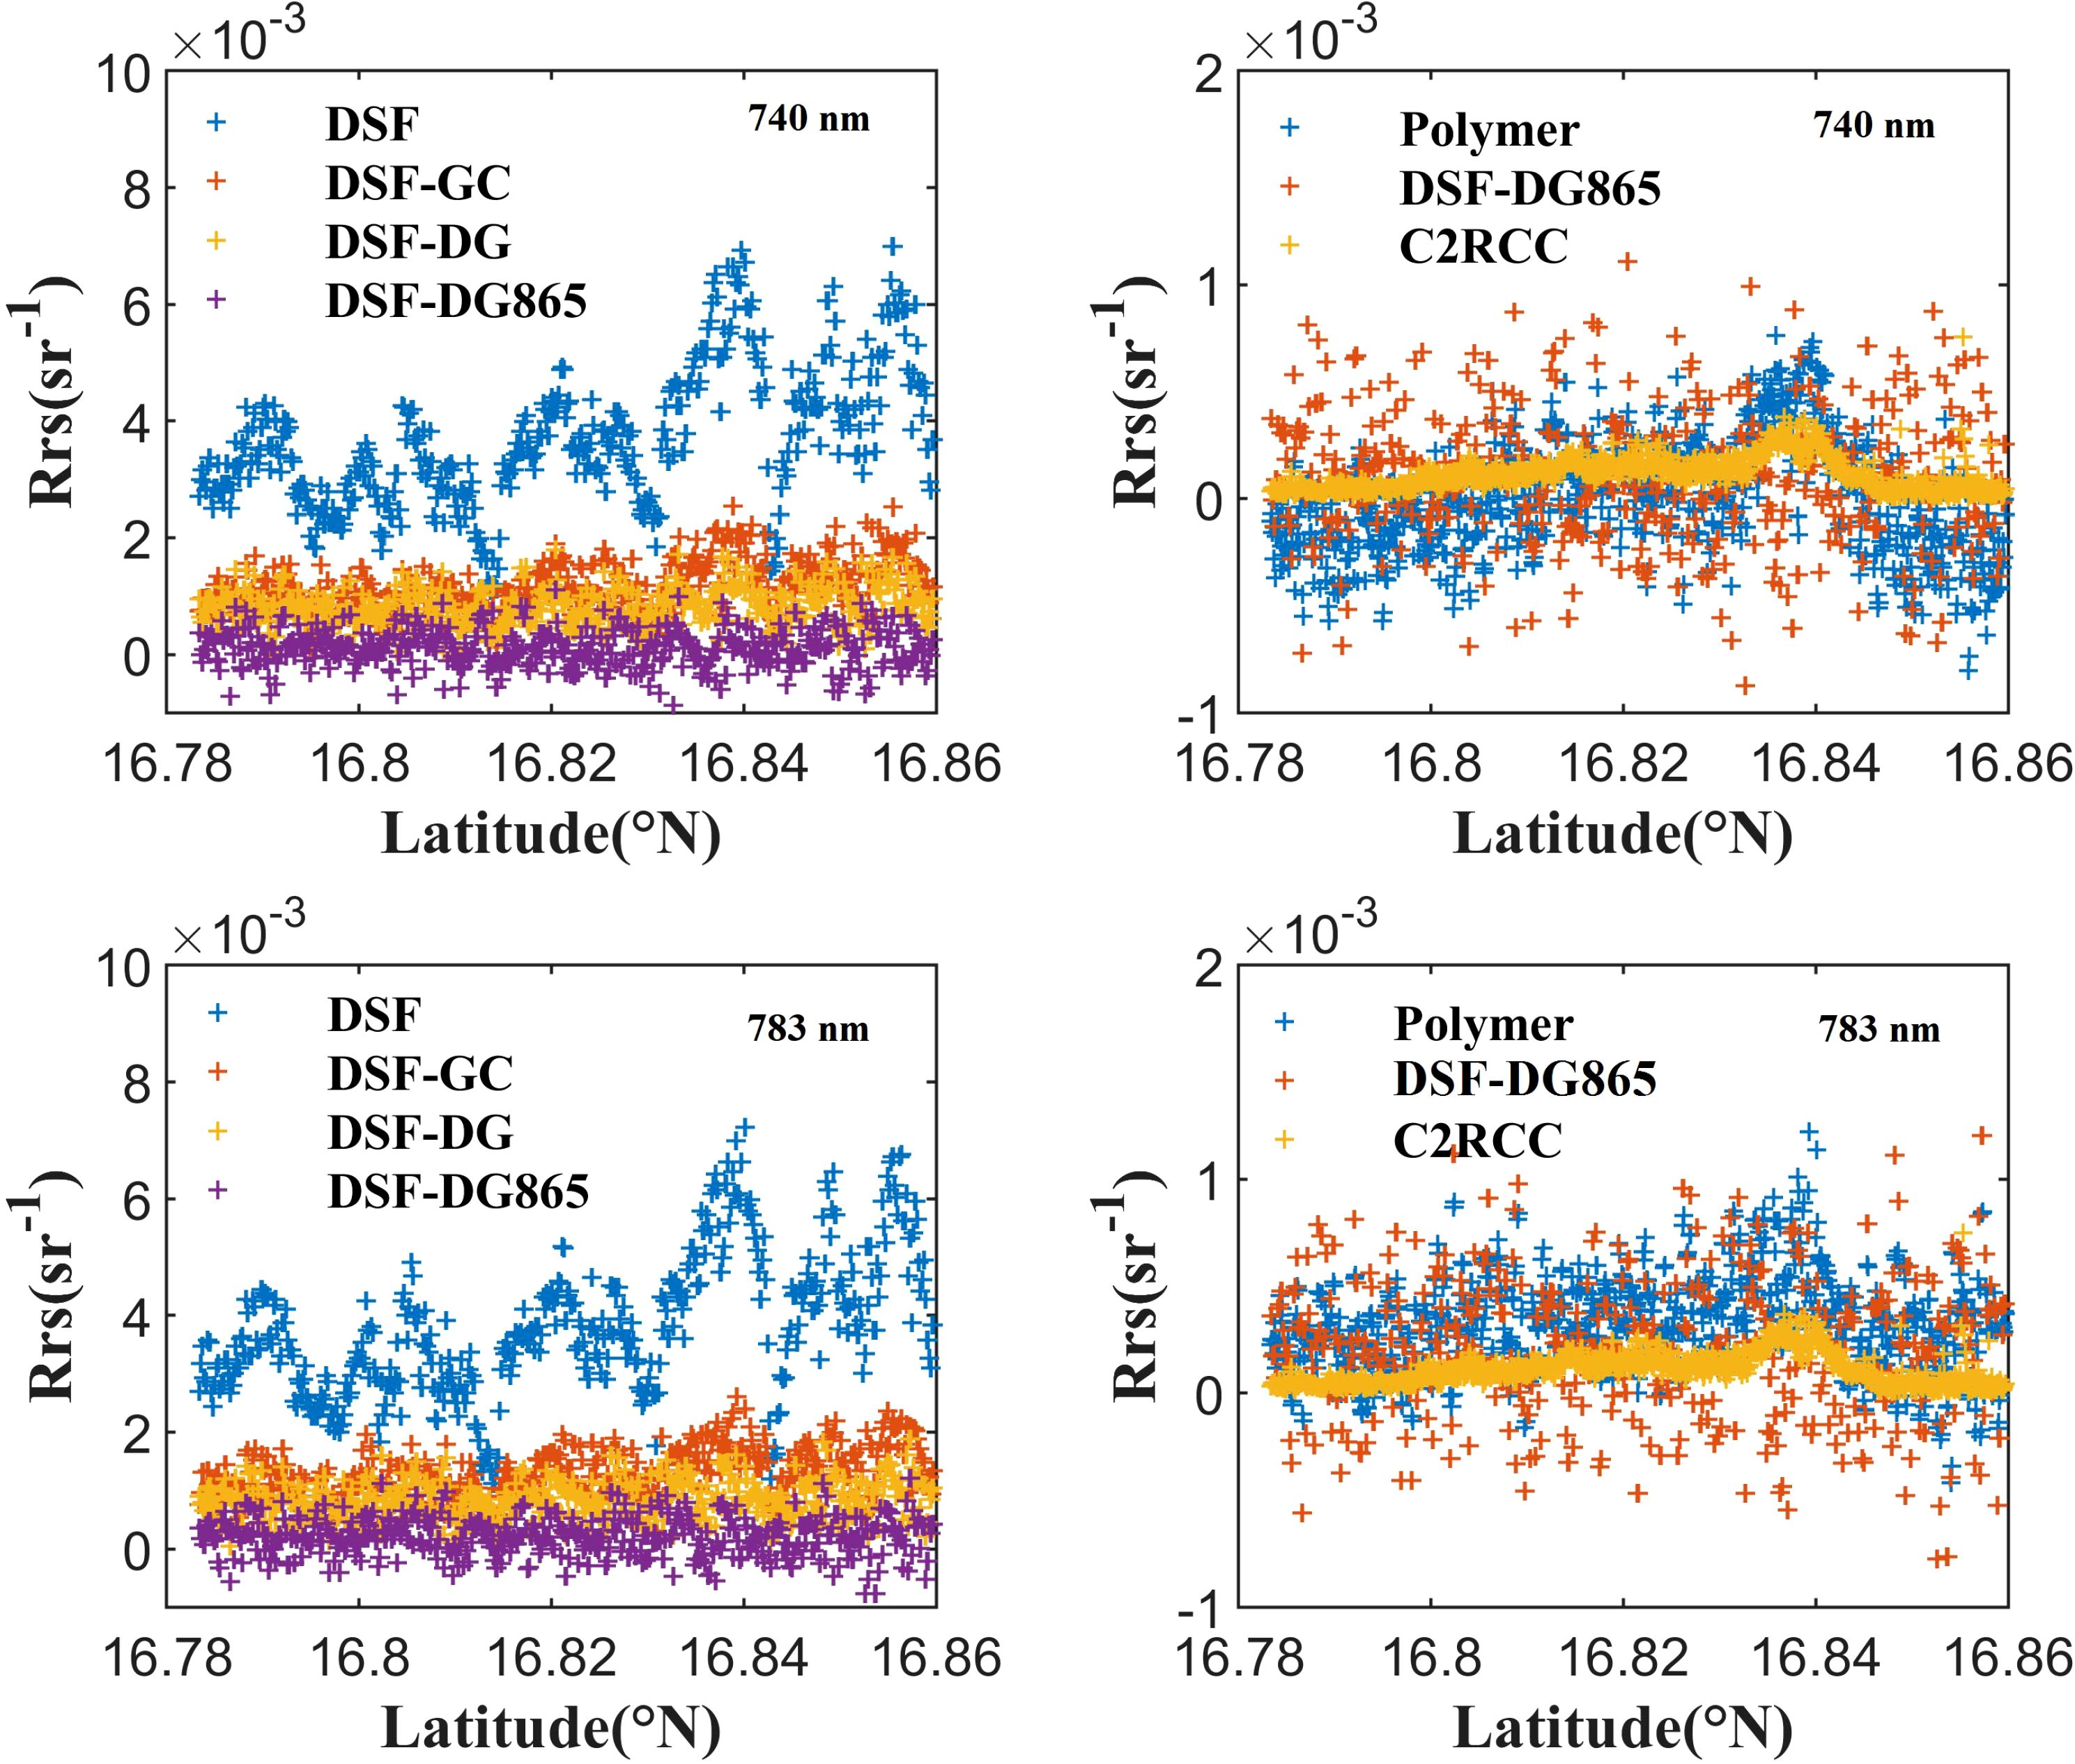
Figure 7. The Rrs_740nm and Rrs_783nm of the MSI image (20181017) derived from the AC algorithm on the yellow line at 112.365°E shown in Figure 6.
3.3 Bathymetry and substrate analysis
Figure 8 presents the bathymetry inversion results of the SAMBUCA model using in situ Rrs (Figure 8G) and matched MSI Rrs (Figures 8A–F) as inputs around Beijiao Island, Coral Island Quanfu Island. The SDB accuracy of DSF method is significantly improved by additional sunglint correction. Among all the methods, the DG865 method (R2 = 0.75, Figure 8D) outperforms the DG method (R2 = 0, Figure 8C) and the GC method (R2 = 0.45, Figure 8B). However, compared to the DSF-DG865 method, the C2RCC method (R2 = 0.81, Figure 8E) and the Polymer method (R2 = 0.85, Figure 8F) yield superior results. Additionally, in situ Rrs inversion resulted in an R2 coefficient of 0.96 (Figure 8G), surpassing the range of R2 values (0-0.85) obtained from the satellite data.
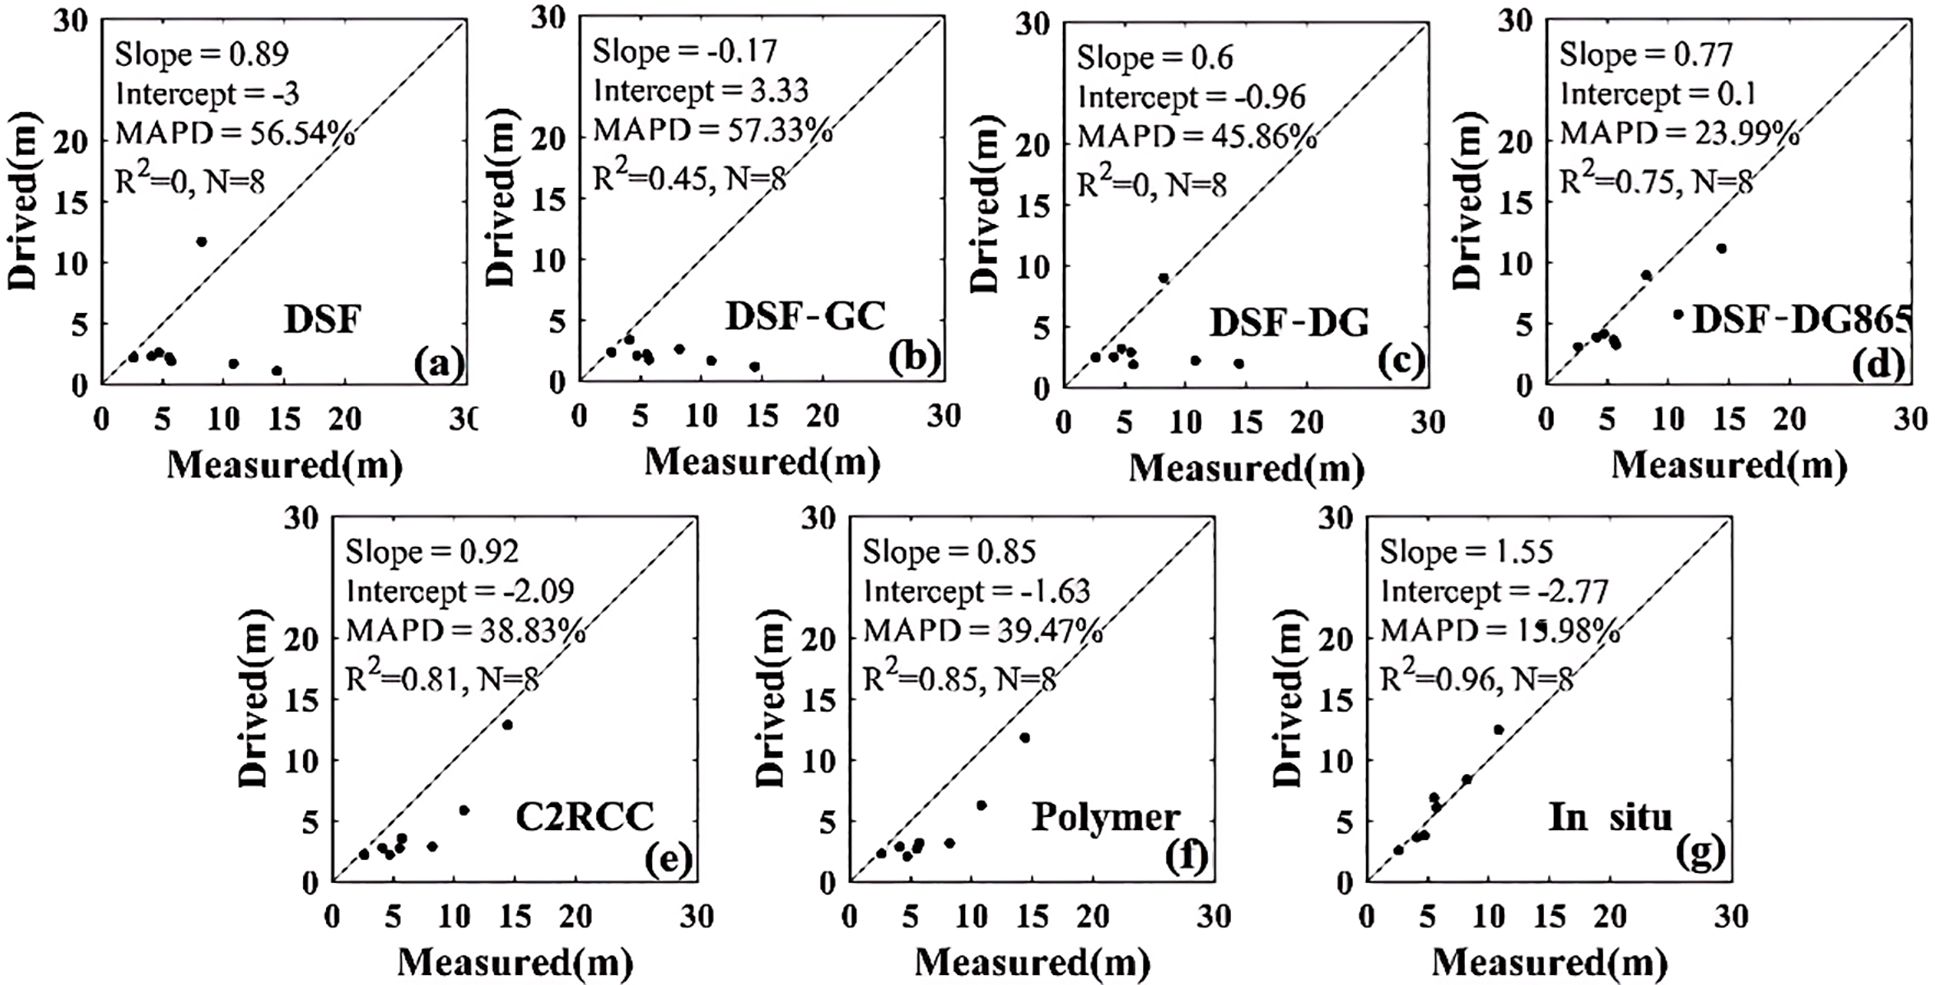
Figure 8. Performance of bathymetry estimation from (A-F) matched MSI Rrs of various AC algorithms, and (G) in situ Rrs measurements by ASD for locations specified in Table 2.
Figure 9 and Table 5 present the SDB results from four MSI images (20181017, 20190105, 20190224 and 20190301, as listed in Table 1) around Yongxing Island. Notably, the SDB attained the highest R2 of 0.85 using the 20190105 MSI image with the Polymer method, while the other images yielded lower R2 values ranging from 0.51 to 0.69. For the C2RCC method, R2 values ranged from 0.13 to 0.71. The use of DG865 significantly improved the accuracy of the DSF method, achieving R2 between 0.24 and 0.77. This marks a notable improvement over the DG method (R2 range: 0 - 0.71) and the GC method (R2 range: 0.05 - 0.70). The DSF method alone, however, had R2 values ranging from 0 to 0.4. Depth-dependent analysis (Figure 10) revealed that DSF-DG865, DSF-GC, DSF-DG and Polymer methods achieved highest performance in shallow water (0-5 m), with R²values above 0.7. However, in deeper water (5-15 m), the Polymer method demonstrated superior performance with an R²values of 0.72, significantly outperforming all other methods.
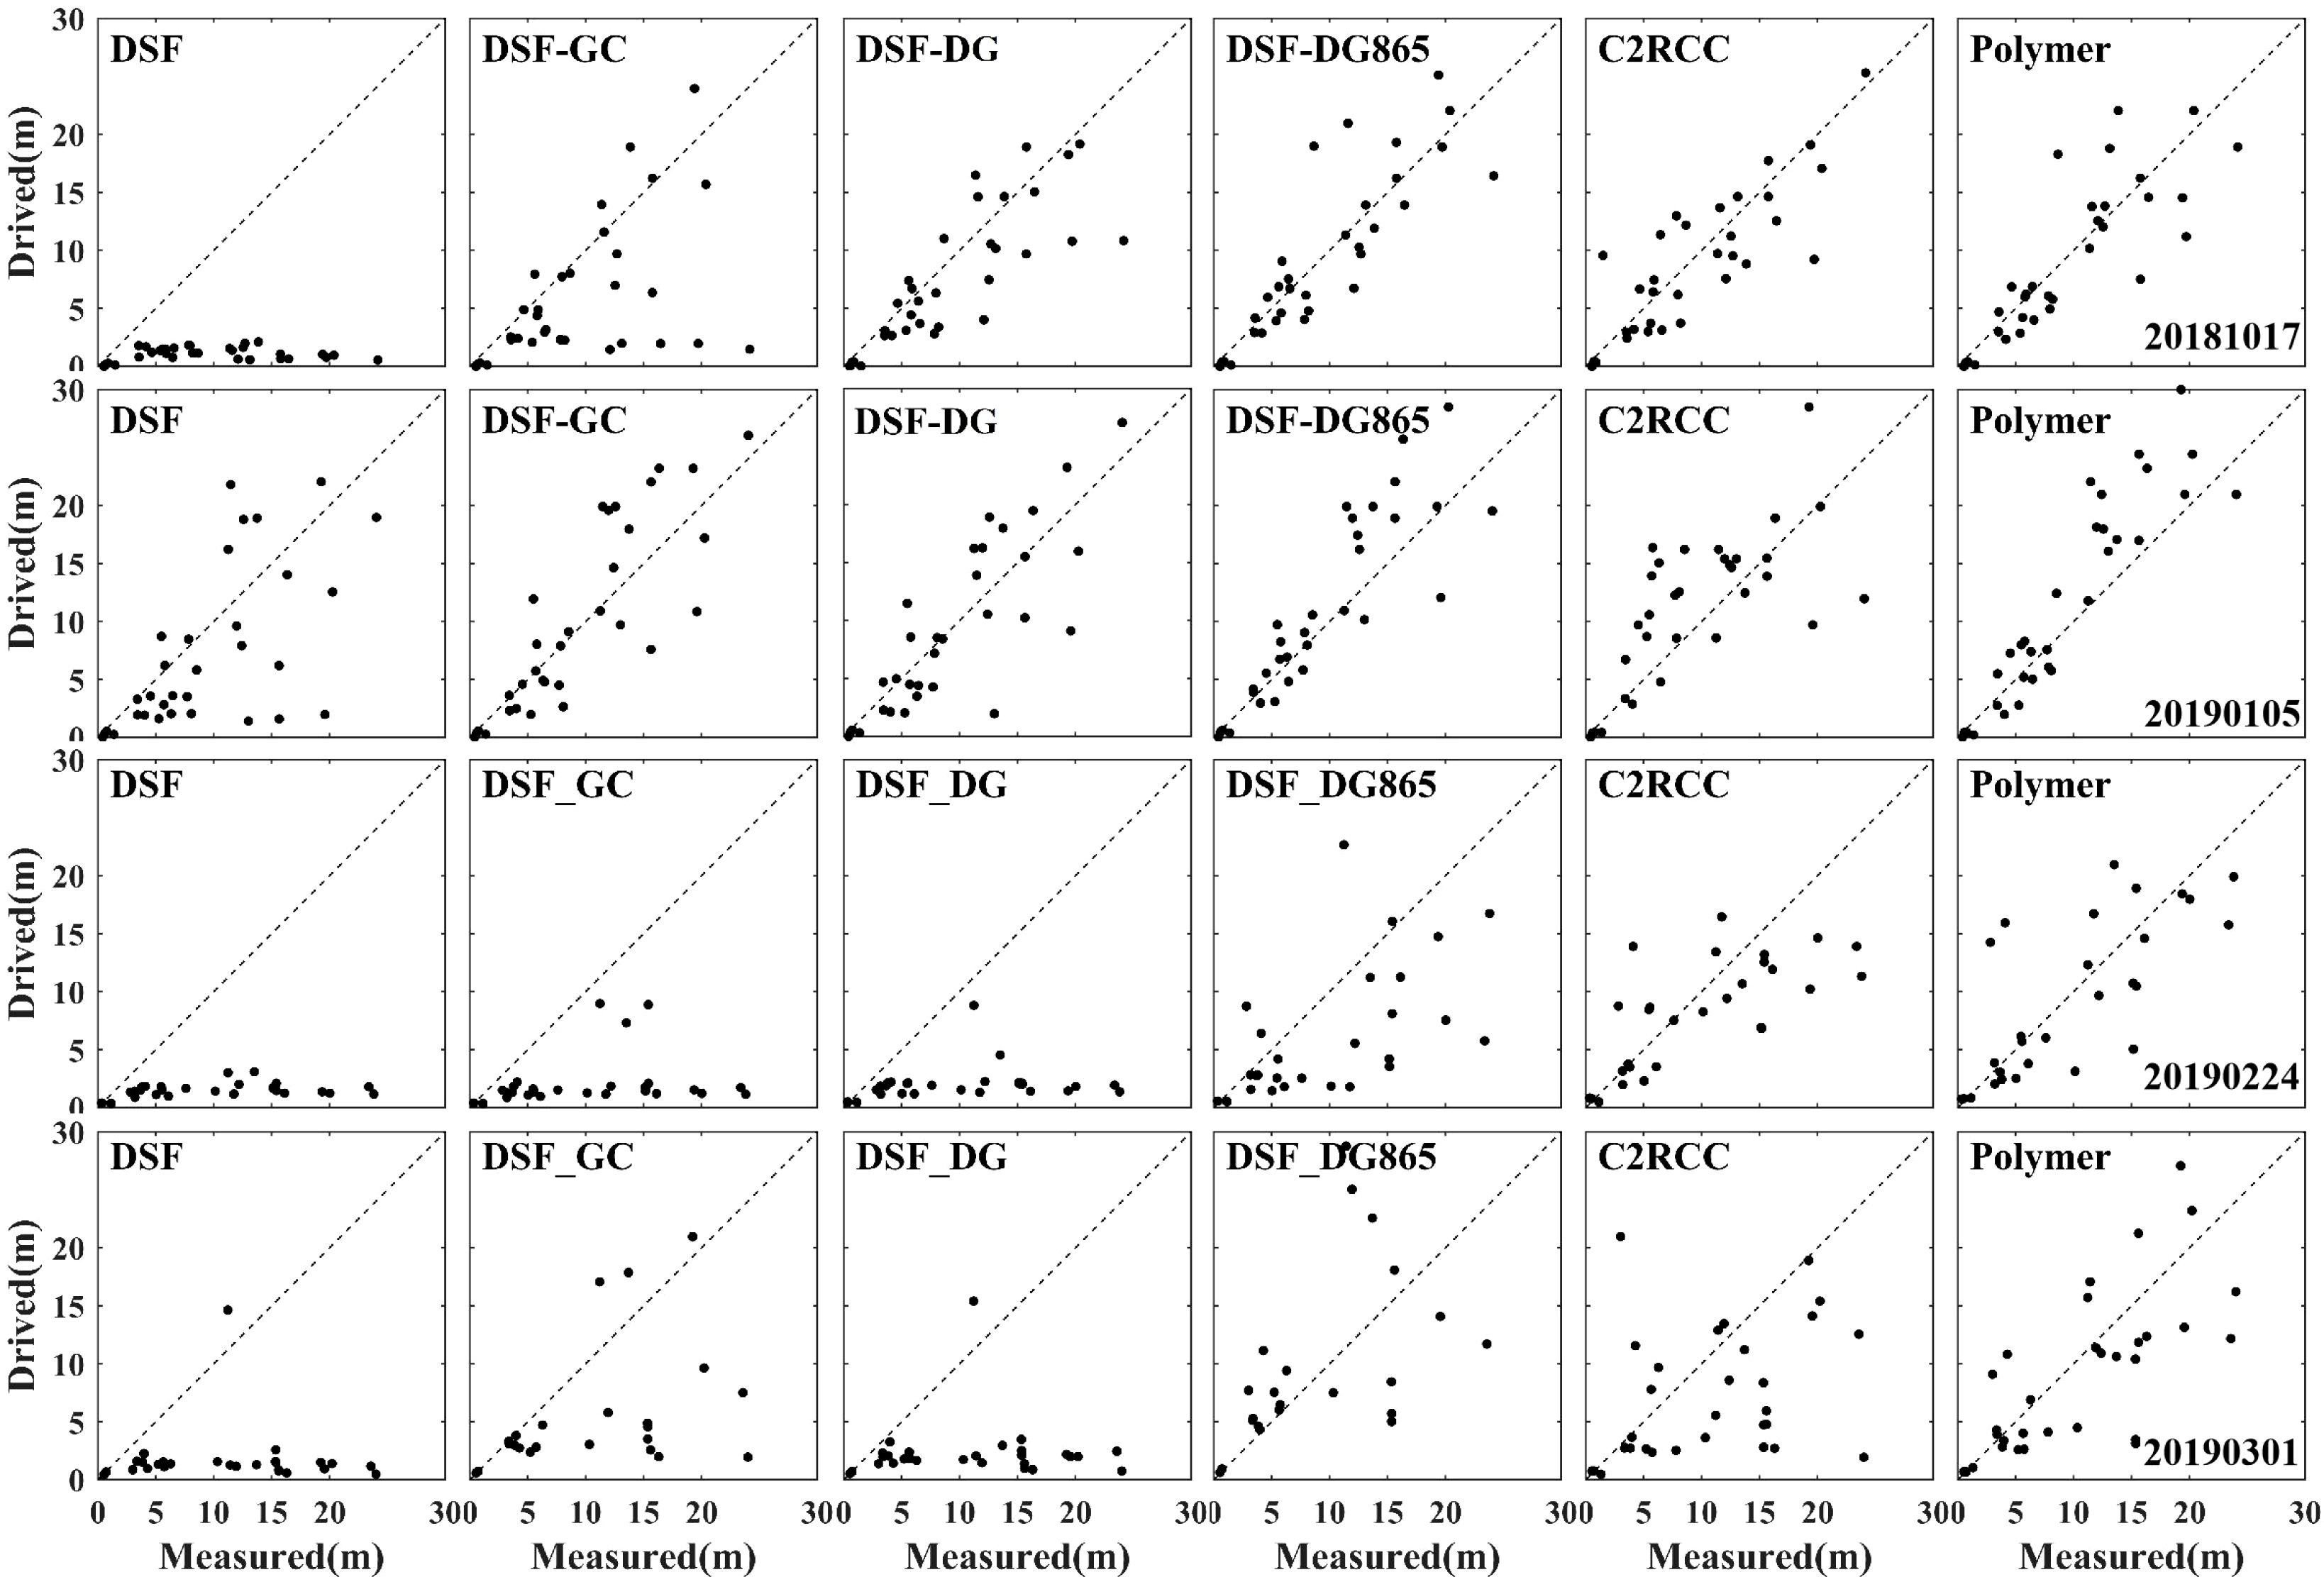
Figure 9. Performance of bathymetry estimation using various AC algorithms for the areas around Yongxing Island.
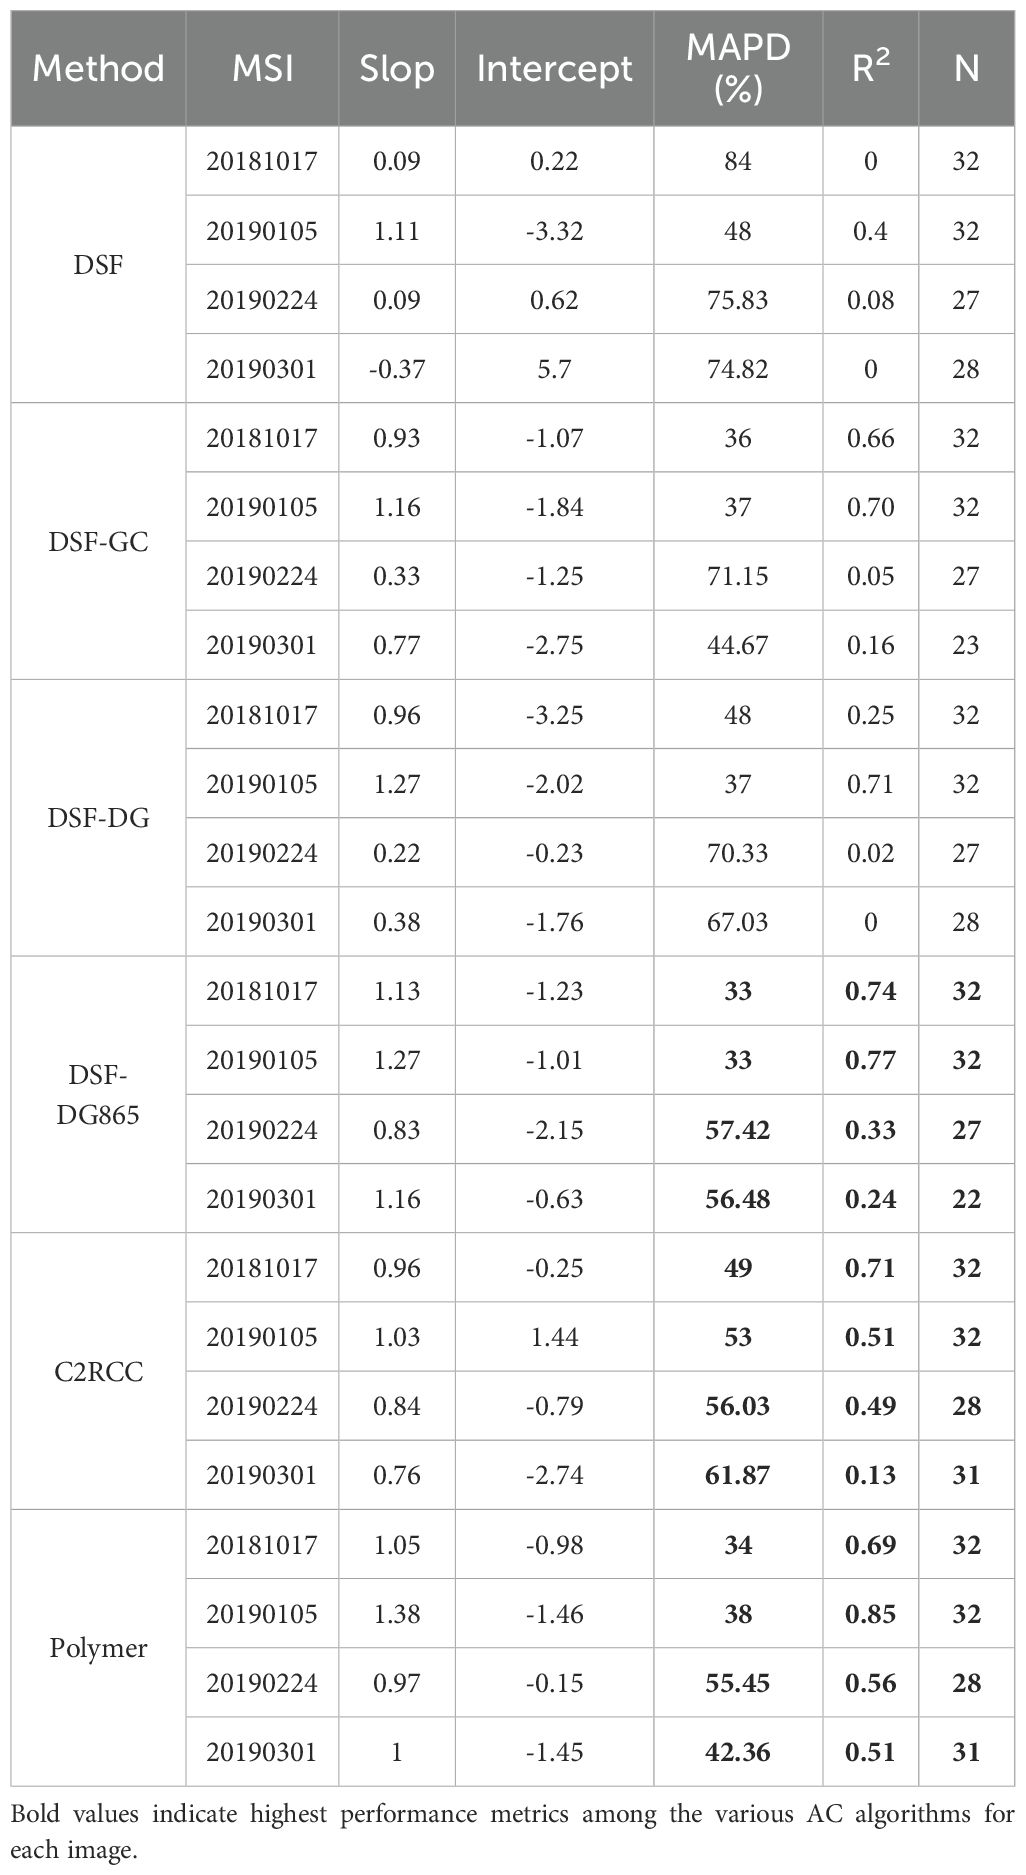
Table 5. Comparison between in situ and SAMBUCA-derived depths around Yongxing Island.
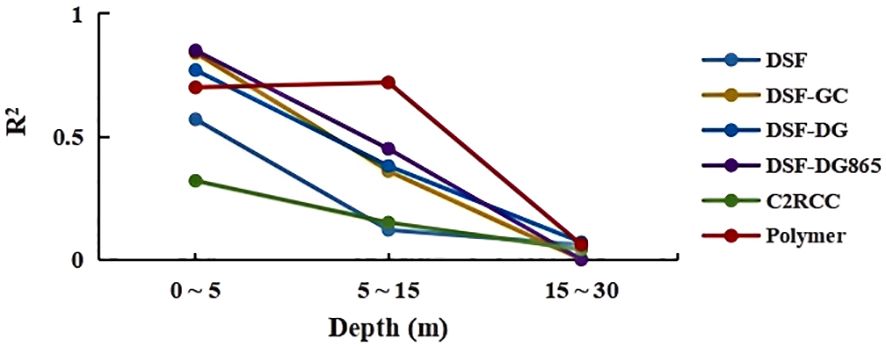
Figure 10. Depth-dependent R2 values comparing in situ measurements with SAMBUCA-derived depths around Yongxing Island.
For the MSI images of 20190224 and 20190301, the two image datasets differ in the amount of validation data due to the presence of clouds and sunglint effects. The Polymer and C2RCC methods provided the highest amount of usable data in both cases. The consistency of the results over time (20181017 and 20190105) was also assessed. As shown in Figures 11A–F, both the DSF-DG865 and the Polymer methods demonstrated superior performance and higher temporal consistency in their bathymetric inversions, achieving R2 values of 0.76 and 0.78, respectively. In comparison, the C2RCC showed lower consistency with an R2 values of 0.54. While the DG865 modification improved DSF method accuracy, its performance remains highly dependent on image quality and requires careful application. Overall, the Polymer method emerged as the most robust approach, providing both the largest amount of usable data and highest accuracy.

Figure 11. (A-F) Comparison of bathymetry around Yongxing Island based on MSI data from 2019/01/05 and 2018/10/17.
Figure 12 presents the substrate types obtained by four MSI images with various AC methods. The most stable substrate distribution was achieved by applying the Polymer method across multiple time periods. From 20181017 to 20190301, the Polymer method consistently provided highly detailed substrate classifications, effectively highlighting the topography of the spine channel system through the identification of sand and coral in deeper water across all four images. In contrast, the C2RCC method exhibited a high proportion of coral distributions. However, for the 20190105 dataset - which featured higher imaging quality - the estimated coral coverage was substantially smaller than in the other three cloud-affected datasets. This discrepancy suggests that the inflated coral distributions were erroneous results induced by cloud interference. As shown in images from 20181017 and 20190105, applying additional sunglint correction to the DSF method led to substantial changes in substrate classification, notably increasing the proportions of sand and coral substrates, the DG865 method exhibits the most significant improvements. However, for the images from 20190224 and 20190301, the inverted bathymetry results (Table 5) obtained using all DSF methods, including those with glint correction, displayed substantial errors. The substrate classifications from these images showed poor agreement with the results from the earlier datasets (20181017 and 20190105), rendering them unreliable for substrate inversion.
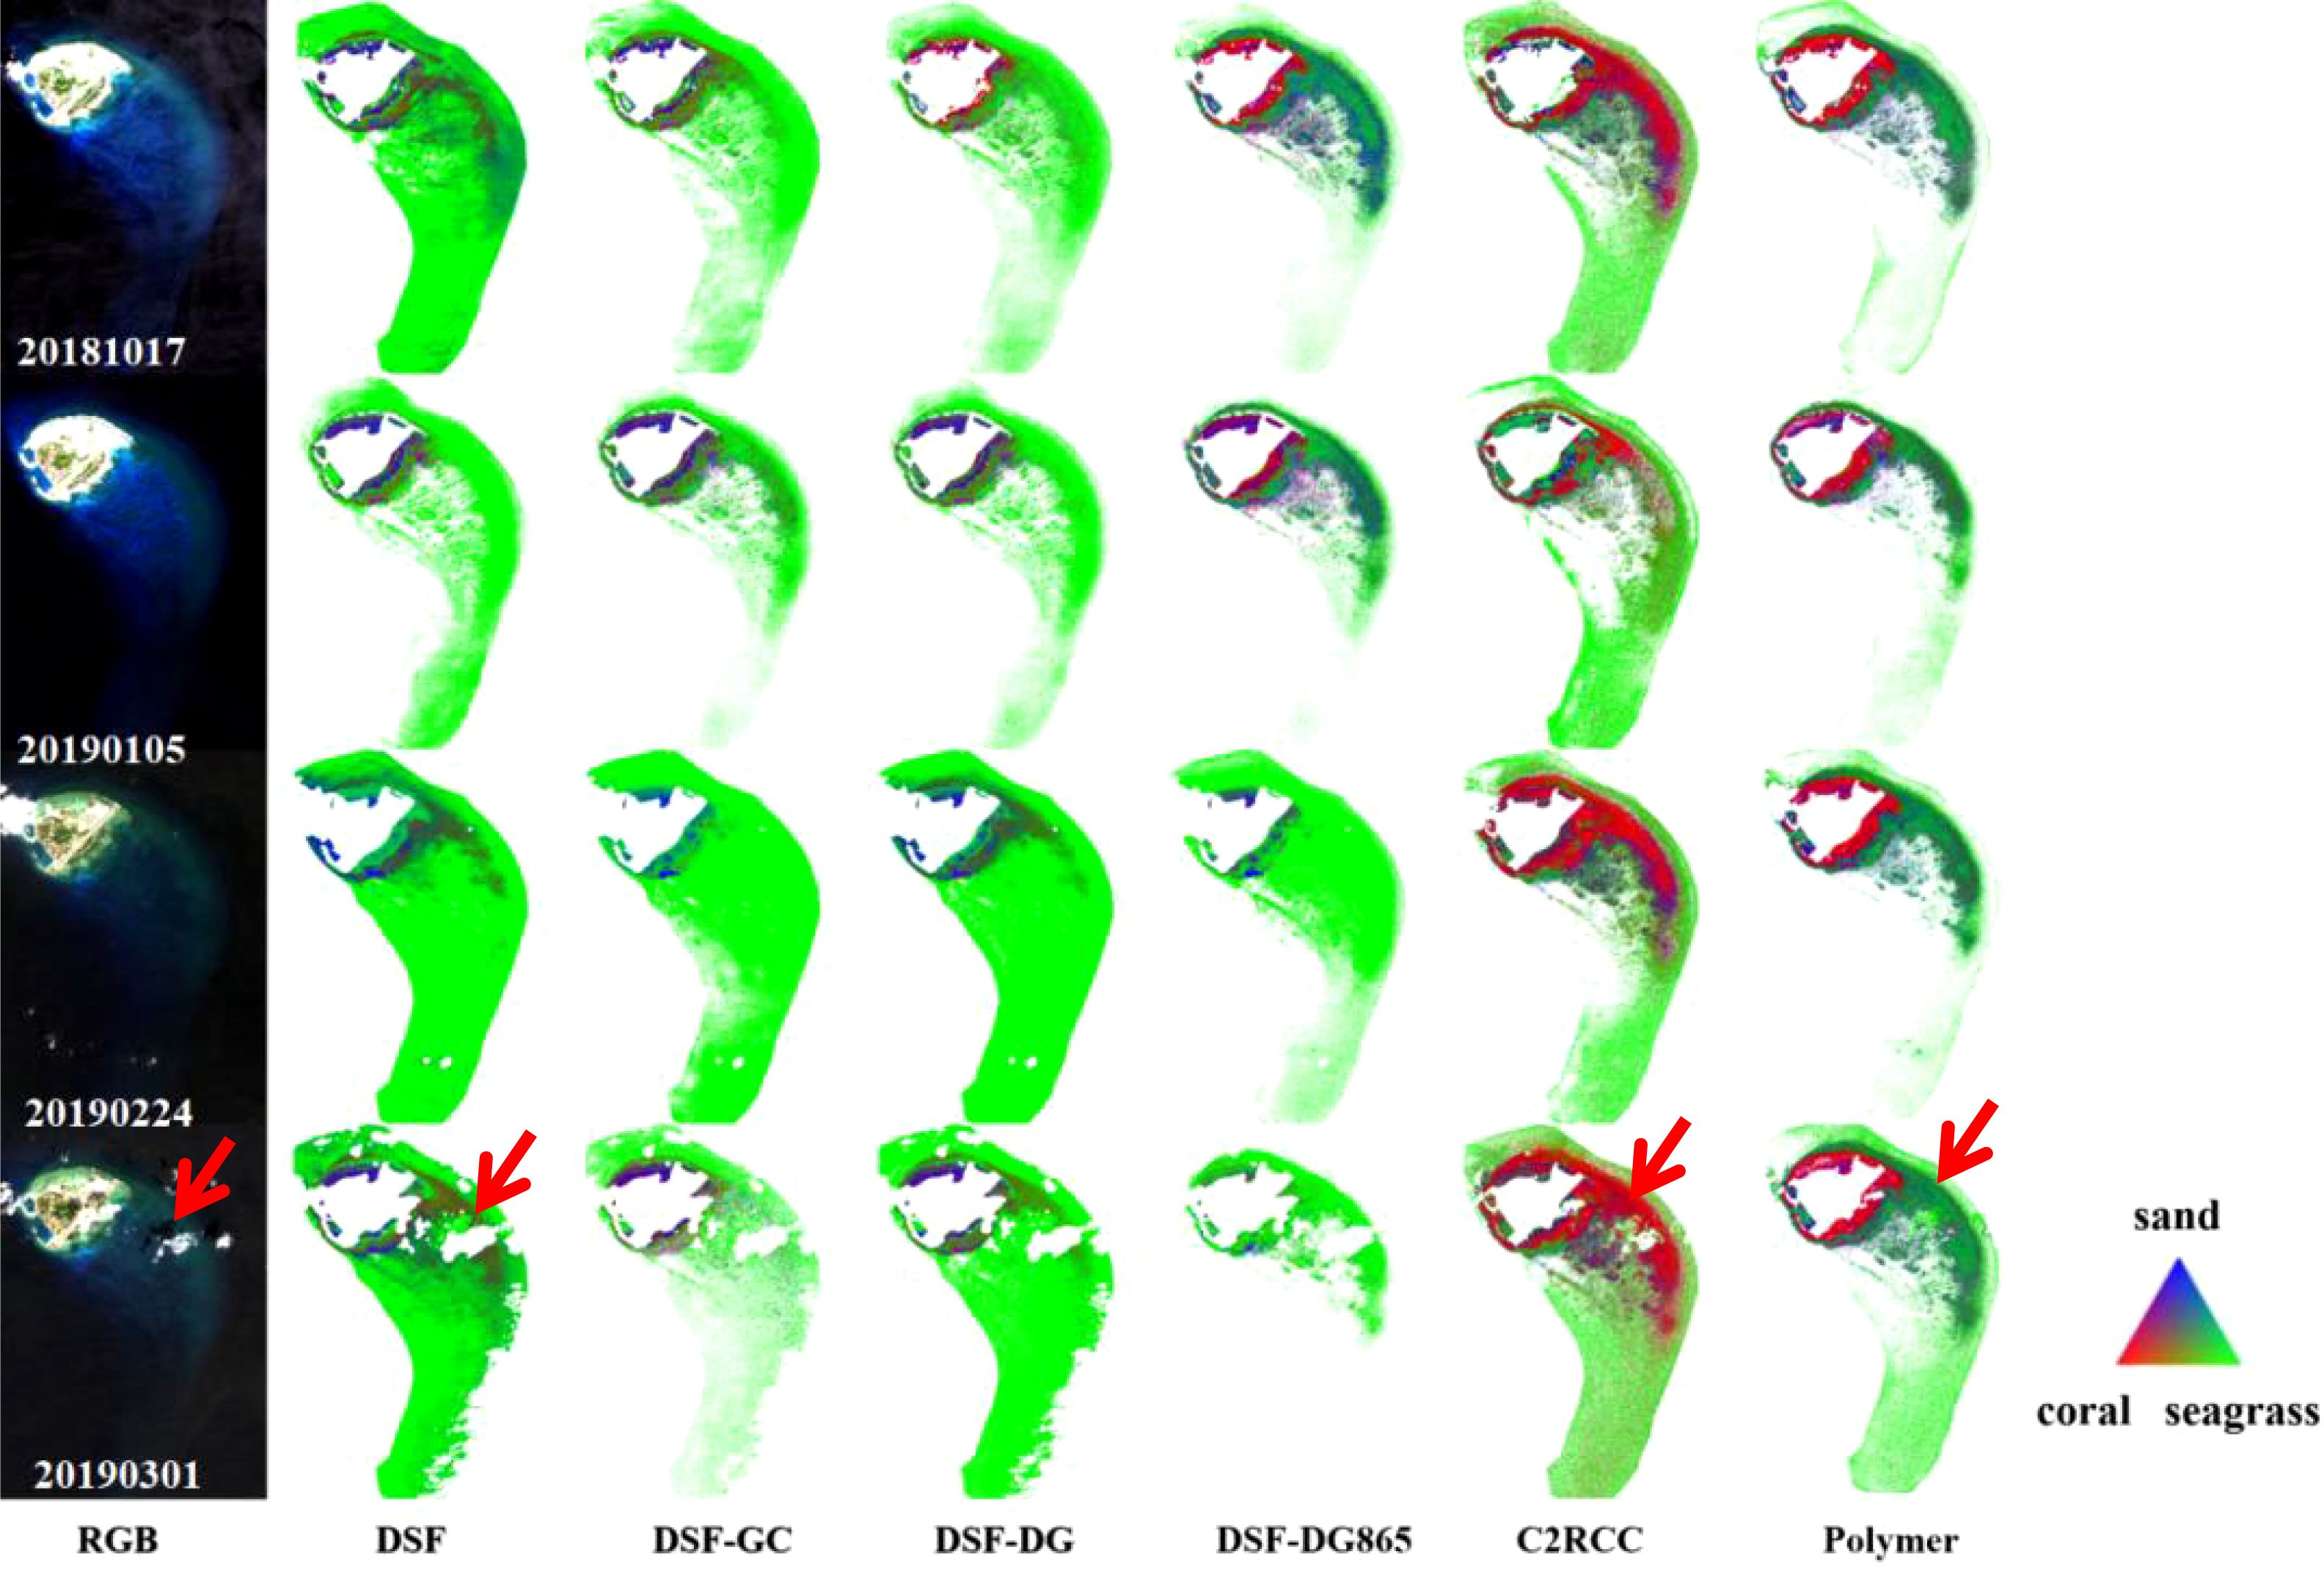
Figure 12. The bottom-type ratio derived from MSI data using various AC algorithms, where red represents coral, green represents seagrass, blue represents sand, for water depths ranging from 0.01 to 15 m. The red arrows indicate the cloud-shaded areas in the substrate results.
In addition, the inversion results from 20190301 highlight the impact of cloud shading on substrate classification, with all AC methods proving ineffective against cloud shadow effects. As indicated by the red arrows in Figure 12, the substrate results from all AC methods in cloud-shaded areas show a disproportionately higher seagrass distribution compared to the surrounding regions. Furthermore, the high proportion of seagrass spectra in deeper water - where the water column signal dominates and bottom contributions are minimal - clearly contradicts the actual distribution of seagrass on the seafloor. The presence of an overall lower bottom reflectance across all spectral bands, characterized by smaller spectral variations and values closely aligning with seagrass spectra, is likely the primary cause of this discrepancy. A decrease in coral biomass was observed in the DSF-DG865 and Polymer results, with the coral spectral ratio for 20190105 compared to 20181017 falling below the 1:1 line. However, due to the absence of accurate and appropriate field measurements, further in-depth research and analysis could not be conducted to draw reliable conclusions.
4 Discussion
Several studies have shown that atmospheric correction is an essential step in remote sensing monitoring of aquatic environments, including the bathymetry, habitats, and water quality (Eugenio-Gonzalez et al., 2015; Vanhellemont and Ruddick, 2015; Warren et al., 2019; Duan et al., 2022). Warren et al. (2019) utilized a 180 m×180 m window to match in situ data, concluding that both Polymer and C2RCC perform better than ACOLITE. However, their reported R2 values were generally lower, all below 0.4, even in the visible bands (400 - 700 nm). This conclusion significantly underestimates the accuracy of satellite products and raises doubts among users relying on satellite-derived data. In contrast, this study adopts a stricter matching approach, using the mean value of a 3 × 3 pixel window with a spatial coverage of 30 m × 30 m, which is more appropriate for shallow water features of coral reefs. As a result, the R2 obtained in this study are consistently above 0.9 in visible bands, demonstrating much higher accuracy.
SDB and inverted substrate types have proven effective tools for evaluating AC performance in shallow water regions (Goodman et al., 2008; Hernandez and Armstrong, 2016; Caballero and Stumpf, 2020; Ma et al., 2020; Caballero and Stumpf, 2021; Duan et al., 2022). Caballero and Stumpf (2020) found that different AC processors exhibit distinct strengths and weaknesses, particularly concerning AC and sunglint correction. For instance, C2RCC could retrieve depths in moderately severe sunglint conditions, whereas ACOLITE DSF removed such data. However, C2RCC corrections were less accurate, with higher noise and errors exceeding 50%. In cases where usable scenes are available, ACOLITE is recommended. In this study, Polymer demonstrated superior handling of sunglint and proved to be a better choice overall for these conditions. Few studies have specifically focused on the impact of atmospheric corrections on substrate inversion results. Goodman et al. (2008) utilized default bottom reflectance values (sand, coral, algae) to assess the effect of varying bathymetry estimates. Their final evaluation compared model-estimated reflectance at 550 nm with in situ reflectance spectra, providing valuable insights into the accuracy of substrate inversion under different AC scenarios.
This paper focuses on optically shallow coral reef waters and evaluates the performance of three commonly used atmospheric correction algorithms (DSF, C2RCC, Polymer) along with three additional sunglint correction methods associated with DSF algorithm. The results highlight variations in the corrected Rrs spectra, the effectiveness of glint removal, and the estimation of bathymetry and substrate types derived from the shallow water model of SAMBUCA using the corrected Rrs in the Xisha Reefs. Based on these findings, the advantages and disadvantages of each of the three methods are analyzed and discussed.
4.1 AC algorithm comparisons
In this study, the Polymer method demonstrated strong performance. Polymer-derived Rrs showed excellent agreement with in-situ measured, with R2>0.95 within a 3-hour match and R2>0.65 within a 6-hour match in visible bands (443nm-655nm). The method provided the highest amount of usable data and absolute R2 value ranging from 0.51 to 0.85 in the bathymetric inversions, effectively capturing substrate information. Notably, the most stable substrate distribution was obtained by applying the Polymer method to invert the MSI data across multiple time periods. Despite its overall performance, the Polymer method exhibits certain limitations, including a tendency for overestimation (see Figure 4B) and negative Rrs values (see Figures 6, 7). These issues could be because of simplified spectral optimization: the spectral optimization process does not account for the influence of CDOM on IOPs beyond chlorophyll-a statistical perspective (Steinmetz and Ramon, 2018), the Angstrom coefficient typically ranges between 0.5 and 1.3 (Hu et al., 2012). For clear ocean waters, it approaches 1.0 (Zhang et al., 2018). However, in optically shallow coastal waters environments, deviations from 1.0 may lead to incorrect aerosol reflectance, causing errors in the retrieved Rrs.
Additionally, Polymer models reflectance as a function of two parameters: chlorophyll-a concentration and a backscattering variability coefficient (Zhang et al., 2018). While effective in open oceanic waters where chlorophyll-a predominantly influences optical properties, this simplification struggles in optically shallow coastal waters. In these environments, complex bottom reflections affect chlorophyll-a estimates and backscattering variability, potentially leading to underestimation of Rrs. Moreover, different IOP models may yield varying phytoplankton concentration outputs, compounding inaccuracies (Windle et al., 2022b). As noted by Steinmetz et al. (2011), Polymer’s reliance on wind speed estimation at sea level introduces another source of error, where inaccurate wind speed values can result in negative reflectance values.
The performance of DSF is highly dependent on the glint correction in this study. The DG865 glint correction, applied following the DSF method, yielded improved Rrs retrievals, with R² > 0.95 within a 3-hour match and R² ranging from 0.31 to 0.74 within a 6-hour match in visible bands (443 nm–655 nm). The DSF-DG865 significantly enhanced bathymetric inversions, achieving R² values between 0.24 and 0.77, compared to the standalone DSF method, which had R² values ranging from 0 to 0.4. Notably, this approach increased the detected proportion of sand and coral substrates in the 20190105 and 20181017 MSI imagery. However, for MSI images with partly cloudy conditions, such as the 20190224 and 20190301 images analyzed in this paper, the method exhibits poor performance in both bathymetry and substrate analysis. This finding contrasts with earlier studies (Caballero and Stumpf, 2019; Caballero and Stumpf, 2020), which suggested that the DSF products provide accurate and consistent results across different MSI scenes and study sites, given rigorous image data screening.
The DSF-DG865 method performs well in some cases (e.g.,20190105 and 20181017 MSI imagery), but it exhibits certain limitations, including overestimation (see Figure 4B) and poor performance in obtaining usable bathymetry and substrate data from cloudy images (e.g.,20190224 and 20190301 MSI images). As a result of assumptions in the DSF, atmospheric path reflectance can be overestimated in cases where non-zero surface reflectance exists in the bands used (Vanhellemont and Ruddick, 2018). The inaccurate aerosol calculation is a potential source of error. This overestimation also causes over-masking, which in turn reduces the amount of data available. Adjusting masking parameters could mitigate this issue and improve data availability. The DSF algorithm is efficient, simple, and the least time-consuming among AC methods in this study. The latest version of ACOLITE updates the DSF look-up table (LUT) to include default continental and marine aerosol models, and also supports the addition of other aerosol models (Vanhellemont, 2019). Once the glint correction issue is resolved, the DSF method will be better suited for these applications.
The C2RCC method demonstrated suboptimal performance, with lower R² values for derived MSI Rrs compared to in situ measurements and consistently inferior SDB results relative to the Polymer method. Substrate classifications derived from C2RCC exhibited significant discrepancies and inconsistencies when compared to DSF and Polymer, highlighting its reduced accuracy and reliability in shallow water assessments. As a model algorithm based on database training, the performance of C2RCC was dominated by the training dataset (Ligi et al., 2017; Soriano-González et al., 2022), the oligotrophic waters in coral reefs were different from the training dataset of C2RCC, the use of C2RCC was limited in this study. We noticed that the C2RCC is considered to be uncorrected for glint (Yan et al., 2023), but from the results of the two scenarios applied in this paper, it seems that C2RCC overcomes the effect of glint, which may be implicitly implied by the training conditions. To maintain state consistency, all ACs were left as defaults, which is one reason for the poor performance of C2RCC. Adding shallow water condition data such as coral reef optical conditions for training, improving forward radiative transfer modelling, and exploring the latest architectures (e.g., optimisation functions, loss functions, activation functions) or models (e.g., convolutional neural network, recurrent neural network) and setting more appropriate atmospheric correction operating parameters for each image data would improve C2RCC.
In summary, the Polymer method is the preferred choice for remote sensing applications of coral reefs using MSI data. The DSF method can be used when the image data are free of cloud effects, but it should be complemented with suitable glint correction. The DG865 method in this paper can serve as a reference. However, it’s important to note that the DG865 method may introduce errors at shorter wavelengths when dealing with non-white aerosols (e.g., continental or dust-type aerosols). The C2RCC method should be used with caution and is not recommended in this paper.
4.2 Uncertainties
The SAMBUCA method used in this study provided the results of the three basic substrate spectra as percentages, but it still falls short when it comes to reconciling and evaluating the results of actual field-substrate surveys with the model substrate results. For example, the relationship between spectral occupancy and actual substrate composition, and the criteria for judging this, remain unclear, as do discrepancies in spatial and temporal alignment between on-site surveys and satellite data. Despite the availability of some onsite substrate survey results, there are still uncertainties in the analysis and verification of substrate inversion results. As the focus of this paper is on the atmospheric correction method, the discussion of the analysis of the consistency of the substrate results with the field has been omitted.
The results presented in this paper are subject to uncertainties when compared with in situ data, including limited availability of matching data, temporal disparities between in situ and satellite data, and spatial discrepancies. In shallow water environments, discrepancies between field measurements and satellite observations can be partially attributed to the heterogeneous distribution of bottom substrate. The spatial matching of in situ measurements to satellite data is influenced by various types of benthic habitats, such as seagrass, bare sand, and coral. Additionally, the synchronization of time is a crucial influencing factor in the comparison between in situ and satellite data (Cui et al., 2014). In optically shallow water, wave and tidal actions can induce substantial water level fluctuations within a relatively short timeframe, thereby impacting the spectral characteristics. Additional challenges include spatially resolved wave facets (varying amounts of sky glint), foam and floating debris. Furthermore, misidentification of cloud shadows by AC algorithms can produce artificially low reflectance pixels, leading to overestimation of seagrass coverage in substrate classifications. Human structures, ships, and their shadows also introduce artifacts - effects that are largely unavoidable for any sensor (Vanhellemont and Ruddick, 2018). Nearshore or cloud edge pixels adjacency effect is another important factor to consider, where shadows or reflections formed by land features occluding and emitting optical radiation propagate to the neighboring sea surface and interfere with the maritime optical signal, thereby altering its optical characteristics and affecting interpretation. While the in situ Rrs measurements does not locate close to shoreline, the adjacency effect was not quantitatively assessed in this study. Moreover, it has been demonstrated that the adjacency effect due to proximity to bright targets can be well mitigated by the Polymer method (Steinmetz and Ramon, 2018). Overall, the fact that the exact same dataset was used for the assessment means that these uncertainties will be equally present in the results of all atmospheric correction methods and will not affect the main conclusions of this study.
5 Conclusions
This study assesses the Rrs derived from three AC algorithms and additional glint correction methods for DSF, and investigates AC influence on water depth and substrates estimation in shallow water coral reef regions. The findings of this study emphasize the importance of accurate AC on precise retrieval of water depth and coral reef substrates in shallow water areas in medium- to high- resolution satellite imagery. Furthermore, the results of this study showed that the Polymer algorithm provides highly accurate and stable results for bathymetry and substrate inversion in optically shallow water in coral reef environments. The results demonstrate that the Polymer method is valuable for AC in precise remote sensing monitoring of coral reefs. Based on the findings of this study, separating the glint correction module from the AC module can result in improved performance evaluation, as demonstrated by the assessment of the overall effectiveness of the complete processing workflow. The inclusion of a performance evaluation of the DSF algorithm after glint correction enhances the comprehensiveness of the assessment, leading to a better understanding of the accuracy and reliability of the Rrs. This paper addresses gaps in the literature and highlights the importance accurate AC processing to advance remote sensing techniques for assessing coral reef ecosystems in optically shallow waters.
Data availability statement
The original contributions presented in the study are included in the article/supplementary material. Further inquiries can be directed to aHVhbmd3MjY3QG1haWwyLnN5c3UuZWR1LmNu.
Author contributions
WH: Writing – original draft, Writing – review & editing. JZ: Data curation, Formal analysis, Methodology, Software, Writing – original draft, Writing – review & editing. ML: Formal analysis, Funding acquisition, Writing – original draft, Writing – review & editing. QL: Data curation, Methodology, Writing – review & editing. NY: Data curation, Formal analysis, Methodology, Software, Writing – review & editing. SS: Formal analysis, Funding acquisition, Methodology, Supervision, Writing – original draft, Writing – review & editing.
Funding
The author(s) declare financial support was received for the research, authorship, and/or publication of this article. This study was funded by the Science and Technology Development Foundation of South China Sea Bureau, Ministry of Natural Resources (Grant No.230208), the Key Program of Marine Economy Development Special Foundation of Department of Natural Resources of Guangdong Province(GDNRC(2020)012), the National Natural Science Foundation of China (Grant No.42106173) and the Southern Marine Science and Engineering Guangdong Laboratory (Zhuhai) (Grant No. SML2023SP219).
Acknowledgments
The data used in this paper were mainly collected and initially processed by the South China Sea Institute of Planning and Environmental Research of the State Oceanic Administration (SOA) and Sun Yat-sen University. We would like to express our sincere gratitude to Prof. Ruru Deng and the team from Sun Yat-sen University, for providing part of the in situ measurements.
Conflict of interest
The authors declare that the research was conducted in the absence of any commercial or financial relationships that could be construed as a potential conflict of interest.
Publisher’s note
All claims expressed in this article are solely those of the authors and do not necessarily represent those of their affiliated organizations, or those of the publisher, the editors and the reviewers. Any product that may be evaluated in this article, or claim that may be made by its manufacturer, is not guaranteed or endorsed by the publisher.
References
Antoine C., Laporte J., Koetz B., Martin-Lauzer F.-R., Desnos Y.-L., et al. (2016). “Mapping bathymetry, habitat, and potential bleaching of coral reefs using Sentinel-2,” in 13th International Coral Reef Symposium (ICRS 2016), Jun 2016, Honolulu, United States., 405–420.
Botha E. J., Brando V. E., Anstee J. M., Dekker A. G., Sagar S. (2013). Increased spectral resolution enhances coral detection under varying water conditions. Remote Sens. Environ. 131, 247–261. doi: 10.1016/j.rse.2012.12.021
Botha E. J., Brando V. E., Dekker A. G. (2016). Effects of per-pixel variability on uncertainties in bathymetric retrievals from high-resolution satellite images. Remote Sens. 8(6), 459. doi: 10.3390/rs8060459
Brockmann C., Doerffer R., Peters M., Kerstin S., Embacher S., Ruescas A. (2016). Evolution of the C2RCC neural network for sentinel 2 and 3 for the retrieval of ocean colour products in normal and extreme optically complex waters. Living Planet Symposium.
Caballero I., Stumpf R. P. (2019). Retrieval of nearshore bathymetry from Sentinel-2A and 2B satellites in South Florida coastal waters. Estuar. Coast. Shelf Sci. 226, 106277. doi: 10.1016/j.ecss.2019.106277
Caballero I., Stumpf R. P. (2020). Atmospheric correction for satellite-derived bathymetry in the Caribbean waters: from a single image to multi-temporal approaches using Sentinel-2A/B,”. Opt. Express 28, 11742–11766. doi: 10.1364/OE.390316
Caballero I., Stumpf R. P. (2021). On the use of Sentinel-2 satellites and lidar surveys for the change detection of shallow bathymetry: The case study of North Carolina inlets. Coast. Eng. 169, 103936. doi: 10.1016/j.coastaleng.2021.103936
Connell J. H. (1978). Diversity in tropical rain forests and coral reefs. Science 199, 1302. doi: 10.1126/science.199.4335.1302
Cui T., Zhang J., Tang J., Sathyendranath S., Groom S., Ma Y., et al. (2014). Assessment of satellite ocean color products of MERIS, MODIS and SeaWiFS along the East China Coast (in the Yellow Sea and East China Sea). ISPRS J. Photogramm. Remote Sens. 87, 137–151. doi: 10.1016/j.isprsjprs.2013.10.013
Dekker A. G., Phinn S. R., Anstee J., Bissett P., Brando V. E., Casey B., et al. (2011). Intercomparison of shallow water bathymetry, hydro-optics, and benthos mapping techniques in Australian and Caribbean coastal environments. Limnol. Oceanogr.: Methods 9, 396–425. doi: 10.4319/lom.2011.9.396
Doerffer R., Schiller H. (2007). The MERIS Case 2 water algorithm. Int. J. Remote Sens. 28, 517–535. doi: 10.1080/01431160600821127
Drusch M., Del Bello U., Carlier S., Colin O., Fernandez V., Gascon F., et al. (2012). Sentinel-2: ESA’s optical high-resolution mission for GMES operational services. Remote Sens. Environ. 120, 25–36. doi: 10.1016/j.rse.2011.11.026
Duan Z., Sensen C., Liangg C., Ji C., Li M., Shen W. (2022). Satellite-derived bathymetry using Landsat-8 and Sentinel-2A images: assessment of atmospheric correction algorithms and depth derivation models in shallow waters. Opt. Express 30, 3, 3238–3261. doi: 10.1364/OE.444557
Eugenio-Gonzalez F., Francisco M. J., Abasolo J. M. (2015). High-resolution maps of bathymetry and benthic habitats in shallow-water environments using multispectral remote sensing imagery. IEEE Trans. Geosci. Remote Sens. 53, 3539–3549. doi: 10.1109/TGRS.2014.2377300
Goodman J. A., Lee Z. P., Ustin S. L. (2008). Influence of atmospheric and sea-surface corrections on retrieval of bottom depth and reflectance using a semi-analytical model: a case study in Kaneohe Bay, Hawaii. Appl. Optics 47, F1–F11. doi: 10.1364/AO.47.0000F1
Gordon H. R., Du T., Zhang T. (1997). Atmospheric correction of ocean color sensors: analysis of the effects of residual instrument polarization sensitivity. Appl. Optics 36, 6938–6948. doi: 10.1364/AO.36.006938
Harmel T., Chami M., Tormos T., Reynaud N., Danis P.-A. (2018). Sunglint correction of the Multi-Spectral Instrument (MSI)-SENTINEL-2 imagery over inland and sea waters from SWIR bands. Remote Sens. Environ. 204, 308–321. doi: 10.1016/j.rse.2017.10.022
He M., He J., Zhou Y., Sun L., He S., Liu C., et al. (2023). Coral reef applications of Landsat-8: geomorphic zonation and benthic habitat mapping of Xisha Islands, China. GIScience Remote Sens. 60, 2261213. doi: 10.1080/15481603.2023.2261213
Hedley J. D., Harborne A. R., Mumby P. J. (2005). Technical note: Simple and robust removal of sun glint for mapping shallow-water benthos. Int. J. Remote Sens. 26, 2107–2112. doi: 10.1080/01431160500034086
Hedley J. D., Roelfsema C. M., Chollett I., Harborne A. R., Heron S. F., Weeks S., et al. (2016). Remote sensing of coral reefs for monitoring and management: A review. Remote Sens. 8, 118. doi: 10.3390/rs8020118
Hernandez W. J., Armstrong R. A. (2016). Deriving bathymetry from multispectral remote sensing data. J. Mar. Sci. Eng. 4(1), 8. doi: 10.3390/jmse4010008
Hu C., Lee Z., Franz B. (2012). Chlorophyll aalgorithms for oligotrophic oceans: A novel approach based on three-band reflectance difference. J. Geophys. Res., 117, C01011. doi: 10.1029/2011JC007395
Hedley J.-D., Chris R., Vittorio B., Claudia G., Tiit K., Stuart P., et al. (2018). Coral reef applications of Sentinel-2: Coverage, characteristics, bathymetry and benthic mapping with comparison to Landsat 8. Remote Sens. Environ. 216, 598–614. doi: 10.1016/j.rse.2018.07.014
Kai Z. (2022). In situ spectral identification and retrieval of substrates for the coral reefs in the South China Sea (University of Chinese Academy of Sciences).
Lee Z., Casey B., Arnone R., Weidemann A., Parsons R., Montes M., et al. (2007). Water and bottom properties of a coastal environment derived from Hyperion data measured from the EO-1 spacecraft platform. J. Appl. Remote Sens. 1, 011502. doi: 10.1117/1.2822610
Ligi M., Kutser T., Kallio K. Y., Attila J., Koponen S. S., Paavel B., et al. (2017). Testing the performance of empirical remote sensing algorithms in the Baltic Sea waters with modelled and in situ reflectance data. Oceanologia 59, 57–68. doi: 10.1016/j.oceano.2016.08.002
Lin J., Lee Z., Tilstone G. H., Liu X., Wei J., Ondrusek M., et al. (2023). Revised spectral optimization approach to remove surface-reflected radiance for the estimation of remote-sensing reflectance from the above-water method. Opt. Express 31(14):22964–22981. doi: 10.1364/OE.486981
Liu Y., Deng R., Qin Y., Cao B., Liang Y., Liu Y., et al. (2019). Rapid estimation of bathymetry from multispectral imagery without in situ bathymetry data. Appl. Opt 58, 7538–7551. doi: 10.1364/AO.58.007538
Lyons M. B., Roelfsema C. M., Kennedy E. V., Kovacs E. V., Borrego-Acevedo R., Markey K., et al. (2020). Mapping the world’s coral reefs using a global multiscale earth observation framework. Remote Sens. Ecol. Conserv. 6, 557–568. doi: 10.1002/rse2.157
Ma Y., Xu N., Liu Z., Yang B., Yang F., Wang X. H., et al. (2020). Satellite-derived bathymetry using the ICESat-2 lidar and Sentinel-2 imagery datasets. Remote Sens. Environ. 250, 112047. doi: 10.1016/j.rse.2020.112047
Ma Y., Zhang H., Cao W., Wang J. (2023). Detection of coral bleaching in oceanic islands using normalized bottom reflectance change index from multispectral satellite imagery. IEEE Geosci. Remote Sens. Lett. 20, 1–5. doi: 10.1109/LGRS.2023.3282708
Morel A., Maritorena S. (2001). Bio-optical properties of oceanic waters: A reappraisal,”. J. Geophys. Res. 106, 7163–7180. doi: 10.1029/2000JC000319
Mueller J. L., Morel A., Frouin R., Davis C., Arnone R., Carder K., et al. (2003). “Radiometric measurements and data analysis protocols,” in Ocean Optics Protocols For Satellite Ocean Color Sensor Validation. Eds. Mueller J. L., Fargion G. S., McClain C. R.. (USA: USA)
QiDong C. (2014). Remote sensing study on typical reef corals and their growth status in Xisha Island (Sun Yat-sen University).
Soriano-González J., Urrego E. P., Sòria-Perpinyà X., Angelats E., Alcaraz C., Delegido J., et al. (2022). Towards the combination of C2RCC processors for improving water quality retrieval in inland and coastal areas. Remote Sens. 14(5), 1124. doi: 10.3390/rs14051124
Steinmetz F., Deschamps P.-Y., Ramon D. (2011). Atmospheric correction in presence of sun glint: application to MERIS. Opt. Express 19, 9783–9800. doi: 10.1364/OE.19.009783
Steinmetz F., Ramon D. (2018). “Sentinel-2 MSI and Sentinel-3 OLCI consistent ocean colour products using POLYMER,” in SPIE Asia-Pacific Remote Sensing, vol. 10778. (SPIE).
Vanhellemont Q. (2019). Adaptation of the dark spectrum fitting atmospheric correction for aquatic applications of the Landsat and Sentinel-2 archives. Remote Sens. Environ. 225, 175–192. doi: 10.1016/j.rse.2019.03.010
Vanhellemont Q., Ruddick K. (2015). Advantages of high quality SWIR bands for ocean colour processing: Examples from Landsat-8. Remote Sens. Environ. 161, 89–106. doi: 10.1016/j.rse.2015.02.007
Vanhellemont Q., Ruddick K. (2018). Atmospheric correction of metre-scale optical satellite data for inland and coastal water applications. Remote Sens. Environ. 216, 586–597. doi: 10.1016/j.rse.2018.07.015
Wang L., Yu K., Zhao H., Zhang Q. (2014). Economic valuation of the coral reefs in South China Sea. Trop. Geogr. 34, 44–49.
Warren M. A., Simis S. G. H., Martinez-Vicente V., Poser K., Bresciani M., Alikas K., et al. (2019). Assessment of atmospheric correction algorithms for the Sentinel-2A MultiSpectral Imager over coastal and inland waters. Remote Sens. Environ. 225, 267–289. doi: 10.1016/j.rse.2019.03.018
Wei J., Lee Z., Garcia R., Zoffoli L., Armstrong R. A., Shang Z., et al. (2018). An assessment of Landsat-8 atmospheric correction schemes and remote sensing reflectance products in coral reefs and coastal turbid waters. Remote Sens. Environ. 215, 18–32. doi: 10.1016/j.rse.2018.05.033
Wettle M., Brando V. E., CSIRO. Land and Water. (2006). SAMBUCA: Semi-Analytical Model for Bathymetry, Un-mixing and Concentration Assessment (CSIRO Land and Water).
Windle A. E., Evers-King H., Loveday B. R., Ondrusek M., Silsbe G. M. (2022a). Evaluating atmospheric correction algorithms applied to OLCI sentinel-3 data of Chesapeake Bay waters. Remote Sens. 14, 1881. doi: 10.3390/rs14081881
Windle A. E., et al. (2022b). Evaluating atmospheric correction algorithms applied to OLCI sentinel-3 data of Chesapeake Bay waters. Remote Sens. doi: 10.3390/rs14081881
Yan N., Sun Z., Huang W., Jun Z., Sun S. (2023). Assessing Landsat-8 atmospheric correction schemes in low to moderate turbidity waters from a global perspective. Int. J. Digital Earth 16, 66–92. doi: 10.1080/17538947.2022.2161651
Zhang M., Hu C., Cannizzaro J., English D., Barnes B., Carlson P., et al. (2018). Comparison of two atmospheric correction approaches applied to MODIS measurements over North American waters. Remote Sens. Environ. 216, 442–455. doi: 10.1016/j.rse.2018.07.012
Zhang M., Hu C., Barnes B. B. (2019). Performance of POLYMER atmospheric correction of ocean color imagery in the presence of absorbing aerosols. IEEE Trans. Geosci. Remote Sens. 57, 6666–6674. doi: 10.1109/TGRS.36
Zhang M., Hu C. (2020). Evaluation of remote sensing reflectance derived from the sentinel-2 multispectral instrument observations using POLYMER atmospheric correction. IEEE Trans. Geosci. Remote Sens. 58, 5764–5771. doi: 10.1109/TGRS.36
Keywords: atmospheric correction (AC), sentinel-2 MSI, coral reefs, optically shallow water, sunglint correction
Citation: Huang W, Zhao J, Li M, Lou Q, Yan N and Sun S (2025) Assessment of atmospheric correction methods in MSI imagery for deriving bathymetry and substrates of shallow-water coral reefs. Front. Mar. Sci. 12:1495793. doi: 10.3389/fmars.2025.1495793
Received: 13 September 2024; Accepted: 13 January 2025;
Published: 10 February 2025.
Edited by:
Mhd. Suhyb Salama, University of Twente, NetherlandsReviewed by:
Shengqiang Wang, Nanjing University of Information Science and Technology, ChinaIan Somlai-Schweiger, German Aerospace Center (DLR), Germany
Copyright © 2025 Huang, Zhao, Li, Lou, Yan and Sun. This is an open-access article distributed under the terms of the Creative Commons Attribution License (CC BY). The use, distribution or reproduction in other forums is permitted, provided the original author(s) and the copyright owner(s) are credited and that the original publication in this journal is cited, in accordance with accepted academic practice. No use, distribution or reproduction is permitted which does not comply with these terms.
*Correspondence: Shaojie Sun, c3Vuc2hqN0BtYWlsLnN5c3UuZWR1LmNu