 Thuy Thi Thanh Pham
 Claire W. Armstrong
 Hiroko Kato Solvang2
- 1Norwegian College of Fishery Science, UiT – The Arctic University of Norway, Tromsø, Norway
- 2Marine Mammal Group, Institute of Marine Research, Bergen, Norway
- 3Ecosystem Process Group, Institute of Marine Research, Bergen, Norway
This study aims to investigate the risks posed by climate change and anthropogenic activities on ecosystem services in the Barents Sea, Norway. Using an expert assessment approach, we identify which ecosystem services are at high risk and the human activities and pressures contributing to these risks. The findings indicate that risks vary across ecosystem services, activities, and pressures; however, most are categorized as medium or low. Biodiversity, as a cultural service, and fish/shellfish, as a provisioning service, are identified as the two most threatened ecosystem services. In contrast, educational services are perceived as the least impacted. Temperature change is found to have the greatest impact on the services. Experts are generally uncertain about the risk levels; however, fish/shellfish and biodiversity are the two services associated with the least uncertainty. The results highlight the limited knowledge regarding risks to ecosystem services in the Barents Sea. The study emphasizes the need for future research to address these knowledge gaps and discusses where management efforts should be focused.
1 Introduction
Reducing risks to ecosystems from climate change and anthropogenic activities is one of the major challenges of the twenty-first century. The risks posed by climate change to species and ecosystems have cascading effects on aquatic production and on social and cultural systems closely linked to the aquatic environments (Cooley et al., 2022; Campbell et al., 2016). In addition, severe impacts of anthropogenic activities on marine ecosystems have also been detected (Helle et al., 2020; Halpern et al., 2019; O’Hara et al., 2021), which, in combination, may have severe consequences for human communities. Ecosystem-based management (EBM) is advocated as a holistic approach to managing human interactions with ecosystems, with risk assessment being a crucial component to evaluate trade-offs and prioritize issues for management.
Risk assessments have broad applications across various fields. In marine resource management, they can assist in evaluating the risks associated with climate change (e.g., Hare et al., 2016) and other human drivers (e.g., Armstrong et al., 2019), and inform management to avoid critical stock levels (e.g., Patrick et al., 2010). The concept of risk assessment has evolved from understanding how individual risks affect ecosystems to more recent efforts to understand the impact of multiple stressors on a regional to global scale (Halpern et al., 2008; Gissi et al., 2021).
While risk assessments related to ecosystems are becoming more common, very few have been carried out in relation to marine ecosystem services (Armstrong et al., 2019; Gissi et al., 2021; Cooley et al., 2022). Although the demand for ecosystem service input into marine spatial planning is increasing (Ntona and Morgera, 2018), there remains a knowledge gap regarding ecosystem services. This gap is partly due to the concept being relatively young (MEA, 2005) and the lack of clarity around who qualifies as experts to assess these services. An important question is how this increased demand can be met, especially on a blue planet increasingly affected by anthropogenic pressures and resource extraction (Jouffray et al., 2020).
It is also important to note that many risk assessments often overlook crucial elements, such as the assessment of certainty. This omission weakens their reliability and may undermine the “science-based” decisions they are intended to inform. A substantial body of literature has raised concerns about the robustness of risk assessments, particularly in the context of ecosystem services, and emphasized the need to address the issue of certainty (Schägner et al., 2013; Gissi et al., 2021; Jones et al., 2018). Seppelt et al. (2011) pointed out that only one-third of the assessments studied considered certainty, even in the most basic manner. This suggests that certainty assessments remain inadequately addressed in the field of ecosystem services.
This study aims to identify the human activities, pressures, and ecosystem services connected to risk in the Barents Sea. Specifically, we consulted scientific and management expertise related to the Barents Sea to assess the activities and pressures at risk, as well as the ecosystem services affected. Additionally, we examined certainty to determine whether a lack of understanding regarding likelihood and effect results from insufficient knowledge or from a well-understood probabilistic process. Risk assessments can be conducted using various approaches, including qualitative (e.g., Fletcher, 2005; Doubleday et al., 2013), semiquantitative (e.g., Allison et al., 2009), quantitative (e.g., Okey et al., 2015), or a combination of these methods. Holsman et al. (2017) provided an overview of the diverse analytical frameworks used for ecosystem risk assessment. While the quantitative method can generalize whether the risks are statistically significant, the qualitative approach, which primarily relies on expert opinion, enables a deeper analysis of the potential quantitative results.
In this study, we adopt a mixed-method approach. Specifically, qualitative analysis is used to assess risks based on expert judgments regarding various human activities and pressures in the Barents Sea. In addition, quantitative analysis tests the significance of risk ranking differences between services, activities, and pressures. The results show that the risks differ across ecosystem services, pressures, and activities, though most are classified as medium or low. The most threatened ecosystem services are fish/shellfish, as a provisioning service, and biodiversity, as a cultural service. Temperature change has the most significant impact on these ecosystem services. The study also discusses which combinations of risk and certainty levels should be prioritized in management strategies, e.g., focusing on services with high risk and high certainty, or high risk and low certainty.
2 Materials and methods
2.1 Identification of ecosystem services, human activities, and pressures—conceptual framework
To identify human activities, pressures, and ecosystem services relevant to risk assessment, we proposed the Driver–Activities–Pressures–State–Impact (Welfare)–Response (Measure) (DAPSI(W)R(M)) framework alongside the UN Common International Classification of Ecosystem Services (CICES) framework. The DAPSI(W)R(M) framework provides a basis for selecting pressures and activities, and for establishing causal links between these activities, pressures, and the ecosystem studied. In contrast, the CICES framework helps classify the ecosystem services impacted by these activities and pressures.
The DAPSI(W)R(M) framework is a recent and widely recommended conceptual model for marine EBM (Elliott et al., 2017). It refines the Driver–Pressure–State–Impact–Response (DPSIR) approach by addressing key limitations, enabling the identification of more holistic management strategies that can address the linkages between various environmental problems and their associated drivers and pressures (Cooper et al., 2013; Atkins et al., 2011). Within the DAPSI(W)R(M) framework, drivers refer to societal drivers that are related to basic human needs, such as food, energy, and security. These drivers lead to activities (A)—human intervention—that generate pressures, which are the mechanisms of change. These pressures, in turn, cause alterations in the state (S) of the natural system, resulting in certain impacts (I) (on welfare) on the social system that prompt various responses (measures), such as prevention, mitigation, compensation, or other initiatives. Examples of pressures in a marine context include pollution, climate change, and invasive species. The I (on welfare) are measured here as the risk associated with changes in the state of the environment affecting both biotic and abiotic ecosystem services. For the pragmatic application of DAPSI(W)R(M) in this study, we made some simplifications. First, we defined the overall health of the marine ecosystem as the sole indicator of the state. Second, we focused on identifying human activities and natural pressures that can be clearly observed and are indisputable, rather than considering all societal needs of drivers, which may be disputable. Third, we prioritized negative impacts in this study, as these are often highlighted and receive significant attention due to their urgency and the need for intervention. In contrast, positive impacts may be uncertain or difficult to quantify, which presents challenges in establishing causation and thus falls outside the scope of this study.
Ecosystem services were first broadly introduced by the Millennium Ecosystem Assessment (MEA) and defined as “the benefits that people obtain from ecosystems”, both natural and managed (MEA, 2005). These services are categorized into provisioning, regulating, cultural, and supporting services. The first three categories have a direct impact on human well-being, while the latter has an indirect impact by supporting provisioning, regulating, and cultural services. Since its release, the MEA has served as a conceptual framework identifying, classifying, and quantifying ecosystem services (ESs) (Armstrong et al., 2012; Costanza et al., 2017; Fisher et al., 2009). Other more recent frameworks, including The Economics of Ecosystems and Biodiversity (TEEB) (TEEB, 2010), the CICES (CICES, 2013), and the Intergovernmental Platform on Biodiversity and Ecosystem Services (IPBES) (IPBES, 2017), have been developed to differentiate, structure, and provide the basis for evaluating ecosystem services (Thurber et al., 2014). To some degree, these frameworks critique the MEA framework, particularly with regard to the inclusion of both direct and indirect services, which may create the potential for double counting values.
We applied the CICES framework (Haines-Young, 2023) because it represents an important step forward compared to earlier classifications provided by MEA (MEA, 2005) and TEEB (TEEB, 2010). First, in CICES, ESs are defined as the contributions ecosystems make to human well-being, distinct from the goods and benefits people derive from them. This framework emphasizes identifying both the purposes and uses people have for the different kinds of ESs. Second, supporting services are excluded from the classification to avoid the issue of “double counting” when linking ecosystem and economic accounts. Third, CICES distinguishes between ESs that depend on living systems (i.e., biophysical ecosystem outputs) and those that involve nonliving (abiotic) parts of ecosystems, which also contribute to human well-being (geophysical ecosystem outputs). The framework also facilitates a clearer identification of the different service categories and their coverage. For this study, we defined and classified all the biotic and abiotic services examined, focusing on the class level of the CICES framework.
2.2 Risk and certainty assessment
Risk matrices are widely adopted structures for risk assessment in marine ecosystem-based management (Cox, 2008). They are commonly used to provide a ranking framework for visualizing and prioritizing risks, guiding resource allocations in a convenient and efficient manner. Different concepts of risk have been discussed in recent years to address the complex interactions and uncertainties associated with climate change and human activities (Oppenheimer et al., 2015; Field et al., 2012; Hobday et al., 2011). In the most common definition, risk is the product of likelihood and effect. Specifically, risk is typically seen as the product of (1) the likelihood that an event will occur, and (2) the effect that event may have. However, recent literature emphasizes the potential pitfalls of the risk matrix, such as risk rating, limitations in resolution, and the possibility of errors (Cox, 2008). Additionally, the risk matrix establishment process often fails to account for the risk attitudes of decision-makers (Ruan et al., 2015; Kaya et al., 2019). Therefore, risk should be viewed as a multivariate construct rather than a scalar. Furthermore, to evaluate risk in a more comprehensive manner, it is recommended that it be viewed in a way that integrates risk attitudes based on utility theory (Ruan et al., 2015).
In this study, we have nonetheless chosen to use the risk matrix method for several reasons. First, despite its limitations, this approach is still widely applied in many fields (Cox, 2008; Duijm, 2015). Second, assessing risk based on utility theory may also be problematic due to what is commonly known as the Allais paradox (Allais, 1953). For instance, people may not always make rational decisions, i.e., based on their utility, but may instead be influenced by cognitive biases that affect their perception of risk (Zhang et al., 2022). This is due to social and cultural relationships, meaning that the opinions of others can influence one’s choices (Nick et al., 2019).
We designed the risk matrix based on the principles of weak consistency, betweenness, and consistent coloring, as recommended in more recent literature (e.g., Cox, 2008; Li et al., 2018). Solutions for addressing limitations such as poor resolution, range compression, and ranking reversal errors, which aim to minimize their impacts, are also considered (Figure 1). In addition, we ensure that all risk values associated with higher-rated cells are quantitatively greater than those in lower-rated cells. To avoid the issue of scalar risks, we present risk as a graphical combination of likelihood and effect, offering a more comprehensive understanding of the risks involved.
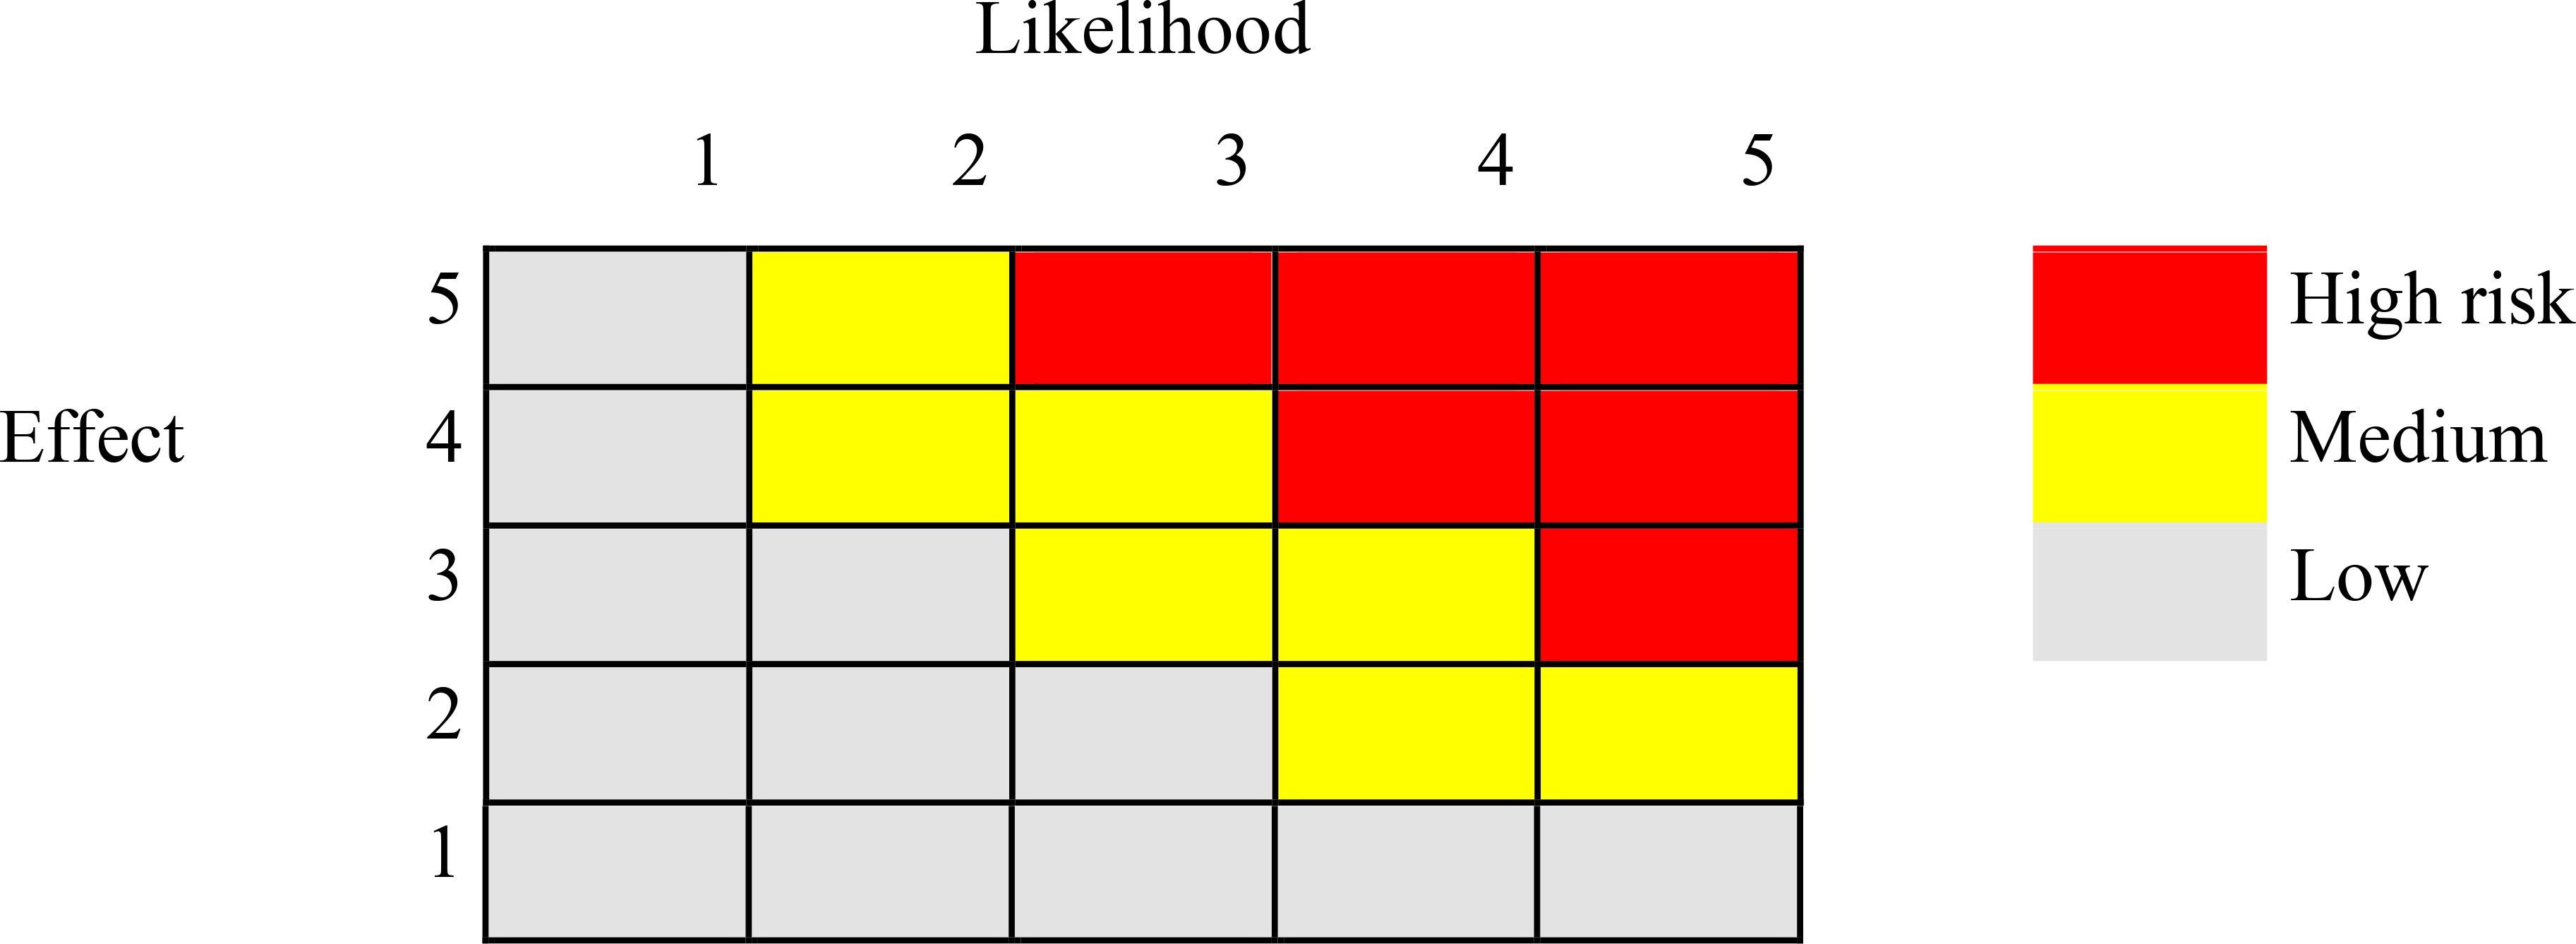
Figure 1. Risk matrix.
In recent years, there has been increased emphasis on uncertainties concerning risk assessment and management (Brown and Cox, 2011; Aven and Zio, 2011). Criticisms have been directed at the traditional probabilistic approach to risk assessment and management due to its limited scope in addressing risk and handling uncertainties. As proposed by Aven (2017), the general framework for risk description should encompass three components: effect (E), likelihood (L), and background knowledge (K), upon which both E and L are based. This approach to describe risk allows for all types of uncertainty representations and could serve as a basis for a unified perspective on uncertainties within the context of risk assessment.
Following this recommendation, we conduct a certainty assessment in addition to the risk assessment for the study. This allows us to examine whether the lack of effect and likelihood arises from insufficient knowledge (uncertainty) or from a well-understood probabilistic process (risk). Certainty is assessed in the same manner as the risk assessment, i.e., based on experts’ judgment using a Likert scale ranging from very uncertain (1) to very certain (5) for all the drivers and ecosystem services.
Despite the growing recognition of the importance of describing uncertainty in risk assessment, there remains a scarcity of practical proposals for assessing uncertainty in relation to risk. One alternative qualitative approach is visualizing uncertainty in risk diagrams, which includes concepts such as the family of risk curves (e.g., Kaplan and Garrick, 1981), uncertainty boxes in probability-consequence diagrams (e.g., Duijm, 2015), and bubble diagrams (e.g., Abrahamsen and Aven, 2011). Recent recommendations favor the use the three-dimensional PCD-PISEA visualization (probability-consequence diagrams with prediction intervals and strength-of-evidence assessments). This method incorporates three dimensions: (i) the assigned likelihood for event occurrence (L), (ii) a prediction for the effect given the occurrence of events (E), and (iii) a measure of the strength of evidence upon which the likelihood and effect assignments are based (K). Here, we propose a three-dimensional visualization using a spider web diagram for judgment. Furthermore, we investigate whether certainty levels for ranking risk between services and between drivers differ significantly from each other. To do this, we perform a pairwise Wilcoxon signed-rank test with two types of correction for multiple testing: Bonferroni correction and False Discovery Rate (FDR). While Bonferroni’s correction is conservative, FDR helps avoid false-positive outcomes. This approach is appropriate because the assumption of a normal distribution is not met for the data.
2.3 Barents sea region
The Barents Sea region is a high-latitude shelf ecosystem situated north of Norway and Russia (Figure 2). It covers an area of approximately 1.6 million km2 and has an average depth of around 230 m. The region hosts a wealth of resources, including oil and gas, minerals, and some of the largest fish stocks in the world. With 5.1 million people living around the Barents Sea and extensive international trade and tourism, a broad range of human activities take place in this region.
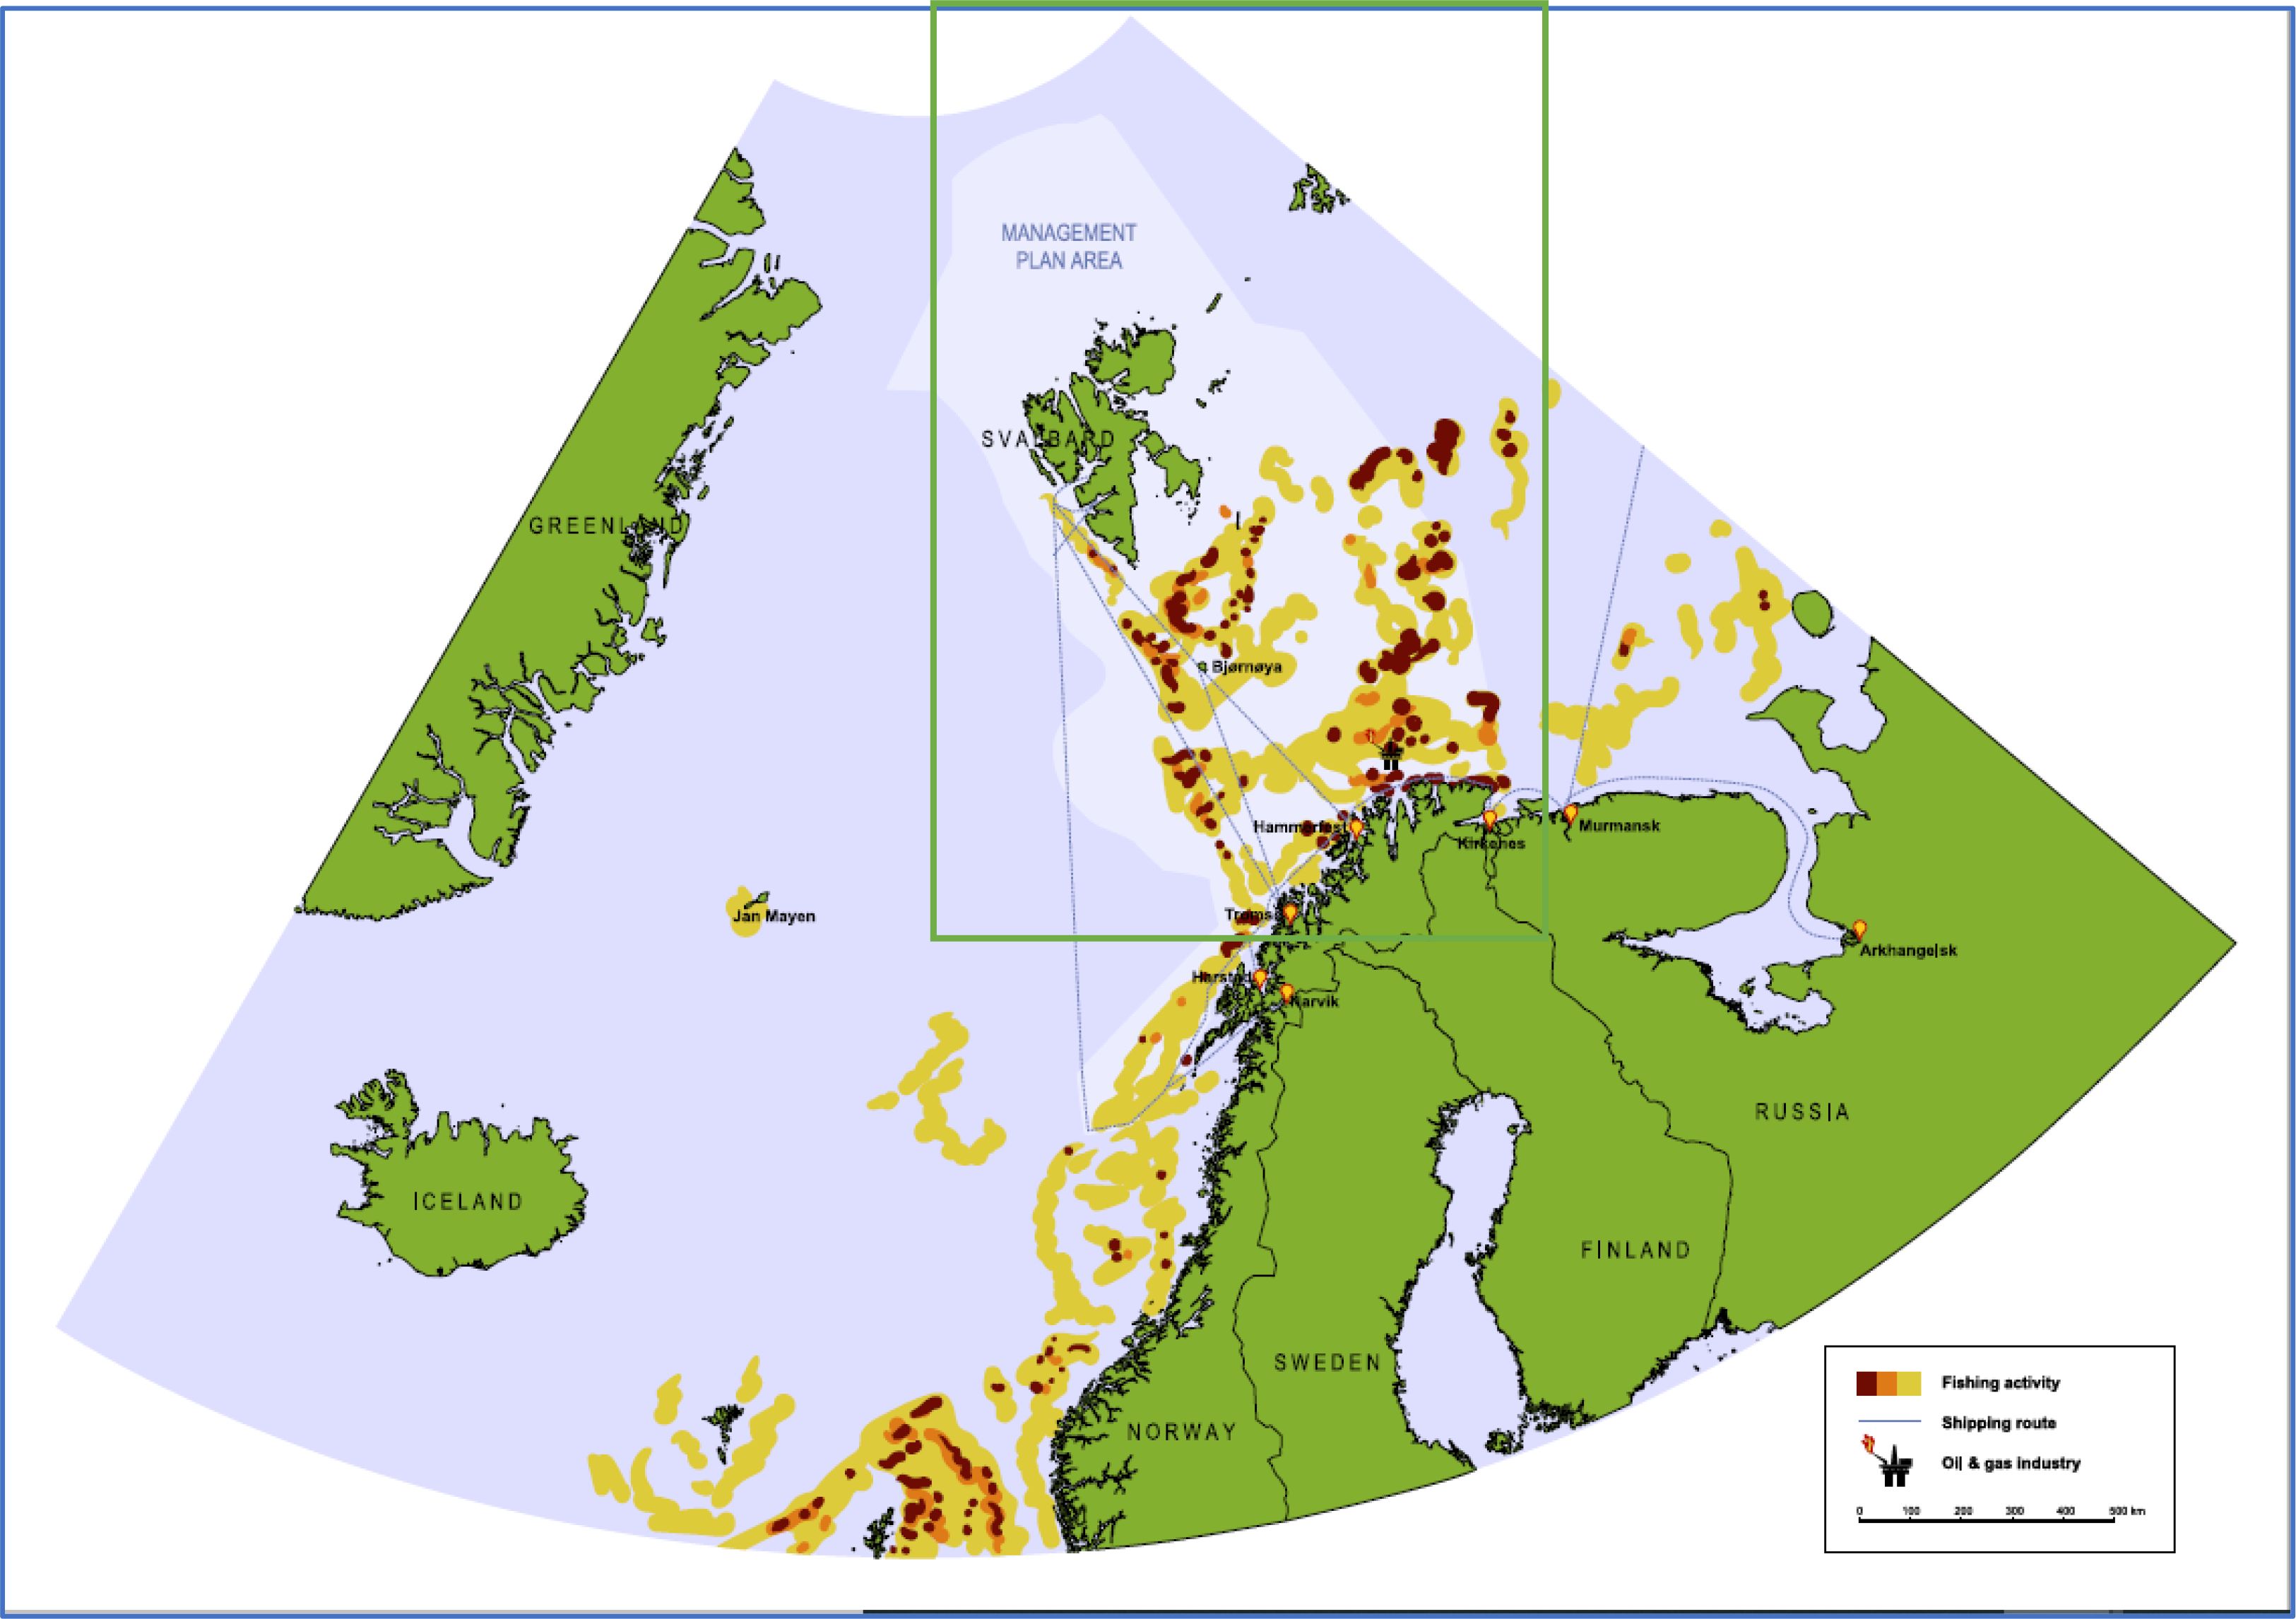
Figure 2. Barents Sea region (the green square).
The management plan for the Barents Sea was first presented as a white paper titled Integrated Management of the Marine Environment of the Barents Sea and the Sea Areas off the Lofoten Islands (Report No. 8 (2005–2006) to the Storting) (The Royal Norwegian Ministry of the Environment, 2006). This plan has since been revised, with the most recent update in 2011, in the white paper First update of the Integrated Management Plan for the Marine Environment of the Barents Sea–Lofoten Area (Meld. St. 10 (2010–2011) Report to the Storting) (Norwegian Ministry of the Government (2012)). The plan consolidates existing and new knowledge about the main activities, pressures, ecosystems, and services, as well as trends in regional risks. The main activities and pressures in the Barents Sea were also summarized in The Professional Forum for Norwegian Marine Areas (2023).
Accordingly, primary activities in the Barents Sea include fishing, tourism, oil and gas, and shipping. The region is regarded as one of the most productive fishing areas in the world, home to major commercial species such as cod, haddock, and capelin. It is also rich in hydrocarbons, leading to increased oil and gas exploration and extraction activities. This includes drilling operations, seismic surveys, and the establishment of offshore platforms, all of which have raised environmental concerns due to increased pollution, noise, and the risk of accidental spills. As climate change reduces ice coverage, the Barents Sea is becoming more accessible for both petroleum activities and shipping routes. Increased shipping traffic, including cargo vessels and cruise ships, poses potential risks to marine ecosystems (e.g., pollution, vessel noise, accidental spills) and safety. Invasive species, such as the king crab and snow crab, have also been recognized in the region (Husa et al., 2022).
The Barents Sea provides numerous ecosystem services, including the supply of seafood and oil and gas resources, which are vital for local and regional economies. The region plays an important role in climate regulation, carbon sequestration, and water purification (Rogge et al., 2023; Smedsrud et al., 2013). It is also significant for cultural identity, both locally and nationally, and supports educational and research opportunities that enhance public awareness of marine conservation.
However, the region is also impacted by global stressors, such as climate change and long-range pollution. Climate change is evident in the Barents Sea through rising sea temperatures, which alter the distribution, growth rates, and reproductive cycles of marine species. Shrinking ice cover affects habitat availability for ice-dependent species, leading to shifts in food webs and ecological dynamics (Cooley et al., 2022; Mikkelsen et al., 2023). Pollutants, including heavy metals, microplastics, and organic contaminants, are increasingly entering the Barents Sea due to local activities and long-range atmospheric transport. These pollutants threaten marine life and can accumulate in the food chain, posing health risks for humans who depend on marine resources (Frantzen et al., 2022).
2.4 The survey
The survey was conducted by collecting experts’ opinions to identify relevant human activities, pressures, and ecosystem services at risk in the Barents Sea, followed by an evaluation of the risks posed by these different pressures and activities on the ecosystem services. The survey was developed specifically for this case, though it was based on a previous Atlantic Ocean deep-sea ES risk assessment (Armstrong et al., 2019).
2.4.1 Step 1: Identification of human activities, pressures, and ESs in the Barents Sea
Scientists involved in this task within the BarentsRISK project (Grant Number: RCN #288192), drawing on the literature review, their knowledge, and expertise, compiled a list of relevant human activities, pressures, and ESs in the Barents Sea, using the DAPSI(W)R(M) framework as the foundation. The following documents were particularly important when identifying the list: the management plan of the Barents Sea presented in the white paper submitted to the Norwegian government in 2006 (The Royal Norwegian Ministry of the Environment, 2006), the summary report on main activities and pressures in the Barents Sea by The Professional Forum for Norwegian Marine Areas (2023), and the recently published article on stakeholders’ perspectives concerning the Barents Sea ecosystem (Mikkelsen et al., 2023). This list was then presented to all the experts in the BarentsRISK project consortium during a face-to-face workshop. At the workshop, the concepts of ecosystem services, human activities, and pressures were introduced for reference. The participants then reviewed and discussed the list of ongoing activities, pressures, and ESs that apply to the Barents Sea. Reaching a consensus on the activities and pressures was relatively straightforward. This may be attributed to the fact that most participants were natural scientists working in the Barents Sea, with expertise in studying issues related to pressures and activities. Additionally, the management plan for the Barents Sea, presented as a white paper to the Norwegian parliament, provided valuable guidance. In contrast, achieving consensus on ecosystem services was more challenging, as several ecosystem service concepts are more familiar to social scientists than to natural scientists. Ultimately, we did not reach a definitive conclusion on the number of ecosystem services identified. Instead, we compiled a list of the main potential ecosystem services that most participants agreed upon and introduced a category labeled “Others” for participants to fill out, accommodating differing viewpoints.
Tables 1, 2 present a summary of the activities, pressures, and ESs identified for the Barents Sea, as agreed upon by the stakeholders involved in the workshops. A total of three human activities, three pressures, and 11 ESs were identified.
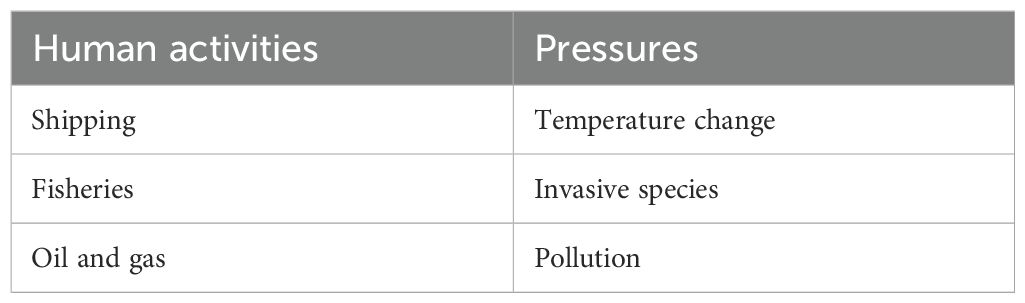
Table 1. Human activities and pressures identified in the Barents Sea region.
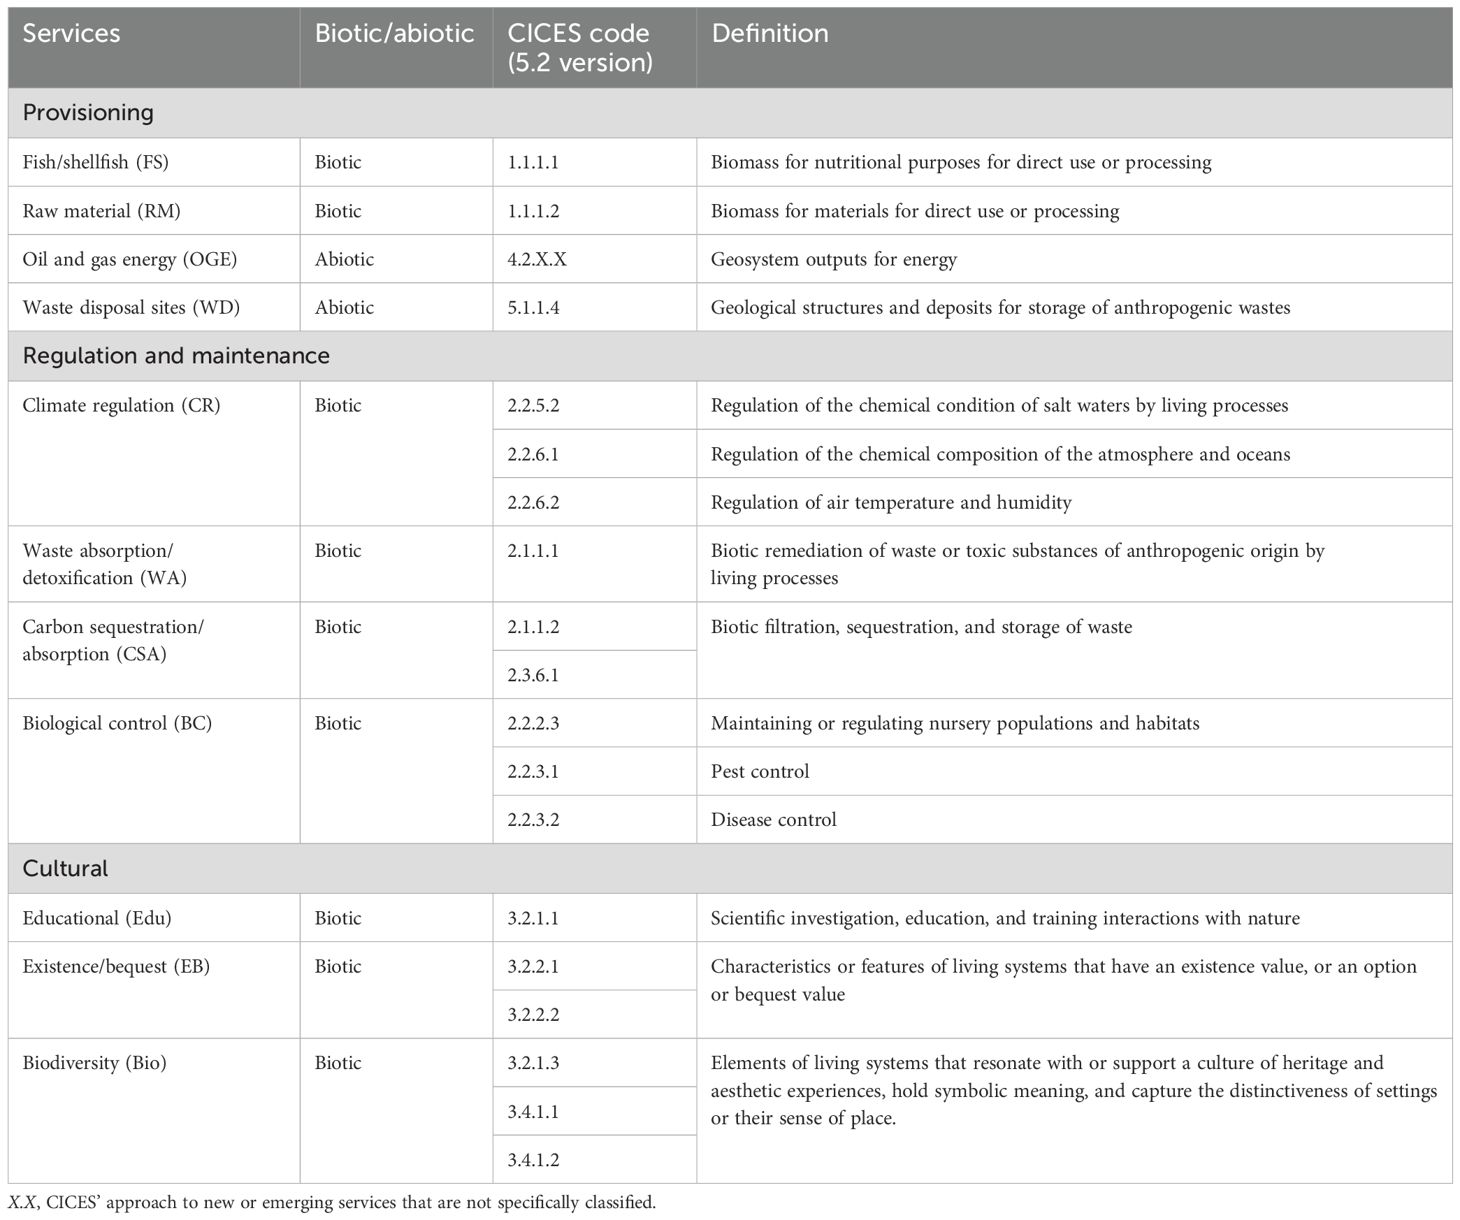
Table 2. Biotic and abiotic services impacted by human activities and pressures in the Barents Sea region (abbreviations in parentheses), based on the CICES framework.
The identified human activities are fisheries, oil and gas, and shipping, while the three pressures are pollution, invasive species, and temperature change. Fisheries encompass various forms of commercial fishing conducted in the Barents Sea. Oil and gas activities refer to operations related to the exploration, exploitation, and installation of associated infrastructure and carbon sequestration storage. Shipping includes the movement of vessels at sea, including the transport of people, goods, and freight within the marine environment. Temperature change could be due to climate change, thermal discharge, or thermal construction affecting water flow (OSPAR, 2022). Pollution arises from various sources, including organic (substances) or inorganic (the compounds of inorganic by-products). There are also a number of different invasive species in the Barents Sea. While only three pressures and three human activities are listed here, these are broad concepts that cover a range of specific activities and pressures. The generality of the pressures and activities reflects both the survey development process and the need for simplification due to the complexity of the risk elicitation.
The study focuses solely on existing, observable, and indisputable human activities for several reasons. First, this approach minimizes respondent fatigue due to the complexity of the risk elicitation. Second, evaluating existing activities provides insights that can inform assessments of potential impacts from emerging sectors. Understanding the effects of existing activities also lays the groundwork for future risk assessments, allowing these insights to be applied to evaluate new activities.
Consequently, activities that have not yet been undertaken in the Barents Sea or are not addressed in the management plan—such as ocean-based aquaculture, deep-sea mining, and offshore renewable energy—are excluded from consideration. Currently, there are no governmental plans for ocean-based aquaculture. Although the government has opened mining opportunities, these are limited to the Norwegian Sea and Greenland Sea, not the Barents Sea. Offshore wind is currently identified in the southern Barents Sea; however, its development is still far in the future, and the specific areas were not yet defined at the time of our assessment. Although marine biotechnology is occasionally mentioned, it is not seen as a critical issue for the marine environments of the Barents Sea, as in-situ collection is minimal due to the central role of synthetization in producing commercially viable compounds.
The ESs are classified into three main service types: provisioning, regulation and maintenance, and cultural services. Provisioning services include four ESs: fish/shellfish, oil and gas/energy, waste disposal sites, and raw materials. Regulation and maintenance services, which play vital roles in regulating ecological processes and maintaining ecosystem balance, consist of climate regulation, waste absorption, carbon sequestration, and biological control. The cultural services are linked to cultural heritage, including educational services, existence/bequest, and cultural aspects of biodiversity. In CICES, each service is identified by a four-digit code with a hierarchical structure. The first digit identifies the “section” (e.g., provisioning), the second the “division” within this “section” (e.g., biomass), the third the “group” within this “division” (e.g., wild plants for nutrition, materials or energy), and the last the “class” within this “group” (e.g., fibers and other materials from wild plants for direct use or processing), as shown in Table 2. It is highlighted that, although we discussed during the workshops what these services could be in relation to the Barents Sea, we did not explicitly define them in the questionnaire. Our intention was to allow respondents—who are experts in the field—to exercise their own judgment in this regard.
2.4.2 Step 2: Score risks
After the list of activities, pressures, and ESs was established, an Excel sheet survey was developed, in which basic, anonymous information about the respondents was collected (e.g., workplace, expertise, years of work/study). This was followed by a matrix in which assessments of the effect and likelihood of all identified pressures and activities in relation to ecosystem services were filled in. The respondents were asked to base their assessments on a 30-year period leading up to 2050. We also asked respondents to rate their level of certainty regarding each driver and service on a scale from 1 to 5, with 1 representing very uncertain and 5 being very certain. To utilize experts’ knowledge and minimize bias, we designed an “Other” category under each ES type in the survey, allowing participants to add additional ESs if they had perspectives that differed from the group consensus (see the survey in Appendix 1).
To facilitate experts in scoring risks, we conducted six workshops to introduce the concepts of services, pressures, and activities, provided guidance on scoring during the workshops, and offered additional support afterward if respondents had any questions. Some experts filled in the survey during the workshops, while others submitted it later. Additionally, some sent further queries before submitting the surveys. In total, 25 surveys were submitted after the six workshops.
The experts gathered in the workshops included both natural and social scientists, with the majority being natural scientists who possessed extensive experience working in the Barents Sea. In particular, 21 experts had natural science backgrounds, while the remainder had social science backgrounds, The natural scientists had an average of 12 years of work experience in the field, while the social scientists had an average of 7 years. Seventeen experts were from research institutions, six from universities, and two from management.
The external experts were identified using the snowball sampling method, which begins with one or more study participants and continues through referrals from those participants. This method is particularly useful for reaching hard-to-access populations, such as experts with knowledge related to the Barents Sea, particularly those working in management bodies. In total, eight experts were from the project consortium, while 17 were external. Among the external experts, two had a social science background, and 15 had a natural science background (see Table 3). The two managers, both natural scientists, were also from this external group. Although the data may appear unbalanced due to the small number of social scientists, the majority of participants were external to the BarentsRISK consortium. Furthermore, there is a balance in the number of social scientists across both internal and external expert groups, with two in each group. Although the percentage representation differs, with social scientists comprising 25% of the internal group and 11.8% of the external group, this numerical balance was prioritized to facilitate interdisciplinary integration. This approach overcomes, to some extent, the relatively small size of the social science group compared to the natural science group while also leveraging opportunities to involve more social scientists in the survey process. Some services, pressures, and activities were marked as “nonapplicable”. These were given 0 values for both effect and likelihood. Since the lowest effect (1 value-effect) and lowest likelihood (1 value-likelihood) represent very low effect and very low likelihood, it is reasonable to assume a 0 value for both effect and likelihood in nonapplicable cases. Similarly, when a service, pressure, or activity is not applicable, the equivalent certainty may not be identified and is given a 0 value, as the lowest Likert scale measure (1) is defined as very uncertain. For the most part, however, certainty measures were provided by respondents, as these encompass all ESs for each activity and pressure, as well as all activities and pressures for each ES.
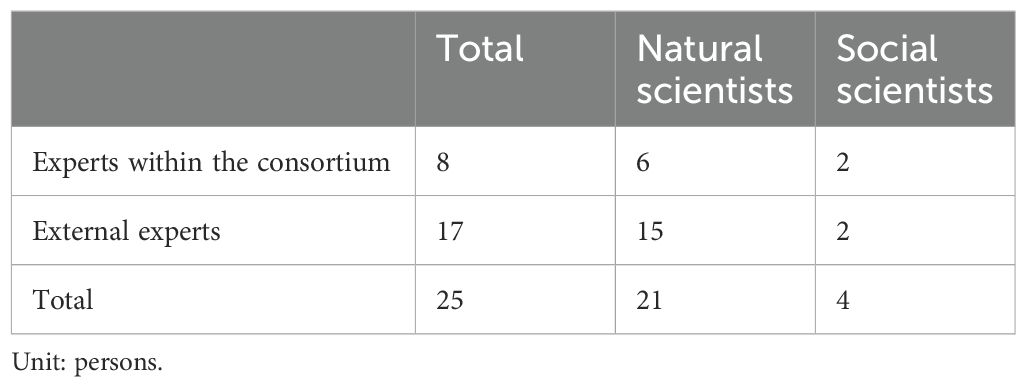
Table 3. Overview of experts who participated in the survey.
3 Results
3.1 Knowledge of respondents
As already mentioned, the data are limited, and there is significant variance in the number of responses for each activity, pressure, and service, making it challenging to compare their likelihood, effect, and consequently, risk levels. We have therefore attempted to assess the lack of response, i.e., the “holes” (or the zero values) in the dataset, to illustrate the differences in knowledge among the respondents across services, activities, and pressures. This is illustrated in Figure 3, which shows a greater number of scored values for the services fish/shellfish and biodiversity, while educational services have more “nonapplicable” values. We also observe that invasives and shipping are marked as “nonapplicable” for most ESs, whereas pollution and temperature change are on the opposite end of the scale.
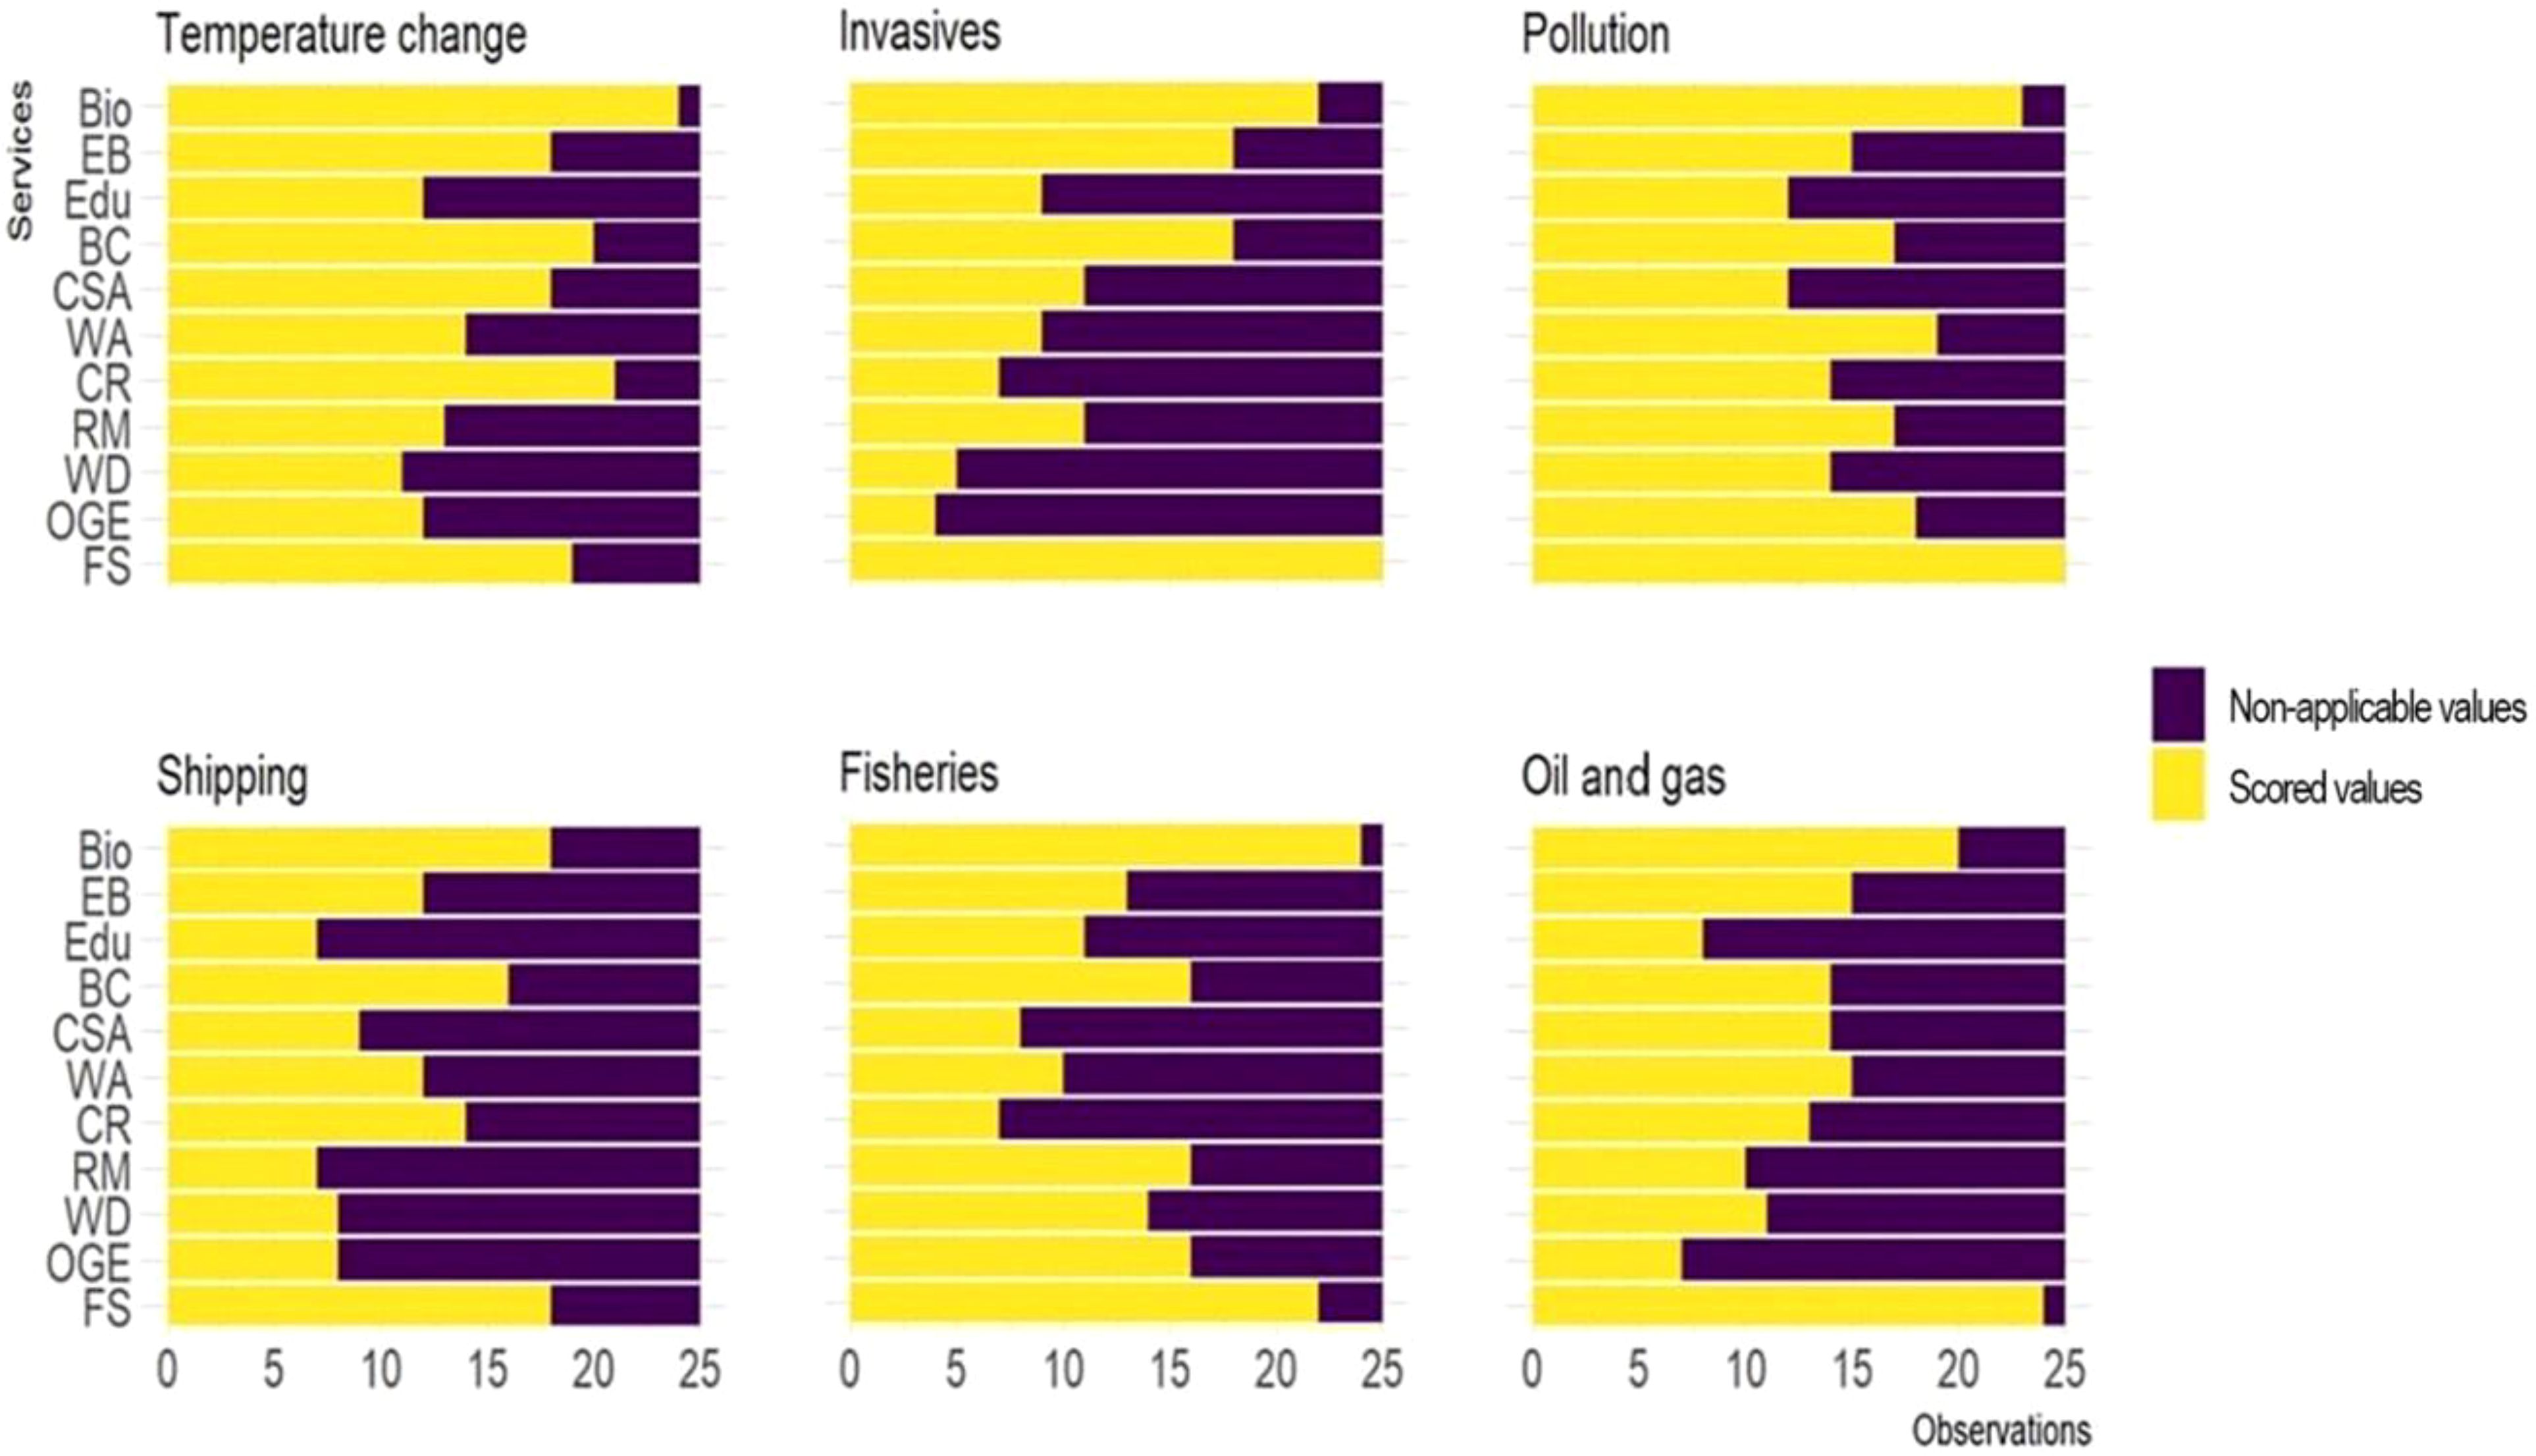
Figure 3. Observations with “nonapplicable” values and scored values.
3.2 Risk to ecosystem services
In the following, we present the results from two forms of risk associated with pressures and anthropogenic activities identified in the Barents Sea: (1) the risk associated with each activity and each pressure (Figure 4) and (2) the risk resulting from each ES (Figure 5). In Figure 4, the general impression is that all pressures and activities generate risks. Although the levels of risk varied among the pressures and activities depending on the ES being assessed, all risks were medium or low. However, some distinct results emerge. For instance, shipping has the lowest variance in risks, whereas temperature change shows the greatest variance overall. Although temperature change is recognized as a medium-risk pressure, changes in temperature poses higher risk levels to a greater number of ESs than other pressures. Meanwhile, pollution poses a medium risk to most ESs and, in some cases, a low risk. The same situation applies to fisheries and oil and gas activities. Shipping is the only activity that places all ESs at a low-risk level.
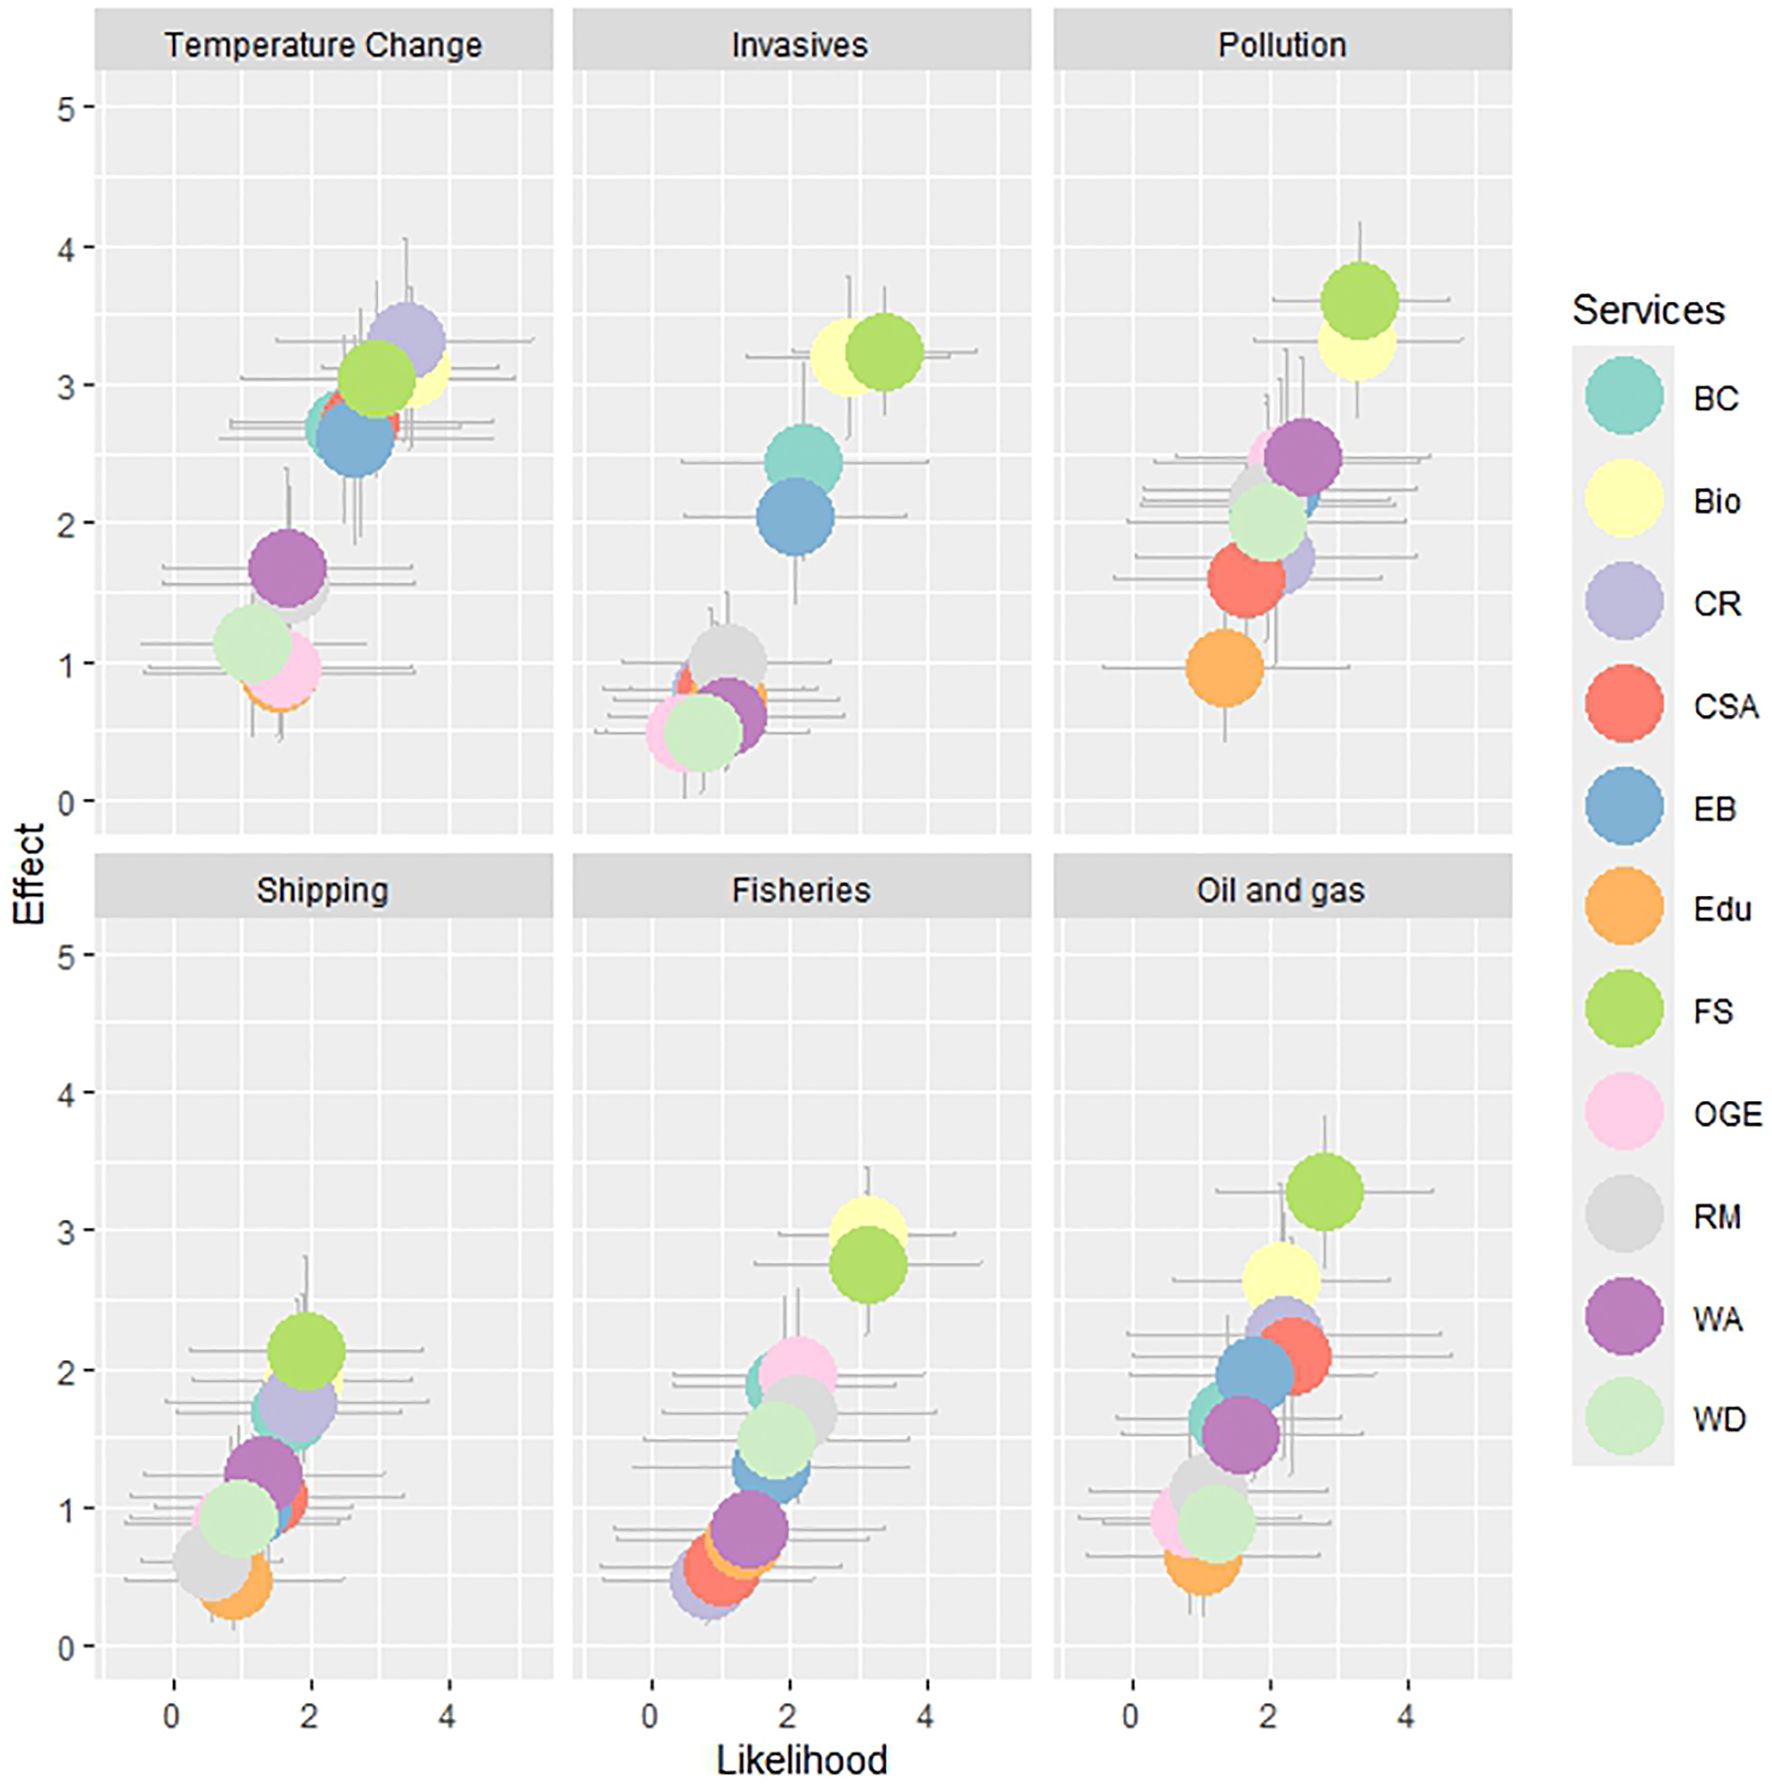
Figure 4. Risks posed by human activities and their pressures on various ecosystem services. The y-axis represents the severity of the effect, ranging from 1 (low severity) to 5 (high severity). The x-axis represents the likelihood of the effect, ranging from 1 (low likelihood) to 5 (high likelihood). The plots display mean values (the median values of effects and likelihoods of all ecosystem services and drivers, along with their corresponding 25th and 75th percentiles, are presented in Appendices 2, 3) with standard deviations.
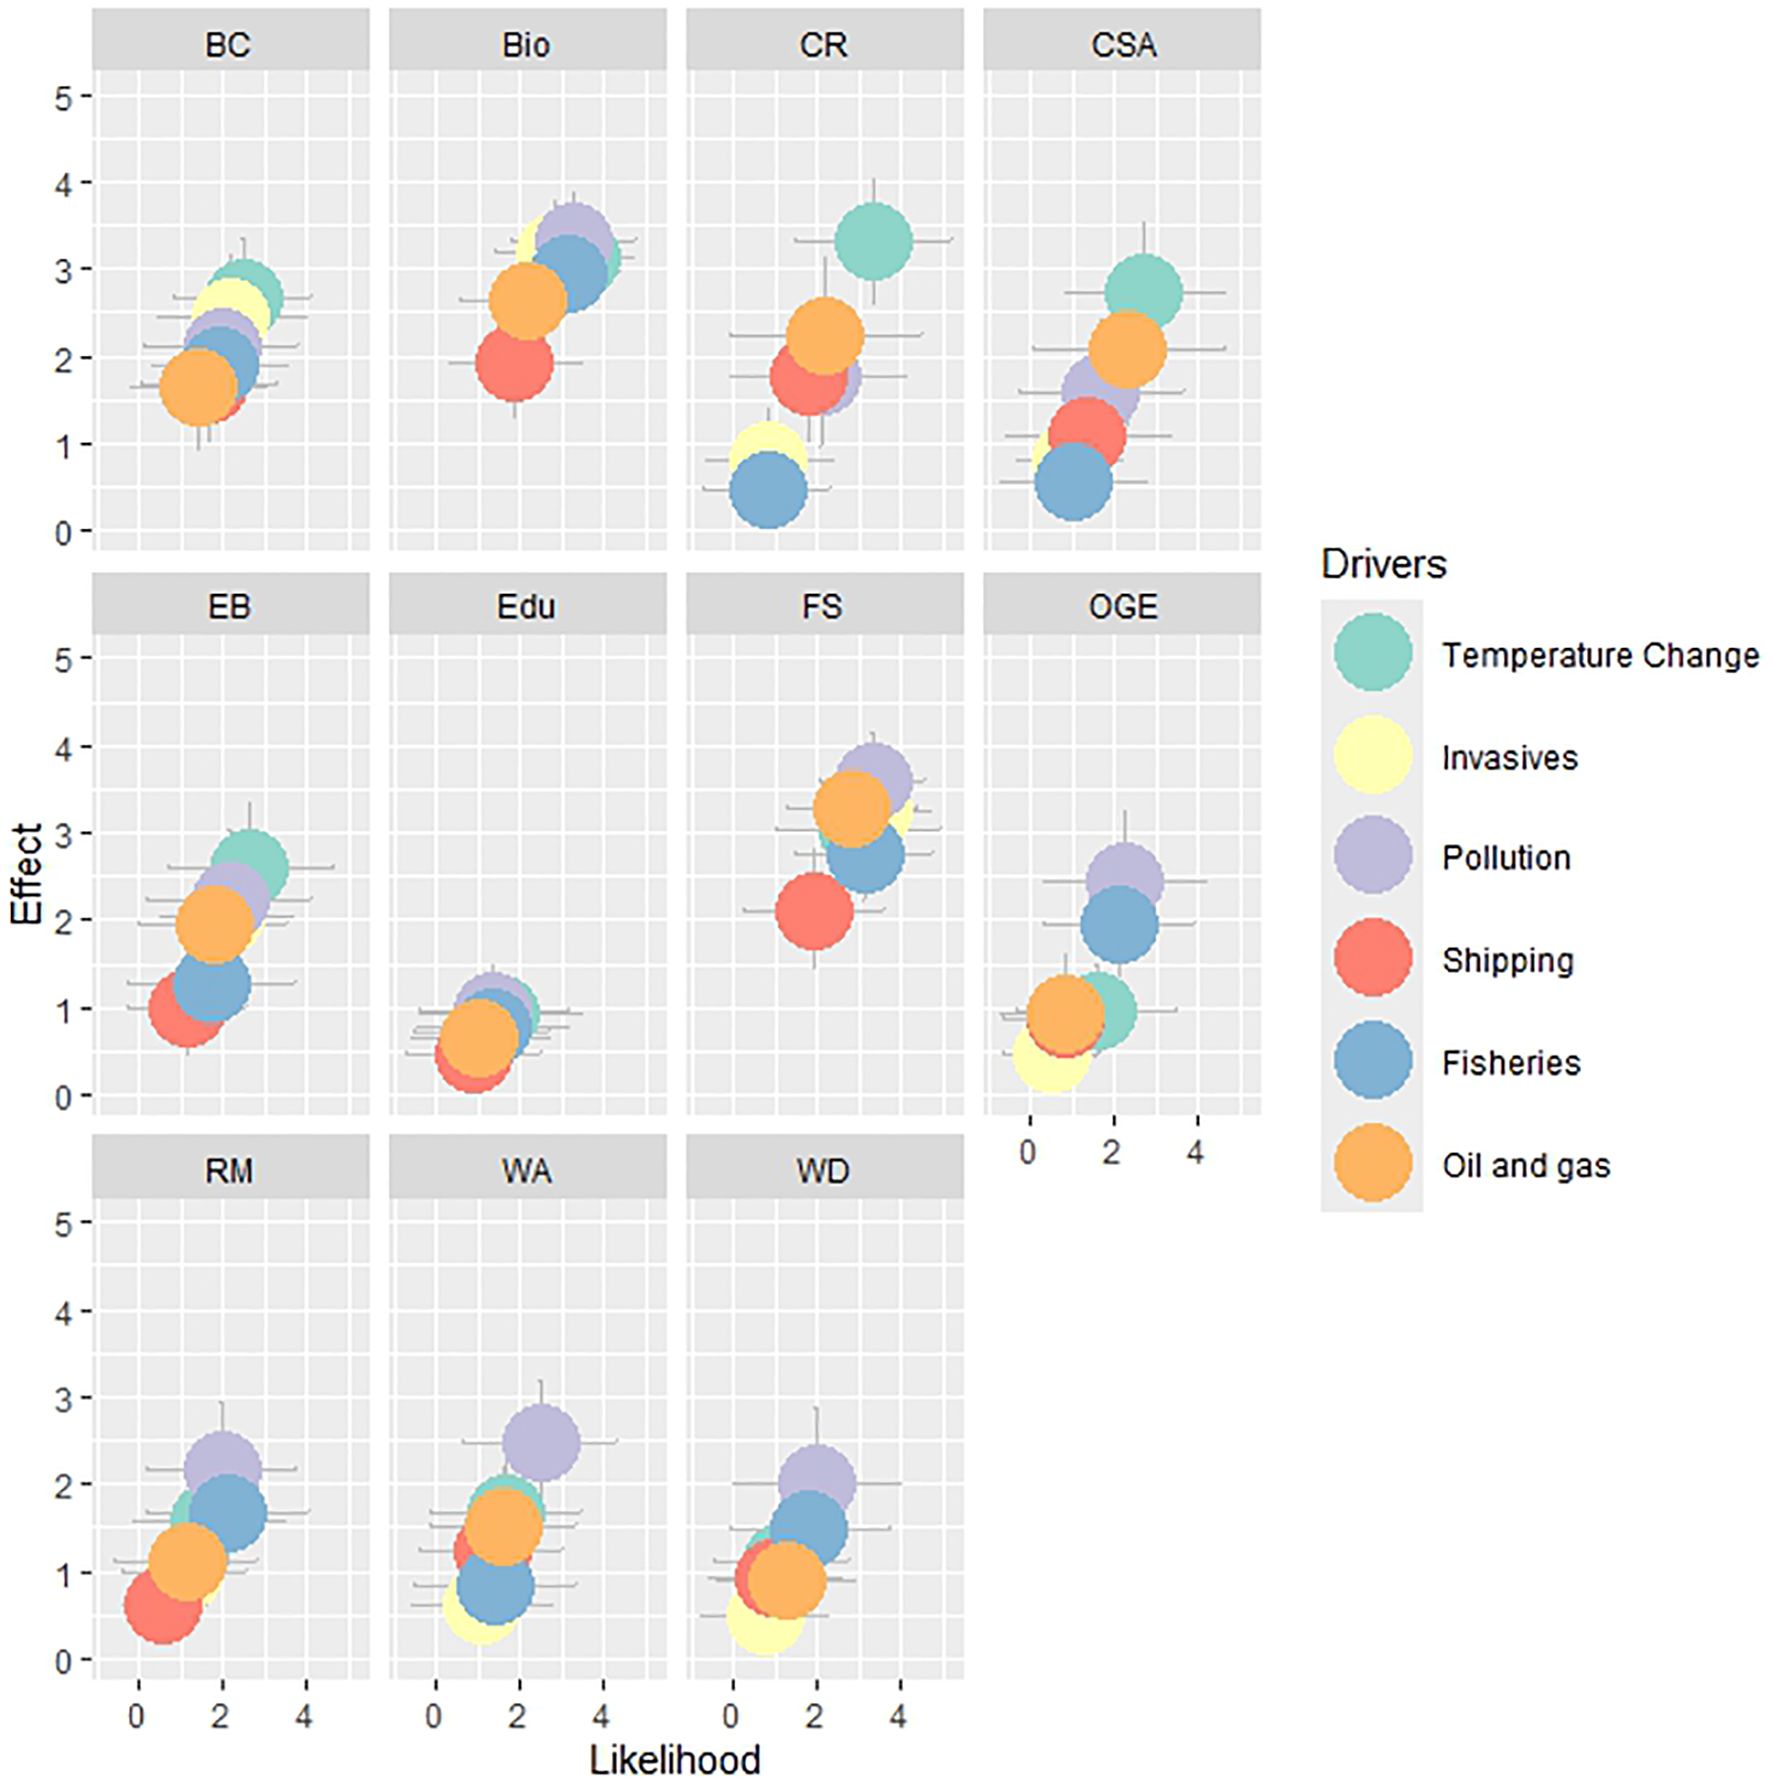
Figure 5. Risk levels for ecosystem services caused by various human activities and pressures. The y-axis represents the severity of the effect, ranging from 1 (low severity) to 5 (high severity). The x-axis represents the likelihood of the effect, ranging from 1 (low likelihood) to 5 (high likelihood). The plots display mean values with standard deviations.
Figure 5 focuses on the services, illustrating that all are at risk of impact from a broad spectrum of activities and pressures; however, the risk levels vary among them. Notably, fish/shellfish and biodiversity services are ranked as the highest-risk services under most activities and pressures. To a lesser degree, biological control, climate regulation, and existence/bequest are also highly ranked, while educational services appear to be much less at risk. Interestingly, perceived risk levels for fish/shellfish from, e.g., pollution are higher than those from fisheries, suggesting that the respondents may have high confidence in fisheries management. However, the difference in risk to fish/shellfish between pollution and fisheries is not statistically significant.
3.3 Certainty of risk assessment
As seen in Figure 6, we observe that all services, pressures, and human activities are perceived at medium certainty on average, with somewhat less certainty associated with ESs compared to the pressures and activities. The mean values differ slightly from the median values in some services/pressures and activities. For instance, all ESs, pressures, and activities have the same certainty mean of 2, with a standard deviation of ± 0.9 for ecosystem services, ± 1.3 for activities, and ± 1.1 for pressures. Meanwhile, the median certainty for ES is 2, while it is 3 for pressures and activities. This is as expected, given that the data are not normally distributed.
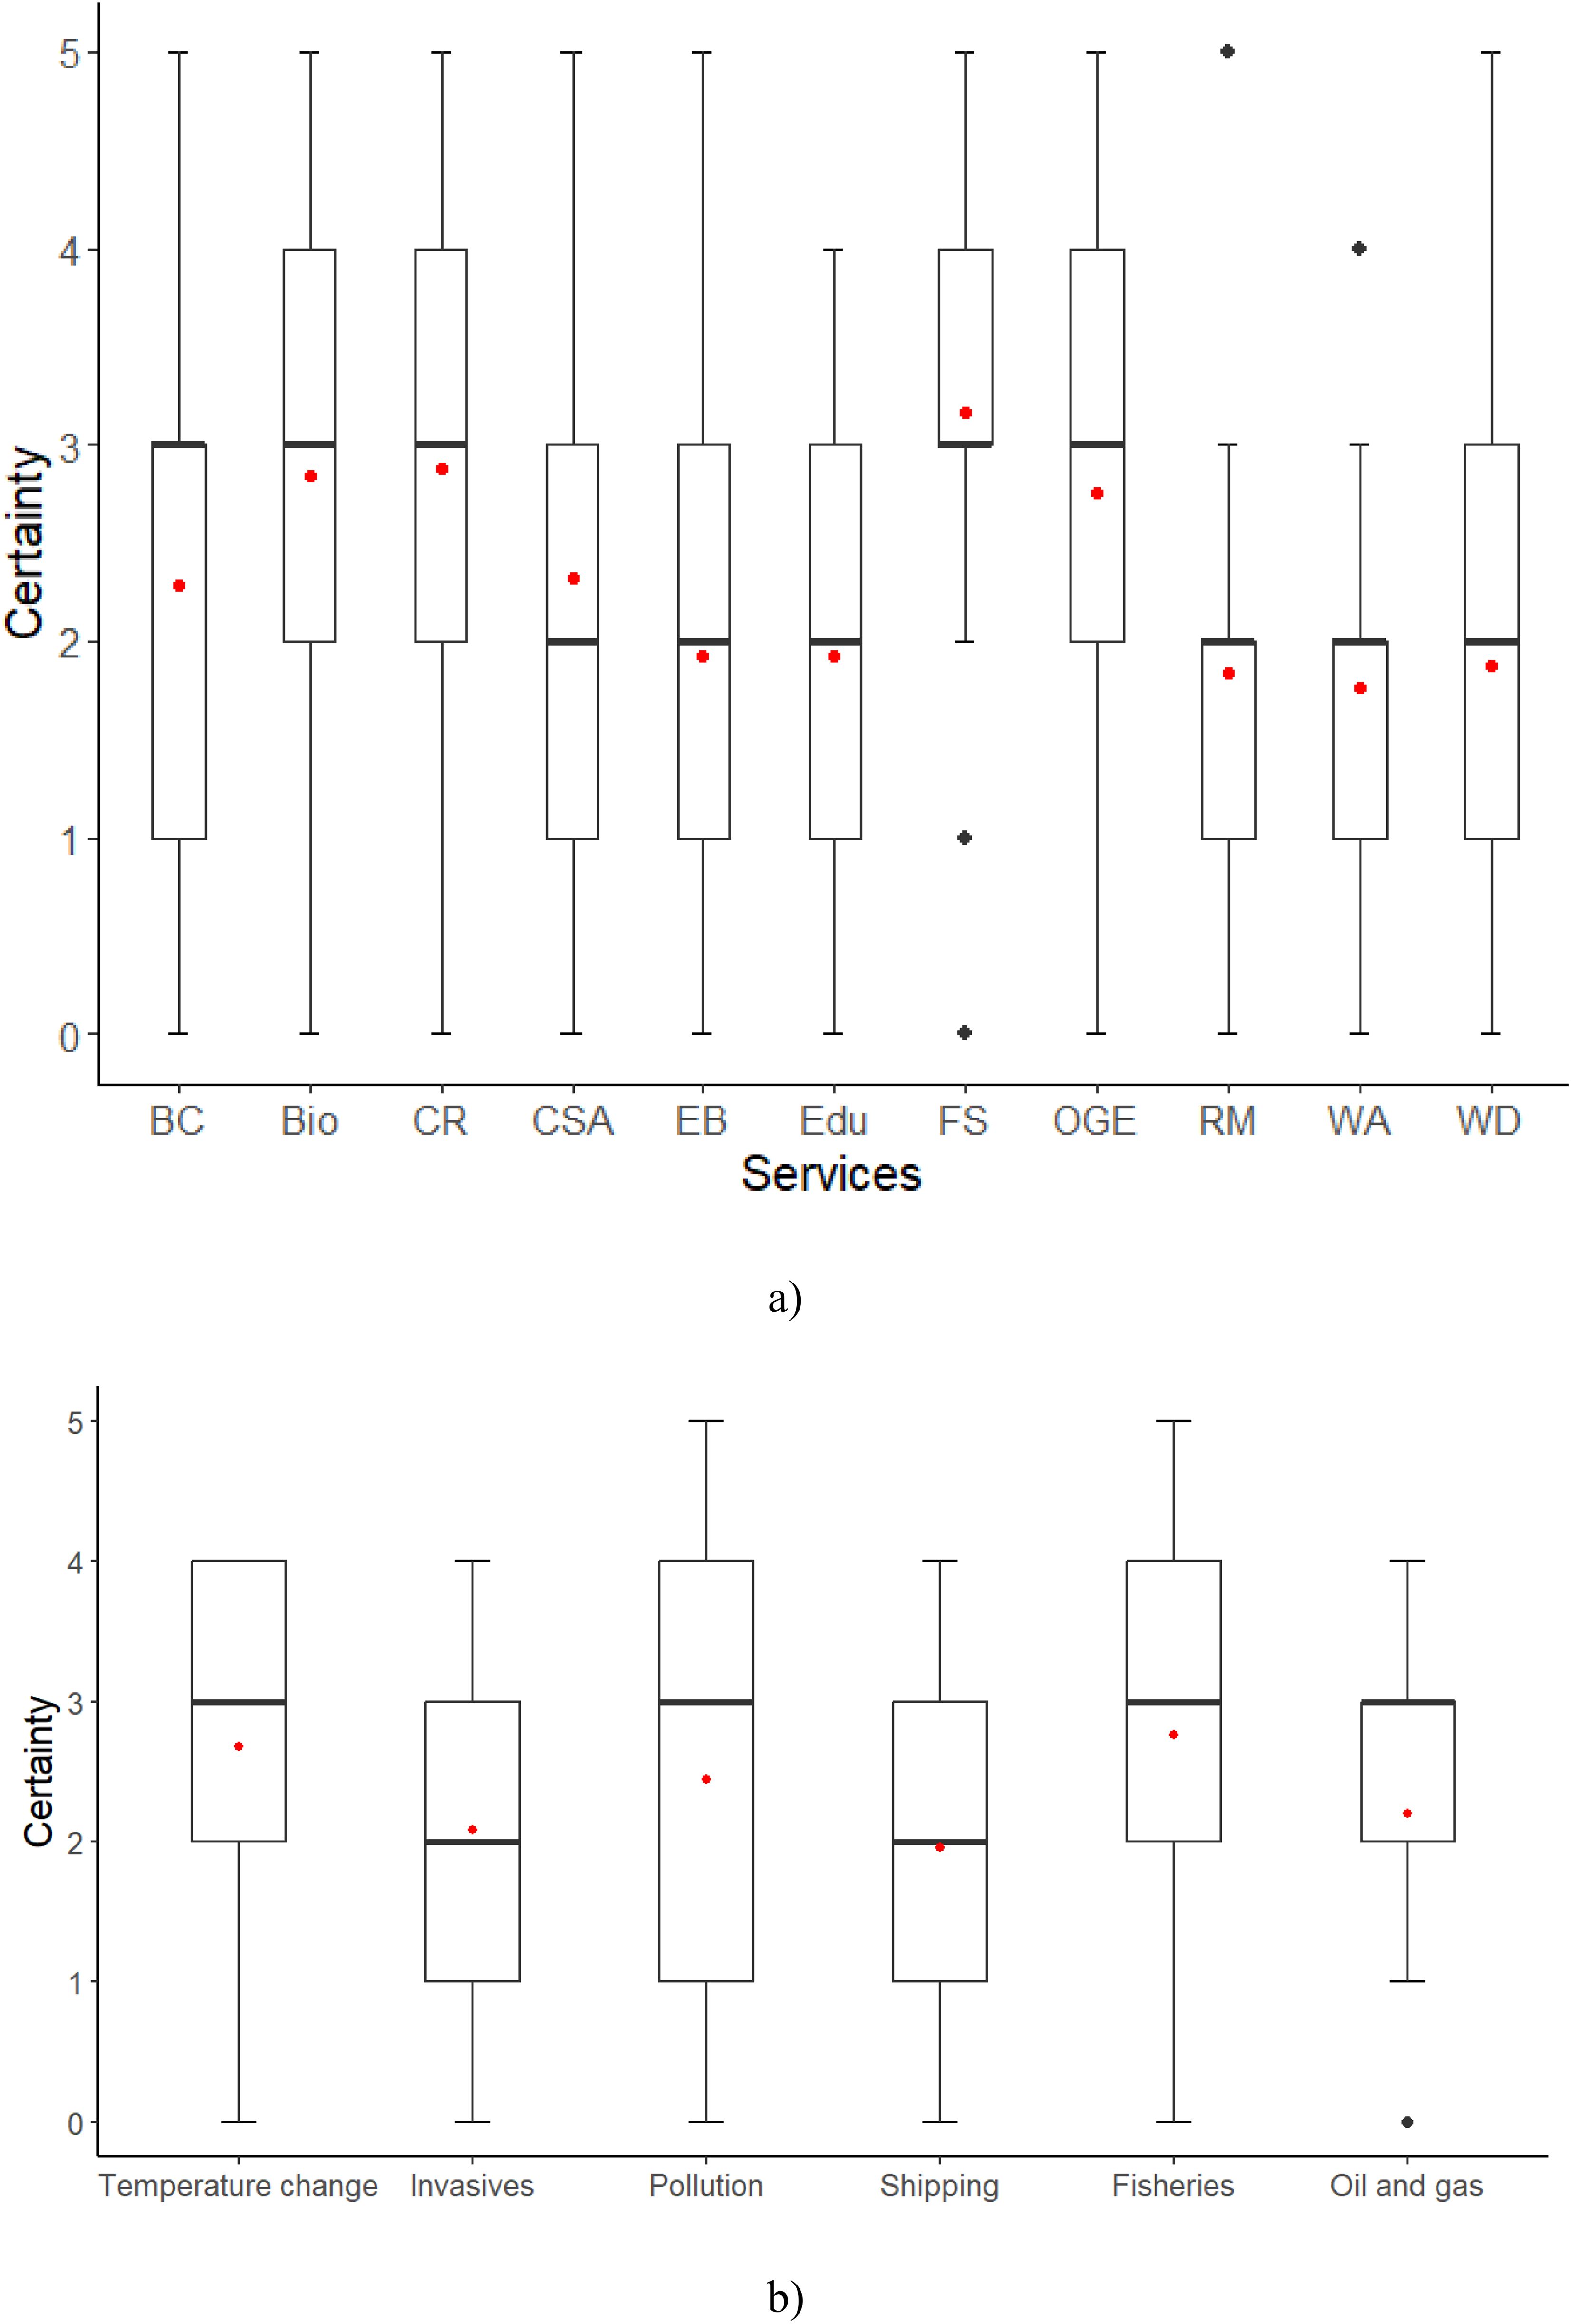
Figure 6. Certainty in relation to (A) ecosystem services and (B) human activities and pressures. The y-axis represents certainty, ranging from 5 (very certain) to 1 (very uncertain). The x-axis represents the identified pressures and activities/ecosystem services. The boxplots display median values, 25th and 75th percentiles, and max and min values. Black dots and red dots present outliers and mean values, respectively.
Among the identified pressures, temperature change is ranked as having the highest certainty levels, while invasives exhibit the lowest. Experts are also fairly certain about pollution, although this certainty is somewhat lower than that associated with temperature change. Regarding activities, fisheries are perceived to have the highest certainty levels, whereas shipping is associated with significantly lower certainty.
With respect to ecosystem services, certainty varies between the services, and its variance is generally high. The highest certainty levels are assigned to fish/shellfish, followed by climate regulation and biodiversity. The certainty levels for oil and gas/energy, raw materials, waste absorption, and carbon sequestration/absorption are also significantly different from most of the services identified in the Barents Sea.
The statistical results (p-values) of the Wilcoxon test to determine significant differences in the levels of certainty between the pressures, human activities, and services are presented in Tables 4, 5. Two methods to avoid multiple comparison problems, Bonferroni correction and FDR, are applied to detect significant differences in certainty levels (when scoring risk) between services/pressures and activities. The certainty levels of temperature change and fisheries are similar but significantly different from the certainty levels of oil and gas, shipping, and invasives. While the certainty level of pollution is similar to those of temperature change and fisheries, it is not significantly different from the level of oil and gas. For services, those significant p-values support that the certainty levels of WD, Edu, EB, CSA, and BC are similar to those of FS, OGE, CR, and Bio, as seen in Figure 6. The level and quantile ranges of WA appear similar to those of RM in plots, but the p-value indicates a significant difference. The results may be due to a number of outliers.
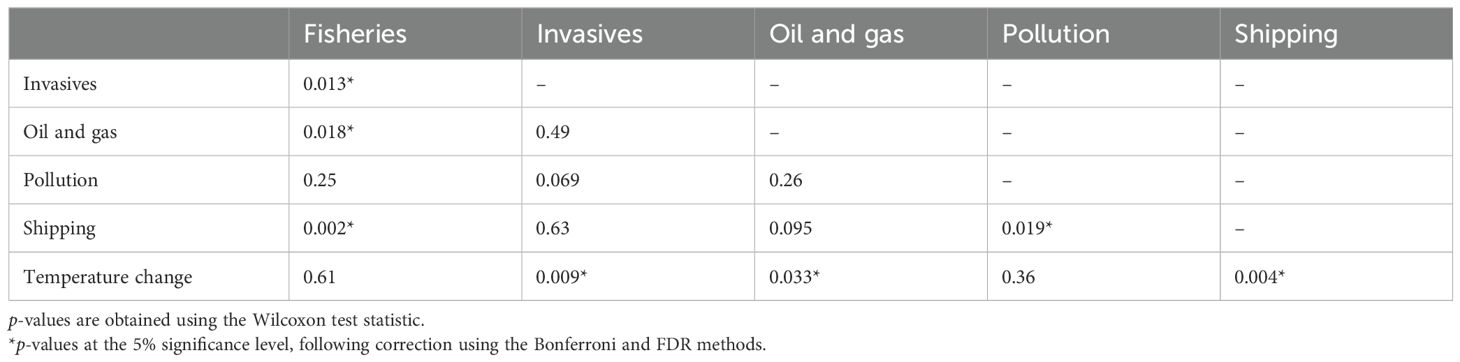
Table 4. Pairwise comparison of certainty levels between human activities and pressures.
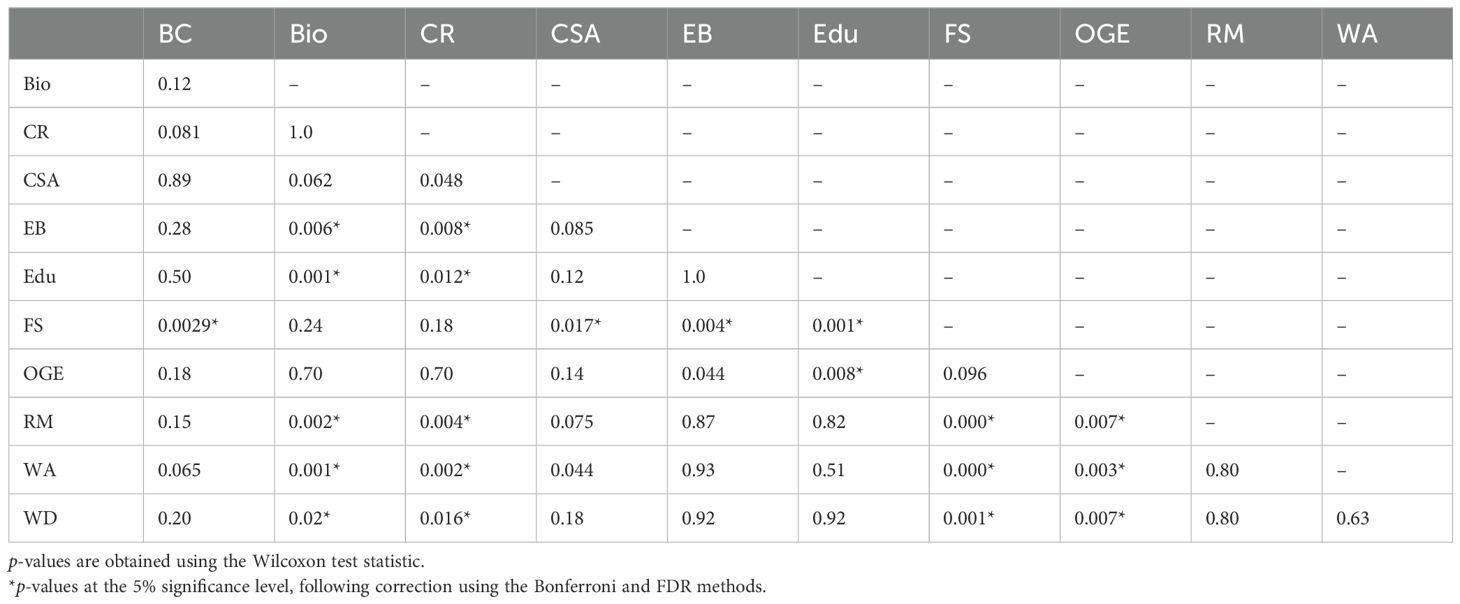
Table 5. Pairwise comparison of the certainty levels between the services.
3.4 Risk in relation to certainty
Figures 7, 8 present risks in relation to certainty for services, pressures, and activities using radar charts. While the certainty levels are assumed to be the same for all pressures and activities in each ES (Figure 7) and for all services in each pressure or activity (Figure 8), the likelihood and effect vary accordingly. As seen in Figure 7, the likelihood, effect, and certainty scores for fish/shellfish and biodiversity are the greatest, suggesting these are the most threatened services with the highest certainty. Climate regulation is also perceived to be among the greatest at-risk services, at least in relation to “temperature change”. In contrast, education is perceived as the least threatened service, albeit with the lowest certainty. In Figure 8, temperature change and pollution are recognized as the most threatening pressures, with higher certainty levels for the services of Bio, CR, FS, and OGE, and lower certainty levels for BC, CSA, EB, WD, WA, RM, and Edu. Shipping is considered the least threatening activity with the lowest certainty. This result may reflect how well temperature change and pollution have been studied in the literature. A caveat is, of course, that most of the respondents are natural scientists who work on topics related to fisheries, climate regulation, and biodiversity.
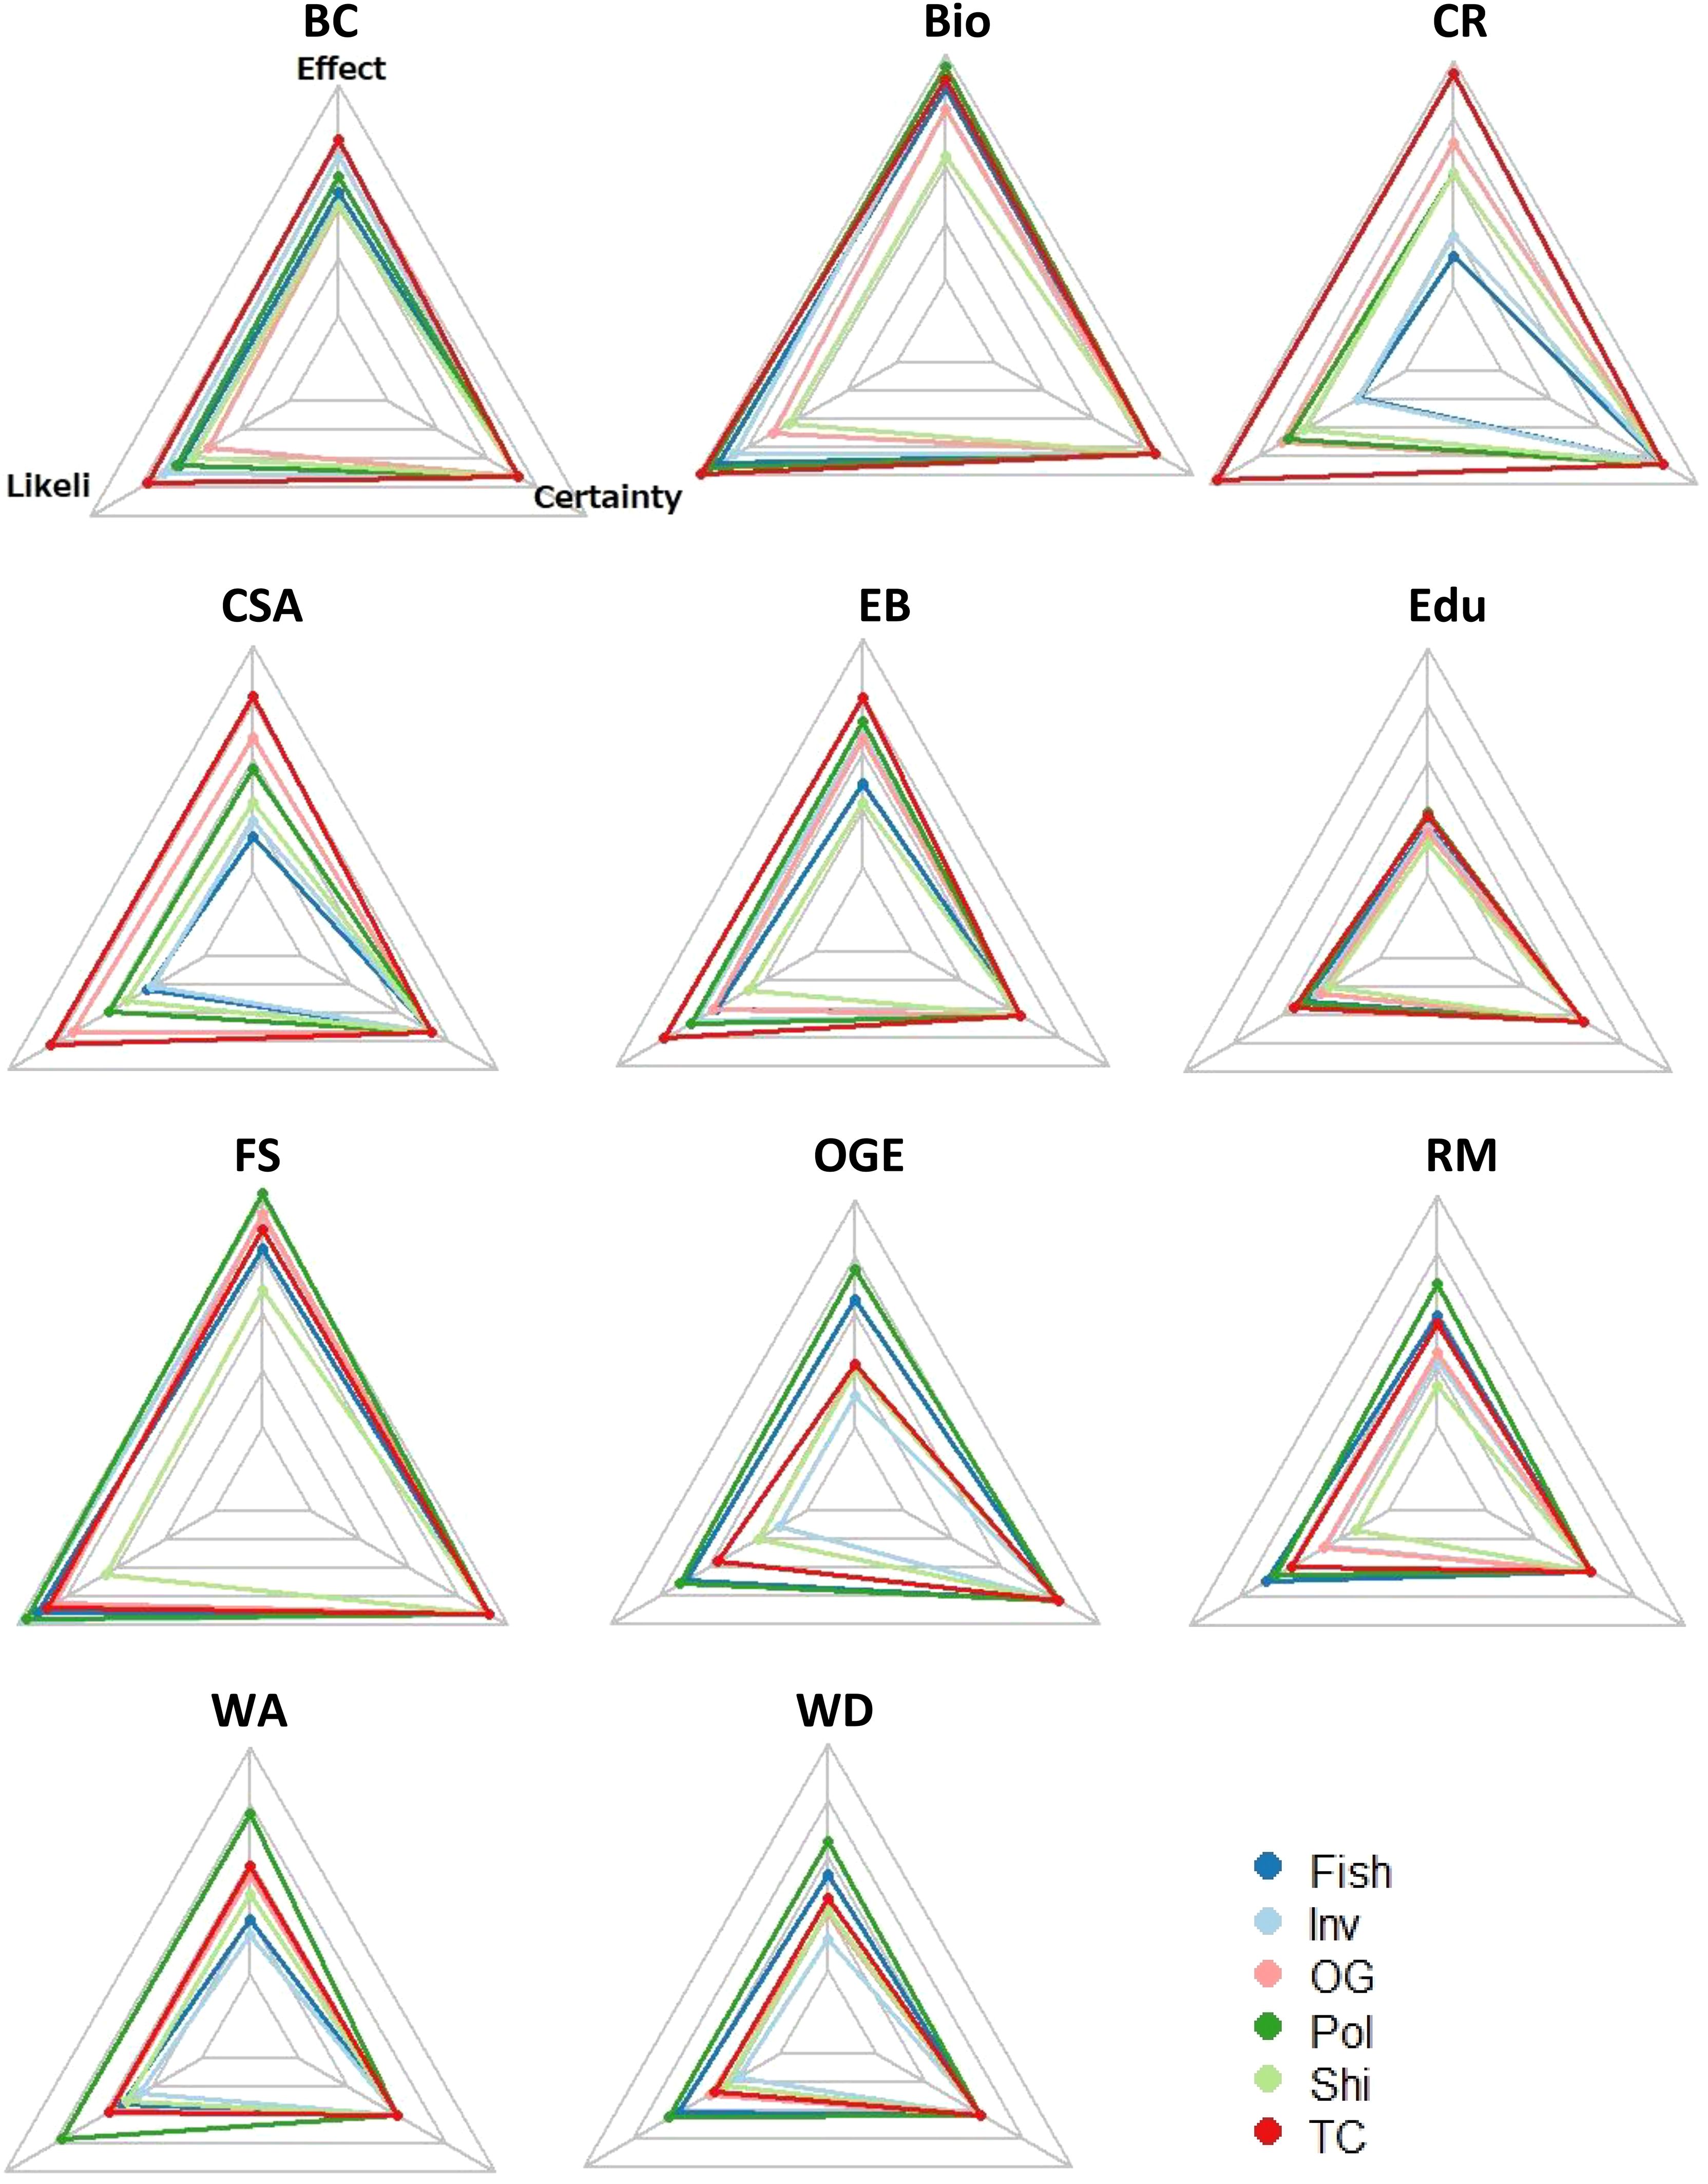
Figure 7. Effect, likelihood, and certainty levels of ecosystem services affected by pressures and human activities. Mean values are shown on a scale from 0 to 3.5, with 3.5 representing the maximum observed level.
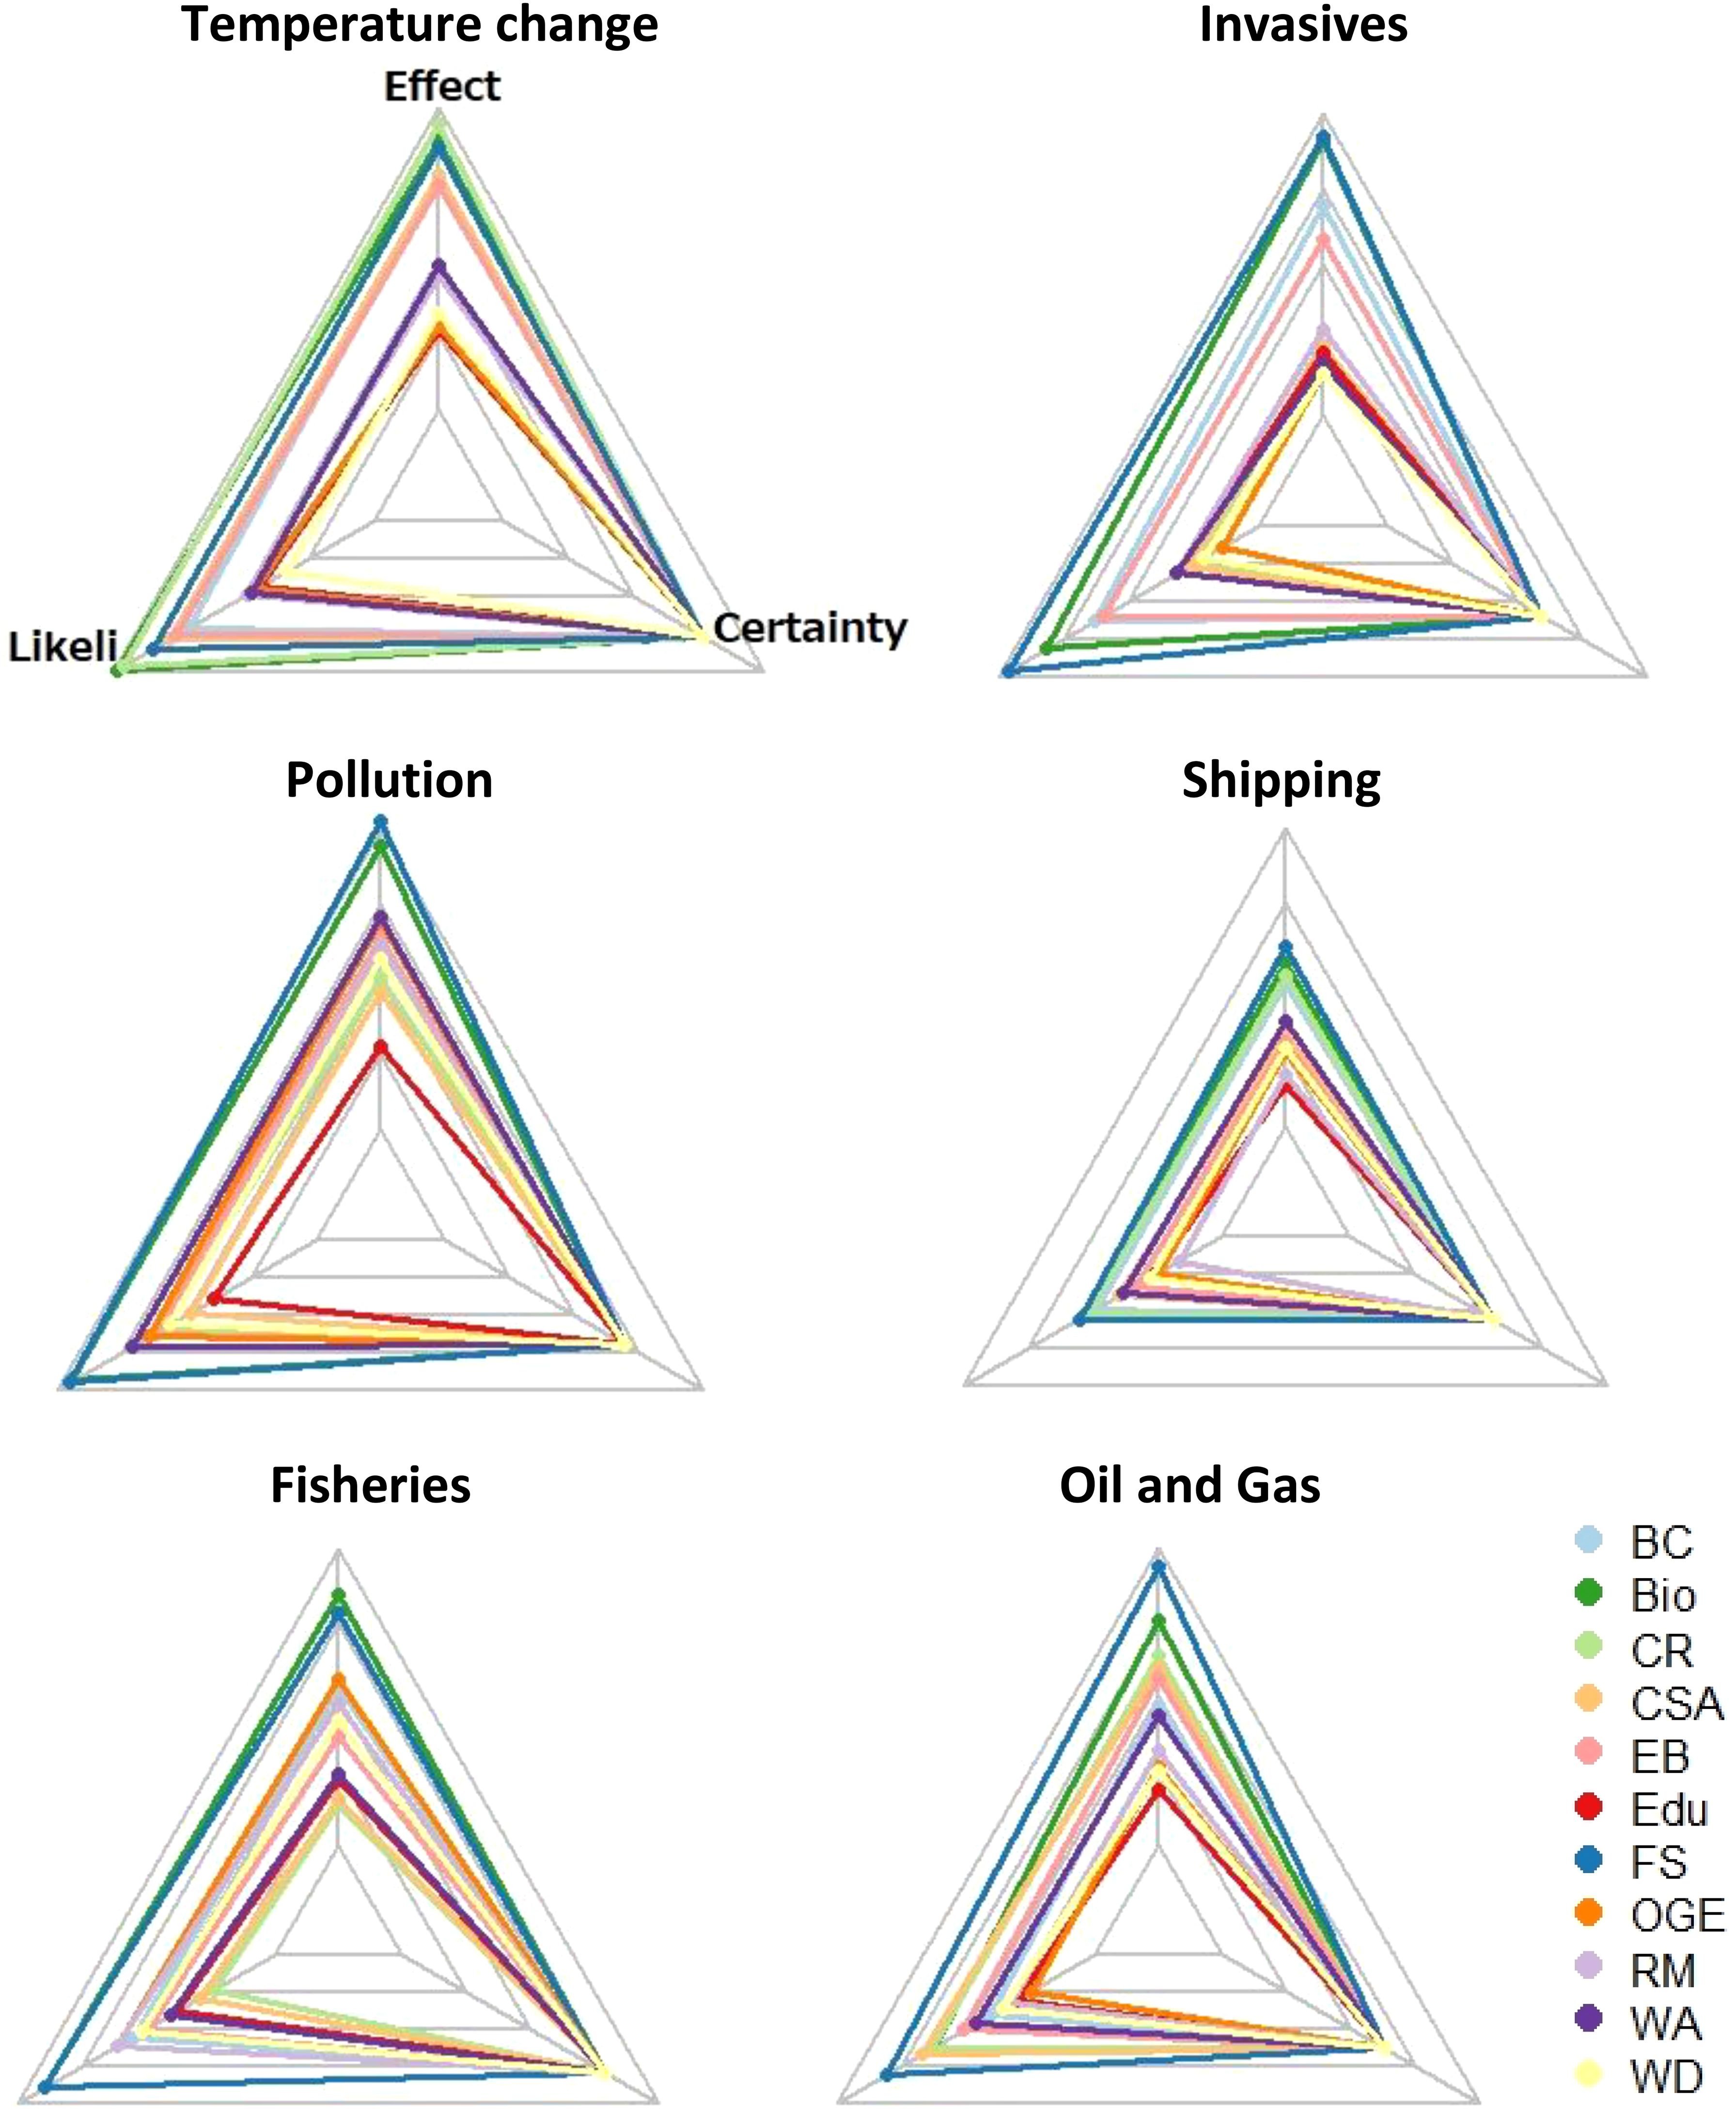
Figure 8. Effect, likelihood, and certainty levels of human activities and pressures impacting ecosystem services. Mean values are shown on a scale from 0 to 3.5, with 3.5 representing the maximum observed level.
4 Discussions and conclusions
The literature on the effects of natural pressures and human activities on ESs in the Barents Sea is limited (Noring et al., 2016; Ottersen et al., 2023). This study aims to address this gap by assessing the potential impacts on ESs in the Barents Sea. We employ the DAPSI(W)R(M) and CICES frameworks to identify human activities, pressures, and ESs, establish their causal links, and use the risk matrix approach for assessment. An expert survey is utilized to evaluate risk perceptions of natural pressures and human effects on ESs. Certainty assessment is also conducted to examine the background knowledge supporting the effect and likelihood of risk.
The results indicate that perceived risks vary among different services under various human activities and pressures; however, most risks fall within the medium or low-risk range. The most threatened ESs are the production of fish/shellfish and biodiversity, while education is the least threatened. Temperature change and pollution are identified as the pressures posing the greatest risk, though these risks are not classified as high. Shipping is considered the least threatening activity. Overall, certainty levels are generally low, with slightly less certainty regarding ESs compared to activities and pressures. The highest certainty level for ESs is assigned to fish/shellfish, followed by climate regulation and biodiversity services. Among activities, fisheries have the highest certainty level, showing less variation compared to the pressures of temperature change and pollution, This is notable, as the latter two pressures are associated with somewhat higher perceived risks.
4.1 Management implications
Addressing all identified risks is challenging due to resource limitations and inherent trade-offs between ESs. This raise the question: where should greater management efforts be focused. Should priority be given to ecosystem services with the highest perceived risks? Or could it be that when we have better knowledge, we feel more confidents about assessing the risks? Our assessment reveals that fisheries is not identified as the highest-risk activity in this study, despite having the greatest certainty among activities. Interestingly, fisheries is often ranked as a top-risk activity in other studies (e.g., Hansen et al., 2022; Pedreschi et al., 2023). This demonstrates strong confidence in the scientific foundation of the fisheries management system in the Barents Sea. Extensive efforts in science and management—more than for any other marine sector (e.g., annual fish stock monitoring surveys, annual stock assessments, and a well-developed system for management advice and harvest control rules)—have contributed to a successful transition to sustainable harvesting of the dominant fish stocks in the Barents Sea over the recent decades (Gullestad et al., 2017).
Meanwhile, fish/shellfish production and biodiversity services face the highest risks from temperature change and pollution pressures, which are associated with high certainty levels. This suggests that management strategies should prioritize these areas to mitigate risks effectively. These strategies could include investing in an advanced monitoring systems to detect early signs of temperature anomalies and pollution levels, enabling timely management; strengthening regulations to control pollutants entering marine ecosystems; and encouraging sustainable fishing practices that minimize bycatch and habitat destruction. Additionally, raising public awareness about the impacts of temperature change and pollution on marine ecosystems can promote community involvement in conservation efforts.
The study found that fisheries-associated risk was scored slightly higher for biodiversity than for fish/shellfish, aligning with Siwertsson et al. (2023). This demonstrates that fisheries affect the broader ecosystem, causing significant bycatch by capturing nontarget species and habitat destruction, rather than just impacting the targeted species. Conservation efforts may need to strengthen the focus on protecting marine biodiversity in addition to managing the target fish and shellfish stocks. This includes implementing additional measures to reduce bycatch, protect critical habitats, and enforce sustainable fishing practices. Management strategies should focus on ecosystem-based approaches rather than single-species management. This could involve setting biodiversity conservation targets and enhancing monitoring and enforcement to ensure compliance with sustainable fishing regulations. Policies and regulations may need to be revised to address the broader ecological impacts of fisheries. This could include stricter controls on fishing gear and methods, catch limits that consider ecosystem health, and more robust environmental impact assessments before allowing fishing activities. Recent efforts along these lines include the establishment of areas closed to fisheries in the northern Barents Sea, which are becoming more accessible to fisheries due to climate warming and receding sea ice (Jørgensen et al., 2020).
The results also point to challenges for management. It is, therefore, essential to define the managed system we wish to achieve, balance trade-offs between ESs, determine which services, pressures, and activities should be prioritized, and identify the necessary risk mitigation measures in practice. The prioritizations depend on both the management level and spatial scale. Local managers may focus on high-risk, high-certainty issues, where immediate actions can be implemented effectively. In contrast, regional authorities are tasked with balancing these with longer-term, uncertain risks, requiring resource allocation between direct interventions and research. At the international level, cooperation becomes crucial for addressing high-risk, low-certainty issues that cross boundaries, necessitating collaborative frameworks and shared resources to manage complex, transboundary challenges. Such multilevel management systems ensure a comprehensive approach to risk management.
In the context of this study, fisheries represent a significant risk activity with a high degree of certainty. As such, national managers are advised to prioritize this area, as they have the authority to establish regulations, such as closing areas to fisheries in general or restricting the use of specific gears, such as bottom trawling, which impacts benthic habitats within areas of Norwegian jurisdictions (e.g., Jørgensen et al., 2020). Additionally, pollution and temperature change were identified as primary risk pressures for the Barents Sea region. Although these pressures were measured as having lower levels of risk and certainty, their transboundary nature suggests that addressing them requires longer-term efforts, including national or international cooperation for effective risk mitigation.
4.2 Knowledge gaps
The study identifies significant knowledge gaps. The medium and low certainty perceived in all activities, pressures, and ESs indicates limited knowledge of risks in the Barents Sea. This finding is consistent with Siwertsson et al. (2023). Further research is needed to enhance understanding of ESs in relation to activities and pressures, as certainty regarding ESs is generally lower. This involves gathering more comprehensive data and developing advanced models to predict the risks of various pressures and activities on ESs more accurately. Specifically, for carbon sequestration and oil and gas/energy services, which are high risk but low certainty, more in-depth studies are necessary to pave the way for risk mitigation strategies. Since fisheries are seen as impacting biodiversity more than fish/shellfish, ongoing research and monitoring are needed to better understand the impacts of fisheries on biodiversity. This includes studying the cumulative and indirect effects of fishing on nontarget species and habitats and developing indicators for ecosystem health.
4.3 Limitations of the study
It should be emphasized that the findings are based on the qualified assessments of a limited number of respondents, predominantly from a natural science background. Therefore, the results should be interpreted with caution. Variations in disciplinary backgrounds may lead to different risk perceptions, and imbalanced representation may skew overall results, especially if certain perspectives are under- or over-represented. It would be desirable to analyze the influence of different disciplinary backgrounds on our results, as this would provide valuable insights into how these disciplines influence responses to identification and risk perceptions. Additionally, examining whether project member involvement affects scoring and how interactions during the workshops influence identification and scoring would further enrich the analysis. Unfortunately, the limited number of respondents does not permit such analyses. In this study, a more balanced representation of expertise, particularly from social scientists, is often more desirable, as ecosystem services bridge the natural and social sciences. Ecosystem services are human-centric in focus, with interdisciplinary perspectives. They incorporate knowledge from economics, sociology, anthropology, and political science to address questions about equity, governance, and resource management. Social scientists bring important knowledge relevant to addressing conflicts, trade-offs, and synergies among stakeholders with different interests, as well as insights into the role of governance structures, economic incentives, and policy frameworks in managing ecosystem services. This is especially true for regulating and cultural services, which often have less direct market value but are of significant societal importance.
In this study, the Barents Sea is treated as a homogeneous area, which may not capture localized variations in ecosystem processes or site-specific management decisions. For instance, the risk to marine ecosystems and likely to ecosystem services increases from the open ocean toward the coastal areas due to increasing human activities and impacts (Hansen et al., 2022; Aarflot et al., 2024). While this simplification may affect the accuracy of localized risk estimates, it enables a comprehensive regional overview. Future studies should incorporate spatially explicit data to account for these variations and align the analysis with localized management needs. Additionally, the study focused on individual risks only, but it is important to consider the indirect and cumulative risks of multiple activities and pressures on ESs and their interactions. For instance, the indirect risks associated with temperature change, such as marine heatwaves and policy changes, can substantially impact the ecosystem. These cumulative effects can exacerbate the overall risk to ESs, leading to more complex and potentially severe consequences than those posed by individual activities or pressures alone.
4.4 External validity
4.4.1 Generalizability of methodology
The innovative framework employed in this study offers a significant improvement over traditional risk assessment methodologies and has the potential to be applied in diverse contexts beyond the Barents Sea. Its key innovations—certainty assessment and multivariate risk evaluation—enhance the robustness of risk management decisions and prevent oversimplified approaches that may fail to capture the complexity of marine ecosystems. First, the inclusion of certainty assessment offers a valuable addition to traditional probabilistic risk assessment, which has often been criticized for inadequately addressing uncertainties (Aven and Zio, 2011). By incorporating certainty assessment, this analysis provides an approach that could be adopted in other ecosystem assessments, where understanding the confidence in risk estimates is crucial for a more comprehensive evaluation of potential impacts on ecosystem services. Second, the study emphasizes the importance of viewing risk as a multivariate construct rather than a scalar. Merely multiplying effects by likelihood to determine risk can lead to misguided management decisions (Cox, 2008). For instance, a management strategy for an ES with a high effect but low likelihood of occurrence will differ significantly from that for an ES with a low effect but high likelihood, although both yield the same risk level. This distinction is crucial, as it emphasizes that the nature and context of risks should inform management strategies, rather than relying solely on a numerical risk score.
4.4.2 Generalizability of findings
The findings of this study regarding risks to ecosystem services exhibit varying levels of generalizability to other marine regions. In particular, the high risks associated with temperature change and pollution identified in the study align with globally observed patterns documented in the literature. Numerous studies have demonstrated the detrimental effects of rising sea temperatures on species distribution, reproductive success, and overall ecosystem resilience (e.g., Venegas et al., 2023; Weiskopf et al., 2020). Similarly, pollution, a significant contaminant, has been shown to disrupt ecosystem components, particularly the early life stages of fish (e.g., Aarflot et al., 2024). These pressures represent pervasive effects on marine ecosystems worldwide and are not confined to the Barents Sea.
The recognition of higher fisheries-associated risks to biodiversity in this study, in contrast to the traditional focus on fish and shellfish, and the need for management strategies that prioritize the broader ecosystem rather than specific species, are likely generalizable to other marine regions. The findings align with recent literature emphasizing the importance of considering all service types when assessing risks for marine systems, not only provisioning services but also regulating and cultural services. This shift in focus is particularly significant, as it highlights the interrelationship among various ecosystem components and the importance of protecting overall biodiversity.
4.4.3 Region-specific findings
However, the results also highlight region-specific nuances that may limit their universal applicability. Although temperature change was identified as the greatest risk to most ESs, as indicated in the literature, this study did not find that this risk and certainty were always considered high for all the services. One reason might be that the focus on direct risks over indirect ones (e.g., those mediated through policy changes) mirrors local stakeholder priorities, which may vary across other marine contexts. Similarly, the projected timeline for temperature change in our study is based on a 25-year timeframe. This regional perspective limits the extrapolation of results to areas where alternative timelines might influence risk assessments. For instance, in Collins et al. (2019), the respondents do not seem very concerned about abrupt changes, such as marine heatwaves, within a 100-year projection. In contrast, Kjesbu et al. (2022) found that near-future climate change has a highly mixed impact on fish stocks in the North-East Atlantic.
Data availability statement
The raw data supporting the conclusions of this article will be made available by the authors, without undue reservation.
Ethics statement
The studies involving humans were approved by Norwegian Center for Research Data (NSD). The studies were conducted in accordance with the local legislation and institutional requirements. The participants provided their written informed consent to participate in this study.
Author contributions
TP: Conceptualization, Data curation, Formal Analysis, Investigation, Methodology, Visualization, Writing – original draft, Writing – review & editing. CA: Conceptualization, Data curation, Methodology, Writing – review & editing. HS: Formal Analysis, Methodology, Visualization, Writing – review & editing. MS-M: Conceptualization, Writing – review & editing.
Funding
The author(s) declare that financial support was received for the research, authorship, and/or publication of this article. This research was conducted as part of the BarentsRISK project (Grant Number: RCN #288192), funded by the Norwegian Research Council.
Acknowledgments
We would like to thank Per Arneberg for his assistance in contacting experts for data collection, as well as the experts who participated in the surveys and contributed valuable insights on Barents Sea pressures, activities, and their associated ecosystem services. We also extend our gratitude to the two reviewers for their invaluable comments, which significantly improved the paper. Any remaining errors are our own responsibility.
Conflict of interest
The authors declare that the research was conducted in the absence of any commercial or financial relationships that could be construed as a potential conflict of interest.
Publisher’s note
All claims expressed in this article are solely those of the authors and do not necessarily represent those of their affiliated organizations, or those of the publisher, the editors and the reviewers. Any product that may be evaluated in this article, or claim that may be made by its manufacturer, is not guaranteed or endorsed by the publisher.
Supplementary material
The Supplementary Material for this article can be found online at: https://www.frontiersin.org/articles/10.3389/fmars.2025.1493592/full#supplementary-material
References
—. Mapping, monitoring and assessment of vectors for introductions (Oslo, Norway:Norwegian Ministry of the Government :Institute of Marine Research). Available at: https://www.hi.no/en/hi/nettrapporter/rapport-fra-havforskningen-en-2022-8sec-2-2.
— (2012). First update of the Integrated Management Plan for the Marine Environment of the Barents Sea–Lofoten Area (Meld. St. 10 (2010–2011).
Aarflot J. M., Bjørdal V. R., Dunlop K. M., Espinasse M., Husson B., Lindstrøm U., et al. (2024). Ecosystem risk from human use of ocean space and resources: A case study from the Norwegian coast. Ocean Coast. Manage. 256, 107299. doi: 10.1016/j.ocecoaman.2024.107299
Abrahamsen E. B., Aven T. (2011). Safety oriented bubble diagrams in project risk management. Int. J. Perform. Eng. 7, 91–96. Available at: https://www.scopus.com/inward/record.uri?eid=2-s2.0-79955096811&partnerID=40&md5=e75999c80fb5b8cdc313673638e7a033 (Accessed Month 9, 2024).
Allais M. (1953). Le Comportement de l’Homme Rationnel devant le Risque: Critique des Postulats et Axiomes de l’Ecole Americaine. Econometrica 21, 503–546. doi: 10.2307/1907921
Allison E. H., Perry A. L., Badjeck M.-C., Neil Adger W., Brown K., Conway D., et al. (2009). [amp]]ldquo;Vulnerability of national economies to the impacts of climate change on fisheries. Fish. Fish. 10, 173–1965. doi: 10.1111/j.1467-2979.2008.00310.x
Armstrong C. W., Foley N. S., Tinch R., van den Hove S. (2012). Services from the deep: Steps towards valuation of deep sea goods and services. Ecosyst. Serv. 2, 2–13. doi: 10.1016/j.ecoser.2012.07.001
Armstrong C. W., Vondolia G. K., Foley N. S., Henry L.-A., Needham K., Ressurreição A. (2019). Expert assessment of risks posed by climate change and anthropogenic activities to ecosystem services in the deep North Atlantic. Front. Mar. Sci. 6. doi: 10.3389/fmars.2019.00158
Atkins J. P., Burdon D., Elliott M., Gregory A. J. (2011). [amp]]ldquo;Management of the marine environment: Integrating ecosystem services and societal benefits with the DPSIR framework in a systems approach. Mar. pollut. Bull. 62, 215–2265. doi: 10.1016/j.marpolbul.2010.12.012
Aven T. (2017). A conceptual foundation for assessing and managing risk, surprises and black swans. In: Motet G., Bieder C. (eds) The Illusion of risk control. Springer, Cham. 23–39. doi: 10.1007/978-3-319-32939-0_3
Aven T., Zio E. (2011). [amp]]ldquo;Some consideration on the treatment of uncertainties in risk assessment for practical decision making. Reliability Eng. System Saf. 96, 64–74. doi: 10.1016/j.ress.2010.06.001
Brown G. G., Cox L. A. Jr. (2011). [amp]]ldquo;How probabilistic risk assessment can mislead terrorism risk analysts. Risk Anal. 31, 196–2045. doi: 10.1111/j.1539-6924.2010.01492.x
Campbell B. M., Vermeulen S. J., Aggarwal P. K., Corner-Dolloff C., Girvetz E., Loboguerrero A. M., et al. (2016). Reducing risks to food security from climate change. Global Food Secur. 11, 34–43. doi: 10.1016/j.gfs.2016.06.002
CICES (2013). Common International Classification of Ecosystem Services. (Version 4.3). Copenhagen, Denmark: European Environment Agency.
Collins M., Sutherland M., Bouwer L., Cheong S.-M., Frölicher T., Combes H.J. D., et al. (2019). “Extremes, abrupt changes and managing risk,” in IPCC Special Report on the Ocean and Cryosphere in a Changing Climate (Cambridge University Press, Cambridge, UK and New York, NY, USA).
Cooley S., Schoeman D., Bopp L., Boyd P., Donner S., Ghebrehiwet D. Y., et al. (2022). Ocean and Coastal Ecosystems and their Services (Cambridge, UK and New York, NY, USA: Cambridge University Press).
Cooper K., Burdon D., Atkins J. P., Weiss L., Somerfield P., Elliott M., et al. (2013). Can the benefits of physical seabed restoration justify the costs? An assessment of a disused aggregate extraction site off the Thames Estuary, UK. Mar. pollut. Bull. 75, 33–45. doi: 10.1016/j.marpolbul.2013.08.009
Costanza R., de Groot R., Braat L., Kubiszewski I., Fioramonti L., Sutton P., et al. (2017). Twenty years of ecosystem services: How far have we come and how far do we still need to go? Ecosyst. Serv. 28, 1–16. doi: 10.1016/j.ecoser.2017.09.008
Cox A. L. (2008). What’s wrong with risk matrices? Risk Anal. 28, 497–512. doi: 10.1111/j.1539-6924.2008.01030.x
Doubleday Z., Clarke S., Lu X., Pecl G., Ward T., Battaglene S., et al. (2013). Assessing the risk of climate change to aquaculture: A case study from south-east Australia. Aquacult. Environ. Interact. 3, 163–175. doi: 10.3354/aei00058
Duijm N. J. (2015). Recommendations on the use and design of risk matrices. Saf. Sci. 76, 21–31. doi: 10.1016/j.ssci.2015.02.014
Elliott M., Burdon D., Atkins J. P., Borja A., Cormier R., de Jonge V. N., et al. (2017). [amp]]ldquo;And DPSIR begat DAPSI(W)R(M)!” - A unifying framework for marine environmental management. Mar. pollut. Bull. 118, 27–40. doi: 10.1016/j.marpolbul.2017.03.049
Field C. B., Barros V., Stocker T. F., Qin D., Dokken D. J., Ebi K. L, et al (2012). Managing the risks of extreme events and disasters to advance climate change adaptation: Special report of the intergovernmental panel on climate change. Intergovern. Panel Climate Change 9781107025066, 582 .
Fisher B., Turner R.K., Morling P. (2009). Defining and classifying ecosystem services for decision making. Ecol. Econ. 68, 643–6535. doi: 10.1016/j.ecolecon.2008.09.014
Fletcher W. J. (2005). The application of qualitative risk assessment methodology to prioritize issues for fisheries management. ICES J. Mar. Sci. 62, 1576–1587. doi: 10.1016/j.icesjms.2005.06.005
Frantzen S., Boitsov S., Dehnhard N., Duinker A., Grøsvik B. E., Heimstad E. S., et al. (2022). Forurensning i de norske havområdene - Barentshavet, Norskehavet og Nordsjøen - Rapport fra Overvåkingsgruppen 2021 (Norway: Havforskningsinstituttet). Available at: https://hdl.handle.net/11250/2992182 (Accessed Month 9, 2024).
Gissi E., Manea E., Mazaris A. D., Fraschetti S., Almpanidou V., Bevilacqua S., et al. (2021). A review of the combined effects of climate change and other local human stressors on the marine environment. Sci. Total Environ. 755, 142564. doi: 10.1016/j.scitotenv.2020.142564
Gullestad P., Abotnes A. M., Bakke G., Skern-Mauritzen M., Nedreaas K., Guldborg S. (2017). Towards ecosystem-based fisheries management in Norway – Practical tools for keeping track of relevant issues and prioritising management efforts. Mar. Policy 77, 104–110. doi: 10.1016/j.marpol.2016.11.032
Haines-Young R. (2023). Common International Classification of Ecosystem Services (CICES). V5.2 and Guidance on the Application of the Revised Structure. Available online at: www.cices.eu (Accessed Month 9, 2024).
Halpern B. S., Frazier M., Afflerbach J., Lowndes J. S., Micheli F., O’Hara C., et al. (2019). Recent pace of change in human impact on the world’s ocean. Sci. Rep. 9, 116095. doi: 10.1038/s41598-019-47201-9
Halpern B. S., Walbridge S., Selkoe K. A., Kappel C. V., Micheli F., D’Agrosa C., et al. (2008). A global map of human impact on marine ecosystems. Science 319, 948–952. doi: 10.1126/science.1149345
Hansen C., Aarflot J. M., Eriksen E., Husson B., Fauchald P., Johansen G. O., et al. (2022). Samlet påvirkning i foreslåtte særlig verdifulle og sårbare områder i norske havområder (Norway: Havforskningsinstituttet).
Hare J. A., Morrison W. E., Nelson M. W., Stachura M. M., Teeters E. J., Griffis R. B., et al. (2016). A vulnerability assessment of fish and invertebrates to climate change on the northeast U.S. Continental shelf. PloS One 11, e01467565. doi: 10.1371/journal.pone.0146756
Helle I., Mäkinen J., Nevalainen M., Afenyo M., Vanhatalo J. (2020). Impacts of oil spills on arctic marine ecosystems: A quantitative and probabilistic risk assessment perspective. Environ. Sci. Technol. 54, 2112–21215. doi: 10.1021/acs.est.9b07086
Hobday A., Smith S. I., Bulman C., Daley R., Dambacher J. M., Deng R., et al. (2011). [amp]]ldquo;Ecological risk assessment for the effects of fishing. Fish. Res. 108, 372–384. doi: 10.1016/j.fishres.2011.01.013
Holsman K., Samhouri J., Cook G., Hazen E., Olsen E., Dillard M., et al. (2017). An ecosystem-based approach to marine risk assessment. Ecosyst. Health Sust. 3, e012565. doi: 10.1002/ehs2.1256
Husa V., Agnalt A., Berntsen H., Falkenhaug T, et al (2022). Alien marine species in Norway — Mapping, monitoring and assessment of vectors for introductions. Institute of Marine Research, Bergen, Norway. Available at: https://www.hi.no/en/hi/nettrapporter/rapport-frahavforskningen-en-2022-8sec-2-2 (Accessed [September 09, 2024).
IPBES (2017). Update on the classification of nature’s contributions to people by the Intergovernmental Science-Policy Platform on Biodiversity and Ecosystem Services (Boom, Germany: The Intergovernmental Science-Policy Platform on Biodiversity and Ecosystem Services (Boom, Germany)).
Jones A. R., Doubleday Z. A., Prowse T. A. A., Wiltshire K. H., Deveney M. R., Ward T., et al. (2018). [amp]]ldquo;Capturing expert uncertainty in spatial cumulative impact assessments. Sci. Rep. 8, 14695. doi: 10.1038/s41598-018-19354-6
Jørgensen L. L., Bakke G., Hoel A. H. (2020). Responding to global warming: New fisheries management measures in the Arctic. Prog. Oceanog. 188, 102423. doi: 10.1016/j.pocean.2020.102423
Jouffray J.-B., Blasiak R., Albert V., Österblom H., Nyström M. (2020). The blue acceleration: the trajectory of human expansion into the ocean. One Earth 2, 43–545. doi: 10.1016/j.oneear.2019.12.016
Kaplan S., Garrick B.J. (1981). On the quantitative definition of risk. Risk Anal. 1, 11–275. doi: 10.1111/j.1539-6924.1981.tb01350.x
Kaya G. K., Ward J., Clarkson J. (2019). A review of risk matrices used in acute hospitals in england. Risk Anal. 39, 1060–1070. doi: 10.1111/risa.13221
Kjesbu O. S., Sundby S., Sandø A. B., Alix M., Hjøllo S. S., Tiedemann M., et al. (2022). [amp]]ldquo;Highly mixed impacts of near-future climate change on stock productivity proxies in the North East Atlantic. Fish. Fish. 23, 601–6155. doi: 10.1111/faf.12635
Li J., Bao C., Wu D. (2018). How to design rating schemes of risk matrices: A sequential updating approach. Risk Anal. 38, 99–1175. doi: 10.1111/risa.12810
MEA (2005). Ecosystems and Human Well-being: Synthesis (Washington, DC: Millennium Ecosystem Assessment, Island Press).
Mikkelsen N., Planque B., Arneberg P., Skern-Mauritzen M., Hansen C., Fauchald P., et al. (2023). Multiple stakeholders’ perspectives of marine social ecological systems, a case study on the Barents Sea. Ocean Coast. Manage. 242, 106724. doi: 10.1016/j.ocecoaman.2023.106724
Nick H., Jason S., Ben W. (2019). Introduction to Environmental Economics (UK: Oxford University Press).
Noring M., Hasselström L., Håkansson C., Soutukorva Å., Gren Å. (2016). Valuation of oil spill risk reductions in the Arctic. J. Environ. Econ. Policy 5, 298–3175. doi: 10.1080/21606544.2016.1155499
Ntona M., Morgera E. (2018). Connecting SDG 14 with the other Sustainable Development Goals through marine spatial planning. Mar. Policy 93, 214–222. doi: 10.1016/j.marpol.2017.06.020
O’Hara C. C., Frazier M., Halpern B. S. (2021). At-risk marine biodiversity faces extensive, expanding, and intensifying human impacts. Science 372, 84–87. doi: 10.1126/science.abe6731
Okey T. A., Agbayani S., Alidina H. M. (2015). [amp]]ldquo;Mapping ecological vulnerability to recent climate change in Canada’s Pacific marine ecosystems. Ocean Coast. Manage. 106, 35–48. doi: 10.1016/j.ocecoaman.2015.01.009
Oppenheimer M., Campos M., Warren R., Birkmann J., Luber G., O’Neill B., et al. (2015). “Emergent risks and key vulnerabilities”. Climate Change 2014: Impacts, Adaptation, and Vulnerability. Part A: Global and Sectoral Aspects. Contribution of Working Group II to the Fifth Assessment Report of the Intergovernmental Panel on Climate Change. Eds. Field C. B., Barros V. R., Dokken D. J., Mach K. J., Mastrandrea M. D., Bilir T. E., Chatterjee M., Ebi K. L., Estrada Y. O., Genova R. C., Girma B., Kissel E. S., Levy A. N., MacCracken S., Mastrandrea P. R., White L. L. (Cambridge, United Kingdom and New York, NY, USA: Cambridge University Press C).
OSPAR (2022). Standardised lists of terms and definitions of DAPSIR elements (Drivers, Activities, Pressures, and Impact on Ecosystem Services) to be used in OSPAR Quality Status Report 2023 thematic assessments. Available online at: https://oap.ospar.org/en/ospar-assessments/quality-status-reports/qsr-2023/qsr2023-reference/:~:text=The%20DAPSIR%20framework%20is%20an,in%20turn%20influence%20the%20Drivers (Accessed Month 9, 2024).
Ottersen G., Børsheim K. Y., Arneborg L., Maar M., Schourup-Kristensen V., Rosell E. A., et al. (2023). Observed and expected future impacts of climate change on marine environment and ecosystems in the Nordic region (Bergen, Norway : Institute of Marine Research). Available online at: https://www.hi.no/hi/nettrapporter/rapport-fra-havforskningen-en-2023-10.
Patrick W., Spencer P., Link J., Cope J., Field J., Kobayashi D., et al. (2010). Using productivity and susceptibility indices to assess the vulnerability of United States fish stocks to overfishing. Fish. Bull.- Natl. Ocean. Atmos. Admin. 108, 305–322.
Pedreschi D., Niiranen S., Skern-Mauritzen M., Reid D. G. (2023). Operationalising ODEMM risk assessment for Integrated Ecosystem Assessment scoping: Complexity vs. manageability. Front. Mar. Sci. 9. doi: 10.3389/fmars.2022.1037878
Rogge A., Janout M., Loginova N., Trudnowska E., Hörstmann C., Wekerle C., et al. (2023). [amp]]ldquo;Carbon dioxide sink in the Arctic Ocean from cross-shelf transport of dense Barents Sea water. Nat. Geosci. 16, 82–885. doi: 10.1038/s41561-022-01069-z
Ruan X., Yin Z., Frangopol D. M. (2015). Risk matrix integrating risk attitudes based on utility theory. Risk Anal. 35, 1437–14475. doi: 10.1111/risa.2015.35.issue-8
Schägner J. P., Brander L., Maes J., Hartje V. (2013). [amp]]ldquo;Mapping ecosystem services’ values: Current practice and future prospects. Ecosyst. Serv. 4, 33–46. doi: 10.1016/j.ecoser.2013.02.003
Seppelt R., Dormann C. F., Eppink F. V., Lautenbach S., Schmidt S. (2011). A quantitative review of ecosystem service studies: approaches, shortcomings and the road ahead. J. Appl. Ecol. 48, 630–6365. doi: 10.1111/j.1365-2664.2010.01952.x
Siwertsson A., Husson B., Arneberg P., Assmann K., Assmy P., Aune M., et al. (2023). Panel-based Assessment of Ecosystem Condition of Norwegian Barents Sea Shelf Ecosystems (Norway: Havforskningsinstituttet).
Smedsrud L. H., Esau I., Ingvaldsen R. B., Eldevik T., Haugan P. M., Li C., et al. (2013). The role of the barents sea in the arctic climate system. Rev. Geophys. 51, 415–4495. doi: 10.1002/rog.20017
TEEB (2010). “The economics of ecosystems and biodiversity,” in Ecological and Economic Foundations. Ed. Kumar P. (Earthscan, London and Washington).
The Professional Forum for Norwegian Marine Areas. (2023). Faggrunnlag for helhetlige forvaltningsplaner for norske havområder –Hovedrapport 2019-2023. Oslo, Norway.
The Royal Norwegian Ministry of the Environment. (2006). Integrated Management of the Marine Environment of the Barents Sea and the Sea Areas off the Lofoten Islands. Available online at: https://www.regjeringen.no/globalassets/upload/md/vedlegg/stm200520060008en_pdf.pdf (Accessed Month 9, 2024).
Norwegian Ministry of the Government. (2012). First update of the integrated management plan for the marineenvironment of the Barents Sea–Lofoten area. Meld. St. 10 (2010–2011) Report to the Storing (white paper). Oslo, Norway.
Thurber A. R., Sweetman A. K., Narayanaswamy B. E., Jones D. O. B., Ingels J., Hansman R. L. (2014). Ecosystem function and services provided by the deep sea. Biogeosciences 11, 3941–3963. doi: 10.5194/bg-11-3941-2014
Venegas R. M., Acevedo J., Treml E. A. (2023). Three decades of ocean warming impacts on marine ecosystems: A review and perspective. Deep Sea Res. Part II: Top. Stud. Oceanog. 212, 105318. doi: 10.1016/j.dsr2.2023.105318
Weiskopf S. R., Rubenstein M. A., Crozier L. G., Gaichas S., Griffis R., Halofsky J. E., et al. (2020). Climate change effects on biodiversity, ecosystems, ecosystem services, and natural resource management in the United States. Sci. Total Environ. 733, 137782. doi: 10.1016/j.scitotenv.2020.137782
Keywords: Barents Sea, certainty, ecosystem services, expert, risk assessment
Citation: Pham TTT, Armstrong CW, Solvang HK and Skern-Mauritzen M (2025) Risk assessment to Barents Sea ecosystem services: an expert-based approach. Front. Mar. Sci. 12:1493592. doi: 10.3389/fmars.2025.1493592
Received: 09 September 2024; Accepted: 02 January 2025;
Published: 05 February 2025.
Edited by:
Stelios Katsanevakis, University of the Aegean, GreeceReviewed by:
Nadia Papadopoulou, Hellenic Centre for Marine Research (HCMR), GreeceXiurou Wu, Norwegian School of Economics, Norway
Copyright © 2025 Pham, Armstrong, Solvang and Skern-Mauritzen. This is an open-access article distributed under the terms of the Creative Commons Attribution License (CC BY). The use, distribution or reproduction in other forums is permitted, provided the original author(s) and the copyright owner(s) are credited and that the original publication in this journal is cited, in accordance with accepted academic practice. No use, distribution or reproduction is permitted which does not comply with these terms.
*Correspondence: Thuy Thi Thanh Pham, dGhhbmgudGh1eUB1aXQubm8=