 Florian Baletaud1,2,3*
 Sébastien Villon1Antoine Gilbert2Jean-Marie Côme3
 Sylvie Fiat1Corina Iovan1
 Laurent Vigliola1
- 1ENTROPIE, Institut de Recherche pour le Développement (IRD), UR, UNC, IFREMER, CNRS, Centre IRD de Nouméa, Noumea, New Caledonia
- 2Soproner, Groupe GINGER, Noumea, New Caledonia
- 3Burgeap, Groupe GINGER, Lyon, France
Deep-sea demersal fisheries in the Pacific have strong commercial, cultural, and recreational value, especially snappers (Lutjanidae) which make the bulk of catches. Yet, managing these fisheries is challenging due to the scarcity of data. Stereo-Baited Remote Underwater Video Stations (BRUVS) can provide valuable quantitative information on fish stocks, but manually processing large amounts of videos is time-consuming and sometimes unrealistic. To address this issue, we used a Region-based Convolutional Neural Network (Faster R-CNN), a deep learning architecture to automatically detect, identify and count deep-water snappers in BRUVS. Videos were collected in New Caledonia (South Pacific) at depths ranging from 47 to 552 m. Using a dataset of 12,100 annotations from 11 deep-water snapper species observed in 6,364 images, we obtained good model performance for the 6 species with sufficient annotations (F-measures >0.7, up to 0.87). The correlation between automatic and manual estimates of fish MaxN abundance in videos was high (0.72 – 0.9), but the Faster R-CNN showed an underestimation bias at higher abundances. A semi-automatic protocol where our model supported manual observers in processing BRUVS footage improved performance with a correlation of 0.96 with manual counts and a perfect match (R=1) for some key species. This model can already assist manual observers to semi-automatically process BRUVS footage and will certainly improve when more training data will be available to decrease the rate of false negatives. This study further shows that the use of artificial intelligence in marine science is progressive but warranted for the future.
1 Introduction
In order to assess fisheries stock for a target species, it is necessary to estimate its abundance and biomass spatially and across time, but also along the species length structure (Gulland, 1983). Such information may be insufficient or biased when acquired from landings of data-poor fisheries, thus calling for independent methods to complement traditional fisheries stock assessments (Moore et al., 2013). The emergence of video-assisted methods like BRUVS (Baited Remote Underwater Video Stations) (Whitmarsh et al., 2017) using low-cost small action cameras may provide such valuable complementary information (Moore et al., 2013; Letessier et al., 2015). However, video-based assessments require a considerable processing time to manually count fish on images, limiting their broad-scale applications (Sheaves et al., 2020). Modern automated video analyses using deep learning algorithms are becoming more accurate (Villon et al., 2018; Marrable et al., 2022; Bhalla et al., 2024) and may reduce these costly video-processing constraints (Tseng and Kuo, 2020; Connolly et al., 2021; Lopez-Marcano et al., 2021). Yet the lack of labelled, species-rich, datasets for fish classification and identification keeps its automation binding. Furthermore, the performance of deep learning algorithms on deep video surveys, including darkness, artificial lightning or generally variable image conditions and backgrounds, is still poorly known (Saleh et al., 2024; Jian et al., 2024).
In the Pacific, deep-water demersal fisheries are of high significance not only for local consumption but also for their commercial, cultural, and recreational value (Dalzell and Preston, 1992). Their commercial development began in the 1970s to alleviate fishing pressure on coral reefs but has generally collapsed in the 1990s (Williams et al., 2012). Over time, these fisheries have transitioned primarily to subsistence but continued to hold commercial significance in more developed and isolated regions like New Caledonia and Hawaii (Newman et al., 2016). While deep demersal fisheries include around 200 species in the western Pacific Ocean, the landed species are mainly composed of snappers, a group in the Lutjanidae family associated to the genera Etelis, Pristipomoides, Aphareus, and Aprion. Deep-water snappers are characterized by relatively slow metabolic rates and long lifespans, making them highly vulnerable to overfishing (Newman et al., 2016; Wakefield et al., 2020). Usually found at depths starting at 100 m to 500 m and more, these fish aggregate in structured topographies like steep slopes, seamounts, or any topographic anomaly such as sand banks or pinnacles (Gomez et al., 2015). Yet, deep-water snapper fisheries lack core management measures based on stock assessments which remain challenging to perform in such hardly accessible marine habitats (Newman et al., 2016).
Baited Remote Underwater Video Stations are among the most used, standardized video technics to study underwater fish ecology (Whitmarsh et al., 2017; Langlois et al., 2020). BRUVS can assess spatial and temporal variation in fish assemblages through visual identification and quantifying species abundance (Letessier et al., 2015; Wellington et al., 2018). They are a low-cost method able to generate large amounts of data (Cappo et al., 2007; Osgood et al., 2019; MacNeil et al., 2020). BRUVS can be deployed in a variety of habitats, including coral reefs, but also soft sediments, freshwater, the deep sea, or the pelagic environment (Ellender et al., 2012; Gladstone et al., 2012; Zintzen et al., 2012; Henderson et al., 2017; Schmid et al., 2017; Letessier et al., 2019; Reis-Filho et al., 2019). Their use in environmental monitoring is increasing with more studies focusing on industrial settings like underwater pipelines (Bond et al., 2018; Schramm et al., 2020, 2021) or windfarms (Griffin et al., 2016). BRUVS are also emerging as independent and complementary methods for fisheries stock assessments (Cappo et al., 2004; Ault et al., 2018; Boldt et al., 2018). Clearly, BRUVS show great potential for monitoring deep-sea fisheries.
When manually processing BRUVS footage by identifying, counting, and measuring fish, the fastest and commonly used metric is the MaxN (Whitmarsh et al., 2017; Langlois et al., 2020). MaxN corresponds to the maximum number of individuals per species that can be counted in a single image per video. While conservative, this measure prevents from counting the same individuals twice. It has been shown that getting accurate fish abundance measures on each image from a video station, or within short video periods, and averaging these measures along the whole video may be more representative, but would multiply processing costs (Schobernd et al., 2014). This cost could effectively be reduced using deep learning algorithms.
Deep learning and specifically Convolutional Neural Networks (CNNs) are artificial intelligence algorithms that generate classification by autonomously identifying features in images (LeCun et al., 2015). The rapid progress in the automatic processing of underwater images has already long permeated in ecology with the accurate detection of several marine species (Christin et al., 2019; Mannocci et al., 2021; Saleh et al., 2022; Xu et al., 2023). The ability to detect and identify fish on images in their natural environment has also been explored, but have mainly targeted coral reef fish, which can be highly differentiated due to their diversity of shapes and colors (Mandal et al., 2018; Villon et al., 2018, 2022; Saleh et al., 2024). The available public images follow the same trend but are diversifying on shallow habitats, with images from fish at deeper strata still lacking (Saleh et al., 2024; Bhalla et al., 2024).To our knowledge, few studies have used deep-water images with their own singular constraints like variable light levels (Saleh et al., 2022; Jian et al., 2024 but see Liu et al., 2023), and none for the deep-water snappers. Given the diversity of habitats and conditions in which fish can be detected, incorporating more diverse species and backgrounds is crucial for improving general fish detection and identification techniques (Saleh et al., 2022; Bhalla et al., 2024; Jian et al., 2024).
The state-of-the-art of object detection and classification features three primary algorithms: Single Shot Detection (SSD), Faster Region-based Convolutional Neural Network (Faster R-CNN), and You Only Look Once (YOLO) (Bhalla et al., 2024). While YOLO and SSD have demonstrated notable speed advantages over Faster R-CNN, the latter has shown superior accuracy in object detection and classification (Kim et al., 2018; Bose and Kumar, 2020; Kaarmukilan et al., 2020; Lee and Kim, 2020; Lee et al., 2021; Mahendrakar et al., 2022; Sarma et al., 2024). This difference is due to the NAS (Neural Architecture Search) automatically searching and building the most efficient architecture (Elsken et al., 2018). Furthermore, while some recent versions of YOLO do outperform older Faster R-CNN implementations, one of YOLO’s weaknesses is its inability to address important variation of object sizes like Faster R-CNN can do (Ammar et al., 2019). Such variation is commonplace in underwater videos, where individuals can appear either close or very far from the camera. One of the main advantages of YOLO is its speed in real-time detection operations where faster R-CNN will take more processing time. BRUVS are usually deployed and retrieved over a short period of time, leading to an inevitable separated processing time from deployment. For this reason, Faster R-CNN seems to represent the best option for this context as being the most precise although a little bit slower (Sarma et al., 2024).
Here, we chose the Faster R-CNN architecture and assessed its ability to automatically detect deep-water snapper species in BRUVS images from deep slopes and seamounts of a South Pacific island: New Caledonia. We then discuss constraints and solutions about how this algorithm may help accelerate video processing for fisheries stock assessments considering a fully automatic and semi-automatic approach. To our knowledge, this study is the first to train an artificial intelligence algorithm for the detection, identification and counting of deep-water snapper in the wild on baited videos.
The main contributions of this article are as follows:
1. To address the problem of high processing costs associated with manual data extraction on images by experts on BRUVS footage of commercial species, we propose the use of artificial intelligence, specifically the Faster R-CNN deep learning algorithm, to automate the detection, identification and counting of deep-water snappers (Lutjanidae family) observed in New Caledonia.
2. To address the choice of deep learning algorithm for non-specialists, we propose the use of the Faster R-CNN architecture. It has proven to be effective in processing varying objects (species) with higher accuracy compared to other model architectures.
3. To address the problem of too small training dataset, we propose a semi-automatic method which combines manual and automatic processes to improve the accuracy of fish abundance estimates. This semi-automatic process achieved results much closer to manual count while reducing the number of images checked by the expert to the amount of detections by the algorithm.
2 Materials and methods
2.1 Video dataset origin
New Caledonia is a sanctuary and hotspot for marine biodiversity (Payri et al., 2019). Anthropic pressure is low, with around 271 400 inhabitants over 16,372 km² (isee.nc) disproportionally localized around its capital, Noumea. The 400 km long main island is surrounded by a 1,600 km long coral reef barrier and wilderness atolls, reefs, and small islands scattered across the 1,450,000 km² of the New-Caledonian Exclusive Economic Zone (EEZ). Mainly composed of deep sea, 40% of the EEZ surface is a potential habitat for deep-sea snappers (Gomez et al., 2015). A total of 15 sites were sampled with BRUVS, including 11 seamount summits and 4 deep island slopes, during four oceanographic campaigns conducted aboard the RV ALIS in 2019 and 2020. Sample depths varied between 47 and 552 m (Baletaud et al., 2023).
On each seamount or deep slope, five to ten video samples were collected for a total of 121 deep water BRUVS deployments using GoPro Hero 4. Cameras were set with a medium field of view in 1920x1080 at 30 frames per second and at 1200 lumens, 120-degree angle led light (Groupbinc). BRUVS were baited with 1kg of crushed sardines in a perforated PVC canister and provided 2 hours of usable seafloor footage. Then, videos were manually processed, and MaxN (maximum abundance per species in a single frame, Langlois et al., 2020) was estimated for each species using the EventMeasure (Seagis) software (version 5.42). Eleven species of deep-water snappers were observed throughout this 121 BRUVS dataset. Snappers were observed at variable abundances on 98 BRUVS and were absent in the remaining 23 video stations. We then extracted a total of 410 video clips of 15 seconds centered around each MaxN observation. Overlapping sequences between different species’ MaxN on each video clip were filtered to avoid duplicated annotations of identical images. These video clips were then sliced to two or five frames per second for manual annotation. The annotation procedure was identical to a previous study (Villon et al., 2018). Briefly, for each image, the coordinates of the box enclosing each observed snapper were registered using Computer Vision Annotation Tool (CVAT) (Sekachev et al., 2020). This procedure yielded 12,100 individual deep-water snapper annotations identified at the species level on 6,364 images extracted from the video sequences. The image dataset was then split into a training and a testing dataset. Splitting considered individual BRUVS to avoid images of the same species and BRUVS in the training and testing dataset, and thus minimize false negatives (Villon et al., 2020). The training dataset included 80% of annotations (5,031 images, 9,782 annotations), and the remaining 20% were used in the testing dataset (1,333 images, 2,318 annotations). Species-wise annotations were highly unbalanced as some species occurred more often than others (Table 1). Randallichthys filamentosus was represented by only three annotations, resulting in no image in the testing dataset. Therefore, the species was only kept in the model training to add diversity to its training data.
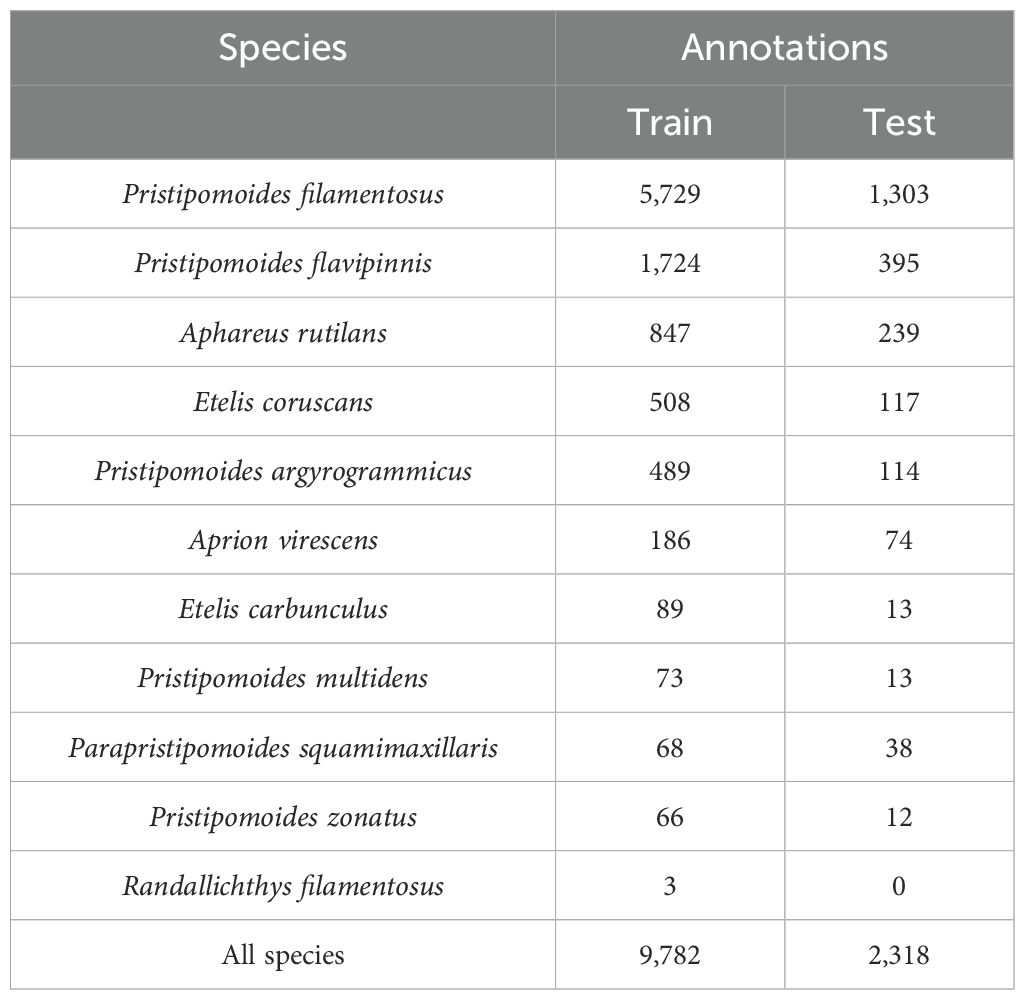
Table 1. Annotation summary for the training and testing datasets per species used with the R-CNN algorithm.
2.2 Deep learning model and evaluation metrics
CNNs are specific algorithms designed for object detection and image classification. By initially extracting pixel sets that represent potential features, CNNs apply filters and weights to generate a localized sum of pixels throughout the image. Training these algorithms involves supplying raw images along with manually annotated features, enabling the recognition of specified objects. The output generated by the CNN is the list of identified objects and their respective probability scores.
We used the Faster Region-Based Convolutional Neural Network (Faster R-CNN) dedicated to object detection (Ren et al., 2017). Faster R-CNN has proven to be the best type of architecture to process objects within a large range of sizes, and to provide higher accuracies than other models (Ammar et al., 2019; Bose and Kumar, 2020; Kaarmukilan et al., 2020; Lee et al., 2021). For these reasons, the architecture is particularly suited to applications in the field of marine biodiversity and is indeed commonly used for fish detection and classification (Blowers et al., 2020; Chen et al., 2023). The model was used with a hybrid inception module coupled to a Nas ResNet configuration (Inception-ResNet V2) with images processed in 1024x1024 format. The architecture was pre-trained on the COCO (common objects in context) dataset (Lin et al., 2014), and is built as following: 1) a feature extractor relying on inception (Szegedy et al., 2015) and residual connections (He et al., 2016) to embed the image, 2) a region proposal network composed of convolutional layers predicting the likelihood of object presence (Zhong et al., 2020), 3) a region of interest pooling layer deleting redundant bounding boxes, 4) fully connected layers refining the features of each object and 5) a classification layer with a softmax function which outputs classification scores for each region proposal. Such two-stage architecture is particularly efficient to process images with objects of different sizes, fitting the context of fish detection and classification. All further details and model architecture can be found on the TensorFlow 2’s GitHub model directory. The training and testing data of our BRUVS images annotated with the deep-water snapper species were converted into the tensorflow file format and supplied to the architecture. Model training and testing were carried out through the open-source Tensorflow API in Python 3. The used hardware contained four parallelized NVIDIA Quadro RTX 8000 cards with 196 GB of CPU memory and 42 GB of GPU memory and operated on an Ubuntu operating system. The model was run on 200 000 iterations with a batch size of 8.
The test dataset provided the number of true positives (a detection of the correct species where it has been manually annotated), false negatives (no detection in images with manually annotated species), and false positives (detection in an image where no individual was present, or the incorrect species detected). From these parameters, the common assessment metrics used in deep learning were computed: recall (1), precision (2), and F-measure (3) (Zhang and Zhang, 2009). Each metric’s value ranges from 0 to 1, with values closer to 1 indicating better performance.
The recall reveals the algorithm’s essential ability to accurately detect and identify the desired features. It represents instances where detections should have taken place in the test dataset but were missed. It is calculated by dividing the number of true positives by the sum of true positives and false negatives:
Precision indicates the algorithm’s detection error rate, calculated by dividing the number of true positives by the combined sum of true positives and false positives:
The F-measure is a general indicator of the model’s quality and is equal to the harmonic mean of recall and precision:
These evaluation metrics were calculated for each of the eleven species seen across all frames of the test dataset.
2.3 Automatic and semi-automatic fish counting on video
In order to evaluate the ability of the algorithm to estimate MaxN, the number of automatic detections per frame (MaxNAuto) in the test dataset was compared to the number of manual annotations (MaxNMan). First, the Pearson correlation coefficient was used for its simplicity in quantifying the strength and direction of the linear relationship between MaxNAuto and MaxNMan. A high correlation (close to 1) will indicate a strong positive linear relationship between both indices. Then, using a standard linear regression, the intercept of the linear relationship between MaxNAuto and MaxNMan was tested against zero. The slope was also tested against 1 to evaluate whether the algorithm underestimated or overestimated the number of detections, and hence fish abundance.
Next, we proposed a semi-automatic approach that combines the trained algorithm with manual intervention on images containing detections. This method aimed at evaluating the potential of deep learning-assisted video processing. All images where the faster R-CNN detected deep water snappers were reviewed and manually corrected by an expert biologist. This process eliminated false positives, leaving only errors due to false negatives. Using this protocol, we recalculated the model metrics based on the corrected misclassifications. With no more false positives, the precision metrics consistently reached 1. The semi-automatic MaxN (MaxNSemi) was then compared to the MaxNAuto using the Pearson correlation and linear regression against MaxNMan.
3 Results
Faster R-CNN training lasted for four days in order to execute 200,000 iterations on the multi-GPU calculator. Out of the 1,333 testing images comprising 2,318 annotated fish, the trained Faster R-CNN automatically detected 2,351 fish, out of which 1786 were true positives (76%) so 565 were false positives.
The F-measure of automatic detections ranged between 0.15 to 0.87, indicating considerable variation in the evaluation measures per species. Largest values were obtained for Etelis coruscans (F-measure: 0.87, recall: 0.91, precision: 0.84), closely followed by Pristipomoides filamentosus (F-measure: 0.79, recall: 0.86, precision: 0.73, Table 2). Pristipomoides multidens, was not detected on any of the 13 testing observations, hence values of 0 for the recall and precision. Pristipomoides zonatus was hardly detected in the equally low testing observations (recall of 0.08 on 12 annotations). However, the model never classified another deep-water snapper as this species (precision of 1.0). These two latter species along with Etelis carbunculus and Parapristipomoides squamimaxillaris, were those with less than 89 annotations to train the model. Species with comparatively higher annotation numbers (> 186, Aprion virescens, up to 5729, P.filamentosus) showed F-measures of at least 0.71 (Pristipomoides flavipinnis). A sample of the testing dataset is illustrated in Figure 1.
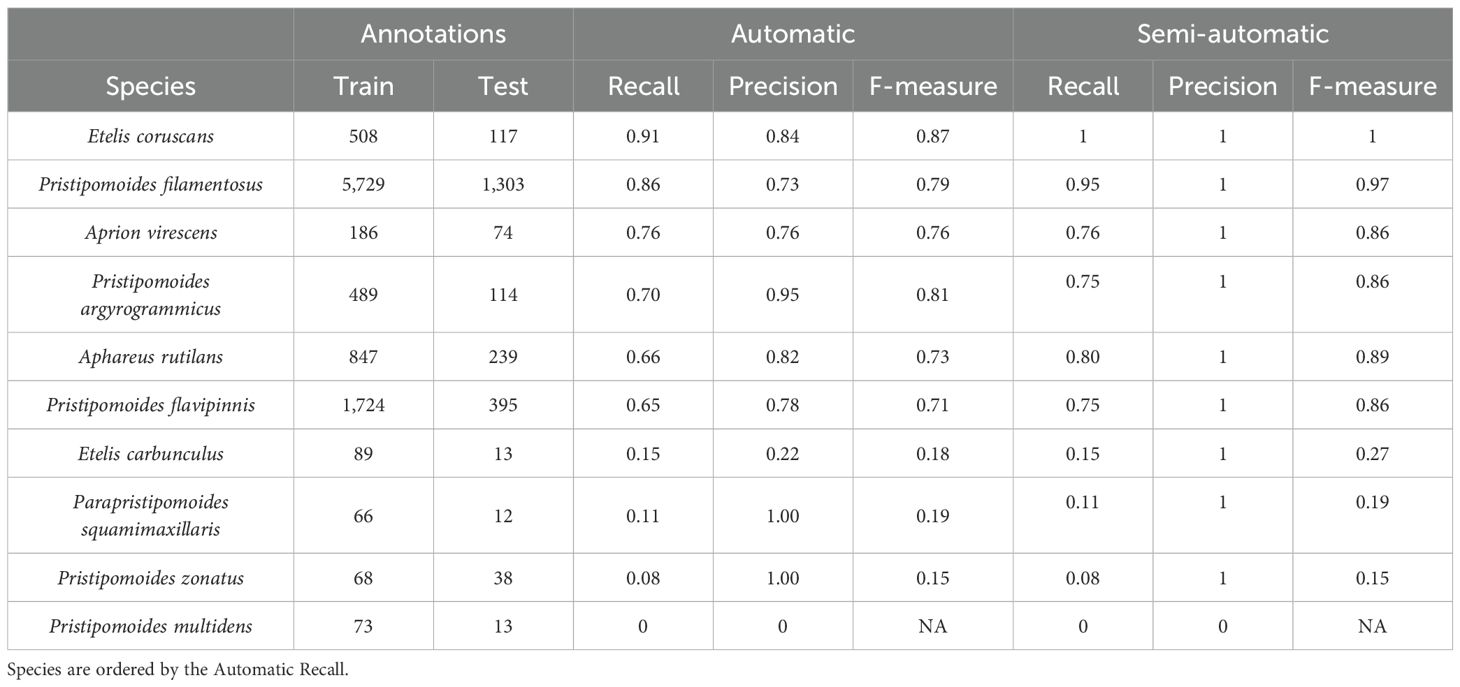
Table 2. Evaluation metrics (recall, precision and F-measure) generated from the testing dataset for 10 deep-water snapper species on the trained Faster R-CNN (automatic) and the corrected detections from the Faster R-CNN (semi-automatic).
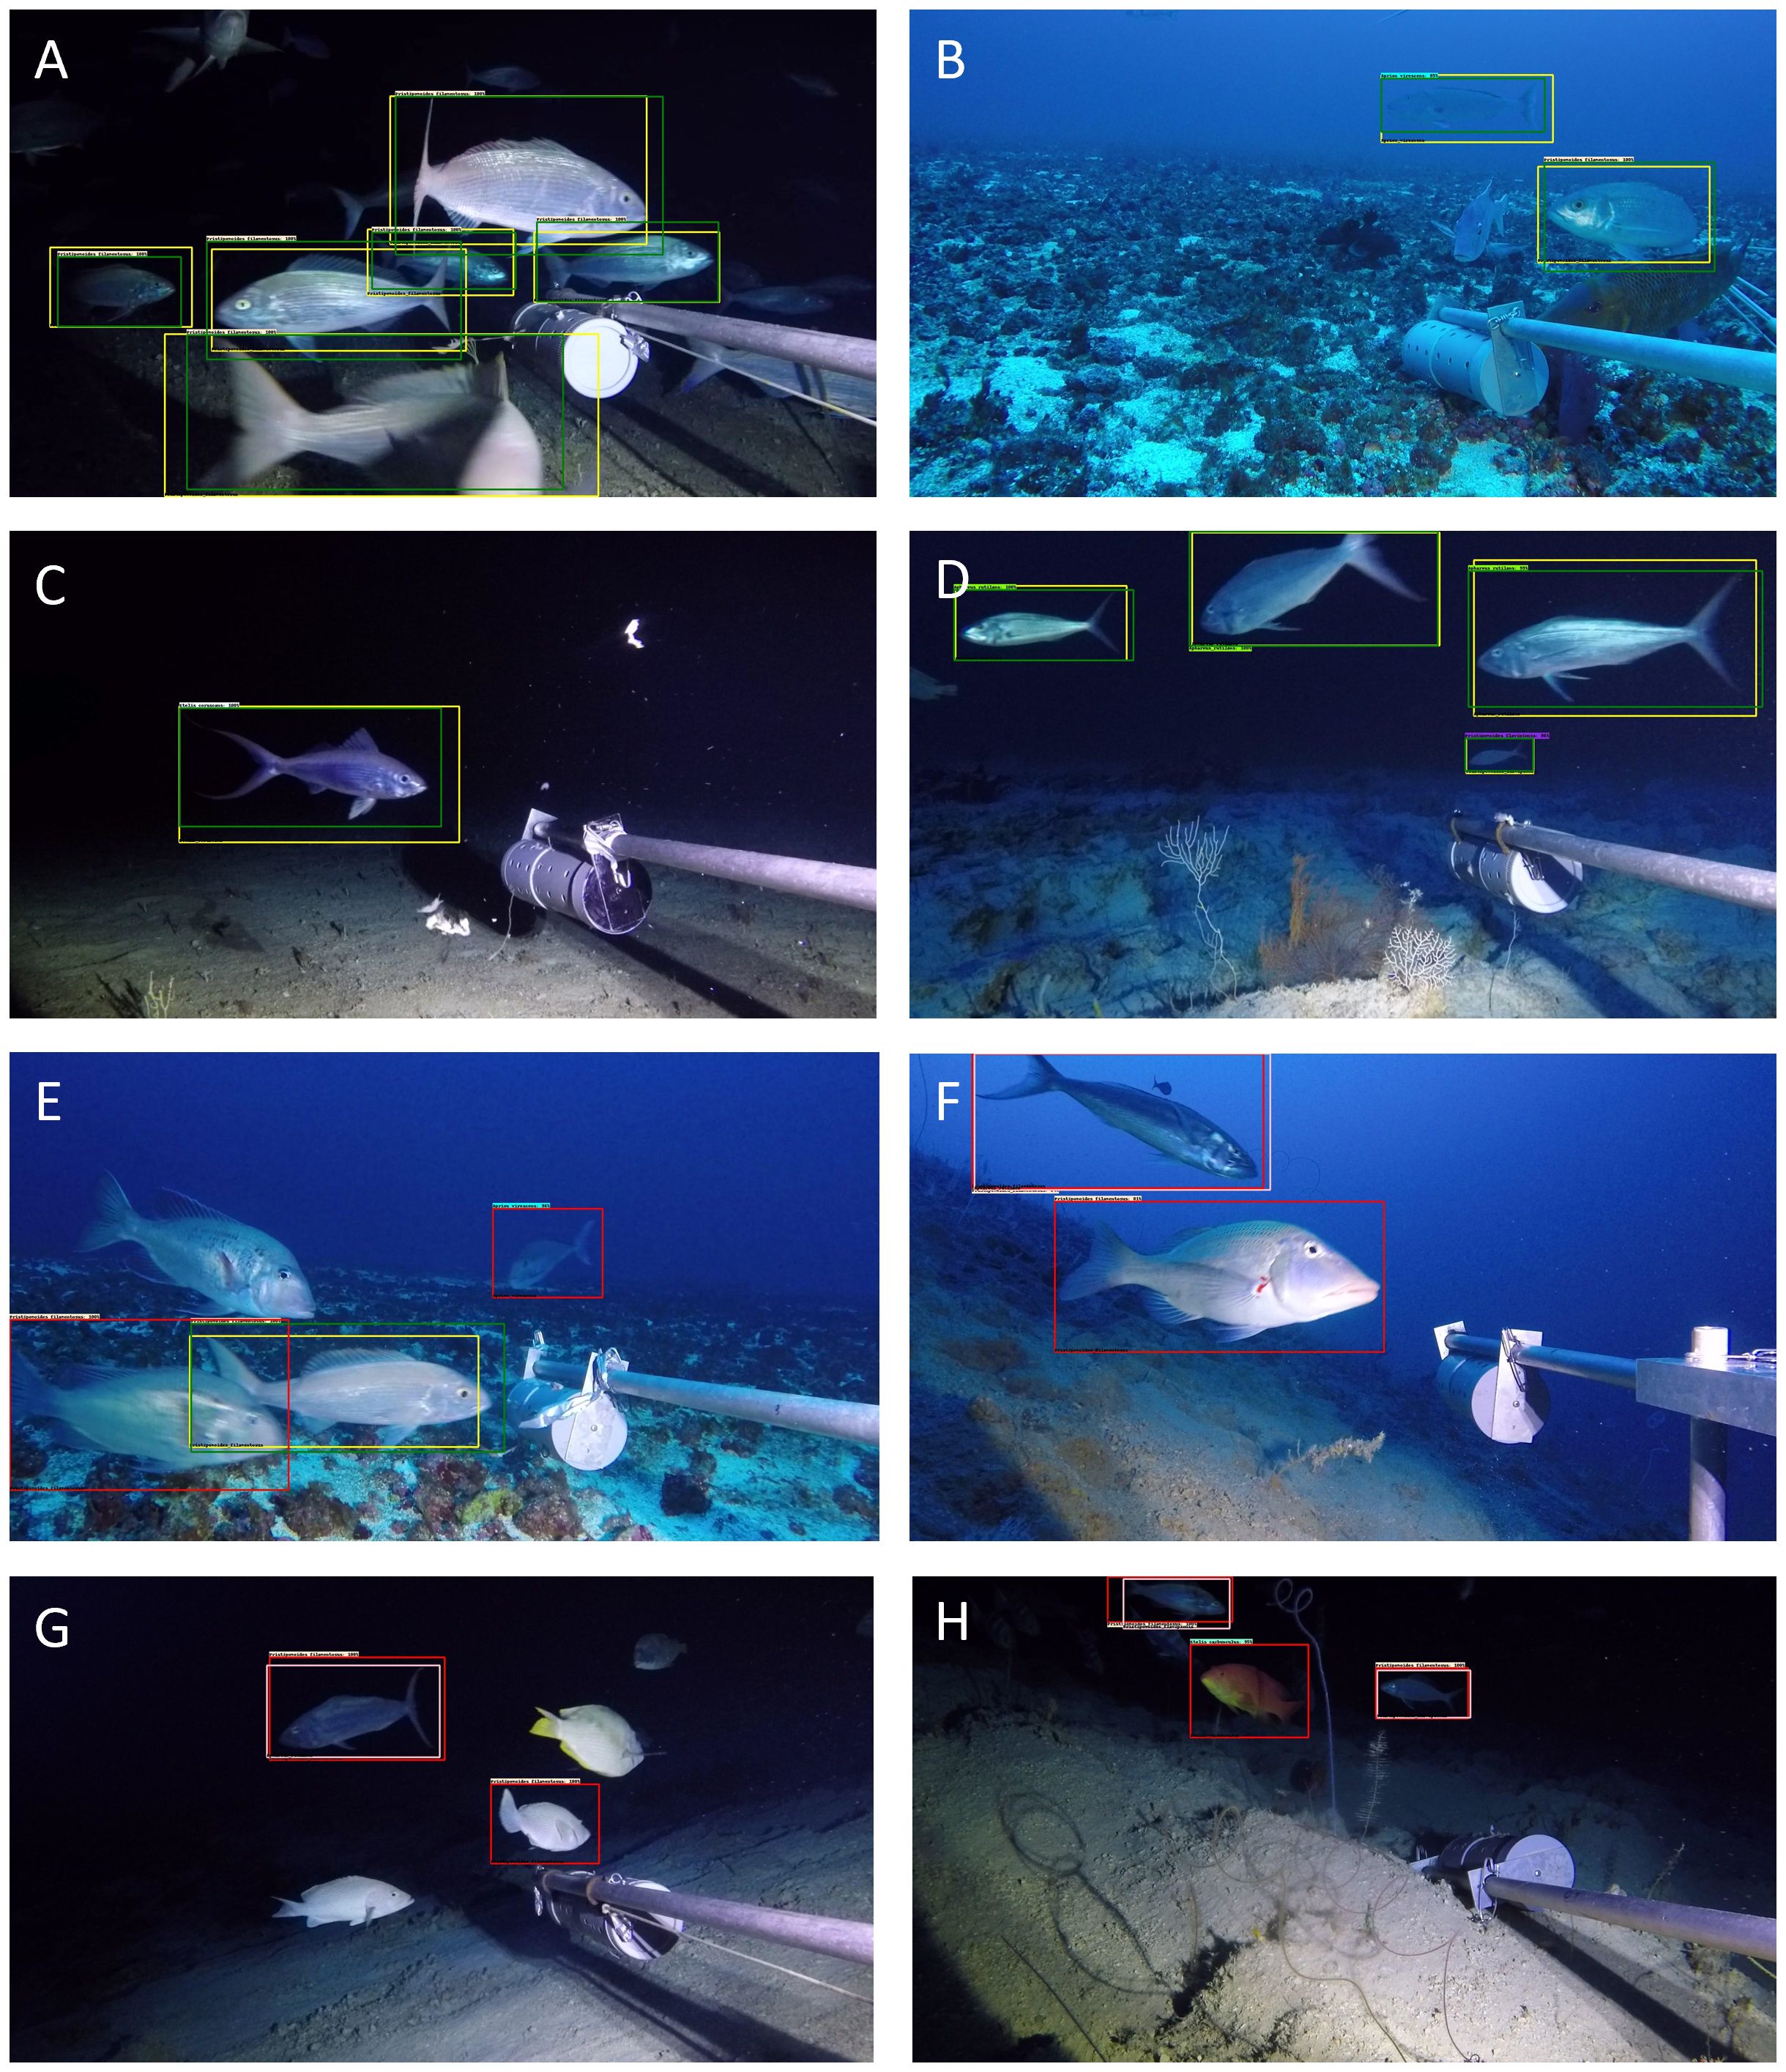
Figure 1. Examples of correct (A–D) and incorrect (E–H) detections on the test dataset. (A) Six correct detections of Pristipomoides filamentosus, (B) correct detection of Aphareus rutilans and P.filamentosus while correctly leaving two emperors Lethrinus miniatus and a grouper Epinephelus maculatus. (C) Correct detection of Etelis coruscans. (D) Correct detection of three A. rutilans and a single Pristipomoides flavipinnis. (E) Correct detection of the single P.filamentosus with incorrect detection of an emperor (Gymnocranius euanus) as P. filamentosus and a surgeonfish (Naso hexacanthus) as Aprion virescens. (F) Incorrect classification of a. rutilans and an emperor (L. miniatus) as P.filamentosus. (G) Incorrect classification of A. rutilans and a grouper (Epinephelus chlorostigma) as P. filamentosus, (H) incorrect classification of two P. flavipinnis as P.filamentosus and a grouper (Variola louti) as Etelis carbunculus.
The semi-automatic approach, in which the expert corrected classification errors, showed an F-measure ranging from 0.15 to 1 (Table 2). A drastic increase in performance metrics was observed for species with higher number of annotations (>186), with semi-automatic F-measures ranging from 0.86 for A. virescens to 1 for E. coruscans, which showed no more false negatives in the testing dataset. P. filamentosus, with the highest number of images tested (1,303), returned an F-value of 0.97 compared to 0.86 without correction. The largest increase in F value was for A. rutilans and P. flavipinnis, from 0.66 and 0.65 to 0.86 and 0.89, respectively.
For the analysis of fish abundance on whole BRUVS (MaxN), we focused on species with F-measures superior or equal to 0.71 (aka with more than 100 annotations, Table 2) as models with lower F-measures provided poor abundance estimates. High correlation coefficients were observed between manually and automatically estimated fish abundance (Figure 2; Table 3). Pearson Correlation coefficient ranged between 0.72 and 0.90 among species, with the highest values observed for Etelis coruscans and an overall value of 0.85 when combining data from all species.
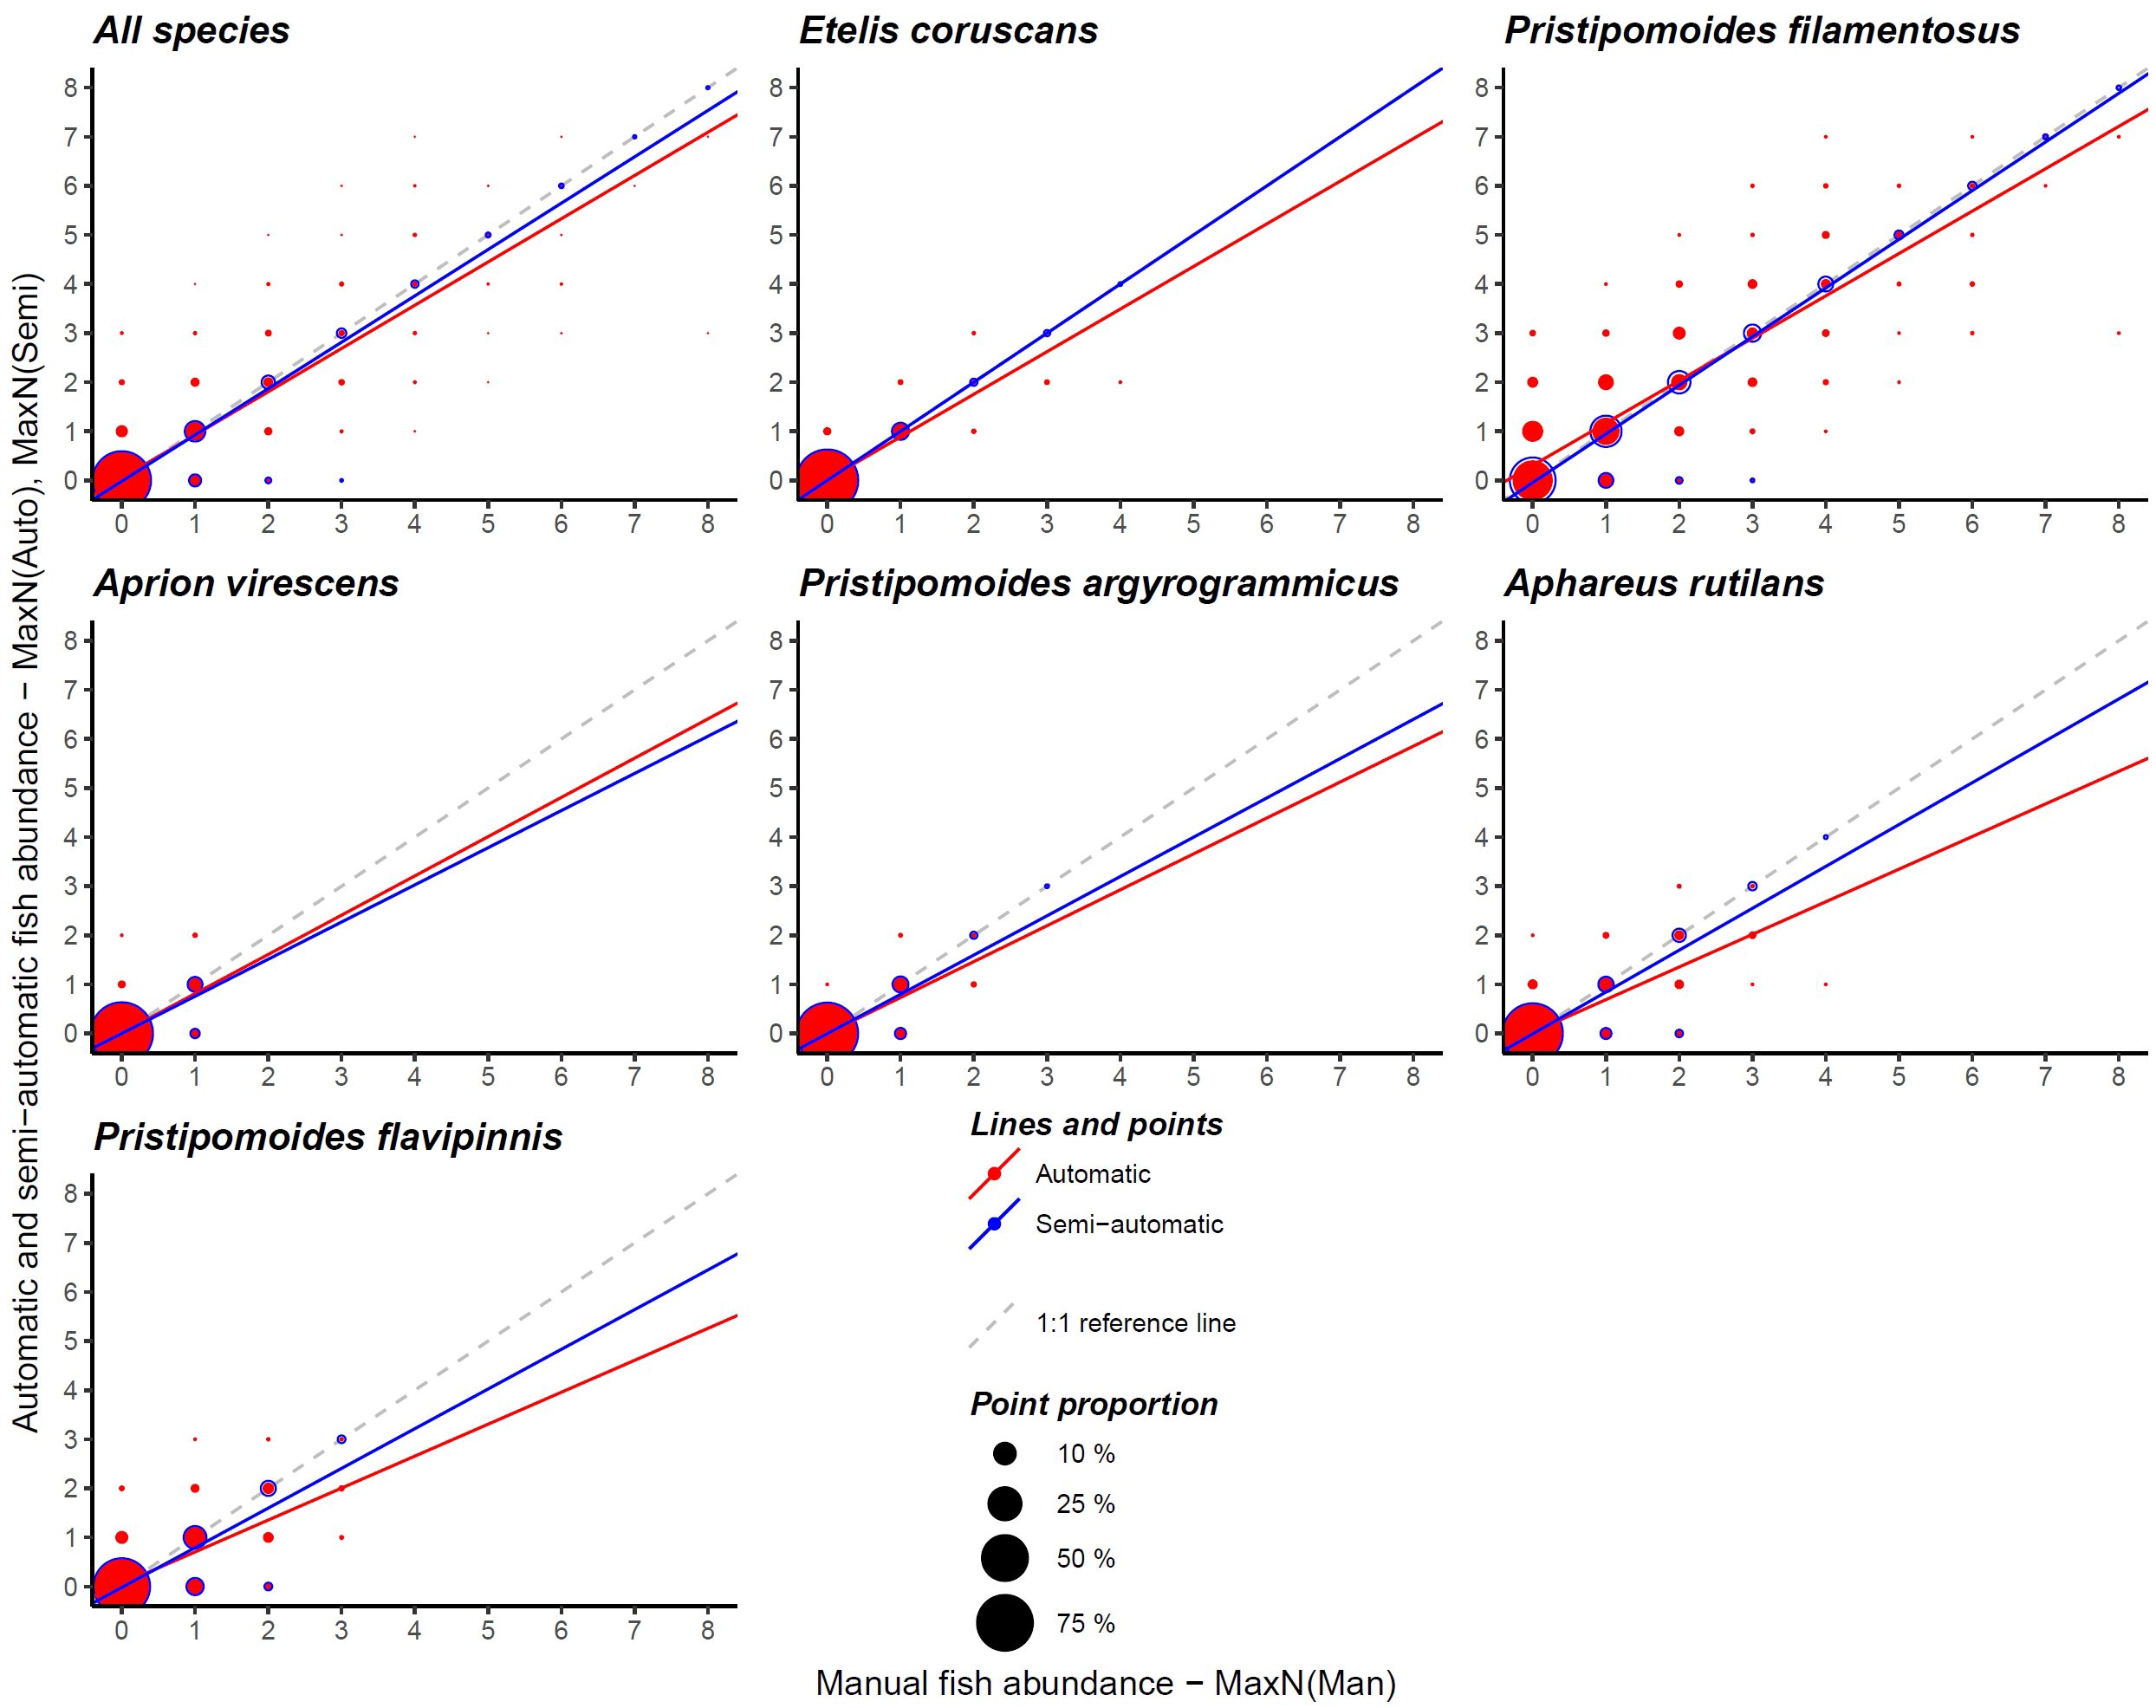
Figure 2. Comparison of manual (MaxNMan), automatic (MaxNAuto) and semi-automatic (MaxNSemi) fish abundance on baited remote underwater video stations (BRUVS) using the R-CNN trained on the deep-water snapper species. Only species with more than 100 annotations were considered relevant for this analysis. Point size is proportional to the number of detections against annotated fish. Automatic and semi-automatic linear fits are also shown with a dotted reference line of slope 1 and intercept 0.
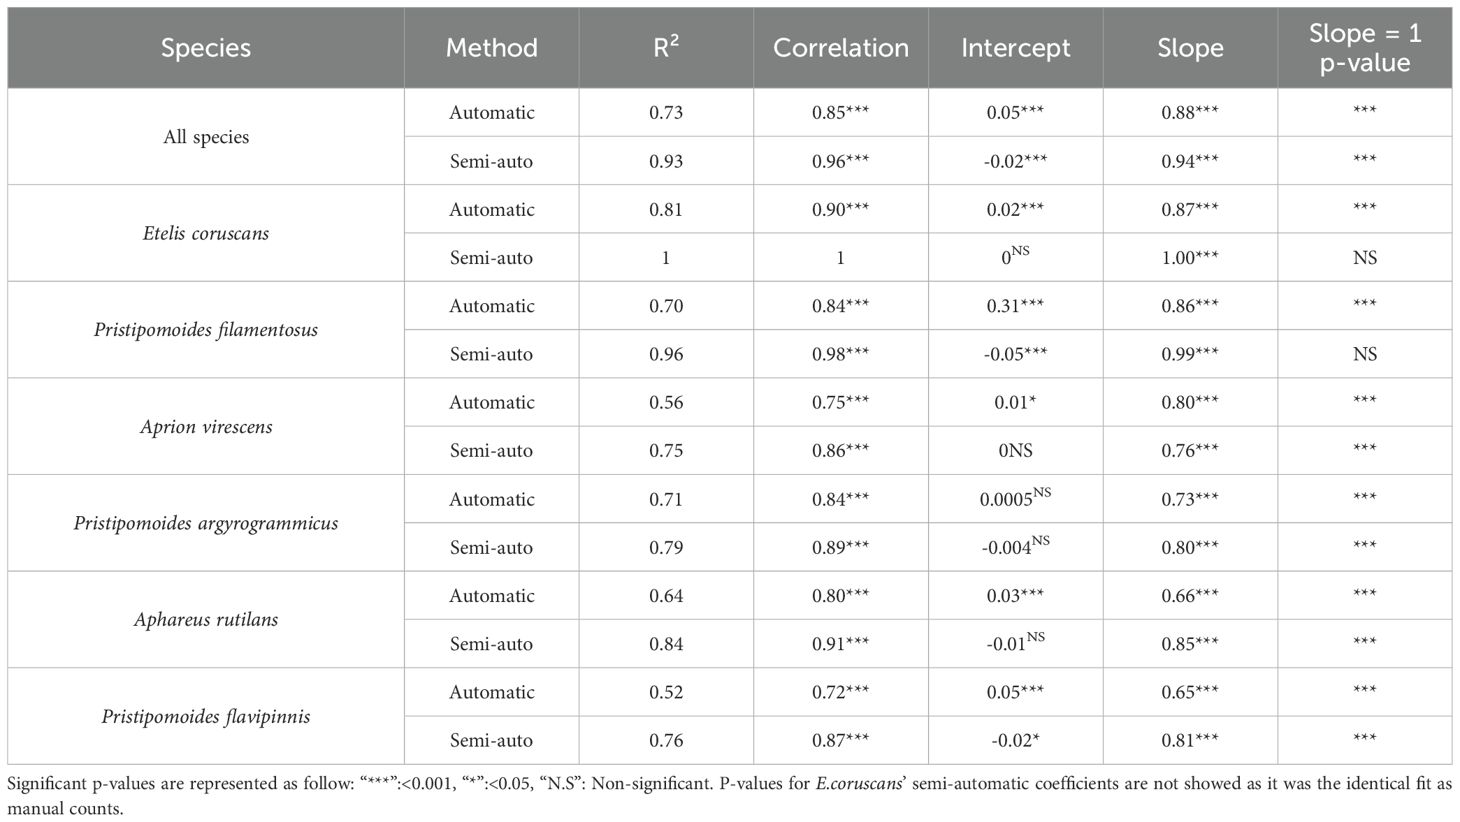
Table 3. R squared (R²), Pearson correlation coefficient (correlation), test of intercept against zero (intercept), test of slope against zero (slope) and test of slope against one (slope = 1 p-value) for automatic (MaxNAuto) and semi-automatic (MaxNsemi) counts.
The slope coefficient for each and all individual species were significantly different from zero (p< 0.001). However, while automatic fish abundances appeared comparable to manual abundances for up to three to four individuals in the same frame, the Faster R-CNN model tended to underestimate higher abundance with slope coefficients significantly smaller than 1 for all and each species. Slope coefficient ranged nonetheless between 0.65 and 0.88 with highest value found when considering all species together (Figure 2). Except for P. argyrogrammicus, all intercepts were significantly different from zero, but with marginal deviation (range: 0.01 to 0.05 except for P. filamentosus: 0.31).
The semi-automatic protocol yielded fish abundance estimates much closer to manual counts, with a Pearson correlation coefficient of 0.96 for all species combined (Figure 2; Table 3). Correlations ranged from 0.86 to 1 depending on the species. E. coruscans showed a perfect fit (slope = 1, intercept = 0) with semi-automatic MaxN identical to manual MaxN. The slope between MaxNMan and MaxNSemi was not significantly different from one for P. filamentosus, revealing extremely good semi-automatic model performance.
4 Discussion
The use of the Faster R-CNN algorithm to automatically detect, identify and count deep-water snappers proved successful and highly promising considering the challenge this group of fish presents and the variable background habitat. The algorithm effectively differentiated between species that were very similar and hard to distinguish, even for an experienced taxonomist. While the detection and identification will probably need post-verification until enough annotations are gathered to achieve automatic F-measures above 0.9 for all species, the abundance estimations were still consistent with manual counts. This procedure can already be employed for automatic deep-sea snapper monitoring, or semi-automatic monitoring, where observers would save substantial processing time by simply verifying and adjusting detections rather than processing entire BRUVS videos.
It is crucial for fisheries stock management to be able to work on the species level. This deep-water snappers’ dataset represents a fine addition to the collection with varying habitat constraints such as presence or absence of natural light and hard and soft substrates. Especially, this species group is challenging due to the similar appearance of its members. Deep-water snappers are mostly “greyish”, “fish-looking” species, posing a challenge in identification, particularly for P. filamentosus and P. flavipinnis which share almost identical characteristics (Figure 3). E. coruscans stands out with its reddish color and long elongated tail tips, allowing the algorithm to distinguish it from other species, and lead to the highest recall, precision, and F-measure metrics. Furthermore, the semi-automatic treatment of E. coruscans yielded individual detections and abundance values that matched the manual estimates perfectly. This is highly encouraging, considering E. coruscans is a highly targeted species of this fishery (Newman et al., 2016). P. filamentosus had the highest number of annotations and images, which likely explains its high identification success rate. The bigger the training database per feature, the better the identification for the Faster R-CNN algorithm, which typically requires at least 1,300 training images per feature to achieve over 95% certainty in fish identification (Villon et al., 2018). In our study, only two out of the 11 species studied (P. filamentosus and P. flavipinnis) met this training size requirement.
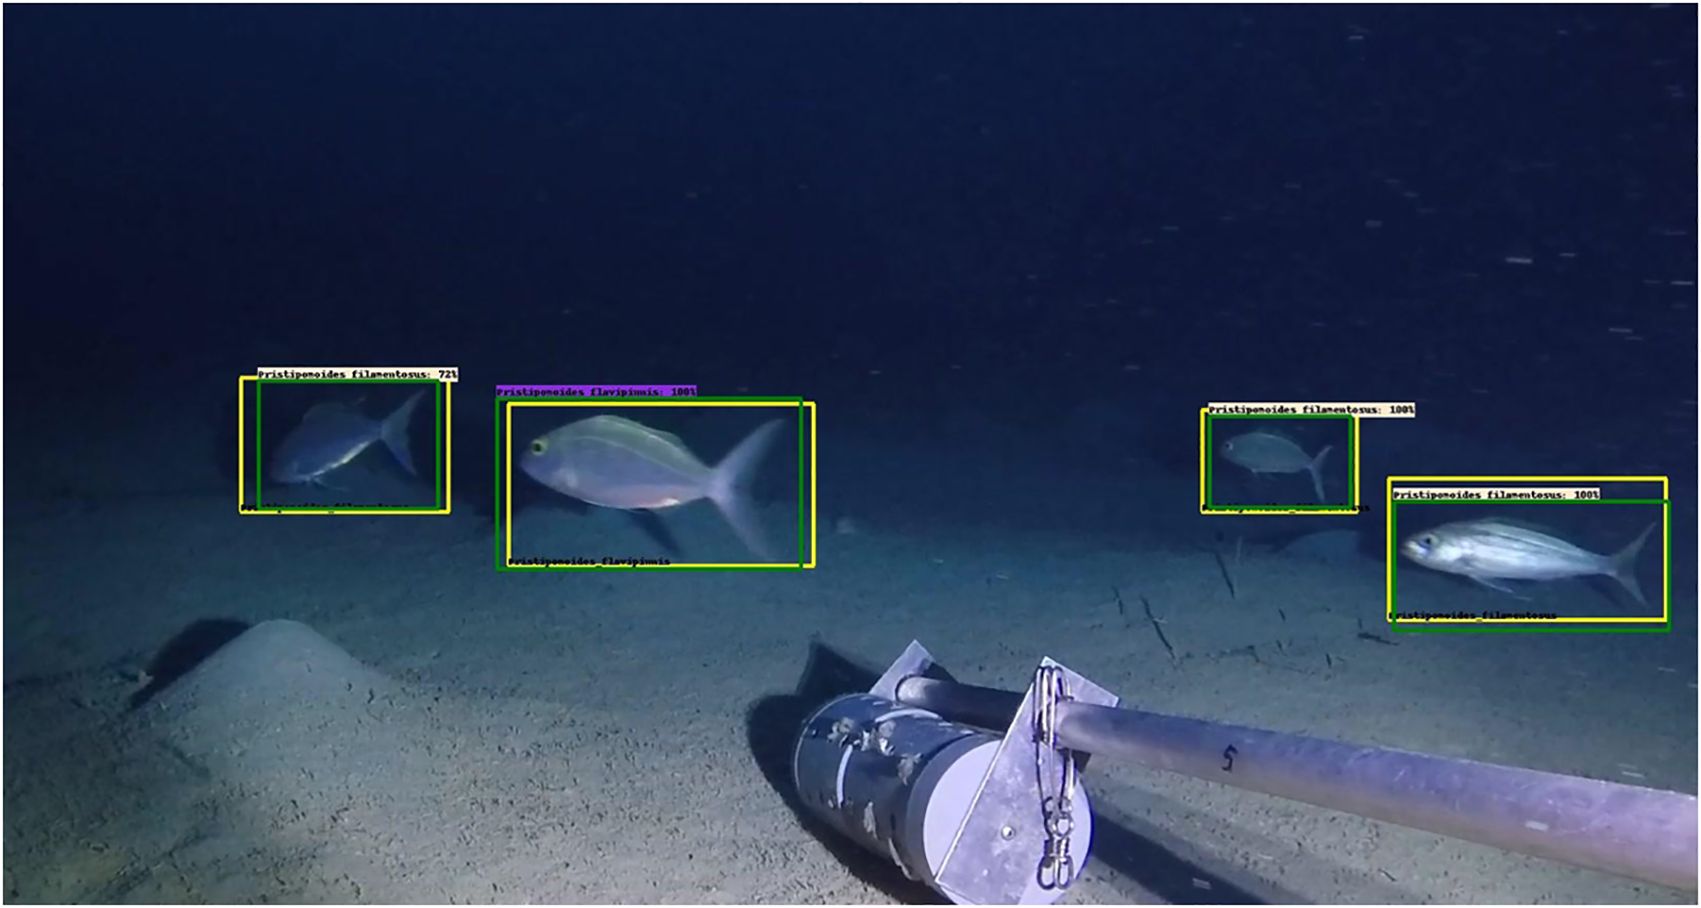
Figure 3. Correct automatic detection of closely related and similar-looking deep-water species Pristipomoides filamentosus (yellow) and P. flavipinnis (purple). The expert would be interested by the accentuated yellow eye color and recognize the slight vertical band pattern presented only by P.flavipinnis. Other frames before and after this image would have been required by the expert to confirm the identification.
While the human observer may browse through the video sequence to observe color, behavior, movements, and other clues to identify species and count individuals, the algorithm is restricted to each single image to decide. That the algorithm was able to effectively differentiate between snapper species with so little information at hand is therefore very encouraging. However, errors have still been observed with many false positives caused by rarer species (e.g., A. rutilans) being confused with the most common ones (P. filamentosus, Figure 1). This type of confusion was easily corrected by the intervention of an expert during the semi-automatic counting protocol as the fish still got detected. The expert fully corrected each false positive, and the precision became equal to one. Additionally, semi-automatic recall also increased compared to its value with the automatic protocol. This is because some fish were not detected in frames where other individuals were detected. Since the expert corrected the entire frames, undetected individuals were also annotated, thereby reducing the number of false negatives and increasing recall. For example, the recall of A. rutilans increased from 0.66 to 0.80, indicating that this species was present in many frames with other detected species. However, the recall of A. virescens remained the same, indicating that no further detections of this species occurred on frames where other snappers were detected by the algorithm. The confusion problem between species could be partly due to the disparity in available images between similar species, with those with fewer images being misclassified more often than those with more images. While a semi-automatic protocol can partly address the issue, an alternative solution might involve adding temporal information through motion analysis or a tracking algorithm that would isolate the background or follow the same individuals, thereby adding detection and identification information from previous frames to subsequent ones (Shin, 2016; Jalal et al., 2020). The other major constraint highlighted in this study is the underestimation bias at higher abundances. We observed that frames involving many fish can become easily saturated (notably P. filamentosus, cf. Figure 1A) with few individuals blocking the camera’s field of view. This bias in the algorithm seems rather inevitable due to its dependance to the technical video sampling system with a single sensor and angle of view. The MaxN abundance index based on the maximum number of fish present in the same frame is known to be sensitive to the phenomenon of image saturation (MacNeil et al., 2020). It is also reported in another study working on a different species of snapper in a different configuration (daylight reef) (Connolly et al., 2021). Our semi-automatic protocol could correct this bias for the two species that presented the highest MaxN, E. coruscans and P. filamentosus, yielding F-measure > 0.96 after correction by an expert taxonomist. The tracking of individuals across successive frames might also permit a better differentiation of individuals saturating images, hence reducing or removing the bias in MaxN at high abundance, as the expert usually also does.
We are confident that our trained Faster R-CNN algorithm is already operational for fisheries assessment using our semi-automatic detection procedure. The whole process using BRUVS to assess fish abundance is nondestructive, independent from fisheries data and may today become cost-effective with the support of artificial intelligence. Our model, as it is, can provide a matrix of detections per species for each frame of the video stations. The frames with the greatest number of detections per species can then be identified and used as references to define video intervals of a few seconds including the MaxN of the different species. These short video sequences could then be processed by biologists using programs like EventMeasure, reducing hours of video processing to minutes. Furthermore, the manual processing of the short video sequences would be limited to simply correcting algorithmic detections, which would further speed up the process. Additionally, new annotations should be used to retrain the algorithm and further improve its performance. If stereo cameras are used, then fish size could be measured in addition to abundance. Although size-measurements are performed manually so far using programs like EventMeasure (Letessier et al., 2015), algorithms exist to automatically measure object dimensions on videos like with instance segmentation (Othman et al., 2018; Garcia-d’Urso et al., 2022). Their ongoing development represents the next stage and their application on BRUVS and fisheries management is warranted.
Some caveats can still be discussed for further improvement. The uneven distribution of training images among species calls for an increased sampling to complete the dataset and improve identification accuracy (Villon et al., 2018). Our current algorithm may still drastically reduce annotation times for rarer species as they are detected but mostly confused with more occurring species. However, rarity is a key characteristic of biodiversity, and a large number of annotations can remain difficult to gather for the rarest species (Villon et al., 2022). In this case, methods like the few shots deep learning algorithm could be coupled with the Faster R-CNN to compensate for the lack of annotations (Villon et al., 2021). A coupling with other BRUVS datasets from other regions may also improve the algorithm performances but may then face issues related to changes in environmental conditions across regions (Kalogeiton et al., 2016). However, while our study relied on a dataset restricted to New Caledonia, the sampling occurred across the spatially immense EEZ and across depth ranging from shallow photic seamounts (50-60 meters deep) to deep aphotic seamounts and continental deep slopes (150-500 meters deep), exploring diverse environmental backgrounds and light intensities (Baletaud et al., 2023).
While this case study involved a particularly constraining group of species (looking-alike deep-water snappers), in variable background conditions of light and habitats, it further shows that the Faster R-CNN is a worthy algorithm architecture that may be used in many use-case scenarios involving fish species detection. The methodology is applicable to any visually identifiable fish species provided sufficient training images for the model, as is the main constraint for any deep learning development (Ahmad et al., 2023). New CNN architectures are released more and more frequently, improving classification speed and accuracy, and their review using this new dataset will prove interesting although not in the scope of this study. The potential for deep learning to improve the day-to-day work of marine scientists in monitoring fisheries seems certified for the future (Zhang et al., 2021). The transition is progressive, and a semi-automatic approach may be yet closer to being adopted by operational monitoring organizations or consultancy firms using this work.
Data availability statement
The original contributions presented in the study are included in the article/supplementary material, further inquiries can be directed to bGF1cmVudC52aWdsaW9sYUBpcmQuZnI=.
Ethics statement
Ethical approval was not required for this study involving animals captured by video in accordance with the local legislation and institutional requirements because the data analyzed was from a previous study.
Author contributions
FB: Conceptualization, Data curation, Formal analysis, Investigation, Methodology, Software, Validation, Visualization, Writing – original draft, Writing – review & editing. SV: Conceptualization, Data curation, Formal analysis, Methodology, Software, Validation, Visualization, Writing – review & editing. AG: Conceptualization, Funding acquisition, Project administration, Resources, Supervision, Writing – review & editing. J-MC: Funding acquisition, Project administration, Resources, Supervision, Writing – review & editing. SF: Data curation, Investigation, Resources, Writing – review & editing. CI: Conceptualization, Funding acquisition, Methodology, Project administration, Resources, Writing – review & editing. LV: Conceptualization, Funding acquisition, Investigation, Methodology, Project administration, Resources, Supervision, Validation, Visualization, Writing – review & editing.
Funding
The author(s) declare that financial support was received for the research, authorship, and/or publication of this article. The study was funded by grant ANR “SEAMOUNTS” #ANR-18-CE02-0016, the French Oceanographic Fleet, and IRD core funding. FB was supported by grant ANRT CIFRE #2019/0105.
Acknowledgments
We would like to thank the many undergrad students and technical staffs for their help in the annotation process at the lab. Data was collected under permits 2019-733/GNC, 2020-503/GNC and 2020-1077/GNC delivered by the Government of New-Caledonia, 898-2019/ARR/DENV, 3066-2019/ARR/DENV, 844-2020/ARR/DDDT and 1955-2020/ARR/DDDT delivered by the Southern Province of New-Caledonia, and 609011/2019/DEPART/JJC, 609011-18/2019/DEPART/JJC and 609011-39/2020/DEPART/JJC delivered by the Northern Province of New-Caledonia.
Conflict of interest
FB, AG ang J-MC was employed by Groupe GINGER.
The remaining authors declare that the research was conducted in the absence of any commercial or financial relationships that could be construed as a potential conflict of interest.
Publisher’s note
All claims expressed in this article are solely those of the authors and do not necessarily represent those of their affiliated organizations, or those of the publisher, the editors and the reviewers. Any product that may be evaluated in this article, or claim that may be made by its manufacturer, is not guaranteed or endorsed by the publisher.
References
Ahmad U., Junaid Ali M., Ahmed Khan F., Ahmad Khan A., Ur Rehman A., Muhammad Ali Shahid M., et al. (2023). Large scale fish images classification and localization using transfer learning and localization aware CNN architecture. Comput. Syst. Sci. Eng. 45, 2125–2140. doi: 10.32604/csse.2023.031008
Ammar A., Koubaa A., Ahmed M., Saad A., Benjdira B. (2019). Aerial images processing for car detection using convolutional neural networks: comparison between faster R-CNN and YoloV3. Electronics (Basel) 10, 820. doi: 10.3390/electronics10070820
Ault J. S., Smith S. G., Richards B. L., Yau A. J., Langseth B. J., O’Malley J. M., et al. (2018). Towards fishery-independent biomass estimation for Hawaiian Islands deepwater snappers. Fish Res. 208, 321–328. doi: 10.1016/j.fishres.2018.08.012
Baletaud F., Lecellier G., Gilbert A., Mathon L., Côme J.-M., Dejean T., et al. (2023). Comparing seamounts and coral reefs with eDNA and BRUVS reveals oases and refuges on shallow seamounts. Biol. (Basel) 12, 1446. doi: 10.3390/biology12111446
Bhalla S., Kumar A., Kushwaha R. (2024). Analysis of recent techniques in marine object detection: a review. Multimed Tools Appl. doi: 10.1007/s11042-024-19782-9
Blowers S., Evans J., Mcnally K. (2020). Automated identification of fish and other aquatic life in underwater video. Scottish Mar. Freshw. Sci. 11, 1–62. doi: 10.7489/12333-1
Boldt J. L., Williams K., Rooper C. N., Towler R. H., Gauthier S. (2018). Development of stereo camera methodologies to improve pelagic fish biomass estimates and inform ecosystem management in marine waters. Fish Res. 198, 66–77. doi: 10.1016/j.fishres.2017.10.013
Bond T., Partridge J. C., Taylor M. D., Cooper T. F., McLean D. L. (2018). The influence of depth and a subsea pipeline on fish assemblages and commercially fished species. PloS One 13, e0207703. doi: 10.1371/journal.pone.0207703
Bose S. R., Kumar V. S. (2020). Efficient inception V2 based deep convolutional neural network for real-time hand action recognition. IET Image Process 14, 688–696. doi: 10.1049/iet-ipr.2019.0985
Cappo M., De’ath G., Speare P. (2007). Inter-reef vertebrate communities of the Great Barrier Reef Marine Park determined by baited remote underwater video stations. Mar. Ecol. Prog. Ser. 350, 209–221. doi: 10.3354/meps07189
Cappo M., Speare P., De’ath G. (2004). Comparison of baited remote underwater video stations (BRUVS) and prawn (shrimp) trawls for assessments of fish biodiversity in inter-reefal areas of the Great Barrier Reef Marine Park. J. Exp. Mar. Biol. Ecol. 302, 123–152. doi: 10.1016/j.jembe.2003.10.006
Chen M.-H., Lai T.-H., Chen Y.-C., Chou T.-Y. (2023). A robust fish species classification framework: FRCNN-VGG16-SPPNet. doi: 10.21203/rs.3.rs-2825927/v1
Christin S., Hervet É., Lecomte N. (2019). Applications for deep learning in ecology. Methods Ecol. Evol. 10, 1632–1644. doi: 10.1111/2041-210X.13256
Connolly R. M., Fairclough D. V., Jinks E. L., Ditria E. M., Jackson G., Lopez-Marcano S., et al. (2021). Improved accuracy for automated counting of a fish in baited underwater videos for stock assessment. Front. Mar. Sci. 8. doi: 10.3389/fmars.2021.658135
Dalzell P., Preston G. L. (1992). Deep reef slope fishery resources of the South Pacific (Noumea (New Caledonia: South Pacific Commission).
Ellender B. R., Becker A., Weyl O. L. F., Swartz E. R. (2012). Underwater video analysis as a non-destructive alternative to electrofishing for sampling imperiled headwater stream fishes. Aquat Conserv. 22, 58–65. doi: 10.1002/aqc.1236
Elsken T., Metzen J. H., Hutter F. (2018). Neural architecture search: A survey. J. Mach. Learn. Res. 20, 1–21. doi: 10.48550/arXiv.1808.05377
Garcia-d’Urso N., Galan-Cuenca A., Pérez-Sánchez P., Climent-Pérez P., Fuster-Guillo A., Azorin-Lopez J., et al. (2022). The DeepFish computer vision dataset for fish instance segmentation, classification, and size estimation. Sci. Data 9, 287. doi: 10.1038/s41597-022-01416-0
Gladstone W., Lindfield S., Coleman M., Kelaher B. (2012). Optimization of baited remote underwater video sampling designs for estuarine fish assemblages. J. Exp. Mar. Biol. Ecol. 429, 28–35. doi: 10.1016/j.jembe.2012.06.013
Gomez C., Williams A. J., Nicol S. J., Mellin C., Loeun K. L., Bradshaw C. J. A. (2015). Species distribution models of tropical deep-sea snappers. PloS One 10, 1–17. doi: 10.1371/journal.pone.0127395
Griffin R. A., Robinson G. J., West A., Gloyne-Phillips I. T., Unsworth R. K. F. (2016). Assessing fish and motile fauna around offshore windfarms using stereo baited video. PloS One 11, 1–15. doi: 10.1371/journal.pone.0149701
He K., Zhang X., Ren S., Sun J. (2016). “Deep residual learning for image recognition,” in Proceedings of the IEEE conference on computer vision and pattern recognition, (Las Vegas: CVPR), 770–778. Available at: http://image-net.org/challenges/LSVRC/2015/.
Henderson C., Olds A., Lee S., Gilby B., Maxwell P., Connolly R., et al. (2017). Marine reserves and seascape context shape fish assemblages in seagrass ecosystems. Mar. Ecol. Prog. Ser. 566, 135–144. doi: 10.3354/meps12048
Jalal A., Salman A., Mian A., Shortis M., Shafait F. (2020). Fish detection and species classification in underwater environments using deep learning with temporal information. Ecol. Inform 57, 101088. doi: 10.1016/j.ecoinf.2020.101088
Jian M., Yang N., Tao C., Zhi H., Luo H. (2024). Underwater object detection and datasets: a survey. Intelligent Mar. Technol. Syst. 2, 9. doi: 10.1007/s44295-024-00023-6
Kaarmukilan S. P., Poddar S., Thomas A. K. (2020). “FPGA based Deep Learning Models for Object Detection and Recognition Comparison of Object Detection: Comparison of object detection models using FPGA,” in 2020 Fourth International Conference on Computing Methodologies and Communication (ICCMC) (Erode, India: IEEE), 471–474. doi: 10.1109/ICCMC48092.2020.ICCMC-00088
Kalogeiton V., Ferrari V., Schmid C. (2016). Analyzing domain shift factors between videos and images for object detection. IEEE Trans. Pattern Anal. Mach. Intell. 38, 2327–2334. doi: 10.1109/TPAMI.2016.2551239
Kim C. E., Dar Oghaz M. M., Fajtl J., Argyriou V., Remagnino P. (2018). “A comparison of embedded deep learning methods for person detection,” in VISIGRAPP 2019 - Proceedings of the 14th International Joint Conference on Computer Vision, Imaging and Computer Graphics Theory and Applications, vol. 5. , 459–465. doi: 10.5220/0007386304590465
Langlois T., Goetze J., Bond T., Monk J., Abesamis R. A., Asher J., et al. (2020). A field and video annotation guide for baited remote underwater stereo-video surveys of demersal fish assemblages. Methods Ecol. Evol. 11, 1401–1409. doi: 10.1111/2041-210X.13470
Lee Y.-H., Kim Y. (2020). Comparison of CNN and YOLO for object detection. J. Semiconductor Display Technol. 19, 85–92.
Lee J., Wang P., Xu R., Dasari V., Weston N., Li Y., et al. (2021). “Benchmarking video object detection systems on embedded devices under resource contention,” in Proceedings of the 5th International Workshop on Embedded and Mobile Deep Learning (ACM, New York, NY, USA), 19–24. doi: 10.1145/3469116.3470010
Letessier T. B., Juhel J. B., Vigliola L., Meeuwig J. J. (2015). Low-cost small action cameras in stereo generates accurate underwater measurements of fish. J. Exp. Mar. Biol. Ecol. 466, 120–126. doi: 10.1016/j.jembe.2015.02.013
Letessier T. B., Mouillot D., Bouchet P. J., Vigliola L., Fernandes M. C., Thompson C., et al. (2019). Remote reefs and seamounts are the last refuges for marine predators across the Indo-Pacific. PloS Biol. 17, e3000366. doi: 10.1371/journal.pbio.3000366
Lin T.-Y., Maire M., Belongie S., Hays J., Perona P., Ramanan D., et al. (2014). “Microsoft COCO: Common Objects in Context,” (Cham: Springer) 740–755. doi: 10.1007/978-3-319-10602-1_48
Liu M., Jiang W., Hou M., Qi Z., Li R., Zhang C. (2023). A deep learning approach for object detection of rockfish in challenging underwater environments. Front. Mar. Sci. 10. doi: 10.3389/fmars.2023.1242041
Lopez-Marcano S., Brown C. J., Sievers M., Connolly R. M. (2021). The slow rise of technology: Computer vision techniques in fish population connectivity. Aquat Conserv. 31, 210–217. doi: 10.1002/aqc.3432
MacNeil M. A., Chapman D. D., Heupel M., Simpfendorfer C. A., Heithaus M., Meekan M., et al. (2020). Global status and conservation potential of reef sharks. Nature 583, 801–806. doi: 10.1038/s41586-020-2519-y
Mahendrakar T., Ekblad A., Fischer N., White R., Wilde M., Kish B., et al. (2022). “Performance study of YOLOv5 and faster R-CNN for autonomous navigation around non-cooperative targets,” in 2022 IEEE Aerospace Conference (AERO) (Big Sky, MT, USA: IEEE), 1–12. doi: 10.1109/AERO53065.2022.9843537
Mandal R., Connolly R. M., Schlacher T. A., Stantic B. (2018). “Assessing fish abundance from underwater video using deep neural networks,” in 2018 International Joint Conference on Neural Networks (IJCNN) (Rio de Janeiro, Brazil: IEEE), 1–6. doi: 10.1109/IJCNN.2018.8489482
Mannocci L., Villon S., Chaumont M., Guellati N., Mouquet N., Iovan C., et al. (2021). Leveraging social media and deep learning to detect rare megafauna in video surveys. Conserv. Biol. 36, 1–11. doi: 10.1111/cobi.13798
Marrable D., Barker K., Tippaya S., Wyatt M., Bainbridge S., Stowar M., et al. (2022). Accelerating species recognition and labelling of fish from underwater video with machine-assisted deep learning. Front. Mar. Sci. 9. doi: 10.3389/fmars.2022.944582
Moore C. H., Drazen J. C., Kelley C. D., Misa W. F. X. E. (2013). Deepwater marine protected areas of the main Hawaiian Islands: Establishing baselines for commercially valuable bottom fish populations. Mar. Ecol. Prog. Ser. 476, 167–183. doi: 10.3354/meps10132
Newman S. J., Williams A. J., Wakefield C. B., Nicol S. J., Taylor B. M., O’Malley J. M. (2016). Review of the life history characteristics, ecology and fisheries for deep-water tropical demersal fish in the Indo-Pacific region. Rev. Fish Biol. Fish 26, 537–562. doi: 10.1007/s11160-016-9442-1
Osgood G. J., McCord M. E., Baum J. K. (2019). Using baited remote underwater videos (BRUVs) to characterize chondrichthyan communities in a global biodiversity hotspot. PloS One 14, e0225859. doi: 10.1371/journal.pone.0225859
Othman N. A., Salur M. U., Karakose M., Aydin I. (2018). “An embedded real-time object detection and measurement of its size,” in 2018 International Conference on Artificial Intelligence and Data Processing (IDAP) (Malatya, Turkey: IEEE), 1–4. doi: 10.1109/IDAP.2018.8620812
Payri C. E., Allain V., Aucan J., David C., David V., Dutheil C., et al. (2019). “New Caledonia,” in World Seas: An Environmental Evaluation (Elsevier), 593–618.
Reis-Filho J. A., Schmid K., Harvey E. S., Giarrizzo T. (2019). Coastal fish assemblages reflect marine habitat connectivity and ontogenetic shifts in an estuary-bay-continental shelf gradient. Mar. Environ. Res. 148, 57–66. doi: 10.1016/j.marenvres.2019.05.004
Ren S., He K., Girshick R., Sun J. (2017). “Faster R-CNN: Towards real-time object detection with region proposal networks,” in IEEE Trans Pattern Anal Mach Intell. 39, 1137–1149. doi: 10.1109/TPAMI.2016.2577031
Saleh A., Sheaves M., Jerry D., Azghadi M. R. (2024). Applications of Deep Learning in Fish Habitat Monitoring: A Tutorial and Survey. Available online at: http://arxiv.org/abs/2206.05394.
Saleh A., Sheaves M., Rahimi Azghadi M. (2022). Computer vision and deep learning for fish classification in underwater habitats: A survey. Fish Fisheries 23, 977–999. doi: 10.1111/faf.12666
Sarma K. S. R. K., Sasikala C., Surendra K., Erukala S., Aruna S. L. (2024). A comparative study on faster R-CNN, YOLO and SSD object detection algorithms on HIDS system, in AIP Conference Proceedings, 060044. doi: 10.1063/5.0195857.
Schmid K., Reis-Filho J. A., Harvey E., Giarrizzo T. (2017). Baited remote underwater video as a promising nondestructive tool to assess fish assemblages in clearwater Amazonian rivers: testing the effect of bait and habitat type. Hydrobiologia 784, 93–109. doi: 10.1007/s10750-016-2860-1
Schobernd Z. H., Bacheler N. M., Conn P. B. (2014). Examining the utility of alternative video monitoring metrics for indexing reef fish abundance. Can. J. Fisheries Aquat. Sci. 71, 464–471. doi: 10.1139/cjfas-2013-0086
Schramm K. D., Marnane M. J., Elsdon T. S., Jones C., Saunders B. J., Goetze J. S., et al. (2020). A comparison of stereo-BRUVs and stereo-ROV techniques for sampling shallow water fish communities on and off pipelines. Mar. Environ. Res. 162, 105198. doi: 10.1016/j.marenvres.2020.105198
Schramm K. D., Marnane M. J., Elsdon T. S., Jones C. M., Saunders B. J., Newman S. J., et al. (2021). Fish associations with shallow water subsea pipelines compared to surrounding reef and soft sediment habitats. Sci. Rep. 11, 1–15. doi: 10.1038/s41598-021-85396-y
Sekachev B., Manovich N., Zhiltsov M., Zhavoronkov A., Kalinin D., Hoff B., et al. (2020). doi: 10.5281/zenodo.4009388
Sheaves M., Bradley M., Herrera C., Mattone C., Lennard C., Sheaves J., et al. (2020). Optimizing video sampling for juvenile fish surveys: Using deep learning and evaluation of assumptions to produce critical fisheries parameters. Fish Fisheries 21, 1259–1276. doi: 10.1111/faf.12501
Shin K. J. (2016). Robot fish tracking control using an optical flow object-detecting algorithm. IEIE Trans. Smart Process. Computing 5, 375–382. doi: 10.5573/IEIESPC.2016.5.6.375
Szegedy C., Liu W., Jia Y., Sermanet P., Reed S., Anguelov D., et al. (2015). “Going deeper with convolutions,” in Proceedings of the IEEE conference on computer vision and pattern recognition. (Boston: CVPR), 1–9.
Tseng C.-H., Kuo Y.-F. (2020). Detecting and counting harvested fish and identifying fish types in electronic monitoring system videos using deep convolutional neural networks. ICES J. Mar. Sci. 77, 1367–1378. doi: 10.1093/icesjms/fsaa076
Villon S., Iovan C., Mangeas M., Claverie T., Mouillot D., Villéger S., et al. (2021). Automatic underwater fish species classification with limited data using few-shot learning. Ecol. Inform 63, 101320. doi: 10.1016/j.ecoinf.2021.101320
Villon S., Iovan C., Mangeas M., Vigliola L. (2022). Confronting deep-learning and biodiversity challenges for automatic video-monitoring of marine ecosystems. Sensors 22, 497. doi: 10.3390/s22020497
Villon S., Mouillot D., Chaumont M., Darling E. S., Subsol G., Claverie T., et al. (2018). A Deep learning method for accurate and fast identification of coral reef fishes in underwater images. Ecol. Inform 48, 238–244. doi: 10.1016/j.ecoinf.2018.09.007
Villon S., Mouillot D., Chaumont M., Subsol G., Claverie T., Villéger S. (2020). A new method to control error rates in automated species identification with deep learning algorithms. Sci. Rep. 10, 10972. doi: 10.1038/s41598-020-67573-7
Wakefield C. B., Williams A. J., Fisher E. A., Hall N. G., Hesp S. A., Halafihi T., et al. (2020). Variations in life history characteristics of the deep-water giant ruby snapper (Etelis sp.) between the Indian and Pacific Oceans and application of a data-poor assessment. Fish Res. 230, 105651. doi: 10.1016/j.fishres.2020.105651
Wellington C. M., Harvey E. S., Wakefield C. B., Langlois T. J., Williams A., White W. T., et al. (2018). Peak in biomass driven by larger-bodied meso-predators in demersal fish communities between shelf and slope habitats at the head of a submarine canyon in the south-eastern Indian Ocean. Cont Shelf Res. 167, 55–64. doi: 10.1016/j.csr.2018.08.005
Whitmarsh S. K., Fairweather P. G., Huveneers C. (2017). What is Big BRUVver up to? Methods and uses of baited underwater video. Rev. Fish Biol. Fish 27, 53–73. doi: 10.1007/s11160-016-9450-1
Williams A. J., Nicol S. J., Bentley N., Starr P. J., Newman S. J., McCoy M. A., et al. (2012). International workshop on developing strategies for monitoring data-limited deepwater demersal line fisheries in the Pacific Ocean. Rev. Fish Biol. Fish 22, 527–531. doi: 10.1007/s11160-011-9234-6
Xu S., Zhang M., Song W., Mei H., He Q., Liotta A. (2023). A systematic review and analysis of deep learning-based underwater object detection. Neurocomputing 527, 204–232. doi: 10.1016/j.neucom.2023.01.056
Zhang R., Li S., Ji G., Zhao X., Li J., Pan M. (2021). Survey on deep learning-based marine object detection. J. Adv. Transp 2021, 1–18. doi: 10.1155/2021/5808206
Zhang E., Zhang Y. (2009). “F-measure,” in Encyclopedia of Database Systems (Springer US, Boston, MA), 1147–1147. doi: 10.1007/978-0-387-39940-9_483
Zhong Y., Wang J., Peng J., Zhang L. (2020). “Anchor box optimization for object detection,” in Proceedings of the IEEE/CVF Winter Conference on Applications of Computer Vision, (Snowmass, CO, USA: WACV), 1286–1294.
Keywords: deep-water snapper fisheries, artificial intelligence, semi-automatic, BRUVS, faster R-CNN
Citation: Baletaud F, Villon S, Gilbert A, Côme J-M, Fiat S, Iovan C and Vigliola L (2025) Automatic detection, identification and counting of deep-water snappers on underwater baited video using deep learning. Front. Mar. Sci. 12:1476616. doi: 10.3389/fmars.2025.1476616
Received: 06 August 2024; Accepted: 20 January 2025;
Published: 06 February 2025.
Edited by:
Maria Grazia Pennino, Spanish Institute of Oceanography (IEO), SpainReviewed by:
Andrés Fuster-Guilló, University of Alicante, SpainSuja Cherukullapurath Mana, PES University, India
Copyright © 2025 Baletaud, Villon, Gilbert, Côme, Fiat, Iovan and Vigliola. This is an open-access article distributed under the terms of the Creative Commons Attribution License (CC BY). The use, distribution or reproduction in other forums is permitted, provided the original author(s) and the copyright owner(s) are credited and that the original publication in this journal is cited, in accordance with accepted academic practice. No use, distribution or reproduction is permitted which does not comply with these terms.
*Correspondence: Florian Baletaud, ZmxvcmlhbmJhbGV0YXVkQGhvdG1haWwuY29t