 Margarita Rincón Hidalgo
 MariAngeles Gamaza
 MaJosé Zúñiga
 Fernando Ramos
 Jorge Tornero
94% of researchers rate our articles as excellent or good
Learn more about the work of our research integrity team to safeguard the quality of each article we publish.
Find out more
ORIGINAL RESEARCH article
Front. Mar. Sci., 24 March 2025
Sec. Marine Fisheries, Aquaculture and Living Resources
Volume 12 - 2025 | https://doi.org/10.3389/fmars.2025.1467442
This article is part of the Research TopicChallenges in Fishery Assessment MethodologiesView all 12 articles
Traditionally, parameters defining life history traits, such as growth, were solely determined through length or age–length databases and then included as fixed in integrated stock assessment models. In current practice, growth parameters are usually estimated within these models (“inside”) and fitted to other datasets. However, for short-lived and small pelagic species, challenges may arise, particularly when there is a high variability in the age–length data or sampling biases are inadequately identified or addressed by these models. To test model effectiveness in capturing the growth dynamics of these species, we propose a comparative analysis following recommended practices for incorporating age–length data into integrated stock assessment models for the specific case of anchovy (Engraulis encrasicolus) stock in the Gulf of Cadiz. The reason is twofold: its significant ecological and economic importance and the need to improve the accuracy of growth parameter estimates used to inform total allowable catch (TAC) scientific advice. The overarching goal of this analysis is to identify the optimal model configuration that provides accurate growth parameter estimates. Our approach shows that random effects can effectively estimate growth in species with high age–length variability. Furthermore, using the obtained estimates as fixed in the stock assessment model reduces computational time and enhances the goodness of fit, resulting in a more efficient model. The results address a significant gap in existing integrated models used for scientific advice, which often do not have the “random effects on parameters” feature. Notably, this framework is widely applicable to other short-lived small pelagic species that typically exhibit a high data variability, offering a valuable solution for improving efficiency and robustness in fisheries management decision-making.
Estimating fish growth is a fundamental step to evaluate fish populations and plays a crucial role in stock assessment models and fisheries management (Lee et al., 2024). Generally, growth can be defined as the change in length or weight over the life of an individual and directly influences fish survival, sexual maturity, reproductive success, as well as movement and migration (Peters, 1986). Accurate growth estimation enhances the understanding of fish population dynamics, productivity, and sustainability, particularly for short-lived, small pelagic species like anchovy, which are ecologically and commercially significant (Costalago et al., 2011; Gebremedhin et al., 2021). Within most stock assessment models used, growth is typically estimated through age-based approaches, relying on age determination techniques such as otolith analysis or length–frequency data (Rodríguez Mendoza, 2006). These models, when incorporating data for all the ages and lengths, help to evaluate the size composition and age structure and to estimate biological parameters accounting for growth changes produced by the effect of fishing. These advantages, among others (Lee et al., 2024), facilitate an informed decision-making process (Cope et al., 2023). However, estimating fish growth within stock assessment models may also present limitations since these models, used to handle a large amount of data, often assume that growth is uniform across the entire population, provide parameters not representative of the species biology influencing the stock status estimation (Lee et al., 2024), or require high computational time. This is the case of the integrated model Gadget (Globally applicable Area Disaggregated General Ecosystem Toolbox) (Begley and Howell, [[NoYear]]; Begley, 2004), which is an extensively used and a very flexible model that includes age–length dynamics [compared to others that only include length or age (Punt et al., 2020)]. However, Gadget could be very slow to run because it is not coded such that the gradients of the objective function with respect to the parameters are computed automatically, and it does not allow to include random effects on the parameters (Punt et al., 2020). It should be noted that other models extensively used, such as Stock synthesis, MULTIFAN, or CASAL, do not account random effects properly and that the ability to do so for several parameters is one of the essential features that the next generation of stock assessment models should have (Punt et al., 2020).
In contrast, estimating growth empirically, external or “outside” stock assessment models, offers greater flexibility in data selection, allowing researchers to incorporate representative age–length data and length–frequency distributions and to choose parameter values according to their expert knowledge on the species’ biology. In addition, estimation “outside” enables the use of more appropriate calculation methods, such as the use of random effects on the parameters through non-linear mixed models which have been proven to fit better when there is a high variability in the data (Pilling et al., 2002; Stewart et al., 2022). However, implementing these methods “inside” remains computationally intensive (Maunder and Punt, 2013). Despite these advantages, empirical growth estimation is subject to several challenges arising from uncertainties in age determination (Campana, 2001), sampling bias, and increased variability driven by environmental factors, including gear selectivity and oceanographic conditions (Pennino et al., 2020; Fernández-Corredor et al., 2021), among others (Lee et al., 2024).
European anchovy (Engraulis encrasicolus) inhabiting the Gulf of Cádiz (hereafter, GoC), ICES Subdivision 9.a, serves as a compelling case study in the context of estimating fish growth. This species is a small pelagic species (<20 cm) with a short life cycle (living up to approximately a maximum of 3 years), whose population fluctuations are governed by environmental drivers (particularly temperature, wind regimes, and the Guadalquivir river discharges), and therefore recruitment success depends highly on meteorological and oceanographic conditions during the early stages of their vital development (Ruiz et al., 2006; Ruiz et al., 2009; Rincón et al., 2016). The GoC is a highly productive coastal ecosystem that supports a significant anchovy fishery, yet growth patterns have fluctuated in recent decades, necessitating a better understanding of growth dynamics (Costalago et al., 2011). Research on anchovy growth in the GoC dates back to the 1990s, with early studies reporting life cycle characteristics such as length–frequency distributions, length–weight relationships, age structure, and reproduction (Rodríguez-Roda, 1977). Thereafter (Millán, 1999), described the reproductive biology of this species, highlighting variations in growth in response to environmental conditions. The first growth parameter estimates for GoC anchovy were derived from monthly length–frequency samples collected in three commercial ports in the area during 5 years, yielding estimates of =18.95 cm and k = 0.90 using ELEFAN I and =18.69 and k = 0.90 using Powell–Wheterall methods (Bellido et al., 2000). Currently, for the European anchovy inhabiting Atlantic waters, including the GoC, the ICES Working Group on southern horse mackerel, anchovy, and sardine (WGHANSA) provides scientific advice on fishing opportunities (ICES, 2022) using a Gadget stock assessment model since 2018. This model growth parameters estimates are as follows: =29.17 cm and k = 0.08 (ICES, 2018b).
To test model effectiveness in capturing the growth dynamics for short-lived small pelagic species, we propose a comparative analysis following recommended practices outlined by (Lee et al., 2024) for incorporating age–length data into a Gadget-integrated stock assessment model for the specific case of anchovy (Engraulis encrasicolus) stock in the Gulf of Cadiz. Our approach involves a three-step process: initially, conducting an exploratory analysis of the length-at-age datasets available to identify potential variability and biases; secondly, fitting a von Bertalanffy growth function in a random effects’ framework aligned with the data properties previously identified; and finally, comparing the outcomes of the existing model with two alternative Gadget implementations (Figure 1). In one approach, we fix the growth parameters based on values derived from the previous step, while the other permits the model to autonomously calculate the parameters. For these alternative implementations, goodness of fit (likelihood scores), computational time, and their ability to accurately reflect the biology of the species were considered as performance indicators.
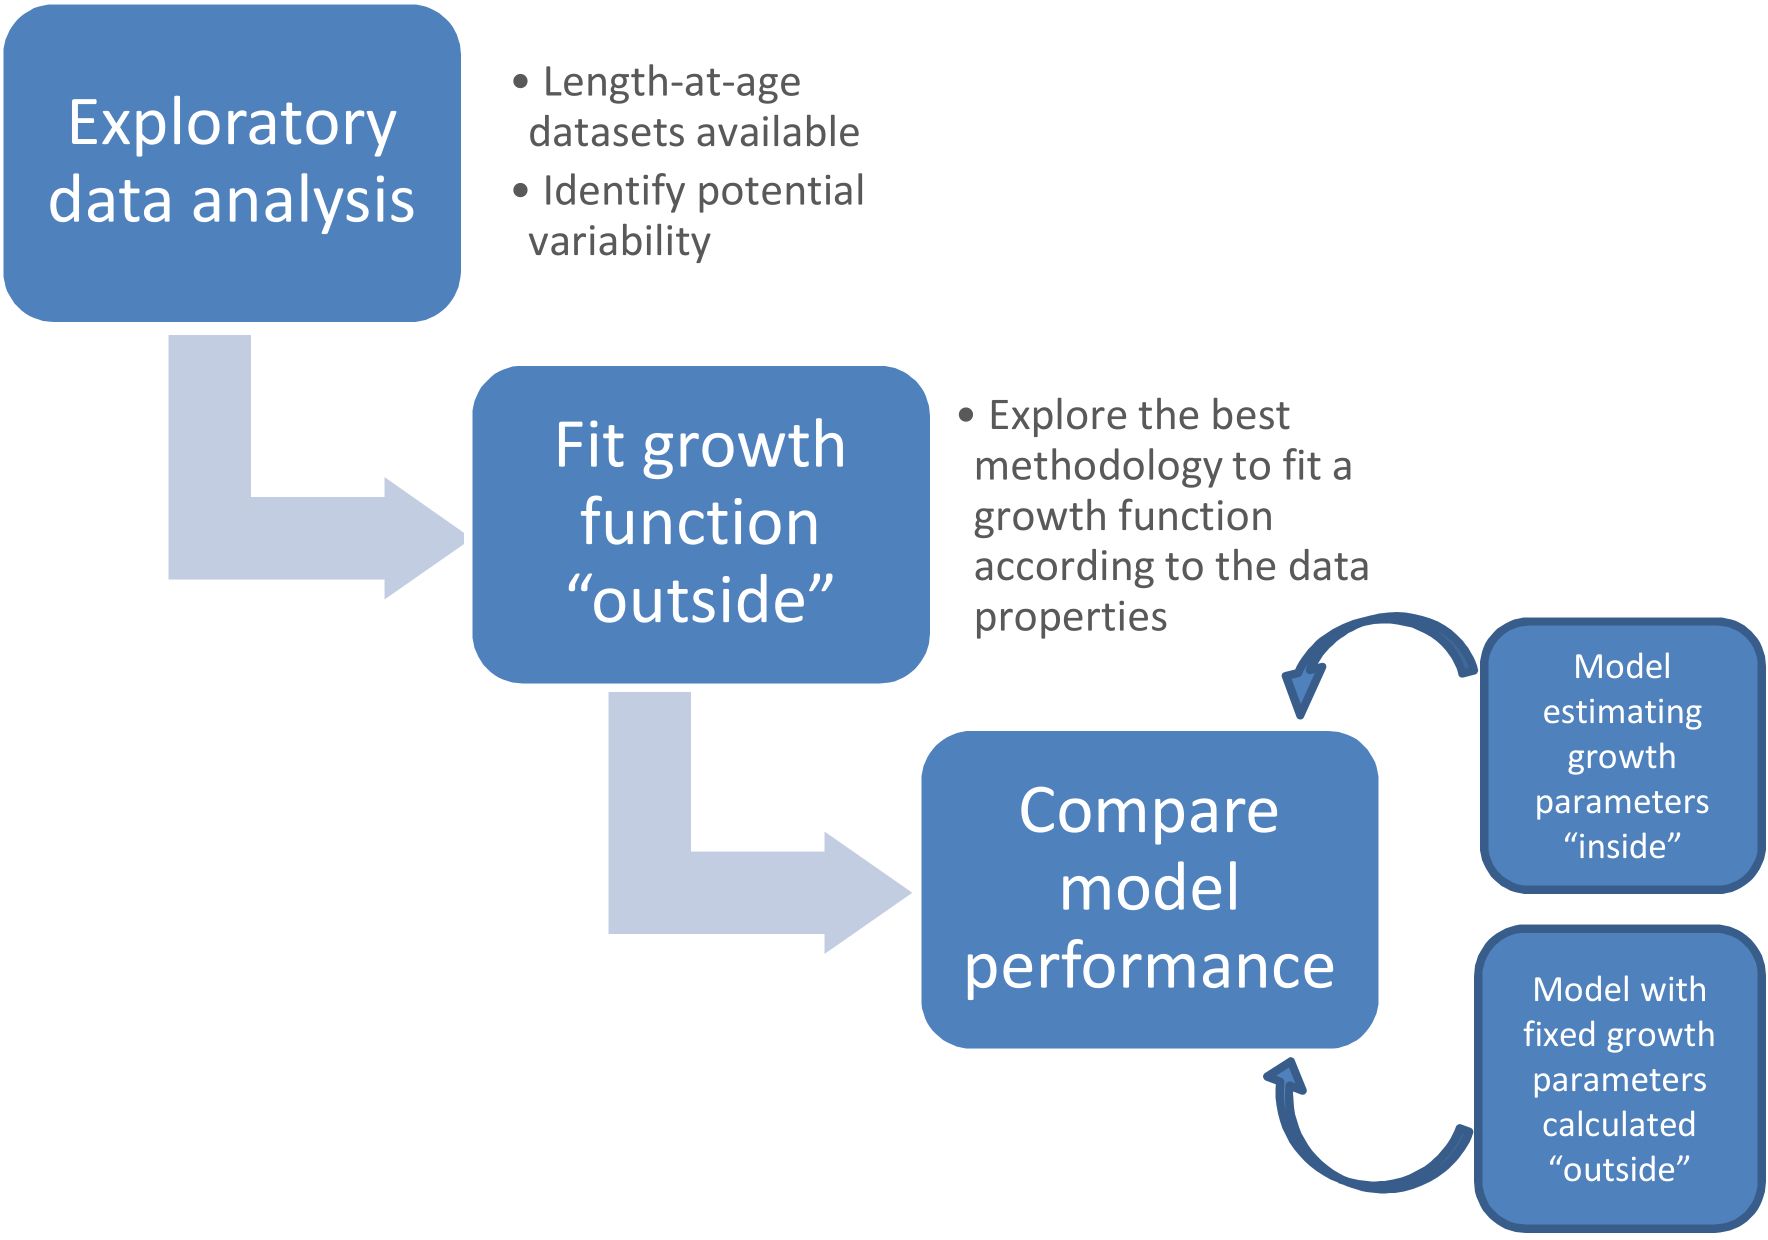
Figure 1. Illustration of the three-step approach undertaken for this work.
The overarching goal of this analysis is to determine the optimal model configuration in terms of both efficiency and accuracy, exploring the possibility to include random effects in growth estimation “outside” the integrated model by fixing the resulting parameters. This study seeks to determine the best approach for incorporating length–age data into integrated models when datasets exhibit high variability and limited age classes, particularly when random effects cannot be directly implemented “inside” the model. This could offer a valuable solution to improve the precision and effectiveness of stock assessments and, therefore, to inform adaptive fisheries management strategies.
The methods used here include the identification of potential variability and biases in the age–length datasets available, an exploratory analysis of non-linear models with fixed and random effects to fit a von Bertalanffy growth function “outside” the model, the selection of the most suitable methodology considering the data properties, the conditioning of two different Gadget models with the data available: one fixing the values for growth parameters using those estimated in the previous step and another allowing the model to estimate them, and lastly, the comparison of the outcomes of the model used to provide scientific advice in 2023 (ICES, 2023) with the two alternative Gadget implementations described in the previous step in terms of computational time and total likelihood score.
The age–length data used comes from all anchovy biological sampling undertaken by the Spanish Oceanographic Institute and the Instituto Português do Mar e da Atmosfera in the GoC which corresponds to ICES division 27.9a South. These data include quarterly age–length keys, obtained from otoliths readings of commercial samples from 1989 to 2022 and those from research surveys conducted by Spain and Portugal [see (ICES, 2010) for more information]. For instance, the research surveys data used in this work is presented in Table 1 and Figure 2.
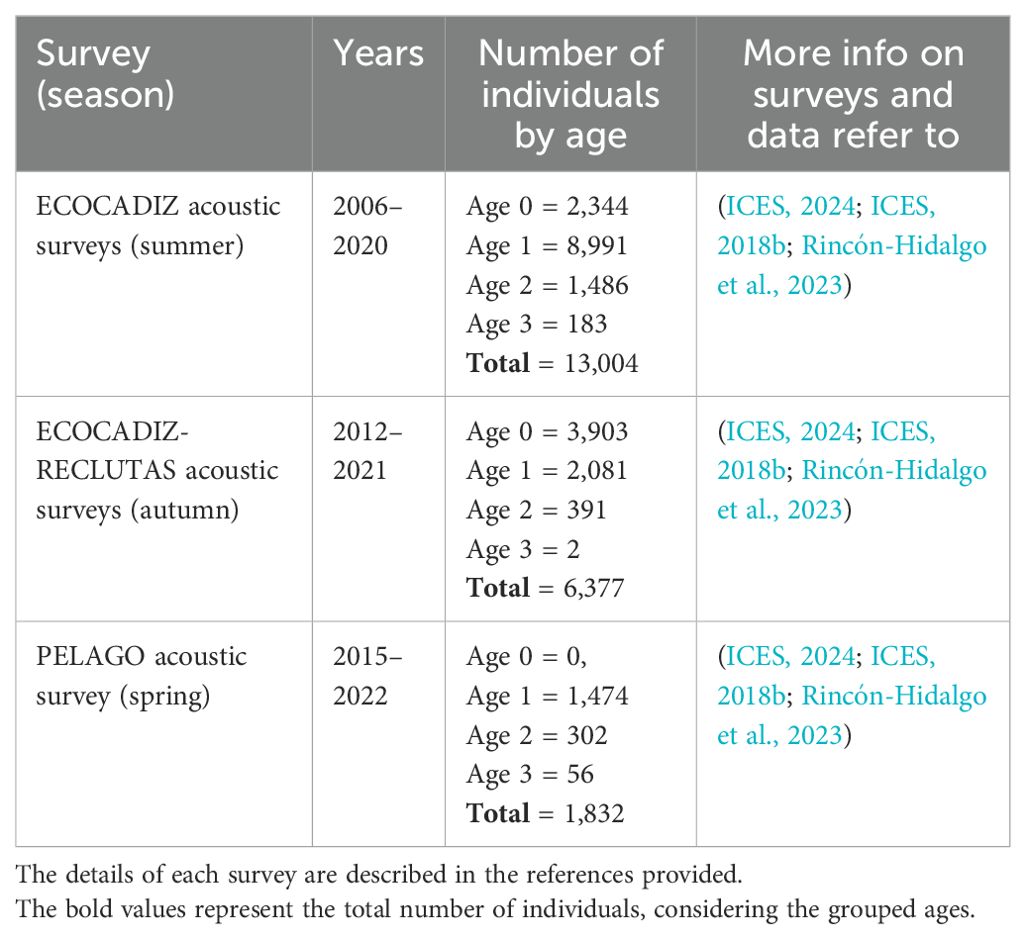
Table 1. Survey data used in this work.
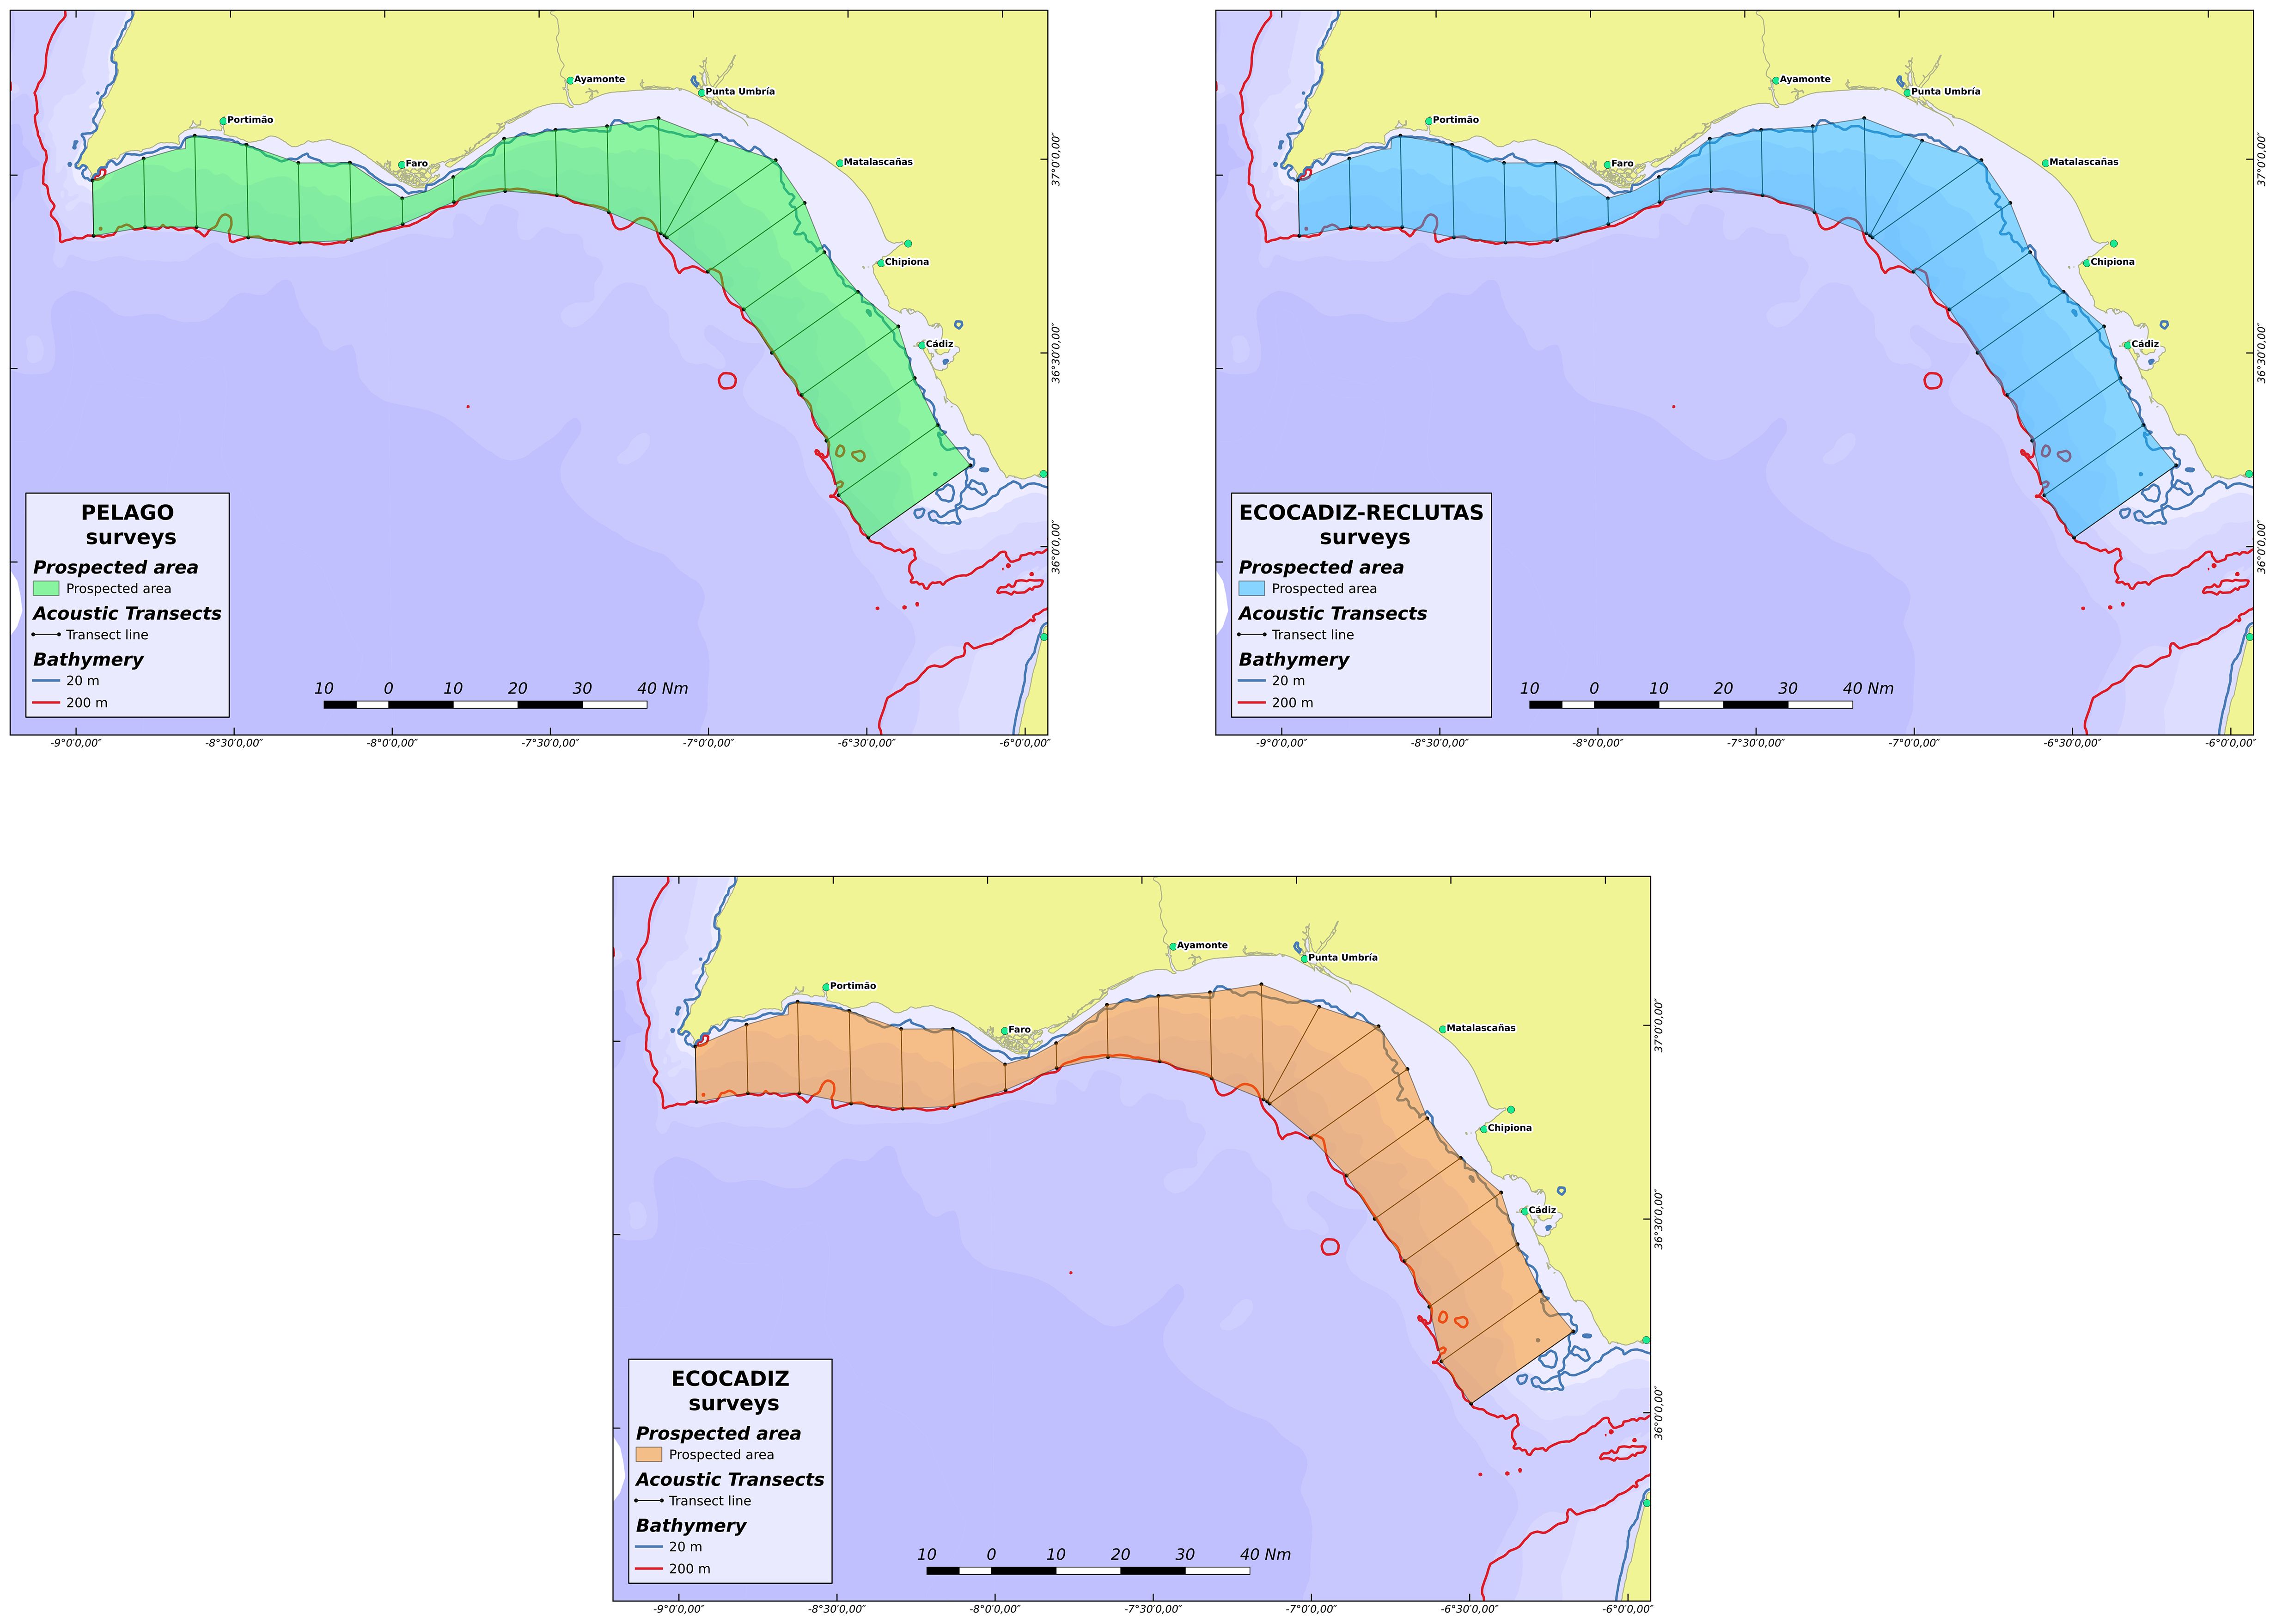
Figure 2. Area covered by the survey data used in this work.
It is worth to remark that the data used for the model that provided scientific advice in 2023 (ICES, 2022) did not include the ECOCADIZ-RECLUTAS and age 0 data from the ECOCADIZ survey due to lack of enough observations when the model was benchmarked [please refer to (Rincón-Hidalgo et al., 2023) and to (ICES, 2018a) for more information]. Considering that a sufficient number of observations are currently available and that recruitment data are crucial for this stock (Ramos et al., 2018; Ruiz et al., 2006; Drake et al., 2007), as well as for other small pelagic species—given that these individuals are the basis of stock productivity—it was decided to incorporate the ECOCADIZ-RECLUTAS and age 0 ECOCADIZ time series.
In summary, four distinct age–length datasets were analyzed: commercial landings and three scientific survey series: ECOCADIZ-RECLUTAS, ECOCADIZ, and PELAGO. The data cover a range of ages from 0 to 3 years, represented as relative years (fractional years), and were collected across different months of the year. It is noteworthy that the data from the commercial fleet are quarterly; however, for the purposes of this study, months 2, 5, 8, and 11 were considered to represent quarters 1, 2, 3, and 4, respectively. Additionally, the convention of assuming that individuals are born only in the third and fourth quarters, with the birth date set to January 1, was considered (there are no age 0 individuals in the first and second quarters and they move to age 1 group on January 1 (ICES, 2010; ICES, 2020).
An exploratory analysis of age–length data was conducted to identify its statistical properties following best-practice recommendations provided by (Lee et al., 2024). Thus, variations in fish lengths were evaluated according to age and sampling month for all available data sources. The primary objective was to identify potential biases in sampling methods and the availability of incomplete data, which could impact the estimation of growth parameters.
For each age group, the minimum, maximum, mean, and standard deviation of fish lengths were calculated. Mean lengths at age were determined using an age–length key, while standard deviations were estimated according to the method described by (Bettoli and Miranda, 2001) to avoid treating the data as if they were randomly selected.
Additionally, age proportions and their standard errors were calculated from the age–lengths keys following (Quinn and Deriso, 1999).
Anchovy growth “outside” the model was investigated using von Bertalanffy growth function (vBGF). Estimating fish growth using this function is a commonly employed approach that describes the growth of individual fish over time. This model assumes that fish growth follows a sigmoidal pattern derived from a generalized logistic function and can be represented mathematically as follows: where is length at age t, with age considered as a continuous variable, k is the growth rate coefficient, t0 is the theoretical age when size is zero, and is the asymptotic length.
The parameters , k, and t0 were estimated by fitting the model to the observed length–age data using non-linear regression and non-linear mixed-effects techniques. The primary objective was to minimize the discrepancy between the observed and predicted lengths by identifying the optimal values of these parameters.
Initially, a non-linear regression technique was implemented. Two scenarios were explored to illustrate correlation among parameters when fixing t0 since all of the length variations at age 0 have effects on the curvature of the growth function, i.e., increasing t0, lowering k, and increasing because the three parameters are highly correlated (López Veiga, 1979). In the first, the parameters and t0 were estimated independently, while in the second, the parameter t0 was fixed at zero.
Subsequently, a non-linear mixed-effects (mixed-effects hereafter) model was fitted to the data. This methodology allowed to address the non-independence between the parameters (Thorson and Minto, 2015) and to account for intra-annual variability by considering them as random effects according to the sampling month. Six different scenarios were evaluated, among all of the possible combinations of t0, , and as random effects among the groups defined by the sampling month.
The estimated parameters and Akaike Information Criterion (AIC) (Akaike, 1987) and Bayesian Information Criterion (BIC) (Schwarz, 1978) values were used to select the most suitable method framework and scenario for anchovy growth data. Additionally, bootstrap techniques were applied to the non-linear model to estimate parameter uncertainties, while in the mixed-effects model, uncertainty calculation relied on the covariance matrix of the estimated parameters. This was summarized through length-at-age plots, showcasing length predictions and corresponding confidence intervals, alongside standardized residual plots and their trends for model evaluation.
Gadget is an age–length-structured model that integrates different sources of information in order to produce a diagnosis of the stock dynamics. It works by making forward simulations and minimizing an objective (negative log-likelihood) function that measures the difference between the model and data; the discrepancy is presented as a likelihood score for each time period and model component.
The general Gadget model description and all of the options available can be found in the Gadget manual (Begley and Howell, [[NoYear]]) with implementation examples documented in (Taylor et al., 2007; Bartolino et al., 2011; Elvarsson et al., 2018; Rincón-Hidalgo et al., 2023).
Particularly for this work, the specification and implementation for the Gadget model used as reference are the same as that used to provide scientific advice for anchovy in the GoC in 2023 where growth parameters are estimated “inside” the model using as input the data described in the data section except for ECOCADIZ-RECLUTAS and ECOCADIZ age 0 data. A detailed likelihood component description and particular specifications are available at (Rincón-Hidalgo et al., 2023).
The growth function used by Gadget is a simplified version of the vBGF, defined in (Begley and Howell, [[NoYear]]) as the LengthVBSimple growth function. The length increase for each length group of the stock is given by the equation below:
where Δt is the length of the timestep, and is the terminal length and k is the growth rate coefficient as defined before. The value t0 can be calculated from the vBGF by replacing by reca, the age for recruitment, and by the recruitment length (recl) as follows:
where , and is estimated by the model.
Two performance indicators were used: the total weighted likelihood and the computational time. Total weighted likelihood accounts for differences between data observed and the model estimates. This calculation is performed in Gadget adding and iteratively re-weighting different likelihood components (Elvarsson et al., 2014; Elvarsson et al., 2018; Rincón et al., 2019). For the Gadget implementations in this work, biomass surveys and length distributions likelihood components were used together with understocking and penalties (Begley and Howell, [[NoYear]]).
The Simple Fisheries Stock Assessment Methods FSA R package, version 0.9.5 (Simple Fisheries Stock Assessment Methods [R package FSA version 0.9.5], 2023), was used for data analysis as well as for non-linear estimation of growth parameters.
Additionally, non-linear mixed-effects models were conditioned through the nmle R package, developed by (Pinheiro and Bates, 2006), version 3.1-164 (Lindstrom and Bates, 1990; Pinheiro and Bates, 1996). Bootstrap techniques were implemented with the nlstools R package, version 2.1-0 (Baty et al., 2015). Furthermore, confidence intervals for the non-linear mixed-effects models were estimated using the nlraa R package, version 1.9.7 (Archontoulis and Miguez, 2015).
Both of the Gadget models conditioned were implemented using Gadget2 (version 2.3.5) software in the CESGA supercomputing center servers. Input data and running and weighting processes were implemented in R using mfdb [version 7.2-0 (Lentin and Elvarsson, 2021)] and Rgadget [version 0.5 (Elvarsson and Lentin, 2016)].
A statistical overview of the relationship between fish length and age is presented in Table 2. Spanning various age groups, the recorded minimum and maximum ages ranged from 0 to 3.92 years, with corresponding age intervals, measured in terms of sampling months, spanning from 0.58 to 3.92 fractional years. Fish lengths varied between 37.5 and 194.0 mm, with mean lengths ranging from 104.7 to 163.1 mm. Within each age group, standard deviations of length fluctuated between 10.6 and 19.7 mm. There was a notable variation in sample sizes across age groups, with the largest sample size observed for age 1 (n = 61,131) and the smallest for age 3 (n = 449). Furthermore, the proportion of the sample relative to the total varied across age groups, ranging from 0.005 to 0.665. The age groups with the highest variability were ages 0 and 1, with standard deviations of 16.6 and 19.7 mm, respectively.
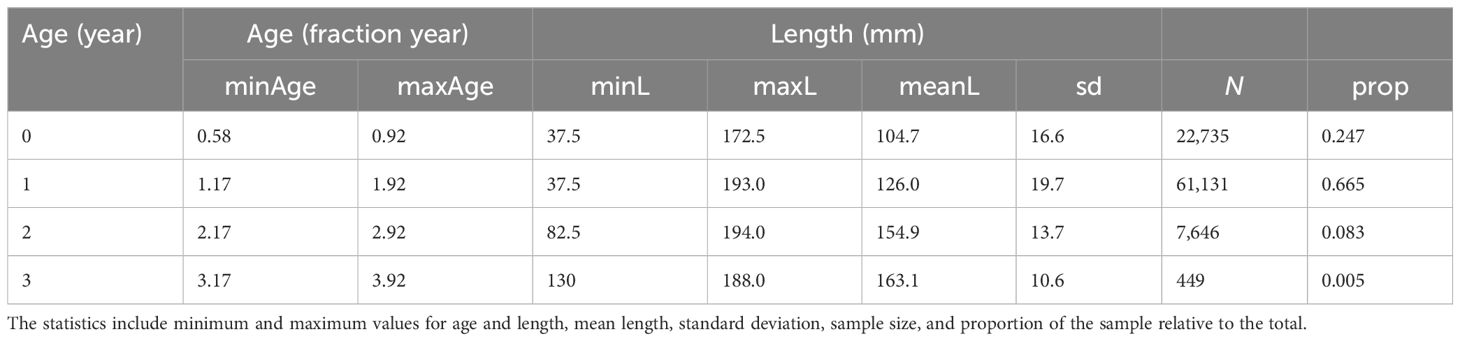
Table 2. Summary of fish length relative to age.
The variability observed in the age–length data can be attributed to several factors. Firstly, age data predominantly comes from commercial samples, which, in turn, are derived from fishing trips in Spanish waters of the Gulf of Cadiz. These data are not georeferenced and may be collected far from areas where oceanographic surveys typically detect larger specimens (in terms of both size and age), often located near or within Portuguese waters. Consequently, most age 3 data come from oceanographic surveys, which are conducted punctually (once per year, with three annual surveys contributing to this data source). These surveys may be influenced by natural variations in the age distribution of anchovy due to environmental conditions and/or factors related to feeding and reproduction (Pennino et al., 2020; Fernández-Corredor et al., 2021).
This variability can lead to certain age classes being underrepresented in specific years, reflecting the shifting distribution of anchovy populations in the Gulf of Cadiz. As a result, the sample coverage of older age classes is often limited. Notably, similar limitations could also affect smaller sizes and younger age classes in more coastal waters. Regarding selectivity, commercial purse seine fisheries are subject to technical regulations designed to prevent the capture of individuals below the minimum conservation reference size of 9 cm in the Gulf of Cadiz. As a result, such individuals are excluded from landings, introducing a degree of bias in the commercial samples, particularly during months corresponding to the recruitment season.
Given these challenges, mixed-effects models were selected to address the imbalances, discrepancies, and gaps in the data. As explained above, these models provide a more responsive framework for tracking growth changes over time and adjusting management strategies accordingly.
All available data are graphically represented in Figure 3, which shows the length at age by sampling month for age groups between 0 and 3 years old. It shows that, as the age to the sampling month increases, the mean length also tends to rise, indicating a growth pattern consistent with anchovy biology. However, it is important to note that this trend comes with significant variability, as reflected in the standard deviations calculated for each age group (Table 1). This suggests that while there is a general growth trend, there is a wide range of lengths within each age group, possibly attributed to observation error and individual or seasonal factors.
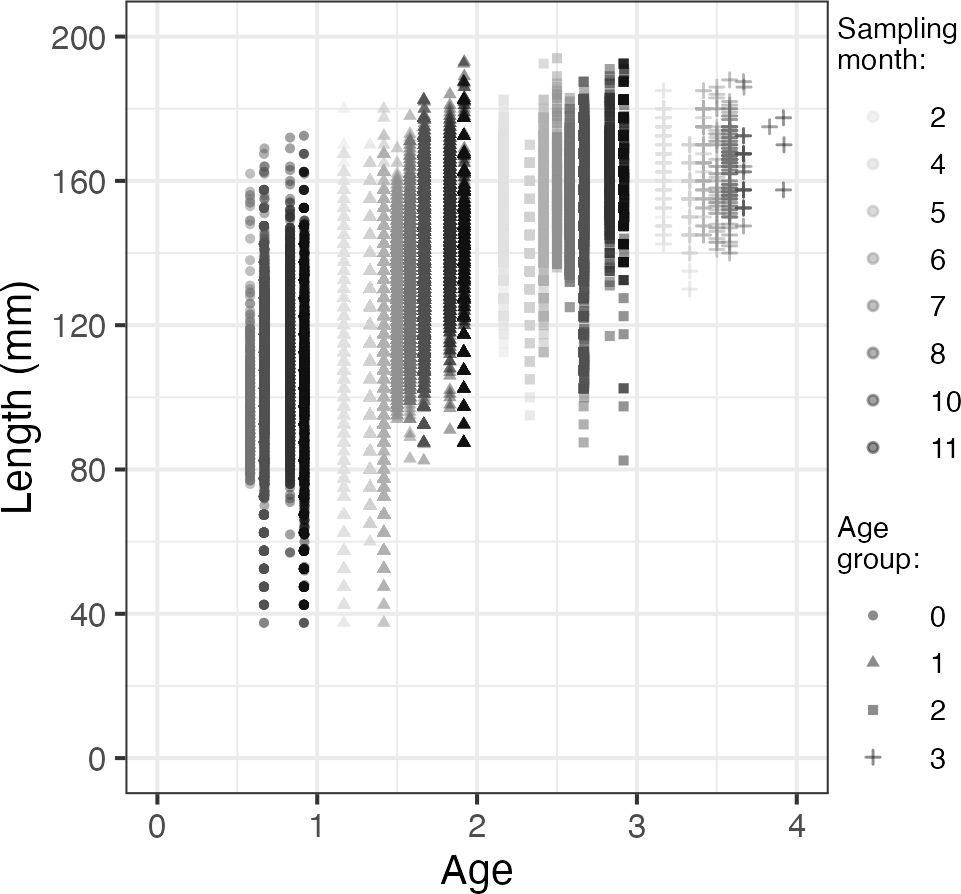
Figure 3. Length at age by sampling month for age groups between 0 and 3+ years old.
The comparison of parameter estimates and model fit for non-linear and mixed-effects models is presented in Table 3. That comparison shows that allowing t0 to be estimated freely in non-linear models results in a higher estimate of . In contrast, fixing t0 results in lower estimates of and higher estimates for k. Among these approaches, the mixed-effects model assuming random effects for t0 and k provides the best fit to the data, as indicated by the lowest AIC and BIC value. This suggests that incorporating random effects may effectively address for the high variability in the data.
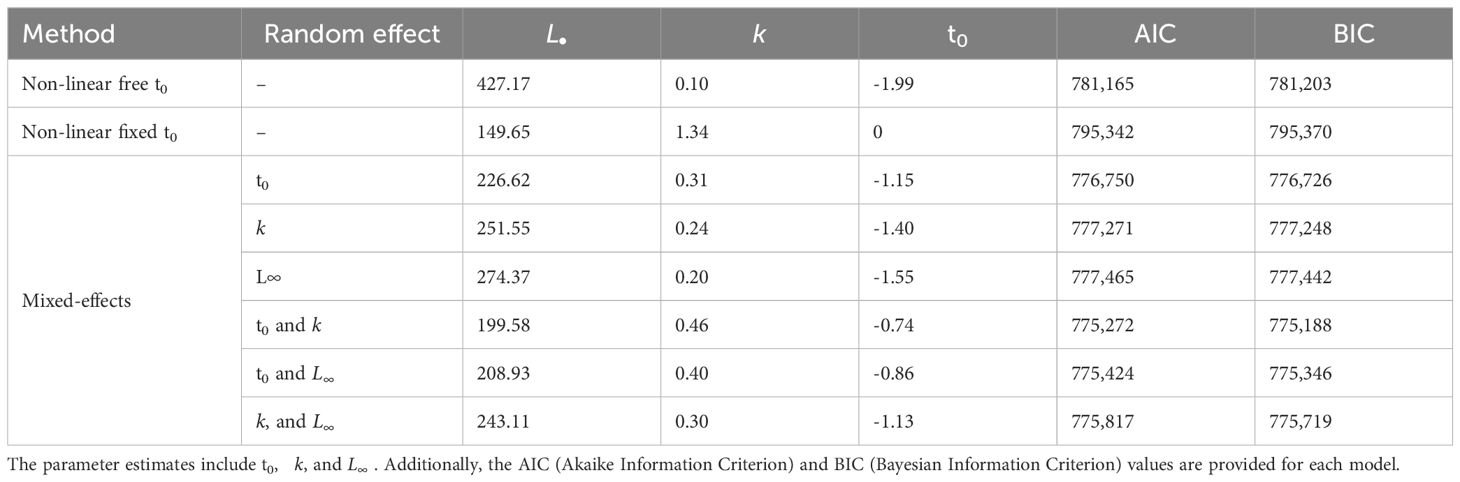
Table 3. Comparison of parameter estimates and model fit between non-linear and non-linear mixed-effects models.
In addition, the best non-linear and mixed-effects model fit according to AIC and BIC criterion are presented together with their standardized residuals in Figure 4. The first with t0 as a free parameter and the second assuming random effects over t0 and k. The results reveal that the non-linear model does not capture the von Bertalanffy growth pattern. Furthermore, the standardized residuals show that this non-linear model has a good fit only for lengths between 150 and 163 mm, while the mixed-effects results in a good fit for lengths below 163 mm. The 95% confidence intervals are also broader for the non-linear model compared to the mixed-effects model. However, neither approach achieves a satisfactory fit for sizes exceeding 163 mm, likely due to the reduced sample size and length range in these older age groups (Table 1).
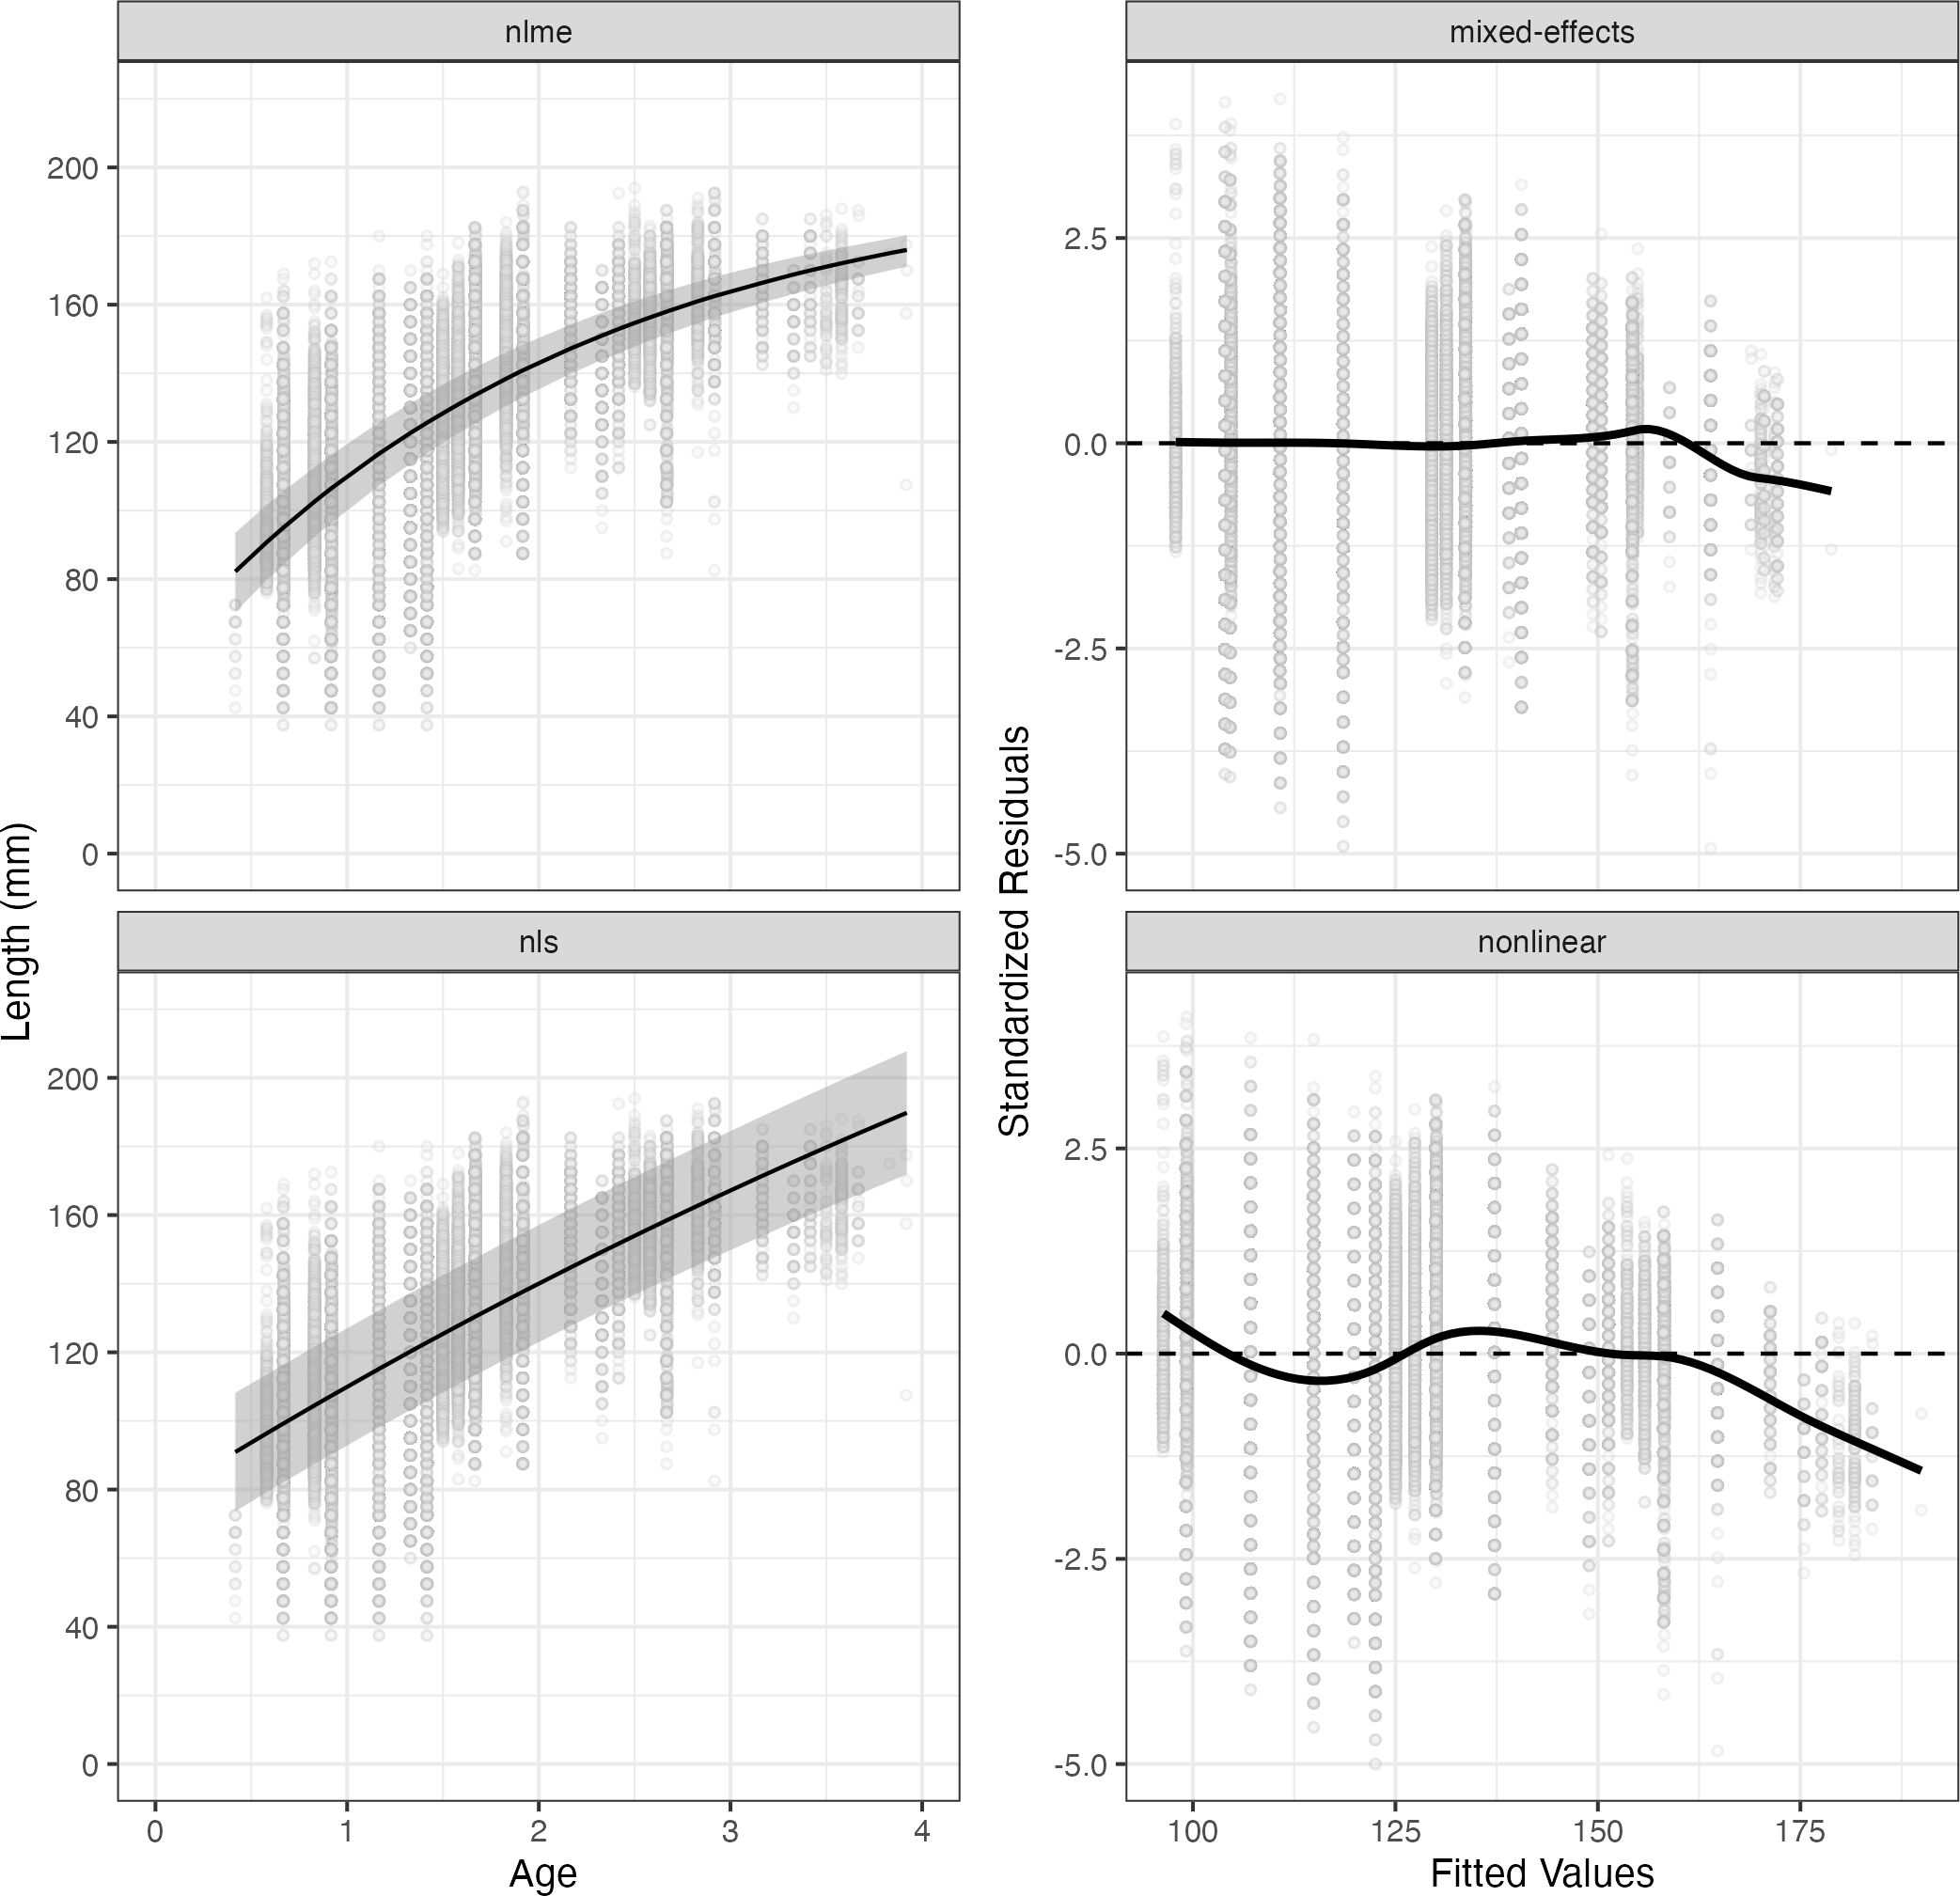
Figure 4. Non-linear and mixed-effects model fit (left panels) and their standardized residuals (right panels). Top left panel: Model fit (black line) and 5th to 95th percentile confidence intervals (gray shaded area) for a mixed-effects model assuming random effects over t0 and k. Bottom left panel: Model fit (black line) and 5th to 95th percentile confidence intervals (gray shaded area) for a non-linear model assuming t0 as a free parameter. Top right panel: Standardized residuals (gray points), trend (black line) and expected residual value (dashed line) for the model in the left panel. Bottom right panel: Standardized residuals (gray points), trend (black line) and expected residual value (dashed line) for the model in the left panel.
As explained before, the outcomes of the existing model are compared with two alternative Gadget implementations. In one approach, we fix the growth parameters based on values derived from the previous step, the values corresponding to the best von Bertalanffy model corresponding to the lowest AIC and BIC (Table 4), while the other permits the model to autonomously calculate the parameters using only the most representative datasets.
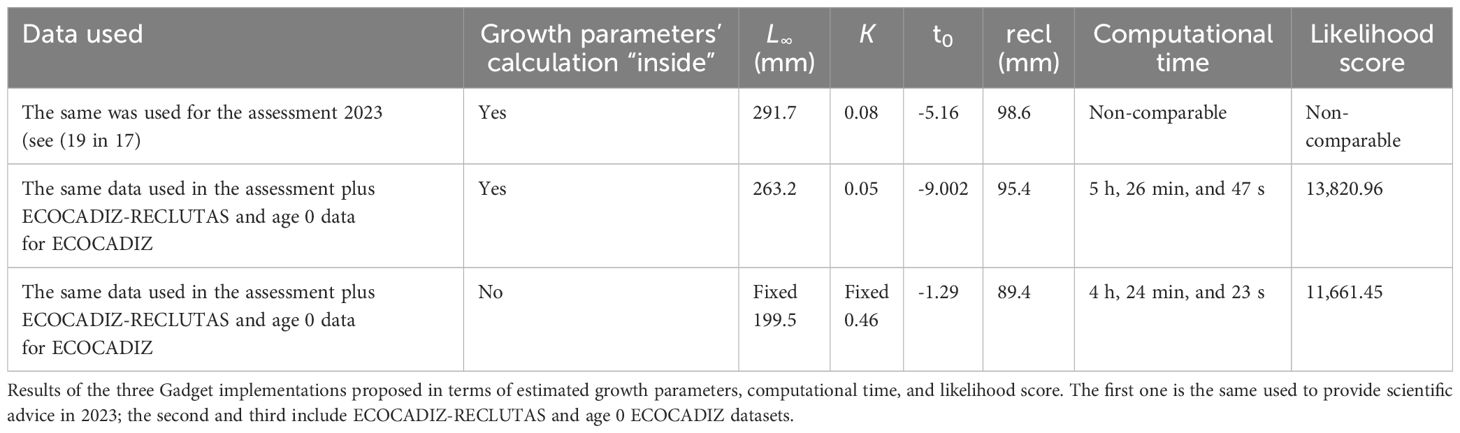
Table 4. Model performance comparison.
Table 4 shows the results of the three implementations, the value for the estimated growth parameters, and a comparison in terms of computational time needed and total weighted likelihood score. The performance indicators for the assessment model in 2023 were included as a reference as they are not comparable with the other Gadget implementations due to differences in the data input. Nevertheless, the values of the parameters estimated are not very different among Gadget implementations when they are calculated “inside” the model, value, and the growth rate result was slightly smaller when using the whole data set as model input. This suggests a leftward shift of the von Bertalanffy function when ECOCADIZ-RECLUTAS and ECOCADIZ age 0 data is incorporated into the model. In addition, values are 63.7 and 92.2 mm higher than the from the best von Bertalanffy model (=199.5), for Gadget implementations with and without the whole dataset, respectively; on the other hand, the growth rate results were much smaller in both cases.
Finally, a comparison between the two approaches: calculating the growth parameters “inside” and “outside” the gadget model with the same data input results in lower likelihood score and computational time when the growth parameters are fixed.
In this study, the guidelines proposed by (Lee et al., 2024) were applied to incorporate length-at-age data into a specific integrated fisheries stock assessment model (Maunder and Punt, 2013), demonstrating that the efficacy of the random effects approach for estimating growth in short-lived species was also characterized by high variability in age–length data, like the anchovy in the GoC, where existing growth parameter estimates were inaccurate and outdated.
Notably, for the anchovy in the Gulf of Cádiz, a comprehensive data and methodological revision was necessary due to the limitations of existing growth parameter estimates. The initial estimation for the growth parameters of this species, published in 2000 (Bellido et al., 2000), had been widely referenced. Since 2018, these parameters are also used as initial values in the current model for providing scientific advice on TACs (ICES, 2022). However, the estimated growth parameters in this model fail to accurately capture the species’ biology, highlighting a need for improvement. This limitation led to a re-examination of the approach to integrating length-age data in models, resulting in a new research question: how to effectively incorporate length-age data in integrated models when dealing with highly variable datasets and limited age classes.
In order to address this question, the guidelines proposed by (Lee et al., 2024) were applied to the anchovy in the GoC. A thorough analysis of the anchovy data available until 2023 was conducted, resulting in the inclusion of a new dataset focused on the recruited population. The data analysis revealed a great variability, and also with length classes overlapping for ages 0 and 1, where the minimum length is the same for both ages and the maximum length is only 20.5 cm higher for age 1 (see Table 2 and Figure 3), which could be one of the reasons explaining the model miss estimates for and k when they are estimated by the model (Table 4).
The observed variability motivated a dedicated methodology analysis, aiming to identify alternative approaches to address the issue. Another possible reason for the misestimates could be related to the fact that growth parameter calculation inside the model does not account for the variability and overlapping in the different age–length datasets, a problem documented by (Sainsbury, 2011). To address this, non-linear mixed-effects regression techniques were considered, as they have been used for observational studies that are replicated across sites or times. In this case, it was assumed that repeated measures taken over time represent lengths at various ages for the same individuals [this is analogous to the methodology proposed by (Helser and Lai, 2004)]. This allows for the incorporation of individual variability in a robust way by explicitly assuming that the growth parameters for each individual represent samples from a normal multivariate population of growth parameters. This approach has been successfully applied in various fields, including human growth (Rogol et al., 2000). As (Pilling et al., 2002) explains, the key advantage of this methodology is that it estimates the mean vector and the covariance matrix of the population of growth parameters, which are precisely the parameters needed to assess individual growth variability. Several authors (Cope and Punt, 2007; Pilling et al., 2002; Castillo-Jordán et al., 2010; Weisberg et al., 2010; Stewart et al., 2022) have documented the benefits of non-linear mixed-effects models, which facilitate the incorporation of different sources of growth variability by including fixed effects and random effects. These models are recommended when a great variation around the mean growth pattern is observed in most length-at-age plots (Figure 3), and they have proven to overcome many of the shortcomings of the fixed-effects models approach (Wang and Ellis, 1998; Weisberg et al., 2010).
Nevertheless, the choice of methodology for fitting these models presents several challenges. A key issue is the need to calculate an integral that typically cannot be solved analytically. The accuracy of the methodology is highly dependent on how this integral is approximated or solved. For the purposes of this work, we implemented the approach proposed by (Lindstrom and Bates, 1990), which linearizes the non-linear model around the expected value of the random effects. This linearization simplifies the integral to a form that can be solved analytically, thus eliminating the need for numerical integration. However, a notable limitation of this method is that it may result in less accurate estimates, particularly when the random effects deviate from normality. Although the results of normality tests were inconclusive, model selection diagnostics—such as AIC, BIC, and standardized residuals (Figure 4)—indicate that mixed-effects models outperform non-linear approaches in this case. These diagnostics, which assess overfitting and underfitting, provide strong evidence supporting the superiority of mixed-effects models for this particular analysis.
Despite this, some misspecifications were observed for sizes exceeding 163 mm (Figure 4). These inaccuracies could potentially be addressed by adopting more advanced methods, such as the Laplace approximation and Bayesian approaches, which would allow for the specification of non-normal distributions for the random effects. However, implementing these techniques would require further customization of the model to estimate random effects based on the sampling month, demanding additional expertise and incurring higher computational costs. A more comprehensive discussion of computational approaches for estimating random effects is available in (Thorson and Minto, 2015).
Additionally, it is important to note that these misspecifications could also stem from the limited sample size for larger age classes and the absence of measurement error in the aging process. As emphasized by (Cope and Punt, 2007), aging error should be taken into account when fitting growth curves. This error primarily arises from the inconsistency between otolith formation, which is subject to environmental influences (Izzo et al., 2018), and the interpretation of age (Campana and Thorrold, 2011; Morales-Nin, 2000; Campana, 2001). Another potential source of error is the decision regarding which parameters should include random effects, as this choice may be influenced by the normality assumption. Alternative approaches could yield different results. In this case, the AIC and BIC values underscore the importance of incorporating random effects for the t0 parameter. Notably, the two best models—those that fix two of the three parameters—as well as the best model that fixes only one parameter, all include random effects for t0 (see Table 3). This finding is likely linked to the high variability observed in the mean size of younger age groups (Table 2). Accurate estimation of the t0 parameter is crucial, as misestimating it can introduce a significant bias into the estimates of k and L∞. Specifically, a negative covariance was observed between k and L∞, indicating that an overestimation of k (which suggests a faster growth rate) generally leads to an underestimation of L∞, implying a smaller potential maximum size. Conversely, underestimating k results in an overestimation of L∞ (Archontoulis and Miguez, 2015; ICES, 2019; Lentin and Elvarsson, 2021; Stewart et al., 2022). These relationships have important implications for the use of these parameters as proxies in life-history estimation and stock assessment models, highlighting the need for careful consideration of model structure and underlying assumptions.
In light of these findings, it is interesting to examine the parameter values estimated. The k value shows the most significant difference compared to previous attempts to estimate growth “outside” the stock assessment model. Most of the non-linear and mixed-effects models tested (Table 3) provide values below 0.5. However, when t0 is fixed in the non-linear regression, the highest estimated value is obtained (k = 1.34). This value is closer to the k estimated by (Bellido et al., 2000), which was around 1 for most of the years studied (ranging from 0.70 to 1.07). This is particularly interesting because they also assumed t0 as fixed. Nevertheless, there are significant differences in the value between both approaches. In this case, an unrealistically low of 14.9 cm was obtained, compared to the values between 18.3 and 19.69 cm obtained previously. Furthermore, in the non-linear framework, allowing t0 to be estimated results in a small k value of 0.1 but an unrealistically large of 42.7 cm. These improbable estimates are obtained regardless of the choice of t0, and as mentioned before this is likely associated with the high variability in lengths for younger ages. This provides additional evidence that the non-linear approach without random effects is inadequate for this dataset, which predominantly consists of individuals aged 0 and 1 (Table 2).
With the most suitable dataset and methodology for estimating growth parameters identified, a comparative analysis was conducted to test their incorporation into the Gadget integrated model. Specifically, the parameters obtained by the mixed-effects approach were first fixed into the model, and then the model was allowed to autonomously calculate the parameters. The efficiency of both Gadget implementations was evaluated in terms of computational time and goodness of fit. For both indicators, it was determined that the first implementation was the more efficient, reducing computational time in 1 h and improving likelihood score values (Table 4). A notable time reduction was observed, as the number of parameters to estimate had been reduced, but 1 h is a considerable reduction for this stock assessment model, giving some idea of the importance of these parameters in the rest of the calculations and having in mind that this model is able to handle both age and length data at the same time. This implementation is also more accurate for the t0 parameter, as the estimated value (-1.29) is the closest to the mean of the values obtained using the mixed-effects approach (-1.14) compared to the other Gadget implementations. Since t0 depends on the estimated recruitment length, this length should be correspondingly more accurate. Furthermore, the Gadget-estimated parameter values are close to the unrealistic ones obtained by the model used for the 2023 assessment, indicating that high variability was already present in the earlier dataset.
Moreover, the dataset used in this study (including ECOCADIZ-RECLUTAS and ECOCADIZ age 0) has important implications for the management of the anchovy fishery and currently is not the same dataset used to provide TAC advice. For a short-lived, small pelagic fish like anchovy, its sustainability relies on annual recruitment to ensure a healthy adult biomass for the following year. The assessment and management of these species are particularly challenging due to their short life expectancy, characteristic aggregative behavior, rapid response to climate and environmental signals, and large, variable natural mortality (Barange et al., 2009). Therefore, management is challenged by large recruitment variability (Thorson et al., 2014), which accounts for the largest source of population interannual variability (Siple et al., 2021). Hence, an early indication of recruitment greatly benefits their management (Uriarte et al., 2023). Advantages of incorporating recruitment indicators, like juvenile surveys, in stock assessment and management have been demonstrated for the Bay of Biscay anchovy stock (Boyra et al., 2013; Uriarte et al., 2023), where the advice for TAC recommendation is provided once the results of the recruitment survey are available. In particular, the Gulf of Cádiz anchovy fishery targets a highly variable resource with a short lifespan and strong dependence on yearly recruitment (Ruiz et al., 2006; Ruiz et al., 2009; ICES, 2023). Consequently, including the ECOCADIZ-RECLUTAS autumn acoustic survey dataset as an indicator of early recruitment in the assessment model will reduce the uncertainty in estimating the strength of the next cohort. This early recruitment information, combined with an accurate growth function, can serve as a tool to reduce uncertainty by enabling precise projections of the spawning stock biomass (SSB) for the following year. The SSB, in turn, directly informs recommendations for total allowable catch (TAC), facilitating more proactive and adaptive management measures. For example, fishery managers can implement precautionary adjustments to TACs or fishing effort levels before recruitment failures are fully manifested in the fishery. Such proactive measures help minimize both ecological and economic risks, ensuring more sustainable and resilient fisheries management.
In summary, since a choice needs to be made regarding whether growth should be estimated outside or inside the stock assessment model (Maunder et al., 2016), sufficient evidence was presented here for the GoC anchovy stock to decide to estimate it outside the model or what is called an “empirical approach” according to (Lee et al., 2024), who recommend to use it when there is a high biological variability. This approach has been shown to be effective for this stock, and its adoption holds the potential to be broadened to encompass other short-lived small pelagic species that exhibit similar data variability, offering a valuable solution for improving the accuracy and robustness of stock assessments to better understand population dynamics. Moreover, our approach addresses a significant gap in existing integrated models used to provide TAC scientific advice, which often do not have the “random effects on parameters” feature; by reducing uncertainty in growth parameters, this approach contributes to more stable and scientifically justified TAC recommendations, minimizing the risk of over- or underestimating the sustainable harvest levels, thereby providing a more reliable and robust framework for informing short-lived small pelagic fisheries management decisions.
The datasets presented in this study can be found in online repositories. The names of the repository/repositories and accession number(s) can be found below: https://git.csic.es/math4fish/nonlinear-and-mixed-effects-growth-models and https://github.com/ices-taf/2023_ane.27.9a_south_assessment.
MRH: Conceptualization, Data curation, Formal analysis, Funding acquisition, Investigation, Methodology, Project administration, Resources, Software, Supervision, Validation, Visualization, Writing – original draft, Writing – review & editing. MG: Conceptualization, Data curation, Formal analysis, Investigation, Methodology, Software, Supervision, Visualization, Writing – original draft, Writing – review & editing. MZ: Data curation, Formal analysis, Methodology, Software, Validation, Visualization, Writing – review & editing. FR: Conceptualization, Data curation, Investigation, Validation, Resources, Writing – review & editing. JT: Conceptualization, Data curation, Validation, Writing – review & editing.
The author(s) declare that financial support was received for the research and/or publication of this article. This research has been developed in the framework of the Math4Fish and BioEcon4Fish projects. Math4Fish was financed by EU Commission, EU Next Generation, and the Recovery Plan Component 3, Investment 7 and has been carried out within the framework of the agreement between the Spanish Ministry of Agriculture, Fishing and Food and the Spanish National Research Council (CSIC) through the Spanish Oceanography Institute (IEO) to promote fisheries research as a basis for sustainable fisheries. However, the article does not necessarily reflect European Commission (EC) views and in no way anticipates future policy of the EU in the area. BioEcon4Fish is funded by the Complementary Marine Sciences Plan of the Junta de Andalucía. Complementary I+D+i Plans. Recovery, Transformation, and Resilience Plan. Spanish System of Science, Technology, and Innovation integrated into the State Plan for Scientific, Technical, and Innovation Research 2021-2023 and the Spanish Strategy for Science, Technology, and Innovation 2021-2027 (EECTI-2021-2027). European Union, EU Next Generation, Recovery and Resilience Mechanism, Regulation (EU) 2020/2094 of the Council of December 14, 2020, and regulated under Regulation (EU) 2021-241 of the European Parliament and Council of February 12, 2021, which establishes the Recovery and Resilience Mechanism.
Thank you to Alfonso Perez for his time in reviewing the manuscript draft and his valuable suggestions. We gratefully thank CESGA (Galician Supercomputing Center) for the computational time at the Finisterrae 3 server and for the technical assistance. Additionally, this work would have not been possible without the collection of Spanish fisheries and surveys data, co-funded by the Spanish Institute of Oceanography (IEO) and the EU through the European Maritime and Fisheries Fund (EMFF) within the National Program of collection, management, and use of data in the fisheries sector and support for scientific advice regarding the Common Fisheries Policy (PNDB/EU-DCF-Programa Nacional de Datos Básicos/EU-Data Collection Framework).
The authors declare that the research was conducted in the absence of any commercial or financial relationships that could be construed as a potential conflict of interest.
All claims expressed in this article are solely those of the authors and do not necessarily represent those of their affiliated organizations, or those of the publisher, the editors and the reviewers. Any product that may be evaluated in this article, or claim that may be made by its manufacturer, is not guaranteed or endorsed by the publisher.
Archontoulis S. V., Miguez F. E. (2015). Nonlinear regression models and applications in agricultural research. Agron. J. 107, 786–798. doi: 10.2134/agronj2012.0506
(2023). Simple Fisheries Stock Assessment Methods [R package FSA version 0.9.5]. Available online at: https://cran.r-project.org/package=FSA (Accessed March 5, 2025).
Barange M., Bernal M., Cergole M. C., Cubillos L. A., Daskalov G. M., de Moor C. L., et al. (2009). Current trends in the assessment and management of stocks. Clim Chang Small Pelagic Fish 2009. 191–255. doi: 10.1017/CBO9780511596681.011
Bartolino V., Colloca F., Taylor L., Stefansson G. (2011). First implementation of a Gadget model for the analysis of hake in the Mediterranean. Fish Res. 107, 75–83. doi: 10.1016/j.fishres.2010.10.010
Baty F., Ritz C., Charles S., Brutsche M., Flandrois J. P., Delignette-Muller M. L. (2015). A toolbox for nonlinear regression in R: the package nlstools. J. Stat. Softw 66, 1–21. doi: 10.18637/jss.v066.i05
Begley (2004). “Hafrannsóknastofnunin fjölrit nr. 120,” in Gadget user guide p. 103. Available at: https://www.hafogvatn.is/static/research/files/fjolrit-120.pdf.
Begley J., Howell D. An overview of Gadget, the Globally applicable Area-Disaggregated General Ecosystem Toolbox. Available online at: www.hafro.is/gadget (Accessed March 5, 2025).
Bellido J. M., Pierce G. J., Romero J. L., Millán M. (2000). Use of frequency analysis methods to estimate growth of anchovy (Engraulis encrasicolus L. 1758) in the Gulf of Cadiz (SW Spain). Fish Res. 48, 107–115. doi: 10.1016/S0165-7836(00)00183-1
Bettoli P. W., Miranda L. E. (2001). Cautionary Note about Estimating Mean Length at Age with Subsampled Data. North Am. J. Fish Manag 21, 425–428. doi: 10.1577/1548-8675(2001)021<0425:CNAEML>2.0.CO;2
Boyra G., Martínez U., Cotano U., Santos M., Irigoien X., Uriarte A. (2013). Acoustic surveys for juvenile anchovy in the Bay of Biscay: abundance estimate as an indicator of the next year’s recruitment and spatial distribution patterns. ICES J. Mar. Sci. 70 (7), 1354-1368.
Campana S. E. (2001). Accuracy, precision and quality control in age determination, including a review of the use and abuse of age validation methods. J. Fish Biol. 59, 197–242. doi: 10.1111/j.1095-8649.2001.tb00127.x
Campana S. E., Thorrold S. R (2011). Otoliths, increments, and elements: keys to a comprehensive understanding of fish populations? 58, 30–38. doi: 10.1139/f00-177
Castillo-Jordán C., Cubillos L. A., Navarro E. (2010). Inter-cohort growth rate changes of common sardine (Strangomera bentincki) and their relationship with environmental conditions off central southern Chile. Fish Res. 105, 228–236. doi: 10.1016/j.fishres.2010.05.012
Cope J. M., Dowling N. A., Hesp S. A., Omori K. L., Bessell-Browne P., Castello L., et al. (2023). The stock assessment theory of relativity: deconstructing the term “data-limited” fisheries into components and guiding principles to support the science of fisheries management 33, 241–263. doi: 10.1007/s11160-022-09748-1
Cope J. M., Punt A. E. (2007). Admitting ageing error when fitting growth curves: an example using the von Bertalanffy growth function with random effects. Can. J. Fish. Aquat. Sci. 64 (2), 205–218.
Costalago D., Tecchio S., Palomera I., Álvarez-Calleja I., Ospina-Álvarez A., Raicevich S. (2011). Ecological understanding for fishery management: Condition and growth of anchovy late larvae during different seasons in the Northwestern Mediterranean. Estuar. Coast. Shelf Sci. 93, 350–358. doi: 10.1016/j.ecss.2011.05.005
Drake P., Borlán A., González-Ortegón E., Baldó F., Vilas C., Fernández-Delgado C. (2007). Spatio-temporal distribution of early life stages of the European anchovy Engraulis encrasicolus L. within a European temperate estuary with regulated freshwater inflow: effects of environmental variables. J. Fish Biol. 70, 1689–1709. doi: 10.1111/j.1095-8649.2007.01433.x
Elvarsson B. T., Lentin J. (2016). Rgadget: R package for Gadget models. Available online at: https://scholar.google.com/scholar_lookup?title=Rgadget%3A%20R%20Package%20for%20Gadget%20Models.%20R%20Package%20Version%200.5&publication_year=2018&author=B.T.%20Elvarsson&author=J.%20Lentin.
Elvarsson B. T., Taylor L., Trenkel V. M., Kupca V., Stefansson G. (2014). A bootstrap method for estimating bias and variance in statistical fisheries modelling frameworks using highly disparate datasets. Afr. J. Mar. Sci. 36, 99–110. doi: 10.2989/1814232X.2014.897253
Elvarsson BÞ, Woods P. J., Björnsson H., Lentin J., Thordarson G. (2018). Pushing the limits of a data challenged stock: A size- and age-structured assessment of ling (Molva molva) in Icelandic waters using Gadget. Fish Res. 207, 95–109. doi: 10.1016/j.fishres.2018.06.005
Fernández-Corredor E., Albo-Puigserver M., Pennino M. G., Bellido J. M., Coll M. (2021). Influence of environmental factors on different life stages of European anchovy (Engraulis encrasicolus) and European sardine (Sardina pilchardus) from the Mediterranean Sea: A literature review. Reg. Stud. Mar. Sci. 41, 101606. doi: 10.1016/j.rsma.2020.101606
Gebremedhin S., Bruneel S., Getahun A., Anteneh W., Goethals P. (2021). Scientific methods to understand fish population dynamics and support sustainable fisheries management. Water. 13 (4), 574. doi: 10.3390/w13040574
Helser T. E., Lai H. L. (2004). A Bayesian hierarchical meta-analysis of fish growth: with an example for North American largemouth bass, Micropterus salmoides. Ecol. Modell 178, 399–416. doi: 10.1016/j.ecolmodel.2004.02.013
ICES. (2010). Report of the Workshop on Age reading of European anchovy (WKARA). Sicily, Italy. ICES CM 2009/ACOM:43. 122 pp. doi: 10.17895/ices.pub.19280525
ICES. (2020). Workshop on age validation studies of small pelagic species (WKVALPEL). ICES Scientific Reports. 2:15. 76 pp. doi: 10.17895/ices.pub.5966
ICES. (2022). Anchovy (Engraulis encrasicolus) in Division 9.a (Atlantic Iberian waters). In Report of the ICES Advisory Committee, 2022. ICES Advice 2022, ane.27.9a. doi: 10.17895/ices.advice.19447751
ICES. (2023). Working Group on Southern Horse Mackerel, Anchovy and Sardine (WGHANSA). ICES Scientific Reports. 5:67. 621 pp. doi: 10.17895/ices.pub.23507922
ICES. (2018a). Report of the benchmark workshop on pelagic stocks (WKPELA 2018), 12–16 February 2018, ICES HQ, Copenhagen, Denmark: ICES CM 2018/ACOM:32. 313 pp. doi: 10.17895/ices.pub.23507922
ICES. (2018b). Stock annex : anchovy (Engraulis encrasicolus) in division 9a (Atlanntic iberian waters). ICES Stock Annexes. 55 pp. doi: 10.17895/ices.pub.18621962
ICES. (2024). Working Group on Acoustic and Egg Surveys for small pelagic fish in Northeast Atlantic (WGACEGG; outputs from 2023 meeting). ICES Scientific Reports. 6:21, 227 pp. doi: 10.17895/ices.pub.25296220
Izzo C., Reis-Santos P., Gillanders B. M. (2018). Otolith chemistry does not just reflect environmental conditions: A meta-analytic evaluation. Fish Fish 19, 441–454. doi: 10.1111/faf.12264
Lee H. H., Maunder M. N., Piner K. R. (2024). Good Practices for estimating and using length-at-age in integrated stock assessments. Fish Res. 270, 106883. doi: 10.1016/j.fishres.2023.106883
Lentin J., Elvarsson B. T. (2021). mfdb: mareFrame DB querying library (New York-Oxford: Comprehensive R Archive Network (CRAN). Available at: https://cran.r-project.org/package=mfdb. R package version 7.2-0 (Accessed March 5 2025).
Lindstrom M. J., Bates D. M. (1990). Nonlinear mixed effects models for repeated measures data. Biometrics. 46, 673. doi: 10.2307/2532087
López Veiga E. C. (1979). Fitting von Bertalanffy growth curves in short-lived fish species. A new approach. Investig. Pesq. 43, 179–186.
Maunder M. N., Crone P. R., Punt A. E., Valero J. L., Semmens B. X. (2016). Growth: Theory, estimation, and application in fishery stock assessment models. Fish Res. 180, 1–3. doi: 10.1016/j.fishres.2016.03.005
Maunder M. N., Punt A. E. (2013). A review of integrated analysis in fisheries stock assessment. Fish Res. 142, 61–74. doi: 10.1016/j.fishres.2012.07.025
Millán M. (1999). Reproductive characteristics and condition status of anchovy Engraulis encrasicolus L. from the Bay of Cadiz (SW Spain). Fish Res. 41, 73–86. doi: 10.1016/S0165-7836(99)00010-7
Morales-Nin B. (2000). Review of the growth regulation processes of otolith daily increment formation. Fish Res. 46, 53–67. doi: 10.1016/S0165-7836(00)00133-8
Pennino M. G., Coll M., Albo-Puigserver M., Fernández-Corredor E., Steenbeek J., Giráldez A., et al. (2020). Current and future influence of environmental factors on small pelagic fish distributions in the northwestern mediterranean sea. Front. Mar. Sci. 7, 566340. doi: 10.3389/fmars.2020.00622
Peters R. H. (1986). The ecological implications of body size. Available online at: https://books.google.com/books/about/The_Ecological_Implications_of_Body_Size.html?hl=es&id=OYVxiZgTXWsC (Accessed March 5, 2025).
Pilling G. M., Kirkwood G. P., Walker S. G. (2002). An improved method for estimating individual growth variability in fish, and the correlation between von Bertalanffy growth parameters. Can. J. Fish Aquat Sci. 59, 424–432. doi: 10.1139/f02-022
Pinheiro J. C., Bates D. M. (1996). Unconstrained parametrizations for variance-covariance matrices. Stat. Comput. 6, 289–296. doi: 10.1007/BF00140873
Punt A. E., Dunn A., Elvarsson BÞ, Hampton J., Hoyle S. D., Maunder M. N., et al. (2020). Essential features of the next-generation integrated fisheries stock assessment package: A perspective. Fish Res. 229, 105617. doi: 10.1016/j.fishres.2020.105617
Quinn T. J., Deriso R. B. (1999). Quantitative fish dynamics (New York-Oxford: Oxford University Press). Available at: https://books.google.es/books/about/Quantitative_Fish_Dynamics.html?id=5FVBj8jnh6sC&redir_esc=y.
Ramos F., Silva A., Uriarte A., Rincón M., Garrido S. (2018). Ane.27.9a stock (Anchovy in ICES Division 9a). Southern component (Anchovy in ICES Subdivision 9a South): Fishery and Surveys data. Copenhagen: ICES HQ, 75 pp. Available at: https://digital.csic.es/handle/10261/324665.
Rincón M. M., Corti R., Elvarsson B. T., Ramos F., Ruiz J. (2019). Granger-causality analysis of integrated-model outputs, a tool to assess external drivers in fishery. Fish Res. 213, 42–55. doi: 10.1016/j.fishres.2019.01.001
Rincón M. M., Mumford J. D., Levontin P., Leach A. W., Ruiz J. (2016). The economic value of environmental data: A notional insurance scheme for the European anchovy. ICES J. Mar. Sci. 73, 1033–1041. doi: 10.1093/icesjms/fsv268
Rincón-Hidalgo M., Ramos F., Tornero J., Garrido S., Elvarsson B., Lentin J. (2023). Gadget for anchovy 9a South: Model description and results to provide catch advice and reference points (WGHANSA-1 2023). Available online at: https://github.com/ices-taf/2023_ane.27.9a_south_assessment/blob/main/report/Assessment2023prov_May8.pdf (Accessed March 5, 2025).
Rodríguez Mendoza R. P. (2006). Otoliths and their applications in fishery science. Croat J. Fish Ribar. 64, 89–102.
Rodríguez-Roda J. (1977). El boquerón, Engraulis encrasicholus (L.), del Golfo de Cádiz. Inv. Pesq. 41 (2), 523–542.
Rogol A. D., Clark P. A., Roemmich J. N. (2000). Growth and pubertal development in children and adolescents: effects of diet and physical activity. Am. J. Clin. Nutr. 72, 521S–528S. doi: 10.1093/ajcn/72.2.521S
Ruiz J., Garcia-Isarch E., Emma Huertas I., Prieto L., Juárez A., Muñoz J. L., et al. (2006). Meteorological and oceanographic factors influencing Engraulis encrasicolus early life stages and catches in the Gulf of Cádiz. Deep Res. Part II Top. Stud. Oceanogr. 53, 1363–1376. doi: 10.1016/j.dsr2.2006.04.007
Ruiz J., González-Quirós R., Prieto L., Navarro G. (2009). A Bayesian model for anchovy (Engraulis encrasicolus): the combined forcing of man and environment. Fish Oceanogr 18, 62–76. doi: 10.1111/j.1365-2419.2008.00497.x
Sainsbury K. J. Effect of individual variability on the von bertalanffy growth equation 37, 241–247. doi: 10.1139/f80-031
Schwarz G. (1978). Estimating the dimension of a model. Ann. Stat. 6, 461–464. doi: 10.1214/aos/1176344136
Siple M. C., Koehn L. E., Johnson K. F., Punt A. E., Canales T. M., Carpi P., et al. (2021). Considerations for management strategy evaluation for small pelagic fishes. Fish Fish. 22, 1167–1186. doi: 10.1111/faf.12579
Stewart N. D., Busawon D. S., Rodriguez-Marin E., Siskey M., Hanke A. R. (2022). Applying mixed-effects growth models to back-calculated size-at-age data for Atlantic bluefin tuna (Thunnus thynnus). Fish Res. 250, 106260. doi: 10.1016/j.fishres.2022.106260
Taylor L., Begley J., Kupca V., Stefansson G. (2007). A simple implementation of the statistical modelling framework Gadget for cod in Icelandic waters. Afr. J. Mar. Sci. 29, 223–245. doi: 10.2989/AJMS.2007.29.2.7.190
Thorson J. T., Jensen O. P., Zipkin E. F. (2014). How variable is recruitment for exploited marine fishes? A hierarchical model for testing life history theory. Can. J. Fish Aquat Sci. 71, 973–983. doi: 10.1139/cjfas-2013-0645
Thorson J. T., Minto C. (2015). Mixed effects: a unifying framework for statistical modelling in fisheries biology. ICES J. Mar. Sci. 72, 1245–1256. doi: 10.1093/icesjms/fsu213
Uriarte A., Ibaibarriaga L., Sánchez-Maroño S., Abaunza P., Andrés M., Duhamel E., et al. (2023). Lessons learnt on the management of short-lived fish from the Bay of Biscay anchovy case study: Satisfying fishery needs and sustainability under recruitment uncertainty. Mar. Policy 150, 105512. doi: 10.1016/j.marpol.2023.105512
Wang Y.-G., Ellis N. (1998). Effect of individual variability on estimation of population parameters from length-frequency data. Canadian J. Fisheries and Aquatic Sciences. 55 (11), 2393-2401. doi: 10.1139/f98-134
Keywords: growth, anchovy, age-length, integrated stock-assessment models, Gulf of Cádiz
Citation: Rincón Hidalgo M, Gamaza M, Zúñiga M, Ramos F and Tornero J (2025) Decoding growth parameters of small pelagics: a critical examination of model effectiveness with a focus on the European anchovy. Front. Mar. Sci. 12:1467442. doi: 10.3389/fmars.2025.1467442
Received: 19 July 2024; Accepted: 10 February 2025;
Published: 24 March 2025.
Edited by:
Pablo Presa, University of Vigo, SpainReviewed by:
Taner Yildiz, Istanbul University, TürkiyeCopyright © 2025 Rincón Hidalgo, Gamaza, Zúñiga, Ramos and Tornero. This is an open-access article distributed under the terms of the Creative Commons Attribution License (CC BY). The use, distribution or reproduction in other forums is permitted, provided the original author(s) and the copyright owner(s) are credited and that the original publication in this journal is cited, in accordance with accepted academic practice. No use, distribution or reproduction is permitted which does not comply with these terms.
*Correspondence: Margarita Rincón Hidalgo, bWFyZ2FyaXRhLnJpbmNvbi1oaWRhbGdvQGVjLmV1cm9wYS5ldQ==
Disclaimer: All claims expressed in this article are solely those of the authors and do not necessarily represent those of their affiliated organizations, or those of the publisher, the editors and the reviewers. Any product that may be evaluated in this article or claim that may be made by its manufacturer is not guaranteed or endorsed by the publisher.
Research integrity at Frontiers
Learn more about the work of our research integrity team to safeguard the quality of each article we publish.