
94% of researchers rate our articles as excellent or good
Learn more about the work of our research integrity team to safeguard the quality of each article we publish.
Find out more
ORIGINAL RESEARCH article
Front. Mar. Sci., 05 February 2025
Sec. Marine Biology
Volume 12 - 2025 | https://doi.org/10.3389/fmars.2025.1452991
 Shawn E. Larson1*
 Katie Shelledy1
 Daniela Escontrela Dieguez1
 Jeff Christiansen1†
 Amy Y. Olsen1
 Zachary Randell1
 Megan H. Williams1
 Chris VanDamme1†
 Dayv Lowry2
 William Jasper3
Rockfish, Sebastes spp., are bottomfish that come in a variety of shapes, sizes and colors with 28 species recognized in the Salish Sea. Based on increasing concern over the long-term stability of rockfish populations in Washington by state and federal agencies, the Seattle Aquarium formalized a benthic monitoring program starting in 2005 on rocky reefs west and east of Neah Bay, Washington. Diver-operated video (DOV) surveys were conducted annually to quantify patterns in bottomfish (rockfish and other species associated with rocky reefs) abundance and stability over time. Divers performed 100-meter video transects devised to be both non-invasive and repeatable, for assessing both relatively sessile bottomfish and for schooling, transitory rockfish species. Strip transects were conducted annually in August from 2005 through 2023 at five permanently marked index sites. Species-specific relative abundance data for bottomfish were later extracted by biologists from archived video. Notably, over the 19-year study period, bottomfish abundance was stable or increased at all sites, driven by significant increases in eight rockfish species: Black/Deacon, Canary, China, Copper, Quillback, Tiger, and Yellowtail. Relatively few Puget Sound, Vermillion, Widow, and Yelloweye Rockfish individuals were documented, and their abundance did not increase throughout the study. Boccaccio where never encountered during the 19 year monitoring period. All sites displayed relative stability in fish community structure over time. We documented low levels of young-of-the-year (YOY) rockfish recruitment over the years with one major recruitment event in 2016. Despite an increase in abundance across eight rockfish species, recruitment events remained infrequent. Furthermore, Boccaccio and Yelloweye rockfish, both protected species, were either never or rarely encountered, respectively, underscoring the need for sustained conservation efforts and expanded long-term monitoring for species with long generation times such as rockfish.
Rockfish, Sebastes spp., are long-lived demersal fish with extended generation times and longevity ranging from 44 to 56 years for schooling species and up to 147 years for non-schooling species (Love et al., 2002). There are at least 34 species of rockfish in Washington state waters with 28 found in the Salish Sea (Love et al., 2002; Palsson et al., 2009). Rockfish have been declining in the Puget Sound since the 1970s (Williams et al., 2010). These declines resulted in two rockfish species being listed federally under the Endangered Species Act (ESA) within the Puget Sound and Georgia Basin: Yelloweye Rockfish (S. ruberrimus) are categorized as threatened and Bocaccio (S. paucispinis) are categorized as endangered (75 (Department of Commerce National Oceanic and Atmospheric Administration, 2010) FR 22276, 2010). These conservation designations and associated declines are attributed to historical fishing pressures and potential impacts on successful recruitment events thought to be caused by changes in water quality (Drake et al., 2010; Washington Department of Fish and Wildlife, 2011; Williams et al., 2010). Management and recovery plans for rockfishes at the state and federal level, in both the United States and Canada, prioritize determining stock status and trends as key outcomes from long-term baseline monitoring (National Marine Fisheries Service (NOAA NMFS), 2017b; Fisheries and Oceans Canada (DFO), 2021a). Recent model-based advances toward this goal have relied heavily on a combination of historical catch reconstruction and contemporary visual surveys of deep-water habitats using remotely operated vehicles (Min et al., 2023).
The waters in and around the west end of the Strait of Juan de Fuca and Neah Bay are defined by the Washington Department of Fish and Wildlife (WDFW) and Makah Fisheries Management (MFM) co-managers as Marine Areas 4A and 4B (the Strait of Juan de Fuca from Cape Flattery east to the Sekiu River) (Figure 1). Part of this area also lies within the Olympic Coast National Marine Sanctuary (OCNMS; Figure 1). Marine areas 4A and 4B lie west of an extensive rockfish harvest closure in the eastern Strait of Juan de Fuca and Puget Sound (Marine Areas 6 through 13). Rockfish fishery closures in Marine Areas 6 through 13 were enacted in 2010 to protect the ESA listed Yelloweye, Bocaccio, and Canary Rockfish (S. pinniger), the latter of which was delisted in 2017 due to genetic similarity to the outer coast stock (National Marine Fisheries Service, 2017a). While these closures do not apply to Marine Areas 4A and 4B, catch restrictions are in place to limit the overharvest of many rockfish species. For example, while fishing in Marine Area 4B is allowed year-round, recreational anglers are permitted to retain a total of seven rockfish per day, comprised of just four species: Black (S. melanops), Deacon (S. diaconus), Yellowtail (S. flavidus), and Widow (S. entomelas) (Fish Management Program, 2022). Furthermore, there is no directed tribal or non-tribal commercial rockfish fishery.
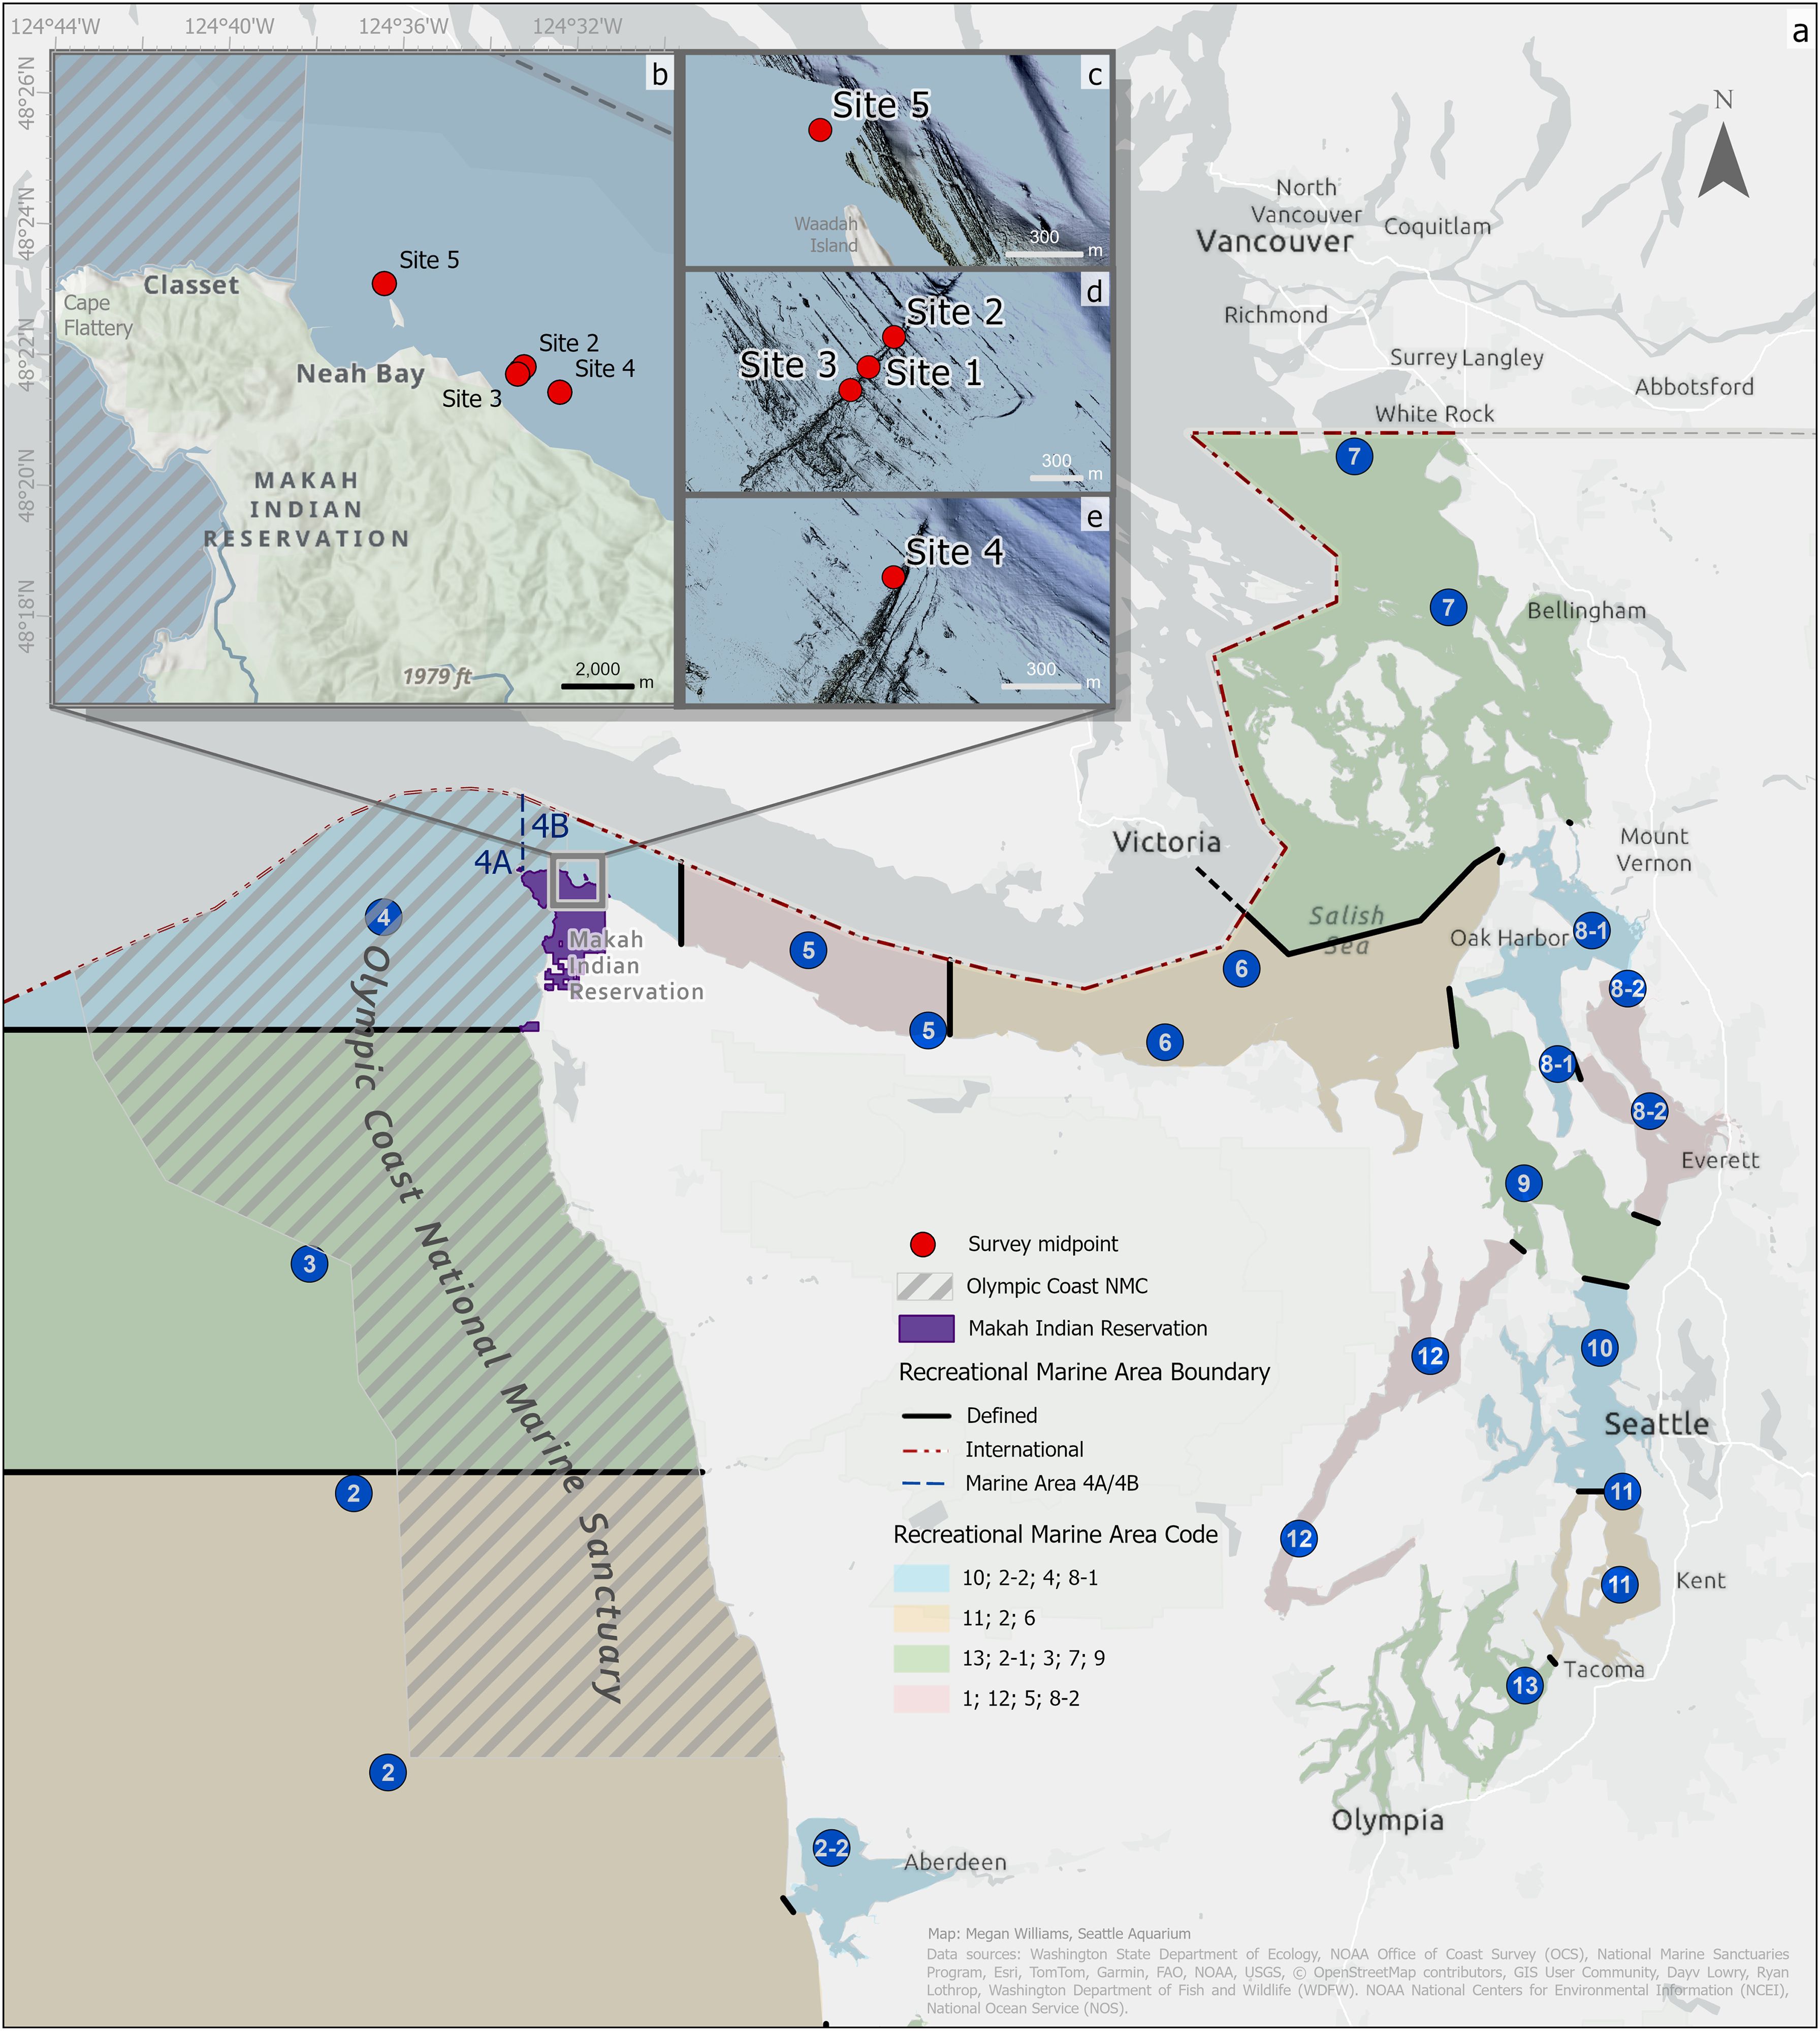
Figure 1. Map of the study area showing the five study sites off Neah Bay, Washington. (A) The map includes layers for recreational marine areas (2–13) and boundaries along the Washington coast and throughout Puget Sound (Lowry et al., 2014), the Olympic Coast National Marine Sanctuary (National Marine Sanctuaries Program, 2004), the Makah Indian Reservation (Washington Department of Ecology, 2017), and a boundary line between Marine Areas 4A and 4bB. (B–E) Bathymetric insets for sites 1–4 highlight the tilted basaltic reefs with central starting positions marked by red circles (NOAA NECI and NOS, 2020). (C) No bathymetric data are available for site 5. Refer to Table 1 depths, and reef orientations.
Since 1984, Seattle Aquarium staff have performed annual collections of temperate marine species for aquarium habitats in and around Marine Area 4B. Aquarium divers participating in annual collections had observed changes in rockfish and other bottomfish abundance and diversity over time, however these anecdotal observations were never quantified. To formally document bottomfish abundance and stability in and around Neah Bay, all within Marine Area 4B, and in response to NOAA NMFS’ call for increased monitoring of bottomfish species in the northeast Pacific, the Seattle Aquarium began formal strip diver operated video (DOV) transects in 2005. Here, we report 19 years of annual bottomfish surveys at five sites in the Strait of Juan de Fuca just east and west of Neah Bay, Washington. All the sites surveyed in this study are located within the Makah Tribe’s Usual and Accustomed fishing area and within marine management area 4B. This is a fishery hotspot area, with recreational rockfish and non-rockfish directed commercial fishing occurring year-round. Our questions were twofold: 1) Did bottomfish abundance and community structure change significantly over the study period? and 2) What was the frequency of large rockfish recruitment events?
The study area is a marine benthic habitat east-southeast of Cape Flattery in the Strait of Juan de Fuca. The five surveyed sites were distributed across three reef systems located just southeast and northwest of the entrance to Neah Bay harbor and just east of the OCNMS (see Figure 1 for map and Table 1 for site descriptions and depths). This area is characterized by tilted slab basaltic reefs that range from 4 m to 6 m tall and run at least 100 m with unbroken reef faces. These basaltic reefs have shell-gravel/sand/cobble benthos and known bottomfish communities (Figure 1).
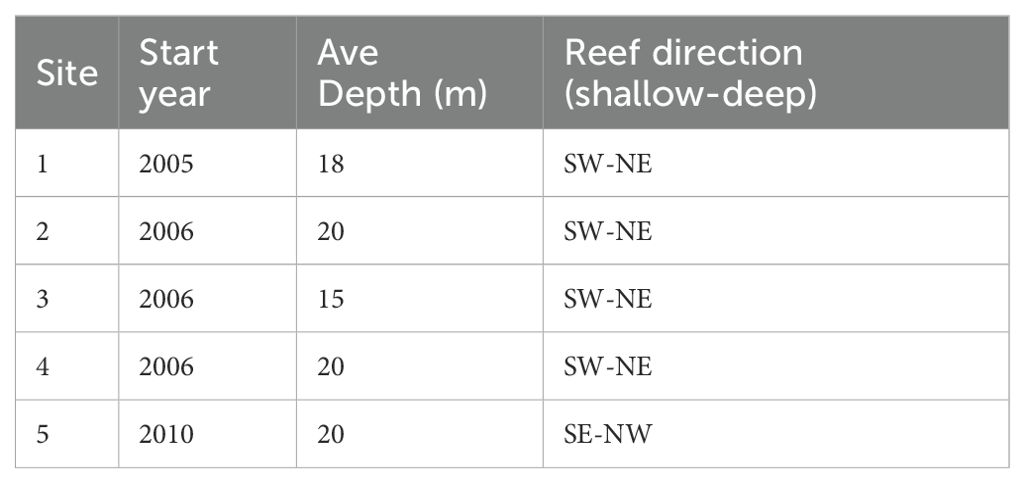
Table 1. Study site descriptions.
Site 1 was the first annually surveyed site, established in 2005. Sites 2 through 4 were added in 2006 and site 5 was added in 2010. Sites were surveyed annually in August via strip DOV transects. Exceptions to annual surveys were as follows: Site 3 was not surveyed in 2016 due to low visibility (less than 1 m), site 5 was not surveyed in 2021 due to unworkable ocean conditions (i.e. high swell prevented dropping the divers on the site), and none of the sites were surveyed in 2020 due to COVID 19 pandemic restrictions. At sites 1 through 4, reef systems run in a south to north direction, while at site 5 the reef runs east to west. Transects were conducted along the tilted slab reefs for vertical and horizontal reference, with the surveyed side varying by site: the east side at sites 1 through 3, the west side at site 4, and the south side at site 5. Video transects were conducted as close as possible to slack tide for optimal diving conditions and between 10:00 am and 5:00 pm for optimal video quality and consistency of conditions (light and presence of diurnal fish).
Dive teams conducted DOV surveys using a 100 m fiberglass surveyors transect tape and a handheld video camera equipped to record diver audio via full face masks and communication units for communications with the boat and for use as an audio slate during the dive. Two divers conducted each strip transect survey: the camera-operating diver swam 1 m above the benthos and 1 m off of the slab reef while the transect-tape diver deployed the transect tape 1 m off of the video operator, or about 2 m from the reef. We counted all fish within 4 m of the forward-facing camera lens, horizontally held in relation to the bottom contour, representing a maximum volume of water ca. 30-58 m3 in all dimensions of the camera. All diver comments on fish species, transect measurements, depth, and current were recorded alongside video observations using full face masks equipped with audio devices, to assist with data verification. A 50 m transect segment began at a permanent zero-point marker located at the midpoint of the 100 m survey area. Forward swims (away) from the marker provided undisturbed video without the transect tape in the viewfinder. Reverse swims (back) to the marker showed the transect tape in the field of view (see Supplementary Figure 1 for a visual interpretation of the dive configuration during the survey). A transect consisted of two, opposing 50 m forward swims and two, opposing 50 m reverse swims, resulting in a 100 m forward and 100 m reverse complete transect (for detailed description of the methods see Larson et al., 2022). This procedure allowed for two views of the reef and accounted for differences in fish behavior caused by divers and gear (i.e., gear attraction or avoidance). One forward and one reverse transect were conducted at each site. Our method was similar to Reef Check methods with slate counting divers who count undisturbed fish on the first pass of the transect tape and divers and who also use standard strip transect methods (Freiwald et al., 2021).
Lens combinations for all cameras and housings were selected to maximize the available field of view while ensuring that fish could be identified to the species level during post-processing analysis on a large high-definition screen. The underwater video camera system used from 2005 through 2010 was a Sony™ VX2100 mini DV camera housed in a Light and Motion™ Bluefin VX2100 Elite Travel Package. Accessories included a Light and Motion™ Bluefin Compact Monitor (VX2100) and a Light and Motion™ UWA 100° Wide Angle Lens. Underwater video camera systems used from 2011 through 2023 were a Sony αNEX 5N, α5000, or α6500 Digital camera using a Sony SEL16F28 16mm f2.8 and VCL-ECU2 close-up adapter (100° angle of view) in a Nauticam NEX 5N, NA-5000, or NA-A6500 underwater housing with a 4.33” fisheye port. The 100° accessory wide lens on the Light and Motion™ housing was used as the initial benchmark for field of view for this research which was continued in the latter camera configuration and was maintained throughout the study. Furthermore, the aspect ratio of the recording format changed from 4:3 to 16:9 when the switch was made to the Sony α series cameras in 2011, producing slightly higher image resolution. From 2011 through 2023, the camera lens and dome port specification remained unchanged between the Sony α series cameras, giving a consistent field of view and image resolution on this video platform. With the one change in video equipment mid-way through the 19 year dataset, the recorded resolution increased from 480i to 4k/24p while maintaining a 100° angle field of view.
Underwater communications consisted of diver-worn full face masks equipped with a wireless transceiver and either a direct hardwire link to the camera housing (Bluefin) or a wireless receiver (Ocean Technology Systems Inc. (OTS) RX-100) mounted external to the camera housing (Nauticam) for recording diver audio. Masks were either Interspiro Divator MkII or OTS Guardian Full Face Masks (GFFM) equipped with OTS earphones and a microphone. Divers wore OTS wireless transceivers (SSB-2010) to provide audio communication between divers and the camera system. Continuous recording of diver speech onto the video file enabled diver observations to be made at the rate the diver could clearly speak and provided an “audio slate” to aid in fish identification when capturing data off of the video (Larson et al., 2022).
Fish data were collected from the videos on a large screen (23” or greater) monitor using commercially available video players (Windows Media Player and VLC Media player). The video output included the visual transect from each site as well as an audio recording of diver observations in real time. A trained observer then reviewed the video and audio files at reduced speed to identify and count fish captured in the video field of view. No still frames were taken from the video, rather the fish were counted directly from the video and only those that could be identified to species level were recorded, aided by the audio slate when appropriate. Fish that were pushed in front of the camera were noted and were not double counted. Young-of-the-year (YOY) were classified as those individuals that were less than 10 cm long, the standard cut off used to describe YOY rockfish, and were thought to be composed of that years cohort (Obaza et al., 2021). This method of data mining the video allowed for counts of fish abundance and diversity annually and provided a permanent record of the reef for repeated analysis, future research, and educational purposes.
There were two instances where we pooled rockfish species. Black and Deacon Rockfish were grouped as they commonly schooled together and were difficult to distinguish from each other when in large mixed groups. Siilarly YOY rockfish schools were also counted as grouped sums because they were composed of relatively large mixed species of individuals (typically made up of Black, Canary, Decon, Widow, and Yellowtail Rockfish) only a few centimeters in length (up to 10 cm), making it difficult to accurately determine species given video resolution and distance from the camera.
To compare our data to other bottomfish metrics collected in Marine Area 4B, we compared fish counts derived from DOV surveys with the recreational fishery information network (RecFIN) biological samples from Neah Bay from 2005 through 2023 (https://www.recfin.org/). RecFIN is a collaborative program among state and federal fishery management agencies on the West Coast to consolidate fishery-related sampling data into a single clearing house and is overseen by the Pacific Marine Fisheries Commission. Recorded species were as follows: Black, Canary, China (S. nebulosus), Copper (S. caurinus), Deacon, Puget Sound (S. emphaeus), Quillback (S. maliger), Tiger (S. nigrocinctus), Vermilion (S. miniatus), Widow, Yelloweye, and Yellowtail Rockfish; as well as Cabezon (Scorpaenichthys marmoratus); Pacific Halibut (Hippoglossus stenolepis); Lingcod (Ophiodon elongatus); Kelp Greenling (Hexagrammos decagrammus); and Wolf-eel (Anarrhichthys ocellatus). Biological samples were generated by WDFW creel samplers over the timeframe of the study. WDFW samplers stationed in Neah Bay collected catch and effort information during dockside angler interviews from boats returning from fishing. During the recreational season each year, recreational fisheries in Neah Bay were sampled a minimum of four days per week, with weekend (Saturday, Sunday, and holidays) and weekdays (non-holiday Monday through Friday) stratified. A minimum of 20% of the boats returning to the port within each boat type (charter and private) were sampled. Data collected during each sample included number of anglers, target species, area fished, landed catch by species, and angler estimates of released groundfish by species (Fish Management Program, 2018).
All data were analyzed using the statistical software, R (v4.3.1; R Core Team, 2023). To avoid pseudo-replication, we used only the forward 100 m pass for all statistical analyses.
To understand adult rockfish trends over time, we constructed a generalized linear mixed effects model (GLMM) with rockfish counts as the response, year × species as fixed effects, and site as a random effect. Given the year × species interaction was significant (year × species, df = 16, LRT = 14.45, p = 0.03), we then constructed separate generalized linear models (GLMs) for each species using counts as the response and year as the predictor. We dropped the random effect (site) as it explained little variation in the mixed effects model and led to convergence issues with the species-specific models (due to insufficient data points). We used the negative binomial distribution for all models to account for overdispersion. We removed Puget Sound, Vermillion, and Yelloweye Rockfish from this analysis as they were observed less than ten times throughout the study period. Widow Rockfish were also removed, even though 70 individuals were counted, because they were observed in only one year (2008) at two sites (sites 1 and 2).
To analyze changes in abundance over the survey time, we used change point analysis. This analysis allowed us to identify the exact time points in the time series where a statistically significant change occurred. Change points in annual rockfish counts were identified using the changepoint.np package in R (Haynes and Killick, 2022). This method applies a non-parametric cost function and uses the pruned exact linear time algorithm (PELT) to search for optimal segmentations or significant changes in trends (Killick et al., 2012). Analysis was completed for total adult rockfish and total YOY, as well as independently for counts of each species tracked. To further assess the significance of these results, we used pairwise Wilcox tests to compare mean counts from the distinct time periods as designated by the changepoint segmentations for each species (Hollander and Wolfe, 1973).
We performed multivariate non-metric multidimensional scaling (NMDS) analyses to extract and visualize the predominant patterns of community structure using the vegan package (Oksanen et al., 2022) in R. We analyzed data from 2010 onwards as we did not add site 5 until that year. The sample unit was kept at the scale of the individual transect. To evaluate how the fluctuations in YOY affected multivariate community structure, we conducted our NMDS analyses on data frames with and without YOY. Rarely observed species encountered on less than 1% of surveys were omitted from the analyses, which resulted in the removal of Puget Sound Rockfish (n=8), Wolf Eel (n=4), and Pacific Halibut (n = 1). The remaining 14 species (or 13 excluding YOY) were retained for the multivariate analyses. Abundances in the community matrix were retained at the natural scale. We used the Bray-Curtis distance metric to calculate a dissimilarity matrix for our n = 70 rows of data, and the metaMDS function in the vegan package to perform NMDS analysis.
To determine whether YOY counts were independent of year, we conducted a Kruskal-Wallace test with the model ‘YOY ~ Year’, where ‘YOY’ indicated counts for each site and year (Hollander and Wolfe, 1973).
To examine how RecFIN data (response) varied with DOV fish counts (predictor), we constructed a GLMM with year and bag limits as random effects. We included all non-rockfish species and only those rockfish species which could be caught each year, as follows: from 2005 through 2009 all species except Canary and Yelloweye, from 2010 through 2019 only Black and Deacon Rockfish, and from 2020 onwards only Black, Deacon, Yellowtail, and Widow Rockfish. Bag limits were as follows: ten fish per day from 2005 through 2009, six fish per day from 2010 through 2019, and seven fish per day from 2021 through 2023. DOV fish counts were totaled across sites for each year and species.
For all GLMMs and GLMs, we tested for homoscedasticity using plots of residuals versus fitted values and tested the assumptions of normality using q-q plots of residuals. The significance of fixed effects was evaluated using likelihood ratio tests (LRTs).
We documented the following rockfish species during our surveys: Black/Deacon, Canary, China, Copper, Puget Sound, Quillback, Tiger, Yelloweye, Yellowtail, YOY (mixed species), and Widow. We also recorded the following non-rockfish bottomfish: Cabezon, Pacific Halibut (documented once), Kelp Greenling, Lingcod, and Wolf Eel (documented once).
Bottomfish abundances varied interannually among sites. The overall trend over the 19-year dataset was stability at all sites, with slight increases at some of the sites (Supplementary Figure 2). Black/Deacon, Canary, China, Copper, Quillback, Tiger, and Yellowtail Rockfish all contributed to the increase in abundance seen at most sites based on significant GLMM (Figure 2). Puget Sound (documented just once), Vermillion, Widow, and Yelloweye Rockfish were rare throughout the 19-year study period and thus do not have modeled projections. The rate of increase in rockfish abundance over time varied depending on the species (year × species, df = 16, LRT = 14.45, p = 0.03) and year was a significant predictor of abundance for all rockfish species (see p values Figure 2). We observed the most notable increase in abundance for China and Black/Deacon Rockfish, which increased by tens to hundreds of individuals over the 19 year study period, respectively. Alternately, Canary, Copper, Quillback, Tiger, and Yellowtail all increased by only a few individuals (usually less than five) over the 19 year monitoring period. Other bottomfish were Cabezon that were rare and Lingcod and Greenling that were stable throughout the study period (see Supplementary Figure 3 for species scatter plots).
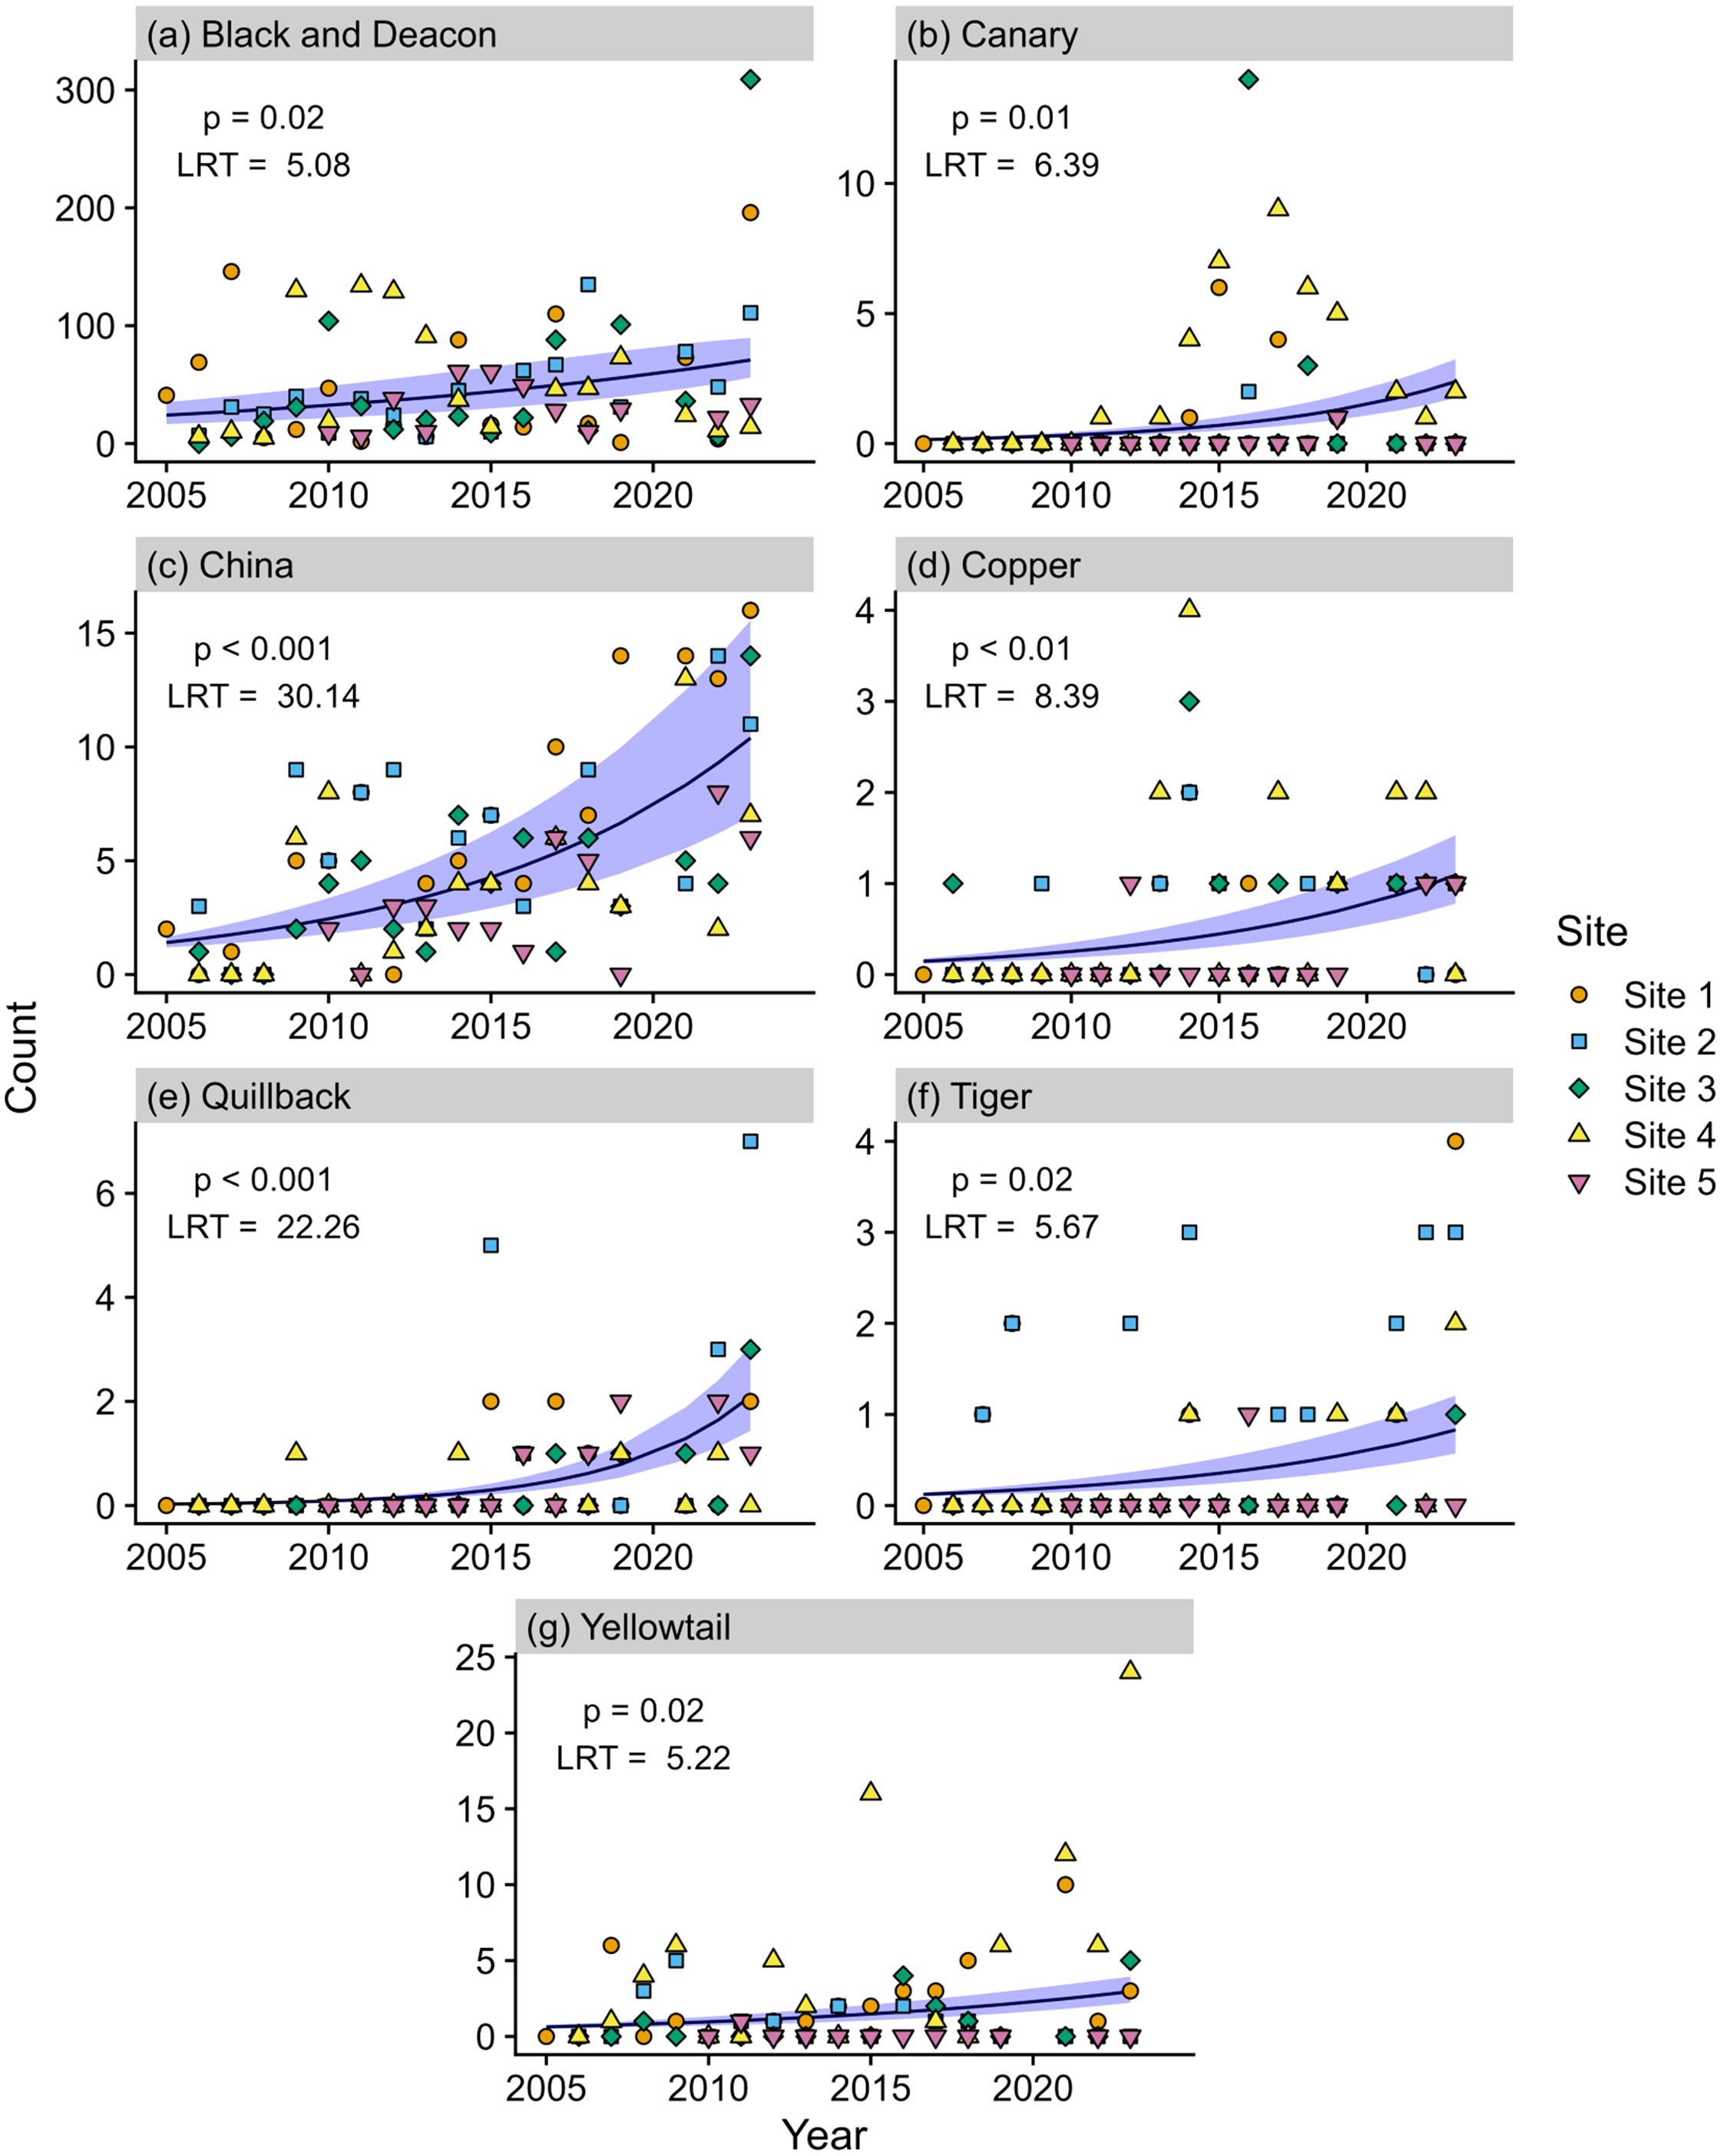
Figure 2. Marginal effects plot depicting rockfish counts derived from DOV surveys through time (2005 through 2023) for (A) Black/Deacon, (B) Canary, (C) China, (D) Copper, (E) Quillback, (F) Tiger, and (G) Yellowtail Rockfish. Each point corresponds to rockfish counts for a given site and year. Plot displays predicted values (line) and 95% confidence interval (shaded area) from the GLMM. Results on the upper left corner of each graph correspond to the LRT conducted to test the significance of the fixed effect (year) in the GLM.
Following the significant model results, with year as a significant predictor, we used changepoint analysis to further investigate whether changes in abundance occurred during specific years. Among the species that increased, some were associated with specific significant changepoints after which they were observed more frequently each year. These species were Copper and Canary in 2012, Quillback in 2014, Tiger in 2019 and China in 2022 (Figure 3). According to Wilcoxon rank sum tests, each of these species exhibited a significant difference (p < 0.01) in annual counts before versus after the identified changepoint.
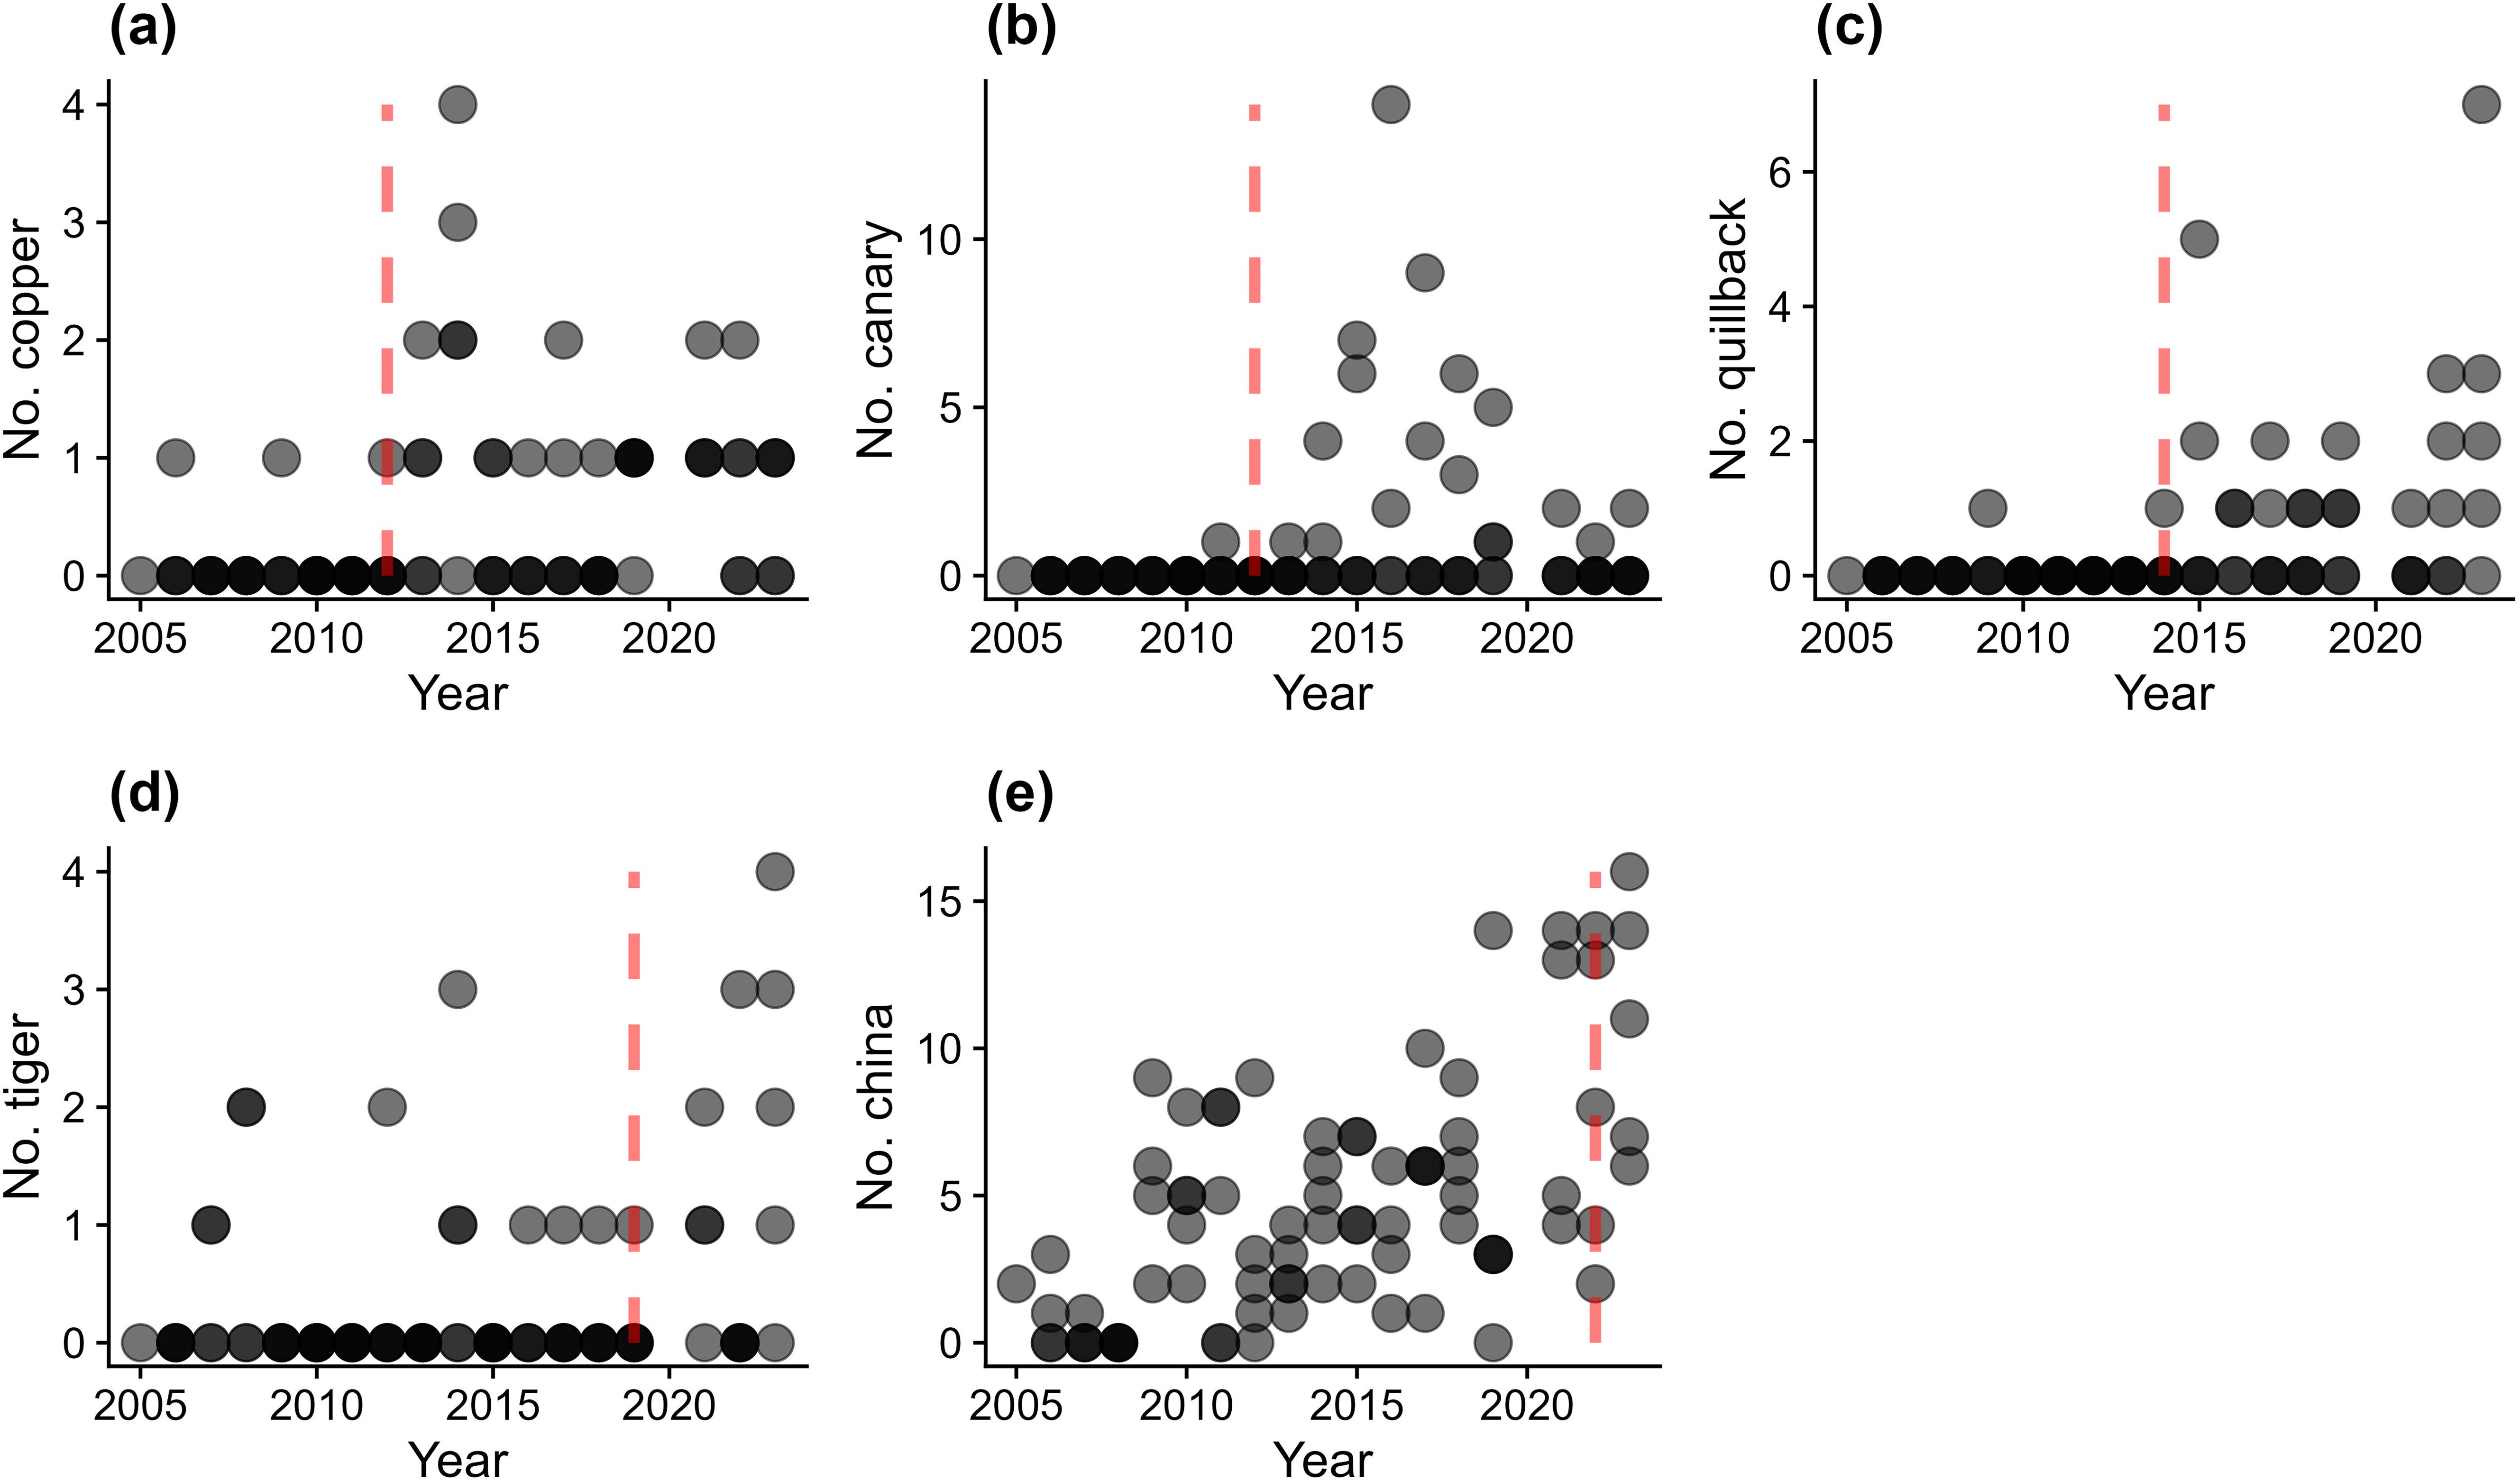
Figure 3. Significant changepoint figures for copper (A), canary (B), quillback (C), tiger (D) and China (E). The red dashed line indicates the significant changepoint.
Over the 19-year dataset and across all sites, the only notable peak in YOY abundance occurred in 2016 (Figure 4). The Kruskal-Wallace rank sum test revealed year was not a significant predictor of YOY count (p= 0.086). Thus the 2016 peak should be considered an outlier or “jackpot” recruitment event.
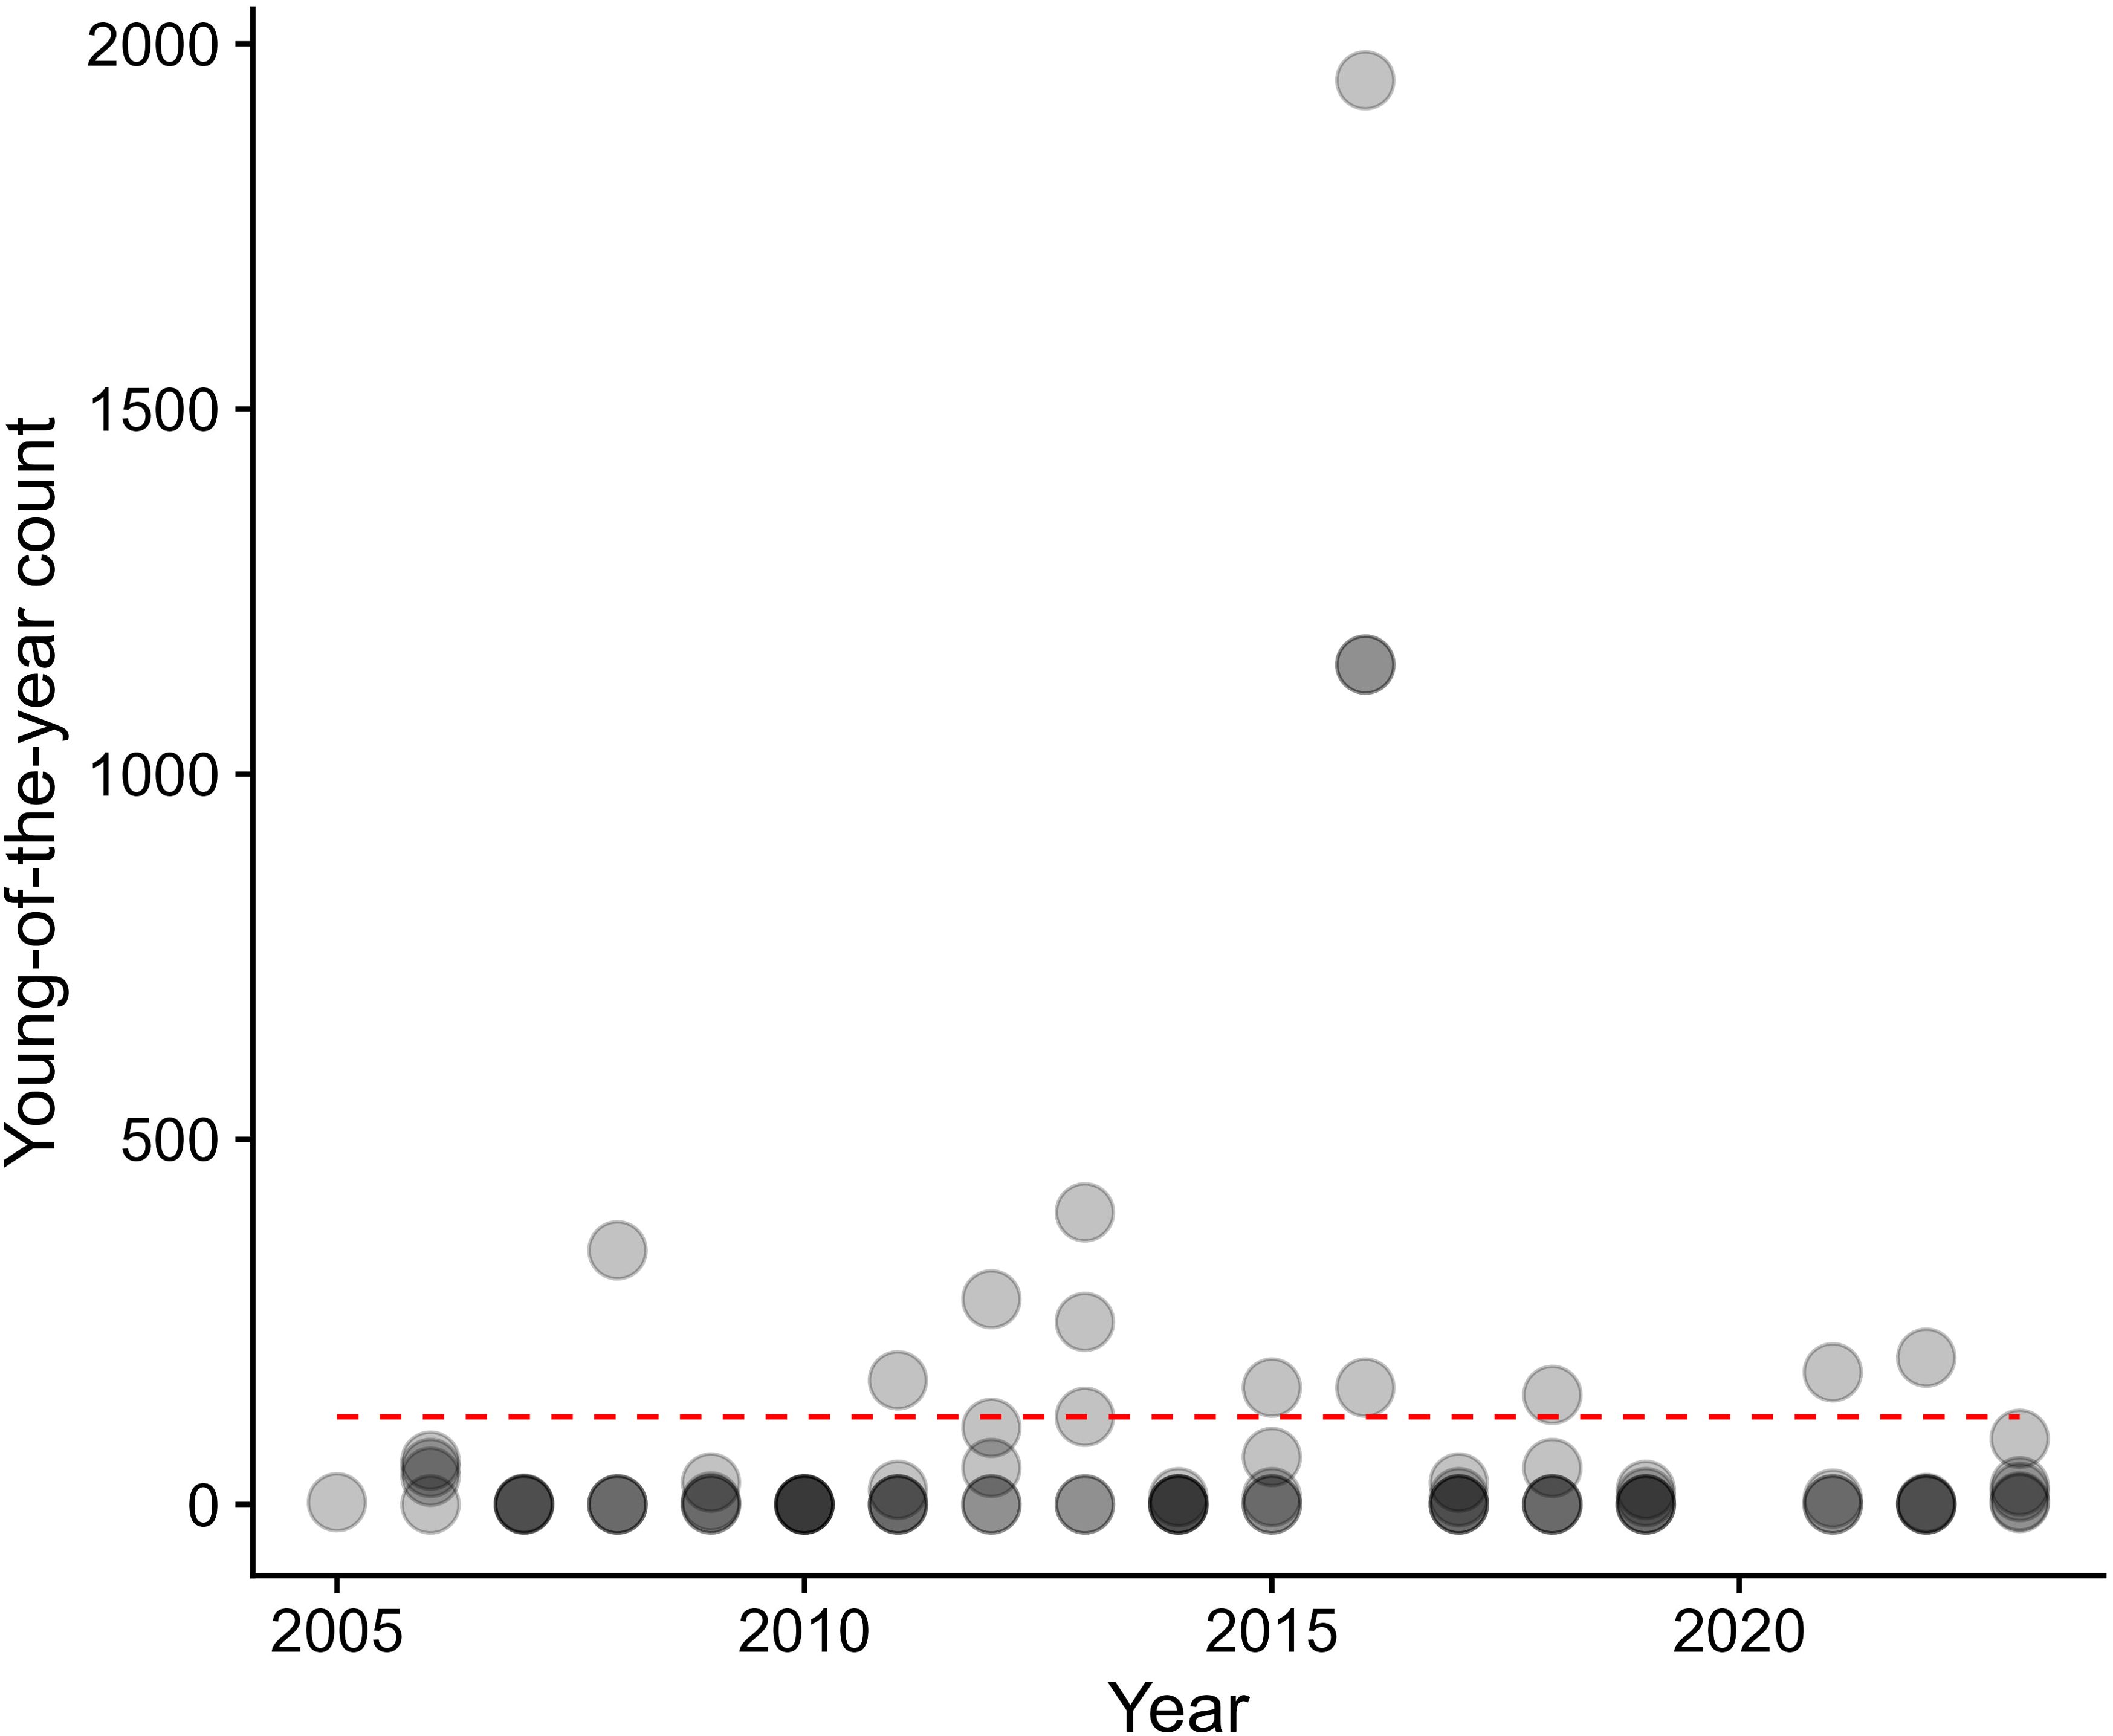
Figure 4. Young of year rockfish (YOY) over time all sites. Points greater than 120 (denoted with the gray dashed line) are considered outliers when all points are considered together.
All sites, including site 5, the westernmost site, occupied similar multivariate space, indicating considerable overlap in the constituency and species-specific abundance of the bottomfish community across time. The multivariate space was larger with YOY included (stress = 0.13; Figure 5A) when compared to the NMDS without YOY (stress = 0.12; Figure 5B), thus the YOY event in 2016 did affect community structure. Overall community structure was variable interannually, but largely consistent across all sites.
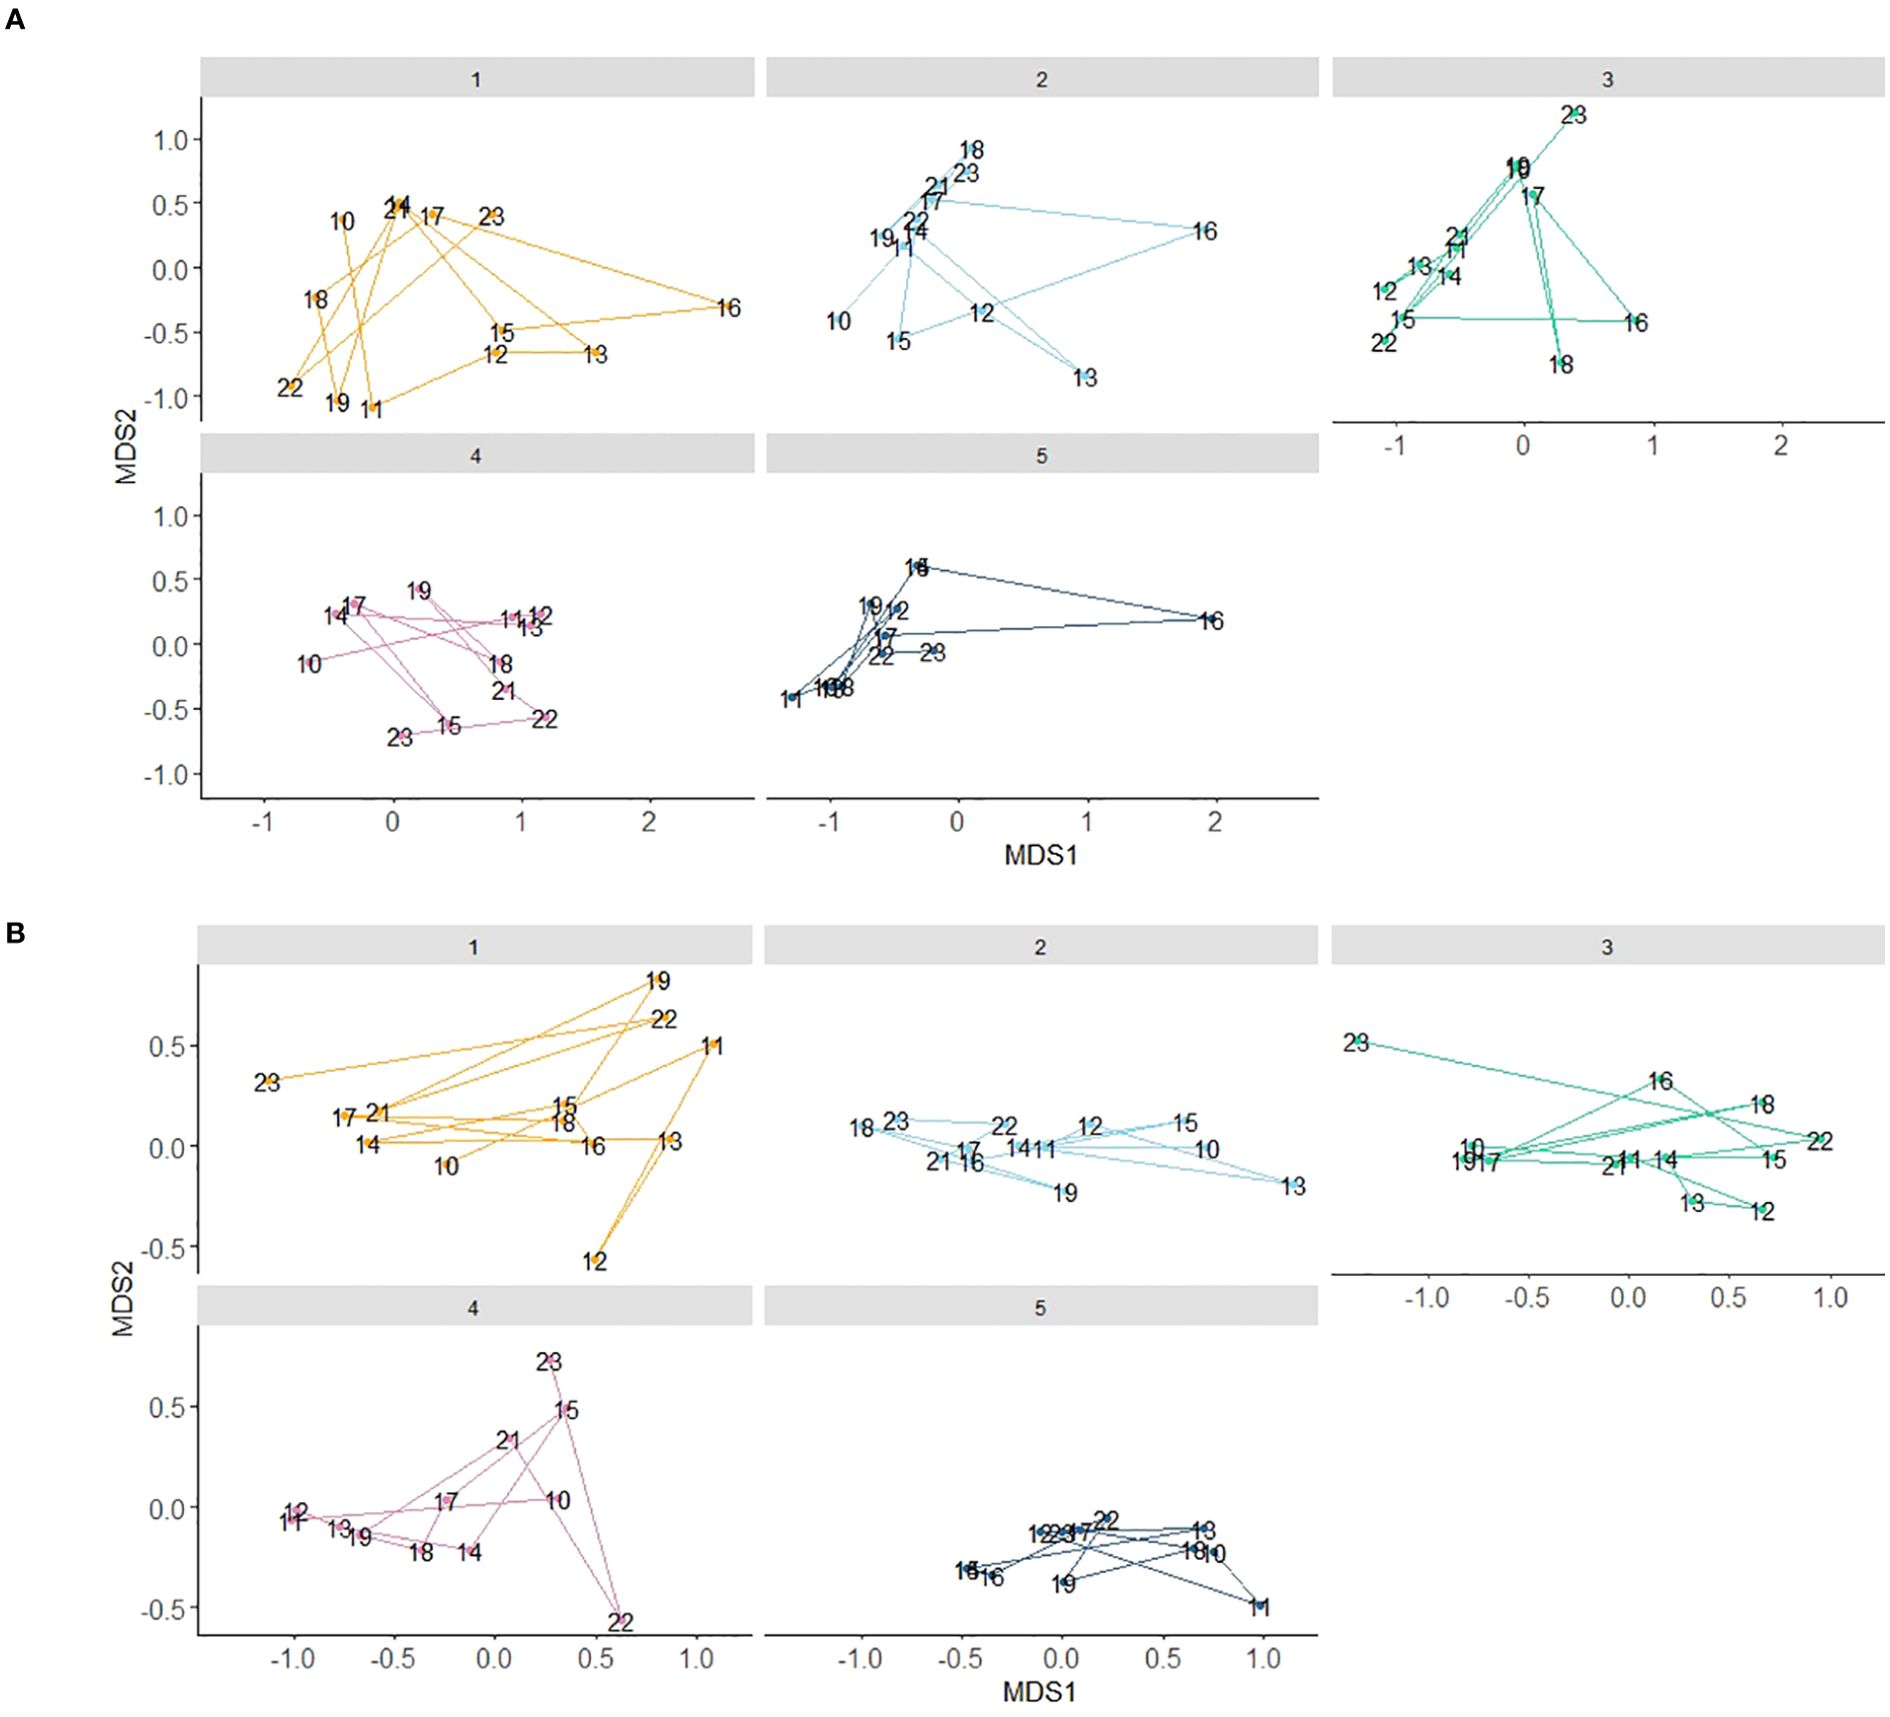
Figure 5. Sites are designated by different colors and each data point is a year (A) NMDS all sites 2010-2023 with YOY (stress=0.13).; (B) NMDS all sites 2010-2023 no YOY (stress = 0.12).
We found there was a positive relationship between fish counts derived from DOV surveys and RecFin counts in the GLMM (Figure 6). Fish counts derived from DOV surveys were a significant predictor of RecFIN counts (df = 5, LRT = 88.71, p < 0.001).
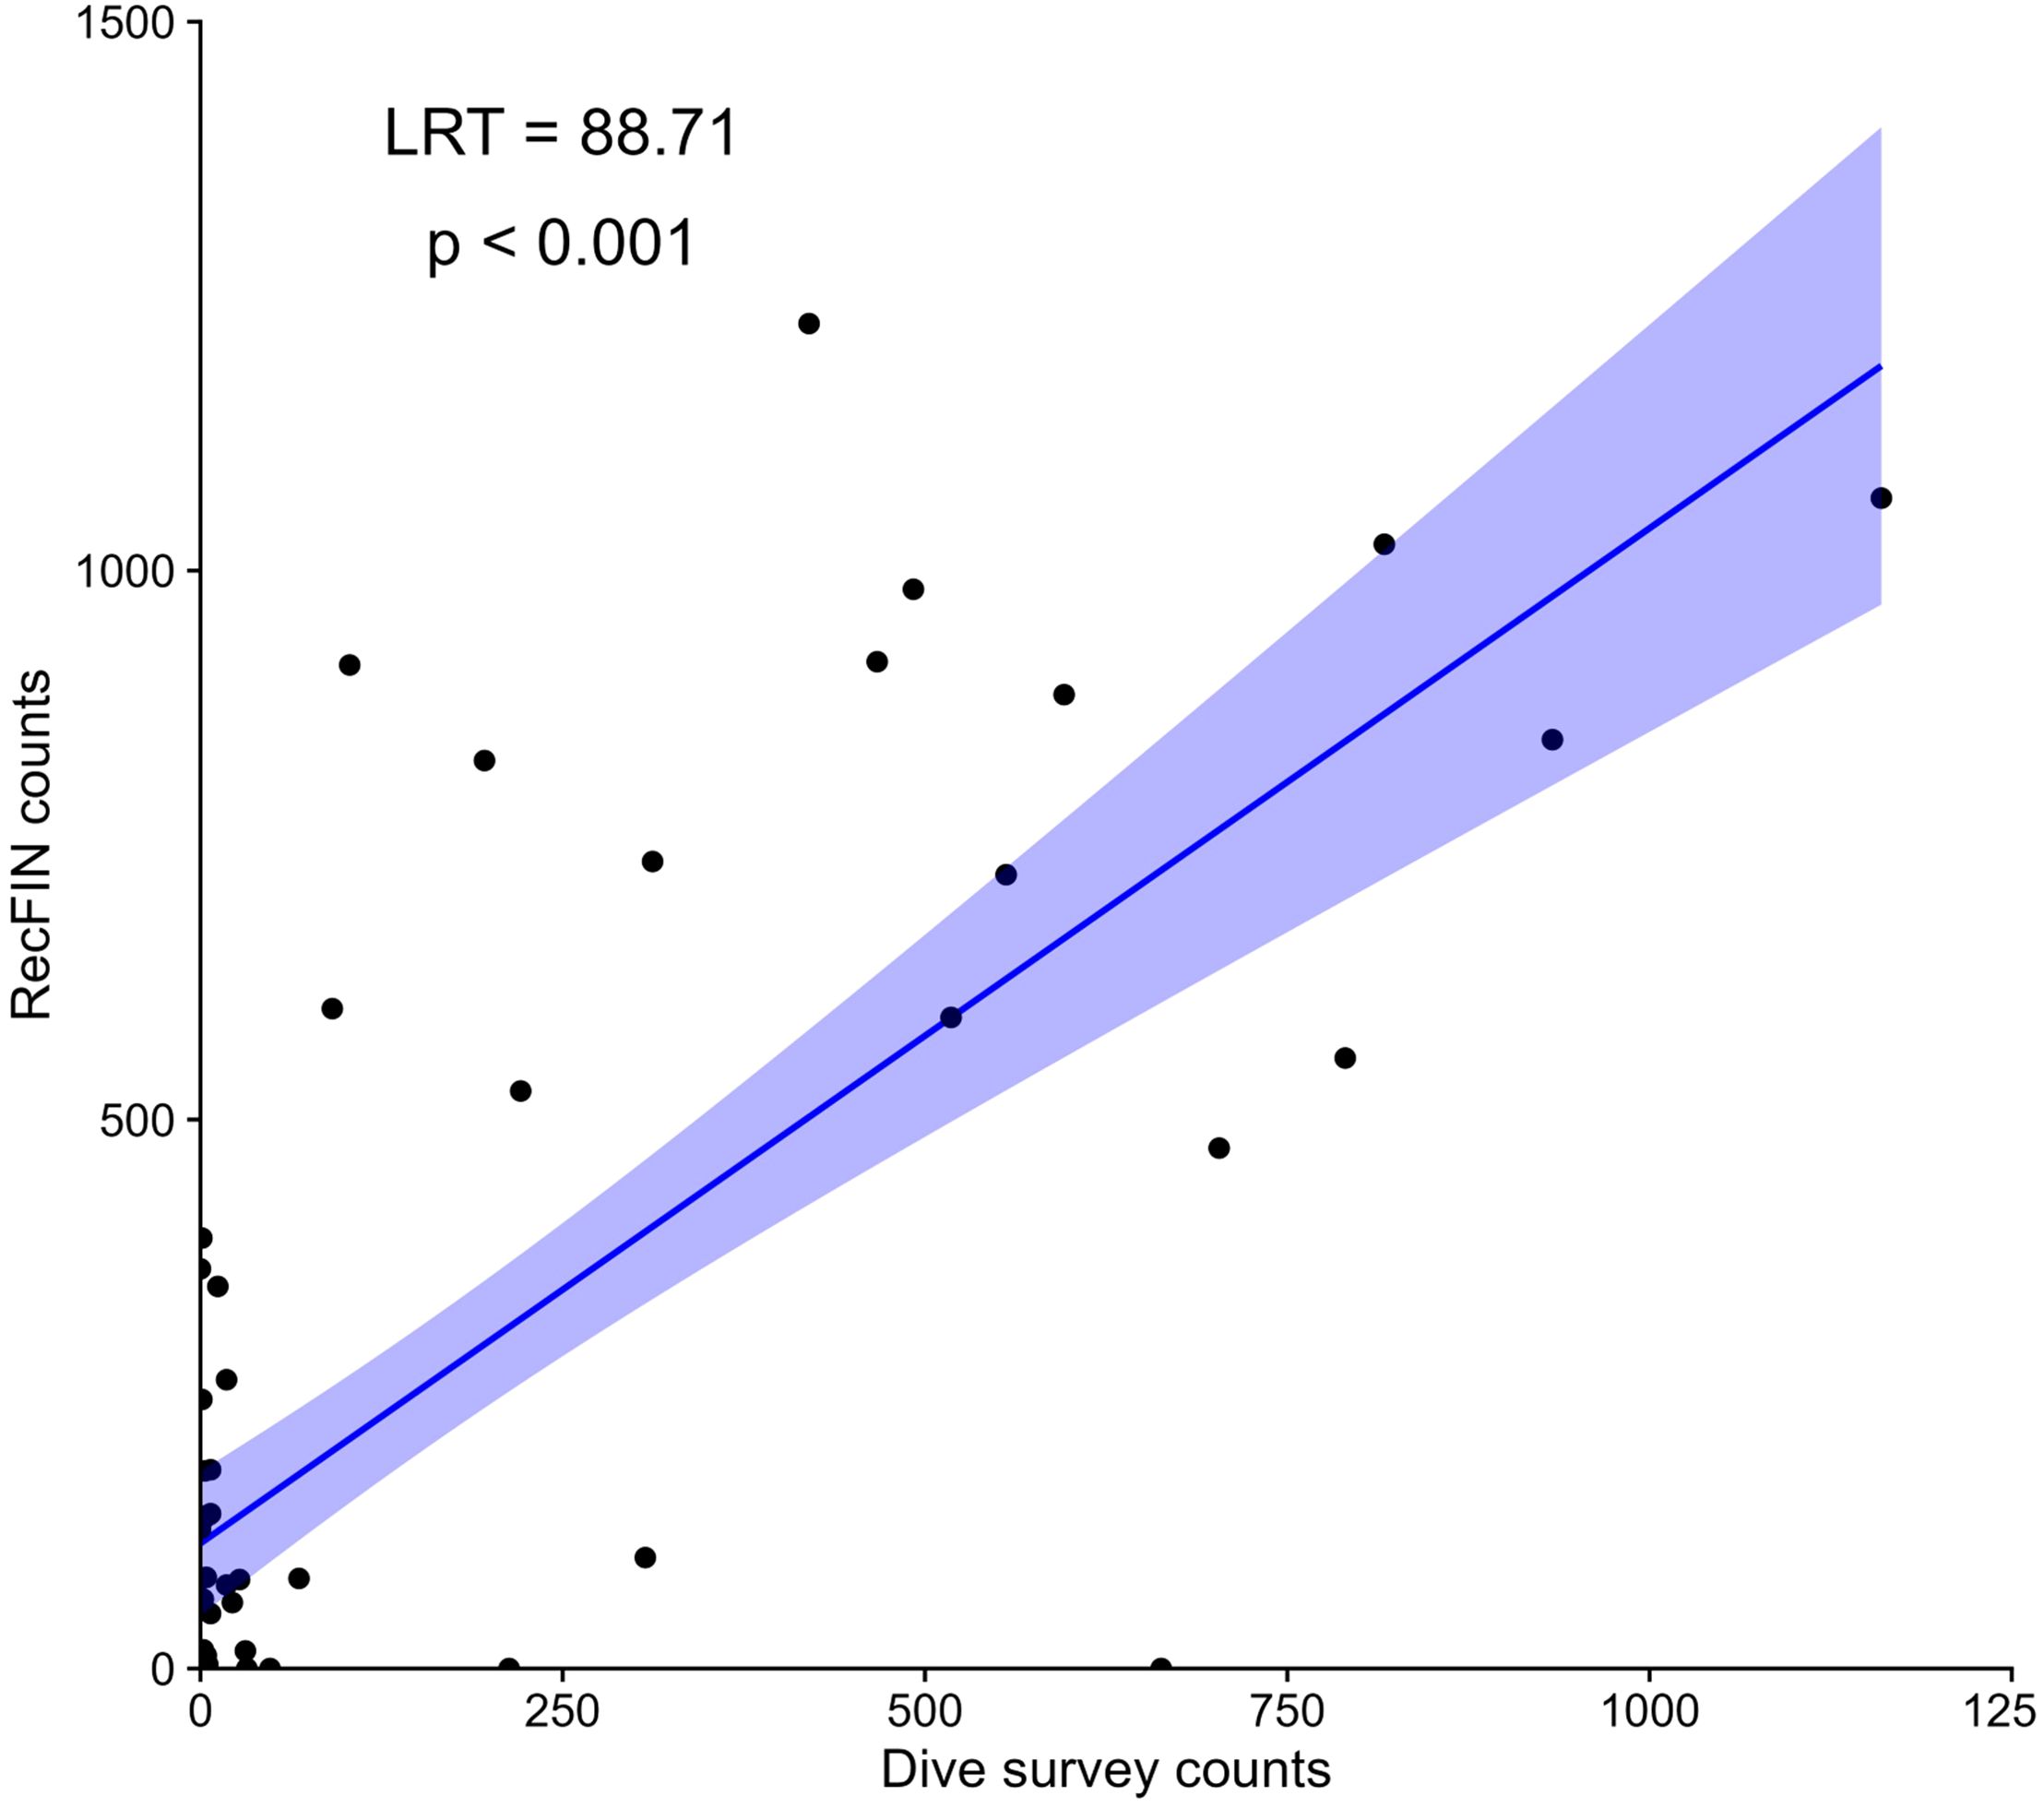
Figure 6. Marginal effects plot depicting dive survey data and recreational fish landings from RecFIN data (2005 through 2023). Each point corresponds to the count for a given species each year (totaled across sites for dive survey data). Plot displays predicted values (line) and 95% confidence interval (shaded area) from GLMM. Only species which could be caught each year were included in the analysis.
Limited datasets exist for direct comparison with this study, given its nature as an extended duration longitudinal investigation aimed at documenting temporal changes in rockfish abundance in the western Strait of Juan de Fuca. While there have been other extended rockfish studies, these have primarily occurred in the Puget Sound. LeClair et al. (2018) is the most directly comparable study, as it was conducted via SCUBA from 1995 through 2010. Interannual variability was documented with noted decreases in some rockfish species, particularly Copper and Quillback (LeClair et al., 2018). Similar to this study, they captured only one “jackpot” recruitment event in 2006 and 2007 (LeClair et al., 2018). A subsequent, briefer study spanning from 2015 to 2020 did not record any noteworthy YOY recruitment events within the Puget Sound, although areas north of the Strait of Juan de Fuca in the Georgia Strait experienced a pulse in recruitment for some rockfish species in 2016 and 2020 (Obaza et al., n.d.; DFO, 2021b, 2024; Starr and Haigh, 2022).
We note interannual variability in bottomfish abundance over time with increases in many of the observed species (Supplementary Figures 2, 3, Figures 2, 3), similar to other surveys of bottomfish in the Northeast Pacific using various sampling methods (LeClair et al., 2018; Pacunski et al., 2020; Keller et al., 2005). Our results showed significant increases over time in eight rockfish species, although the magnitude of this increase varied by species (Figure 2) with significant changes in species trends in five species (Figure 3). The differences in trends between species could be attributed to factors such as life history characteristics (i.e. age at maturity, mortality rate), habitat preferences, and depth associations, among others. For example, China, Black, and Deacon rockfish, which increased by tens to hundreds of individuals, mature earlier in life, leading to faster population recovery rates. These species are primarily associated with shallow, nearshore rocky habitats, making them more detectable at depths accessible to SCUBA divers (Palsson et al., 2009). Additionally, these species had higher initial population sizes, which likely contributed to a larger number of reproductive adults in the population. In contrast, Canary, Quillback, Tiger, and Yellowtail rockfish increased by fewer than five individuals during the study period, possibly due to their later maturation, which results in slower population growth rates (Palsson et al., 2009). Some of these species are also associated with deeper habitats beyond the reach of SCUBA divers, which may have hindered detection (Palsson et al., 2009). Finally, we observed little to no presence of Puget Sound, Widow, Vermilion, Boccaccio, and Yelloweye rockfish. Puget Sound rockfish are typically absent from the Strait of Juan de Fuca and have the highest natural mortality rate of the rockfish species we documented (Palsson et al., 2009). In contrast, Widow, Boccaccio, and Yelloweye rockfish are generally found in deeper habitats, which likely resulted in their low detection during our surveys.
The significant change points (Figure 3) and the “jackpot” YOY recruitment event (Figure 4) coincided with two Northeast Pacific warm water events: the “Blob,” from 2013 to 2016 and the “Blob 2.0,” in 2019 (Amaya et al., 2020; Khangaonkar et al., 2021). Data from other survey efforts in the region also detected a 2016 “jackpot” YOY recruitment event, with DFO Canada estimating Bocaccio rockfish settlement on the West Coast of Vancouver Island 44 times greater than the long-term average (Cornthwaite and Workman, 2021; Starr and Haigh, 2022). The exact underlying mechanism connecting marine heatwaves and rockfish YOY “jackpot” recruitment events remains elusive; however, Black Rockfish on the West Coast of the United States experienced increased larval growth and development rates after the marine heatwave yet that did not result in a YOY settlement pulse, likely due to increased predator abundance and/or phenological shifts in prey availability (Fennie et al., 2023).
A notable ecosystem shift occurred in the study area during and following the “Blob” anomalous marine heatwave event. This ecosystem shift was characterized by a loss of kelp, pandemic of sea star wasting syndrome, and considerable increase in urchin abundance, yet, this study documented stability in bottomfish communities at all sites Figure 5; (Galloway et al., 2023; Rogers-Bennett and Catton, 2019; Tolimieri et al., 2023). This result suggests that adult bottomfish in this region may be resistant to pulse-perturbations such as marine heatwaves and benthic state shifts from kelp dominated states to urchin barrens. The long-term implications of the increase in sea urchins at these survey sites, driven by widespread loss of sea urchin predators due to sea star wasting syndrome, remains unknown (Harvell et al., 2019; Montecino-Latorre et al., 2016). Larval rockfish are thought to preferentially settle alongside marine vegetation in this region, such as understory kelp (Tolimieri et al., 2023). Understanding how such YOY settlement relates to adult abundance in deeper waters will require expanded monitoring, such as adding more sites and remotely operated vehicle surveys to collect data in waters deeper than SCUBA depths, and continued subtidal monitoring.
The stability of bottomfish over 19 years in this known fishery hot spot is notable and aligns with the finding of LeClair et al. (2018), which found that rockfish were most abundant in Puget Sound sites that were once heavily fished, compared no take areas or Marine Protected Areas (MPAs). This pattern could be explained by several factors unrelated to fishing pressure, such as heavily fished areas coinciding with the preferred habitats of target species, thereby increasing the likelihood that population growth occurs in these fished areas first. It is also useful to consider that, while there is a recreational fishery for rockfish and other bottomfish in marine Area 4B, there is no large-scale commercial fishery targeting rockfish in this area. There is, however, a Makah artisanal rod and reel fishery which targets rockfish and other bottomfish in the area. This fishery is primarily conducted from small vessels (less than 25 ft) and has limited participation. Makah fish ticket records indicate that, on average, less than 6,500 pounds of bottomfish have been caught annually across all fisheries occurring in Marine Area 4B since 2010. However, Pacific Halibut and associated deepwater bottomfish species (Rougheye rockfish - Sebastes aleutianus, Sablefish - Anoplopoma fimbri, Pacific cod - Gadus macrocephalus, etc) comprise approximately 50% of this annual catch. These species are primarily harvested in much deeper waters of the Western Strait of Juan de Fuca, which are outside the focus of this study (Personal Communications - Makah Fisheries Management, 2024). As a result, despite regular fishing pressure in this area, rockfish species remain stable, and in some cases, are increasing over time.
Retention limits for recreational anglers (including rockfish sub-bag limits) have generally become more restrictive in Marine Area 4B, with some relaxation of those restrictions in recent years; increasing the daily rockfish bag limit from 6 to 7 (Fish Management Program, 2022). Despite this overall restrictive trend in recreational fisheries management, the fact that the creel species composition is positively correlated with the dive survey data reported here (Figure 6) suggests creel data may be a good metric for the fish species documented in this region. Fish trends derived from the dive surveys were a good predictor of reported RecFIN catches. However, the creel data does not capture the large number of species which cannot be retained in the region, nor does it track YOY recruitments. Thus, it is suggested that creel data be used to supplement the DOV method but should not be used as a substitute for subtidal monitoring.
The Seattle Aquarium is committed to continuing long term subtidal monitoring of bottomfish in Marine Area 4B. We also plan to increase the breadth and scope of our dataset which will enhance our capability to capture changes in bottomfish populations over time. To this end, we will increase the number of DOV index sites and will add remotely operated vehicle (ROV) index sites, the latter of which will allow us to gather additional data in areas beyond SCUBA depths. By making these changes we hope to better capture those species associated with deeper habitats, beyond the depths accessible to SCUBA divers, such as the threatened Yelloweye and endangered Boccacio Rockfish.
This study set out to answer two questions: 1) did bottomfish abundance and community structure change significantly over the study period? and 2) what was the frequency of significant rockfish recruitment events? Over the 19-year study period, we observed fish community stability with gradual increases in bottomfish abundance at most sites. We noted significant increases in Black/Deacon, Canary, China, Copper, Quillback, Tiger, and Yellowtail Rockfish. Even though this was a “long-term” study we documented only one “jackpot” YOY recruitment event. LeClair et al. (2018) concluded that their 16-year study period was not long enough to determine significant trends, as they documented just one strong recruitment event in 2006. While the dataset reported here spanned 19 years and was conducted in a different region, we found remarkably similar results: interannual variability in species abundance with rare, strong recruitment events. We suggest that monitoring to inform rockfish response to changing ocean conditions, as well as fishery management practices (Min et al., 2023), should span multiple decades to detect meaningful trends for rockfish species which have long generation times (e.g. 7 to 10 years for Black, 22.8 years for Quillback and 32.5 years for Yelloweye Rockfish) (M. S. Love et al., 2002; Yamanaka, 2006). Only after we are able to document multigenerational trends of rockfish will we be able to manage and conserve these species for generations to come.
The datasets presented in this study can be found in online repositories. The names of the repository/repositories and accession number(s) can be found below: https://github.com/zhrandell/Seattle_Aquarium_Neah_Bay_subtidal_monitoring.
The animal study was approved by Seattle Aquarium Research Review Committee. The study was conducted in accordance with the local legislation and institutional requirements.
SL: Conceptualization, Data curation, Formal analysis, Funding acquisition, Investigation, Methodology, Project administration, Resources, Software, Supervision, Validation, Visualization, Writing – original draft, Writing – review & editing. KS: Formal analysis, Software, Visualization, Writing – original draft, Writing – review & editing. DED: Formal analysis, Methodology, Software, Visualization, Writing – review & editing. JC: Conceptualization, Methodology, Project administration, Supervision, Writing – original draft, Writing – review & editing. AO: Formal analysis, Software, Writing – original draft, Writing – review & editing. ZR: Formal analysis, Software, Visualization, Writing – original draft, Writing – review & editing. MW: Formal analysis, Software, Visualization, Writing – original draft, Writing – review & editing. CV: Investigation, Writing – original draft, Writing – review & editing. DL: Writing – original draft, Writing – review & editing. WJ: Visualization, Writing – original draft, Writing – review & editing.
The author(s) declare financial support was received for the research, authorship, and/or publication of this article. This research was funded by the Foley Frischkorn Conservation Fund and the Seattle Aquarium general operations funds.
The authors thank the numerous staff, volunteers, and divers from the Seattle Aquarium who contributed to field operations and video recording review. The authors extend thanks to: Barry Hatch, Joel Hollander, Alex Tanz, Tim Carpenter, Kathryn Kegel, Nicole Killibrew, Robert Kirkle, Eric Parker, Mike McGraff, Dave Sylvester, Jim Burke, Dave Smith and Josh Bouma who assisted in the collection of the data. The authors wish to extend our deepest thanks to Makah Fisheries Managers Russell Svek, Ray Colby and Ryan Erhart who supported this work and facilitated the Seattle Aquarium to acquire multi-year memorandum of agreements allowing the Seattle Aquarium to conduct these surveys in Makah Usual and Accustomed waters.
The authors declare that the research was conducted in the absence of any commercial or financial relationships that could be construed as a potential conflict of interest.
All claims expressed in this article are solely those of the authors and do not necessarily represent those of their affiliated organizations, or those of the publisher, the editors and the reviewers. Any product that may be evaluated in this article, or claim that may be made by its manufacturer, is not guaranteed or endorsed by the publisher.
The Supplementary Material for this article can be found online at: https://www.frontiersin.org/articles/10.3389/fmars.2025.1452991/full#supplementary-material
Supplementary Figure 1 | Diver operated video method cartoon showing the camera operator next to reef and the transect operator off of the camera operator furthest from the reef. Note also the swim pattern starting at the middle of the 100 m transect swimming 50 m in one direction recording and then turning around the swim the opposite direction to the center. Once at the center the divers then swam the opposite direction for 50 m recording, turning around to swim back to the start. In this way the transect tape was only deployed 50 m making it easier to handle in swell and current.
Supplementary Figure 2 | Total adult fish abundance from 2005 through 2023 at (A) site 1, (B) site 2, (C) site 3, (D) site 4, and (E) site 5. Different colors and shapes denote different sites. Note general upwards trend at sites 1 through 3 and stability at sites 4 and 5 over the study period.
Supplementary Figure 3 | Species scatters plots 2005 through 2023. Different colors and shapes denote different sites. Note low levels throughout the study period for Widow, Vermillion and Yelloweye Rockfish and Cabezon. Also note stability over time for Lingcod and Greenling.
Amaya D. J., Miller A. J., Xie S.-P., Kosaka Y. (2020). Physical drivers of the summer 2019 North Pacific marine heatwave. Nat. Commun. 11, 1903. doi: 10.1038/s41467-020-15820-w
Cornthwaite C. M., Workman G. (2021). British Columbia Groundfish Fisheries and Their Investigations in 2020. Prepared for the Technical Sub-Committee of the Canada-United States Groundfish Committee. Fisheries and Oceans Canada, Science Branch, Pacific Biological Station, Nanaimo, British Columbia. Available online at: https://waves-vagues.dfo-mpo.gc.ca/Library/40935218.pdf.
Department of Commerce National Oceanic and Atmospheric Administration. (2010). 75FR 22276. (Seattle, Washington, United States: NMFS Scientific Publications Office (SPO)), 22276–22290.
DFO (Fisheries and Oceans Canada) (2021a). Management plan for the yelloweye rockfish (Sebastes ruberrimus) in Canada (Canada: Fisheries and Oceans Canada (DFO) Library. Institute of Ocean Sciences (IOS) in Sidney, British Columbia), 31.
DFO (Fisheries and Oceans Canada) (2021b). Update of the 2019 Bocaccio (Sebastes paucispinis) stock assessment for British Columbia in 2021. (Canada: Fisheries and Oceans Canada (DFO) Library. Institute of Ocean Sciences (IOS) in Sidney, British Columbia).
DFO (Fisheries and Oceans Canada) (2024). Update of the 2019 Bocaccio (Sebastes paucispinis) Stock Assessment for British Columbia in 2024. (Canada: Fisheries and Oceans Canada (DFO) Library. Institute of Ocean Sciences (IOS) in Sidney, British Columbia).
Drake J. S., Berntson E. A., Cope J. M., Gustafson R. G., Holmes E. E., Levin P. S., et al. (2010). Status review of five rockfish species in Puget Sound, Washington: Bocaccio (Sebastes paucispinis), canary rockfish (S. pinniger), yelloweye rockfish (S. ruberrimus), greenstriped rockfish (S. elongatus), and redstripe rockfish (S. proriger) Vol. 108 (Seattle, Washington, United States: NMFS Scientific Publications Office (SPO)), 234. Available online at: https://repository.library.noaa.gov/view/noaa/3777 (Accessed December 10, 2024).
Fennie H. W., Grorud-Colvert K., Sponaugle S. (2023). Larval rockfish growth and survival in response to anomalous ocean conditions. Sci. Rep. 13, 4089. doi: 10.1038/s41598-023-30726-5
Fish Management Program (2018). Washington Sport Fishing Rules (Olympia, Washington, United States: Washington Department of Fish and Wildlife), 104.
Fish Management Program (2022). Washington Sport Fishing Rules (Olympia, Washington, United States: Washington Department of Fish and Wildlife), 115.
Freiwald J., McMillan S. M., Abbott D. (2021). Reef Check California Instruction Manual: A Guide to Monitoring California’s Kelp Forests. 10th ed (Marina del Rey, California, United States: Reef Check Foundation).
Galloway A. W. E., Gravem S. A., Kobelt J. N., Heady W. N., Okamoto D. K., Sivitilli D. M., et al. (2023). Sunflower sea star predation on urchins can facilitate kelp forest recovery. Proc. R. Soc. B: Biol. Sci. 290, 20221897. doi: 10.1098/rspb.2022.1897
Harvell C. D., Montecino-Latorre D., Caldwell J. M., Burt J. M., Bosley K., Keller A., et al. (2019). Disease epidemic and a marine heat wave are associated with the continental-scale collapse of a pivotal predator (Pycnopodia helianthoides). Sci. Adv. 5, eaau7042. doi: 10.1126/sciadv.aau7042
Haynes K., Killick R. (2022). Methods for nonparametric changepoint detection (R Package Version 1.0.5). Available online at: https://CRAN.R-project.org/package=changepoint.np (Accessed June 12, 2024).
Hollander M., Wolfe D. A. (1973). Nonparametric Statistical Methods (Hoboken, New Jersey, United States: John Wiley & Sons).
Keller A., Horness B., Fruh E., Simon V., Tuttle V., Bosley K., et al. (2005). NOAA Technical Memorandum NMFS-NWFSC-93. The 2005 U.S. West Coast Bottom Trawl Survey of Groundfish Resources off Washington, Oregon, and California: Estimates of Distribution, Abundance, and Length Composition. (Springfield, Virginia, United States: the NOAA Institutional Repository, the National Technical Information Service (NTIS)).
Khangaonkar T., Nugraha A., Yun S. K., Premathilake L., Keister J. E., Bos J. (2021). Propagation of the 2014–2016 Northeast Pacific marine heatwave through the Salish sea. Front. Mar. Sci. 8. doi: 10.3389/fmars.2021.787604
Killick R., Fearnhead P., Eckley I. A. (2012). Optimal detection of changepoints with a linear computational cost. J. Am. Stat. Assoc. 107 (500), 1590-1598.
Larson S., Christiansen J., Olsen A. Y., Walsh W. J., Teague C. H., Tissot B., et al. (2022). A unique 100 meter underwater survey method documents changes in abundance, richness, and community structure of Hawai′i reef fishes. Front. Mar. Sci. 9. doi: 10.3389/fmars.2022.892261
LeClair L., Pacunski R., Hillier L., Blaine J., Lowry D. (2018). Summary of findings from periodic scuba surveys of bottomfish conducted over a sixteen-year period at six nearshore sites in central Puget Sound (Olympia, Washington, United States: Washington Department of Fish and Wildlife), 189.
Love M. S., Yoklavich M., Thorsteinson L. (2002). The rockfishes of the northeast Pacific (Oakland, California. United States: University of California Press).
Lowry D., Lothropm R., Washington Department of Fish and Wildlife. (2014). Major fishing area [Feature Layer]. Available online at: https://geodataservices.wdfw.wa.gov/arcgis/rest/services/FP_Projects/MajorFishingArea/MapServer.
Min M. A., Cope J., Lowry D., Selleck J., Tonnes D., Andrews K., et al. (2023). Data-limited fishery assessment methods shed light on the exploitation history and population dynamics of endangered species act-listed yelloweye rockfish in Puget Sound, Washington. Mar. Coast. Fisheries 15, Article 5. doi: 10.1002/mcf2.10251
Montecino-Latorre D., Eisenlord M. E., Turner M., Yoshioka R., Harvell C. D., Pattengill-Semmens C. V., et al. (2016). Devastating transboundary impacts of sea star wasting disease on subtidal asteroids. PloS One 11, e0163190. doi: 10.1371/journal.pone.0163190
National Marine Sanctuaries Program. (2004). Olympic coast national marine sanctuary boundary (polygon) Edition: 200412 GeospatialDataPresentation_Form: vector digital data. (Silver Spring, Maryland: NOAA / National Marine Sanctuary Program). Available online at: http://www.sanctuaries.noaa.gov/.
National Marine Fisheries Service. (2017a). Endangered and threatened species; removal of the Puget Sound/Georgia Basin Distinct Population Segment of canary rockfish from the federal list of threatened and endangered species and removal of designated critical habitat, and update and amendment to the listing descriptions for the yelloweye rockfish DPS and bocaccio DPS. Federal Register 82, Article 13. (Seattle, Washington, United States: NMFS Scientific Publications Office (SPO)). Available online at: https://www.federalregister.gov/documents/2017/01/23/2017-00559/endangered-and-threatened-species-removal-of-the-puget-soundgeorgia-basin-distinct-population.
National Marine Fisheries Service. (2017b). Rockfish Recovery Plan: Puget Sound/Georgia Basin yelloweye rockfish (Sebastes ruberrimus) and bocaccio (Sebastes paucispinis) (National Marine Fisheries Service).
NOAA NECI and NOS. (2020). NCEI Bathymetric Attributed Grid (BAG) Mosaic [TIFF]. Available online at: https://www.ncei.noaa.gov/maps/bathymetry/Viewless.
Obaza A., Bird A., Selleck J., Tonnes D. (2021). Results from Young-of-the-Year Rockfish Surveys in the southern Salish Sea 2015-2020 (Seattle, Washington, United States: NMFS Scientific Publications Office (SPO)), 23.
Oksanen J., Simpson G., Blanchet F., Kindt R., Legendre P., Minchin P., et al. (2022). _vegan: community ecology package_ (R package version 2), 6–4. Available online at: https://CRAN.R-project.org/package=vegan (Accessed May 5, 2024).
Pacunski R., Lowry D., Selleck J., Beam J., Hennings A., Wright E., et al. (2020). Quantification of bottomfish populations, and species-specific habitat associations, in the San Juan Islands, WA employing a remotely operated vehicle and a systematic survey design. (Olympia, Washington, United States: Washington Department of Fish and Wildlife).
Palsson W. A., Tsou T.-S., Bargmann G. G., Buckley R. M., West J. E., Mills M. L., et al. (2009). The biology and assessment of rockfishes in Puget Sound (FPT 09-04; Issue FPT 09-04) (Olympia, Washington, United States: Washington Department of Fish and Wildlife). Available online at: https://wdfw.wa.gov/sites/default/files/publications/00926/wdfw00926.pdf (Accessed November 24, 2024).
R Core Team (2023). R: A Language and Environment for Statistical Computing [Computer software] (R Foundation for Statistical Computing). Available online at: https://www.R-project.org/ (Accessed January 20, 2024).
Rogers-Bennett L., Catton C. A. (2019). Marine heat wave and multiple stressors tip bull kelp forest to sea urchin barrens. Sci. Rep. 9, 15050. doi: 10.1038/s41598-019-51114-y
Starr P. J., Haigh R. (2022). Bocaccio (Sebastes paucispinis) stock assessment for British Columbia in 2019, including guidance for rebuilding plans. (Vancouver, British Columbia, Canada: Canadian Science Advisory Secretariat. Canada. Department of Fisheries and Oceans. Pacific Region).
Tolimieri N., Shelton A., Samhouri J., Harvey C., Feist B., Williams G., et al. (2023). Changes in kelp forest communities off Washington, USA, during and after the 2014-2016 marine heatwave and sea star wasting syndrome. Mar. Ecol. Prog. Ser. 703, 47–66. doi: 10.3354/meps14220
Washington State Department of Ecology. (2017). Tribal Lands [Feature Layer]. Available online at: https://services.arcgis.com/6lCKYNJLvwTXqrmp/arcgis/rest/services/ECY/FeatureServer/10.
Washington Department of Fish and Wildlife. (2011). Final PUGET SOUND ROCKFISH CONSERVATION PLAN policies, strategies and actions including preferred range of actions (Olympia, Washington, United States: Washington Department of Fish and Wildlife). Available online at: https://wdfw.wa.gov/sites/default/files/publications/00035/apr2011_rockfish_conservation_plan.pdf (Accessed January 20, 2024).
Williams G. D., Levin P. S., Palsson W. A. (2010). Rockfish in Puget Sound: An ecological history of exploitation. Mar. Policy 34, 1010–1020. doi: 10.1016/j.marpol.2010.02.008
Keywords: long-term monitoring, diver-operated video, transects, SCUBA, rockfish, Sebastes spp
Citation: Larson SE, Shelledy K, Escontrela Dieguez D, Christiansen J, Olsen AY, Randell Z, Williams MH, VanDamme C, Lowry D and Jasper W (2025) Rockfish abundance, recruitment, and community structure trends in the western Strait of Juan de Fuca, Washington, 2005-2023. Front. Mar. Sci. 12:1452991. doi: 10.3389/fmars.2025.1452991
Received: 21 June 2024; Accepted: 09 January 2025;
Published: 05 February 2025.
Edited by:
Damianos Chatzievangelou, Spanish National Research Council (CSIC), SpainReviewed by:
Leif Rasmuson, Oregon Department of Fish and Wildlife, United StatesCopyright © 2025 Larson, Shelledy, Escontrela Dieguez, Christiansen, Olsen, Randell, Williams, VanDamme, Lowry and Jasper. This is an open-access article distributed under the terms of the Creative Commons Attribution License (CC BY). The use, distribution or reproduction in other forums is permitted, provided the original author(s) and the copyright owner(s) are credited and that the original publication in this journal is cited, in accordance with accepted academic practice. No use, distribution or reproduction is permitted which does not comply with these terms.
*Correspondence: Shawn E. Larson, cy5sYXJzb25Ac2VhdHRsZWFxdWFyaXVtLm9yZw==
†Retired
Disclaimer: All claims expressed in this article are solely those of the authors and do not necessarily represent those of their affiliated organizations, or those of the publisher, the editors and the reviewers. Any product that may be evaluated in this article or claim that may be made by its manufacturer is not guaranteed or endorsed by the publisher.
Research integrity at Frontiers
Learn more about the work of our research integrity team to safeguard the quality of each article we publish.