
94% of researchers rate our articles as excellent or good
Learn more about the work of our research integrity team to safeguard the quality of each article we publish.
Find out more
ORIGINAL RESEARCH article
Front. Mar. Sci., 26 March 2025
Sec. Marine Ecosystem Ecology
Volume 12 - 2025 | https://doi.org/10.3389/fmars.2025.1448250
This article is part of the Research TopicAntarctic Krill and Interactions in the East Antarctic EcosystemView all 17 articles
 Dale Maschette1,2*
 Simon Wotherspoon1
 Hiroto Murase3
 Nat Kelly1
 Philippe Ziegler1
 Kerrie M. Swadling2,4
 So Kawaguchi1,4
The East Antarctic krill fisheries are spread across two Divisions of the Commission for the Conservation of Antarctic Marine Living Resources (CCAMLR), Division 58.4.1 between 80-150°E and Division 58.4.2 between 30-80°E. Each of these Divisions is further divided into East and West subregions with separate catch limits. In 2019, CCAMLR agreed to a revised krill fishery management strategy recommended by the Scientific Committee. This strategy consists of setting catch limits for Euphausia superba using three combined approaches; 1) an acoustic biomass estimate, 2) a precautionary harvest rate derived from a stock assessment and 3) a spatial allocation of catch limits based on overlap of predator needs. Using recent survey data we estimate 50% length at maturity for E. superba to be 41.67 mm and 42.29 mm for Divisions 58.4.1 and 58.4.2 respectively. In both areas females were estimated to reach 50% maturity at a smaller length than males. Using these updated estimates of E. superba length at maturity and a new implementation of the Generalized Yield Model (the Grym), we estimate precautionary harvest rates for krill in Divisions 58.4.1 and 58.4.2-East ranging between 0.0854 - 0.1201. These calculated harvest rates were then applied to the biomass estimates from recent surveys to estimate total precautionary catch limits for E. superba in Divisions 58.4.1 (391,754 tonnes) and 58.4.2 East (640,872 tonnes). These catch limits are based on biomass estimates from a 2019 survey conducted by Japan in Division 58.4.1 and a 2021 survey conducted by Australia in Division 58.4.2 East.
Antarctic krill (Euphausia superba, hereafter krill) is a key species in Southern Ocean ecosystems. Krill is a major grazer of primary production and forms the main prey for many marine predators such as fish, penguins, flying seabirds, seals, and whales (Everson, 2000) as well as playing an important role in marine biogeochemical cycles in the region (Cavan et al., 2019). Krill is also the target of the region’s largest fishery which is managed by the Commission for the Conservation of Antarctic Marine Living Resources (CCAMLR) (Nicol et al., 2012). CCAMLR is divided into three statistical areas for management purposes: Area 48 (Atlantic Ocean Sector, 70°W–30°E), Area 58 (Indian Ocean Sector, 30°E–150°E) and Area 88 (Pacific Ocean Sector, 150°E–70°W). These areas are further subdivided into statistical Subareas and Divisions (Figure 1).
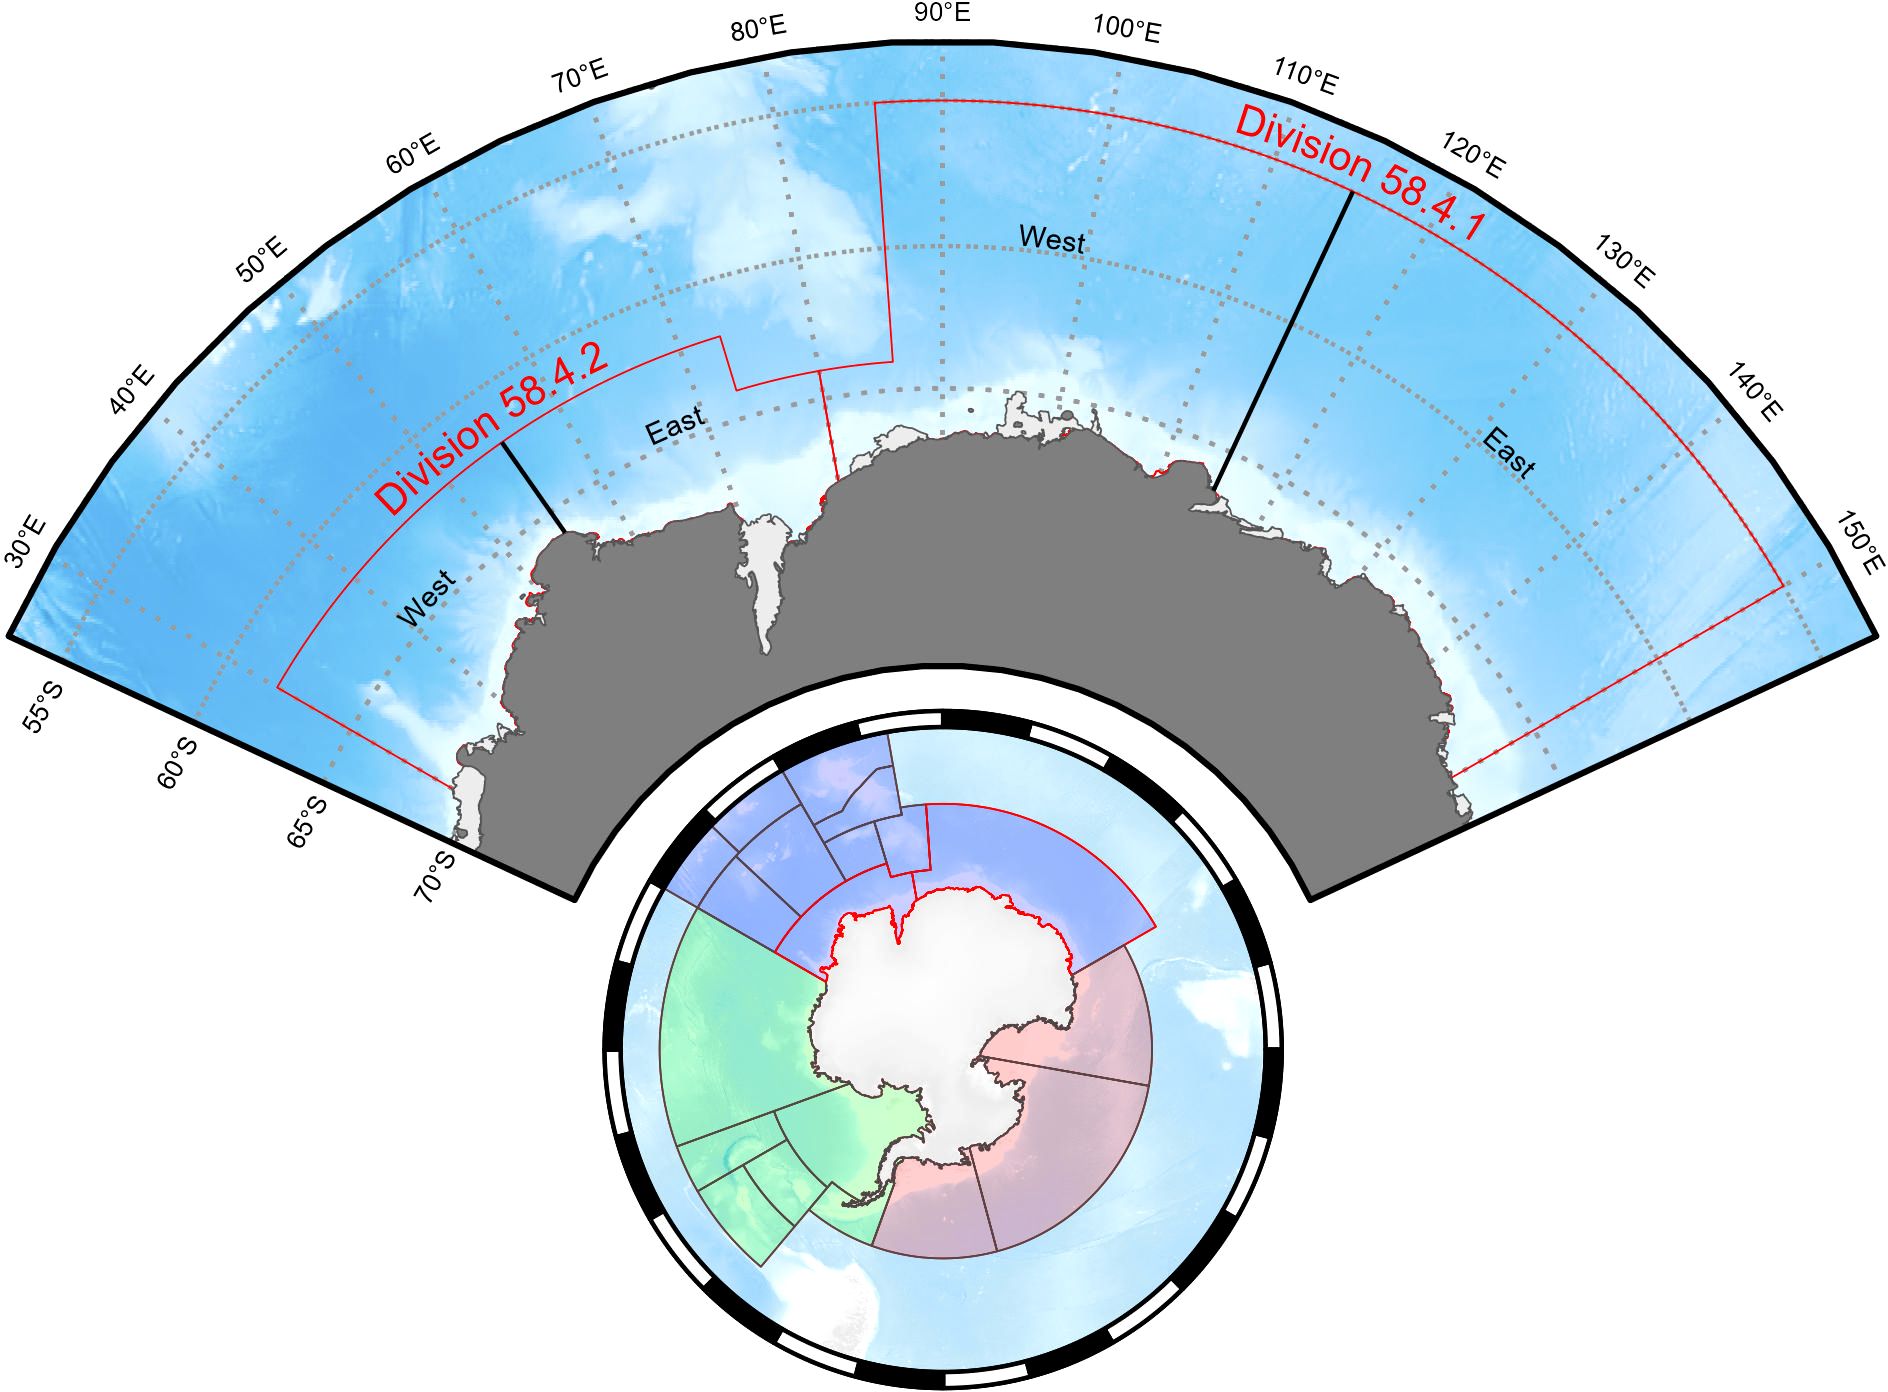
Figure 1. Management areas of the Commission of the Conservation of Antarctic Marine Living Resources (Bottom circle) showing Area 48 (green), Area 58 (blue) and Area 88 (red). Division 58.4.1 and Division 58.4.2 (Top arc) showing current management splits for the krill management into east and west regions in each Division. Maps produced with the SOmap package in R (Maschette et al., 2019).
The krill fishery initially commenced in the 1970s in Area 58 in the Southern Ocean, then spread around the Antarctic continent to the Antarctic Peninsula in Area 48. Since the 1990s, the fishery has been almost exclusively focused in Area 48, and the fishing within this sector has further concentrated to only a few, relatively small locations (Kawaguchi and Nicol, 2020). Krill fishing has grown rapidly since ~ 2010, with recent increasing commercial interest in krill oil driving annual catches to levels previously recorded in the 1980s. Over the last few years, the krill fishery has regularly reached the catch limits on the main fishing ground in the Antarctic Peninsula region (Subarea 48.1) and expanded to other fishing grounds within the Southwest Atlantic sector (such as Subarea 48.2) in the middle of the season. There has also been interest in resuming krill fishing in Area 58, with some activity between 2016/17 and 2018/19 (CCAMLR, 2022).
The Antarctic environment is changing rapidly, and these changes are considered to affect the krill population in a range of ways, including shifts in habitat, physiology, and biomass (Kawaguchi et al., 2024). While CCAMLR’s management procedure takes into account the uncertainty in the long-term dynamics of krill stocks through projections, overall catch limits are likely to be sensitive to changes in biological parameters (such as relationships of length to weight, maturity, and age), and hence management advice is likely to be more robust if derived from multiple surveys and/or more contemporary information. Spatial allocations of catch limits would also benefit from better understanding of variation in the spatial distribution of krill.
In Area 48, there has been recognition of the risk of concentrating krill fishing effort in small areas where central-place foragers also feed (Constable and Nicol, 2002; Watters et al., 2020). As a result, CCAMLR has adopted the concept of small-scale management units (SSMUs), which aim to break up large management areas into smaller areas with their own catch limits, in turn limiting concentrated fishing and spreading the risk of fishing across a broader spatial area (Hewitt et al, 2004). Since their introduction, however, CCAMLR has been unable to reach consensus on allocation of Subarea catch limits to the SSMUs. Notably, due to a lack of recent krill fishing, Area 58 has received less attention or emphasis in ensuring mechanisms are in place to avoid localized risks. Upon joining CCAMLR, member parties agree to be legally bound by ‘Conservation Measures’ (CM) which are agreed each year by the CCAMLR Commission (Constable, 2011). The CMs, among other things, outline the spatial areas and catch limits for all fisheries within the CCAMLR Convention Area. Specified within CM 51-02 and CM 51-03, the Area 58 krill fisheries (and subsequent catch limits) are subdivided into Division 58.4.1 (80–150°E) and Division 58.4.2 (30–80°E) respectively. The current catch limits for these two areas are 440 000 tonnes in Division 58.4.1 and 2.645 million tonnes in Division 58.4.2.
Current precautionary catch limits and trigger levels in Area 58 have been set based on information collected through two large-scale surveys conducted by Australia, the BROKE (Baseline Research on Oceanography, Krill and the Environment) survey in Division 58.4.1 in 1996 (Nicol, 2000) and the BROKE West survey in Division 58.4.2 in 2006 (Nicol et al., 2010). Catch limits for each Division are further split into east and west subdivisions. In 2019, the CAMLR Commission endorsed a revised krill fishery management strategy recommended by the Scientific Committee (CCAMLR, 2019, para. 5.17). This management strategy consists of three elements:
1. a stock assessment to estimate precautionary harvest rates (defined as γ).
2. regular updates of biomass estimates, initially at the subarea scale, but potentially at multiple scales.
3. a spatial overlap analysis framework to inform the spatial allocation of catch.
Most of the work undertaken since then has focused on the areas covered by Conservation Measure 51-07, specifically Subarea 48.1. In Area 58, two surveys have been conducted recently, the first by Japan in Division 58.4.1 in 2018/19 (Abe et al., 2023) and the second by Australia in the eastern sector of Division 58.4.2 (55–80°E) in 2021 (Cox et al., 2022). These provide the necessary data for updating biological parameters (such as length, sex, or maturity; e.g., Schaafsma et al., 2024) and precautionary catch allocations in these Divisions. Here, we provide results from updated stock assessments for both Divisions 58.4.1 and 58.4.2, addressing the first element of the new krill management strategy, i.e., estimating precautionary harvest rates, in these areas.
The Generalised Yield Model (GYM) is an assessment model for assessing the status of stocks under various levels of uncertainty using either deterministic (for icefish) or stochastic (for other species) projections (Constable and de la Mare, 1996; Constable, 2004). The core functionality of the GYM is to project stock abundance, biomass, and yield in each age class forward in time over a single year. The GYM assumes the number, biomass, and yield of individuals of an age class, in a year, at specified timesteps within the year satisfy the system of differential equations with an adaptive Runge-Kutta scheme outlined in Constable and de la Mare (1996). Unlike more modern stock assessment models which integrate observation data to estimate population parameters within the model runs, GYM assessments for krill used pre-calculated parameter values with uncertainty to project the population forward. As noted by Thomson (2016) this provided CCAMLR with an innovative solution to the problem of calculating harvest rates for stock about which little was known, and for which fisheries data were absent. The GYM was reexamined by Maschette et al. (2023), the outcome of which was the development of the Grym model framework which provides same utility of the GYM but with a more exact solution by replacing the adaptive Runge-Kutta scheme with a composite trapezoidal rule. Additionally, by being implemented in an open-source language (Wotherspoon and Maschette, 2023) the Grym has overcome issues highlighted by Kinzey et al. (2013) of pre-termination in the GYM software, and allowed for further expansion of capability such as those implemented by Liu et al. (2023) on incorporating multiple fishing fleets into projections.
Within stock assessment models’ maturity ogives are used to indicate for a given length (or age) class what proportion of individuals are mature (spawning), and ultimately the size of the spawning stock biomass (SSB). As such, changing the underlying shape or distribution used for estimating the ogive function implemented in a stock assessment may lead to quite different estimates of SSB when given the same data. To allow for stock assessments that reflect current population parameters we have re-estimated size at maturity using a ramped ogive function following the methods outlined in Maschette and Wotherspoon (2023) and expanded on these methods to estimate a logistic-based size at maturity for comparison with results using the ramped ogive function.
The results from our krill stock assessments provide precautionary harvest rates for Divisions 58.4.1 and 58.4.2. Similar to the process undertaken in 2021 for Subarea 48.1 (Maschette et al., 2021), these harvest rates are then applied to the recent survey estimates of biomass in Division 58.4.1 (Abe et al., 2023) and 58.4.2 East (Cox et al., 2022) to derive updated precautionary catch limits.
The Grym (Maschette et al., 2023) when used for krill currently models maturity-at-length with a ramp-shaped ogive function (rampOgive in the Grym R package; Wotherspoon and Maschette, 2023) to be consistent with the original Generalized Yield Model implementation (Constable and de la Mare, 1996):
where represents the proportion of individuals of length that are mature, is the length at which 50% of all individuals are mature, and is the width of the ramp.
For the krill stock assessments, within each projection and are held constant, but for each individual projection is drawn from a uniform distribution with limits and :
Maschette et al. (2021) and Maschette and Wotherspoon (2023) used these to be consistent with previous assessments for krill performed within CCAMLR. Recently, however, functionality has been added to the Grym package to model selectivity and maturity using logistic ogive functions. For consistency with the stock assessment framework CASAL (Bull et al., 2012), which is used for many fish stock assessments in CCAMLR, the logistic model is parameterized in terms of the 50% and 95% quantiles and uses a constant of 19 (See Bull et al., 2012 for details), so that:
where and are the 50% and 95% quantiles respectively and Within an individual projection run and (and hence ) are held constant across years, between projection runs however, and are drawn from a multivariate normal distribution:
with mean and variance covariance matrix The use of allows the stock assessment model to maintain the same shape for the logistic ogive relative to each randomly drawn value of when a range of values are provided.
RMT 8 nets with 8m2 mouth opening and mesh size of 4.5mm were used for either ‘target-trawls,’ i.e., responsive fishing when krill-like echoes were observed using the vessel’s echo sounders, or routine trawls (i.e., oblique tows at pre-planned survey stations). Trawls were hauled at approximately 2 knots through water speed and routine trawls sampled the upper 200 m of the water column. Because the total number of krill captured at predetermined stations was generally small, the length measurements of predetermined and targeted stations were both used. Total length of krill (Standard 1; Morris et al., 1988) for up to 150 individuals were measured per station.
Within Division 58.4.1, data collected on board the RV Kaiyo-maru during the Japanese KY1804 survey in 2018/19 (Figure 2, Abe et al., 2023) contain length and maturity observations from 4632 krill consisting of 1124 juveniles, 1245 males and 1824 females ranging from 14 - 63 mm collected in 45 hauls (Figure 3). For Division 58.4.2, data were collected on the RV Investigator TEMPO voyage in 2021 (Figure 2, Cox et al., 2022) and contain length and maturity observations from 2761 krill consisting of 714 juveniles, 1032 males and 1015 females ranging from 14 - 56 mm collected in 27 hauls (Figure 3).
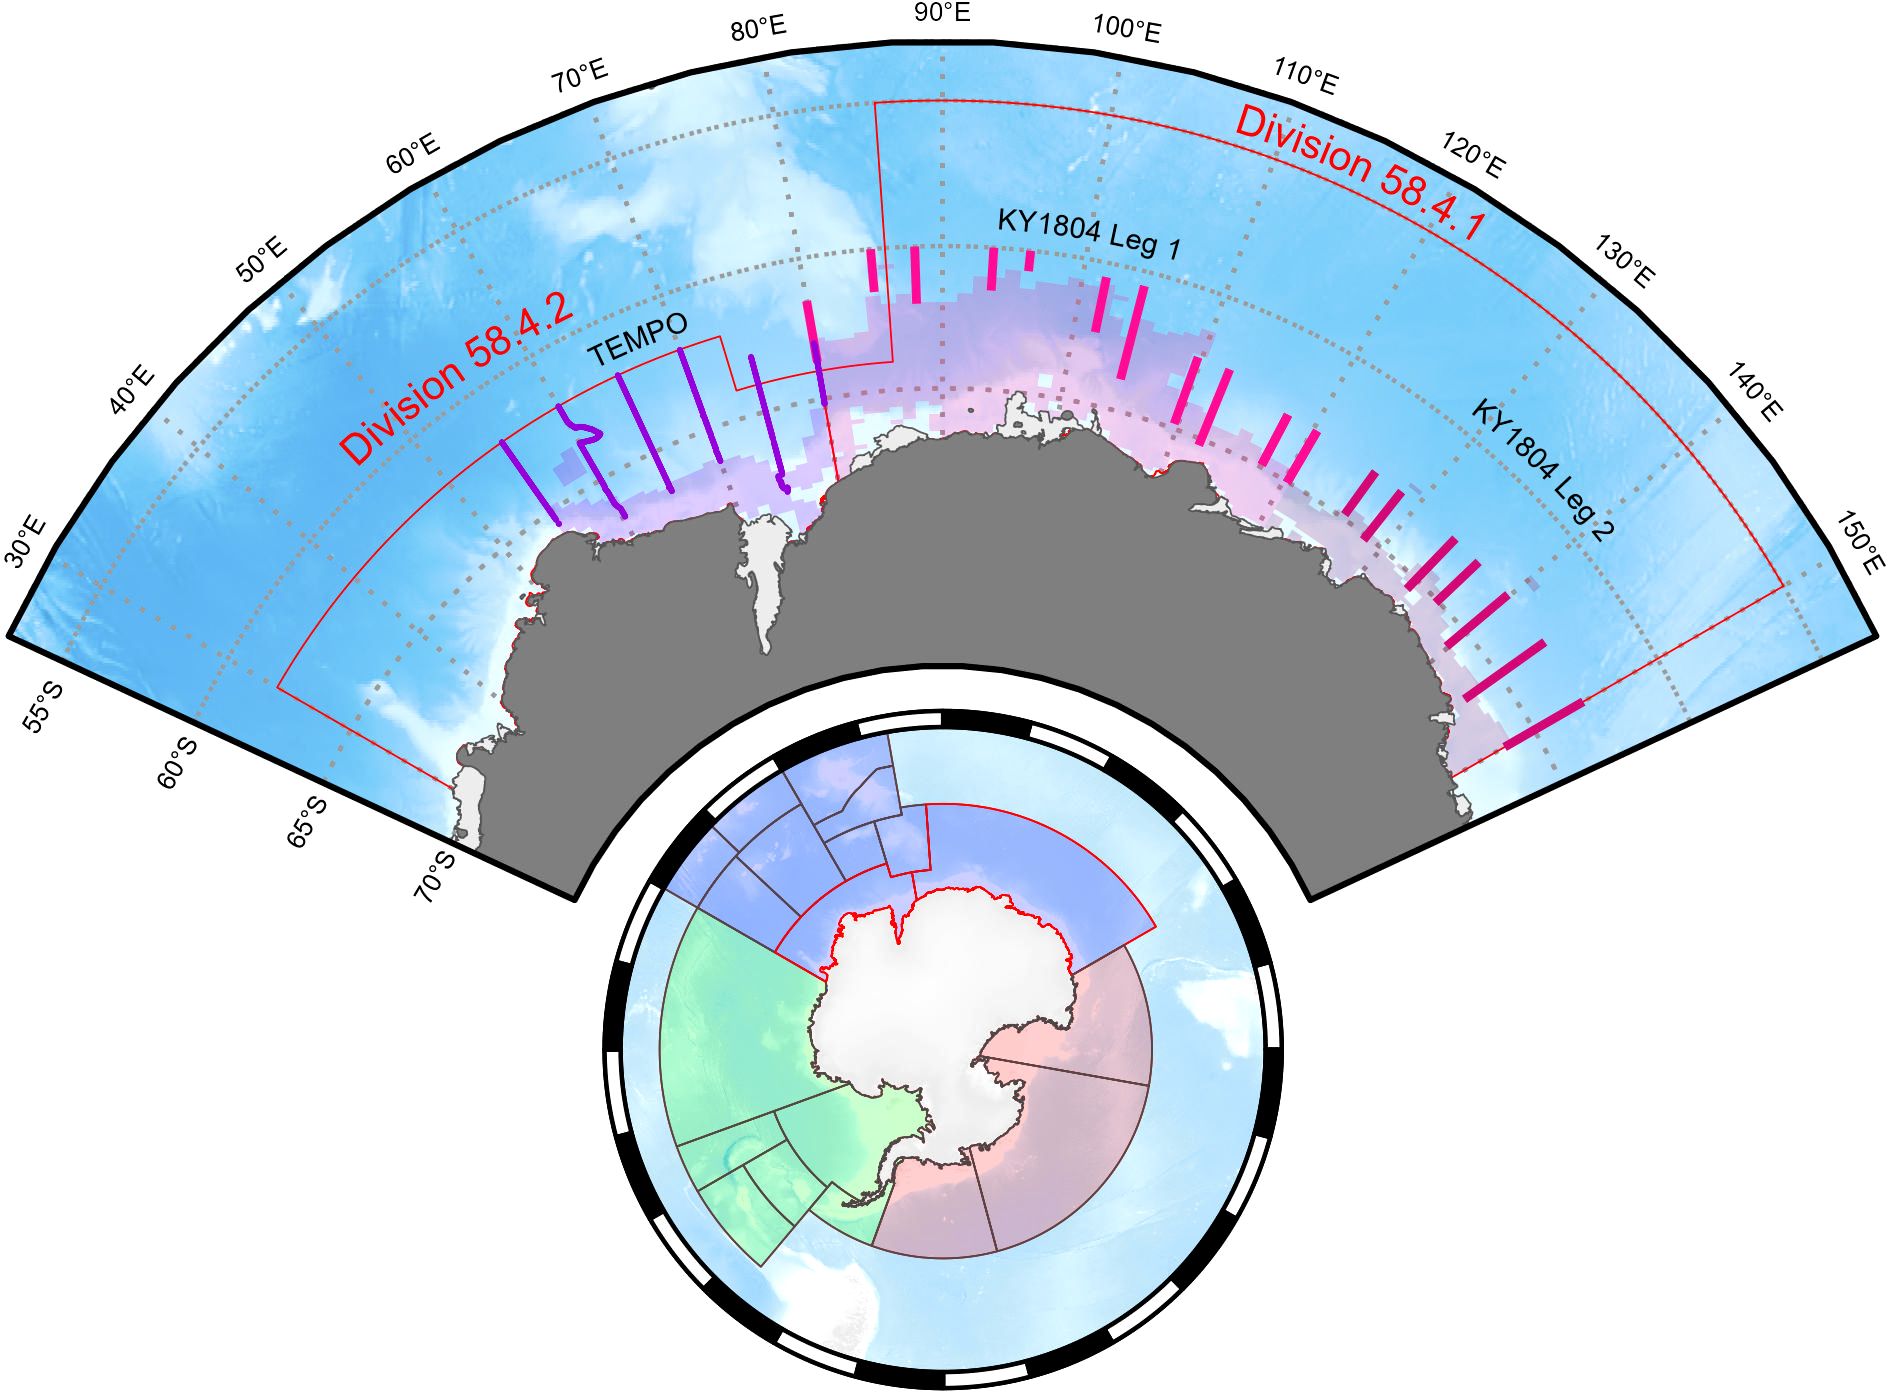
Figure 2. Survey transect locations for KY1804 in Division 58.4.1 split into two legs (pinks) and TEMPO survey transects in Divisions 58.4.2 (purple) showing average sea ice extent over survey periods (transparent colors). Management areas of the Commission of the Conservation of Antarctic Marine Living Resources (Bottom circle) showing Area 48 (green), Area 58 (blue) and Area 88 (red). Maps produced with the SOmap package in R (Maschette et al., 2019).
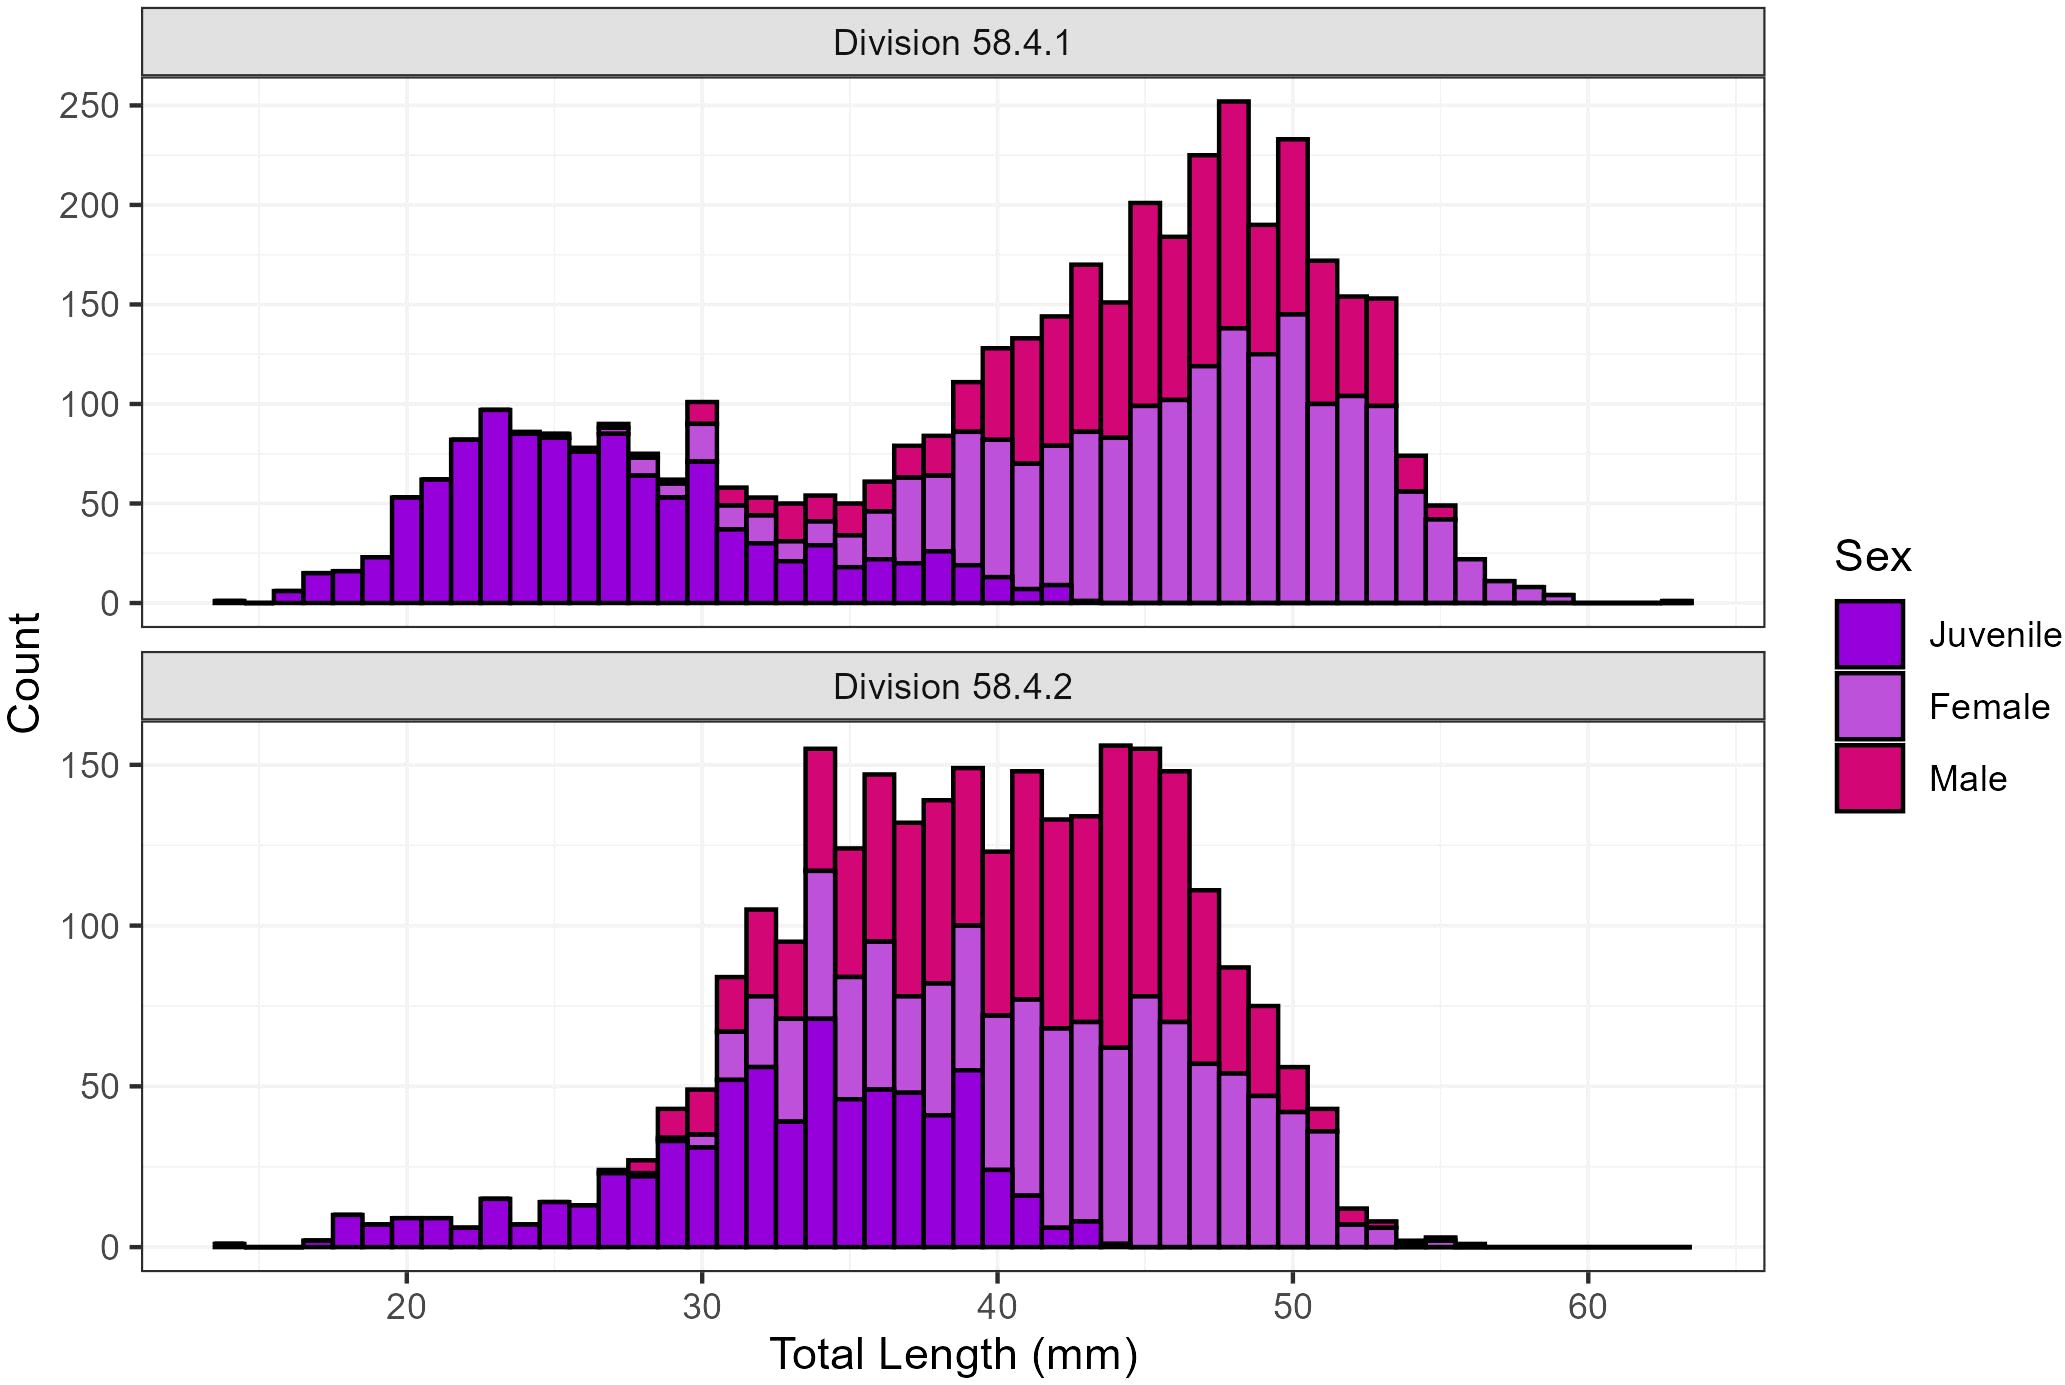
Figure 3. Euphausia superba length distribution measured during surveys in Divisions 58.4.1 and 58.4.2.
In both data sets, krill exhibiting maturity stages F3B to F3E and M3 were considered mature individuals (Makarov and Denys, 1980). Additionally, all krill less than 30 mm in length were designated as immature (Tarling et al., 2016; Pakhomov, 1995a). For each region maturity was estimated for ramp and logistic o-gives for all sexes, and for males and females. Due to the inability to know whether juveniles were male or female, they were included in both the male and female maturity estimates.
The parameters , and for the ramped ogive function are estimated by fitting a Bayesian nonlinear binomial model to maturity at length data observed in the survey. The model takes the form:
where is a binary variable that is 1 if individual is mature and 0 otherwise; is the length of that individual; and is the probability that an individual of that length observed in that year will be mature. Here, is the length at which the probability of maturity is 0.5, and is the width of the ramp. The parameters and represent the probabilities that the smallest and largest individuals will be mature. It is necessary that and to allow for the small number of individuals that mature unusually early or late, and any potential misidentification of maturity stage, and Beta priors are adopted that constrain to be near 0 and to be near 1
Diffuse Normal priors are chosen for and :
where again the normal distributions have been parameterized in terms of mean and standard deviation.
The upper and lower limits and for are determined as the 2.5% and 97.5% quantiles for , and w is determined as the 97.5% quantile for .
The input parameters and for the logistic ogive function are the 50th and 95th quantiles respectively. They are estimated by fitting a Bayesian nonlinear binomial model to maturity at length data observed in the survey. In this case:
where again is a binary variable that is 1 if individual is mature and 0 otherwise; is the length of that individual; is the probability that individual of that length observed in that year will be mature; and .
Diffuse normal priors are chosen for and
For the simulation, logistic ogive profiles are generated by drawing from a multivariate Normal distribution with mean and covariance matching the posterior distribution of and .
The input parameters used in the stock assessment models for Divisions 58.4.1 and 58.4.2 East are shown in Table 1. The parameters are largely consistent with those used in previous assessments for these areas (SC-CAMLR, 2000; Delegation of Australia, 2007). Estimates of maturity were calculated in this paper, where possible, other parameters were obtained from the literature (Table 1). For these assessments, we have run two different scenarios for each Division based on the maturity models described above; the first using the maturity values fitted as a ramp function, the second with maturity implemented as a logistic function (Table 1). Model were fitted to the base parameters (Supplementary Material 1) of previous assessments first then one parameter updated in subsequent runs in the order of B0logSD, Length to weight relationship, and finally maturity (Table 1).
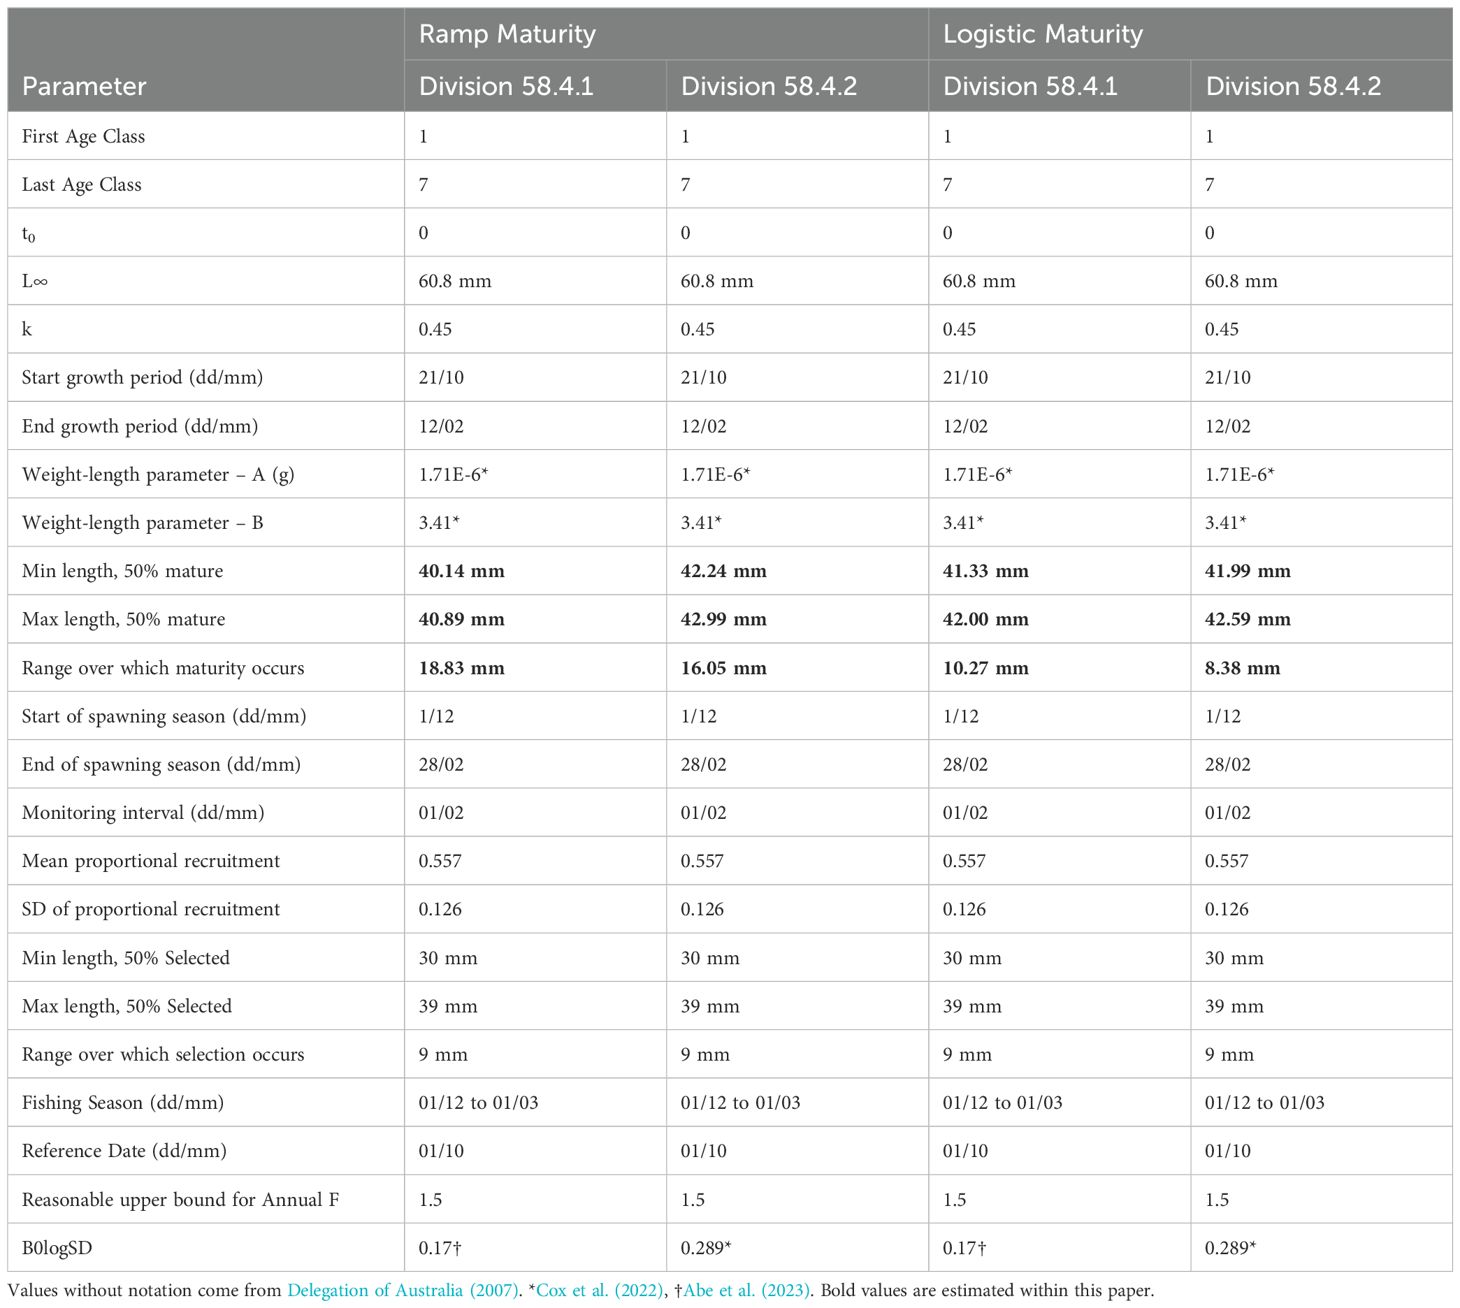
Table 1. Grym model parameters for Euphausia superba stock assessments in Divisions 58.4.1 and 58.4.2.
The structure of the assessment model was configured to be consistent with those used in the krill assessment for Subarea 48.1 (see Maschette et al., 2021).
Natural mortality and recruitment in krill assessments are based on the proportional recruitment model outlined by de la Mare (1994) which was further developed by Pavez et al. (2023). These use the mean () and standard deviation () of proportional recruitment from survey data (Table 1) to determine the associated annual natural mortality and distribution of random recruits which reproduce the recruitment values observed in the survey. The recruitment variance and natural mortality indices were pre-generated using an inverse-beta distribution following the method outlined in Pavez et al. (2023) to enable consistency between model runs. The overlap of mortality estimates across runs with expected values in published literature was used to evaluate the reliability of the generated estimates.
For the assessment models with logistic maturity, the rampOgive function within the projection function was changed to the logisticOgive function (see Supplementary Material 2). For each run, L50 values for maturity and selectivity were selected from their respective and ranges (Table 1) using a uniform distribution (See section 2.1.1).
The precautionary harvest rate is calculated following the CCAMLR decision rules developed for krill (SC-CAMLR, 1994). These specify that:
1. Choose a harvest rate, γ1, so that the probability of the spawning biomass dropping below 20% of its median pre-exploitation level over a 20-year harvesting period is 10%.
2. Choose a harvest rate, γ2, so that the median escapement at the end of a 20-year period is 75% of the median pre-exploitation level.
3. Select the lower of γ1 and γ2 as the precautionary harvest rate.
Initial precautionary harvest rates were determined by testing γ values between 0.05 and 0.13 in 0.0005 increments using 10,000 model iterations. Subsequent runs were conducted at 0.0001 increments for ranges ±0.01 of initial precautionary harvest rates using 100,000 iterations to determine final precautionary harvest rates. Using 100,000 iterations rather than the 10,000 used in the assessment for Subarea 48.1 allows for less variation between reruns of the same model caused by random number generation.
The harvest rates determined by applying the CCAMLR decision rules to the results from the updated stock assessments were multiplied with the recent krill survey biomass estimates in Divisions 58.4.1 and 58.4.2 East to determine updated precautionary catch limits (PCL). The PCL was calculated overall for Division 58.4.1, and at three smaller spatial scales within it referred to as ‘West’, ‘Middle’ and ‘East’ in Abe et al. (2023). Division 58.4.2 is divided into East and West sections. Recently updated biomass estimated for krill (Cox et al., 2022) only covered the ‘East’ region as defined in Conservation Measure 51-03. No recent biomass estimates to update the PCL for Division 58.4.2 West were available.
In Division 58.4.1, the combined sex ramp model estimated maturity to be 40.45 mm with 2.5% and 97.5% quantiles of 40.13 mm and 40.89 mm, respectively (Tables 1, 2). The slope of the ramp, or the 97.5% quantile interval over which maturity occurs, was estimated to be 18.82 mm (Figure 4A).
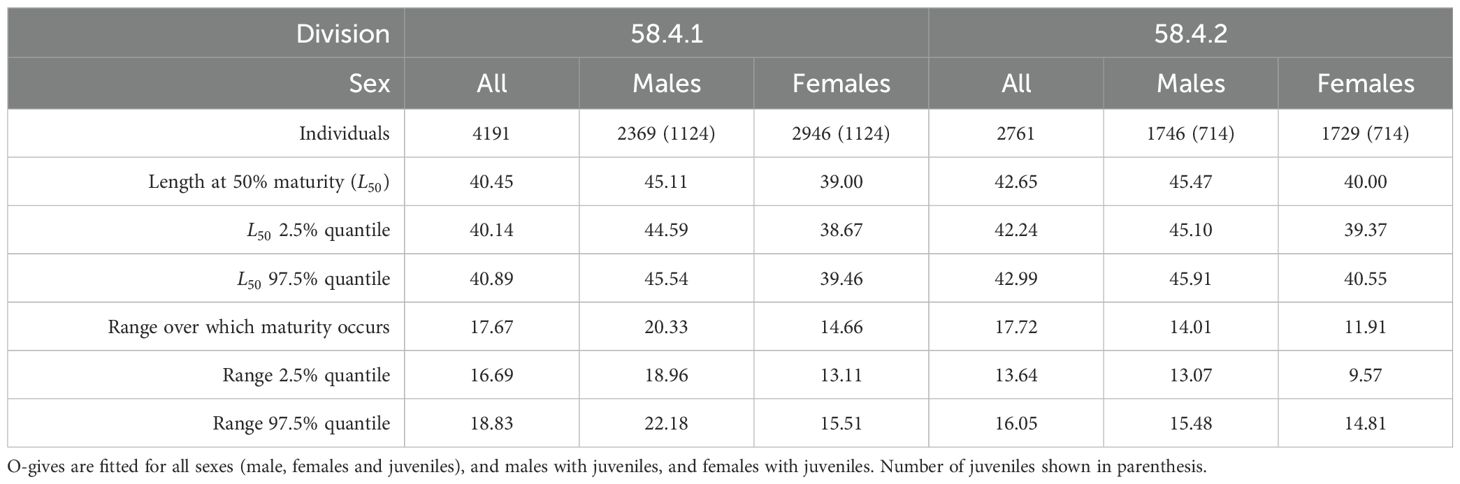
Table 2. Estimates of Euphausia superba length at maturity (mm) from Divisions 58.4.1 and 58.4.2 fitted with ramp o-gives.
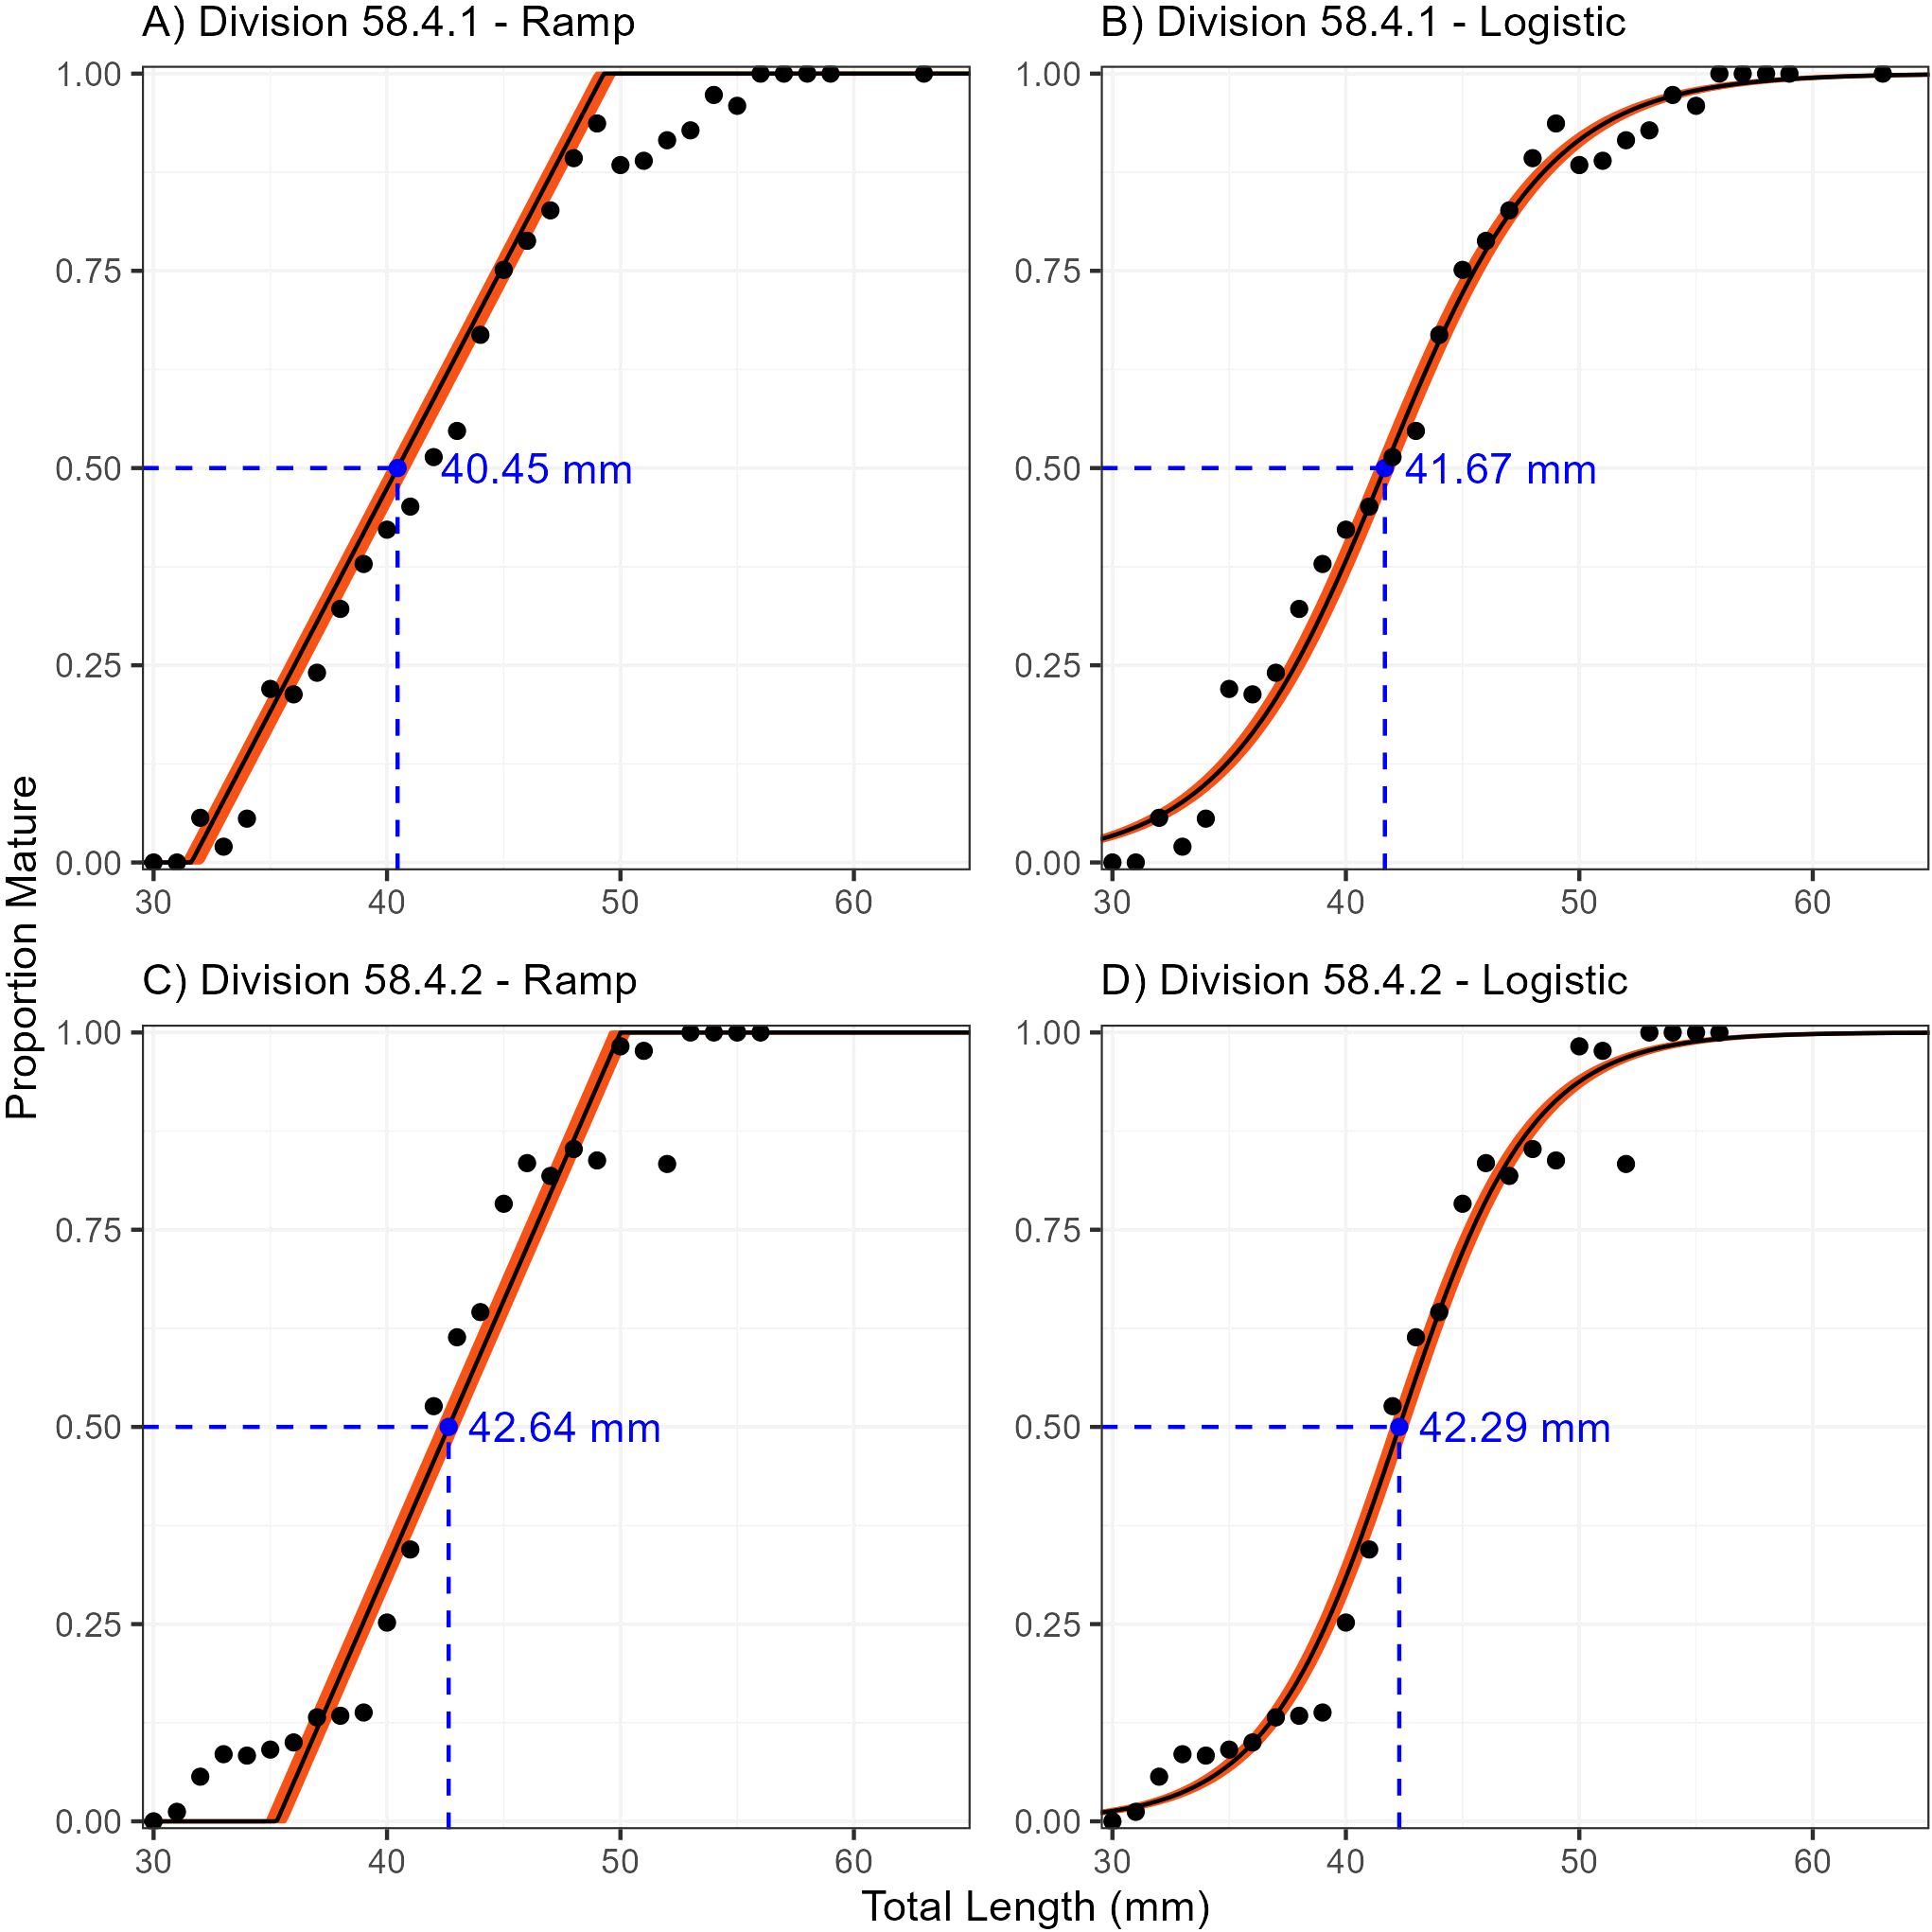
Figure 4. Euphausia superba maturity at length range (orange) fitted with ramp and logistic ogives to survey data in Divisions 58.4.1 (A, B) and 58.4.2 (C, D) with Bayesian nonlinear binomial random effects model.
In Division 58.4.2, the combined sex ramp model estimated maturity to be 42.64 mm with 2.5% and 97.5% quantiles of 42.24 mm and 42.99 mm, respectively (Tables 1, 2). The 97.5% quantile interval over which maturity occurs was estimated at 16.05 mm (Figure 4C).
In both Division 58.4.1 and Division 58.4.2 female krill were estimated to reach maturity at a smaller size (39.00 and 40.00 mm respectively) than male krill (45.11 and 45.47 mm respectively, Table 2, Figure 5).
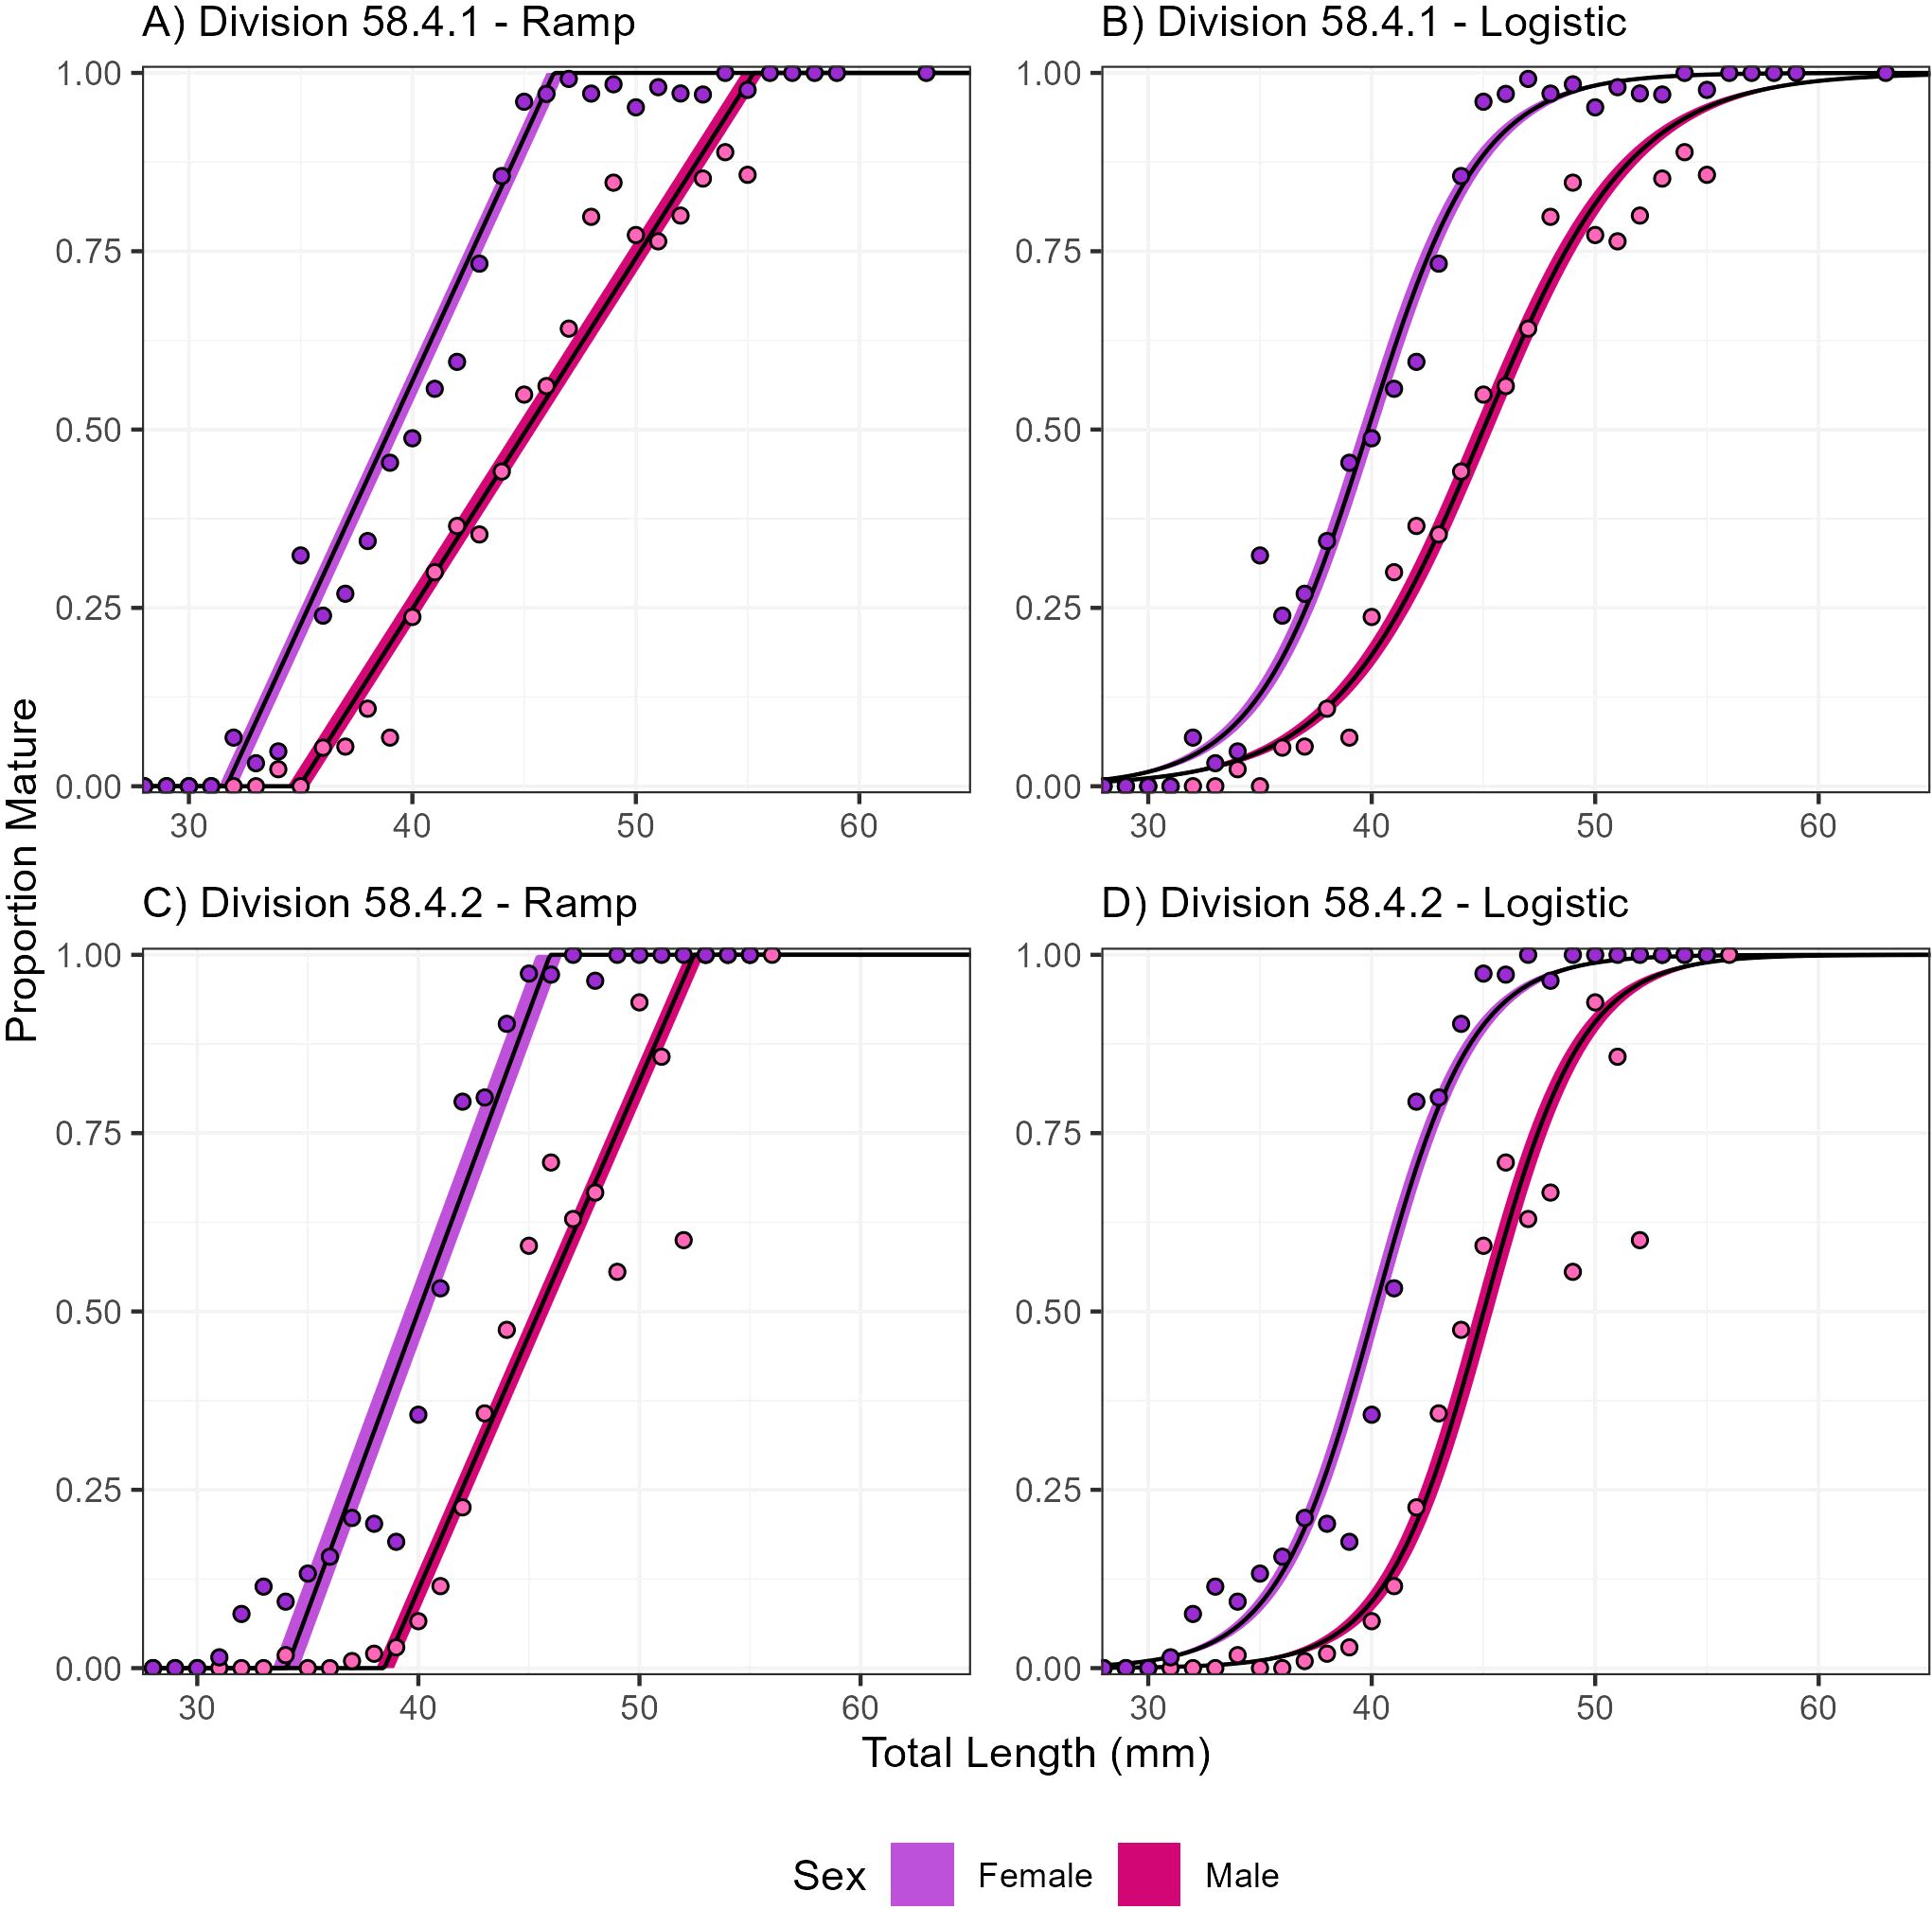
Figure 5. Euphausia superba maturity at length range for males and females fitted with ramp and logistic ogives to survey data in Divisions 58.4.1 (A, B) and 58.4.2 (C, D) with Bayesian nonlinear binomial random effects model.
For both Divisions the combined sex logistic model estimated a similar value of maturity compared to the respective ramp models. In Division 58.4.1, maturity was estimated as 41.67 mm with 2.5% and 97.5% quantiles of 41.33 mm and 42.00 mm, respectively (Tables 1, 3). The , which is used to define the shape of the curve, was estimated as 10.27 mm (Figure 4B).
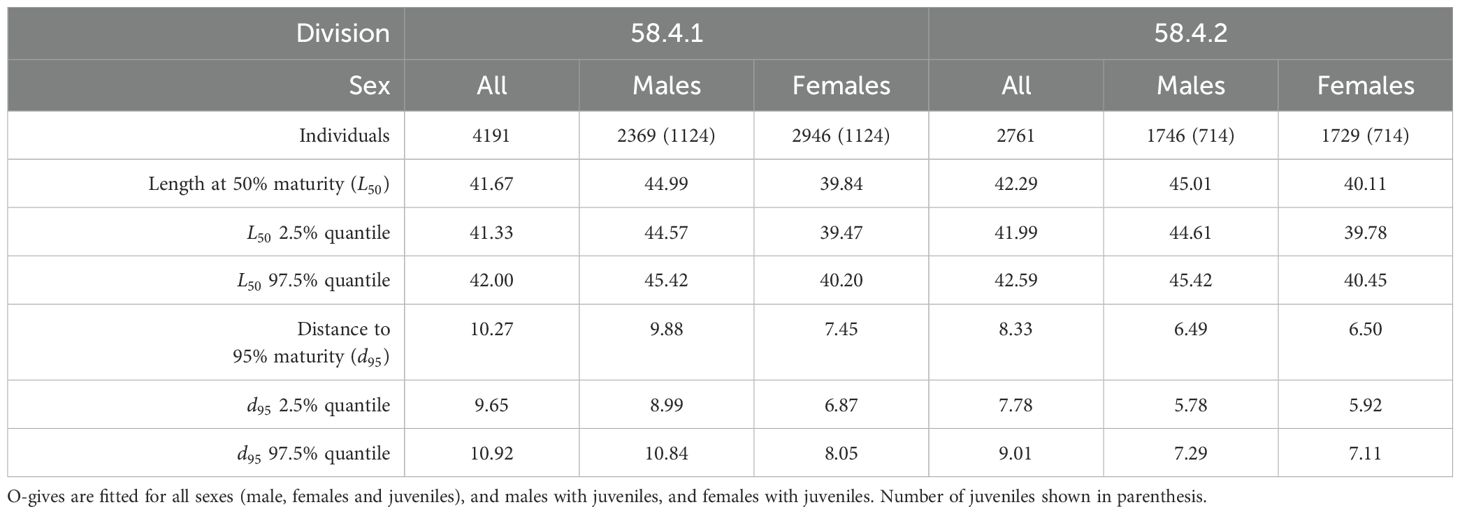
Table 3. Estimates of Euphausia superba length at maturity (mm) from Divisions 58.4.1 and 58.4.2 fitted with logistic o-gives.
In Division 58.4.2, maturity was estimated as 42.29 mm with 2.5% and 97.5% quantiles of 41.99 mm and 42.59 mm respectively (Tables 1, 3). The for this region was estimated as 8.38 mm (Figure 4D).
Similar to the ramp o-gives, in both Division 58.4.1 and Division 58.4.2 female krill were estimated to reach maturity at a smaller size (39.84 and 40.11 mm respectively) than male krill (44.99 and 45.01 mm respectively, Table 2 and Figure 5).
The natural mortality (M_Y-1) associated with the generated recruitment series using an inverse-beta distribution across runs ranged from 0.388 – 1.585, with a mean of 0.857 and showed a 98.2% overlap with the expected natural mortality range for this species (Figure 6; 0.5-1.1; Pakhomov, 1995b). The generated recruitment series across runs resulted in recruitment variances between 0.0008 and 0.1288, with associated mean recruitments ranging from 0.229 to 0.809 (Figure 7).
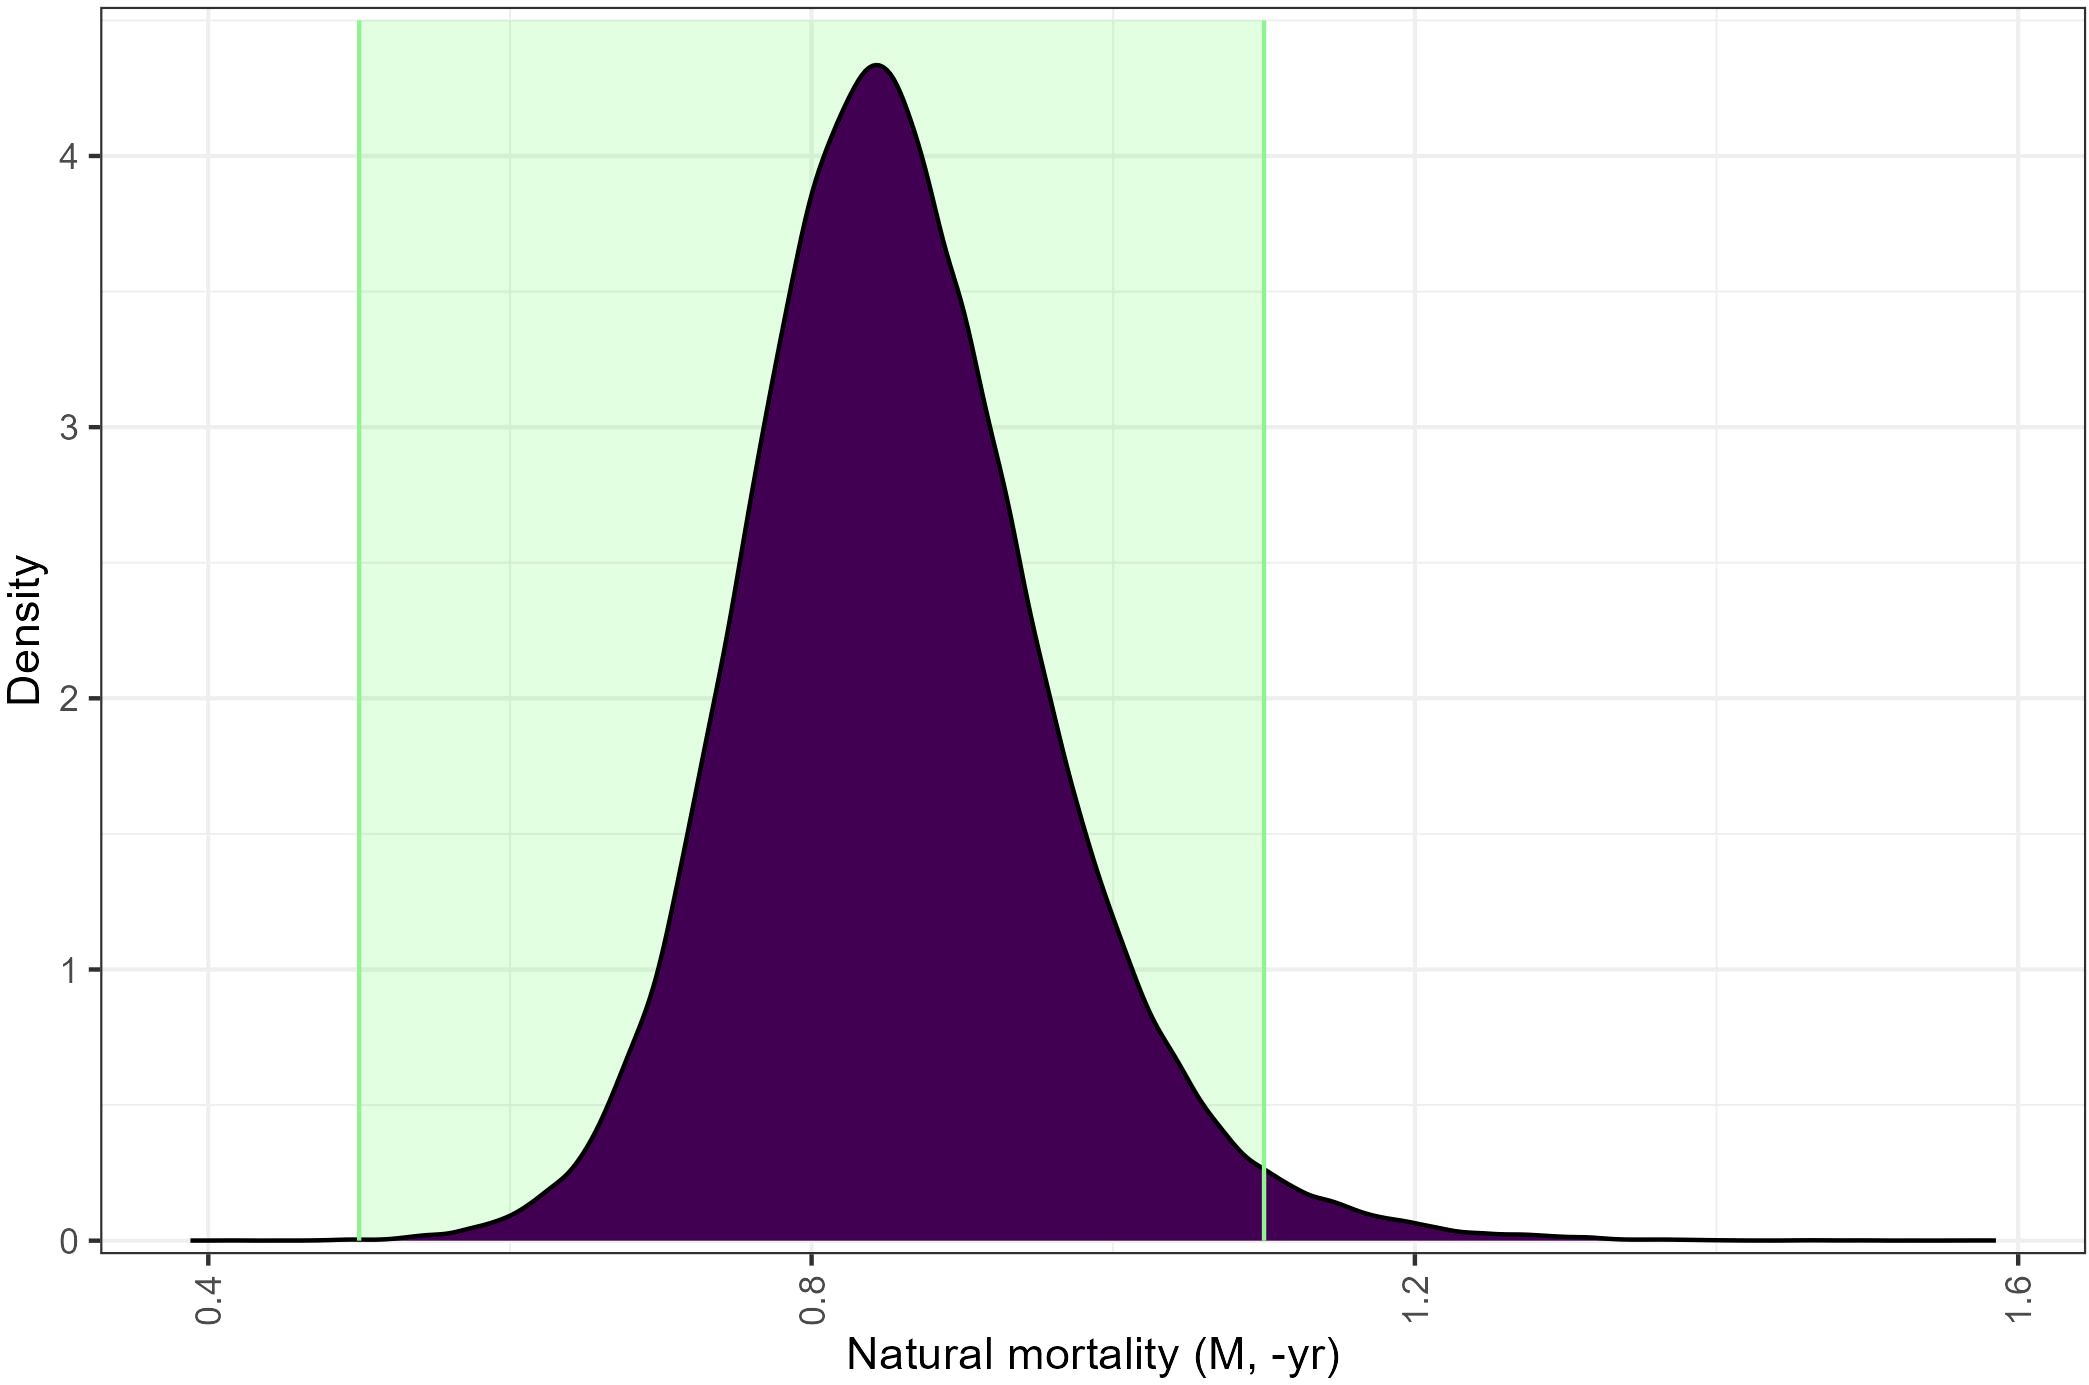
Figure 6. Overlap between Euphausia superba natural mortality (-yr, M) from proportional recruitment models using an inverse-beta distribution and the expected natural mortality range (0.5-1.1, green shaded region; WG-EMM-2021 Table 1).
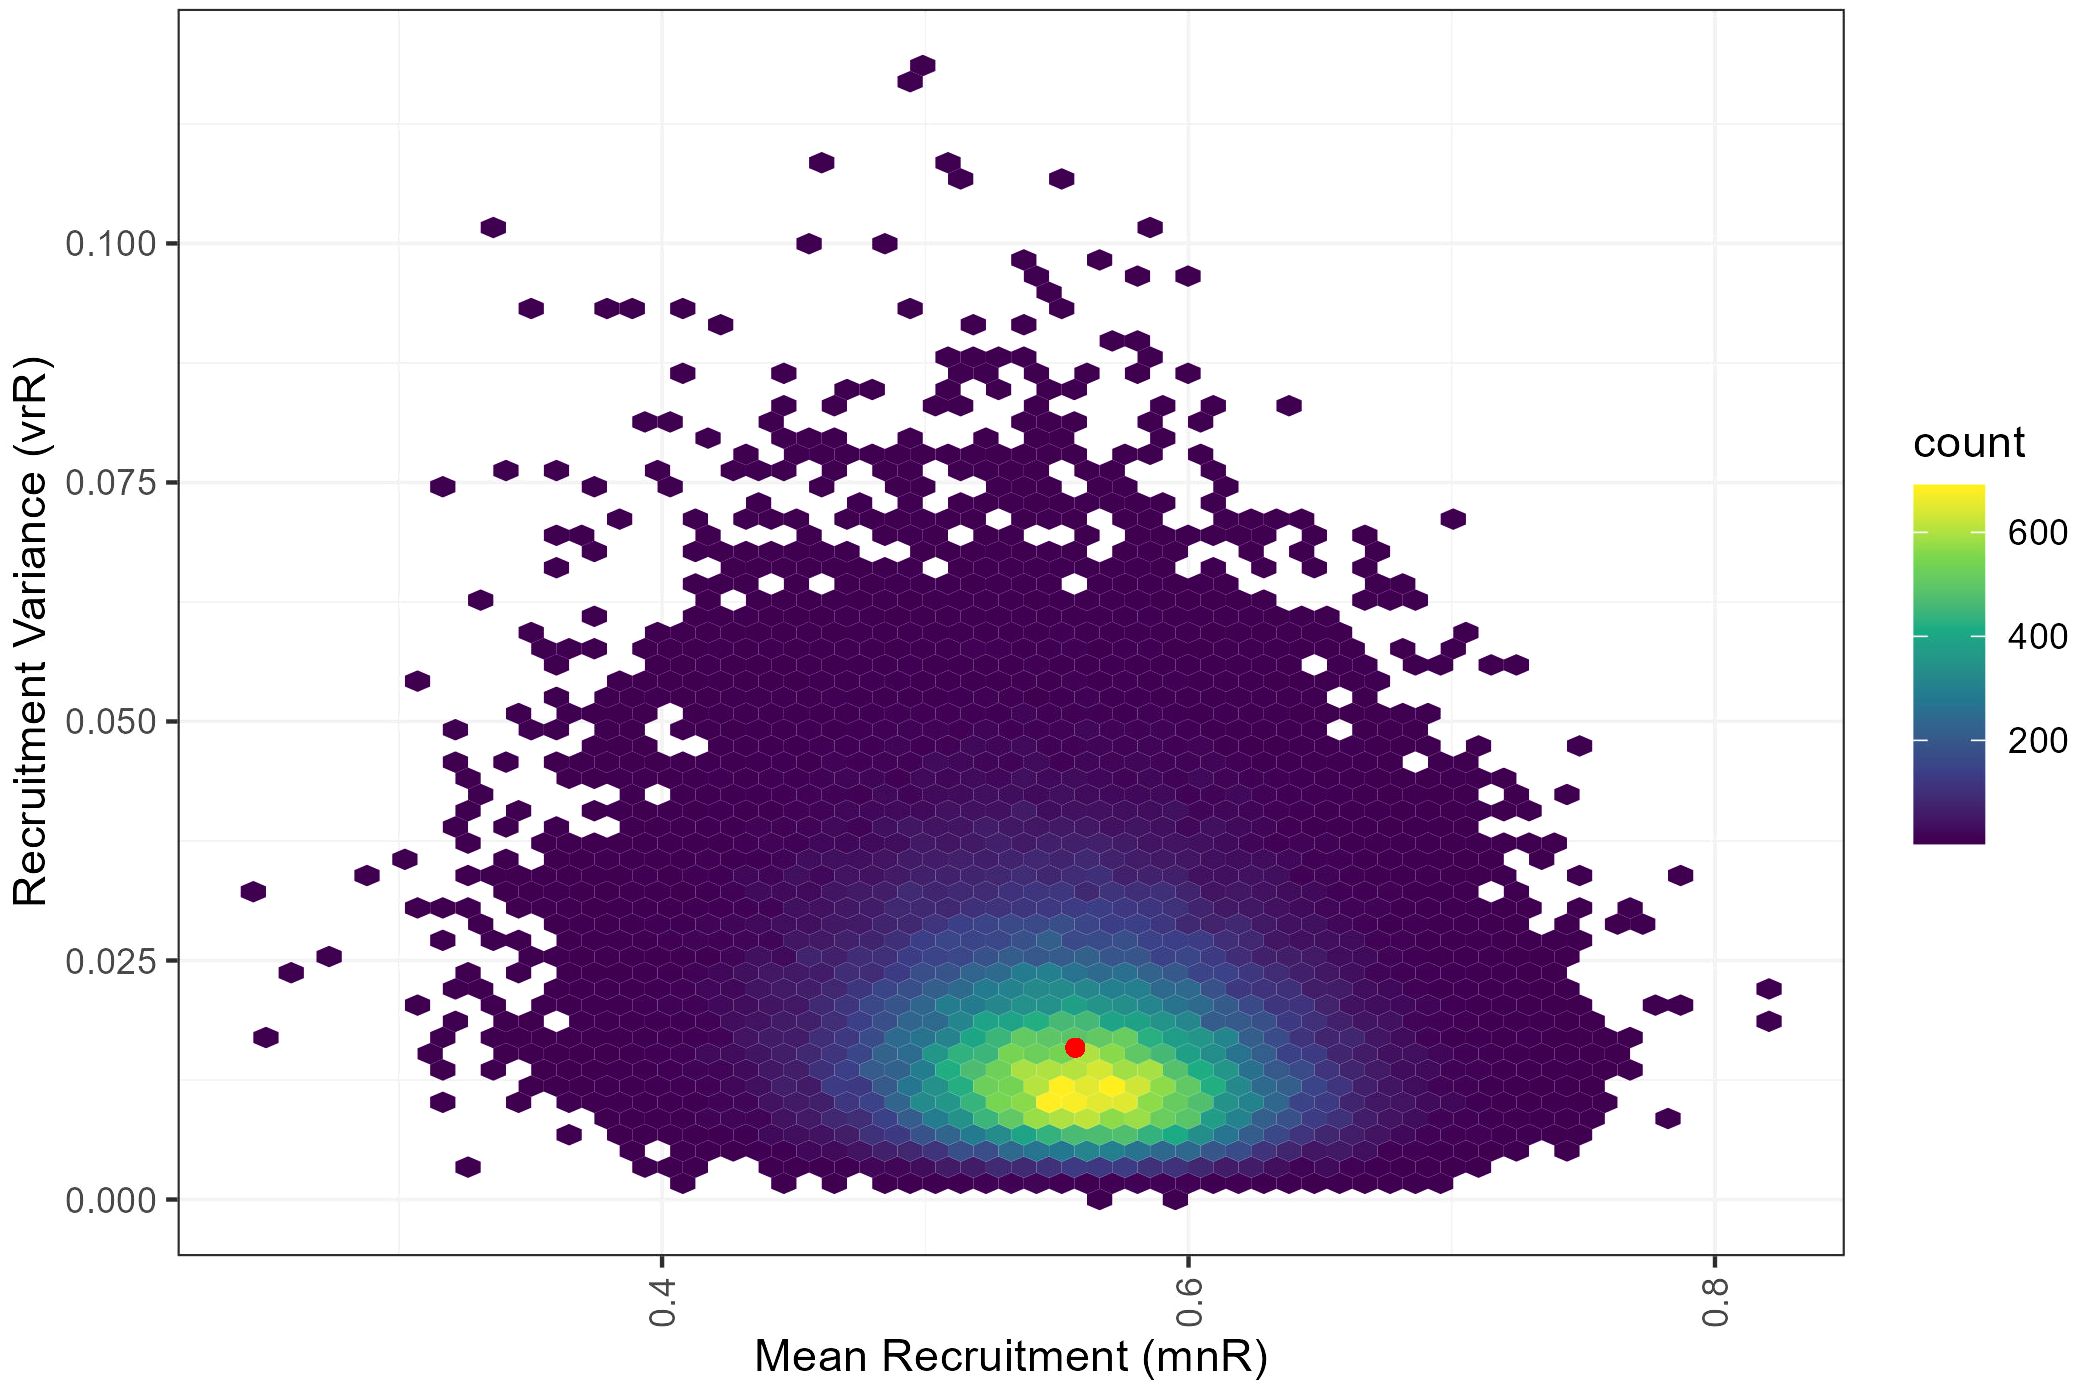
Figure 7. Comparison of Euphausia superba mean recruitment and recruitment variance with respect to the corresponding starting value combination in red (mean = 0.557, standard deviation = 0.126), fitted with proportional recruitment models using an inverse-beta distribution.
The precautionary harvest rates (γ) estimated for Divisions 58.4.1 and 58.4.2 ranged from 0.0854 to 0.1298 (Table 4). Across all models, the 75% escapement criterion (γ2) was lowest and therefore determined the precautionary harvest rate. Each model following the step-wise change in parameters value showed a decrease in γ from the previous model. The exception to this being the model with updated B0logSD values for Division 58.4.1 as the values for B0logSD were identical.
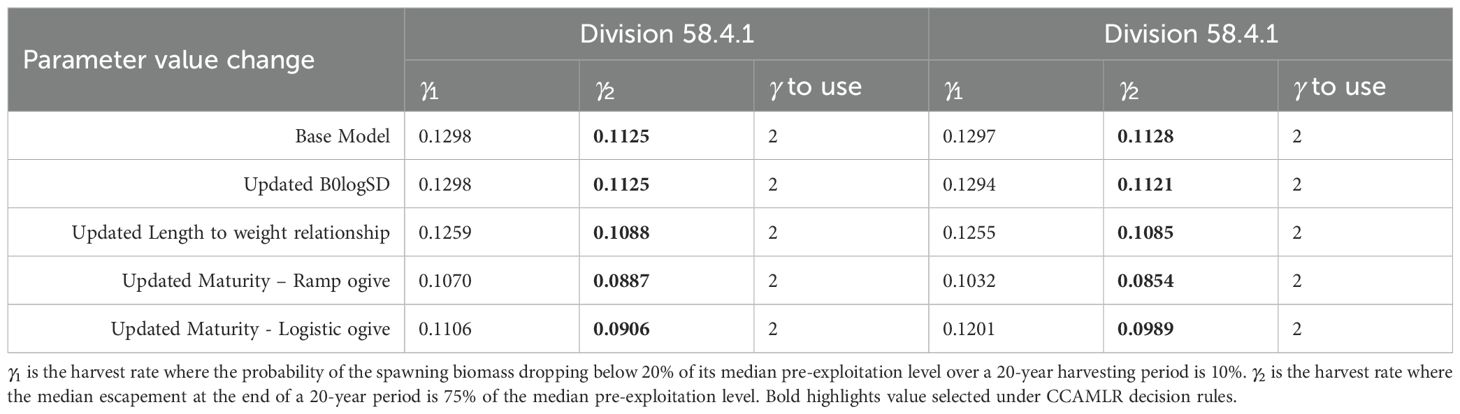
Table 4. Projected harvest rates (γ) following the CCAMLR decision rules for krill in Divisions 58.4.1 and 58.4.2 under two different maturity scenarios.
The final models were those with updated maturity values. Models using the ramp maturity function resulted in slightly lower precautionary harvest rates than models with the logistic maturity function. Projections of median spawning stock status across final models indicate a stable population under the no fishing scenario. For both γ1 and γ2 projections median spawning stock status declines towards 0.75 over approximately 5 years before stabilizing (Figures 8, 9).
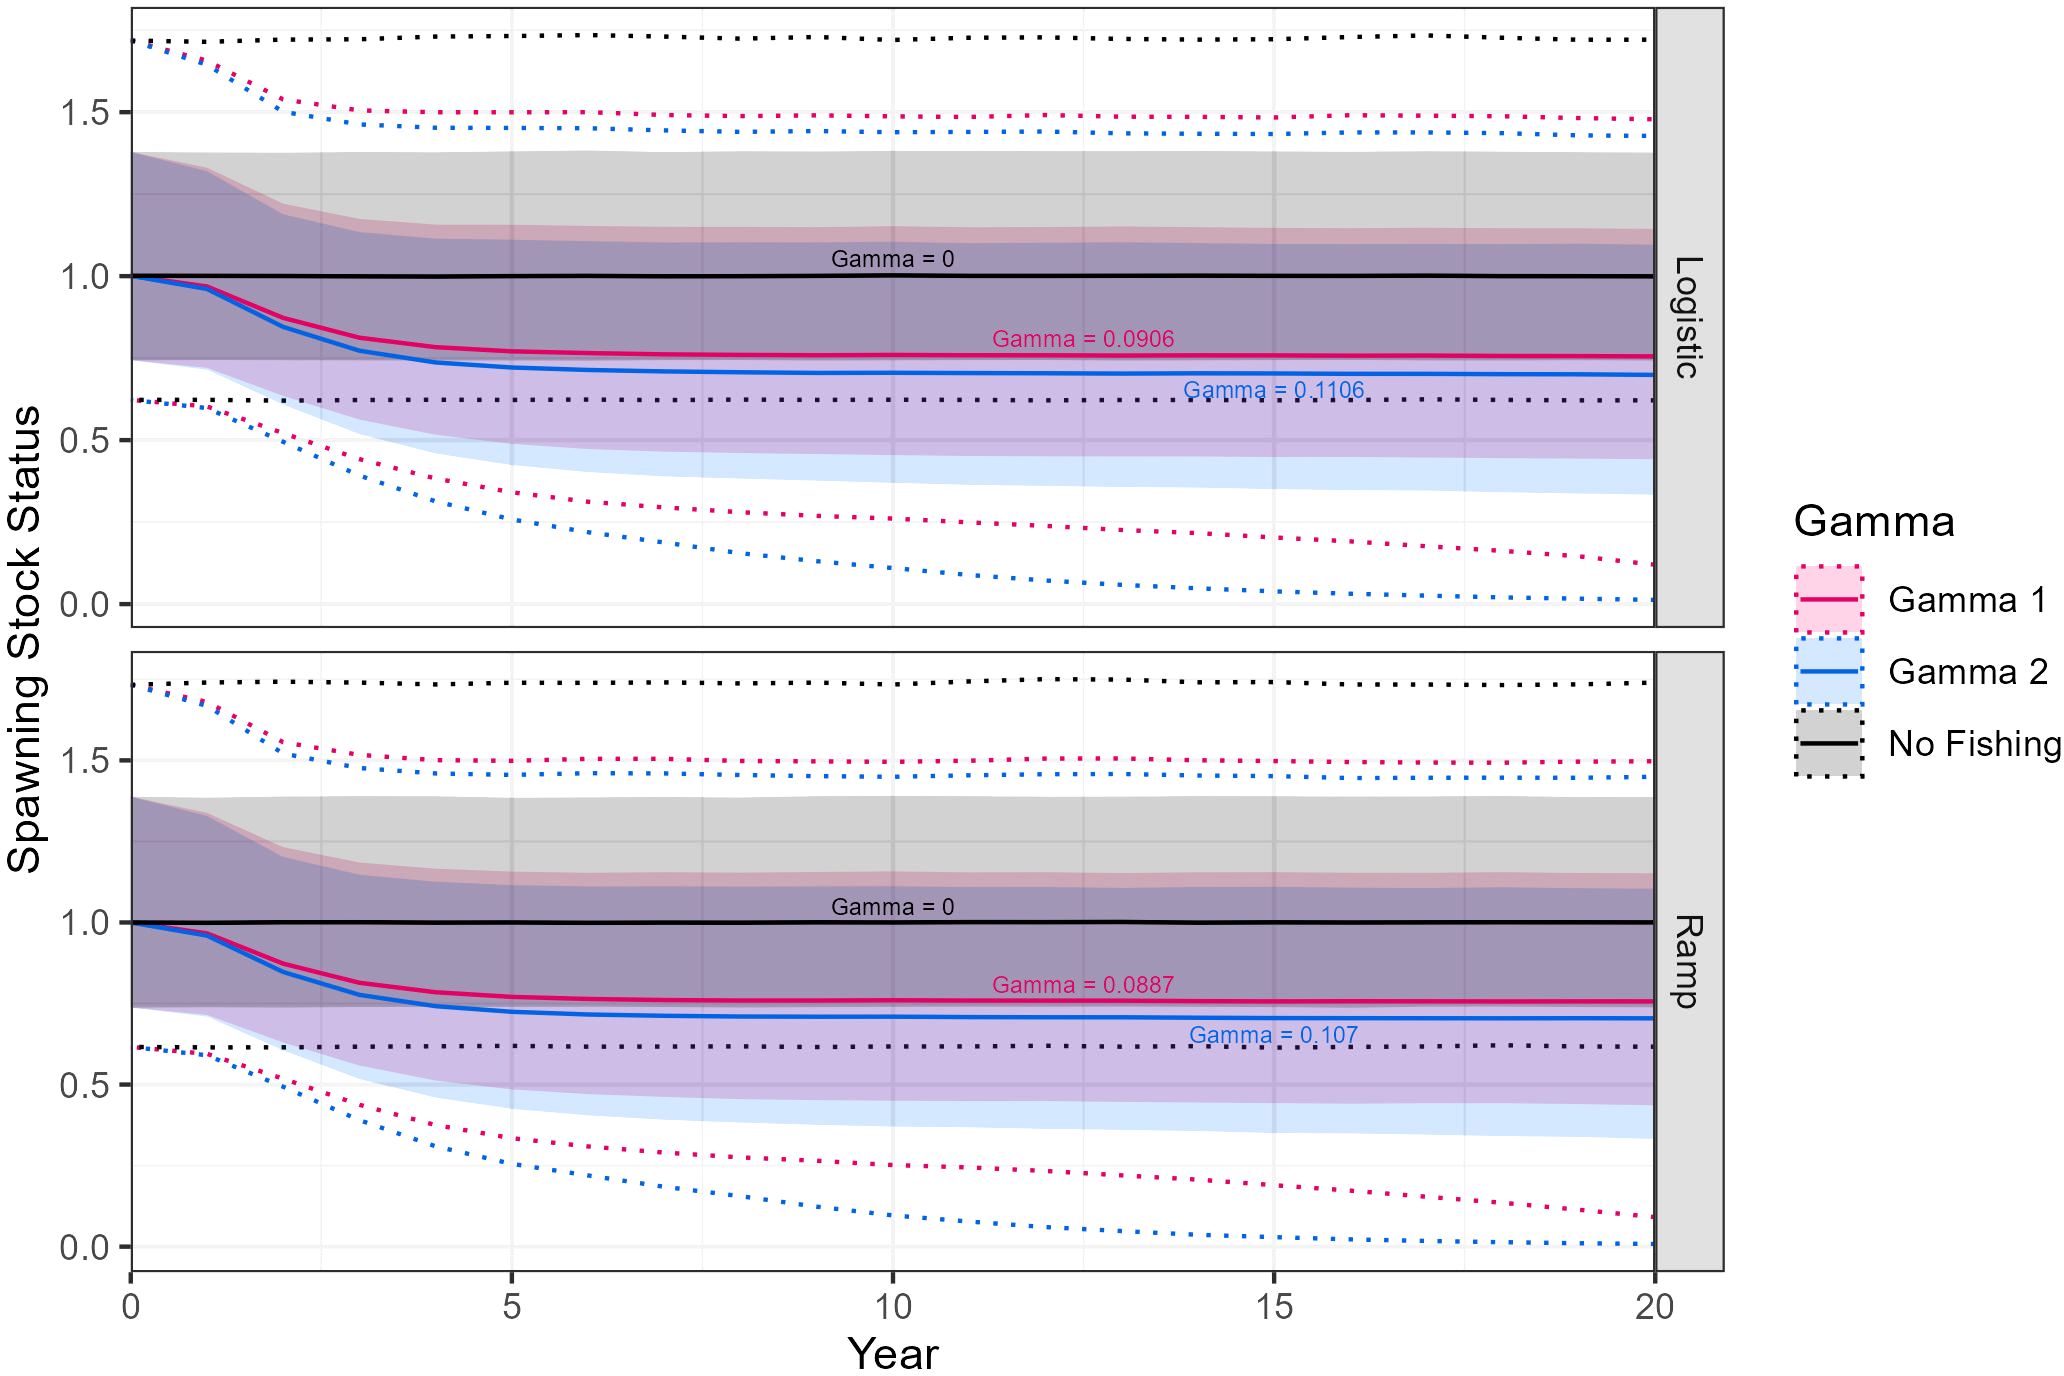
Figure 8. Euphausia superba spawning stock status projected over a 20-year period in Division 58.4.1 for three values of gamma using either ramp or logistic maturity o-gives. Stock status is shown as median (solid lines) with 90% (shaded) and 97.5% confidence intervals (dotted).
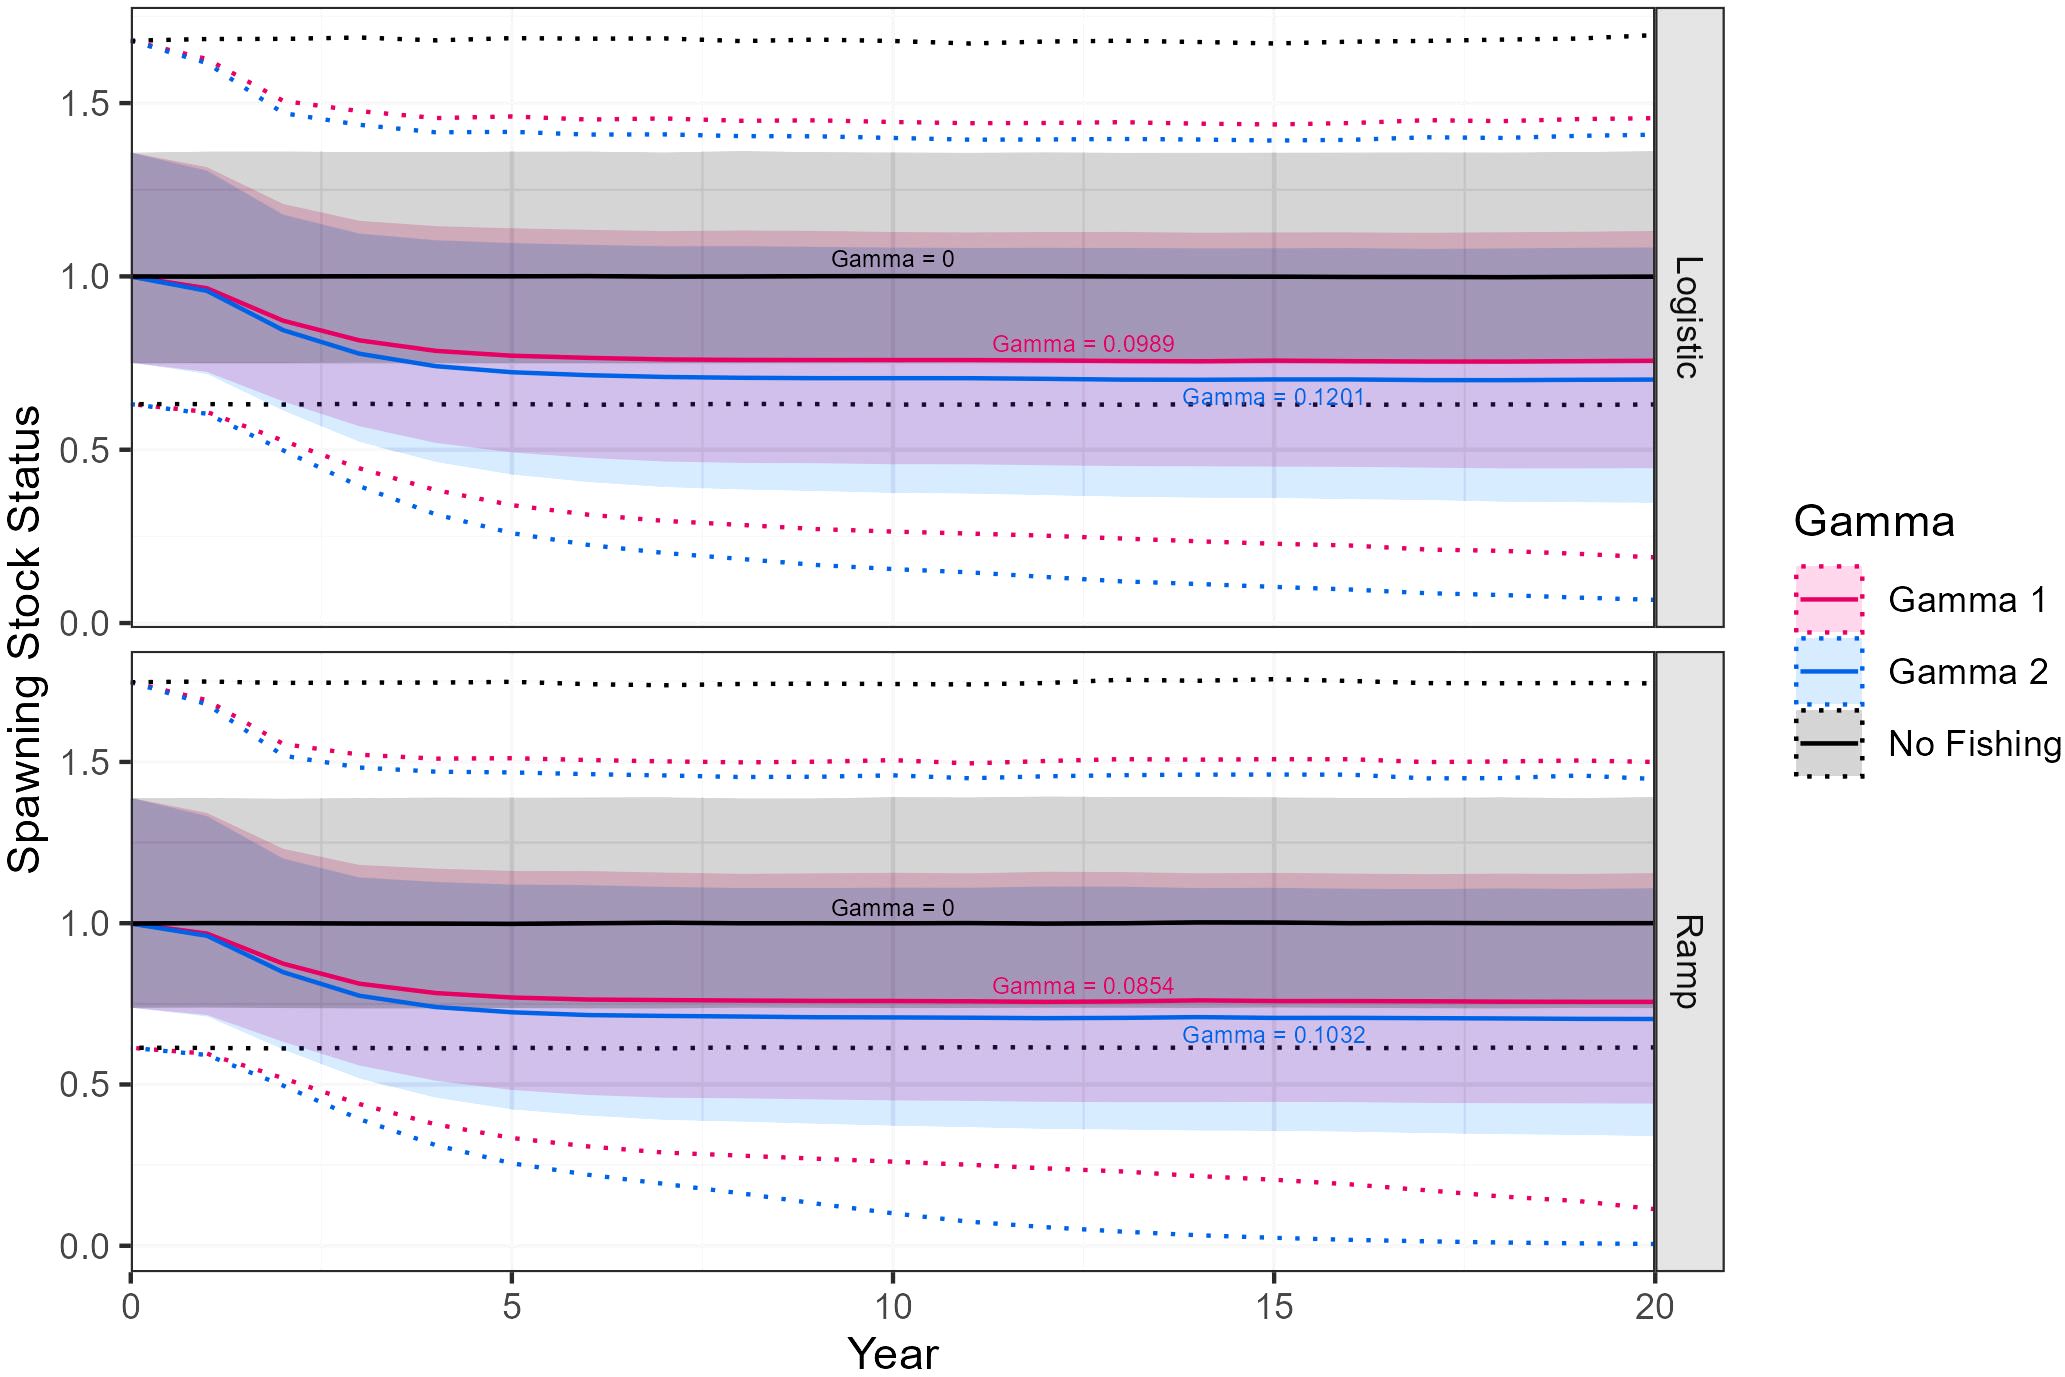
Figure 9. Euphausia superba spawning stock status projected over a 20-year period in Division 58.4.2 for three values of gamma using either ramp or logistic maturity o-gives. Stock status is shown as median (solid lines) with 90% (shaded) and 97.5% confidence intervals (dotted).
The PCL for each Division and Subregions West, Middle and East in Division 58.4.1 and Division 58.4.2 East using the harvest rate resulting from the models using a logistic maturity curve ranged from 28,811 - 640,872 tonnes (Tables 5, 6).
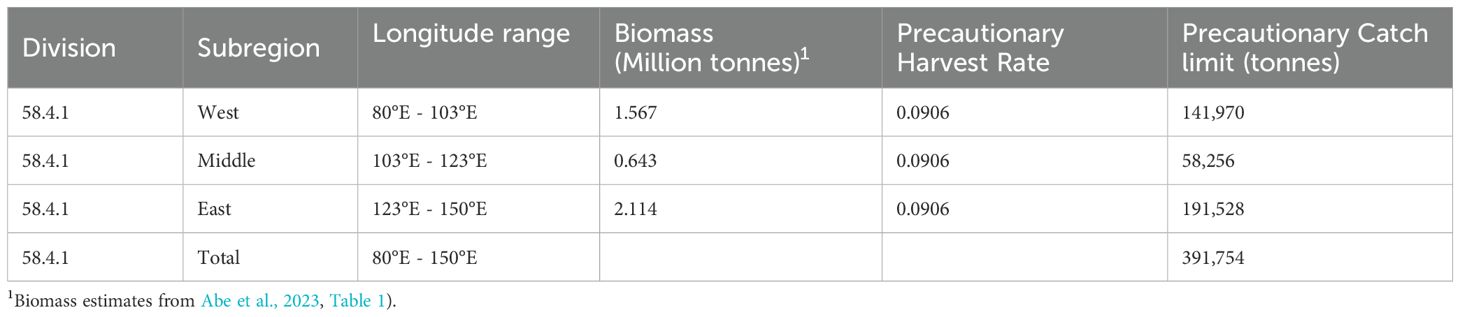
Table 5. Precautionary catch limits estimated for Euphausia superba in Division 58.4.1.
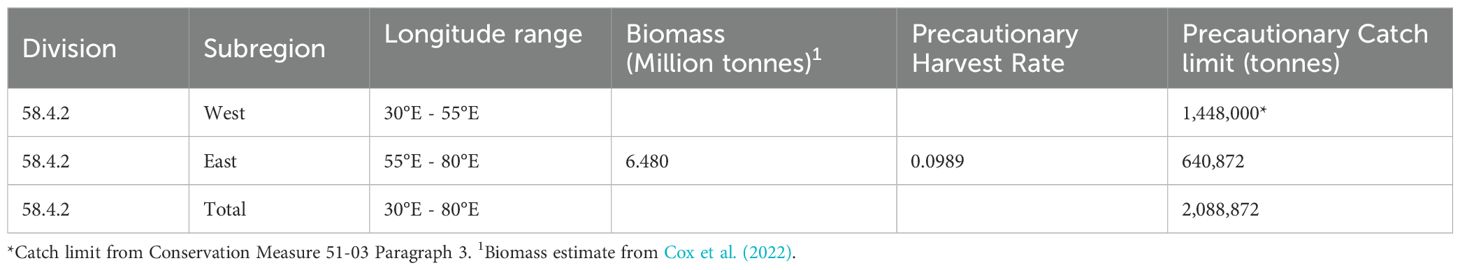
Table 6. Precautionary catch limits estimated for Euphausia superba in Division 58.4.2.
As part of updated stock assessments for krill in CCAMLR Divisions 58.4.1 and Division 58.4.2, we provide new estimates for length at maturity for krill. These estimates display similar mean length at 50% maturity but much tighter confidence intervals than those calculated for Subarea 48.1. Data originating from single surveys could have contributed to the tighter confidence intervals, thus removing any inter-annual variability in length at maturity, which was included as a random effect in Maschette et al. (2021) for the estimates from Subarea 48.1. The sex specific estimates for maturity indicate that females in both Divisions (58.4.1 and 58.4.2) reach 50% maturity approximately 5 mm smaller than that of males. This is similar to the findings of Siegel and Loeb (1994) who found that females were reaching 50% maturity approximately 8 mm smaller than males in Subarea 48.1. For both sexes though the estimates in this study are larger than those of Siegel and Loeb (1994) by approximately 2 mm for males, and 5 mm for females. This may indicate differences in regional growth, however since the combined sex estimates in this study are similar to those presented by Maschette et al. (2021) and which are from the same region as Siegel and Loeb (1994) it may indicate environmental changes which have occurred across the Southern Ocean have resulted in a shift to a larger length at maturity of krill than was present in the 1980/90s. This could be confirmed by calculating sex specific estimates through time in Subarea 48.1 in future.
The comparison between different maturity models (ramp versus logistic) provided similar estimates of 50% maturity. The primary difference between the ogives comes in the differing shapes and width of each ogive. For example, when considering the two ogives from Division 58.4.1 (Figures 3, 5) the length at 50% maturity is approximately 0.6mm different, which is to be expected when fitting two models to the same data. Relative to the ramp model, the logistic model indicates that a larger proportion of the individuals in the population at lengths less than 42.43mm are mature. Conversely the ramp ogive indicates that a greater proportion of individuals at lengths greater than 42.43mm are mature.
When considering a population at equilibrium with no fishing, this would mean that overall, the logistic curve leads to a higher proportion of individual krill being mature (as there are more small krill than large ones). This effect however is often masked in stock assessments because numbers at age are converted to spawning stock biomass. By transforming each age class in the population to their relative biomass the differences between the two ogives are masked. That is, one large krill has the weight of many small krill so whilst a greater number of individual krill are considered mature using the logistic ogive, they have a similar weight of the larger krill included by the ramp ogive. A simplified example illustrating this is shown in Supplementary Material 3.
The use of the ramp ogive for krill was historically driven by limitations in the stock assessment software. Given that the limitation of modelling maturity has been overcome we recommend the use of logistic curves for maturity estimates for future krill assessments since they 1) are more representative of the biological process of maturity, and 2) are consistent with other fishery assessments in the Southern Ocean (such as Ziegler and Welsford, 2017).
The currently accepted stock assessment model configuration for krill management in CCAMLR is based on the Grym using proportional recruitment (SC-CAMLR, 2019). This model structure has the advantage of providing harvest rates for stocks in which little is known, and fisheries data is absent, as is the case for Divisions 58.4.1 and 58.4.2. In future, should a fishery develop in these areas, the combination of fisheries collected data, with on-going research survey data collection may provide the opportunity to utilize integrated stock assessment software packages such as Casal2 (Doonan et al., 2016) or Stock Synthesis (Methot and Wetzel, 2013).
Unlike Divisions 58.4.1 and 58.4.2, in Subarea 48.1 a continual fishery has operated for over 50 years and had annual research surveys between 1992 - 2011 covering ~19% of the Subarea situated near the South Shetland Islands which have provided a multitude of data (Kinzey et al., 2015). Previous efforts to fit integrated assessments in this region using AD Model Builder highlighted issues in getting models to converge reliably (Kinzey et al., 2015; de Lestang, 2016; Thomson, 2016; Wang et al., 2021). Upon reviewing one of these models Thomson (2016), and SC-CAMLR (2016) highlighted that this may be due to over-parameterization of the age-based models. Wang et al. (2021) developed a length-based model which estimated less parameters however still had issues fitting some of those estimated. They highlighted that this may be due to inconsistencies in the data collection in the surveys and fishery across the time series. More recently integrated model development in Casal2 (Kinzey and Watters, 2023) and Stock Synthesis (Mardones et al., 2024) have begun, however these will require overcoming similar challenges faced by previous models.
One option as a stepping-stone from the current stock assessment configuration in the Grym to an integrated assessment may be to explore fitting toothfish style assessments with the Grym (see Maschette et al., 2023). These incorporate previous survey biomass estimates, survey recruitments and fishery catch into the assessment to estimate catch limits. These were used within CCAMLR for toothfish until the fisheries had large quantities of data and developed integrated assessments. They have also been used for several bycatch species which often have less reliable data than target species (Dell et al., 2015; Maschette and Dell, 2015).
Regardless of the pathway taken to achieve an integrated assessment of krill in any area, focus needs to be given on the data collection required to enable models and parameters to be reliably fit. Arguably among the most important parameters for these assessments (and Grym assessments) are recruitment and annual growth (Punt, 2023). To estimate these reliably requires large amounts of survey data collected ideally on an annual basis.
With regards to growth, many studies have been conducted with either instantaneous or daily growth (such as Tarling et al., 2016; Melvin et al., 2018; Veytia et al., 2020; Sylvester et al., 2021) however few exist which attempt to estimate growth parameters used within stock assessments such as the von Bertalanffy growth curve with most assessments relying on estimates used by Constable and de la Mare (1996). Maschette and Wotherspoon (2023) recommended fitting growth curves by using the modal peaks of length classes fitted with a mixture distribution to survey time series data as has been done for other species. This has been conducted twice before for krill, the first by Siegel (1987) in the Atlantic sector and the second by Pakhomov (1995a) in the Indian sector. In both instances survey data was collected between 1983 and 1990. Despite multiple surveys being conducted for krill since, fitting mixture distributions to estimate growth has not been conducted. Modal lengths were calculated for two additional surveys by de la Mare (1994) who was using these to demonstrate the calculation of proportional recruitment.
When considering recruitment of krill into a fishery, some studies have reported large fluctuations of krill recruitment within Subarea 48.1 between years (Kinzey et al., 2013; Meyer et al., 2020; Maschette et al., 2021; Kinzey et al., 2023). Kinzey et al. (2013) examined the estimated proportional recruitments from the US-AMLR survey series and the Palmer LTER survey series using a length threshold as the cutoff for being a juvenile rather than the recommended mixture distribution method of de la Mare (1994). The two survey series have a small spatial overlap and between them cover most of the shelf zone of Subarea 48.1, unfortunately though there is only a three year period where both surveys were conducted. In all three of these years the Palmer LTER survey recruitment estimates were higher than the US-AMLR survey, particularly 2010 which was a ‘low’ recruitment year in the US-AMLR time series. Similar differences between surveys conducted in the same year were also seen by de la Mare (1994) which looked at 10 surveys (mostly from the Indian Sector) to estimate recruitment which was subsequently applied in all krill assessments until Maschette et al. (2021) where Subarea 48.1 specific values were estimated. Both studies highlight that in order to reliably estimate recruitment for a stock assessment the sampling needs to cover the entire region of the assessment (Siegel et al., 1997) either through multiple small-scale surveys, or large synoptic surveys (such as Krafft et al., 2021). This is particularly true for regions such as Subarea 48.1 which is subject to highly dynamic currents and region winds which may dictate whether juvenile krill are located inside or out of a static sampling region (Thompson and Youngs, 2013; Young et al., 2024).
Following the revised krill fishery management strategy recommended by the Scientific Committee and endorsed by CCAMLR in 2019 (CCAMLR, 2019, para. 5.17), we provide updated precautionary catch limits for krill in Divisions 58.4.1 and 58.4.2 East. These catch limits are based on recent biomass estimates from a 2018/19 survey conducted by Japan in Division 58.4.1 (Abe et al., 2023) and from a 2021 survey conducted by Australia in Division 58.4.2 East (Cox et al., 2022). These biomass estimates were combined with precautionary harvest rates for krill in Divisions 58.4.1 and 58.4.2-East estimated from stock assessments fitted with the Grym to derive precautionary catch limits.
The ‘BROKE’ survey in 1996 found krill were more abundant and with a broader latitudinal distribution in the western survey area (80°-115°E) than the east (115°-150°E) where krill were confined to the narrow coastal band of cool water (Nicol et al., 2000; Pauly et al., 2000). Based on this information, CCAMLR agreed in 2000 to subdivide Division 58.4.1 into two management Subdivisions at the 115°E meridian and set individual precautionary catch limits for West and East Subdivisions (Nicol and Pauly, 2000).
The KY1804 krill biomass survey by Japan in Division 58.4.1 in 2018/19 was conducted in two separate legs, with leg 1 covering 80°E to 120°E, and leg 2 covering 120°E to 150°E (Murase et al., 2025). Krill biomass in the leg 1 survey area was estimated to be 2.210 million tonnes. More than 70% (1.567 million tonnes) of this biomass was distributed in the western stratum between 80°-103°E, and less than 30% (0.643 million tonnes) in the middle stratum between 103°-123°E (Abe et al., 2023). The areal biomass of krill in the leg 2 survey area in the eastern stratum between 123°-150°E was estimated at 2.114 million tonnes. The Scientific Committee considered this new estimate to be the best available estimate of krill biomass for this region (SC-CAMLR-2021, para. 2.6).
The total areal krill biomass of 4.325 million tonnes (CV 0.17) for the entire Division 58.4.1 in this survey was similar to the biomass estimated for the same area in the BROKE survey in 1996 (4.83 million tonnes, CV 0.17), and the Scientific Committee considered this new estimate to be the best available estimate of krill biomass for this region (SC-CAMLR-2021, para. 2.6). However, the biomass distribution across Division 58.4.1 was different between the 1996 and 2018/19 surveys, with relatively higher biomass in the east and west and low in the middle of the Division in 2018/19. This difference could be attributed to difference in the survey timings as well as difference in latitudinal coverage between the two surveys especially in the western part of the area.
Based on the three strata biomass estimates by Abe et al. (2023), and the low krill estimates for the middle stratum relative to the eastern and western strata, along with the CCAMLR Scientific Committee (SC-CAMLR, 2023) we recommend that catch limits for Division 58.4.1 are set by CCAMLR individually for three subdivisions following these strata boundaries, rather than the two subdivisions west and east of 115°E as currently defined in CM 51-02. If the middle stratum with low biomass was combined with either the eastern or western stratum with much higher krill biomass and managed as a single management unit, there could be a risk that the entire catch limit set for this management unit could come out of the middle stratum and disproportionately impact the ecosystem by exceeding the sustainable harvest rate through concentrated fishing effort. The proposed precautionary catch limits for the West, Middle, and East subdivisions are 141,970 tonnes, 58,256 tonnes and 191,528 tonnes, respectively.
Splitting the krill catch limits in Division 58.4.1 into three subdivisions would be also consistent with the result of the spatial overlap analysis by Kelly et al. (2018), which was based on data layers available at the time and indicated that krill predators across Division 58.4.1 could potentially be exposed to disproportionate effects of fishing if the harvest rate become close to the catch limit. The KY1804 survey (Murase et al., 2025) has also provided valuable data sets to update the data layers such as whales (Hamabe et al., 2024) and seabirds (Kokubun et al., 2024) in future implementations of spatial overlap analyses in this Division.
Krill biomass across Division 58.4.2 was first estimated from a summer survey in 2006 (Jarvis et al., 2010) and later recalculated by Cox and Kawaguchi (2012), with revised estimates of 15.34 million tonnes (CV 0.21) in the western subdivision (30°-55°E), 11.47 million tonnes (CV 0.28) in the eastern subdivision (55°-80°E), and a total biomass of 28.43 million tonnes (CV 0.16) for the entire Division 58.4.2. The 2021 Australian survey estimated a krill biomass for Division 58.4.2 East of 6.48 million tonnes (CV 0.289; Cox et al., 2022) and this estimate was endorsed as the best available estimate by the Scientific Committee (SC-CAMLR, 2021, para. 2.6).
Based on the Grym assessment presented here, the precautionary catch limit for Division 58.4.2 East was calculated to be 640,872 tonnes. For Division 58.4.2 West, there is no updated biomass estimate available and we recommend that the current precautionary catch limit be retained. Together, the updated total precautionary catch limit for the entire Division 58.4.2 is 2,088,872 tonnes.
The areal size of Division 58.4.2 East of 775,732 km2 (Cox et al., 2022) is larger than the entire Subarea 48.1 (595,490 km2) in the Atlantic Sector, where management units at smaller scales are being discussed under the revised krill management strategy agreed in 2019. To follow consistent principles across different areas within the CAMLR Convention area, it would be important that the krill fishery in Division 58.4.2 is also managed using smaller spatial management units. The spatial overlap analysis conducted by Kelly et al. (2018) could be used for this purpose, however this analysis was preliminary in nature. Until an updated spatial overlap analysis can inform on a spatial allocation of catch within Division 58.4.2, we propose that the current trigger levels for both subdivisions in Division 58.4.2 (CM 51-03) remain in force.
Whist currently underutilized, the krill fisheries in East Antarctica show a substantial resource potential. Despite this, our work has shown that the current catch limits set in CCAMLR Conservation Measures are higher than those which should be set following the CCAMLR decision rule process. Specifically, based on the presented stock assessment for Euphausia superba in this paper, we recommend that CCAMLR consider the following:
● Given that historical limitations have been overcome, future assessments for krill should be based on the use of logistic ogives as they are more representative of krill biology.
● In Division 58.4.1, the total catch limit be set at 391,754 tonnes, with a subdivision of 141,970 tonnes west of 103°E, 58,256 tonnes between 103°E and 123°E, and 191,528 tonnes east of 123°E.
● In Division 58.4.2, the total catch limit be set at 2,088,872 tonnes, with a subdivision of 1.448 million tonnes west of 55°E and 640,872 tonnes east of 55°E.
● The current trigger levels in CM 51-03 for both subdivisions of Division 58.4.2 remain in force until such time that an updated spatial overlap analysis can inform on a spatial allocation of catch within this Division.
The datasets presented in this study can be found in online repositories. The names of the repository/repositories and accession number(s) can be found below: https://data.aad.gov.au/metadata/AAS_4512_TEMPO_bioacoustics for TEMPO data. The KY1804 survey data will be shared on reasonable request to Hiroto Murase with permission from the funding institute and agencies.
DM: Conceptualization, Data curation, Formal analysis, Investigation, Methodology, Project administration, Resources, Software, Validation, Visualization, Writing – original draft, Writing – review & editing. SW: Formal analysis, Investigation, Methodology, Validation, Writing – original draft, Writing – review & editing. HM: Conceptualization, Funding acquisition, Investigation, Project administration, Resources, Writing – original draft, Writing – review & editing. NK: Methodology, Validation, Writing – original draft, Writing – review & editing. PZ: Resources, Supervision, Validation, Writing – original draft, Writing – review & editing. KS: Supervision, Writing – review & editing. SK: Conceptualization, Funding acquisition, Investigation, Project administration, Resources, Validation, Writing – original draft, Writing – review & editing.
The author(s) declare that financial support was received for the research and/or publication of this article. This project was supported and funded by Australian Antarctic Science Project 4512, 4578, and 4636 and received grant funding from the Australian Government as part of the Antarctic Science Collaboration Initiative program. This project also received financial support from Pew Charitable Trust and Antarctic Science Foundation. We acknowledge the use of the CSIRO Marine National Facility (https://ror.org/01mae9353) and grant of sea time on RV Investigator in undertaking this research. The KY1804 component was financially supported by the Institute of Cetacean Research, the Japan Fisheries Research and Education Agency and the Fisheries Agency of Japan.
The authors would like to thank the TEMPO krill team members: Rob King, Jessica Melvin, Alicia Burns, Christine Weldrick, Olivia Johnson, Abigail Smith and Maddie Brasier for collecting the length and maturity data during the TEMPO survey that was analyzed in this study. We would additionally like to thank Hiroko Sasaki, Ryuichi Matsukura, Marin van Regteren, Sara Driscoll, Ryan Driscoll, Jianfeng Tong, Rikuto Sugioka, Hideya Ohshima, Kaiki Ohshima, Ishihara, Qingyuan Yang and Hanae Doiguchi from the KY1804 survey for collecting the length and maturity data analyzed here. The Authors would like to thank the reviewers which provided useful comments to the manuscript.
The authors declare that the research was conducted in the absence of any commercial or financial relationships that could be construed as a potential conflict of interest.
All claims expressed in this article are solely those of the authors and do not necessarily represent those of their affiliated organizations, or those of the publisher, the editors and the reviewers. Any product that may be evaluated in this article, or claim that may be made by its manufacturer, is not guaranteed or endorsed by the publisher.
The Supplementary Material for this article can be found online at: https://www.frontiersin.org/articles/10.3389/fmars.2025.1448250/full#supplementary-material
Abe K., Matsukura R., Yamamoto N., Amakasu K., Nagata R., Murase H. (2023). Biomass of Antarctic krill (Euphausia superba) in the eastern Indian sector of the Southern Ocean (80–150°E) in the 2018–19 austral summer. Prog. Oceanography 218, 103107. doi: 10.1016/j.pocean.2023.103107
Bull B., Francis R. I. C. C., Dunn A., McKenzie A., Gilbert D. J., Smith M. H., et al. (2012). CASAL C++ Algorithmic Stock Assessment Laboratory): CASAL user manual v2.30-2012/03/21. Technical Report 135, National Institute of Water and Atmospheric Research Ltd (NIWA), Wellington, New Zealand.
Cavan E. L., Belcher A., Atkinson A., Hill S. L., Kawaguchi S., McCormack S., et al. (2019). The importance of Antarctic krill in biogeochemical cycles. Nat. Commun. 10, 4742. doi: 10.1038/s41467-019-12668-7
CCAMLR (2019). Report of the thirty-eighth meeting of the commission for the conservation of antarctic marine living resources (CCAMLR-38) (Hobart, Australia: CCAMLR).
Constable A. J. (2004). “Modifications to the generalised yield model in 2004, version GYM501E.EXE,” in Document WG-FSA 04/91(Hobart, Tasmania, Australia: CCAMLR).
Constable A. J. (2011). Lessons from CCAMLR on the implementation of the ecosystem approach to managing fisheries: Lessons from CCAMLR on EBFM. Fish. Fish. 12, 138–151. doi: 10.1111/j.1467-2979.2011.00410.x
Constable A. J., de la Mare W. K. (1996). A generalised model for evaluating yield and the long-term status of fish stocks under conditions of uncertainty. CCAMLR Sci. 3, 31–54.
Constable A. J., Nicol S. (2002). Defining smaller-scale management units to further develop the ecosystem approach in managing large-scale pelagic krill fisheries in Antarctica. CCAMLR Sci. 9, 117–131.
Cox M., Kawaguchi S. (2012). “Recalculation of Antarctic krill (Euphausia superba) biomass off East Antarctica (30–80°E) in January–March 2006,” in Document WG-EMM-12/31 (Hobart, Tasmania, Australia: CCAMLR).
Cox M. J., Macaulay G., Brasier M. J., Burns A., Johnson O. J., King R., et al. (2022). Two scales of distribution and biomass of Antarctic krill (Euphausia superba) in the eastern sector of the CCAMLR Division 58.4.2 (55˚E to 80˚E). PloS One 17, e0271078. doi: 10.1371/journal.pone.0271078
Delegation of Australia (2007). “Biomass of krill in Division 58.4.2 and an estimation of precautionary yield, including a subdivision of the precautionary catch limit along the 55°E longitude,” in Document SC-CAMLR-XXVI/07 (CCAMLR, Hobart, Tasmania, Australia).
de Lestang (2016). Center for Independent Experts (CIE) independent peer reviewer’s report of an age-based, integrated stock assessment for Antarctic krill (Euphausia superba) with projected catches to 2035 (Center for Independent Experts NOAA). Available online at: https://www.st.nmfs.noaa.gov/science-quality-assurance/cie-peer-reviews/cie-review-2016.
Dell J., Maschette D., Woodcock E., Welsford D. (2015). “Biology, population dynamics and preliminary assessment of the long-term yield of Macrourus caml by-caught by the Australian fishery at Heard Island and the McDonald Islands (CCAMLR Division 58.5.2),” in Document WG-FSA-15/63 (Hobart, Tasmania, Australia: CCAMLR).
Doonan I., Large K., Dunn A., Rasmussen S., Marsh C., Mormede S. (2016). Casal2: New Zealand’s integrated population modelling tool. Fisheries Res. 183, 498–505. doi: 10.1016/j.fishres.2016.04.024
Hamabe K., Miyashita T., Nagata R., Sasaki H., Murase H. (2024). Abundance of humpback whales in the eastern Indian sector of the Southern Ocean in 2018/19 using opportunistic sighting survey data with a note on the occurrence of other cetaceans. Prog. Oceanography 226, 103296. doi: 10.1016/j.pocean.2024.103296
Hewitt R. P., Watters G., Trathan P. N., Croxall J. P., Goebel M. E., Ramm D., et al. (2004). Options for allocating the precautionary catch limit of krill among small-scale management units in the Scotia Sea. CCAMLR Sci. 11, 81–97.
Jarvis T., Kelly N., Kawaguchi S., van Wijk E., Nicol S. (2010). Acoustic characterisation of the broad-scale distribution and abundance of Antarctic krill (Euphausia superba) off East Antarctica (30-80 degrees E) in January-March 2006. Deep-Sea Res. Part II-Topical Stud. Oceanography 57, 916–933. doi: 10.1016/j.dsr2.2008.06.013
Kawaguchi S., Atkinson A., Bahlburg D., Bernard K. S., Cavan E. L., Cox M. J., et al. (2024). Climate change impacts on Antarctic krill behavior and population dynamics. Nat. Rev. Earth Environ. 5, 43–58. doi: 10.1038/s43017-023-00504-y
Kawaguchi S., Nicol S. (2020). “Krill fishery,” in Fisheries and aquaculture. Eds. Lovrich G., Thiel M. (Oxford University Press). doi: 10.1093/oso/9780190865627.003.0006
Kelly N., Emmerson L., Kawaguchi S., Southwell D., Welsford D. (2018). “An ecological risk assessment of current conservation measures for krill fishing in East Antarctica (CCAMLR Divisions 58.4.1 and 58.4.2),” in Document WG-EMM-18/37(Hobart, Tasmania, Australia: CCAMLR).
Kinzey D., Watters G. (2023). “Casal2 stock assessment for antarctic krill in CCAMLR subarea 48.1,” in Document WG-FSA-23/14 (Hobart, Tasmania, Australia: CCAMLR).
Kinzey D., Hinke J. T., Reiss C. S., Watters G. M. (2023). ecruitment variability of Antarctic krill in Subarea 48.1 expressed as ‘proportional recruitment’: length threshold effects. CCAMLR Sci. 24, 1–18.
Kinzey D., Watters G., Reiss C. S. (2013). Effects of recruitment variability and natural mortality on generalised yield model projections and the CCAMLR decision rules for Antarctic krill. CCAMLR Sci. 20, 81–96.
Kinzey D., Watters G. M., Reiss C. S. (2015). Selectivity and two biomass measures in an age-based assessment of Antarctic krill (Euphausia superba). Fisheries Res. 168, 72–84. doi: 10.1016/j.fishres.2015.03.023
Kokubun N., Hamabe K., Yamada N., Sasaki H., Nishizawa B., Watanuki Y., et al. (2024). Abundance and estimated food consumption of seabirds in the pelagic ecosystem in the eastern Indian sector of the Southern Ocean. Prog. Oceanography, 231, 103385. doi: 10.1016/j.pocean.2024.103385
Krafft B. A., Macaulay G. J., Skaret G., Knutsen T., Bergstad O. A., Lowther A., et al. (2021). Standing stock of Antarctic krill (Euphausia superba Dana 1850) (Euphausiacea) in the Southwest Atlantic sector of the Southern Ocean 2018-19. J. Crustacean Biol. 41 (4), 1–17. doi: 10.1093/jcbiol/ruab046
Liu J., Wotherspoon S., Maschette D. (2023). Multi-fleet stock assessment modelling with the Grym. CCAMLR Sci. 24, 95–109.
Makarov R. R., Denys C. J. (1980). Stages of sexual maturity of Euphausia superba. Biomass Handb. 11, 1–13.
Mardones M., Krüger L., Santa Cruz F., Cárdenas C., Watters G. (2024). “Integrated approach to modeling krill population dynamics in the Western Antarctic Peninsula: spatial and ecosystem considerations,” in Document WG-FSA-24/27 (Hobart, Tasmania, Australia: CCAMLR).
Maschette D., Dell J. (2015). “An updated assessment of unicorn icefish (Channichthys rhinoceratus) in Division 58.5.2, based on results from the 2015 random stratified trawl survey,” in Document WG-FSA-15/50 (Hobart, Tasmania, Australia: CCAMLR).
Maschette D., Wotherspoon S. (2023). Description and use of parameters within Antarctic krill (Euphausia superba) assessment models conducted with the Grym. CCAMLR Sci. 24, 58–68.
Maschette D., Sumner M., Raymond B. (2019). SOmap: Southern Ocean maps. Version 0.5.0. Available online at: https://github.com/AustralianAntarcticDivision/SOmap
Maschette D., Wotherspoon S., Kawaguchi S., Ziegler P. (2021). “Grym assessment for Subarea 48.1 Euphausia superba populations,” in Document WG-FSA-2021/39 (CCAMLR, Hobart, Australia).
Maschette D., Wotherspoon S., Pavez S., Ziegler P., Thanassekos S., Reid K., et al. (2023). Grym: A new open-source implementation of the generalised yield model for flexible stock assessments. CCAMLR Sci. 24, 69–94.
Melvin J. E., Kawaguchi S., King R., Swadling K. M. (2018). The carapace matters: refinement of the instantaneous growth rate method for Antarctic krill Euphausia superba Dana, 1850 (Euphausiacea). J. Crustacean Biol. 38, 689–696. doi: 10.1093/jcbiol/ruy069
Methot R. D., Wetzel C. R. (2013). Stock Synthesis: A biological and statistical framework for fish stock assessment and fishery management. Fisheries Res. 142, 86–99. doi: 10.1016/j.fishres.2012.10.012
Meyer B., Atkinson A., Bernard K. S., Brierley A. S., Driscoll R., Hill S. L., et al. (2020). Successful ecosystem-based management of Antarctic krill should address uncertainties in krill recruitment, behaviour and ecological adaptation. Commun. Earth Environ. 1, 28. doi: 10.1038/s43247-020-00026-1
Morris D. J., Watkins J. L., Ricketts C., Buchholz F., Priddle J. (1988). An assessment of the metrics of length and weight measurements of Antarctic krill Euphausia supeba. Br. Antarctic Survey Bull. 79, 27–50. Available online at: https://nora.nerc.ac.uk/id/eprint/521694.
Murase H., Abe K., Schaafsma F. L., Katsumata K. (2025). Overview of the multidisciplinary ecosystem survey in the eastern Indian sector of the Southern Ocean (80–150°E) by the Japanese research vessel Kaiyo-maru in the 2018–19 austral summer (KY1804 survey). Prog. Oceanography 103456. doi: 10.1016/j.pocean.2025.103456
Nicol S. (2000). BROKE” A multidisciplinary survey of the waters off East Antarctica (80-150D). Deep-Sea Res. II 47, 2281–2613. doi: 10.1016/S0967-0645(00)00026-6
Nicol S., Foster J., Kawaguchi S. (2012). The fishery for Antarctic krill – recent developments. Fish Fisheries 13, 30–40. doi: 10.1111/j.1467-2979.2011.00406.x
Nicol S., Meiners K., Raymond B. (2010). BROKE-West, a large ecosystem survey of the South West Indian Ocean sector of the Southern Ocean, 30°E–80°E (CCAMLR Division 58.4.2). Deep Sea Res. Part II: Topical Stud. Oceanography 57, 693–700. doi: 10.1016/j.dsr2.2009.11.002
Nicol S., Pauly T. (2000). “A proposal to subdivide CCAMLR Statistical Division 58.4.1 using environmental data,” in Document WG-EMM-00/30 (Hobart, Tasmania, Australia: CCAMLR).
Nicol S., Pauly T., Bindoff N. L., Wright S., Thiele D., Hosie G. W., et al. (2000). Ocean circulation off east Antarctica affects ecosystem structure and sea-ice extent. Nature 406, 504–507. doi: 10.1038/35020053
Pakhomov E. A. (1995a). Demographic studies of Antarctic krill Euphausia superba in the Cooperation and Cosmonaut Seas (Indian sector of the Southern Ocean). Mar. Ecol. Prog. Ser. 119, 45–61. doi: 10.3354/meps119045
Pakhomov E. A. (1995b). Natural age-dependent mortality rates of Antarctic krill Euphausia superba Dana in the Indian sector of the Southern Ocean. Polar Biol. 15, 69–71. doi: 10.1007/BF00236127
Pauly T., Nicol S., Higginbottom I., Hosie G., Kitchener J. (2000). Distribution and abundance of Antarctic krill (Euphausia superba) off East Antarctica (80-150 degrees E) during the Austral summer of 1995/1996. Deep-Sea Res. Part Ii-Topical Stud. Oceanography 47, 2465–2488. doi: 10.1016/S0967-0645(00)00032-1
Pavez C., Wotherspoon S., Maschette D., Reid K., Swadling K. (2023). Recruitment modelling for Euphausia superba stock assessments considering the recurrence of years with low recruitment. CCAMLR Sci. 24, 110–124.
Punt A. E. (2023). Those who fail to learn from history are condemned to repeat it: A perspective on current stock assessment good practices and the consequences of not following them. Fisheries Res. 261, 106642. doi: 10.1016/j.fishres.2023.106642
SC-CAMLR (1994). Report of the thirteenth meeting of the Scientific Committee (Hobart, Australia: CCAMLR).
SC-CAMLR (2000). “Report of the working group on ecosystem monitoring and management, annex 4,” in Report of the nineteenth meeting of the Scientific Committee (CCAMLR, Hobart, Tasmania, Australia).
SC-CAMLR (2016). “Report of the working group on statistics, assessments and modelling, annex 5,” in Report of the thirty-fifth meeting of the scientific committee (CCAMLR, Hobart, Tasmania, Australia).
SC-CAMLR (2019). Report of the thirty-eighth meeting of the Scientific Committee (Hobart, Australia: CCAMLR).
SC-CAMLR (2021). Report of the fortieth meeting of the scientific committee (Hobart, Australia: CCAMLR).
SC-CAMLR (2023). Report of the fourty-second meeting of the scientific committee (Hobart, Australia: CCAMLR).
Schaafsma F. L., Driscoll R., Matsuno K., Sugioka R., Driscoll S., van Regteren M., et al. (2024). Demography of Antarctic krill (Euphausia superba) from the KY1804 austral summer survey in the eastern Indian sector of the Southern Ocean (80 to 150˚E), including specific investigations of the upper surface waters. Front. Mar. Sci. 11. doi: 10.3389/fmars.2024.1411130
Siegel V. (1987). Age and growth of Antarctic Euphausiacea (Crustacea) under natural conditions. Mar. Biol. 96, 483–495. doi: 10.1007/BF00397966
Siegel V., de la Mare W. K., Loeb V. (1997). Long-term monitoring of krill recruitment and abundance indices in the Elephant Island area (Antarctic Peninsula). CCAMLR Sci. 4, 19–35.
Siegel V., Loeb V. (1994). Length and age at maturity of Antarctic krill. Antarctic Sci. 6, 479–482. doi: 10.1017/S0954102094000726
Sylvester Z. T., Long M. C., Brooks C. M. (2021). Detecting climate signals in southern ocean krill growth habitat. Front. Mar. Sci. 8. doi: 10.3389/fmars.2021.669508
Tarling G. A., Hill S., Peat H., Fielding S., Reiss C., Atkinson A. (2016). Growth and shrinkage in Antarctic krill Euphausia superba is sex-dependent. Mar. Ecol. Prog. Ser. 547, 61–78. doi: 10.3354/meps11634
Thompson A. F., Youngs M. K. (2013). Surface exchange between the weddell and scotia seas. Geophysical Res. Lett. 40, 5920–5925. doi: 10.1002/2013GL058114
Thomson R. (2016). Center for Independent Experts (CIE) independent peer reviewer’s report of an age-based, integrated stock assessment for Antarctic krill (Euphausia superba) with projected catches to 2035 (Center for Independent Experts NOAA). Available online at: https://www.st.nmfs.noaa.gov/science-quality-assurance/cie-peer-reviews/cie-review-2016.
Veytia D., Corney S., Meiners K. M., Kawaguchi S., Murphy E. J., Bestley S. (2020). Circumpolar projections of Antarctic krill growth potential. Nat. Climate Change 10, 568–575. doi: 10.1038/s41558-020-0758-4
Wang R., Song P., Li Y., Lin L. (2021). An integrated, size-structured stock assessment of antarctic krill, euphausia superba. Front. Mar. Sci. 8. doi: 10.3389/fmars.2021.710544
Watters G. M., Hinke J. T., Reiss C. S. (2020). Long-term observations from Antarctica demonstrate that mismatched scales of fisheries management and predator-prey interaction lead to erroneous conclusions about precaution. Sci. Rep. 10, 2314. doi: 10.1038/s41598-020-59223-9
Wotherspoon S., Maschette D. (2023). Grym: R implementation of the Generalized Yield Model. R package version 0.1.2. Available online at: https://github.com/AustralianAntarcticDivision/Grym.
Young E. F., Thorpe S. E., Renner A. H. H., Murphy E. J. (2024). Environmental and behavioural drivers of Antarctic krill distribution at the South Orkney Islands: A regional perspective. J. Mar. Syst. 241, 103920. doi: 10.1016/j.jmarsys.2023.103920
Ziegler P., Welsford D. C. (2017). “The Patagonian toothfish (Dissostichus eleginoides) fishery at Heard Island and McDonald Islands (HIMI) – population structure and history of the fishery stock assessment,” in The Kerguelen Plateau: marine ecosystem and fisheries. Proceedings of the Second Symposium. Eds. Welsford D. ,. J.D., Duhamel G. (Australian Antarctic Division, Kingston, Tasmania, Australia).
Keywords: krill, fishery, precautionary catch limit, generalised yield model, Grym, CCAMLR, stock assessment
Citation: Maschette D, Wotherspoon S, Murase H, Kelly N, Ziegler P, Swadling KM and Kawaguchi S (2025) Resource potential and maturity estimates of Euphausia superba in East Antarctica. Front. Mar. Sci. 12:1448250. doi: 10.3389/fmars.2025.1448250
Received: 13 June 2024; Accepted: 24 February 2025;
Published: 26 March 2025.
Edited by:
Steven Parker, Commission for the Conservation of Antarctic Marine Living Resources (CCAMLR), AustraliaReviewed by:
Erica Jarvis Mason, National Oceanic and Atmospheric Administration, United StatesCopyright © 2025 Maschette, Wotherspoon, Murase, Kelly, Ziegler, Swadling and Kawaguchi. This is an open-access article distributed under the terms of the Creative Commons Attribution License (CC BY). The use, distribution or reproduction in other forums is permitted, provided the original author(s) and the copyright owner(s) are credited and that the original publication in this journal is cited, in accordance with accepted academic practice. No use, distribution or reproduction is permitted which does not comply with these terms.
*Correspondence: Dale Maschette, RGFsZS5NYXNjaGV0dGVAdXRhcy5lZHUuYXU=
Disclaimer: All claims expressed in this article are solely those of the authors and do not necessarily represent those of their affiliated organizations, or those of the publisher, the editors and the reviewers. Any product that may be evaluated in this article or claim that may be made by its manufacturer is not guaranteed or endorsed by the publisher.
Research integrity at Frontiers
Learn more about the work of our research integrity team to safeguard the quality of each article we publish.