 Adam G. Pollack1*
 Eric R. Hoffmayer1
 Theodore S. Switzer2
 David S. Hanisko1
 Jill M. Hendon3
 John Mareska4
 Fernando Martinez-Andrade5
 Jeff Rester6
 Zachary C. Zuckerman7
 Gilmore Pellegrin8
- 1Mississippi Laboratories, Southeast Fisheries Science Center, National Marine Fisheries Service, Pascagoula, MS, United States
- 2Florida Fish and Wildlife Conservation Commission, Fish and Wildlife Research Institute, St. Petersburg, FL, United States
- 3Center for Fisheries Research and Development, The University of Southern Mississippi, Ocean Springs, MS, United States
- 4Marine Resources Division, Alabama Department of Conservation and Natural Resources, Dauphin Island, AL, United States
- 5Coastal Fisheries Division, Texas Parks and Wildlife Department, Corpus Christi, TX, United States
- 6Gulf States Marine Fisheries Commission, Ocean Springs, MS, United States
- 7Fisheries Research Laboratory, Louisiana Department of Wildlife and Fisheries, Grand Isle, LA, United States
- 8Retired, Pascagoula, MS, United States
Long-term fishery-independent surveys provide a wealth of information on fisheries stocks that inform stock assessments. One of the strengths of these surveys is that the design and methods are consistent through time. However, maintaining an unchanged time series can pose several potential issues as management needs change resulting in the need to alter either the survey design or its spatial extent. In the United States Gulf of Mexico, bottom trawl surveys targeting groundfish and shrimp (hereafter, groundfish surveys) have been conducted since the 1950s, with standardized surveys beginning in 1972. The resulting data can provide a great deal of information on commercially and recreationally important species. However, many of the alterations to the survey design have been buried in gray literature or otherwise poorly noted. The history of these surveys is discussed, along with the rationale behind these changes and the impacts they had on stock assessments in the region. Starting in 1981, the Southeast Area Monitoring and Assessment Program began groundfish surveys, continuing the time series. Over time, the survey’s spatial extent and design have been altered to meet changing management needs. Delta-lognormal models are used to draw inferences concerning the effects of the survey design change on the relative abundance and their associated coefficients of variation for several commercially and recreationally important species. The expansion of the surveys across the Gulf of Mexico is examined in relation to stock assessments. Overall, the design changes and spatial expansion have been beneficial from a stock assessment standpoint, resulting in an increase in the number of indices used for single-species stock assessments and the utility of survey data in support of ecosystem modeling efforts. Finally, a discussion around the lesson learned (i.e., the critical need for overlap of survey designs), emphasizing the potential impacts of these changes on the overall time series concerning stock assessments, is presented.
1 Introduction
Under increasing pressure from commercial and recreational fisheries, timely and accurate assessment and management are essential to maintaining sustainable fish stocks. In the United States (U.S.), the National Marine Fisheries Service (NMFS) is responsible “for the stewardship of the nation’s living marine resources and their habitat” (NOAA Fisheries, 2022a). Part of this stewardship involves the management of 492 stocks or stock complexes, of which 48 are currently overfished (the population size is too small) and 24 are subject to overfishing (the annual catch rate is too high; NOAA Fisheries, 2023). The Magnuson-Stevens Fishery Conservation and Management Act requires that once stocks are identified as overfished, a rebuilding plan must be put in place to immediately end overfishing and rebuild the stock to sustainable levels (MSFCMA, 2007). Effective management of these stocks requires information on an array of metrics, including annual landings and discards, abundance, size and age composition, reproduction, and mortality among other factors (Punt, 2023).
Fishery managers rely on outputs from stock assessments to not only assess stock status, but also to project future fisheries productivity and guide the establishment of sustainable harvest regulations. The stock assessment process requires both fishery-dependent and fishery-independent data to develop a statistical model that accurately estimates overall population dynamics while also capturing sources of uncertainty (Punt, 2023). The complexity of a stock assessment model is heavily dependent on the quantity and quality of data available for a particular stock. Regardless of the assessment model used, time series (indices) of abundance and size/age composition are essential. Although there are various statistical approaches that can be used to generate these indices, model-based approaches are most commonly used to standardize annual estimates of catch (Lo et al., 1992; Maunder and Starr, 2003; Maunder and Punt, 2004; Thorson, 2019; Thompson et al., 2022).
Historically, stock assessments in the U.S. Gulf of Mexico (GOM) routinely utilized catch per unit effort (CPUE) generated from the analysis of fishery-dependent data. However, fishery-dependent data can be influenced by outside factors (e.g., market prices, changes in regulations, etc.) not directly related to population abundance (de Mutsert et al., 2008). In recent years, increasingly complex and restrictive management regulations have reduced the utility of fishery-dependent data to track abundance trends. Therefore, fishery-independent data from scientific surveys have become essential to the accurate assessment and management of fish stocks (SEDAR, 2015). Fishery-independent indices are especially valuable because they utilize data collected following a statistically rigorous survey design that typically encompasses multiple habitats across broad spatial and temporal scales (Rago, 2005; Thompson et al., 2022). These surveys also often provide additional data for life history stages for which fishery harvest is prohibited (e.g., recruits, juveniles, and sublegal adults), which may help to forecast the future productivity of the stock. Despite their importance, the availability of fishery-independent data is often limited due to the high cost of conducting these surveys.
Furthermore, although data from standardized and long-term fishery-independent surveys are essential to the assessment and management of fish stocks (Rourke et al., 2022), maintaining consistency through time is often a challenge and requires a concerted effort by management agencies and other institutions (Dennis et al., 2015). Changes to long-term surveys can arise from several potential sources, including changes to sampling vessels or platforms, changing technology, or even expansion or contraction of the survey footprint to align survey efforts with available funding. A fundamental consideration when modifying long-term surveys is how best to implement changes to the survey design while maintaining the consistency of the time series to the greatest extent practicable. Ideally, statistically robust calibration studies would be conducted prior to implementing any significant change to determine what, if any, correction factor is required. Oftentimes, this is not possible due to financial constraints, program logistics (e.g., staffing requirements, ship time, etc.), or the need for large survey changes. In these cases, careful consideration must be given as to whether changes can be accounted for statistically, or whether data collected under the new design should be treated as a new time series (Miller et al., 2010; Latour et al., 2023; Switzer et al., 2023; Schrandt et al., 2024).
In the GOM, bottom trawl surveys targeting groundfish and shrimp (hereafter, groundfish surveys) have been conducted since the 1950s, with standardized surveys beginning in 1972. Throughout this period, the survey design and methods of groundfish surveys in the GOM have evolved to meet changing objectives and management needs. These surveys represent the only source of long-term, fishery-independent data on groundfish populations in the GOM. Given its history and the length of available time series, the groundfish surveys represent an ideal case study to investigate the impacts of multi-decadal survey design changes, the evolution of multiple independent surveys, and their utility in stock assessments for a variety of species (e.g., shrimp, snappers, groupers, sharks, etc.) under fishery management plans. The use of this fishery-independent survey data within stock assessments is important because of the 492 stocks that are managed nationwide, 69 are located in the GOM, of which 16 are experiencing overfishing and nine are classified as overfished (NOAA Fisheries, 2023).
The objectives of this paper are to: (1) describe the history of the groundfish surveys in the GOM, and document the changes to survey design and underlying sampling frame, (2) investigate the impacts of the most recent groundfish survey design change/expansion in 2008/2010 to stock assessments and ecosystem models in the region, and (3) present lessons learned from over seven decades of survey evolution to provide guidance to others as to how changes to survey design can be implemented successfully while minimizing the impacts on the overall time series. In doing so, we synthesize the vast amount of gray literature documenting changes in groundfish survey design and how these changes have been dealt with analytically.
2 History of fishery-independent groundfish surveys in the Gulf of Mexico
2.1 Early fishery-independent surveys (1950 – 1971)
The Gulf States Marine Fisheries Commission (GSMFC) was established in 1949 by the U.S. Congress “to promote better utilization of the fisheries, marine, shell and anadromous, of the seaboard of the Gulf of Mexico, by the development of a joint program for the promotion and protection of such fisheries and the prevention of the physical waste of the fisheries from any cause” (GSMFC, 2024). In 1950, the GSMFC recommended to the U.S. Fish and Wildlife Service’s Bureau of Commercial Fisheries (the precursor federal agency to NMFS) that tuna, sharks, and snappers be the primary focus of exploratory surveys in the GOM, although shrimp were subsequently substituted for sharks (Bullis, 1964; NOAA, 2022b). The main objectives of these early surveys (1950 – 1963) were exploration and gear studies designed to assess what underexploited fishery resources may be available to the commercial fishing industry (Springer and Bullis, 1956; Bullis and Thompson, 1965). Multiple cruises were conducted each year throughout all seasons that used a variety of gear types including, but not limited to, trawls (bottom, deepwater, mid-water), gillnets, pelagic longlines, handlines, trap lift nets, dipnets, and purse seines, and extensive modification of those gears were commonplace (Figure 1; Springer and Bullis, 1956; Bullis and Thompson, 1970).
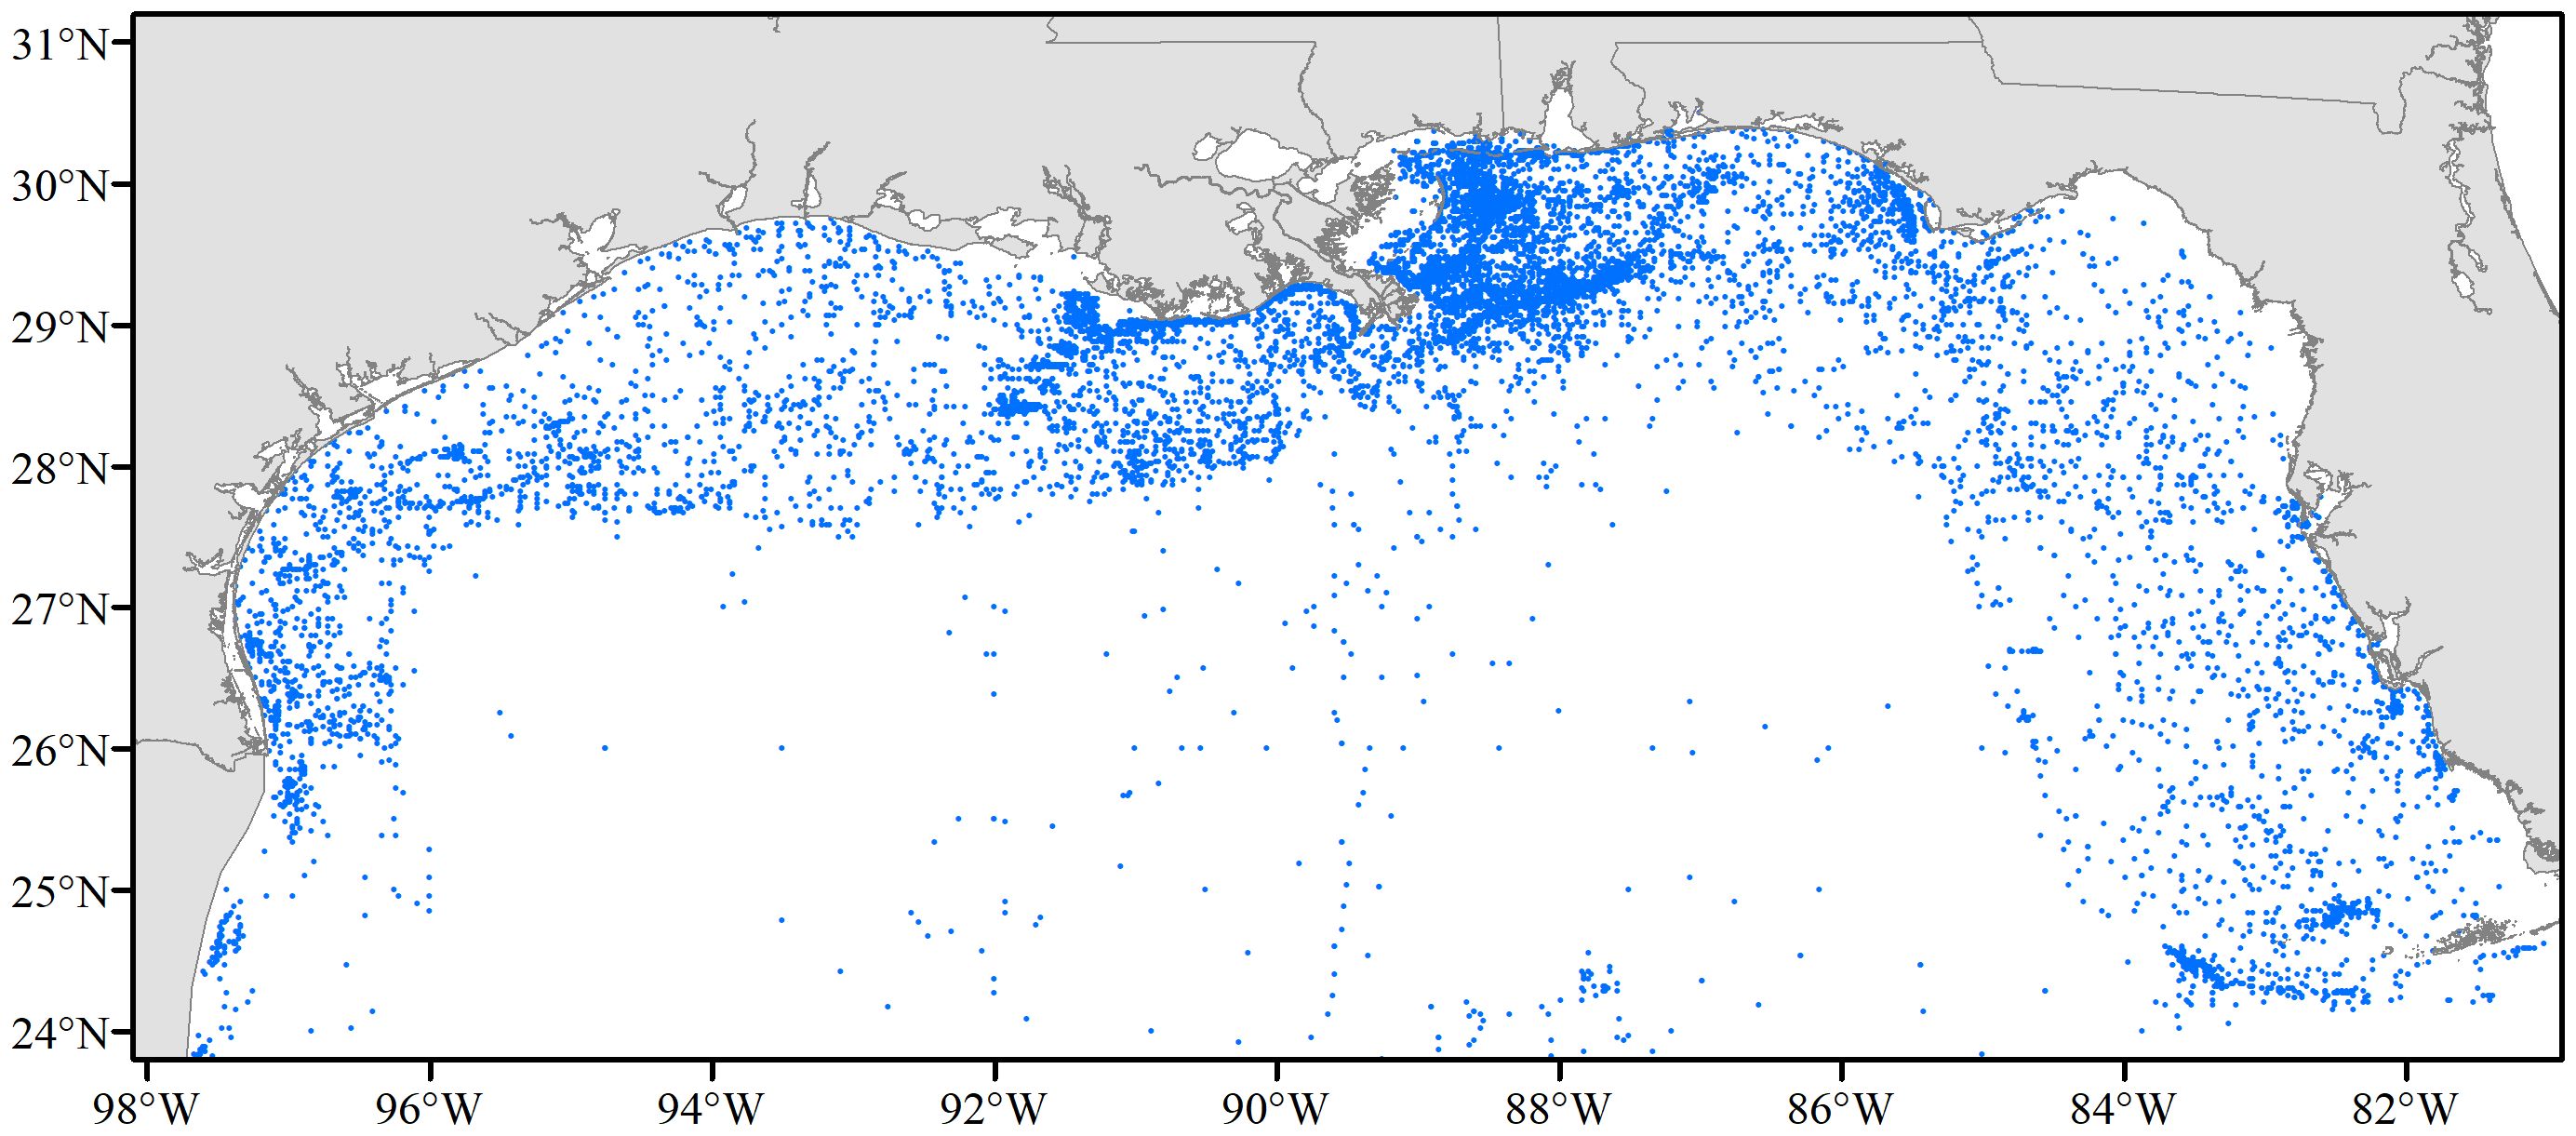
Figure 1. Distribution of stations sampled in the United States Gulf of Mexico during fishery-independent surveys conducted by the National Marine Fisheries Service (NMFS) from 1950 – 1971.
In the GOM, bottom trawls were the most common gear used during these early surveys, partly due to the importance of the shrimp fishery in the region (Springer and Bullis, 1956). Trawling operations were not standardized, and various trawl gear and configurations were used, including multiple-sized trawls and door combinations with varying tow durations (Bullis, 1964; Bullis and Thompson, 1970). Typically, shrimp trawling coverage was limited to two depth strata: 20 – 75 fm (36.6 – 137.2 m) for brown shrimp Farfantepenaeus aztecus, pink shrimp F. duorarum, and white shrimp Litopenaeus setiferus and 175 – 330 fm (320 – 603.5 m) for royal red shrimp Pleoticus robustus, and the work was conducted by a variety of vessels with varying lengths and capabilities (Springer and Bullis, 1956; Bullis and Thompson, 1967).
There was a pronounced shift in the fundamental approach of the program between 1964 and 1971. While still exploratory, surveys became more systematic and focused on producing an inventory of marine organisms in the southeastern U.S. and GOM (Bullis and Thompson, 1967). Trawl surveys were conducted throughout the year, but sampling efforts were inconsistent from year to year. Due to the lack of standardization, data provided during this early period do not represent a reliable fishery-independent time series and cannot be used to draw inferences about population structure over time (Nichols, 2004a). However, the trawl surveys did provide valuable information on presence, abundance, and species composition at specific locations and times (Chittenden and Moore, 1977; Darnell et al., 1983; NOAA, 1985; Darnell and Kleypas, 1987); accordingly, records, numbers and weights of species caught in the tows were informative for distributional analyses. In 1970, the U.S. Fish and Wildlife Service’s Bureau of Commercial Fisheries became the National Oceanic and Atmospheric Administration’s NMFS, with the new task of managing the U.S. fisheries (NOAA Fisheries, 2022b).
2.2 A standardized survey to address management needs (1972 – 1980)
In 1972, the commercial groundfish industry raised concerns about declining CPUE in the GOM, particularly for Atlantic croaker Micropogonias undulatus, which accounted for roughly 70% of landings at that time (Gutherz, 1977). Discussions were held among commercial fishers and state and federal fisheries managers to address these concerns (Juhl et al., 1973). As a result, the GSMFC Technical Coordinating Committee adopted a measure to develop the Oceanic Resource Surveys and Assessment (ORSA) program. The ORSA program was designed to evaluate the industrial (i.e., non-food fish) and commercial (i.e., food fish) groundfish fishery in the northern GOM, and provide information on availability, abundance, and status of the fisheries resources. Over time, the ORSA program evolved to address all demersal species available to bottom trawls and not just those of commercial importance (NMFS, 1975).
The ORSA program implemented the first resource assessment surveys utilizing a stratified random sampling design and standardized trawl gear configuration (now recognized as the 42 ft (12.8 m) SEAMAP groundfish trawl, GSMFC, 2019) to collect quantitative and qualitative biological and environmental data (NMFS, 1975) during the fall season (primarily October and November). The initial 1972 study area fell between 94.5° N and 85.5° W between depths of 5 and 50 fm (9.1 and 91.4 m) and was divided into a single primary spatial stratum (central) and two (eastern and western) secondary spatial strata (Figure 2; Juhl et al., 1974). The primary and secondary areas were defined on the relative faunal densities of commercial groundfish (e.g., Atlantic croaker, spot Leiostomus xanthurus, sand seatrout Cynoscion arenarius, and silver seatrout C. nothus) based on commercial fishing landings data. The central area was the target of the majority of sampling due to its inclusion of the primary fishing grounds of the commercial groundfish industrial fleet (Roithmayr, 1965), while the secondary strata were only sampled as time permitted (Nichols, 2004a). The minimum depth boundary was based on the operational limit of NOAA Ship Oregon II, and the outer depth limit was the expected outer boundary of commercially profitable catches of targeted groundfish and shrimp species (Nichols, 2004a). The defined study area was not inclusive of the full spatial range of the multi-species groundfish stock, but rather an area targeting the greatest densities, as it was considered impossible to study the entire distributional range of desired fishes due to workforce, budgetary, and logistical constraints.
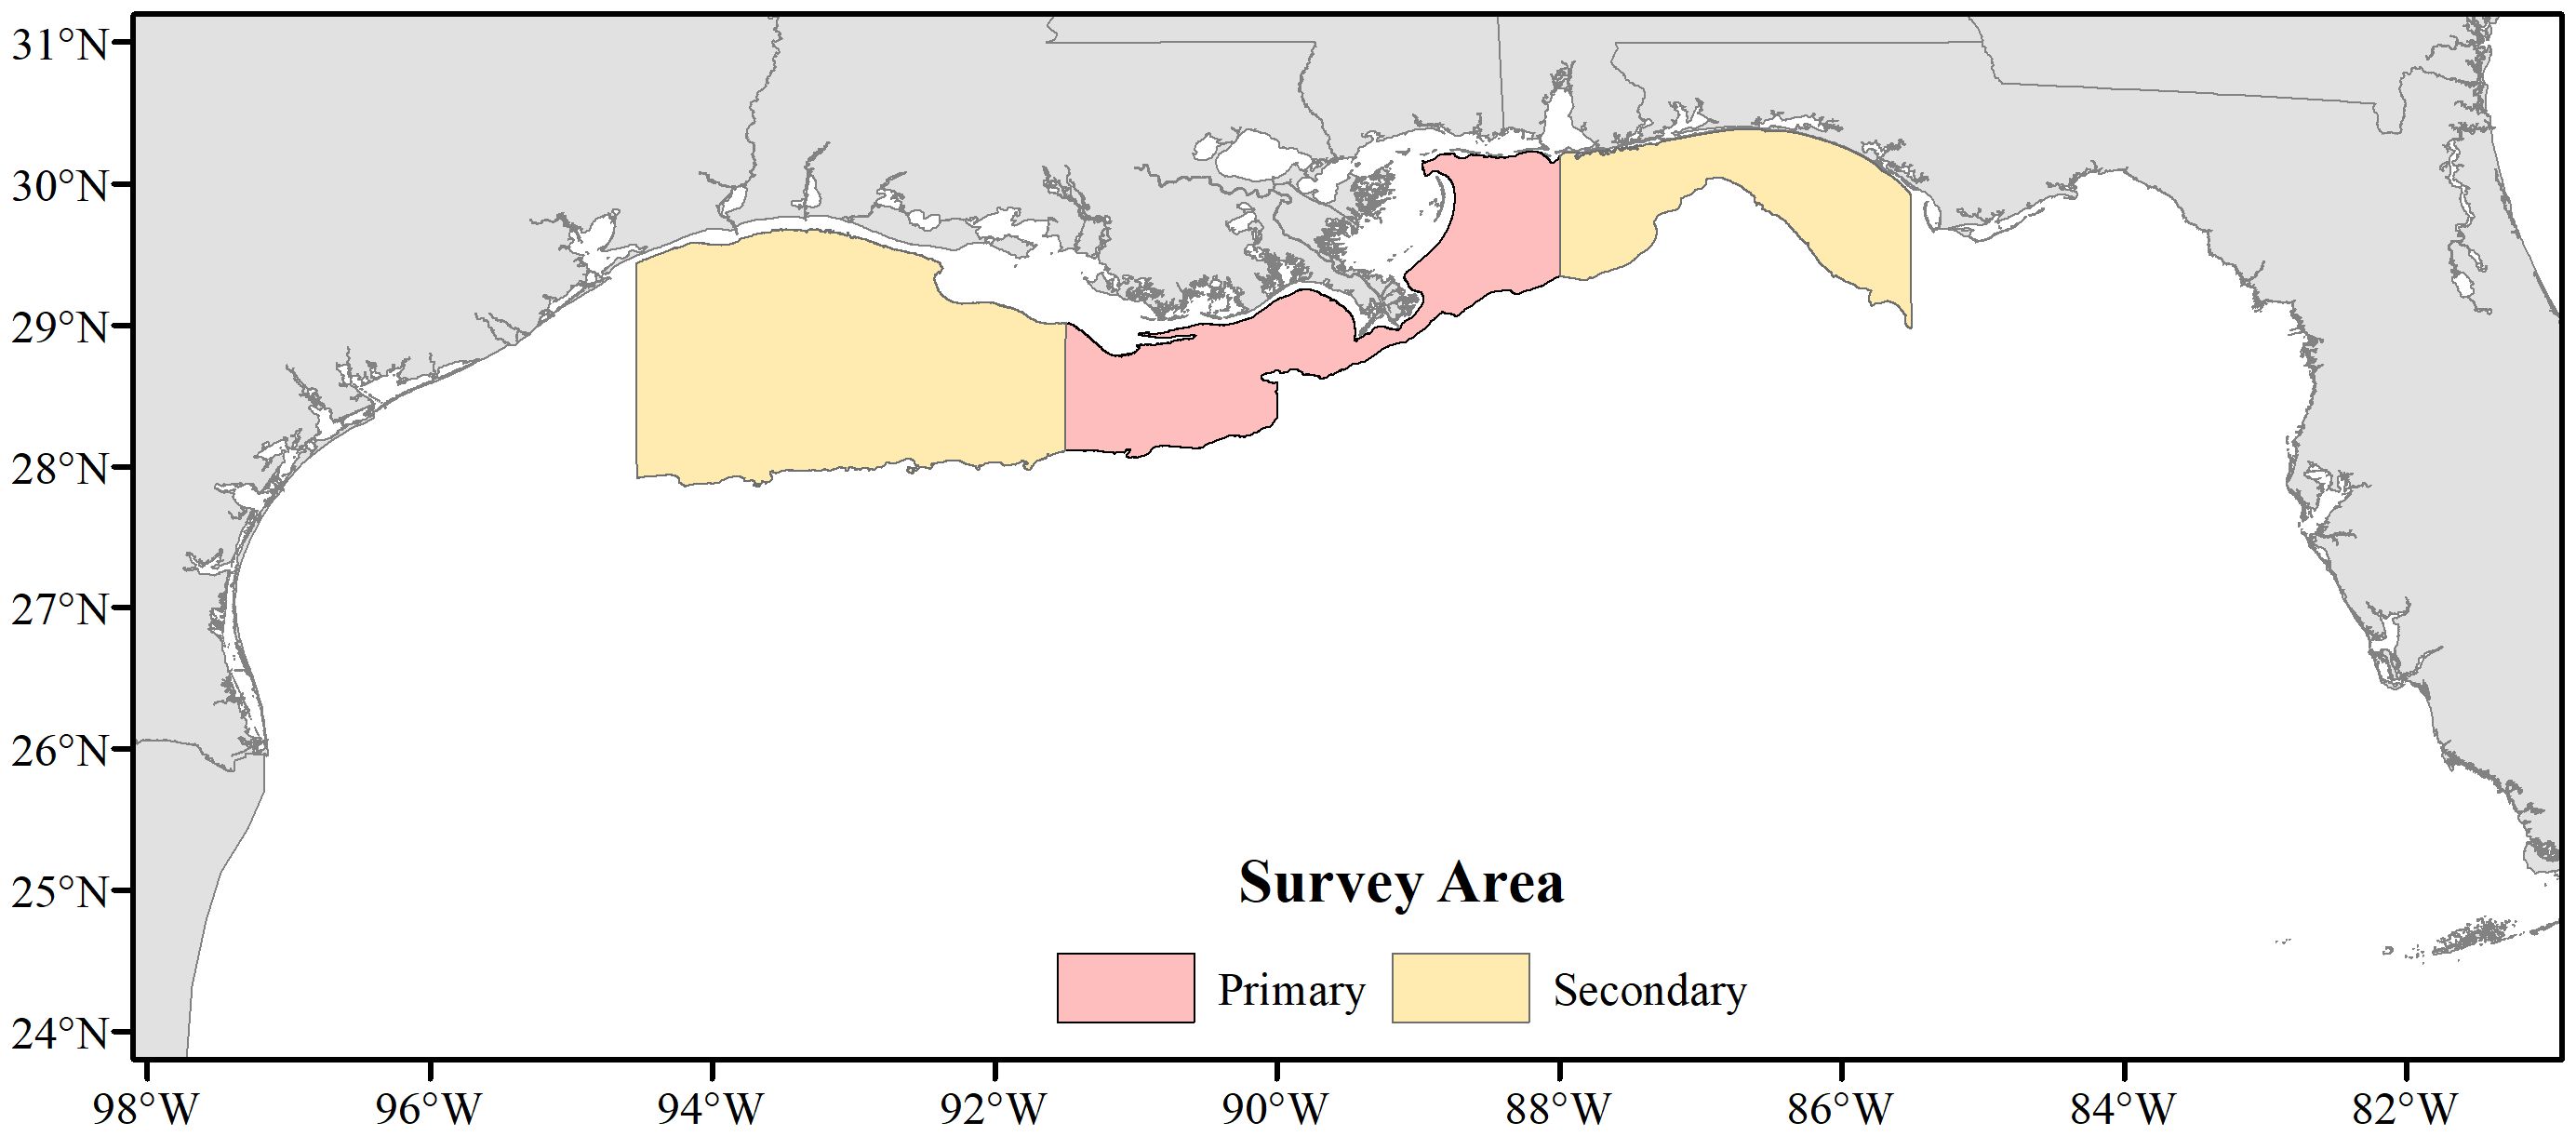
Figure 2. Spatial extents of the National Marine Fisheries Service (NMFS) Fall Groundfish Survey (1972 – 1984).
Random site placement within strata was determined by first selecting a random (with replacement) 10 minute (~18.5 km) block of latitude and longitude and then randomly selecting (without replacement) a smaller 2.5 minute (4.6 km) grid of latitude by longitude within the block (i.e., block-grid design; Nichols, 2004a). The total number of blocks, grids and sites for each area was based on the available number of days at sea (Table 1). Up to three 10 minute tows were targeted for sampling within each grid and predominantly towed parallel to depth contours, which was the practice of the commercial fleet (Nichols, 2004a). However, in many cases, fewer tows were conducted, with the actual number of tows often determined by remaining available time at sea for the survey and the amount of catch in the first tow. Three shorter duration tows were employed rather than a single longer tow due to high catch rate variation among tows attributed to the patchy distribution of fauna.
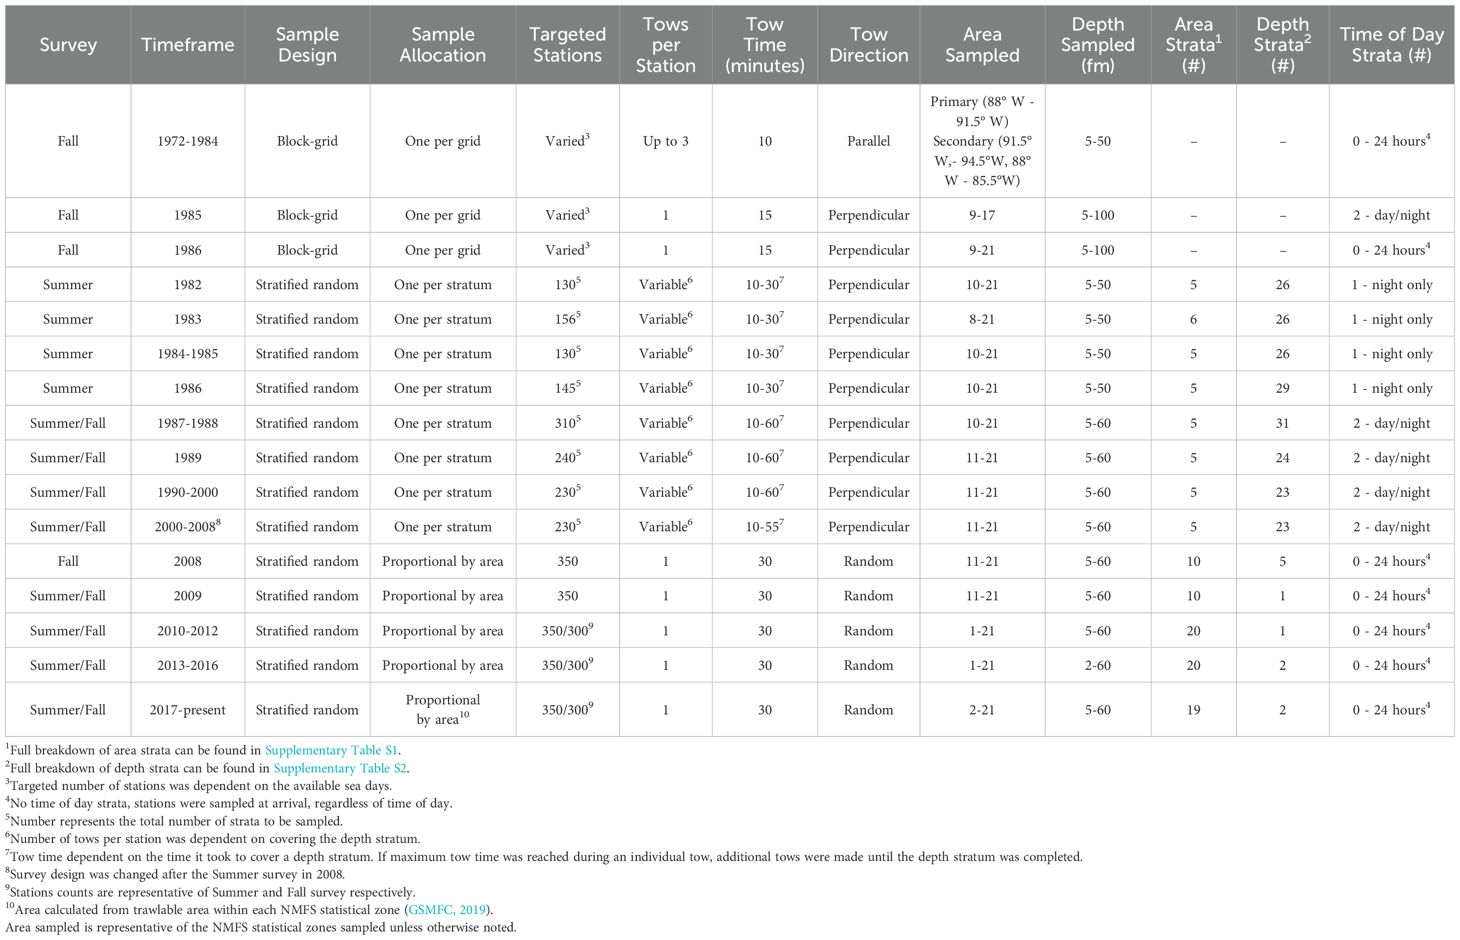
Table 1. Summary of the survey design parameters for the groundfish surveys conducted in the Gulf of Mexico from 1972 to present.
2.3 Initiation of SEAMAP (1981 – 2008)
The Southeast Area Monitoring and Assessment Program (SEAMAP) was initiated in 1981 with the objective of establishing a collaborative program between state, federal, and academic scientists for the collection, management and dissemination of fishery-independent data in the U.S. GOM (Stuntz et al., 1985). SEAMAP is funded through a series of grants from the NMFS, with the main objective to “provide essential fishery independent data and analyses for evaluating the status of the Nation’s fisheries through the SouthEast Data, Assessment and Review (SEDAR) process, while supporting regional fishery management councils and enhanced requirements of the Magnuson-Stevens Reauthorization Act” (SEAMAP, 2024). That same year, NMFS initiated a summer groundfish survey in response to a request to study the effects of the “Texas Closure”, an approach to shrimp management implemented following the passage of the Texas Shrimp Conservation Act of 1959. The closure consisted of a 45 to 60 day period during which no trawling was allowed in the Texas Territorial Sea (waters under state jurisdiction) from about mid-May to mid-July. Starting in 1981, by request, NMFS extended this closure to the Exclusive Economic Zone (i.e., waters under federal jurisdiction). The objective of the closure was to allow shrimp to grow larger prior to harvest to reduce the amount of undersized shrimp being discarded while also increasing market prices for harvested shrimp (Nance, 1993; Fuls, 2001).
The following year, SEAMAP established a summer groundfish survey based on results from the Texas Closure study, and sampling protocols developed by the SEAMAP Shrimp and Bottomfish Sampling Gear Workshop (Watson and Bane, 1985). The working group recommended adopting the same 42 ft net used during the ORSA program surveys and similar deployment protocols. Since most of the Texas shrimp landings consist of two nocturnal species, brown and white shrimp, samples were originally collected at night only. Sample sites were randomly allocated to strata based on depth zones and area, with equal sampling across all strata (Stuntz et al., 1985). Twenty-six depth strata were defined between 5 and 50 fm (9.1 and 91.4 m; Table 1; Supplementary Table S1). Area strata were based on NMFS statistical zones (hereafter, statistical zones) which were originally used to report shrimp landings (Kutkuhn, 1962; Supplementary Figure S1). The area covered statistical zones 10 – 21 with each stratum defined by grouping two or three zones (Figure 3A). A full breakdown of the area strata and depth strata can be found in Supplementary Tables S1 and S2, respectively. The groundfish survey was expanded in 1983 to include the spatial area to Apalachicola, Florida (FL) (85° W; statistical zones 8 and 9; Figure 3B). However, this eastward expansion was quickly abandoned due to increased interaction with untrawlable bottom and damage to trawl nets and the survey’s spatial extent reverted to the area originally developed in 1982 (Nichols, 2004a; Figure 3A). Specific information about the methods that were used to conduct the tows can be found in Table 1.
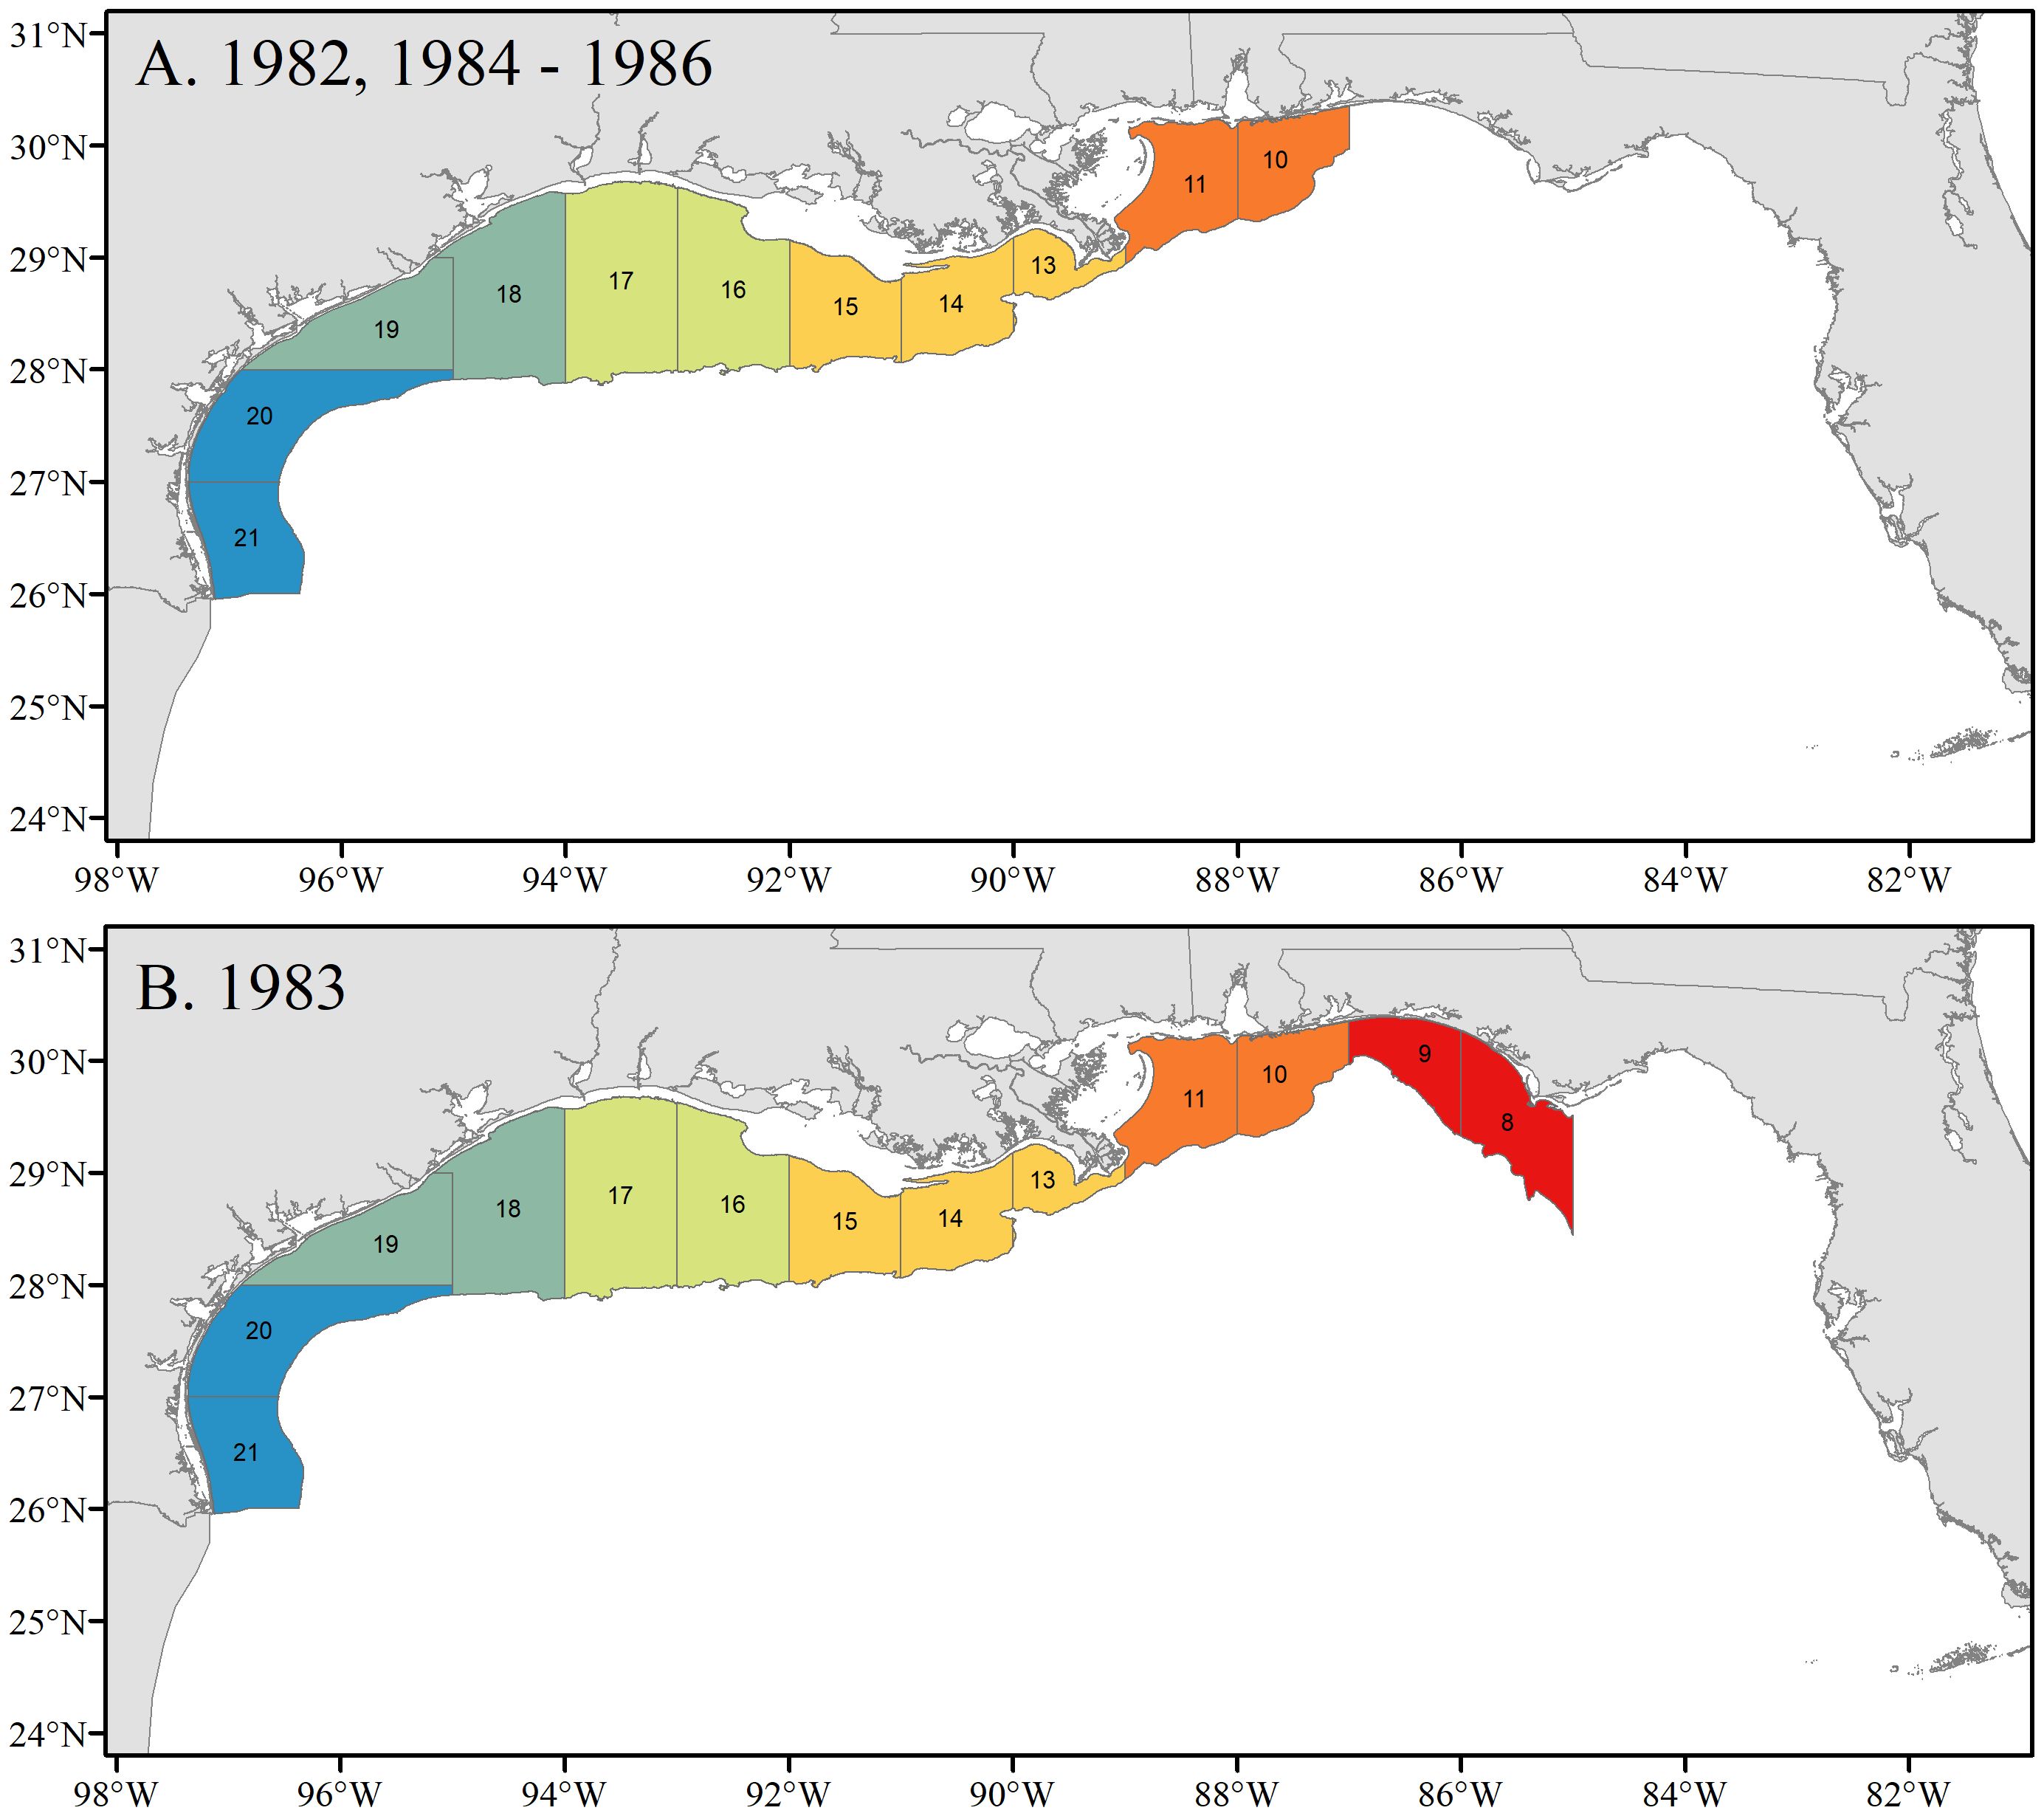
Figure 3. Spatial extents of the Southeast Area Monitoring and Assessment Program (SEAMAP) Summer Shrimp/Groundfish Surveys in (A). 1982 and 1984 – 1986 and (B). 1983. Numbered blocks indicate National Marine Fisheries Service (NMFS) statistical zones. Individual colors represent statistical zones that were paired as area strata.
In 1985, SEAMAP initiated the Fall Groundfish Survey incorporating the NMFS Fall Groundfish Survey. The 1985 and 1986 SEAMAP Fall Groundfish Surveys utilized the NMFS block-grid sample allocation, but with sampling within grids limited to a single 15 minute tow in an effort to expand spatial coverage (Nichols, 2004a). The time saved by conducting only a single tow allowed for the spatial expansion of the study area from Rosemary Beach, FL (86° W) to Sabine, Louisiana (LA) (94° W) (Figure 4A), with the maximum depth extended to 100 fm (182.9 m). The survey was further expanded in 1986 to include the spatial area from Sabine, LA (94° W) to the Texas-Mexico border (Sanders et al, 1990a, Figure 4B). The fall groundfish survey expansion served to increase the scope of the survey to better assess the distribution and abundance of many species, particularly brown and white shrimp, throughout the region. It also served to increase the usefulness of the data in stock assessments (e.g., red snapper Lutjanus campechanus, SEDAR, 2022). Sampling from 60 to 100 fm (109.7 to 182.9 m) was dropped with the intent to align the fall groundfish survey with the summer groundfish survey design, and partly due to the small segment of the survey area actually covered from 60 to 100 fm (109.7 to 182.9 m, Nichols, 2004a).
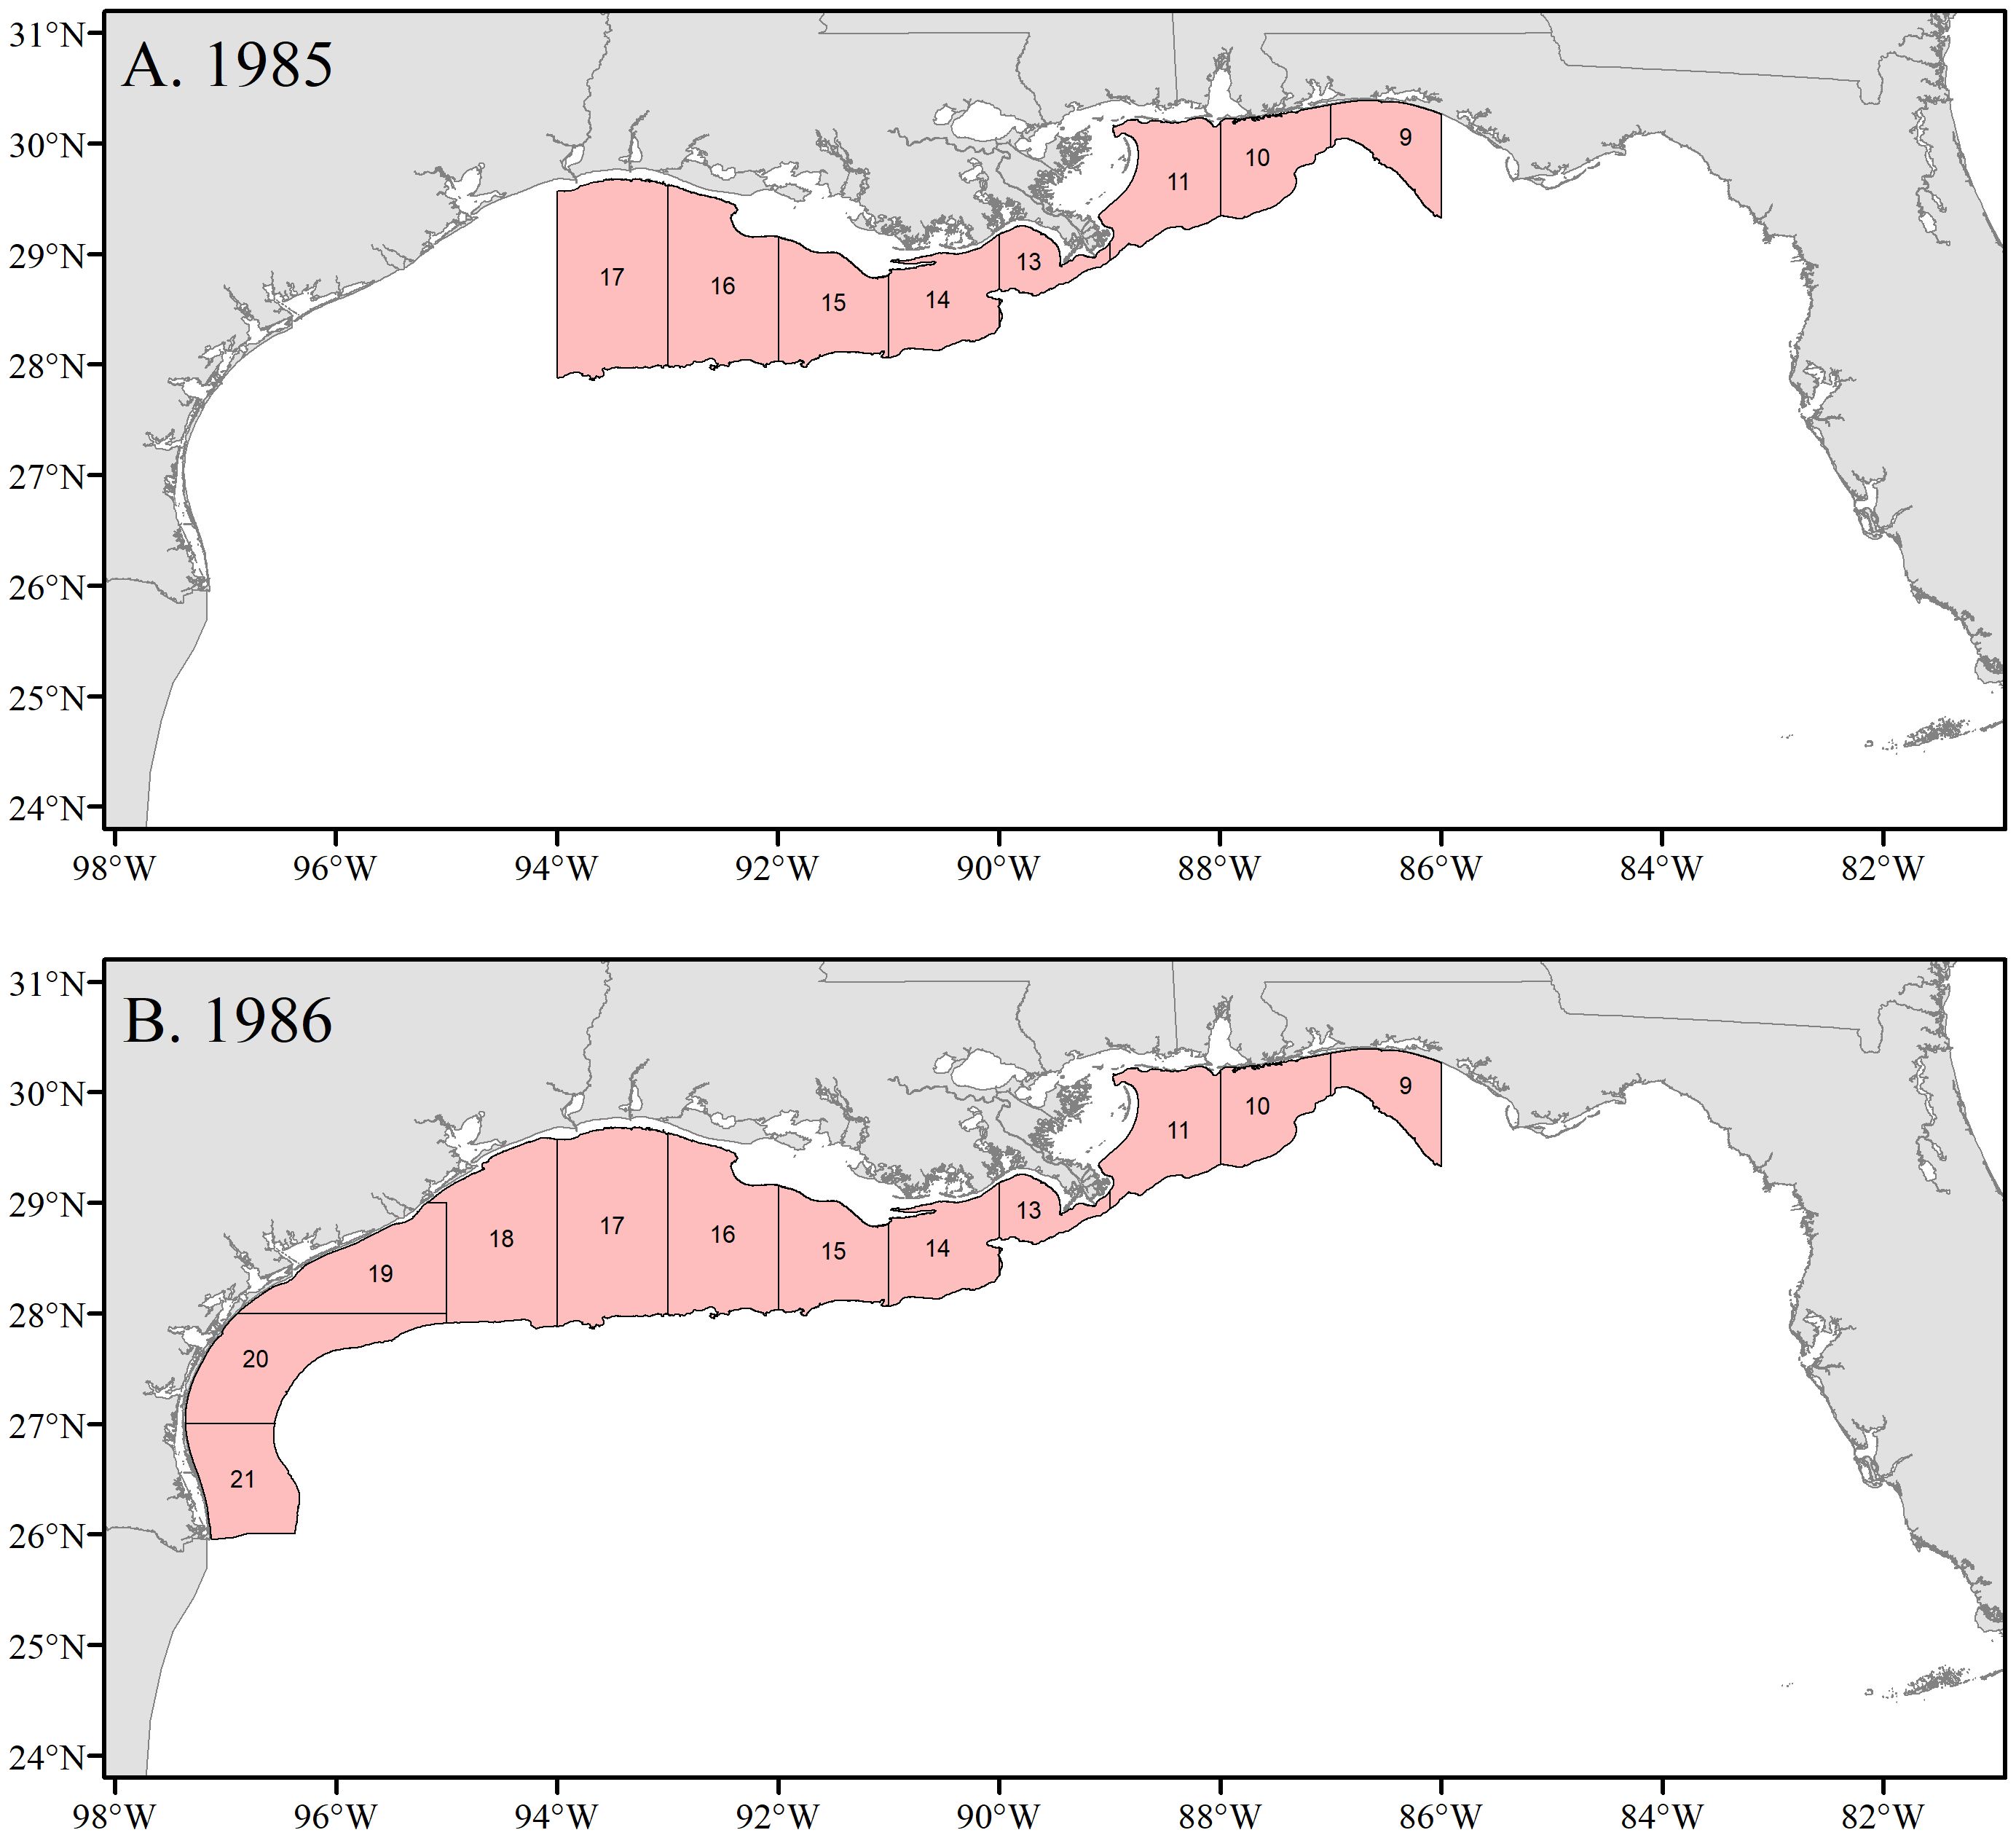
Figure 4. Spatial extents of the Southeast Area Monitoring and Assessment Program (SEAMAP) Shrimp/Groundfish Fall Surveys in (A) 1985 and (B) 1986. Numbered blocks indicate National Marine Fisheries Service statistical zones.
In 1987, the summer and fall groundfish surveys adopted the same sampling protocol and spatial extent (Pensacola, FL to Brownsville, Texas (TX), statistical zones 10 – 21), thereby standardizing data collection for the two seasons and providing seasons as another variable of interest (Figure 5A). At this time three changes were introduced to the groundfish survey: (1) a diurnal stratum (day/night) was incorporated into the design, meaning that a full set of daytime and nighttime samples were collected in each combination of area and depth strata, (2) two additional depth strata were added to extend depth coverage to 60 fm (109.7 m), and (3) the maximum tow duration was extended to 60 minutes (Sanders et al., 1990b). Between 1988 and the summer of 2008 only three minor modifications were made to the SEAMAP groundfish survey sampling design: (1) depth strata were collapsed in 1989 and 1990 (Sanders et al., 1991, 1992; Table 1; Supplementary Table S1), (2) statistical zone 10 was dropped from the survey universe in 1989 because of the increased number of obstructions in the area as Alabama expanded its artificial reef permitting area (Nichols, 2004a; Figure 5B), and (3) maximum tow times were limited to 55 minutes in 2000 due to concerns over sea turtle bycatch, as turtle excluder devices are not used in the trawl net.
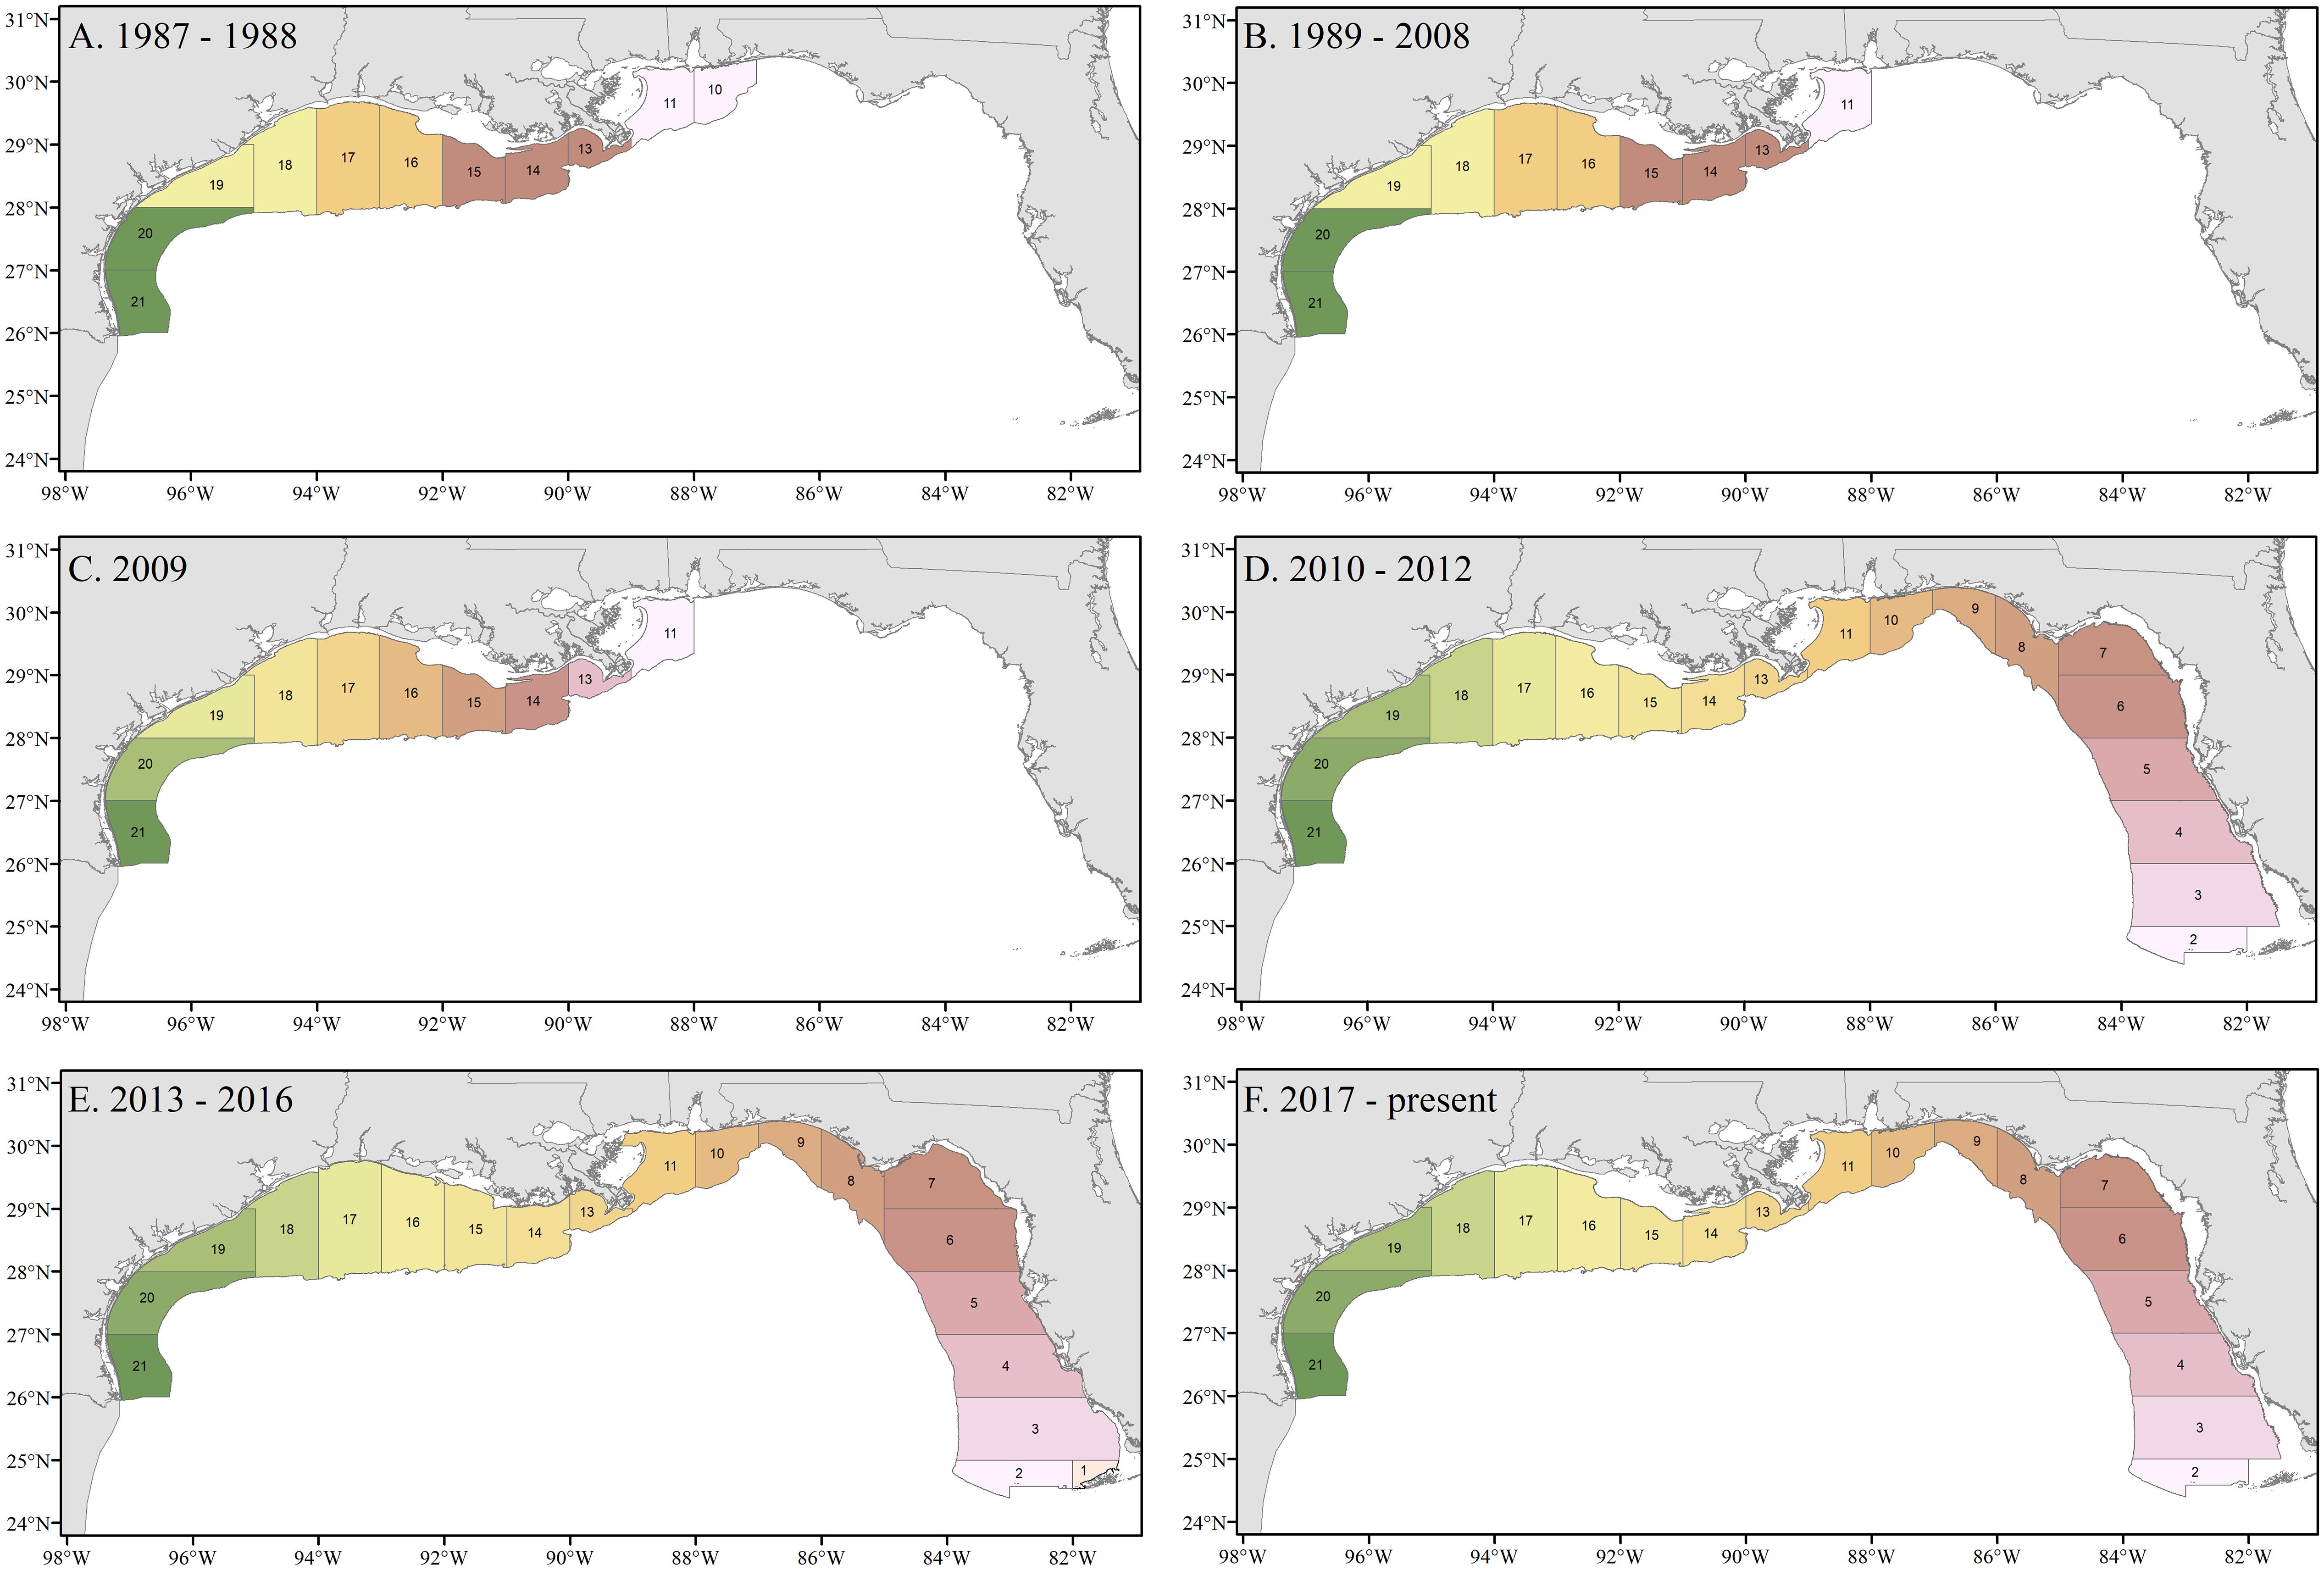
Figure 5. Spatial extents of the Southeast Area Monitoring and Assessment Program (SEAMAP) Summer and Fall Shrimp/Groundfish Surveys in (A) 1987 – 1988, (B) 1989, (C) 2009, (D) 2010 – 2012, (E) 2013 – 2016, and (F) 2017 – present. Numbered blocks indicate National Marine Fisheries Service (NMFS) statistical zones. Individual colors in (A, B) represent statistical zones that were paired as area strata while those in panels (C, F) represent its own strata.
2.4 Survey design change (2008) and expansion to the West Florida Shelf (2010)
In the fall of 2008, the SEAMAP groundfish surveys undertook a series of significant changes that were intended to increase the usefulness and applicability of the data. These changes were implemented to increase survey efficiency by: (1) transitioning to a stratified random sampling design with effort proportional to the spatial area of each statistical zone between 5 and 60 fm (9.1 and 109.7 m; Figure 5C), (2) implementing a standardized 30-minute tow time for all samples, and (3) eliminating the day/night stratification (GSMFC, 2009). With the dropping of the day/night stratification, stations could be towed whenever they were reached, as opposed to having to wait for sunrise or sunset under the previous design, which designated when certain stations could be sampled. Under the new survey design, the number of stations sampled was expected to increase, which in turn, would lead to a reduction in the coefficient of variation (CV) in the time series (Ingram, 2008). Several changes to the depth strata were initiated between 2008 and 2013 to better distribute the sampling effort throughout the survey area and increase station density from the standard 230 stations to a target of 350 stations (Table 1).
The official spatial extent of the summer and fall groundfish surveys continued to range from Brownsville, Texas (TX) to Mobile Bay, Alabama (AL) (statistical zones 11 – 21) through 2009 (Figure 5C). Concurrently, the SEAMAP received supplemental funding that allowed the state of Florida to begin experimental groundfish surveys over the West Florida Shelf (WFS) in 2008 and 2009 using similar protocols to those implemented by the summer and fall groundfish surveys (Figure 5D). Based on the success of the experimental sampling, SEAMAP groundfish surveys were expanded GOM-wide in 2010 to include the area from Mobile Bay, AL to Key West, FL (statistical zones 2 to 10). The decision to expand the fishery-independent trawl sampling into the eastern GOM was based on recommendations by the SEDAR Red Snapper Update Assessment Workshop Committee (SEDAR, 2009). The recommendation was derived from the need to obtain essential information concerning age 0 and age 1 red snapper, as well as other managed species occurring in the eastern GOM (e.g., red grouper Epinephelus morio and gray snapper Lutjanus griseus). The groundfish survey expansion provided gulf-wide coverage, but at the expense of reduced sampling effort within statistical zones 11 through 21 as days at sea remained relatively constant after the expansion. The increased station allocation of 350 stations was now spread across the entire survey area (statistical zones 1 – 21).
After the groundfish survey expansion onto the WFS, there was also an attempt to investigate the composition of catch inside of the 5 fm (9.1 m) line with an additional depth strata added from 2 to 5 fm (3.7 to 9.1 m) in 2013 (Figure 5E). However, this was only possible for statistical zones 2 – 17 because of the depth limitation of the NOAA Ship Oregon II, which conducts all sampling in statistical zones 18 – 21. Sampling in waters less than 5 fm (9.1 m) was ended in 2017 due to the lack of gulfwide coverage (Shrimp/Groundfish Work Group, 2017; Figure 5F).
In 2017, there was a refinement to the SEAMAP groundfish surveys area. While the spatial extent of the survey remained unchanged (statistical zones 2 – 21), untrawlable areas within the statistical zones were removed and the area of each statistical zone/depth strata was recalculated (Figure 6). These changes were made to better reflect the available trawlable habitat within the survey area and to help avoid obstructions, which damage the gear, as well as sensitive live bottom areas (Hanisko et al., 2018). Under the current design, the spatial coverage for the survey ranges from Key West, FL to Brownsville, TX (statistical zones 2 – 21, excluding 12) at depths of 5 to 60 fm (9.1 to 109.1 m), which includes the core area of the initial SEAMAP groundfish surveys design. Random sampling with proportional allocation of stations by area within the statistical and depth strata is used to select the stations, with a target of 350 stations for the summer survey and 300 stations for the fall survey (Table 1).

Figure 6. Current spatial extent of the Southeast Area Monitoring and Assessment Program (SEAMAP) Summer Shrimp/Groundfish Surveys. Blue shaded areas represent the trawlable area within each National Marine Fisheries Service (NMFS) statistical zone, while the untrawlable areas are shaded in yellow.
3 Evaluation of groundfish survey design change
3.1 Assessing change
One of the main reasons for changing the groundfish survey design was to increase survey efficiency (measured in stations sampled per day), which would lead to an increase in the number of stations sampled during each survey. Using data from 1987 to 2022 from the statistical zones 11 – 21, the average number of stations sampled per day by the NMFS was calculated to determine the survey efficiency of the different sampling designs during the old survey design (1987 – summer 2008), new survey design - expanded sampling years (fall 2008 – 2009) and the new survey design – full GOM sampling (2010–2022).
To examine if the survey design change in 2008/2009 affected the trends of the relative abundance indices and their respective CV of the mean (SE/Mean), delta-lognormal models were fit for a suite of species commonly caught in the survey. The relative abundance index computed by this method is a product of yearly abundance estimates from two distinct generalized linear models: a binomial (logistic) model that describes proportion of positive abundance values (i.e., presence/absence) and a lognormal model, which describes variability in only the nonzero abundance data (i.e., CPUE in number per hour; Lo et al., 1992; Ingram et al., 2017). The submodels of the delta-lognormal model were built using a backward selection procedure based on type 3 analyses with an inclusion level of significance of α = 0.05 (Ingram et al., 2017). Variables that could be included in the submodels were year (1987 – 2022), time of day (day/night), statistical zone (11 – 21), and depth (fm). Data were limited to statistical zones 11 – 21 to evaluate relative abundance trends and impacts to CVs over a common survey area. Species that were analyzed included Atlantic croaker, brown shrimp, gray triggerfish Balistes capriscus, longspine porgy Stenotomus caprinus, red snapper, and white shrimp. Separate abundance indices were calculated for the SEAMAP Summer and Fall Groundfish Surveys to account for any seasonal changes that may have affected the survey design. All of the abundance indices presented hereafter were scaled to a mean of one to make comparing different magnitudes of catch between species easier. The binomial and lognormal submodels were computed using the GLMMIX macro and MIXED procedure in the SAS software (ver. 9.4, Copyright © 2016 by SAS Institute Inc., Cary, NC, USA.).
3.2 Results
The design changes implemented in the fall of 2008 have been beneficial to the SEAMAP groundfish surveys with respect to survey efficiency, primarily due to the elimination of the day/night stratum and the reduction in tow times to 30 minutes. Historically, a complete groundfish survey under the original 1987 to 2008/2009 survey design would have consisted of 230 SEAMAP groundfish stations. Under the new survey design, sampling effort increased to an average of 350 stations (52% increase) throughout the historic survey area (Brownsville, TX to Mobile Bay, AL) for the fall 2008 and both the summer and fall surveys in 2009. Survey efficiency also increased from a mean of 7.7 (SD=0.78) stations sampled per day under the old survey design to 9.9 (SD=1.1) stations sampled per day under the new survey design over the historic area in 2008 and 2009. This increase in sampling across the historic survey area did lead to some reductions in the CVs for all species tested (Tables 2, 3), but was only observed during the periods of high, concentrated sampling efforts (e.g., fall of 2008 and summer and fall of 2009). This decrease in the CVs fulfilled the initial goal of the survey design change.
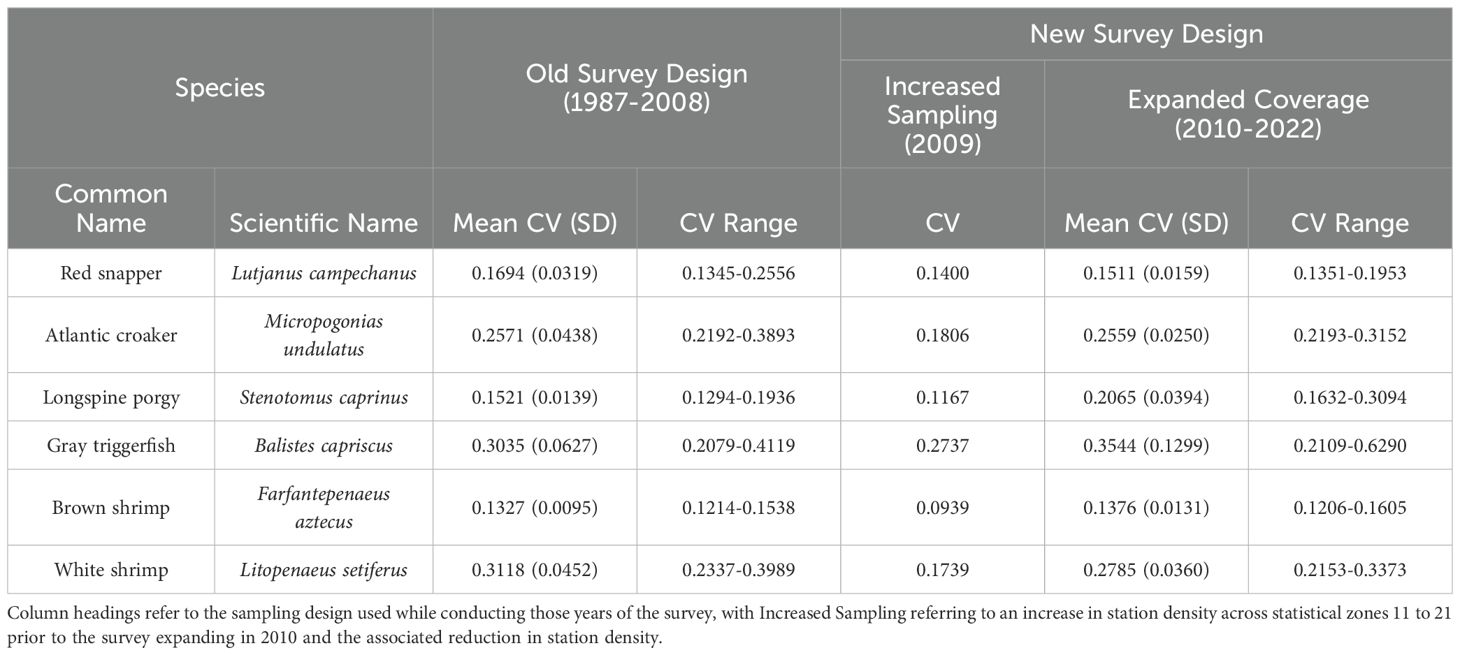
Table 2. Comparison of coefficients of variation (CV) and standard deviations (SD) from delta-lognormal models for selected species from the Southeast Area Monitoring and Assessment Program (SEAMAP) Summer Shrimp/Groundfish Survey conducted from 1987 to 2022 in National Marine Fisheries Service (NMFS) statistical zones 11 to 21.
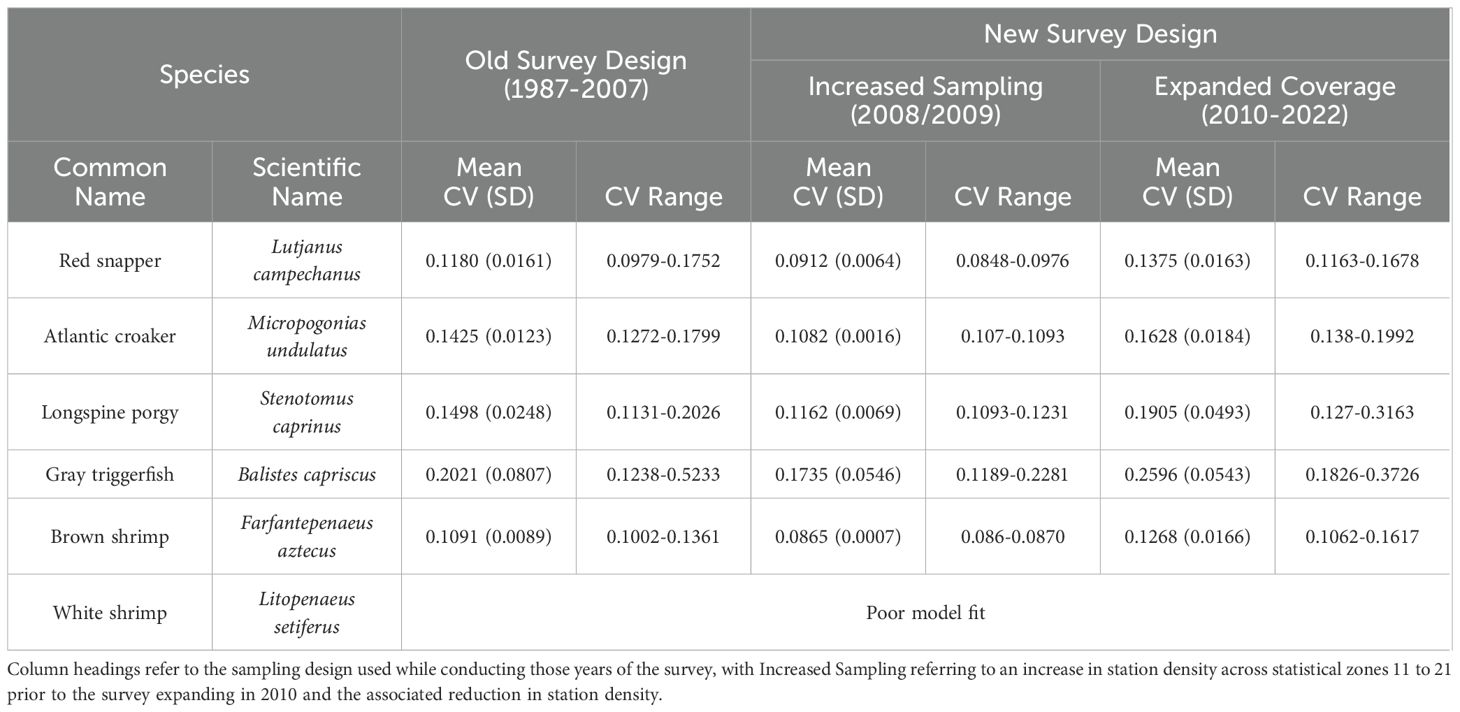
Table 3. Comparison of coefficients of variation (CV) and standard deviations (SD) from delta-lognormal models for selected species from the Southeast Area Monitoring and Assessment Program (SEAMAP) Fall Shrimp/Groundfish Survey conducted from 1987 to 2022.
Ultimately, the decision was made to expand survey coverage into the eastern GOM to better assess the distribution and abundance of species across a wider spatial extent and range of benthic habitats. The gains in efficiency inherent in the new survey design allowed for 7.2 (SD=0.80) stations sampled per day to remain near the 7.7 (SD=0.78) samples per day under the old survey design, all while covering nearly twice the original spatial extent. However, the expansion came at the cost of reduced sampling effort and increased CVs in the indices over the historic survey area. Under the new survey design (GOM-wide target of 350 stations), sampling effort in statistical zones 11 to 21 was reduced to roughly 181 stations, a significant reduction from the old survey design target of 230 stations and the 350 stations averaged during 2008/2009. Given the reduction in sample sizes, abundance indices CVs generated from the summer and fall groundfish surveys for the majority of selected taxa from statistical zones 11 – 21 under the new survey design were in line with those generated under the old survey design (Tables 2, 3).
When examining the relative abundance trends for the selected species, there were some differences between the survey designs. However, in most cases, there had already been increases or decreases in the years immediately preceding the survey design change, which makes it difficult to discern if they had an actual effect on the trends. For example, Atlantic croaker (Figure 7A), brown shrimp (Figure 7B), and white shrimp (Figure 7C) showed increases in abundance during the 2006 summer and fall groundfish surveys and increased values overall during the new design period, with the exception of white shrimp during the fall groundfish survey. However, the model fits for white shrimp during the fall groundfish survey were poor, evidenced by the large confidence intervals. Trends in red snapper abundance also increased after the survey design change during the summer groundfish survey, but were more erratic during the fall groundfish survey, which is most likely due to the fact the fall groundfish survey is mainly catching age 0 fish (Figure 7D). Gray triggerfish relative abundance trends did not seem to be affected by the survey design change (Figure 7E). Longspine porgy relative abundance trends have shown decreases since the survey design change in the summer and fall groundfish surveys, although in the fall groundfish survey the decrease occurs several years after the survey design change (Figure 7F). The final model results detailing the variables retained in each submodel and their significance can be found in Supplementary Tables S3 and S4 for the summer and fall surveys, respectively.
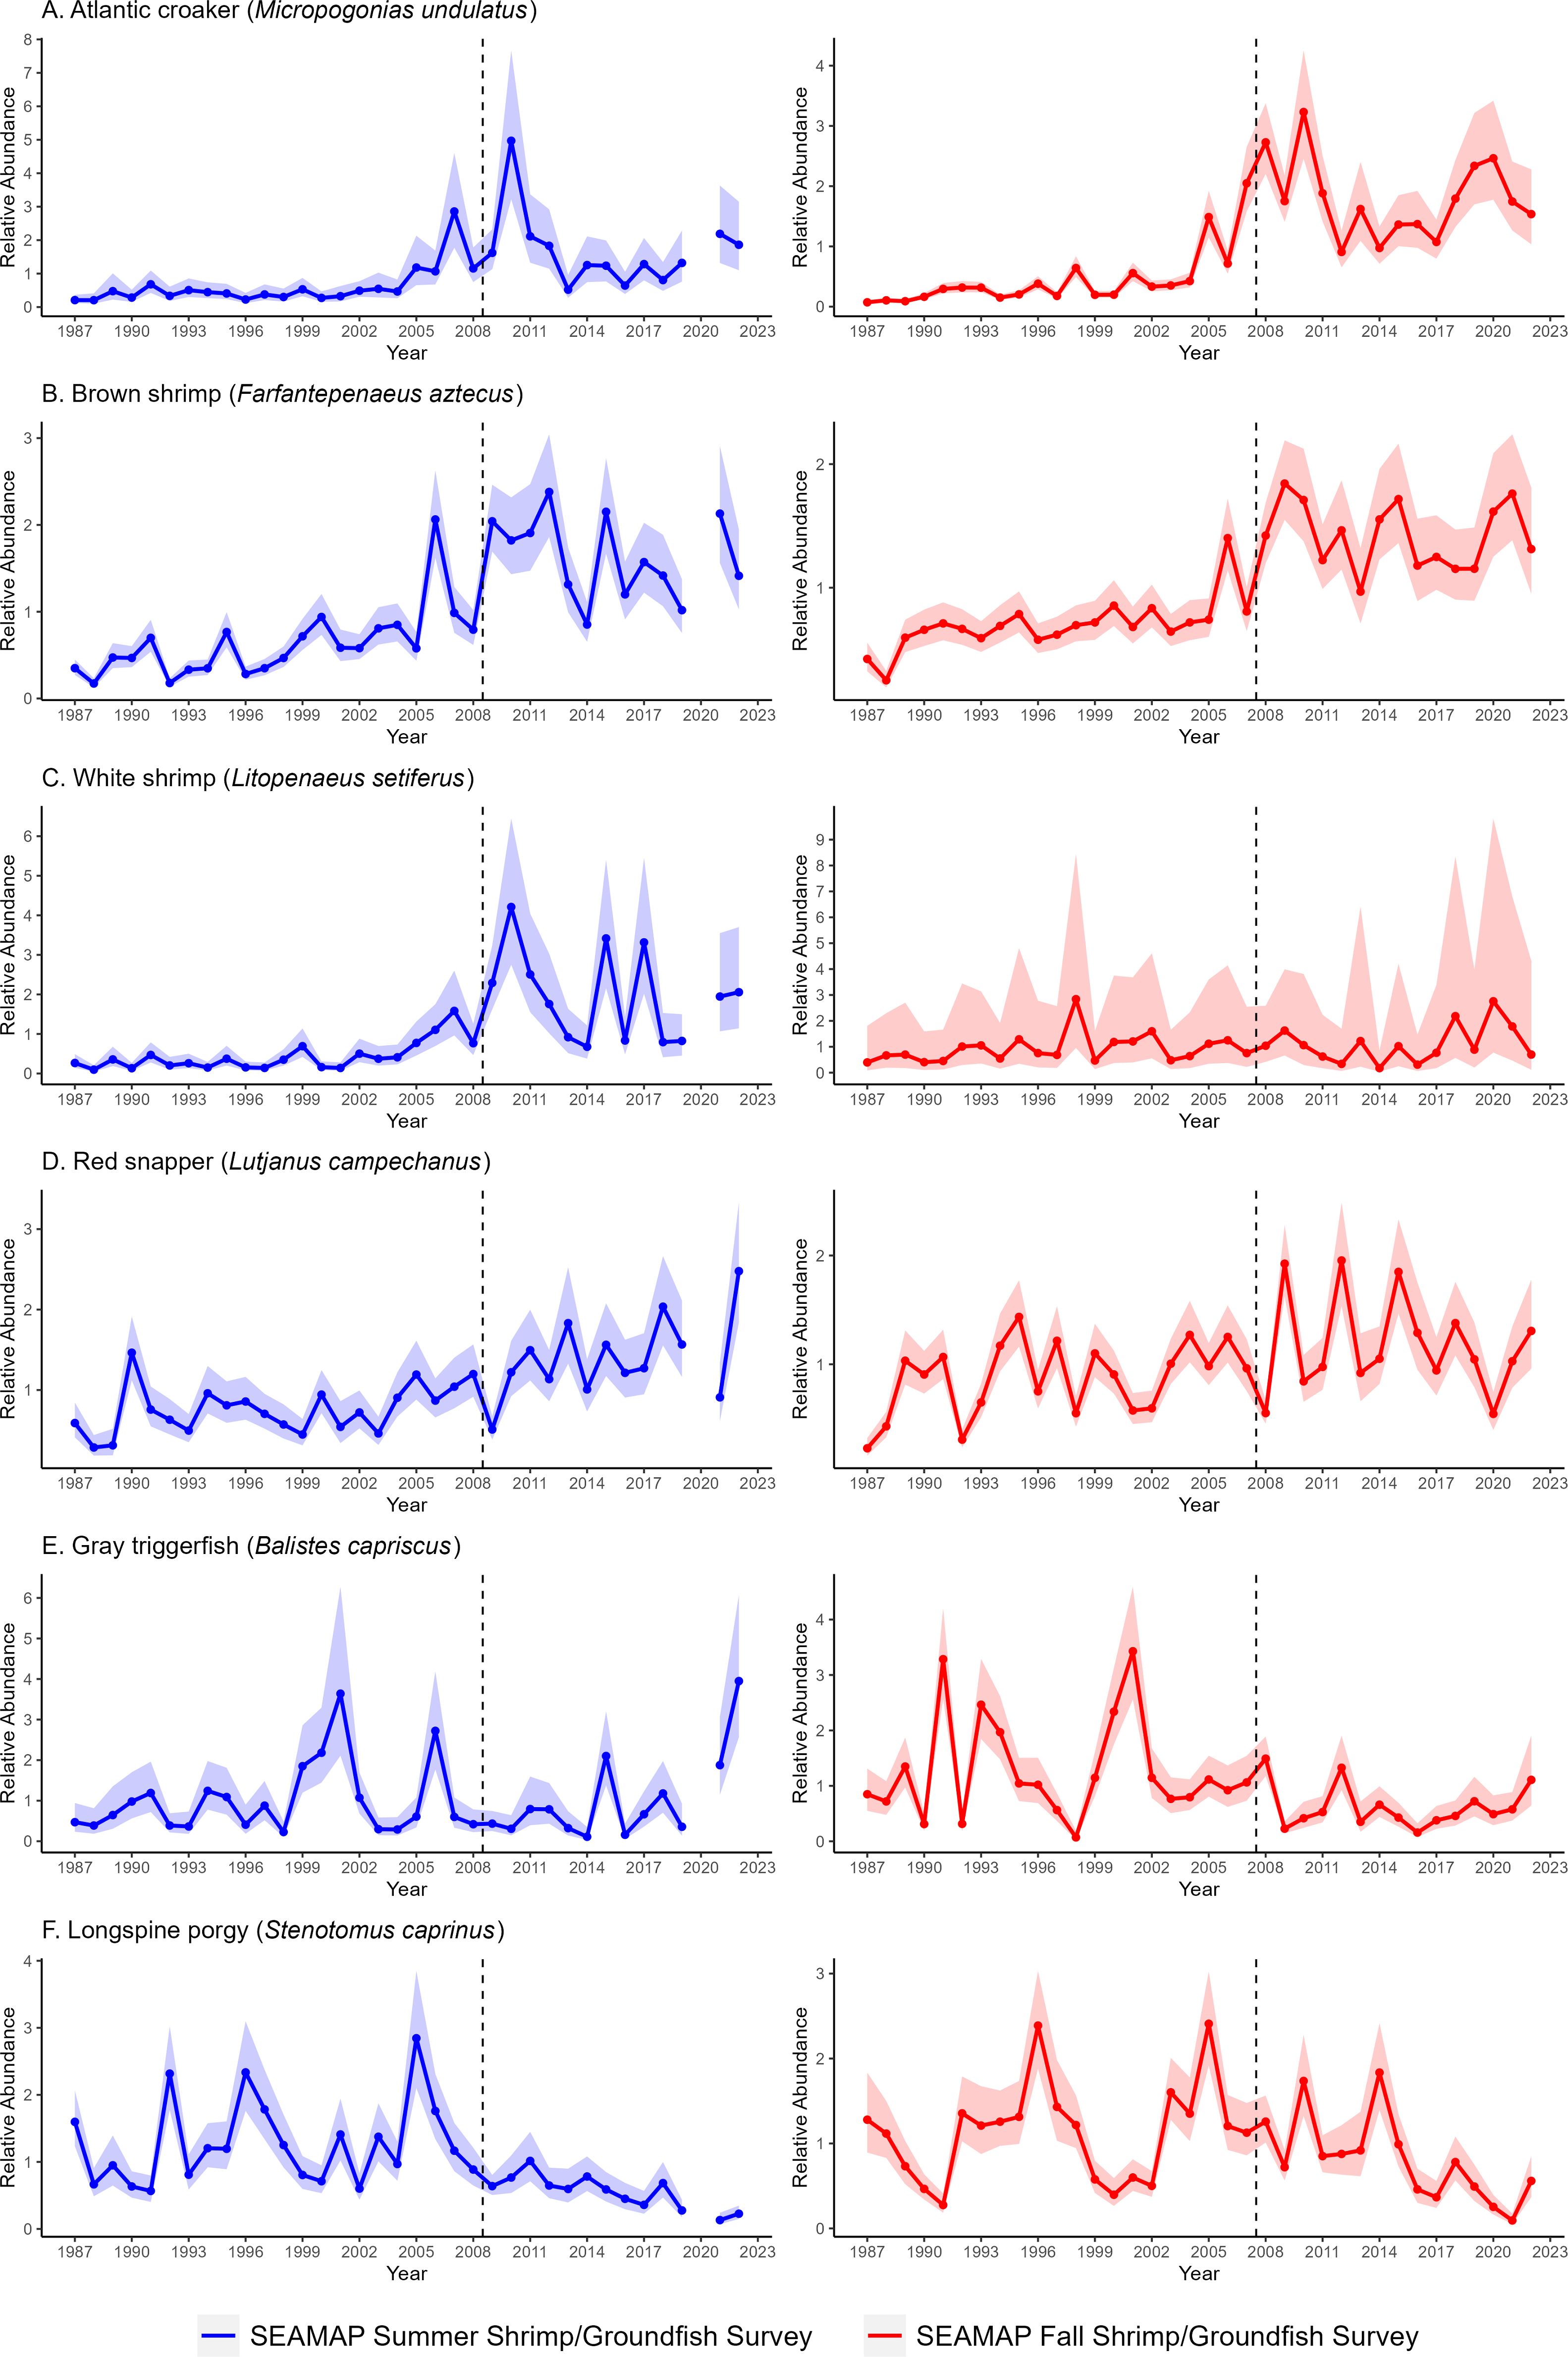
Figure 7. (A-F) Indices of relative abundance (scaled to a mean of one) for selected species from the Southeast Area Monitoring and Assessment Program (SEAMAP) Summer (blue) and Fall (red) Shrimp/Groundfish surveys conducted from 1987 – 2022 in National Marine Fisheries Service (NMFS) statistical zones 11 – 21. Shaded areas represent the lower and upper 95% confidence intervals. Dashed lines denote implementation of survey design changes.
4 Evaluation of spatial survey expansion
4.1 Evaluation methods
One of the main motivations for the eastern expansion of the SEAMAP groundfish surveys was to more accurately capture species diversity in the GOM in support of ongoing ecosystem modeling efforts (Ainsworth et al., 2015; Chagaris et al., 2020) and to better understand the spatial range of commercially and recreationally important species (Grüss et al., 2018; Figure 8A–J). To examine the diversity of species captured across the range of the SEAMAP groundfish surveys, the catch composition from stations sampled during the summer and fall surveys from 2010 to 2022 was examined in relation to their region of capture. In addition, the average number of taxa per station by statistical zone was calculated to see if any differences existed in the catch composition.
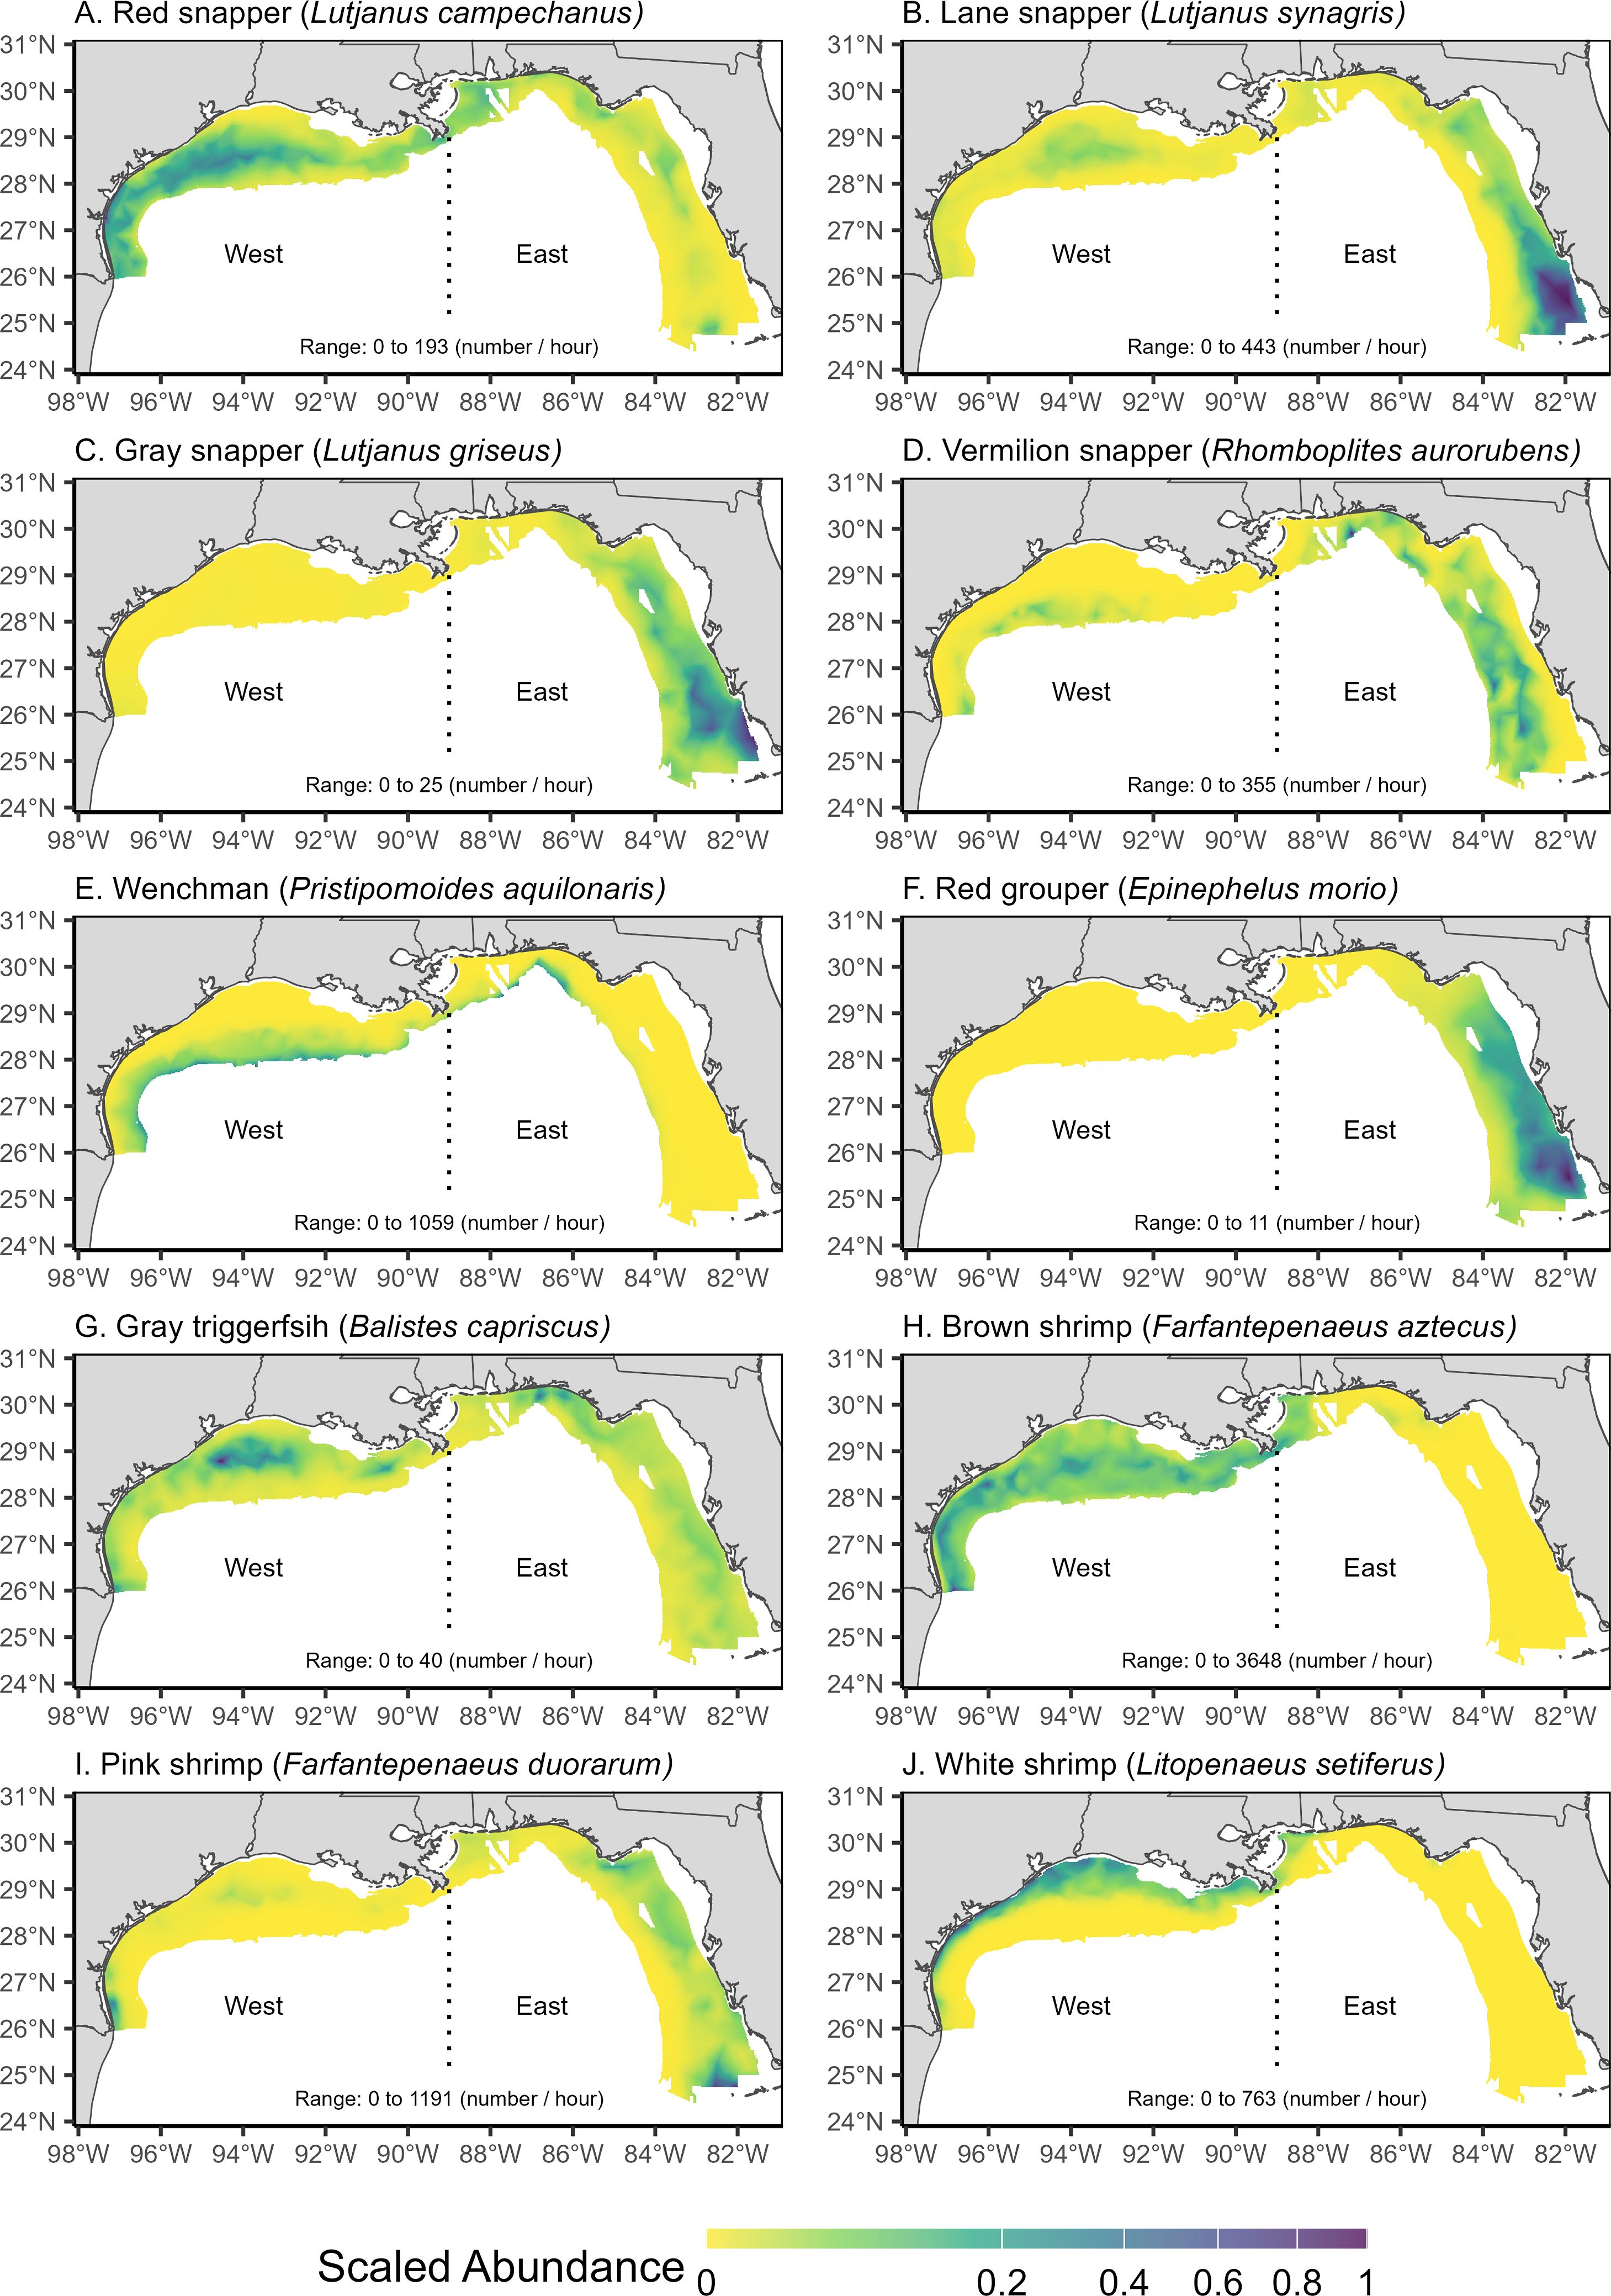
Figure 8. (A-J) Scaled abundance (0 to 1 with respect to the maximum catch rates in number per hour) of selected species captured during Southeast Area Monitoring and Assessment Program (SEAMAP) Summer and Fall Shrimp/Groundfish Surveys from 2010 – 2022. The range of catch rates are listed for each species in their respective panel.
From a stock assessment perspective, a review is presented of how the survey data are being utilized in stock assessments in the GOM. In doing so, indices of abundance for lane snapper L. synagris, red snapper, wenchman Pristipomoides aquilonaris, gray triggerfish, and pink shrimp were compared between the western GOM and the full northern GOM. For lane snapper and pink shrimp, indices of abundance were also calculated separately for the eastern GOM because higher catches rates in the area (Table 4; Figures 8B, I). Indices of abundance were calculated using the delta-lognormal index that was described in section 3.1. Each submodel incorporated the variables year (2010 – 2022), time of day (day/night), statistical zone (western GOM: 11 – 21, eastern GOM: 2 – 10, full GOM: 2 – 21), and depth (fm). All variables were retained in both submodels regardless of significance. This analysis is limited to the SEAMAP Summer Groundfish Survey because of its more complete spatial coverage throughout the time series.
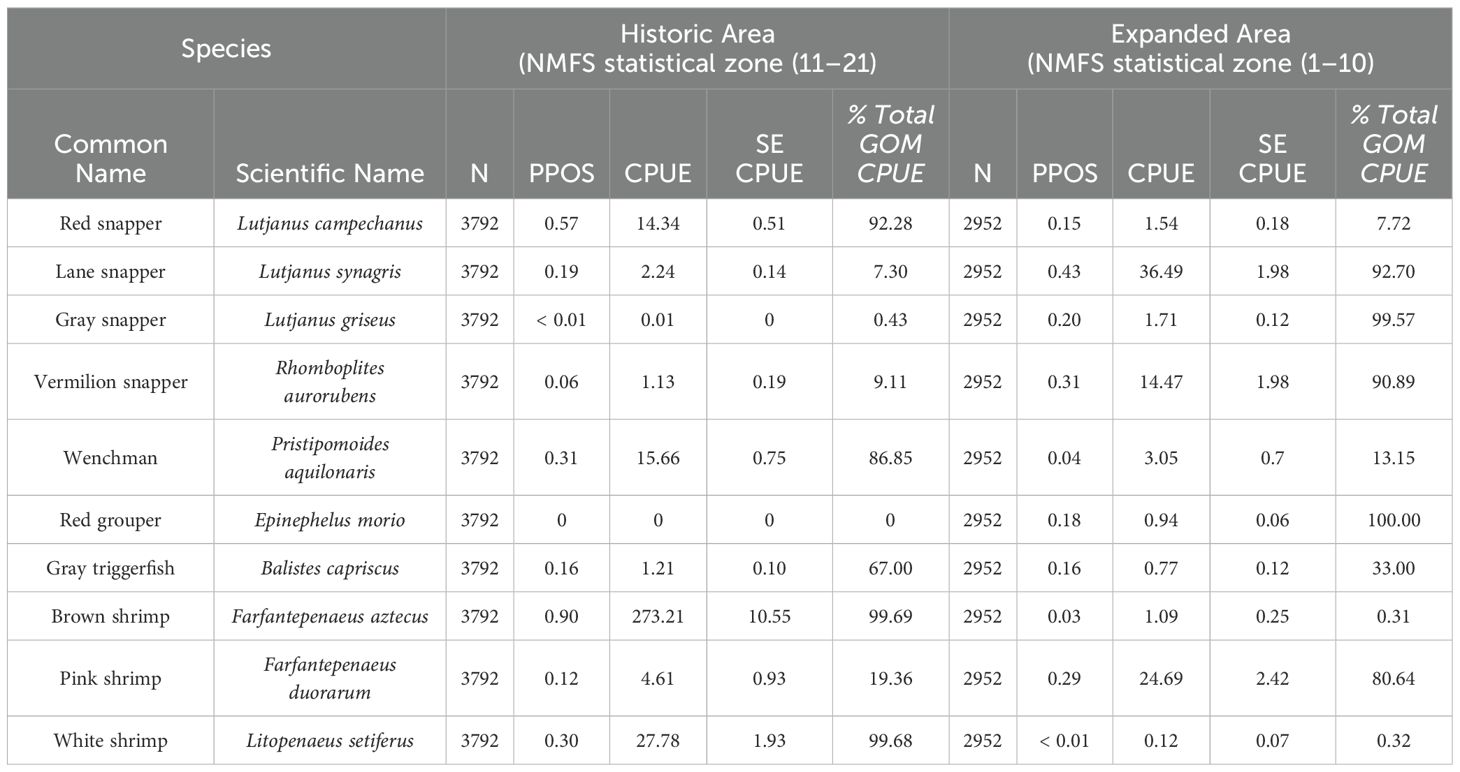
Table 4. Number of stations (N), proportion of stations with a positive catch (PPOS), catch per unit effort (CPUE, number per hour), and standard error (SE) for selected species in the historic and expanded coverage from the SEAMAP Summer and Fall Shrimp/Groundfish Surveys (2010-2022) in the Gulf of Mexico (GOM), along with respective proportion of total Gulf of Mexico CPUE.
4.2 Results
SEAMAP groundfish survey operations between 2010 and 2022 encountered 1866 unique taxa. Taxa that were only found in the western GOM numbered 280, while those only found in the eastern GOM numbered 766, with 820 taxa occurring in both regions. On average, the total number of taxa captured per station does not vary drastically between statistical zones (Figure 9). However, catches in the eastern GOM often exhibited a higher range of taxonomic diversity when compared to stations in the western GOM.
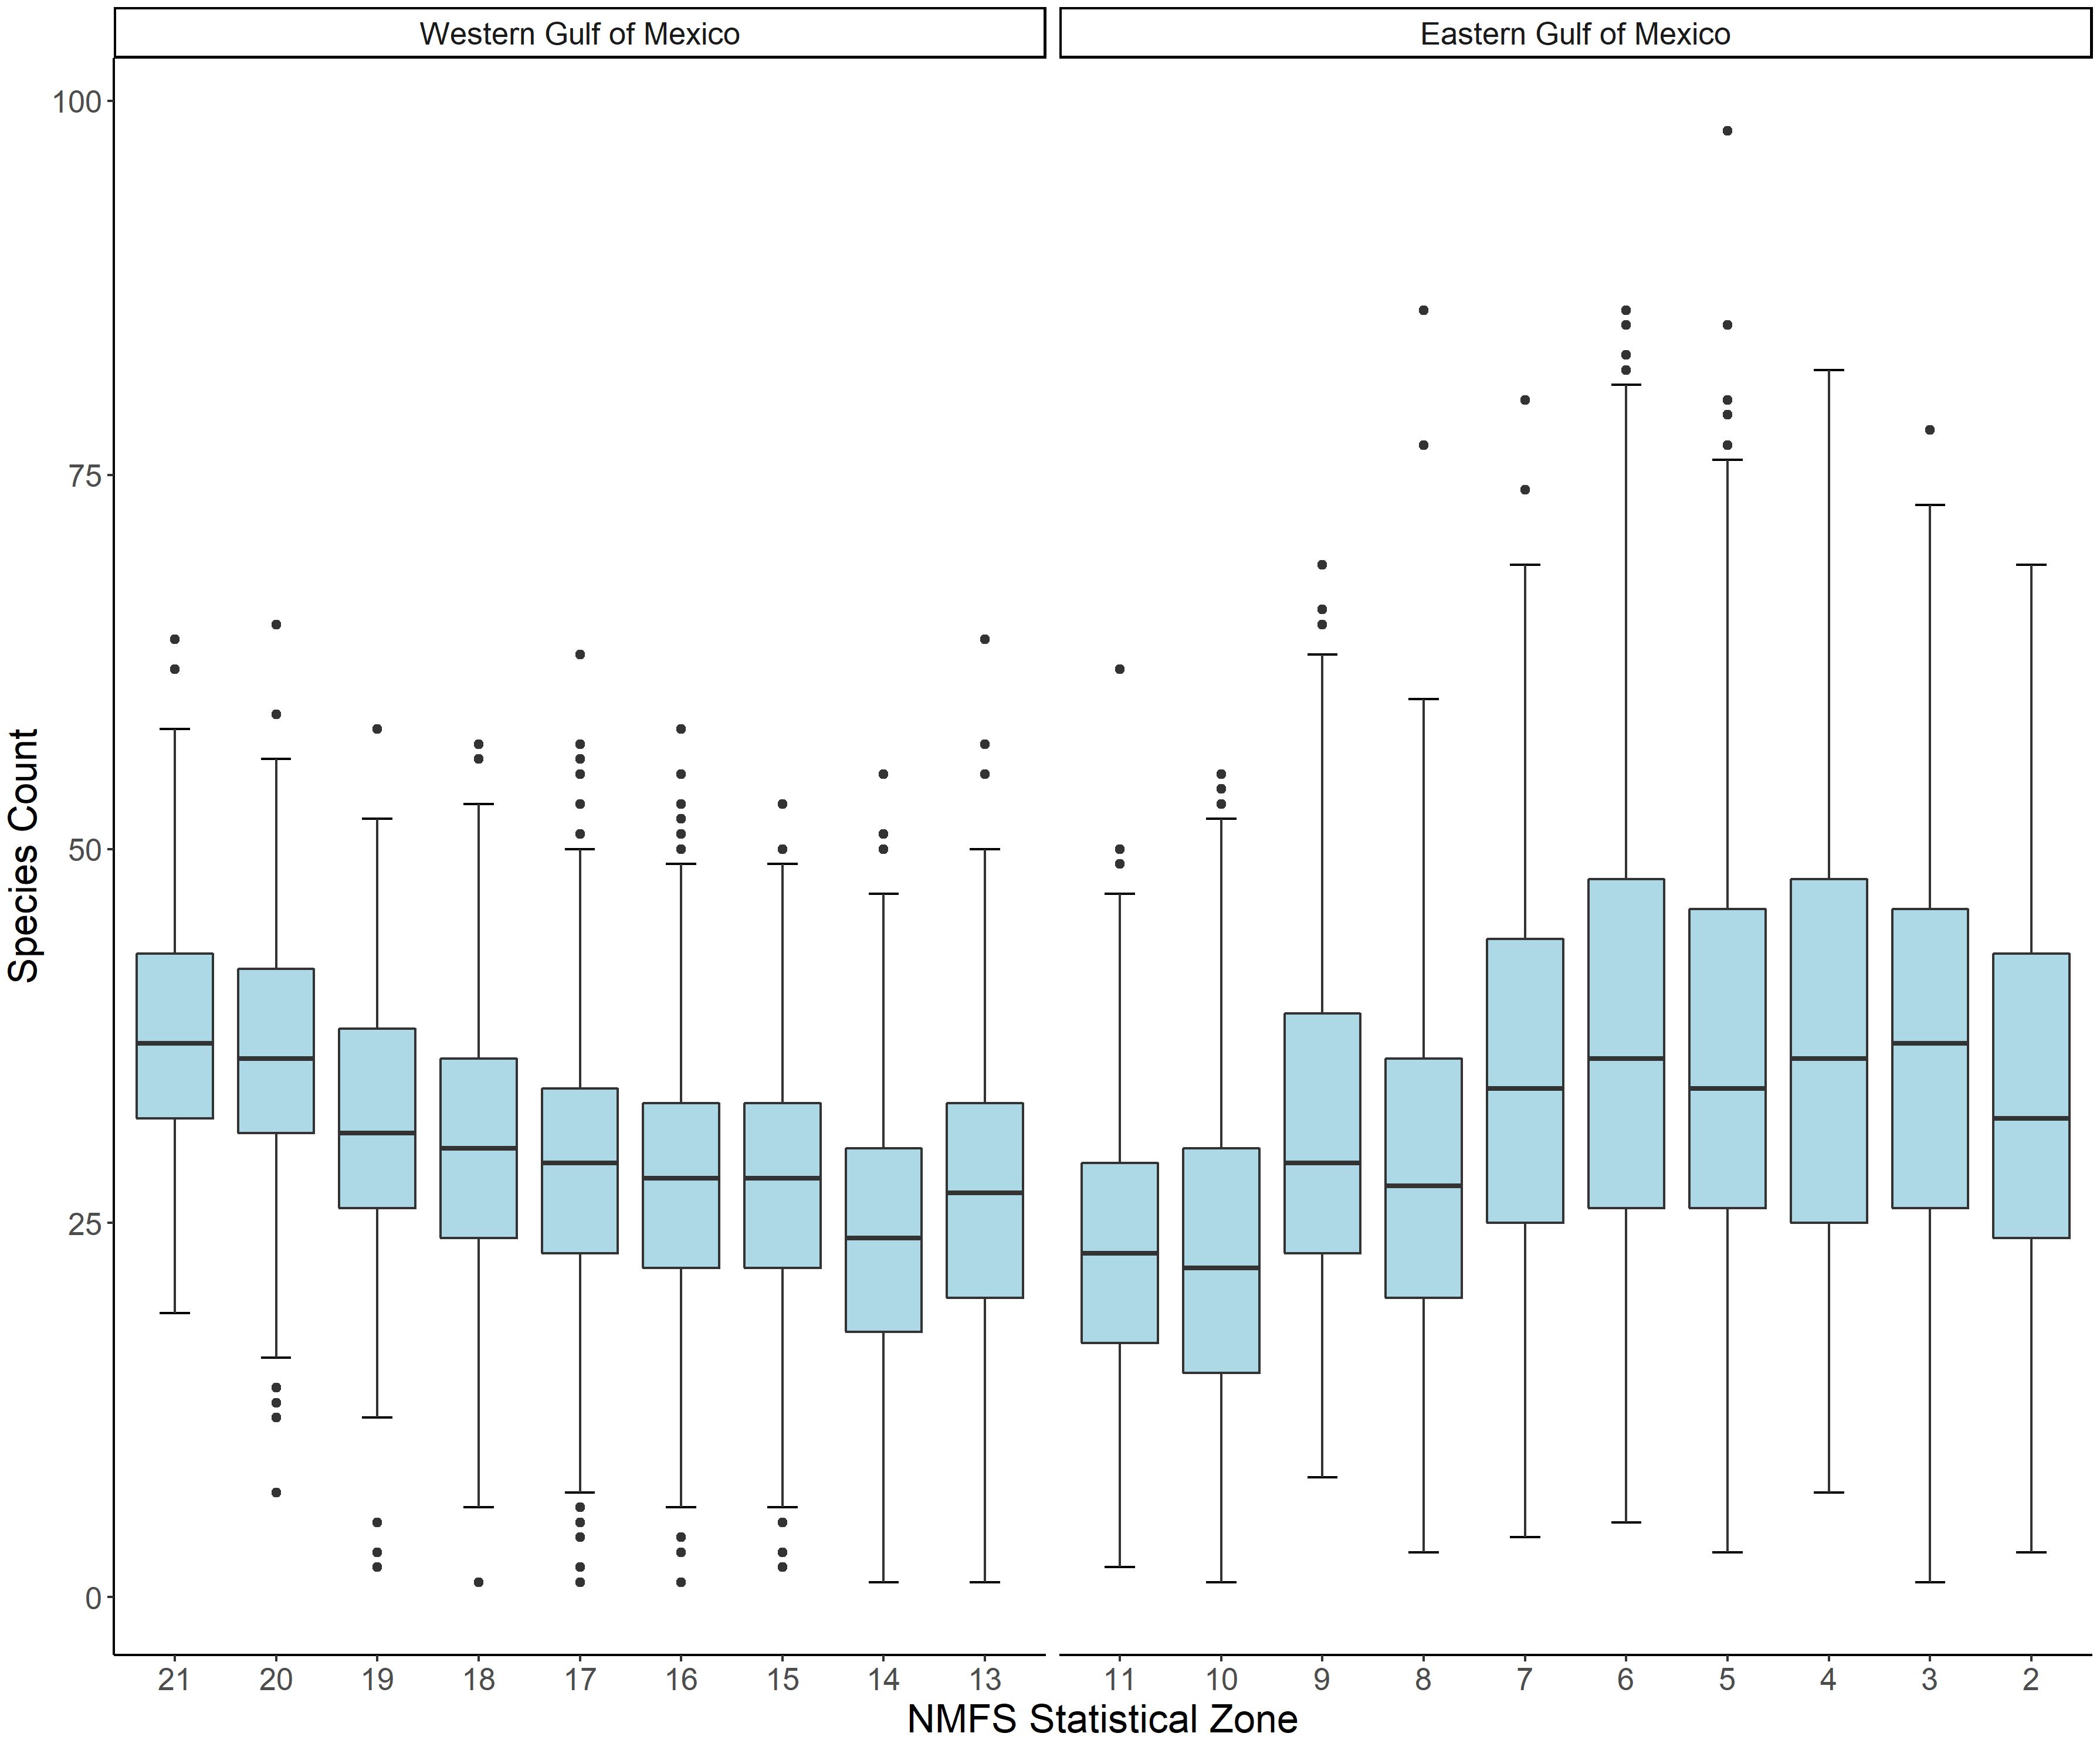
Figure 9. Boxplots representing the differences in the number of taxa (Species Count) caught per station by National Marine Fisheries Service (NMFS) statistical zone across the northern Gulf of Mexico from the Southeast Area Monitoring and Assessment Program (SEAMAP) Summer and Fall Shrimp/Groundfish surveys conducted from 2010 – 2022.
Indices of abundance for important commercial and recreational selected species were divided into three groups: (1) similar relative abundance trends with similar CVs, (2) similar relative abundance trends with improved CVs, and (3) divergent relative abundance trends between the western GOM and full GOM indices. Species in the first group included red snapper and wenchman (Figures 10A, B). Vermilion snapper and gray triggerfish were in the second group with similar relative abundance trends and showed an average reduction in CVs of 49% (6% SD) and 37% (11% SD), respectively (Figures 10C, D). Species with divergent relative abundance trends included lane snapper and pink shrimp (Figures 10E, F). For lane snapper, indices of abundance for the eastern GOM and full GOM showed similar increasing trends with the trends in the western GOM being more divergent, showing a relatively flat trend over the same time period. The CVs for the western GOM were on average 36% (18% SD) higher when compared to the eastern GOM model. Indices of abundance for pink shrimp were divergent for the eastern GOM and western GOM, with the full GOM model roughly falling between them. The CVs for both regional models were higher than those of the full GOM model.
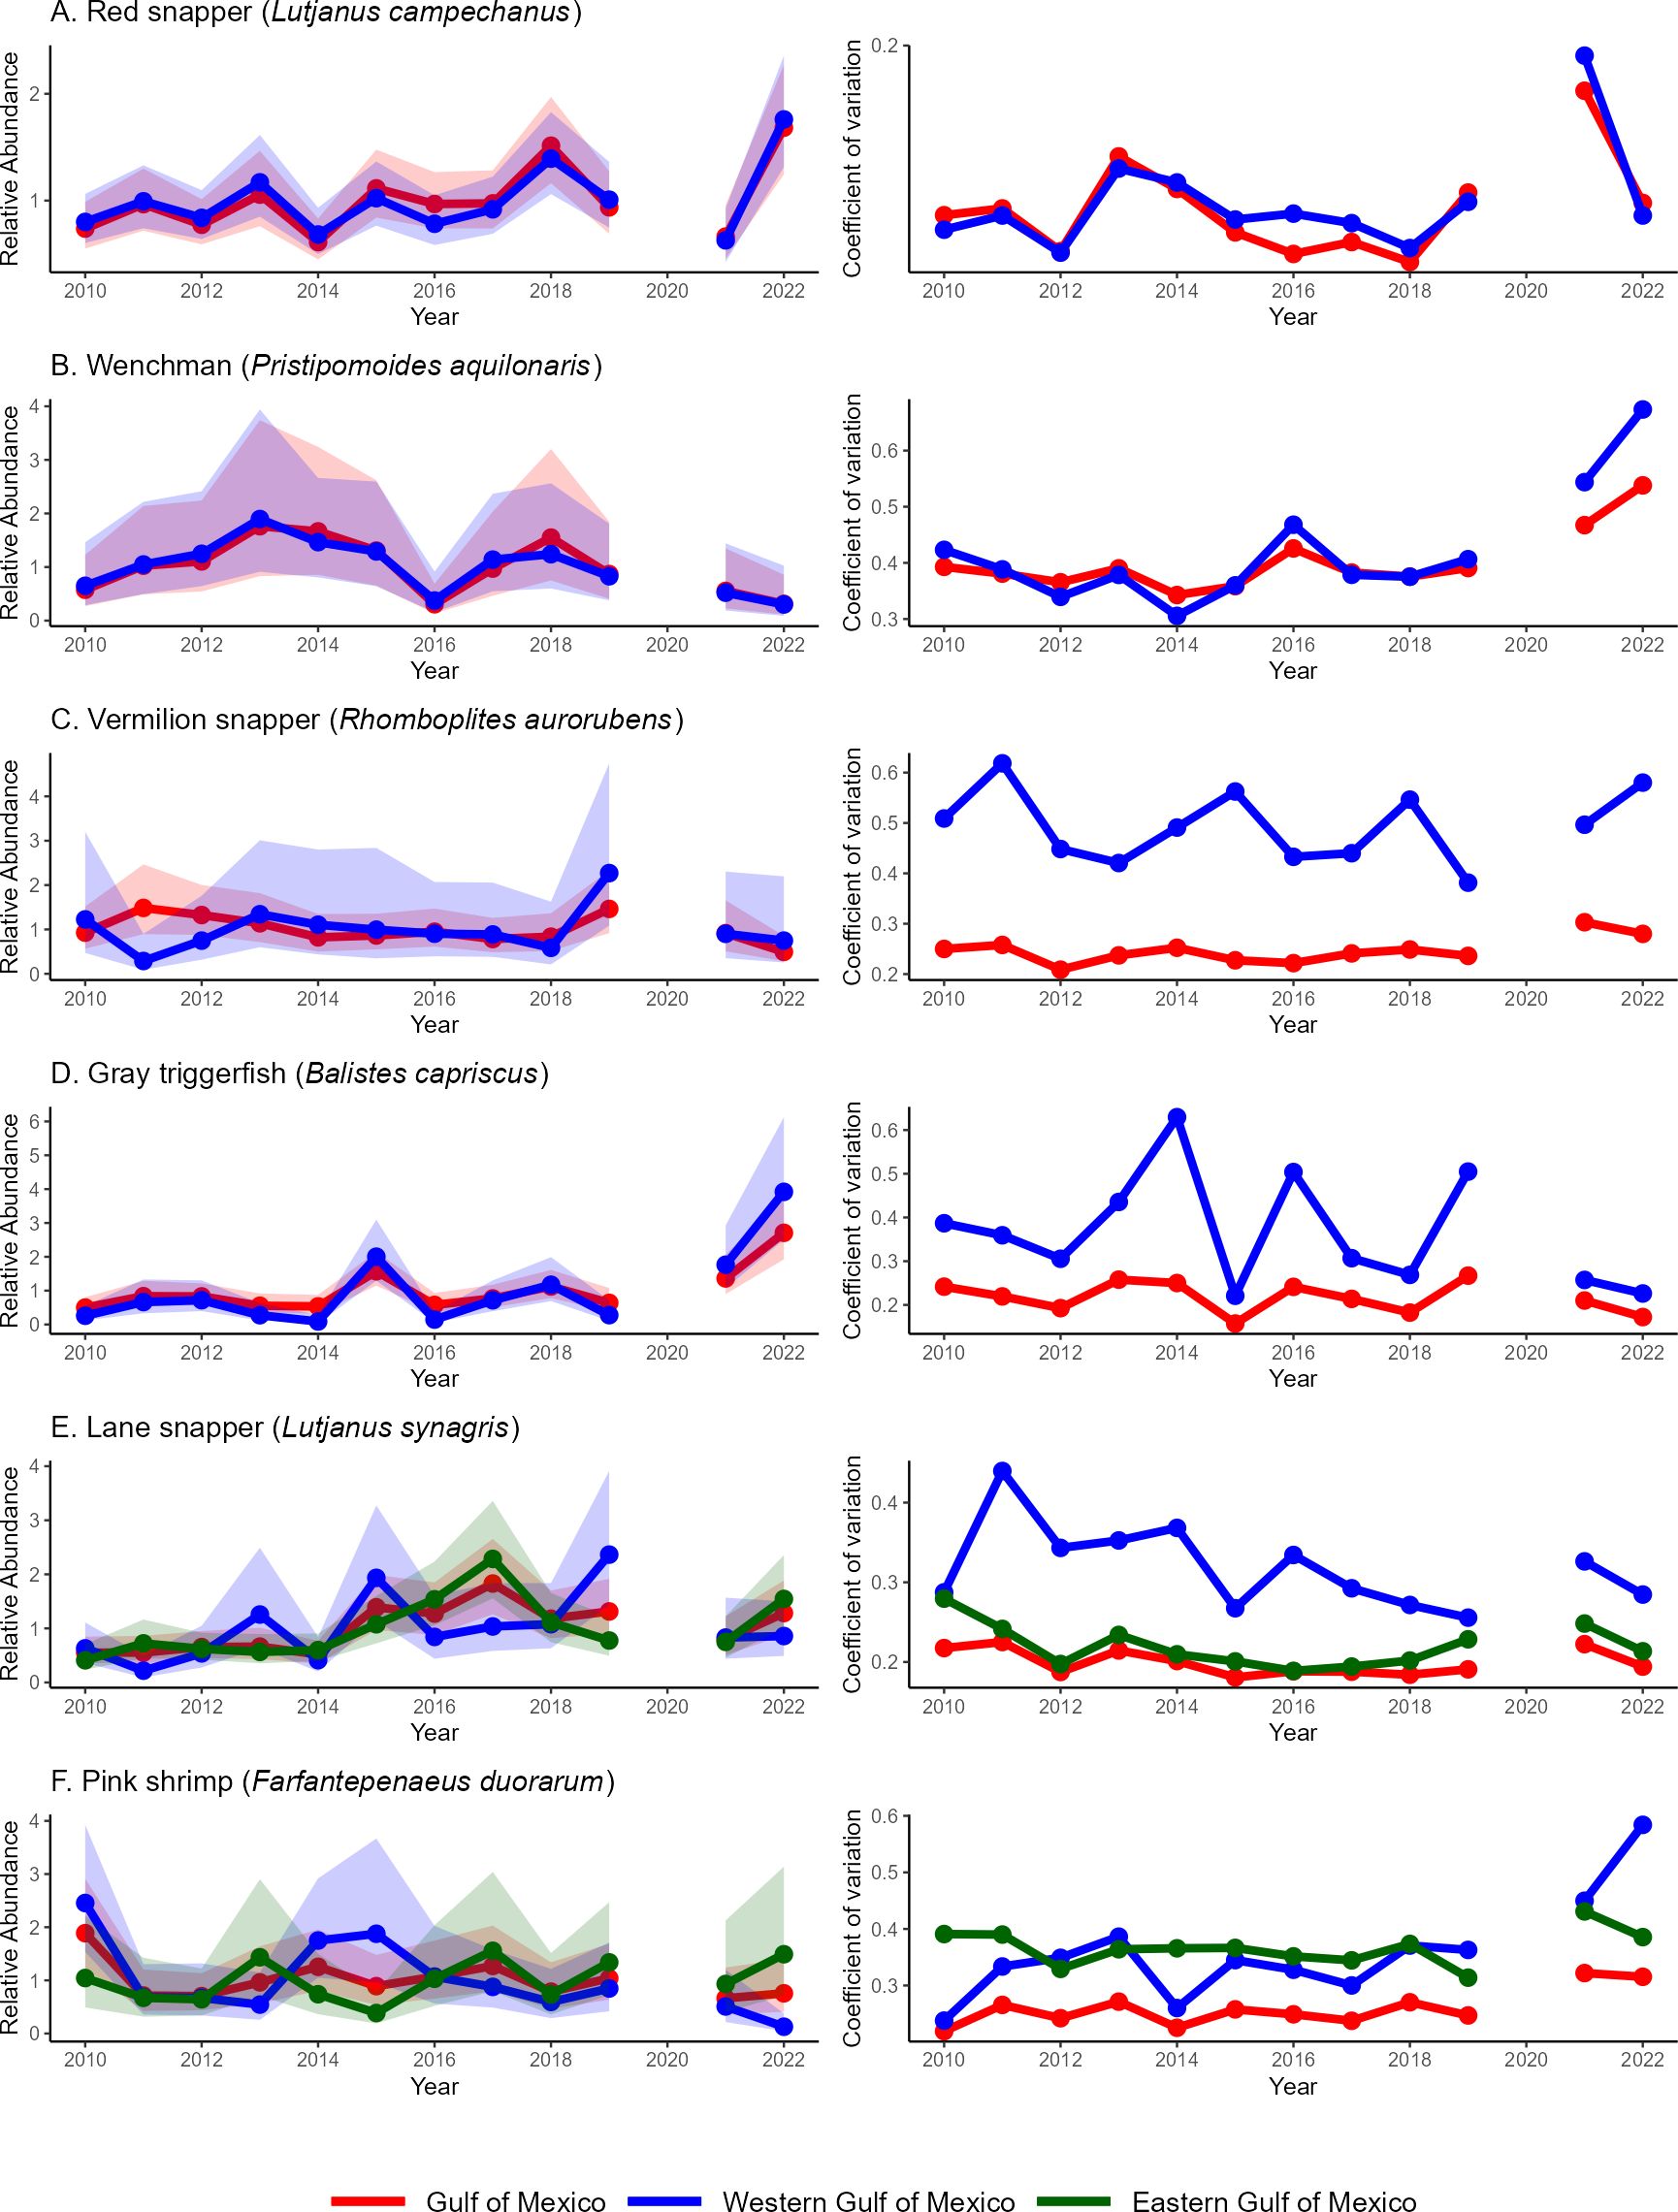
Figure 10. (A-F) Comparison of indices of relative abundance (scaled to a mean of one) and coefficient of variation for selected species from the Southeast Area Monitoring and Assessment Program (SEAMAP) Summer Shrimp/Groundfish Survey from 2010 – 2022 across the western Gulf of Mexico (GOM), full GOM and eastern GOM. Shaded areas represent the lower and upper 95% confidence intervals. Eastern GOM indices presented only for lane snapper and pink shrimp due to core abundance occurring in that region.
4.3 Stock assessment applications
The eastward expansion onto the WFS has resulted in an increase in the number of indices used for single-species stock assessments and increased the utility of the survey data to support ecosystem modeling efforts. The SEAMAP groundfish surveys currently provide abundance indices for 17 single-species stock assessments both across the entire GOM and for the eastern GOM. With the expansion of the SEAMAP groundfish surveys onto the WFS, abundance indices for juvenile vermilion snapper Rhomboplites aurorubens, red grouper, gray snapper, lane snapper, and hogfish Lachnolaimus maximus can now be calculated because they are now captured during the surveys. For several of these species (e.g., red grouper, gray snapper, hogfish), only data from the eastern GOM is included in the stock assessment, while other species (e.g., red snapper) are assessed across the entire GOM. Prior to the eastward expansion of the survey, any index that was produced for the eastern GOM was severely limited in its spatial coverage due to the survey universe ending at Mobile Bay, AL (Figure 3), even if the species’ abundance continued onto the WFS [e.g., red snapper (Figure 8A) and gray triggerfish (Figure 8G)]. However, now indices for pink shrimp, gray triggerfish, red snapper, and Spanish mackerel cover a greater spatial extent of their abundance in the northern GOM. In addition, the improvement in CVs for vermilion snapper and gray triggerfish is indicative of the survey expansion into their preferred habitat. Finally, the divergent trends for lane snapper and pink shrimp show the importance of sampling across a wider range of species’ habitat to get a more informative picture of abundance, and sampling within their core habitats.
5 Lessons learned
Groundfish surveys conducted by NMFS and SEAMAP have exhibited a pronounced shift in their objectives and design since their inception in the early 1950s. The first significant change came between 1965 and 1971 when NMFS transitioned from exploratory surveys to surveys that attempted to better quantify the assemblages of fish and invertebrates (Bullis and Thompson, 1967). While this was a move in the right direction, the surveys still lacked standardized sampling protocols and/or gear that made comparisons across surveys difficult, if not impossible. Beginning in 1972, the use of a standardized survey design and gear marked the second significant change, and the first opportunity to attempt to track changes in the offshore fisheries in the northcentral GOM. The continued refinement of sampling methods and the adjustments to the survey designs have continued to help improve the surveys and expand its usefulness across a wider range of species and scientific applications.
Changes in the survey design of a long-term fishery-independent survey have proven to be beneficial but also introduced some uncertainty as to how to accurately account for these changes when using these data in stock assessments. The spatial expansion of the groundfish surveys have led to a better representation of species ranges and distributions across the U.S. GOM (Figure 8). It has also led to more abundance data being available for use in stock assessments, especially for species that primarily occur across the WFS [e.g., red grouper (Figure 8F)]. Increases in survey efficiency (through both survey design changes and technology [e.g., electronic measuring boards, integrated data collection systems, advancement of database entry]) have allowed the northern GOM-wide survey expansion with the minimal addition of days at sea.
Data from the groundfish surveys serve an important role in the stock assessments as it mainly represents size classes of fishes that are often absent from the fishery-dependent data (e.g., landings) and other fishery-independent surveys (e.g., SEAMAP Reef Fish Video Survey (Campbell et al., 2019), NMFS Bottom Longline Survey (Driggers et al., 2008)). The juvenile red snapper can be used to help inform recruitment since based on their lengths, they are representative of the age 0 (fall groundfish survey) and age 1 (summer groundfish survey) year classes and are not present in other standardized fishery-independent surveys across the GOM (Figure 11). Similar trends are seen in the length distributions of red grouper and gray triggerfish across the groundfish and other fishery-independent surveys. Even in cases where the length data distributions overlap with the SEAMAP Reef Fish Video Survey, the groundfish survey consistently catches smaller fish (e.g., gray snapper, lane snapper).
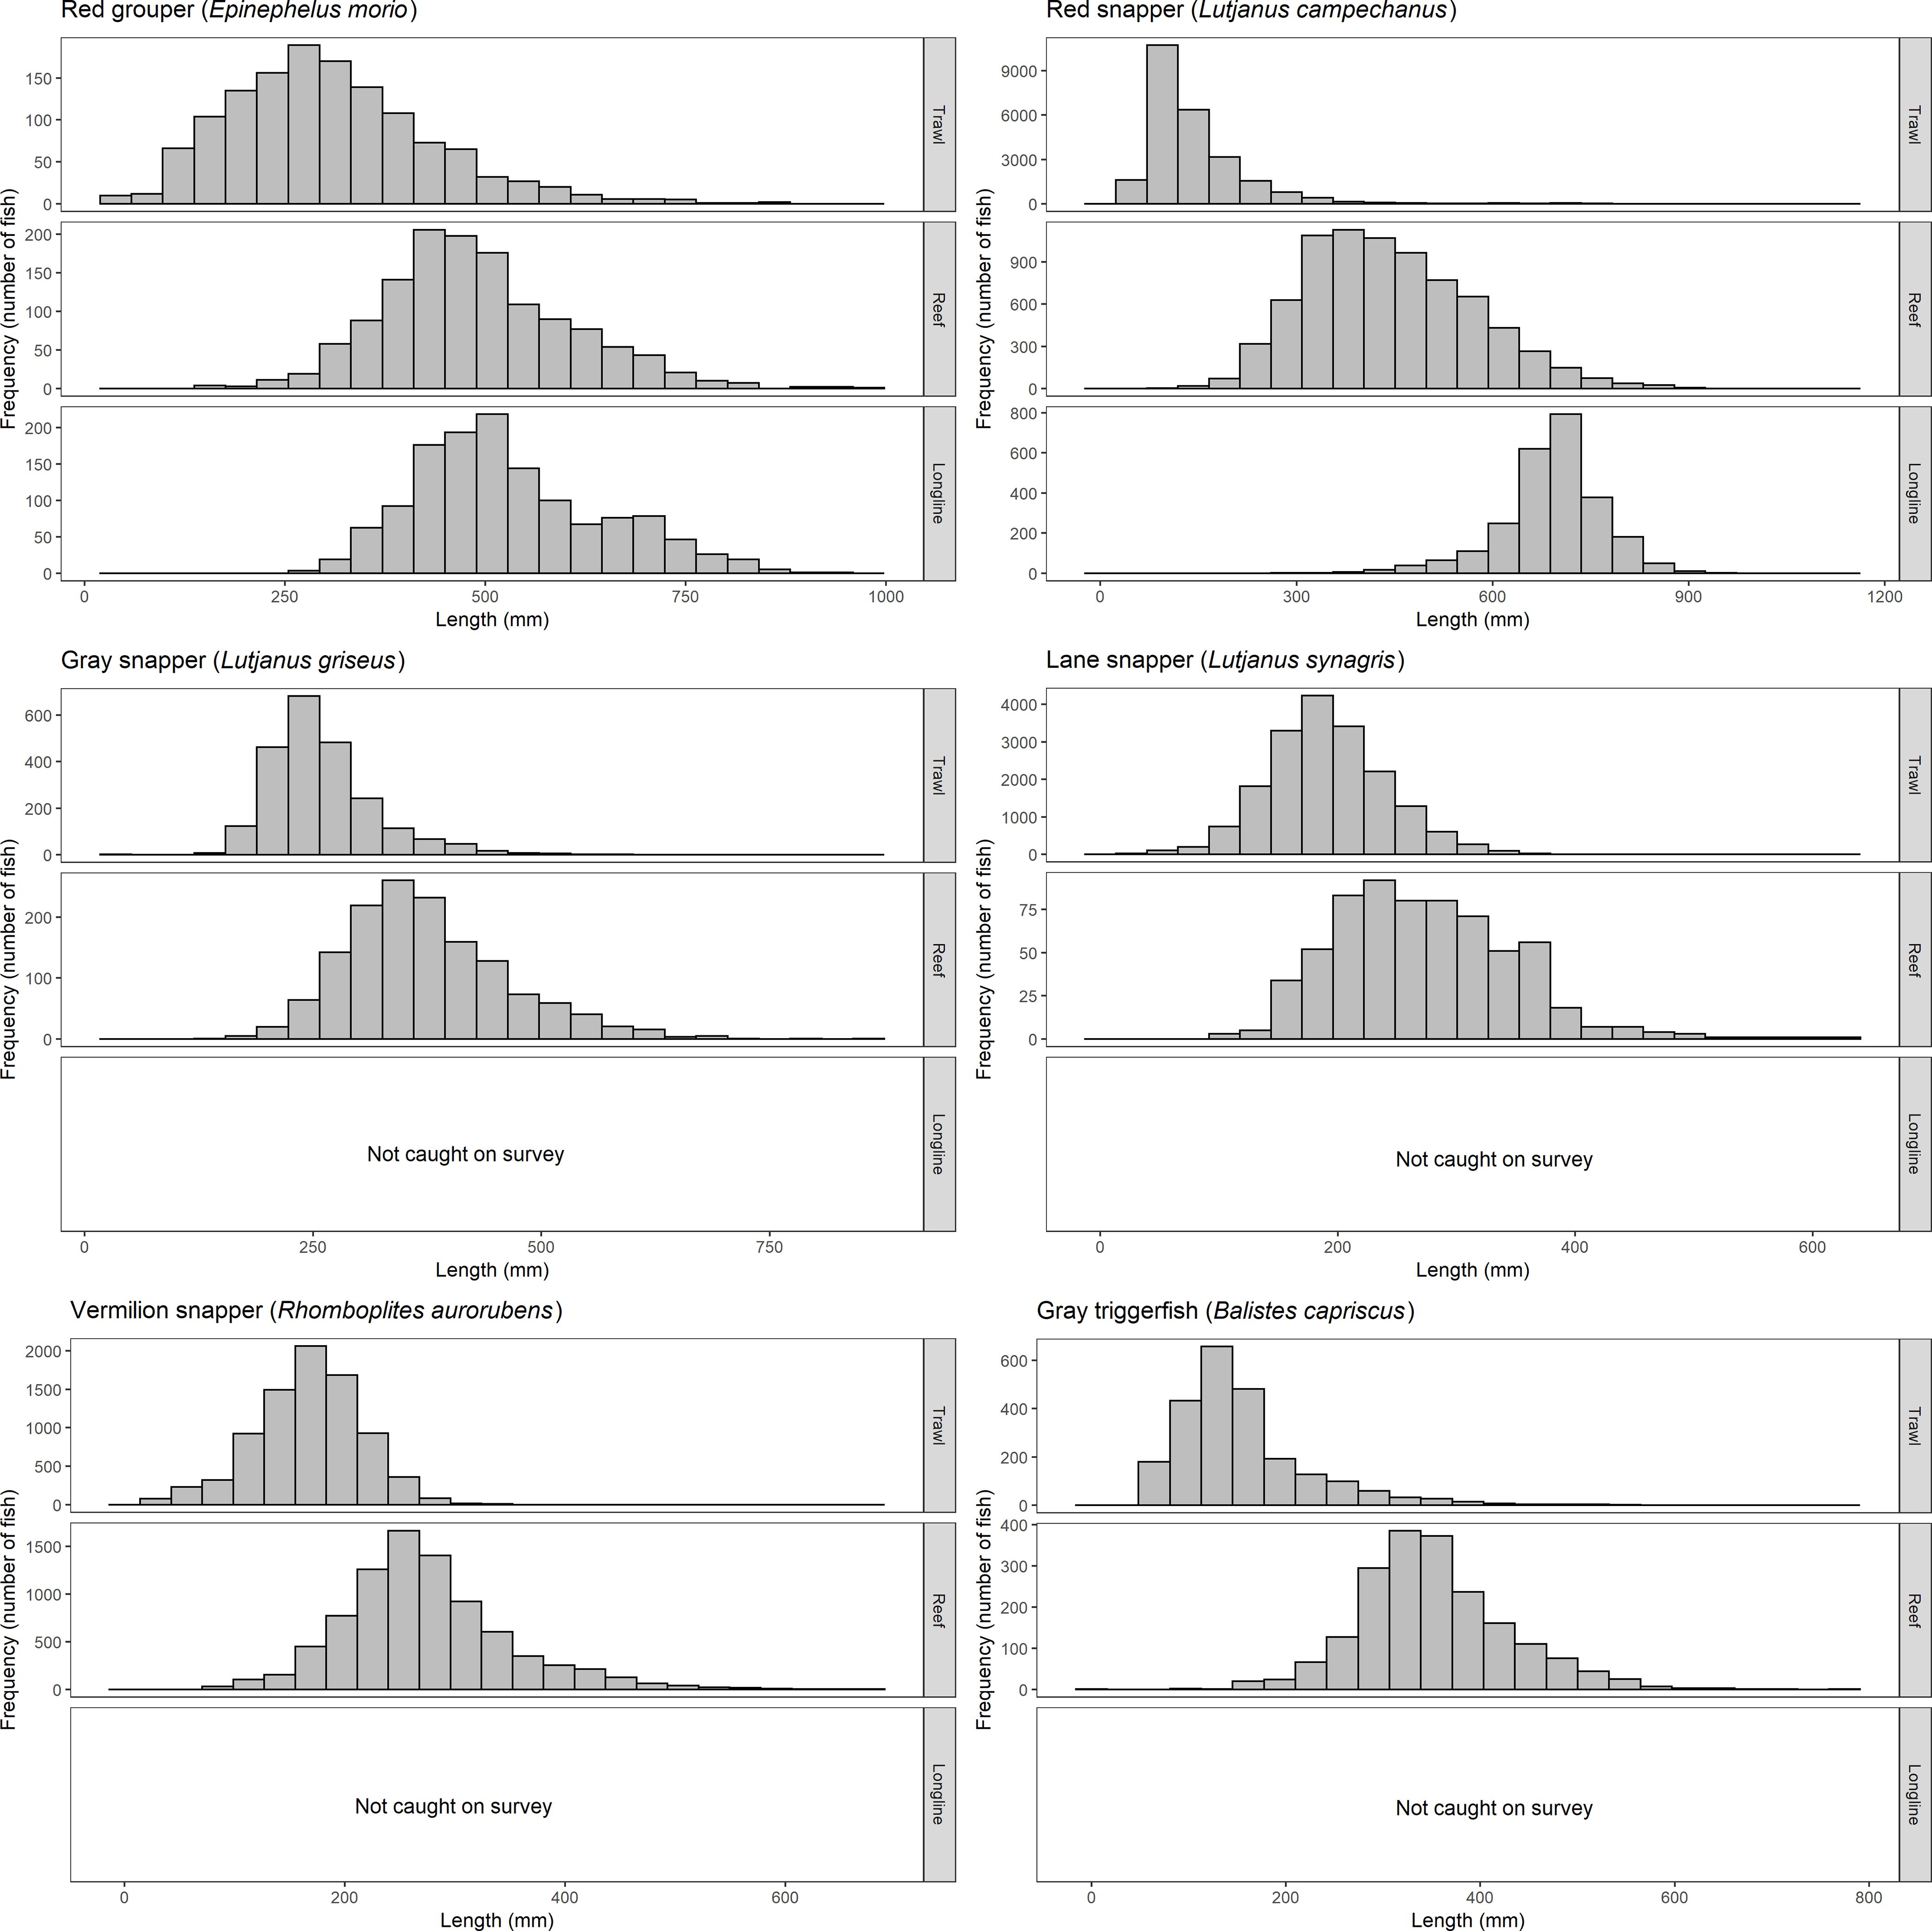
Figure 11. Comparison of length distributions for selected species from the Southeast Area Monitoring and Assessment Program (SEAMAP) Shrimp/Groundfish Survey (Trawl), SEAMAP Reef Fish Video Survey (Reef), and National Marine Fisheries Service (NMFS) Southeast Fisheries Science Center (SEFSC) Bottom Longline survey (Longline).
5.1 Analytical considerations
From a stock assessment perspective, combining data from different survey designs (i.e., NMFS Fall Groundfish Survey, SEAMAP Fall Groundfish Survey) has been problematic, particularly due to the survey expansions that accompanied them. Historically, two methods have been used when preparing indices of abundance for inclusion in stock assessment using the groundfish survey data. Method 1 restricts the data spatially to maximize the length of the time series over a core area, and method 2 restricts the data temporally to maximize spatial coverage. Both have tradeoffs that need to be considered. By utilizing a spatially restricted full time series, relative abundance trends over a longer time frame can be tracked, in some cases over several decades. However, this method may miss changes in abundance that occur outside of the spatially restricted area. In contrast, the use of the second method would capture the changes in abundance across the entire spatial area, but would be limited in describing the long-term trends seen in the data with the use of method 1.
Nichols (2004a) first addressed the issue of combining data from different survey designs during the stock assessment workshop (SEDAR, 2005) for red snapper by separating the data by survey design and analyzing annual abundance data as separate time series. Data were also combined as a single continuous time series following the approach of Nichols (2004b), which was ultimately used for the stock assessment model (SEDAR, 2005). Following this precedent, subsequent analysis followed the general recommendation of producing one continuous time series when data were available (e.g., Pollack et al., 2012; Pollack and Ingram, 2013a; SEDAR, 2020). During subsequent stock assessments, a survey design factor was included in the delta-lognormal models to account for any differences in the catches due to the survey design change (Pollack and Ingram, 2013a, 2015). The survey design factor was defined as a class variable with two (“Old Survey Design (1987 – 2008/2009)” and “New Survey Design (2008/2009 – present”)) or three (“Early (1972 – 1986)”, “Old Survey Design (1987 – 2008/2009, and “New Survey Design (2008/2009 – present”)) levels based on the time series being analyzed. Unfortunately, its usefulness was limited due to the lack of overlap between the survey designs.
While the method of combining time series data across survey design changes seemed to be working for several fish species, issues arose with the king mackerel S. cavalla index, where initially one index was produced (1972 – present) for the assessment. Further analysis determined there were differing catch rates in the sampled areas (i.e., limited area in the early years vs full western GOM coverage onward from 1987) that raised concerns that one area was driving the index (Pollack and Ingram, 2013a). This resulted in the recommendation that the early part of the time series (1972 – 1986) be removed from the analysis (SEDAR, 2014). A similar issue was encountered during SEDAR 74 for red snapper, where the early parts of the time series for the fall survey were not recommended for use in the final assessment model because of the lack of spatial coverage across the defined subregions (SEDAR, 2022).
Brown and white shrimp also presented an issue with divergence in the scale of catches that was noticed between the survey design periods. As a result, NMFS convened a workgroup to better understand data inputs and assumptions for the GOM penaeid shrimp stock assessment models, current practices for index estimation were evaluated, and best practices were identified. A decision was made to develop split indices for both brown and white shrimp, resulting in early (1987 – 2007/2008) and modern (2008/2009 – present) indices. The reasoning behind this approach was related to possible changes in the catchability of brown and white shrimp resulting from the survey design change, particularly the change in tow direction (Pollack et al., 2021). Following this recommendation from the workgroup, the CPUE indices for red snapper (Pollack and Hanisko, 2022) and Spanish mackerel Scomberomorus maculatus (Pollack and Hanisko, 2023) have also been split, echoing the original recommendation put forth by Nichols (2004a).
While the eastward survey expansion in 2008 provided a more complete coverage of several species’ distributions (Figure 8), it did present some problems on how to properly account for expanded areas in the abundance indices. In the first years following the expansion, the decision was made to not use any of the data from the expanded area due to the short time frame that the sampling had taken place (Pollack et al., 2012). As more years of data became available, data were included using a variable in the delta lognormal model to attempt to account for the expanded area (Pollack and Ingram, 2013b, 2015). There was also an issue of when to begin the time series in the eastern GOM, due to the limited spatial coverage of the surveys in 2008 and 2009. In many cases, as more years of data have become available these early years are dropped from the index in favor of only retaining years with more complete spatial coverage (Pollack and Hanisko, 2022). For many indices in the western GOM, the data prior to 1987 are excluded due to the changes in survey design and spatial coverage (Pollack and Ingram, 2013a, 2015). There are different methods available to deal with some of these issues, such as using an area-weighted approach similar to that of Thompson et al. (2022) or a spatiotemporal model (Thorson, 2019), but these options have not been fully explored with the SEAMAP groundfish data.
Another issue becomes how to determine whether changes seen in the groundfish data (e.g., biomass, abundance, species composition) are indicative of survey design changes and/or changes in the commercial groundfish fishery (e.g., regulations, permitting), environmental effects (e.g., hypoxia, river flooding), socioeconomic pressures (e.g., diesel fuel cost, ex-vessel prices), or some combination of them. For example, when examining the annual mean of the total CPUE (kg per km2) of all species within the historic sampling area for the fall groundfish surveys (Figure 2), a case could be made for three distinct trends in the time series (Figure 12). The early part of the time series (1972 – 1986) shows a general decline in annual mean biomass, which mirrors what the commercial groundfish fishery was experiencing, and why the groundfish survey was initiated (Juhl et al., 1973; Gutherz, 1977). The initial years after the survey design change in 1987 saw continued declines in biomass until 1990 when the trend reversed and increased to a peak in 1995. The reversal of the decline in biomass happens to coincide with the implementation of the use of Turtle Excluder Devices in the GOM shrimp fishery (NOAA Fisheries, 2024). During the period of the early SEAMAP groundfish survey (1987 – 2007), the time series was relatively stable and then jumped up in 2008, right after the design change was implemented. The increase in biomass seen during the years of the initial design change (2008 – 2011) appears to be returning to the levels seen during the previous survey design period (1987 – 2007). There were several episodic events, such as a dramatic increase in diesel fuel prices in 2003, Hurricanes Katrina and Rita in 2005, and the Deepwater Horizon Oil Spill in 2010, which had largely negative effects on the shrimp fleet providing a reduction in fishing efforts across the GOM (Posadas and Posadas, 2013; Gallaway et al., 2020).
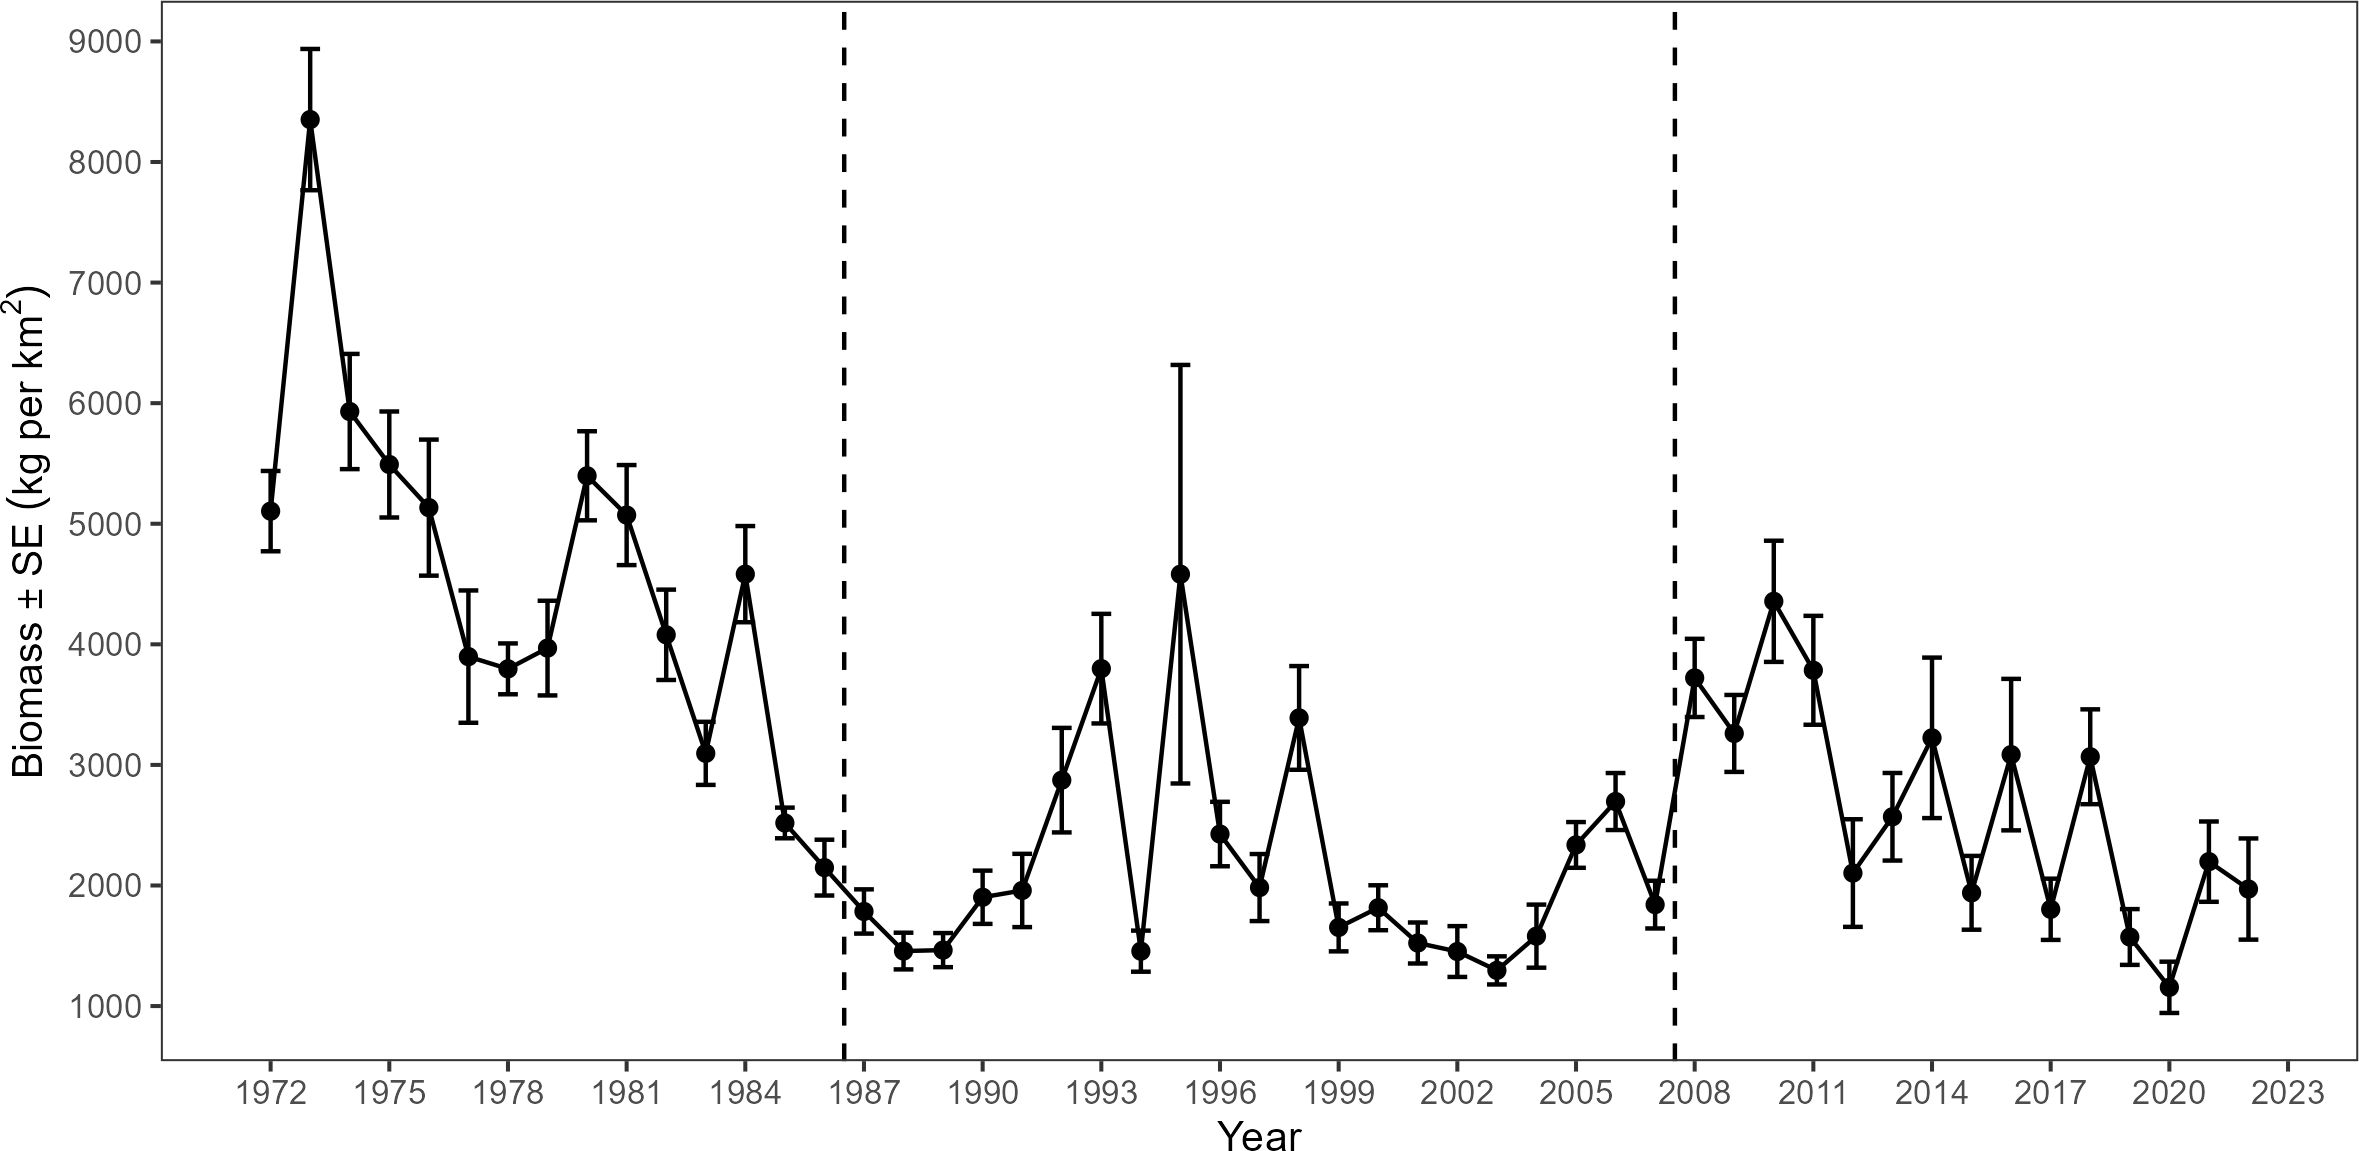
Figure 12. Yearly mean biomass (kg per km2) ± standard error (SE) captured in the historic survey area (National Marine Fisheries Service [NMFS] statistical zones 11 – 15) on the NMFS Fall Groundfish Survey and Southeast Area Monitoring and Assessment Program (SEAMAP) Fall Shrimp/Groundfish Survey from 1972 – 2022. Dashed lines denote implementation of survey design changes.
5.2 Challenges
There are several challenges to maintaining a long-term fishery-independent monitoring program. Budgetary concerns may be the foremost issue that agencies face when conducting large-scale fishery-independent surveys because these surveys are inherently more expensive than fishery-dependent surveys (Dennis et al., 2015). Often intertwined with budgetary concerns are personnel limitations to conducting the surveys, since they require scientists to staff the surveys and conduct the research. Agency priorities can also present a challenge to maintaining long-term monitoring programs due to the redirection of resources and interest. Ideally, the long-term monitoring project could adapt to these changing priorities, such as survey expansion or design changes that maintain the integrity of the historic data while providing comparable data on the new objectives.
Another potential consequence of changing survey designs are the unanticipated factors that can result in additional changes being made as the survey expands into unfamiliar areas. For the SEAMAP groundfish surveys, the interactions with live bottom (e.g., sponges and soft corals) on the WFS are a particular concern (Hanisko et al., 2018). In this case, as a mitigation measure for avoiding live bottom, trawl paths where more than 50 kg of sponge was collected and trawl paths where any coral was reported in the catch were buffered by 250 m area around the trawl path and removed from the survey universe. However, Christiansen et al. (2022) found that abundance data on certain species such as gray triggerfish and red grouper, of which the latter is found almost exclusively on the WFS, could be impacted by the avoidance of areas with high sponge occurrence. In addition, with the survey expansion, additional expertise was needed to help identify species not previously encountered. Bringing in this expertise, either within an agency or from an outside source, not only ensures the accuracy of the data being collected but can lead to a better understanding of species occurrence and distribution across the sampling area.
5.3 Importance of calibration studies
Although survey design improvements have dramatically increased the utility of data provided by the SEAMAP groundfish surveys, the challenges that have been faced in the analysis of groundfish survey data highlight the critical importance of conducting rigorous calibration studies when possible. Initial assessments of the 2008 survey design change indicated that differences between the historical and novel survey designs were minimal (Ingram, 2008). However, the initial assessments of the survey design change were compared between the original SEAMAP design and the new survey design when sampling was much higher in 2008/2009. As additional data were collected after the reduction in sampling effort in the northwestern GOM due to the eastward expansion, questions regarding whether catchability remained constant for some taxa at the lower level of effort have been raised (SEDAR, 2018). Additionally there have also been concerns in regards to alterations to tow direction no longer being consistent across depth strata (SEDAR, 2024). However, there have been no calibration studies conducted between the original SEAMAP design (1987 – summer 2008) and the new survey design (fall 2008 – present) and there are no calibration studies currently being planned.
By conducting calibration studies, one would be able to assess any differences between the survey designs prior to implementing the change while also developing calibration coefficients should any differences be detected (Miller et al., 2010). Nonetheless, calibration studies for large-scale surveys are often not feasible because of (1) their cost, (2) limitation on vessel time, and (3) limitation on personnel time. For example, the calibration study conducted by Miller et al. (2010) used paired tow data from 636 stations to test for differences in catch rates between vessels. While it would be useful to have a similar calibration study done for the SEAMAP groundfish survey, even at a smaller scale, it would be very costly and difficult to implement during the allotted time frames for the surveys. However, a calibration study would be one way to fully understand the impacts of the survey design changes for the SEAMAP groundfish survey.
6 Conclusion
Groundfish surveys in the northern GOM have evolved over time to be an important source of fishery-independent data for fisheries management. While data from the exploratory surveys conducted in the 1950s and 1960s may not be suitable for tracking abundance over time, they can be used to track species occurrence and distribution throughout the GOM. The SEAMAP groundfish surveys and their predecessor, the NMFS groundfish survey, have and continue to provide data on the abundance, spatial distribution, size distribution, and life history metrics for several commercially and recreationally important species, and in many cases represent data on life stages of fishes not captured in fishery-dependent data. However, changes to the design of a long-term fishery-independent survey can have unforeseen effects on data products and analysis if these changes are not properly accounted for. Documentation and communication is key to data users. Throughout the development of this paper, it was found that while most of the survey design changes are documented, they are primarily reported in gray literature or other obscure resources (e.g., meeting notes or internal memos). While many of these changes have been known to internal data users and have documented in stock assessment reports (e.g., Pollack et al., 2021; Pollack and Hanisko, 2022), this paper serves as the first major step in communicating the changes to SEAMAP groundfish surveys to a wider scientific audience. Finally, changes to the SEAMAP groundfish survey design and expansion of its spatial extent have been beneficial in providing important biological information (e.g., indices of relative abundance) for a greater number of commercially and recreationally important species and spatial regions in the northern GOM to inform stock assessments and fisheries management.
Data availability statement
The raw data supporting the conclusions of this article will be made available by the authors, without undue reservation.
Ethics statement
Ethical approval was not required for the study involving animals in accordance with the local legislation and institutional requirements because Research was covered under a federally authorized permit.
Author contributions
AP: Conceptualization, Data curation, Formal Analysis, Investigation, Methodology, Resources, Visualization, Writing – original draft, Writing – review & editing. EH: Conceptualization, Data curation, Methodology, Resources, Writing – original draft, Writing – review & editing. TS: Conceptualization, Data curation, Methodology, Resources, Visualization, Writing – original draft, Writing – review & editing. DH: Formal Analysis, Investigation, Methodology, Writing – original draft, Writing – review & editing. JH: Conceptualization, Data curation, Writing – review & editing. JM: Conceptualization, Data curation, Writing – review & editing. FM-A: Conceptualization, Data curation, Writing – review & editing. JR: Conceptualization, Data curation, Writing – review & editing. ZZ: Conceptualization, Data curation, Writing – review & editing. GP: Resources, Writing – original draft, Writing – review & editing.
Funding
The author(s) declare that financial support was received for the research, authorship, and/or publication of this article. Funding was provided by the National Marine Fisheries Service and the Southeast Area Monitoring and Assessment Project (SEAMAP).
Acknowledgments
The authors would like to acknowledge and thank all the SEAMAP participants that have contributed their time and expertise since the inception of the program in 1981. Without their dedication and commitment to the mission, none of this data collection would have been possible.
Conflict of interest
The authors declare that the research was conducted in the absence of any commercial or financial relationships that could be construed as a potential conflict of interest.
Publisher’s note
All claims expressed in this article are solely those of the authors and do not necessarily represent those of their affiliated organizations, or those of the publisher, the editors and the reviewers. Any product that may be evaluated in this article, or claim that may be made by its manufacturer, is not guaranteed or endorsed by the publisher.
Supplementary material
The Supplementary Material for this article can be found online at: https://www.frontiersin.org/articles/10.3389/fmars.2025.1425362/full#supplementary-material
References
Ainsworth C. H., Schirripa M. J., Morzaria-Luna H. N. (2015).An Atlantis Ecosystem Model for the Gulf of Mexico supporting Integrated Ecosystem Assessment. Available online at: https://repository.library.noaa.gov/view/noaa/4875 (Accessed October 24, 2024).
Bullis H. R. Jr. (1964). Annual report, exploratory fishing and gear research, Bureau of Commercial Fisheries, Region 2 for fiscal year 1963 ending June 30, 1963 Vol. 193 (Washington, D.C.: U. S. Fish and Wildlife Service. Circular). Available at: https://spo.nmfs.noaa.gov/sites/default/files/legacy-pdfs/CIRC193.pdf (Accessed October 24, 2024).
Bullis H. R. Jr., Thompson J. R. (1965). Collections by the exploratory Fishing Vessels Oregon, Silver Bay, Combat, and Pelican made during 1956 to 1960 in the southwestern North Atlantic (Washington, D.C.: U.S. Fish and Wildlife Service. Special Scientific Report-Fisheries No. 510). Available at: https://www.biodiversitylibrary.org/item/39156page/1/mode/1up (Accessed October 24, 2024).
Bullis H. R. Jr., Thompson J. R. (1967). Progress in exploratory fishing and gear research in region 2, fiscal year 1966 Vol. 265 (Washington, D.C.: U. S. Fish and Wildlife Service. Circular). Available at: https://spo.nmfs.noaa.gov/sites/default/files/legacy-pdfs/CIRC265.pdf (Accessed October 24, 2024).
Bullis H. R. Jr., Thompson J. R. (1970). Bureau of commercial fisheries exploratory fishing and gear research base, Pascagoula, Mississippi July 1, 1967 to June 30, 1969 Vol. 351 (Washington, D.C.: U.S. Fish and Wildlife Service. Circular). Available at: https://spo.nmfs.noaa.gov/sites/default/files/legacy-pdfs/CIRC351.pdf(Accessed October 24, 2024).
Campbell M. D., Rademacher K. R., Noble B., Salisbury J., Felts P., Moser J., et al. (2019). Status and trends of marbled grouper in the north-central gulf of Mexico. Mar. Coast. Fish 11, 114–124. doi: 10.1002/mcf2.10066
Chagaris D. D., Patterson W. F. I., Allen M. S. (2020). Relative effects of multiple stressors on reef food webs in the northern gulf of Mexico revealed via ecosystem modeling. Front. Mar. Sci. 7. doi: 10.3389/fmars.2020.00513
Chittenden M. E. Jr., Moore D. (1977). Composition of the ichthyofauna inhabiting the 110-meter contour of the Gulf of Mexico, Mississippi River to the Rio Grande. Northeast Gulf Sci. 1, 106–114. doi: 10.18785/negs.0102.06
Christiansen H. M., Tyler-Jedlund A. J., Switzer T. S., Keenan S. F., Stahl S. D. (2022). Potential implications of excluding live-bottom habitat from a bottom-trawl survey in the eastern Gulf of Mexico. North Am. J. Fish. Manage. 42, 893–905. doi: 10.1002/nafm.10775
Darnell R. M., Defenbaugh R. E., Moore D. (1983). Northwestern Gulf shelf bio-atlas, a study of the distribution of demersal fishes and penaeid shrimp of soft bottoms of the continental shelf from the Rio Grande to the Mississippi River Delta Vol. 82-04 (U.S. Dept. Interior, Minerals Management Service), xii + 438. Open File Rept.
Darnell R. M., Kleypas J. A. (1987). Eastern Gulf shelf bio-atlas, a study of the distribution of demersal fishes and penaeid shrimp of soft bottoms of the continental shelf from the Mississippi River Delta to the Florida Keys (U.S. Dept. Interior, Minerals Management Service), xv + 548. OCS Study MMS 86-0041.
de Mutsert K., Cowan J. H., Essington T. E., Hilborn R. (2008). Reanalyses of Gulf of Mexico fisheries data: Landings can be misleading in assessments of fisheries and fisheries ecosystems. Proc. Natl. Acad. Sci. 105, 2740–2744. doi: 10.1073/pnas.0704354105
Dennis D., Plagányi É., Van Putten I., Hutton T., Pascoe S. (2015). Cost benefit of fishery-independent surveys: Are they worth the money? Mar. Policy 58, 108–115. doi: 10.1016/j.marpol.2015.04.016
Driggers W. B. III, Ingram G. W. Jr., Grace M. A., Gledhill C. T., Henwood T. A., Horton C. N., et al. (2008). Pupping areas and mortality rates of young tiger sharks Galeocerdo cuvier in the western North Atlantic Ocean. Aquat. Biol. 2, 161–170. doi: 10.3354/ab00045
Fuls B. E. (2001). Texas closure dates for the 1993-2000 Texas gulf shrimping seasons (Austin, TX: Texas Parks and Wildlife Department). Available at: https://tpwd.texas.gov/publications/pwdpubs/media/mds_coastal/Series%202_MDS178.pdf (Accessed October 24, 2024).
Gallaway B. J., Raborn S. W., Picariello L., Putman N. F. (2020). Changes in shrimping effort in the gulf of Mexico and the impacts to red snapper. iScience 23, 101111. doi: 10.1016/j.isci.2020.101111
Grüss A., Perryman H. A., Babcock E. A., Sagarese S. R., Thorson J. T., Ainsworth C. H., et al. (2018). Monitoring programs of the U.S. Gulf of Mexico: inventory, development and use of a large monitoring database to map fish and invertebrate spatial distributions. Rev. Fish Biol. Fish. 28, 667–691. doi: 10.1007/s11160-018-9525-2
GSMFC (Gulf States Marine Fisheries Commission) (2009). Meeting Minutes from 2008. Available online at: https://www.gsmfc.org/publications/minutes/2008/2008%20minutes.pdf (Accessed October 24, 2024).
GSMFC (Gulf States Marine Fisheries Commission) (2019). SEAMAP Operations Manual for Trawl and Plankton Surveys. Available online at: https://seamapdata.gsmfc.org/trawl/03%20-%20SEAMAP%20Trawling%20Operations%20Manual%203-29-22.pdf (Accessed October 24, 2024).
GSMFC (Gulf States Marine Fisheries Commission) (2024). Gulf States Marine Fisheries Commission Homepage. Available online at: https://www.gsmfc.org/ (Accessed October 24, 2024).
Gutherz E. J. (1977). The northern Gulf of Mexico groundfish fishery, including a brief life history of the croaker (Micropogon undulatus). Proc. Twenty-Ninth Annu. Gulf Caribbean Fish. Instit. 29, 87–101. Available at: http://hdl.handle.net/1834/28084 (Accessed October 24, 2024).
Hanisko D. S., Pollack A. G., Hoffmayer E. R., Switzer T. S. (2018). Quantifying the impacts to coral and sponge habitats in the eastern Gulf of Mexico during Southeast Area Monitoring and Assessment Program fishery-independent bottom trawl surveys (Pascagoula, MS: NOAA Technical Memorandum NMFS-SEFSC-723), 17. Available at: https://repository.library.noaa.gov/pdfjs/web/viewer.html?file=https://repository.library.noaa.gov/view/noaa/17865/noaa_17865_DS1.pdf (Accessed October 24, 2024).
Ingram G. W. (2008). Evaluation of Summer and Fall SEAMAP Groundfish Surveys in the Western U.S. Gulf of Mexico, (1988-2007) to Assess the Efficacy of Future Changes in Survey Design (Pascagoula, MS: Internal Memo).
Ingram G. W., Alvarez-Berastegui D., Reglero P., Balbín R., García A., Alemany F. (2017). Incorporation of habitat information in the development of indices of larval bluefin tuna (Thunnus thynnus) in the Western Mediterranean SeSea, (2001–2005 and 2012–2013). Deep Sea Res. Part II: Topical Stud. Oceanogr. 140, 203–211. doi: 10.1016/j.dsr2.2017.03.012
Juhl R. J., Gutherz E. J., Roithmayr C. M., Russel G. M. (1973). Southeast groundfish program status report to the Gulf States Marine Fisheries Commission (Pascagoula, Miss: Mississippi Laboratory), 39567.
Juhl R. J., Roe R. B., Gutherz E. J., Drummond S. B., Roithmayr C. M., Benigno J. (1974). Oceanic Resource Surveys and Assessment program status report to the Gulf States Marine Fisheries Commission (Pascagoula, Miss: Mississippi Laboratory), 39568.
Kutkuhn J. H. (1962). Gulf of Mexico commercial shrimp populations-trends and characteristics 1956-59. Available online at: https://fisherybulletin.nmfs.noaa.gov/sites/default/files/pdf-content/fish-bull/kutkuhn.pdf (Accessed October 24, 2024).
Latour R. J., Gartland J., Bonzek C. F. (2023). Design and redesign of a bottom trawl survey in Chesapeake Bay, USA. Front. Mar. Sci. 10. doi: 10.3389/fmars.2023.1217792
Lo N. C., Jacobson L. D., Squire J. L. (1992). Indices of relative abundance from fish spotter data based on delta-lognormal models. Can. J. Fish. Aquat. Sci. 49, 2515–2526. doi: 10.1139/f92-278
Maunder M. N., Punt A. E. (2004). Standardizing catch and effort data: a review of recent approaches. Fish. Res. 70, 141–159. doi: 10.1016/S0165-7836(03)00002-X
Maunder M. N., Starr P. J. (2003). Fitting fisheries models to standardised CPUE abundance indices. Fish. Res. 63, 43–50. doi: 10.1016/S0165-7836(03)00002-X
Miller T., Das C., Politis P., Miller A. S., Lucey S., Legault C., et al. (2010). Estimation of Albatross IV to Henry B. Bigelow calibration factors (Woods Hole, MA: Northeast Fisheries Science Center Reference Document 10-05), 233. Available at: https://repository.library.noaa.gov/view/noaa/3726/noaa_3726_DS1.pdf (Accessed October 24, 2024).
MSFCMA (Magnuson-Stevens Fishery Conservation and Management Act) (2007). Magnuson-Stevens Fishery Conservation and Management Act (MSFCMA), Public Law 94-265. 2007. As amended by the Magnuson-Stevens Fishery Conservation and Management Reauthorization Act (P.L. 109-479). U.S. Department of Commerce (Washington, D.C.: National Oceanic and Atmospheric Administration, National Marine Fisheries Service).
Nance J. M. (1993). Biological review of the 1992 Texas Closure (Galveston, TX: NOAA Technical Memorandum, NMFS-SEFSC-325), 30. Available at: https://repository.library.noaa.gov/view/noaa/8985 (Accessed October 24, 2024).
Nichols S. (2004a). Derivation of red snapper time series from SEAMAP and groundfish trawl surveys. SEDAR7-DW01 (North Charleston, SC: SEDAR), 28. Available at: https://sedarweb.org/documents/s7dw01-derivation-of-red-snapper-time-series-from-seamap-and-groundfish-trawl-surveys/ (Accessed October 24, 2024).
Nichols S. (2004b). Calibration among the separate trawl survey programs to extend the time series for juvenile red snapper indexes. SEDAR7-DW2 (North Charleston, SC: SEDAR), 65. Available at: https://sedarweb.org/documents/s7dw02-calibration-among-the-separate-trawl-survey-programs-to-extend-the-time-series-for-juvenile-snapper-indexes/ (Accessed October 24, 2024).
NMFS (National Marine Fisheries Service) (1975). Program development plan for resource assessment fiscal year 1977 (Pascagoula, Mississippi: National Marine Fisheries Service, Southeast Fisheries Science Center, Pascagoula Fisheries Laboratory), 39567.
NOAA (National Oceanic and Atmospheric Administration) (1985). Gulf of Mexico coastal and ocean zones strategic assessment: data atlas (Rockland, MD: U.S. Dept. Commerce. NOAA, NOS).
NOAA (National Oceanic and Atmospheric Administration) Fisheries (2022a). Strategic Plan 2022-2025. Available online at: https://media.fisheries.noaa.gov/2022-12/NOAA-Fisheries-2022-25-StrategicPlan.pdf (Accessed October 24, 2024).
NOAA (National Oceanic and Atmospheric Administration) Fisheries (2022b). A century of conservation: A brief history of NOAA Fisheries (NOAA Fisheries). Available at: https://www.fisheries.noaa.gov/new-england-mid-atlantic/about-us/century-conservation-brief-history-noaa-fisheries (Accessed October 24, 2024).
NOAA (National Oceanic and Atmospheric Administration) Fisheries (2023). Status of stocks 2022: Annual report to Congress on the status of U.S. Fisheries. Available online at: https://www.fisheries.noaa.gov/s3/2023-04/2022-Status-of-Stocks-RtC-041423-0.pdf (Accessed October 24, 2024).
NOAA (National Oceanic and Atmospheric Administration) Fisheries (2024). History of Turtle Excluder Devices (NOAA Fisheries. NOAA). Available at: https://www.fisheries.noaa.gov/southeast/bycatch/history-turtle-excluder-devices (Accessed October 24, 2024).
Pollack A. G., Hanisko D. S. (2022). Red snapper abundance indices from groundfish surveys in the northern Gulf of Mexico. SEDAR74-DW-30 (North Charleston, SC: SEDAR), 74. Available at: https://sedarweb.org/documents/sedar-74-dw-30-red-snapper-abundance-indices-from-groundfish-surveys-in-the-northern-gulf-of-Mexico/ (Accessed October 24, 2024).
Pollack A. G., Hanisko D. S. (2023). Spanish mackerel abundance indices from SEAMAP groundfish surveys in the northern Gulf of Mexico. SEDAR81-WP-09 Vol. 28 (North Charleston, SC: SEDAR). Available at: https://sedarweb.org/documents/sedar-81-wp-09-spanish-mackerel-abundance-indices-from-seamap-groundfish-surveys-in-the-northern-gulf-of-Mexico/ (Accessed October 24, 2024).
Pollack A. G., Ingram G. W. Jr. (2013a). King mackerel abundance indices from SEAMAP groundfish surveys in the northern Gulf of Mexico. SEDAR38-DW-02 (North Charleston, SC: SEDAR), 71. Available at: https://sedarweb.org/documents/s38dw02-king-mackerel-abundance-indices-from-seamap-groundfish-surveys-in-the-northern-gulf-of-Mexico/ (Accessed October 24, 2024).
Pollack A. G., Ingram G. W. Jr. (2013b). Atlantic sharpnose and bonnethead abundance indices from NMFS Bottom Longline Surveys in the western North Atlantic and northern Gulf of Mexico. SEDAR34-WP-15 (North Charleston, SC: SEDAR), 41. Available at: https://sedarweb.org/documents/s34wp15-atlantic-sharpnose-and-bonnethead-abundance-indices-from-nmfs-bottom-longline-surveys-in-the-western-north-atlantic-and-northern-gulf-of-Mexico/ (Accessed October 24, 2024).
Pollack A. G., Ingram G. W. Jr. (2015). Gray triggerfish abundance indices from SEAMAP groundfish surveys in the northern Gulf of Mexico. SEDAR43-WP-11 (North Charleston, SC: SEDAR), 30. Available at: https://sedarweb.org/documents/sedar-43-wp11-gray-triggerfish-abundance-indices-from-seamap-groundfish-surveys-in-the-northern-gulf-of-Mexico/ (Accessed October 24, 2024).
Pollack A. G., Ingram G. W. Jr., Foster D. G. (2012). Red snapper abundance indices from SEAMAP groundfish surveys in the northern Gulf of Mexico. SEDAR31-DW20 Vol. 236 (North Charleston, SC: SEDAR). Available at: https://sedarweb.org/documents/s31dw20-red-snapper-abundance-indices-from-seamap-groundfish-surveys-in-the-northern-gulf-of-Mexico/ (Accessed October 24, 2024).
Pollack A. G., Masi M., Hanisko D. S., Munch S., Nance J., Craig K., et al. (2021). SEAMAP Trawl Shrimp Data and Index Estimation Work Group Report (Pascagoula, MS: A Report to the Gulf of Mexico Marine Fisheries Commission), 118. Available at: https://sedarweb.org/documents/sedar-rd01-seamap-trawl-shrimp-data-and-index-estimation-work-group-report/ (Accessed October 24, 2024).
Posadas B. C., Posadas B. A. Jr. (2013). Estimation of the Baseline for Assessment of Economic Impacts of the Gulf of Mexico Oil Spill on Mississippi’s Commercial Fishing Sector. Available online at: https://repository.library.noaa.gov/view/noaa/38158 (Accessed October 24, 2024).
Punt A. E. (2023). Those who fail to learn from history are condemned to repeat it: A perspective on current stock assessment good practices and the consequences of not following them. Fish. Res. 261, 106642. doi: 10.1016/j.fishres.2023.106642
Rago P. J. (2005). “Fishery independent sampling: survey techniques and data analyses,” in Management techniques for elasmobranch fisheries, vol. 474 . Ed. Musick J. A. (Food & Agriculture Organization, Roma), 201–215. FAO fisheries technical paper.
Roithmayr C. M. (1965). Industrial bottomfish fishery of the northern Gulf of Mexico 1959-63 (Washington, D.C.: U. S. Fish and Wildlife Service). Available at: https://www.biodiversitylibrary.org/item/38427page/1/mode/1up. Special Scientific Report-Fisheries, No. 518. (Accessed October 24, 2024).
Rourke M. L., Fowler A. M., Hughes J. M., Broadhurst M. K., DiBattista J. D., Fielder S., et al. (2022). Environmental DNA (eDNA) as a tool for assessing fish biomass: A review of approaches and future considerations for resource surveys. Environ. DNA 4, 9–33. doi: 10.1002/edn3.185
Sanders N., Donaldson D., Thompson P. A. (1990b). SEAMAP environmental and biological atlas of the Gulf of Mexic (Ocean Springs, MS: Gulf States Marine Fisheries Commission), 337. Available at: https://www.gsmfc.org/publications/GSMFC%20Number%20022.pdf (Accessed October 24, 2024).
Sanders N., Donaldson D., Thompson P. A. (1991). SEAMAP environmental and biological atlas of the Gulf of Mexic (Ocean Springs, MS: Gulf States Marine Fisheries Commission), 318. Available at: https://www.gsmfc.org/publications/GSMFC%20Number%20025.pdf (Accessed October 24, 2024).
Sanders N., Donaldson D., Thompson P. A. (1992). SEAMAP environmental and biological atlas of the Gulf of Mexico 1990 (Ocean Springs, MS: Gulf States Marine Fisheries Commission), 311. Available at: https://www.gsmfc.org/publications/GSMFC%20Number%20027.pdf (Accessed October 24, 2024).
Sanders N., Van Devender T., Thompson P. A. (1990a). “SEAMAP environmental and biological atlas of the Gulf of Mexico 1986,” (Ocean Springs, MS: Gulf States Marine Fisheries Commission), 328. Available at: https://www.gsmfc.org/publications/GSMFC%20Number%20020.pdf (Accessed October 24, 2024).
Schrandt M. N., MacDonald T. C., Winner B. L., Blewett D. A., Paperno R., Onorato G. V., et al. (2024). Sampling design modifications to a fishery-independent monitoring survey balance the maintenance of long-term data with emerging management needs and funding limitations. Front. Mar. Sci. 10. doi: 10.3389/fmars.2023.1199076
SEAMAP (Southeast Area Monitoring and Assessment Program) (2024). Gulf States SEAMAP. Available online at: https://seamapdata.gsmfc.org/ (Accessed October 24, 2024).
SEDAR (Southeast Data, Assessment, and Review) (2005). Stock Assessment Report of SEDAR 7: Gulf of Mexico Red Snapper (North Charleston, SC: SEDAR), 480. Available at: https://sedarweb.org/documents/sedar-7-sar1-red-snapper-stock-assessment-report/ (Accessed October 24, 2024).
SEDAR (Southeast Data, Assessment, and Review) (2009). Stock Assessment of Red Snapper in the Gulf of Mexico – SEDAR Update Assessment (North Charleston, SC: SEDAR), 224. Available at: https://sedarweb.org/documents/2009-update-sedar-07-gulf-of-Mexico-red-snapper/ (Accessed October 24, 2024).
SEDAR (Southeast Data, Assessment, and Review) (2014). SEDAR 38 Stock assessment report Gulf of Mexico king mackerel (North Charleston, SC: SEDAR), 465. Available at: https://sedarweb.org/documents/sedar-38-final-stock-assessment-report-gulf-of-Mexico-king-mackerel/ (Accessed October 24, 2024).
SEDAR (Southeast Data, Assessment, and Review) (2015). SEDAR Procedural Workshop 7: Data Best Practices (North Charleston SC: SEDAR), 151. Available at: http://sedarweb.org/pw-07 (Accessed October 24, 2024).
SEDAR (Southeast Data, Assessment, and Review) (2018). SEDAR 52 Stock Assessment Report Gulf of Mexico Red Snapper (North Charleston, SC: SEDAR), 434. Available at: https://sedarweb.org/documents/sedar-52-gulf-of-Mexico-red-snapper-final-stock-assessment-report/ (Accessed October 24, 2024).
SEDAR (Southeast Data, Assessment, and Review) (2020). SEDAR 38 Update Gulf of Mexico king mackerel (North Charleston, SC: SEDAR), 82. Available at: https://sedarweb.org/documents/2019-update-sedar-38-update-assessment-report-gulf-of-Mexico-king-mackerel/ (Accessed October 24, 2024).
SEDAR (Southeast Data, Assessment, and Review) (2022). SEDAR 74 Gulf of Mexico Red Snapper Section III: Data Workshop Report (North Charleston, SC: SEDAR), 225. Available at: https://sedarweb.org/documents/sedar-74-gulf-of-Mexico-data-workshop-report/ (Accessed October 24, 2024).
SEDAR (Southeast Data, Assessment, and Review) (2024). SEDAR 87 Gulf of Mexico White, Pink, and Brown Shrimp Section II: Data Workshop Report (North Charleston, SC: SEDAR), 94. Available at: https://sedarweb.org/documents/sedar-87-gulf-of-Mexico-white-pink-and-brown-shrimp-data-workshop-report/ (Accessed October 24, 2024).
Shrimp/Groundfish Work Group (2017). Meeting summary for the Shrimp/Groundfish Work Group – Thursday, May 18, 2017 (Ocean Springs, MS: Gulf States Marine Fisheries Commission), 2.
Springer S., Bullis H. R. (1956). Collections by the Oregon in the Gulf of Mexico: List of crustaceans, mollusks, and fishes identified from collections made by the exploratory Fishing Vessel Oregon in the Gulf of Mexico and adjacent seas 1950 through 1955 (Washington, D.C.: U.S. Department of the Interior, Bureau of Commercial Fisheries). Available at: https://spo.nmfs.noaa.gov/sites/default/files/legacy-pdfs/SSRF196.pdf (Accessed October 24, 2024).
Stuntz W. E., Bryan C. E., Savastano K., Waller R. S., Thompson P. A. (1985). SEAMAP environmental and biological atlas of the Gulf of Mexic (Ocean Springs, MS: Gulf States Marine Fisheries Commission), 145. Available at: https://www.gsmfc.org/publications/SEAMAP/SEAMAP%20Environmental%20and%20Biological%20Atlas%201982.PDF (Accessed October 24, 2024).
Switzer T. S., Keenan S. F., Thompson K. A., Shea C. P., Knapp A. R., Campbell M. D., et al. (2023). Integrating assemblage structure and habitat mapping data into the design of a multispecies reef fish survey. Mar. Coast. Fish 15, e10245. doi: 10.1002/mcf2.10245
Thompson K. A., Switzer T. S., Christman M. C., Keenan S. F., Gardner C. L., Overly K. E., et al. (2022). A novel habitat-based approach for combining indices of abundance from multiple fishery-independent video surveys. Fish. Res. 247, 106178. doi: 10.1016/j.fishres.2021.106178
Thorson J. T. (2019). Guidance for decisions using the Vector Autoregressive Spatio-Temporal (VAST) package in stock, ecosystem, habitat and climate assessments. Fish. Res. 210, 143–161. doi: 10.1016/j.fishres.2018.10.013
Watson J. W., Bane N. (Eds.) (1985). Proceedings: SEAMAP Shrimp and Bottomfish Sampling Gear Workshop Vol. 12 (Ocean Springs, MS: Gulf States Marine Fisheries Commission). Available at: https://www.gsmfc.org/publications/GSMFC%20Number%20012.pdf (Accessed October 24, 2024).
Keywords: design change, survey expansion, SEAMAP, groundfish, shrimp, trawl survey, Gulf of Mexico
Citation: Pollack AG, Hoffmayer ER, Switzer TS, Hanisko DS, Hendon JM, Mareska J, Martinez-Andrade F, Rester J, Zuckerman ZC and Pellegrin G (2025) Assessing survey design changes of long-term fishery-independent groundfish trawl surveys in the Gulf of Mexico. Front. Mar. Sci. 12:1425362. doi: 10.3389/fmars.2025.1425362
Received: 29 April 2024; Accepted: 15 January 2025;
Published: 04 February 2025.
Edited by:
Fabio Campanella, National Research Council (CNR), ItalyReviewed by:
Michela Martinelli, National Research Council (CNR), ItalyWalter Bubley, South Carolina Department of Natural Resources, United States
Copyright © 2025 Pollack, Hoffmayer, Switzer, Hanisko, Hendon, Mareska, Martinez-Andrade, Rester, Zuckerman and Pellegrin. This is an open-access article distributed under the terms of the Creative Commons Attribution License (CC BY). The use, distribution or reproduction in other forums is permitted, provided the original author(s) and the copyright owner(s) are credited and that the original publication in this journal is cited, in accordance with accepted academic practice. No use, distribution or reproduction is permitted which does not comply with these terms.
*Correspondence: Adam G. Pollack, YWRhbS5wb2xsYWNrQG5vYWEuZ292