Abstract
Introduction:
The molting processes are crucial for the survival and development of crustaceans. Eriocheir sinensis demonstrates representative discontinuous growth during molting, while muscle is the most obvious tissue exhibiting this property. However, the signal regulation mechanisms involved in muscle during molting remain unexplored.
Methods:
In this work, a comprehensive analysis of the gene expressions in E. sinensis muscle between post-molt and inter-molt stages were performed by integrating the ATAC-seq and RNA-seq techniques.
Results:
The integration analysis identified 446 up-regulated and 21 down-regulated genes in the two stages. GO enrichment analysis revealed that the up-regulated genes are largely associated with protein phosphorylation and phosphorus metabolism, while the down-regulated genes are mainly involved in DNA metabolism, transcription, cell adhesion, and G protein-coupled receptor (GPCR) signaling pathway. In all the enriched signaling pathways, GPCR signaling pathway includes the most differentially expressed genes (8 genes), which underlines its importance in the signal transduction from the post-molt stage to the inter-molt stage. Further protein structure analysis and RT-qPCR validation confirmed five GPCR genes related to molting process, in which four genes (GRM7, FMRFaR, mth2, gpr161) are active during the post-molt stage and one gene (moody) functions during the inter-molt stage.
Discussion:
These findings highlight the key regulatory proteins and pathways involved in E. sinensis muscle during molting and also offer foundational data for studying the mechanisms of molting and discontinuous growth in crustaceans.
1 Introduction
Eriocheir sinensis (Chinese Mitten Crab) belongs to the Crustacea, Mollusca, Decapoda, Crabaidae, and Eriocheir. It is a valuable species in aquaculture, where molting serves as a critical physiological process affecting its growth and development. Understanding the physiological properties and gene expression of E. sinensis across various molting stages is essential for improving its aquaculture production. In crustaceans, the molting cycle is a cyclical event defined as the interval from the last molting to the next molting (Chang and Mykles, 2011). This cycle includes four distinct stages: (1) inter-molt (C stage): after the last molting is completed and the new shell hardens, the subcutaneous cells of crustaceans begin to increase and elongate, and secrete the epidermis and pigment layer that make up the new skin. This process is called the inter-molt stage, which is the longest period of molting process among the four molting stages; (2) pre-molt (D stage, with sub-stages D0, D1, and D3-4): at this stage, crustaceans begin to prepare for molting, including absorbing calcium carbonate from the old shell and storing it in bodily fluids, while soft folds grow in the shell; (3) molt (E stage): crustaceans begin to molt, and their old shells slowly crack open and fall off. During this process, the folds gradually expand, forming new shells; (4) post-molt (A-B stages): the new shell is still soft just after molting. The period from the soft shell to the completely hardening of the new shell is called the pre-molt stage (Kang et al., 2012). E. sinensis undergoes approximately 18 times of molting in its lifetime. Molting is closely related to its growth and development. The abnormal of molting may cause death or precocious puberty, which is a significant issue affecting the yield and economic value of E. sinensis. Exploration of the molting mechanism of E. sinensis is of great significance for addressing the issue of precocious puberty and breeding new varieties with better properties.
The molting process is known to be regulated through the antagonistic effects of ecdysone and molting-inhibiting hormones (MIH) secreted by Y-organ (Pu et al., 2015). Ecdysone primarily promotes molting and the MIH delays the molting process by regulating the secretion of ecdysones through a negative feedback mechanism. Several molting related genes have been found and cloned in E. sinensis, such as ecdysone receptor gene, retinoid X receptor gene, chitinase genes, myostatin genes and hyperglycemic hormone gene (Wang et al., 2013; Gong et al., 2014). However, the underlying molecular mechanism about how the other organs/tissues receive these hormone signals and produce responses is currently unknown. Molting is a multi-stage process involving multiple organs/tissues. The expressions of molting-related genes are significantly changed during molting cycle, with unique gene expression patterns in various tissues. For example, in the hepatopancreas of E. sinensis, the differentially expressed genes (DEGs) enriched in the post-molt stage were found related to energy consumption, whereas genes enriched in the inter-molt stage were linked to carbohydrates, lipids metabolic and biosynthetic processes. In the pre-molt stage, the highly expressed genes were enriched in response to steroid hormone stimulus and immune system development (Huang et al., 2015; Li et al., 2023). In the gill of E. sinensis, genes in chitin metabolism were found enriched during the post-molt and molt stages, while glucosamine metabolic enzymes were up-regulated during the inter-molt and pre-molt stages (Li et al., 2019). These studies indicates that the molting process may be regulated by different mechanisms in various organs/tissues and stages. Therefore, the analysis of the regulation mechanism of molting requires independent analysis for different organs/tissues and molting stages.
Muscles of E. sinensis exhibit obvious discontinuous growth during molting. Significant differences in fiber diameter and density of muscle are observed across various molting stages (Yue et al., 2021). Muscle fiber diameter and density increase considerably during the molt stage and gradually revert to normal levels in the post-molt and inter-molt stages (Jiang et al., 2020). Tian et al. conducted a transcriptome analysis of E. sinensis claw muscle across molting stages, revealing that molting-related gene expression in claw muscle is primarily linked to muscle contraction, energy metabolism and cytoskeletal remodeling (Tian and Jiao, 2019). In addition, Sun et al. utilized ATAC-seq and RNA-seq to investigate GPCR activity in E. sinensis muscle during the pre-molt and post-molt stages, finding that six GPCRs are significantly up-regulated in the post-molt stage (Sun et al., 2022). These observations indicate that distinct regulation mechanism may be employed in different molting stages due to the unique physiological changes in each stage.
The signaling regulation during molting in E. sinensis is still unclear. Hou et al. discovered that RNA interference targeting the serine/threonine-protein kinase EsmTOR significantly delayed the molting process in E. sinensis, suggesting the involvement of EsmTOR in molting (Hou et al., 2021). Within the mTOR signaling pathway, the following genes showed significant down-regulation after EsmTOR interference: the upstream genes EsSLC7A5 and EsVATB involved in amino acid transport; the downstream gene EsS6K1, which facilitates ribosomal protein synthesis; and the key molting-related genes EsMIH and EsEcR. This finding indicates that EsmTOR plays a critical role in the molting regulation via the SLC7A5-V-ATPase-mTORC1 network. Furthermore, in Gecarcinus lateralis, up to 23 signaling pathways were found existing in the Y-organ to control the molting hormone synthesis, with significant expression changes observed in genes associated with MIH, mTOR, TGF-β/activin, Notch, MAPK, and Wnt signaling pathways (Das et al., 2018). Shyamal et al. also reported that mTOR directly or indirectly regulates the transcription of genes that activate the Y-organ in G. lateralis (Shyamal et al., 2018).
The transition from the post-molt to inter-molt stage represents a crucial period characterized by notable changes in muscle morphology and distinct intermittent growth patterns. However, no studies have explored the signal regulation in muscle of E. sinensis during these stages. Besides, the current high-throughput analysis about the molting process is mostly based on the RNA-seq data, while it is difficult to avoid the problem of false positives results with the RNA-seq technique. ATAC-seq is a technology to study the chromatin accessibility with the DNA transposase Tn5 (Buenrostro et al., 2015). Many studies have shown that the combination of ATAC-seq and RNA-seq techniques can effectively improve the quality of the testing results and have been applied well in analyzing the gene regulation and expression (Yang et al., 2019; Wang et al., 2022; Xu et al., 2022).
In this work, an integrated analysis of ATAC-seq and RNA-seq data from E. sinensis muscle during the post-molt and inter-molt stages were firstly performed to identify the DEGs specific to these periods. The GO and KEGG pathway enrichment analyses were conducted with particular emphasis on the genes associated with signal regulation. The purpose of this study is to explore the signal regulation process and reveal the key genes involved in the signal regulation during post-molt and inter-molt stages within muscle of E. sinensis. The results may offer new insights for a more comprehensive understanding of molting mechanisms and the discontinuous growth observed in crustaceans.
2 Materials and methods
2.1 Experiment design of this work
In order to perform an integrated analysis of ATAC-seq and RNA-seq for the post-molt and inter-molt stages, the E. sinensis muscle samples at the inter-molt stage were collected and sequenced with ATAC-seq and RNA-seq. The ATAC-seq and RNA-seq data for post-molt stages were obtained from GEO database with GEO number as GSE206233. The peak enrichments of the two stages obtained from ATAC-seq were compared to identify the differentially enriched peaks (DEPs), and then the gene expressions of the two stages obtained from RNA-seq were compared to find the DEGs. The genes with DEPs from ATAC-seq were compared with the DEGs from RNA-seq to obtain the integrated DEGs (IDEGs). Based on the GO and KEGG enrichment analysis of the IDEGs, signal regulation were found to have essential roles in the regulation of molting from post-molt to inter-molt stages, and the signaling pathways and candidate GPCR genes involved in this process were identified. Structure analysis and Real-time quantitative PCR (RT-qPCR) were subsequently performed to further verify the GPCRs functioning in the two stages. The diagram of experiment design was shown in Figure 1.
Figure 1

The diagram of experiment design.
2.2 Animals and sampling
Healthy juvenile E. sinensis crabs were obtained from Tianjin Xieyuan Aquaculture Co., Ltd., averaging a carapace length of 24.28 ± 1.54 mm, carapace width of 26.97 ± 1.65 mm, and a weight of 8.41 ± 1.47 g. The crabs were housed in a plastic incubator (70 × 40 × 50 cm) under controlled conditions of 20 ± 1°C and natural light exposure for over 7 days. They were fed a compound diet twice daily, with each feeding amounting to approximately 5% of their body weight. To maintain water quality, a siphoning method was used to remove leftover feed and introduce fresh water, ensuring more than 50% of the water was refreshed daily.
For muscle sample collection, three crabs were selected from the inter-molt stage. Muscle samples were extracted from the crabs’ walking legs. The inter-molt stage can be confirmed by the hardening of the new exoskeleton, with the disappearance of the translucent space between the epithelium and exoskeleton. Additionally, the setae at the distal ends of the maxillipedal exopods showed a tubular epidermal structure, with the setal matrix undergoing fibrillation to form setal cones, which is the distinct morphological markers of the inter-molt phase (Kang et al., 2013).
To prepare for tissue collection, crabs in the inter-molt stage were first anesthetized using ice. Muscles from the walking legs were rapidly collected and submerged immediately in liquid nitrogen for preservation, and then stored at -80°C for long-term storage. Each muscle sample was divided into two parts for analysis: one for ATAC-seq and the other for RNA-seq. The cell activity of the muscle samples was assessed with the Trypan blue assay.
2.3 ATAC-seq analysis
For ATAC-seq analysis, three muscle samples from inter-molt stages were designated as Mu_C_1, Mu_C_2, and Mu_C_3. The ATAC-seq protocol was based on the method described by Corces et al (Corces et al., 2017). Briefly, nuclei were isolated from the muscle samples and treated with a Tn5 transposase reaction mixture. Next, adapter 1 and adapter 2 were added in equal concentrations, followed by PCR amplification of the library. Library quality was confirmed using Qubit analysis. Sequencing was then performed on the Illumina NovaSeq platform (Illumina, San Diego, CA, USA), producing 150 bp paired-end reads. The raw data were trimmed with the skewer software (version 0.2.2, Beijing, China) (Jiang et al., 2014). Quality metrics, Q20 and Q30, were calculated for both raw and processed data. The reads were then aligned to a reference genome from the NCBI BioProject database (accession number PRJNA555707) using BWA (version 0.7.12-r1039, Cambridge, UK) (Li and Durbin, 2009) with default settings. High-quality reads (MAPQ ≥ 13) that mapped to non-mitochondrial chromosomes were retained. Peak calling was performed using MACS2 (version 2.1.2, Boston, MA, USA) (Zhang et al., 2008)
The ATAC-seq dataset for the post-molt stage was obtained from the GEO database (GSE206233). The data of post-molt and inter-molt stages were compared with the DESeq2 R package (version 1.20.0, Boston, MA, USA) (Love et al., 2014). P-values were adjusted using the Benjamini-Hochberg method to control the false discovery rate. Peaks with p-value ≤ 0.05 and |log2FoldEnrich| ≥ 1 were identified as DEPs. The distribution of these peaks across various genomic regions was assessed with ChIPseeker (version 1.38.0, Hong Kong, China) (Yu et al., 2015), following a hierarchical classification: promoter, untranslated region (UTR), exon, intron, downstream of transcription termination site (TTS), and distal intergenic regions.
GO enrichment analysis for genes with DEPs was conducted using Goseq (version 4.10.2, Parkville, Australia) (Young et al., 2010) and KOBAS (version 3.0, Beijing, China) (Mao et al., 2005) was used for Kyoto Encyclopedia of Genes and Genomes (KEGG) pathway enrichment analysis.
2.4 RNA-seq analysis
RNA-seq of E. sinensis muscle samples was performed using Illumina high-throughput technology. Total RNA was extracted via the TRIzol method (Invitrogen), and its integrity was evaluated with RNA Nano 6000 Assay Kit on an Agilent Bioanalyzer 2100 system (Agilent Technologies, Santa Clara, CA, USA). The library was conducted and the quality of the libraries was confirmed on the same system. Sequencing was then conducted on an Illumina NovaSeq platform, generating 150 bp paired-end reads. Initial sequencing data, or raw reads, were processed into usable data through base-calling. Clean reads were generated by removing reads containing adapters, poly-N sequences, and low-quality scores. Key quality metrics such as Q20, Q30, and GC content were calculated for these clean reads. The reference genome for E. sinensis, obtained from the NCBI BioProject database (accession number PRJNA555707), was used for alignment. The clean reads were aligned with the reference genome with Hisat2 (version 2.0.5, Baltimore, Maryland, USA) (Kim et al., 2015). The FPKM (Fragments Per Kilobase of exon model per Million mapped fragment) values were calculated for each gene.
The RNA-seq dataset for the post-molt stage was sourced from the GEO database (GSE206233). Differential expression analysis between post-molt and inter-molt stages was conducted with DESeq2 (version 1.20.0, Boston, MA, USA) (Love et al., 2014). Genes with padj ≤ 0.05 and |log2FoldChange| ≥ 1 were classified as DEGs. GO and KEGG pathway enrichment analysis for these DEGs were conducted using Goseq (version 4.10.2, Parkville, Australia) (Young et al., 2010) and KOBAS (version 3.0, Beijing, China) (Mao et al., 2005), respectively. The ATAC-seq and RNA-seq datasets for inter-molt stage in muscle of E. sinensis have been submitted to GEO database with the accession number as GSE281094.
2.5 Integration analysis of ATAC-seq and RNA-seq
For the integration analysis of ATAC-seq and RNA-seq data, the correlation between genes with DEPs from ATAC-seq and the DEGs from RNA-seq was examined. DEGs that were up-regulated in the RNA-seq data were compared with the corresponding genes linked to up-regulated peaks identified in ATAC-seq. Conversely, down-regulated DEGs from RNA-seq were matched with genes related to down-regulated peaks in ATAC-seq. Genes demonstrating consistent profiles across both analytical methods were selected for further GO enrichment analysis.
2.6 Structure analysis of proteins encoded by candidate GPCR genes
For structural analysis of the proteins encoded by the identified candidate GPCRs, TMHMM (https://services.healthtech.dtu.dk/service.php?TMHMM-2.0, accession on Mar. 24th, 2024) (Krogh et al., 2001) was utilized to predict the transmembrane helices (TMHs) in the candidate GPCRs. PredictProtein (https://predictprotein.org/, accession on Mar. 24th, 2024) (Bernhofer et al., 2021) and SWISS-MODEL (https://swissmodel.expasy.org/, accession on Mar. 24th, 2024) (Waterhouse et al., 2018) were employed for predicting the secondary and three-dimensional structures of the proteins.
2.7 RT-qPCR verification of candidate GPCR genes
Gene expression levels of these candidate GPCRs were verified through RT-qPCR. Each gene had three corresponding muscle samples used for RT-qPCR validation as biological replicates. Each of these samples consisted of mixed muscle tissues from three different crabs to minimize individual variance. Primer sequences utilized in the RT-qPCR are provided in Supplementary Table 1. RNA extraction was performed using TRIzol reagent (Invitrogen, San Diego, CA, USA), followed by reverse transcription using the PrimeScriptTM RT Master Mix (Perfect Real Time) test kit (Takara, Japan). Fluorescence quantification was performed using the TB Green® Premix Ex TaqTM II(Tli RNaseH Plus) *2 test kit (Takara, Japan) with the ABI Applied Biosystems instrument. The housekeeping gene used for normalization was β-actin. The RT-qPCR reaction mix was 20-µl and the thermal cycling conditions were set at 95°C for 30 s, followed by 40 cycles at 95°C for 5 s and 60°C for 30 s, concluding with a final extension at 60°C for 1 min. Quantitative analysis of the data was performed using the 2^–ΔΔCt method.
3 Results
3.1 Results of ATAC-seq analysis
3.1.1 Results and quality control of ATAC-seq
The results and quality control parameters for ATAC-seq of the three inter-molt samples are shown in Table 1 (See also Supplementary Figure 1). The average Q20 and Q30 for the clean reads across the samples were 93.66% and 85.95%, respectively, indicating high sample quality. The A/T and G/C ratios of reads are within the deviation. The deviation of GC content distribution of reads from the theoretical value is less than 15%. The N ratio does not exceed 5%. The average alignment rate of clean reads to the non-mitochondrion reference genome is 87.67%. In the analysis of ATAC-seq data, the unique-mapped and non-duplicated reads is the focus of subsequent analysis. The average rate of unique-mapped reads relative to clean reads was 65.07%, and that of the de-duplicated unique reads relative to the clean reads is 51.93%. The sequence duplication level is within the deviation. The number of detected peaks ranged from 49,000 to 58,000, with summit counts ranging from 62,000 to 77,000.
Table 1
| Sample | Clean reads | Clean ratio | Q20 | Q30 | Unique_mapped1 | Dedup_unique_mapped2 | Peak | Summits |
|---|---|---|---|---|---|---|---|---|
| Mu_ C_1 | 46,653,049 | 72.99% | 92.50% | 83.31% | 31,044,864(66.54%) | 25,036,817(53.67%) | 57,320 | 76,917 |
| Mu_ C_2 | 43,498,496 | 67.67% | 94.56% | 87.82% | 27,718,950(63.72%) | 21,874,560(50.29%) | 49,574 | 62,643 |
| Mu_ C_3 | 42,792,140 | 69.52% | 93.92% | 86.71% | 27,793,624(64.95%) | 22,182,228(51.84%) | 56,919 | 75,785 |
Results of ATAC-seq.
1 The number of reads with unique alignment positions on the reference sequence (the proportion in parentheses is the percentage of unique_mapped reads relative to clean reads).
2 The number of reads after removing multiple reads in unique_mapped reads (the proportion in parentheses is the percentage of dedup_unique_mapped reads relative to the clean reads).
The density of total mapped reads aligned to each chromosome (divided into positive and negative chains) on the genome was also counted. From the graph of the reads mapped to the chromosome, the relationship between the chromosome length and the total number of reads was reflected intuitively (Supplementary Figure 2). Normally, the longer the chromosome is, the more reads mapped to it. The results in Supplementary Figure 2 exactly displayed the positive correlation between the chromosome length and the number of reads, which reflects the reliability of sequencing quality.
3.1.2 Correlation analysis of samples
To assess the quality of the six ATAC-seq samples—Mu_A_1, Mu_A_2, Mu_A_3 in the post-molt group and Mu_C_1, Mu_C_2, Mu_C_3 in the inter-molt group—, a Spearman correlation analysis was conducted based on the FoldEnrich values of peaks (Figure 2A). The results showed that the correlations among samples within the same group exceeded 0.92 and the intragroup correlations were higher than the intergroup correlations, thereby reflecting the reliability of the sample quality. The average signal distribution across a 3 kb region upstream and downstream of peak summits were analyzed and revealed significant differences among samples in the gene regulatory regions. The Genebody heatmap highlighted the enhanced transcriptional activity within gene body regions under specific conditions (Figure 2B), while the TSS heatmap underscored the key role of promoter regions and adjacent areas in transcription initiation (Figure 2C). These results indicate substantial transcriptional activity enhancement in these regions under specific conditions.
Figure 2

Results of the assay for ATAC. “A” represents the post-molt stage, and “C” stands for the inter-molt stage. (A) Heatmap of spearman correlation analysis; (B) Mapped read distributions across the gene bodies; (C) mapped read distributions across the TSS.
3.1.3 Identification of DEPs
DEPs were analyzed between samples from Mu_A and Mu_C (Figure 3A). A total of 9,266 peaks exhibited up-regulated enrichment, 3,738 peaks showed down-regulated enrichment, and 88,535 peaks were statistically insignificant. By identifying and categorizing transcriptional regulatory regions across the genome and calculating their proportions among up-regulated and down-regulated peaks, the complete genomic distribution of differential peaks was mapped (Figure 3B). Among the up-regulated peaks, 0.66% was located in promoter regions near the transcription start site (Promoter-TSS), while 0.72% of the down-regulated peaks were found in this area. Exonic regions accounted for 4.23% of the up-regulated peaks and 13.04% of the down-regulated peaks, highlighting the role of exons in gene expression regulation. Intronic regions comprised 48.06% of the up-regulated peaks and 27.43% of the down-regulated peaks, suggesting a complex regulatory role for introns in transcription. Additionally, un-translated regions (UTRs) accounted for 13.04% of the up-regulated peaks and 2.11% of the down-regulated peaks, possibly indicating a role for the 5’ or 3’ UTRs in the precise regulation of gene expression. In the distal intergenic regions, 70.75% of the down-regulated peaks and 17.99% of the up-regulated peaks were located, suggesting that distal regulatory elements may play a crucial role in the downward regulation of genes.
Figure 3

Differential enrichment analysis of ATAC-seq peaks. (A) Differential enrichment of ATAC-seq peaks; (B) The genome-wide distribution of differentially enriched peaks.
3.1.4 GO enrichment analysis of genes with DEPs from ATAC-seq
The GO enrichment analyses were performed for genes with up-regulated and down-regulated DEPs to identify significantly enriched biological processes, cellular components, and molecular functions. Figure 4A presents the GO enrichment analysis results for genes with up-regulated DEPs. In the biological process category, terms such as “cellular process,” “protein phosphorylation,” “phosphate-containing compound metabolic process,” and “amino sugar metabolic process” were notably enriched. Additionally, the enrichment of “regulation of biosynthetic process” and “regulation of transcription, DNA-templated” suggests an essential role for biosynthesis and transcriptional regulation in the post-molt stage. In the cellular component category, genes with up-regulated DEPs were primarily enriched in the “extracellular matrix” and “cell periphery,” indicating the communication between cells through extracellular and cell periphery may play important roles in the post-molt stage. The significant enrichment of “transferase complex, transferring phosphorus-containing groups” aligns with the enrichment of “protein phosphorylation” in biological process category. In the molecular function category, terms like “protein kinase activity” and “phosphotransferase activity” further highlight the importance of phosphorylation in the post-molt stage.
Figure 4

GO enrichment analysis of genes with up-regulated (A) and down-regulated (B) DEPs identified in ATAC-seq.
Figure 4B shows the GO enrichment analysis results for genes with down-regulated DEPs in the ATAC-seq analysis, where these genes are predominantly active during the inter-molt stage. In biological process, genes with down-regulated DEPs were significantly enriched in terms related to “DNA recombination,” “DNA integration,” “DNA metabolic process,” and “chromosome condensation,” suggesting that these genes are involved in DNA repair, replication, and chromosomal maintenance. In the cellular component category, terms like “intermediate filament cytoskeleton” and “supramolecular complex” imply the roles of genes in the cytoskeleton and supramolecular structures. In molecular function, the enrichment of terms such as “transposase activity,” “sigma factor activity,” and “RNA-DNA hybrid ribonuclease activity” underscores the significance of these genes in transposition, DNA binding, and RNA processing during the inter-molt stage.
3.2 Results of RNA-seq analysis
3.2.1 Results and quality control of RNA-seq
The results and quality control for RNA-seq sequencing of the three inter-molt samples are shown in Table 2 (see also Supplementary Figure 3). The average Q20 and Q30 values for all samples were 96.63% and 91.92%, respectively, indicating high sample quality. The A/T and G/C ratios of reads are within the deviation. The ratios of clean reads relative to raw reads exceed 92% in all the samples. The clean reads were mapped to the reference genome of E.sinensis (Tang et al., 2019). The assembled size of the reference genome was 1.27 Gb. Approximately 94.00% of the expected eukaryotic genes were completely present in the genome assembly based on assessment using Benchmarking Universal Single-Copy Orthologs (BUSCO). Totally 22,619 protein-coding genes were annotated in the genome. The average alignment rate of the clean reads to the reference genome across the three samples was 79.82%.
Table 2
| Sample | Raw reads | Clean reads | Error rate | Q20 | Q30 | GC | Unique_mapped1 |
|---|---|---|---|---|---|---|---|
| Mu_ C_1 | 26,454,128 | 25,623,436 | 0.01 | 96.65 | 92 | 52.62 | 20,472,977(79.9%) |
| Mu_ C_2 | 29,523,954 | 28,406,970 | 0.02 | 96.49 | 91.7 | 52.1 | 22,594,948(79.54%) |
| Mu_ C_3 | 26,907,334 | 25,906,670 | 0.01 | 96.75 | 92.05 | 56.55 | 20,703,099(79.91%) |
Results of RNA-seq.
1 The number of reads with unique alignment positions on the reference sequence (the proportion in parentheses is the percentage of unique_mapped reads relative to clean reads).
To evaluate the quality and correlation among the six samples, a Spearman correlation analysis was conducted using the FPKM values for all the genes. The results showed strong correlations within groups, confirming the high quality of the samples (Figure 5A). Additionally, an analysis of genomic composition across the six samples indicated that the intergenic regions represented the largest percentage, suggesting that non-coding regions make up a substantial portion of RNA in these samples (Figure 5B). The proportion of exons was significantly higher than that of introns. Typically, exons should make up the largest proportion in the RNA samples, however, for E. sinensis, the genome sequence is less complete compared to the model organisms, which may account for the relatively high proportion of intergenic regions.
Figure 5
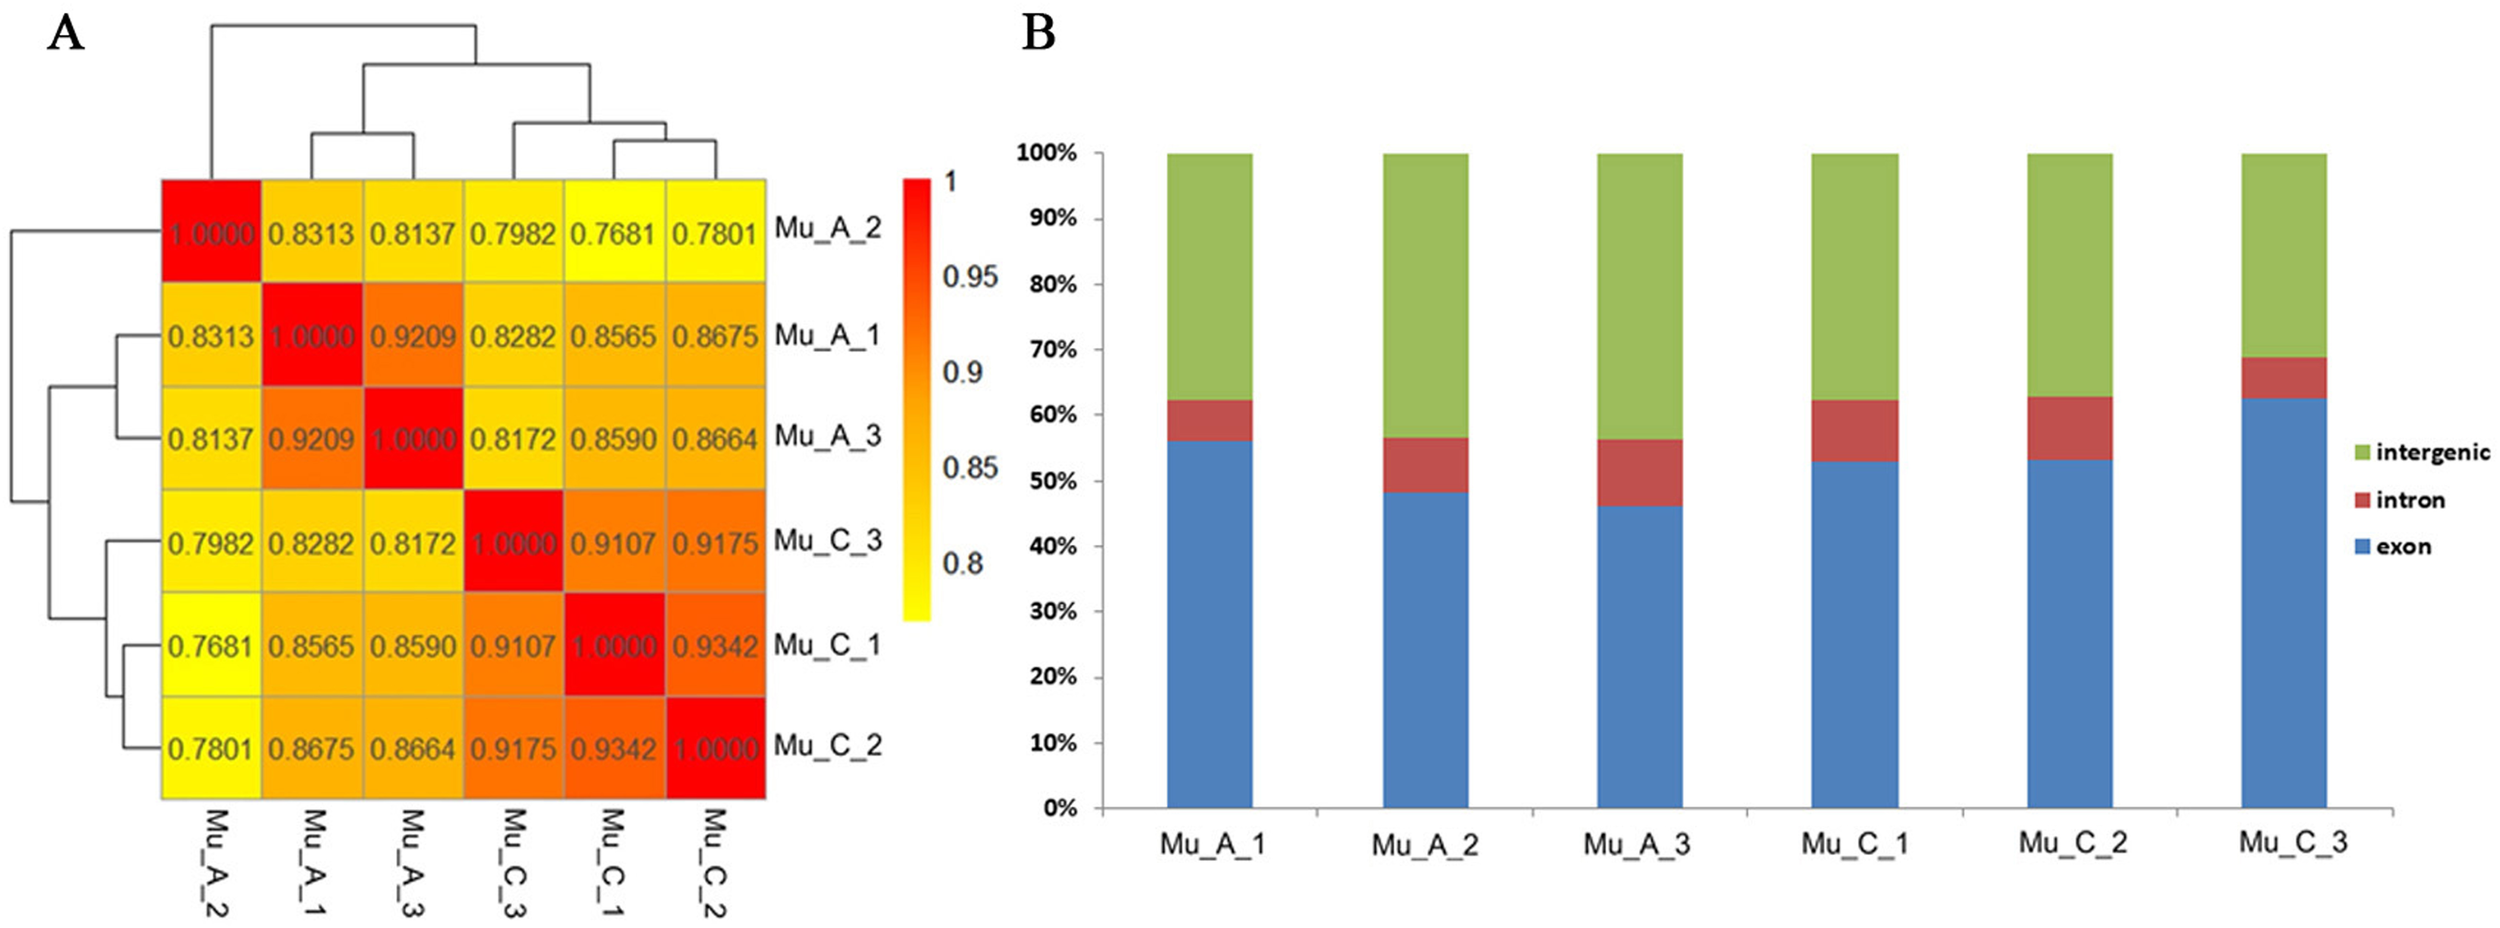
Heatmap of Spearman correlation analysis (A) and proportions of genomic elements (B) for six samples.
3.2.2 DEGs and GO enrichment analysis
The RNA sequencing results revealed significant differences in gene expression between the Mu_A and Mu_C groups (Figure 6A). A total of 2716 genes were up-regulated, 2539 were down-regulated, and 10,200 showed no significant expression difference. These findings highlight substantial gene expression variations between the post-molt and inter-molt stages.
Figure 6
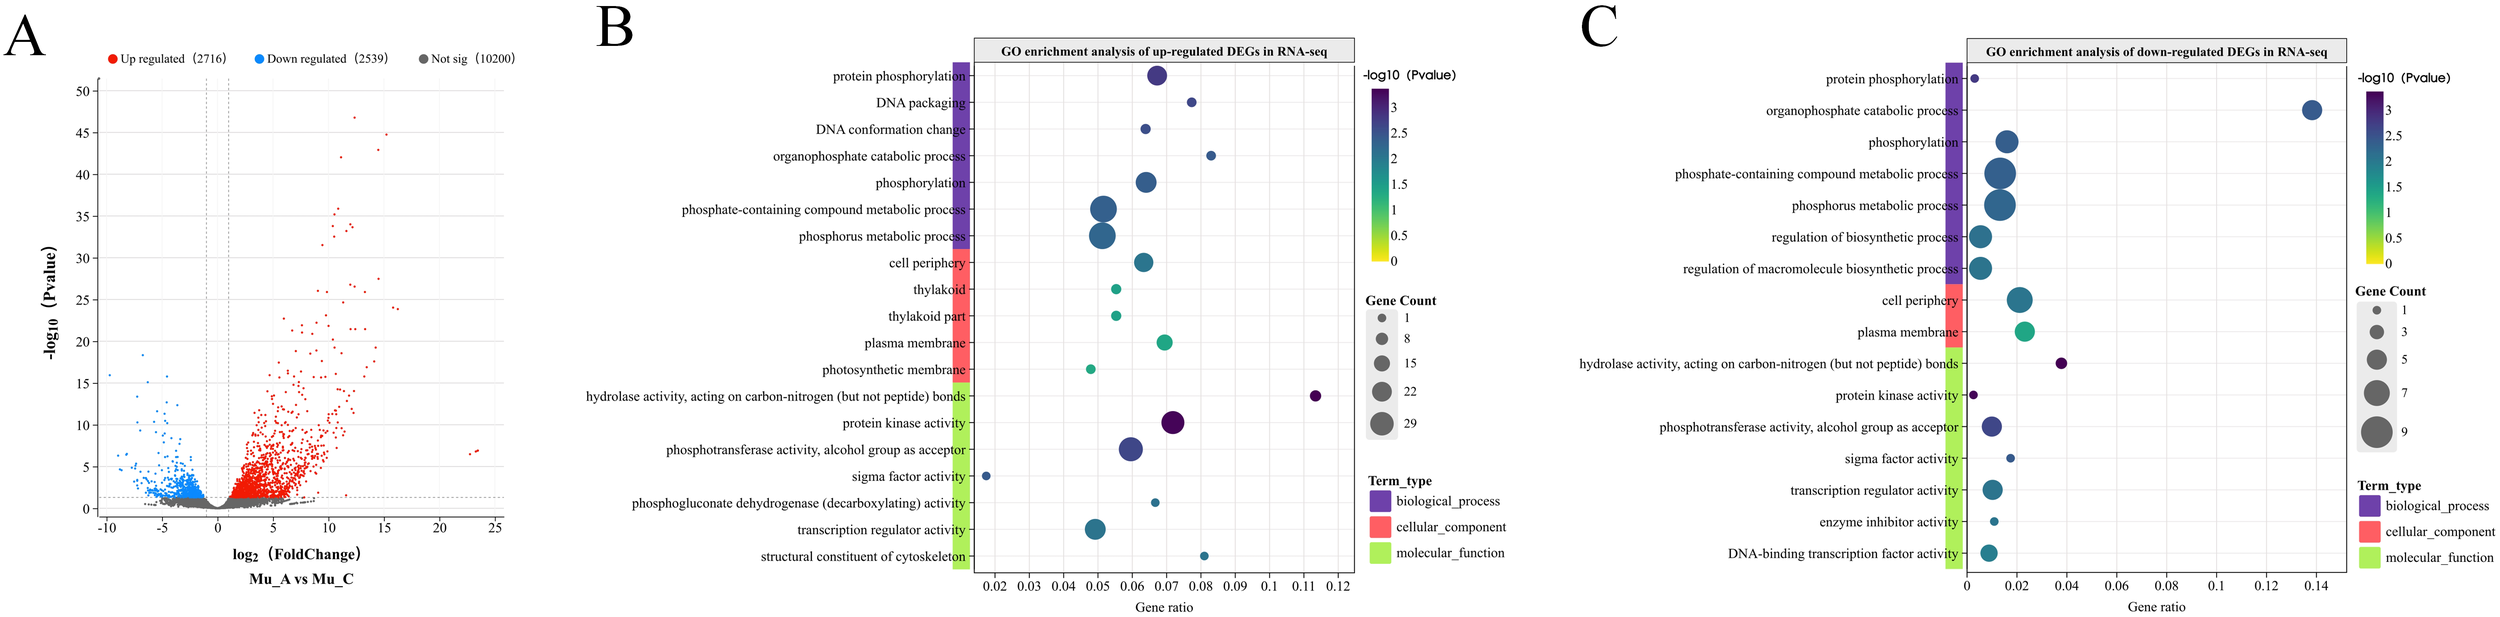
DEGs and GO enrichment analysis in RNA-seq. (A) Volcano plot depicting the DEGs between Mu_A and Mu_C. (B) GO enrichment analysis of up-regulated DEGs. (C) GO enrichment analysis of down-regulated DEGs.
GO enrichment analysis was performed on DEGs obtained from the RNA-seq. Figure 6B displays the results for up-regulated DEGs, highlighting several biological processes significantly associated with these genes, including “protein phosphorylation”, “DNA packaging”, “DNA conformation changes”, “organic phosphate catabolism”, and “phosphate-containing compound metabolism”. These processes are essential for cell signaling, DNA replication and repair. In terms of cellular component, the up-regulated DEGs were primarily linked to the “plasma membrane”, “thylakoid”, and “photosynthetic membrane”. For molecular function, these DEGs were significantly enriched in “protein kinase activity”, “phosphotransferase activity”, and “sigma factor activity”. These items are all closely related to the phosphorylation events. Notably, 29 DEGs were associated with protein kinase activity, emphasizing the importance of phosphorylation in cellular activity regulation during the post-molt stage, which is in consistence with the results based on ATAC-seq analysis.
The GO enrichment results for down-regulated DEGs are shown in Figure 6C. Genes highly expressed at the inter-molt stage were significantly linked to the “protein phosphorylation”, “organic phosphate catabolism”, “phosphate-containing compound metabolism”, and “phosphate metabolism”. These processes play crucial roles in cell signaling, energy balance, and biosynthesis regulation. Cellular component analysis revealed significant enrichment in the “plasma membrane” and “cell periphery”. For molecular function, the down-regulated DEGs were enriched in “hydrolase activity”, “protein kinase activity”, “phosphotransferase activity”, and “sigma factor activity”, which is same with the up-regulated DEGs. These results suggest that phosphorylation-related biological processes are also critical during the inter-molt stage.
3.3 Integration analysis of ATAC-seq and RNA-seq
3.3.1 GO enrichment analysis of IDEGs
By comparing the genes with DEPs from ATAC-seq and DEGs identified from RNA-seq, the genes with consistent expression and chromatin accessibility were identified, which were named integrated differentially expressed genes (IDEGs) in this work. The comparison result was summarized in Table 3. A total of 446 up-regulated and 21 down-regulated IDEGs were found by integrating the two sequencing methods (see Supplementary Table 2). GO enrichment analysis was conducted to explore the functions of these IDEGs. In terms of biological process, the up-regulated IDEGs were significantly enriched in “protein phosphorylation”, “phosphate-containing compound metabolic processes”, “amino sugar metabolic processes”, and “the regulation of transcription”, DNA-templated” (Figure 7A). These processes play essential roles in cell signaling, energy metabolism, and gene expression. The cellular component analysis revealed significant enrichment of IDEGs in the “cell periphery”, “extracellular region”, “transferase complex”, and “RNA polymerase complex”. At the molecular function level, significant enrichment was observed in “protein kinase activity” and “phosphotransferase activity”, both associated with phosphorylation. Additionally, enrichment in “actin binding” suggests that these genes may participate in the dynamic regulation of the cytoskeleton.
Table 3
| Subject | Up-regulated | Down-regulated | Total |
|---|---|---|---|
| genes with DEPs from ATAC-seq | 2723 | 597 | 3276 |
| DEGs from RNA-seq | 1376 | 635 | 2011 |
| IDEGs | 446 | 21 | 467 |
Comparison of genes with DEPs from ATAC-seq and DEGs from RNA-seq.
Figure 7
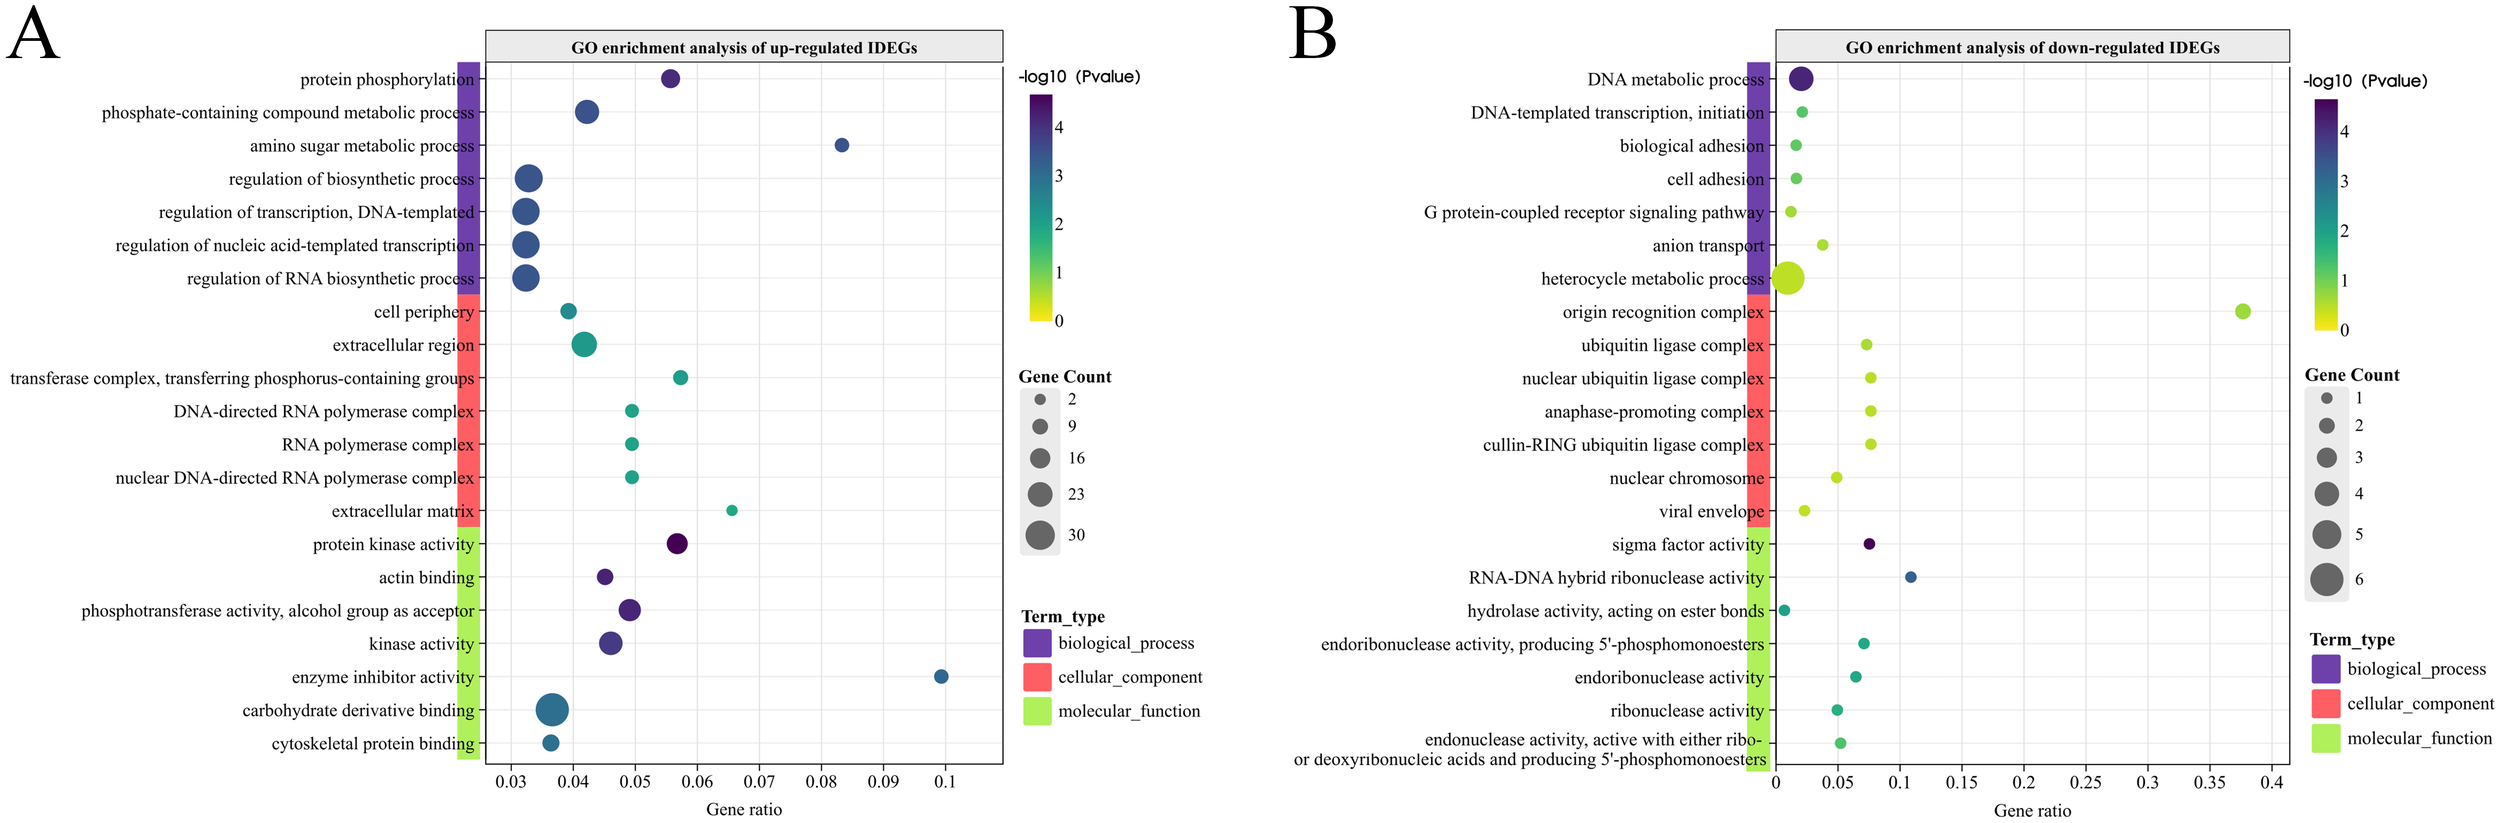
GO enrichment analysis of up-regulated (A) and down-regulated (B) IDEGs.
The down-regulated IDEGs were significantly enriched in “DNA metabolic processes” and “DNA-templated transcription, initiation” (Figure 7B), indicating their roles in gene expression and maintaining DNA integrity. Enrichment in “biological adhesion” and “cellular adhesion” suggests the involvement of genes in cell-cell interactions and tissue structure formation. The enrichment of down-regulated IDEGs in the “G protein-coupled receptor signaling pathway” underscores the importance of signaling pathways during the inter-molt stage. Enrichment in “anion transport” points to a role for IDEGs in maintaining ion balance between cells, while enrichment in the “heterocycle metabolic process” suggests that these genes may be involved in the metabolism of various nitrogen-containing compounds. At the cellular component level, the down-regulated IDEGs were associated with the “origin recognition complex,” “ubiquitin ligase complexes,” and “nuclear chromosomes,” suggesting their roles in the DNA replication and protein degradation pathways. The enrichment of molecular functions such as “sigma factor activity,” “RNA-DNA hybrid ribonuclease activity,” and various ribonuclease and hydrolase activities highlights the potential roles of genes in RNA processing pathways, which is also related to the gene expression.
The published study have mentioned the DEGs involved in gene expression, protein synthesis, muscle development, new cuticle reconstruction and energy metabolic pathways in claw muscle during post-molt at inter-molt stages (Tian and Jiao, 2019). Although they did not distinguish up- or down-regulated genes, part of the results in this work are in consistent with their study, including the up-regulated IDEGs enriched in energy metabolism and gene expression, and the down-regulated IDEGs enriched in the gene expression and protein degradation pathways. In addition, the enrichment analysis of IDEGs in this work further emphasized the important role of signal regulation during the post-molt and inter-molt stages. Although the signal regulation mechanism of muscle in E. sinensis is still unknown, its importance has been indicated in the studies on G. lateralis. The mTOR signaling pathway has been hypothesized to regulate the protein synthesis in claw muscle of G. lateralis (Maclea et al., 2012). And several signaling pathways have been found to be involved in the Y-organ of G. lateralis during molting, such as mTOR, MAPK and Wnt signaling pathways. In our previous study, the MAPK signaling pathways were also found to be included in the regulation from pre-molt to post-molt stages in muscle of E. sinensis (Sun et al., 2022).
3.3.2 Signaling pathway analysis of IDEGs
Regardless of whether genes are up-regulated or down-regulated, the biological processes they enriched are strongly linked to the regulatory processes. Protein phosphorylation is a common chemical process wherein a phosphate group from ATP is added to a cellular compound. This reaction is generally catalyzed by kinases, enzymes that play essential roles in diverse signaling pathways and regulatory mechanisms by modifying protein structures and modulating their activities (Cohen, 2000; Ubersax and Ferrell, 2007). Notably, the G protein-coupled receptor signaling pathway is highly enriched among down-regulated IDEGs, underscoring the significance of signal regulation in both the post-molt and inter-molt stages. Consequently, the GO and KEGG enrichment analyses were further performed to explore the signaling pathways active during these stages, with detailed results provided in Supplementary Table 3.
In the GO enrichment analysis, 32 IDEGs were identified in the signaling category (GO:0023052), spanning in nine signaling pathways (Figure 8A). KEGG enrichment analysis further showed that these IDEGs were enriched in the Hippo, TGF-β, Wnt, mTOR, MAPK, FoxO, and Hedgehog signaling pathways (Figure 8B). The Wnt signaling pathway appeared consistently in both GO and KEGG pathway analyses. In all the signaling pathways, the G protein-coupled receptor signaling pathway contained the most genes (8 genes), with 7 up-regulated and 1 down-regulated IDEG, indicating its importance in signal regulation throughout the post-molt and inter-molt periods of E. sinensis.
Figure 8

Enrichment analysis of signaling pathways. (A) GO enrichment analysis of IDEGs in signaling pathways. (B) KEGG enrichment analysis of IDEGs in signaling pathways.
3.3.3 Structure analysis of candidate GPCRs
The 8 GPCR genes identified by enrichment analysis underwent further structural examination of their encoded proteins. TMHMM was applied to determine whether these proteins possess the transmembrane helical structures, while PredictProtein and SWISSMODEL were used to analyze their secondary and tertiary structures, respectively (see Supplementary Figure 4). These genes were verified as part of the GPCR family with at least two tools confirmed the presence of a characteristic 7-transmembrane helical (7-THM) structure in their encoding proteins. As summarized in Table 4, all genes except U36, U103, and U306 displayed typical GPCR structural features. Notably, the 3D structure of U116 revealed two seven-transmembrane regions, consistent with the typical configuration of type C GPCR metabotropic glutamate receptors. Among the five genes with confirmed GPCR features, U116, U244, U314, and U176 were up-regulated, suggesting a role in the signal regulation during the post-molt stage, while U415 was down-regulated, indicating its role in the signal regulation during the inter-molt stage.
Table 4
| Code | Gene ID | Gene symbol | TMHMM | PredicProtein | SWISSMODEL |
|---|---|---|---|---|---|
| U116 | evm.TU.CM024146.1.116 | GRM7 | 7 | 7 | 7×2 |
| U244 | evm.TU.CM024127.1.244 | FMRFaR | 6 | 7 | 7 |
| U314 | evm.TU.CM024134.1.314 | mth2 | 7 | 7 | 7 |
| U176 | evm.TU.CM024164.1.176 | gpr161 | 7 | 7 | 7 |
| U415 | evm.TU.CM024100.1.415 | moody | 7 | 7 | 7 |
| U36 | evm.TU.CM024097.1.36 | PFD1115c | 1 | 0 | 2 |
| U103 | evm.TU.CM024125.1.103 | TGIF2 | 0 | 0 | 2 |
| U306 | evm.TU.CM024099.1.306 | Arl5b | 0 | 0 | 0 |
Structure analysis of candidate GPCR proteins.
3.3.4 RT-qPCR verification of GPCR genes
Based on the GO enrichment analysis, 8 genes were found enriched in the GPCR signaling pathway. In these genes only the ones with their encoding proteins exhibited the typical 7-THM structural of GPCRs were selected for further verification. There are 5 such genes (U116, U244, U314, U176 and U415) fulfil this selection criteria, and these genes were further validated using RT-qPCR to determine their expression patterns in the post-molt and inter-molt stages. The results indicate that U116, U244, U314, and U176 were up-regulated, while U415 was down-regulated (Figure 9). The RT-qPCR results are consistent with the results of the integrated analyses, further confirming the reliability of the integration analysis based on the ATAC-seq and RNA-seq.
Figure 9
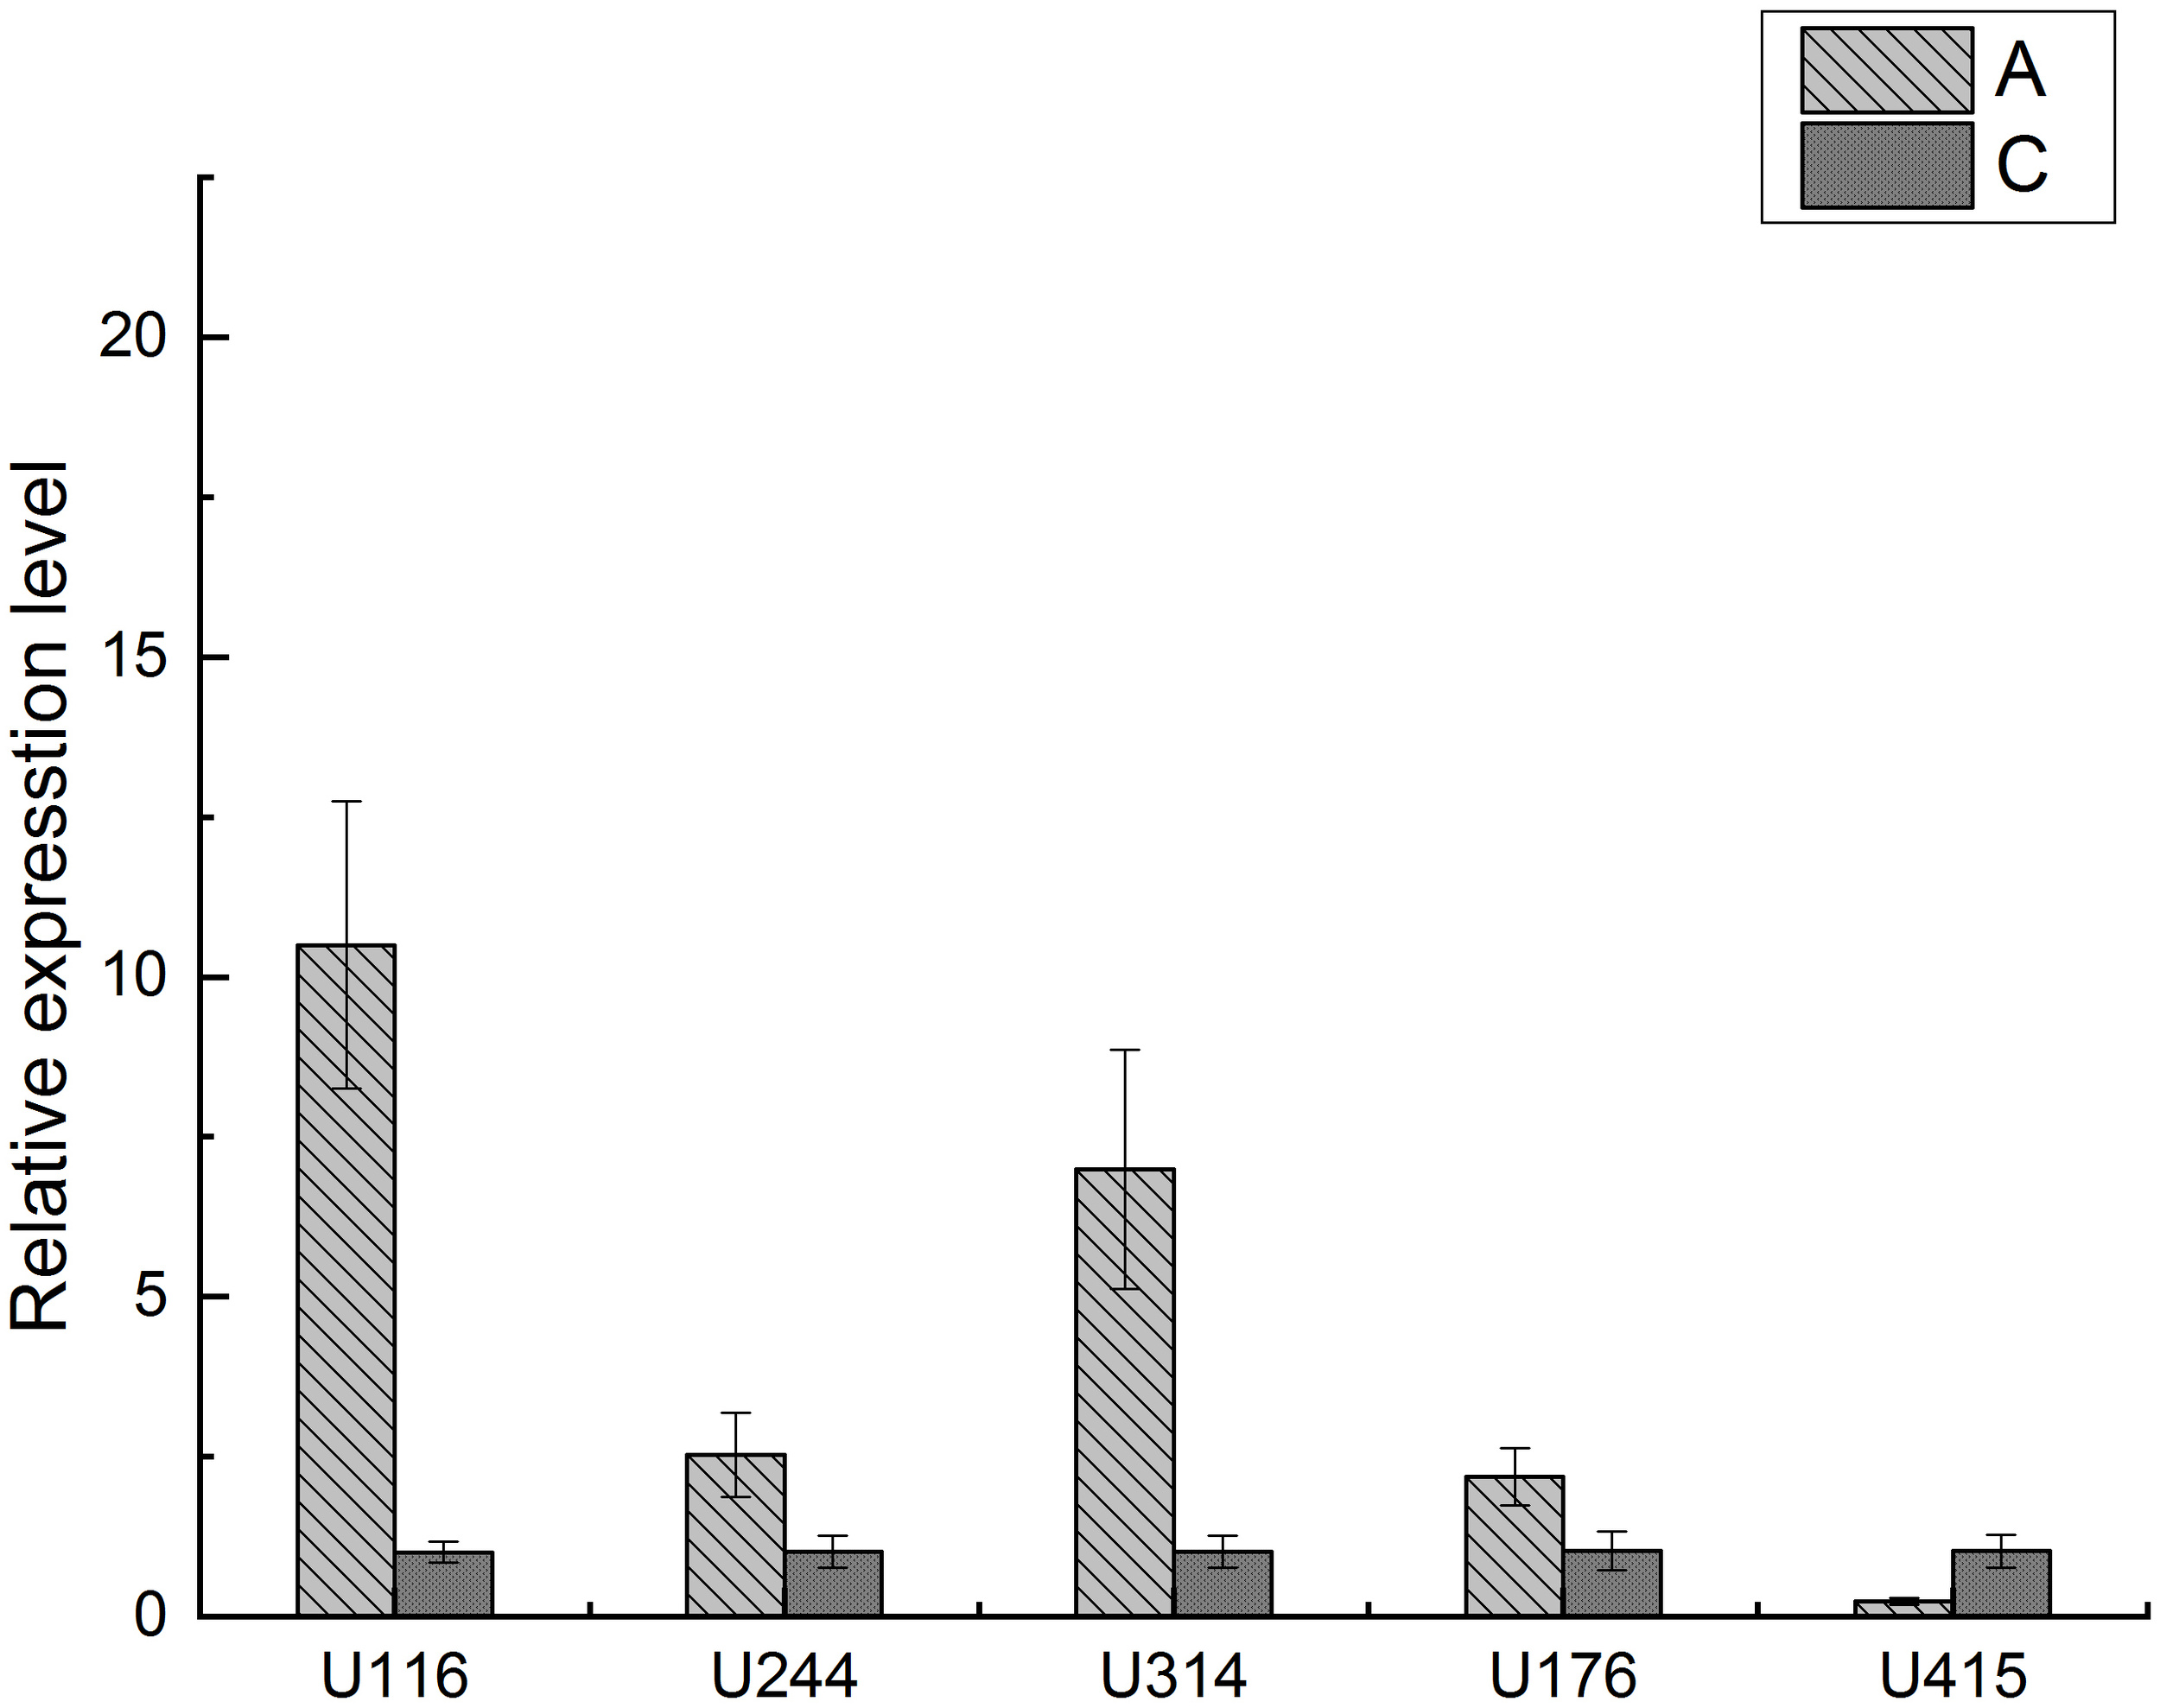
RT-qPCR verification of candidate GPCR genes.
In the five identified GPCRs, U116 (GRM7) is known to initiate signaling through guanine nucleotide-binding proteins and modulate the downstream effector activity in humans (Song et al., 2021). U244 (FMRFaR) acts as a receptor for FMRFamide peptides, binding with high affinity to FMRFamide and related peptides, which stimulates intracellular calcium signaling through the inositol 1,4,5-trisphosphate receptor, Itpr, in dopaminergic neurons. It may play a role in maintaining neuronal excitability and regulating flight duration (Cazzamali and Grimmelikhuijzen, 2002; Ravi et al., 2018). U314 (mth2) has been identified as a possible genetic marker for normal pigmentation development in shrimp (Huang et al., 2020) and may also participate in aging and stress responses (Song et al., 2002). U176 (gpr161) is critical in development by suppressing hedgehog signaling (Hoppe et al., 2024). It also forms part of a ciliary-localized signaling complex with type I PKA holoenzymes and helps coordinate precise signal propagation within the primary cilium by acting as a sensory signaling platform (Tschaikner et al., 2020). U415 (moody) is found to be essential for maintaining the blood-brain barrier’s integrity in adult Drosophila. A Moody-mediated signaling pathway in glial cells is thought to regulate nervous system insulation and influence sleep (Bainton et al., 2005; Axelrod et al., 2023). However, there is currently no direct experimental evidence linking these GPCRs to molting regulation. Therefore, our findings may offer valuable clues for the roles of these genes in the molting regulation of E. sinensis muscle.
4 Discussion
Signal regulation has been found to be involved in the molting process based on the studies in crustaceans (Mykles, 2021). Twenty-three KEGG signaling pathways were found in the Y-organ of G. lateralis during molting (Das et al., 2018). Besides, mTOR and MIH signaling pathways have also been found in Carcinus maenas and Cancer antennarius (Mattson and Spaziani, 1987; Oliphant et al., 2018). In this work, IDEGs in post-molt and inter-molt stages are found to be distributed in the GPCR, Hippo, TGF-β, Wnt, mTOR, MAPK, FoxO, and Hedgehog signaling pathways based on the GO and KEGG enrichment analyses. Our study is the first to report the participation of these pathways in the signal regulation of muscle in E. sinensis.
In addition, the involvement of protein phosphorylation in the signal regulation was further explored in this work. Totally 14 genes were found enriched in the protein phosphorylation process. Actually, some protein kinases have been identified as key players in the molting process in other crustaceans. Adenosine monophosphate-activated protein kinase (AMPK) has been found serving as an intracellular energy sensor and is vital for hormone signaling in Apolygus lucorum. AMPK influences molting and metamorphosis by adjusting its phosphorylation state (Tan et al., 2023). Additionally, protein phosphorylation triggered by the prothoracicotropic hormone (PTTH) has been shown to initiate ecdysteroidogenesis (biosynthesis of molting hormones) in the prothoracic glands of the tobacco hornworm, Manduca sexta (Song and Gilbert, 1995).
The involvement of GPCRs in the molting process from post-molt to inter-molt stages were identified in this work based on the enrichment analysis, structure analysis and RT-qPCR experiment. GPCRs are a crucial group of membrane proteins that play a broad role in cell signaling and regulation of various physiological functions such as immune response (Qin et al., 2019), environmental stress adaptation (Wang et al., 2021), nervous system regulation (Yang et al., 2018), growth, development (Ma et al., 2018), and sex differentiation (Wang et al., 2020). GPCRs have also been found to influence the molting process in insects. Studies indicate that 20E rapidly initiates cellular responses through GPCR signaling, which involves the swift release of Ca2+ from the endoplasmic reticulum and influx from the extracellular medium, along with rapid protein phosphorylation and subcellular localization changes (Zhao, 2020). A GPCR, Drosophila dopamine/ecdysteroid receptor (DopEcR) can binds the molting hormone 20E and functions in response to stress (Petruccelli et al., 2020). Some studies suggest that molting is arguably a stressful event and ecdysteroid changes muscle excitability through GPCR signaling (Cooper and Ruffner, 1998; Ruffner et al., 1999; Petruccelli et al., 2020). Besides, the 20E-responsive GPCRs are also explored in Helicoverpa armigera to influence its molting process (Cai et al., 2014; Wang et al., 2015). In C. maenas, 62 contigs encoding GPCRs were found in the central nervous system to control the molting process (Oliphant et al., 2018). In our previous study, GPCR signaling pathway has been found in the regulation from pre-molt to post-molt stages in muscle of E. sinensis (Sun et al., 2022). While in this work, GPCRs were found also important in the process from post-molt to inter-molt stages in muscle, but with totally different genes.
The genes involved in the signal transduction process identified in this study differ significantly from those found from pre-molt to post-molt stages identified in our previous research (Sun et al., 2022). There are a total of 19 and 18 genes involved in signal transduction process during the pre-molt to post-molt stages and the post-molt to inter-molt stages, respectively. But there are only 5 common genes between these two studies. Especially for GPCR genes, the two studies share only one common GPCR gene. All of these indicate that the signal transduction mechanisms in muscle vary greatly at different stages of molting. Therefore, the results of this work provide important new findings for the study of the regulation mechanism in the molting process of crustacean.
5 Conclusion
Molting is a crucial biological process that profoundly impacts the growth and development of most crustaceans. This study conducted a systematic analysis of gene expression changes in the muscle of E. sinensis across the post-molt and inter-molt stages, employing a combined approach of ATAC-seq and RNA-seq technologies, with a specific focus on the signaling regulation-related genes. The findings revealed significant differences in gene expression and chromatin accessibility between the two stages. The importance of protein phosphorylation and GPCRs in the signal regulation was emphasized. In all the signaling pathways with IDEGs, the GPCR signaling pathway includes the highest number of genes, underscoring its role in the post-molt and inter-molt stages. Structural analysis and RT-qPCR validation further identified five GPCR genes. This study provide new understanding of the signaling regulatory in E. sinensis muscle during the transition from post-molt to inter-molt stages. It also offers valuable insights for further exploration of the molecular regulatory network governing the molting process and discontinuous growth of crustaceans.
Statements
Data availability statement
The datasets presented in this study can be found in online repositories. The names of the repository/repositories and accession number(s) can be found in the article/Supplementary Material.
Ethics statement
The animal study was approved by College of Life Sciences, Tianjin Normal University. The study was conducted in accordance with the local legislation and institutional requirements.
Author contributions
BW: Conceptualization, Formal analysis, Investigation, Methodology, Software, Visualization, Writing – original draft, Writing – review & editing. JL: Conceptualization, Data curation, Formal analysis, Methodology, Resources, Validation, Writing – original draft, Writing – review & editing. MZ: Data curation, Formal analysis, Investigation, Methodology, Validation, Writing – original draft. AL: Writing – original draft, Writing – review & editing, Data curation, Visualization, Investigation, Funding acquisition. ZS: Data curation, Formal analysis, Investigation, Methodology, Visualization, Writing – original draft. ZH: Data curation, Formal analysis, Investigation, Methodology, Writing – original draft. RZ: Data curation, Formal analysis, Investigation, Methodology, Writing – original draft. TH: Conceptualization, Funding acquisition, Investigation, Methodology, Project administration, Supervision, Writing – original draft, Writing – review & editing. JS: Conceptualization, Funding acquisition, Investigation, Methodology, Project administration, Supervision, Writing – original draft, Writing – review & editing.
Funding
The author(s) declare financial support was received for the research, authorship, and/or publication of this article. This work was supported by the National Natural Science Foundation of China (32102764, 31770904), Tianjin Aquatic Seed Industry Innovation Project (SCZYGG202402) and Tianjin Development Program for Innovation and Entrepreneurship team (ITTFRS2017007).
Conflict of interest
The authors declare that the research was conducted in the absence of any commercial or financial relationships that could be construed as a potential conflict of interest.
Generative AI statement
The author(s) declare that no Generative AI was used in the creation of this manuscript.
Publisher’s note
All claims expressed in this article are solely those of the authors and do not necessarily represent those of their affiliated organizations, or those of the publisher, the editors and the reviewers. Any product that may be evaluated in this article, or claim that may be made by its manufacturer, is not guaranteed or endorsed by the publisher.
Supplementary material
The Supplementary Material for this article can be found online at: https://www.frontiersin.org/articles/10.3389/fmars.2024.1529684/full#supplementary-material
Supplementary Figure 1Quality control of clean reads from the ATAC-seq. For each sample, the upper left graph is the per base sequence quality; the upper middle graph is per base sequence content; the upper right graph is per sequence quality scores; the bottom left graph is per sequence GC content; the bottom middle graph is per base N content; the bottom right graph is sequence duplication levels.
Supplementary Figure 2The density of total mapped reads from ATAC-seq aligned to each chromosome.
Supplementary Figure 3Quality control of the RNA-seq data. The upper graphs are the distribution map of sequencing error rate; the middle graphs are the GC content distribution map; the bottom graphs are the sequencing data filter of samples.
Supplementary Figure 4Results of structure analysis for candidate GPCRs.
Supplementary Table 1Primers for candidate GPCR genes and house-keeping genes in RT-qPCR experiment.
Supplementary Table 2List of IDEGs.
Supplementary Table 3GO and KEGG enrichment analysis of IDEGs.
References
1
Axelrod S. Li X. Sun Y. Lincoln S. Terceros A. O’neil J. et al . (2023). The Drosophila blood-brain barrier regulates sleep via Moody G protein-coupled receptor signaling. Proc. Natl. Acad. Sci. U S A.120, e2309331120. doi: 10.1073/pnas.2309331120
2
Bainton R. J. Tsai L. T. Schwabe T. Desalvo M. Gaul U. Heberlein U. (2005). moody encodes two GPCRs that regulate cocaine behaviors and blood-brain barrier permeability in Drosophila. Cell123, 145–156. doi: 10.1016/j.cell.2005.07.029
3
Bernhofer M. Dallago C. Karl T. Satagopam V. Heinzinger M. Littmann M. et al . (2021). PredictProtein - predicting protein structure and function for 29 years. Nucleic Acids Res.49, W535–W540. doi: 10.1093/nar/gkab354
4
Buenrostro J. D. Wu B. Chang H. Y. Greenleaf W. J. (2015). ATAC-seq: A method for assaying chromatin accessibility genome-wide. Curr. Protoc. Mol. Biol.109, 21.29.1–21.29.9. doi: 10.1002/0471142727.mb2129s109
5
Cai M. J. Dong D. J. Wang Y. Liu P. C. Liu W. Wang J. X. et al . (2014). G-protein-coupled receptor participates in 20-hydroxyecdysone signaling on the plasma membrane. Cell Commun. Signal.12, 9. doi: 10.1186/1478-811X-12-9
6
Cazzamali G. Grimmelikhuijzen C. J. (2002). Molecular cloning and functional expression of the first insect FMRFamide receptor. Proc. Natl. Acad. Sci. U S A.99, 12073–12078. doi: 10.1073/pnas.192442799
7
Chang E. S. Mykles D. L. (2011). Regulation of crustacean molting: a review and our perspectives. Gen. Comp. Endocrinol.172, 323–330. doi: 10.1016/j.ygcen.2011.04.003
8
Cohen P. (2000). The regulation of protein function by multisite phosphorylation–a 25 year update. Trends Biochem. Sci.25, 596–601. doi: 10.1016/s0968-0004(00)01712-6
9
Cooper R. L. Ruffner M. E. (1998). Depression of synaptic efficacy at intermolt in crayfish neuromuscular junctions by 20-hydroxyecdysone, a molting hormone. J. Neurophysiol.79, 1931–1941. doi: 10.1152/jn.1998.79.4.1931
10
Corces M. R. Trevino A. E. Hamilton E. G. Greenside P. G. Sinnott-Armstrong N. A. Vesuna S. et al . (2017). An improved ATAC-seq protocol reduces background and enables interrogation of frozen tissues. Nat. Methods14, 959–962. doi: 10.1038/nmeth.4396
11
Das S. Vraspir L. Zhou W. Durica D. S. Mykles D. L. (2018). Transcriptomic analysis of differentially expressed genes in the molting gland (Y-organ) of the blackback land crab, Gecarcinus lateralis, during molt-cycle stage transitions. Comp. Biochem. Physiol. Part D Genomics Proteomics.28, 37–53. doi: 10.1016/j.cbd.2018.06.001
12
Gong L. Zhang Y. Sun Y. Liu Y. Geng X. Sun J. (2014). Cloning and expression analysis of ecdysteriod receptor gene (Ers-EcR) in Eriocheir sinensis. J. Fisheries China.6, 786–793. doi: 10.3724/SP.J.1231.2014.49039
13
Hoppe N. Harrison S. Hwang S. H. Chen Z. Karelina M. Deshpande I. et al . (2024). GPR161 structure uncovers the redundant role of sterol-regulated ciliary cAMP signaling in the Hedgehog pathway. Nat. Struct. Mol. Biol.31, 667–677. doi: 10.1038/s41594-024-01223-8
14
Hou X. Yang H. Chen X. Wang J. Wang C. (2021). RNA interference of mTOR gene delays molting process in Eriocheir sinensis. Comp. Biochem. Physiol. B Biochem. Mol. Biol.256, 110651. doi: 10.1016/j.cbpb.2021.110651
15
Huang C. W. Chu P. Y. Wu Y. F. Chan W. R. Wang Y. H. (2020). Identification of functional SSR markers in freshwater ornamental shrimps neocaridina denticulata using transcriptome sequencing. Mar. Biotechnol. (NY).22, 772–785. doi: 10.1007/s10126-020-09979-y
16
Huang S. Wang J. Yue W. Chen J. Gaughan S. Lu W. et al . (2015). Transcriptomic variation of hepatopancreas reveals the energy metabolism and biological processes associated with molting in Chinese mitten crab, Eriocheir sinensis. Sci. Rep.5, 14015. doi: 10.1038/srep14015
17
Jiang H. Lei R. Ding S. W. Zhu S. (2014). Skewer: a fast and accurate adapter trimmer for next-generation sequencing paired-end reads. BMC Bioinf.15, 182. doi: 10.1186/1471-2105-15-182
18
Jiang X. Wang H. Cheng Y. Wu X. (2020). Growth performance, gonad development and nutritional composition of Chinese mitten crab Eriocheir sinensis selected for growth and different maturity time. Aquaculture523, 735194. doi: 10.1016/j.aquaculture.2020.735194
19
Kang X. Tian Z. Wu J. Mu S. (2012). Molt stages and changes in digestive enzyme activity in hepatopancreas during molt cycle of Chinese mitten crab, Eriocheir sinensis. J. Fisheries. China.19, 806–812. doi: 10.3724/SP.J.1118.2012.00806
20
Kang X. Tian Z. Wu J. Mu S. (2013). Molt stages and changes in digestive enzyme activity in hepatopan-creas during molt cycle of Chinese mitten crab, Eriocheir sinensis. J. Fishery Sci. China.19, 806–812. doi: 10.3724/SP.J.1118.2012.00806
21
Kim D. Langmead B. Salzberg S. L. (2015). HISAT: a fast spliced aligner with low memory requirements. Nat. Methods12, 357–360. doi: 10.1038/nmeth.3317
22
Krogh A. Larsson B. Von Heijne G. Sonnhammer E. L. (2001). Predicting transmembrane protein topology with a hidden Markov model: application to complete genomes. J. Mol. Biol.305, 567–580. doi: 10.1006/jmbi.2000.4315
23
Li H. Durbin R. (2009). Fast and accurate short read alignment with Burrows-Wheeler transform. Bioinformatics25, 1754–1760. doi: 10.1093/bioinformatics/btp324
24
Li J. Sun J. Dong X. Geng X. Qiu G. (2019). Transcriptomic analysis of gills provides insights into the molecular basis of molting in Chinese mitten crab (Eriocheir sinensis). PeerJ7, e7182. doi: 10.7717/peerj.7182
25
Li Z. Zhang G. Pan K. Niu X. Shu-Chien A. C. Chen T. et al . (2023). Functional transcriptome reveals hepatopancreatic lipid metabolism during the molting cycle of the Chinese mitten crab Eriocheir sinensis. Comp. Biochem. Physiol. A Mol. Integr. Physiol.284, 111474. doi: 10.1016/j.cbpa.2023.111474
26
Love M. I. Huber W. Anders S. (2014). Moderated estimation of fold change and dispersion for RNA-seq data with DESeq2. Genome Biol.15, 550. doi: 10.1186/s13059-014-0550-8
27
Ma K. Y. Zhang S. F. Wang S. S. Qiu G. F. (2018). Molecular cloning and characterization of a gonadotropin-releasing hormone receptor homolog in the Chinese mitten crab, Eriocheir sinensis. Gene665, 111–118. doi: 10.1016/j.gene.2018.05.006
28
Maclea K. S. Abuhagr A. M. Pitts N. L. Covi J. A. Bader B. D. Chang E. S. et al . (2012). Rheb, an activator of target of rapamycin, in the blackback land crab, Gecarcinus lateralis: cloning and effects of molting and unweighting on expression in skeletal muscle. J. Exp. Biol.215, 590–604. doi: 10.1242/jeb.062869
29
Mao X. Cai T. Olyarchuk J. G. Wei L. (2005). Automated genome annotation and pathway identification using the KEGG Orthology (KO) as a controlled vocabulary. Bioinformatics21, 3787–3793. doi: 10.1093/bioinformatics/bti430
30
Mattson M. P. Spaziani E. (1987). Demonstration of protein kinase C activity in crustacean Y-organs, and partial definition of its role in regulation of ecdysteroidogenesis. Mol. Cell Endocrinol.49, 159–171. doi: 10.1016/0303-7207(87)90209-7
31
Mykles D. L. (2021). Signaling pathways that regulate the crustacean molting gland. Front. Endocrinol. (Lausanne).12. doi: 10.3389/fendo.2021.674711
32
Oliphant A. Alexander J. L. Swain M. T. Webster S. G. Wilcockson D. C. (2018). Transcriptomic analysis of crustacean neuropeptide signaling during the moult cycle in the green shore crab, Carcinus maenas. BMC Genomics19, 711. doi: 10.1186/s12864-018-5057-3
33
Petruccelli E. Lark A. Mrkvicka J. A. Kitamoto T. (2020). Significance of DopEcR, a G-protein coupled dopamine/ecdysteroid receptor, in physiological and behavioral response to stressors. J. Neurogenet.34, 55–68. doi: 10.1080/01677063.2019.1710144
34
Pu S. Gao X. Hou H. He C. Shi J. (2015). Advances in genes related to molting in crustacean (in Chinese). Fish. Sci.34, 60–67. doi: 10.16378/j.cnki.1003-1111.2015.06.010
35
Qin X. Jin X. Zhou K. Li H. Wang Q. Li W. (2019). EsGPCR89 regulates cerebral antimicrobial peptides through hemocytes in Eriocheir sinensis. Fish Shellfish Immunol.95, 151–162. doi: 10.1016/j.fsi.2019.10.015
36
Ravi P. Trivedi D. Hasan G. (2018). FMRFa receptor stimulated Ca2+ signals alter the activity of flight modulating central dopaminergic neurons in Drosophila melanogaster. PloS Genet.14, e1007459. doi: 10.1371/journal.pgen.1007459
37
Ruffner M. E. Cromarty S. I. Cooper R. L. (1999). Depression of synaptic efficacy in high- and low-output Drosophila neuromuscular junctions by the molting hormone (20-HE). J. Neurophysiol.81, 788–794. doi: 10.1152/jn.1999.81.2.788
38
Shyamal S. Das S. Guruacharya A. Mykles D. L. Durica D. S. (2018). Transcriptomic analysis of crustacean molting gland (Y-organ) regulation via the mTOR signaling pathway. Sci. Rep.8, 7307. doi: 10.1038/s41598-018-25368-x
39
Song J. M. Kang M. Park D. H. Park S. Lee S. Suh Y. H. (2021). Pathogenic GRM7 mutations associated with neurodevelopmental disorders impair axon outgrowth and presynaptic terminal development. J. Neurosci.41, 2344–2359. doi: 10.1523/JNEUROSCI.2108-20.2021
40
Song Q. Gilbert L. I. (1995). Multiple phosphorylation of ribosomal protein S6 and specific protein synthesis are required for prothoracicotropic hormone-stimulated ecdysteroid biosynthesis in the prothoracic glands of Manduca sexta. Insect Biochem. Mol. Biol.25, 591–602. doi: 10.1016/0965-1748(94)00100-v
41
Song W. Ranjan R. Dawson-Scully K. Bronk P. Marin L. Seroude L. et al . (2002). Presynaptic regulation of neurotransmission in Drosophila by the g protein-coupled receptor methuselah. Neuron36, 105–119. doi: 10.1016/s0896-6273(02)00932-7
42
Sun Z. Li J. Lv L. Gou Y. Wang B. Hao T. (2022). Integration of ATAC-seq and RNA-seq identifies active G-protein coupled receptors functioning in molting process in muscle of Eriocheir sinensis. Front. Mar. Science.9. doi: 10.3389/fmars.2022.900160
43
Tan Y. Xiao L. Zhao J. Zhang J. Ahmad S. Xu D. et al . (2023). Adenosine monophosphate-activated protein kinase (AMPK) phosphorylation is required for 20-hydroxyecdysone regulates ecdysis in apolygus lucorum. Int. J. Mol. Sci.24, 8587. doi: 10.3390/ijms24108587
44
Tang B. Wang Z. Liu Q. Zhang H. Jiang S. Li X. et al . (2019). High-Quality Genome Assembly of Eriocheir japonica sinensis Reveals Its Unique Genome Evolution. Front. Genet.10. doi: 10.3389/fgene.2019.01340
45
Tian Z. Jiao C. (2019). Molt-dependent transcriptome analysis of claw muscles in Chinese mitten crab Eriocheir sinensis. Genes Genomics41, 515–528. doi: 10.1007/s13258-019-00787-w
46
Tschaikner P. Enzler F. Torres-Quesada O. Aanstad P. Stefan E. (2020). Hedgehog and gpr161: regulating cAMP signaling in the primary cilium. Cells9, 118. doi: 10.3390/cells9010118
47
Ubersax J. A. Ferrell J. E. Jr. (2007). Mechanisms of specificity in protein phosphorylation. Nat. Rev. Mol. Cell Biol.8, 530–541. doi: 10.1038/nrm2203
48
Wang S. He J. Deng M. Wang C. Wang R. Yan J. et al . (2022). Integrating ATAC-seq and RNA-seq reveals the dynamics of chromatin accessibility and gene expression in apple response to drought. Int. J. Mol. Sci.23, 11191. doi: 10.3390/ijms231911191
49
Wang M. Tang Y. Yu J. Su S. Li J. Yu F. et al . (2020). Molecular insights into the sex-differential regulation of signal transduction in the cerebral ganglion and metabolism in the hepatopancreas of Eriocheir sinensis during reproduction. Genomics112, 71–81. doi: 10.1016/j.ygeno.2019.10.014
50
Wang T. Yang C. Zhang T. Liang H. Ma Y. Wu Z. et al . (2021). Immune defense, detoxification, and metabolic changes in juvenile Eriocheir sinensis exposed to acute ammonia. Aquat Toxicol.240, 105989. doi: 10.1016/j.aquatox.2021.105989
51
Wang Y. Zhang Y. Sun Y. Liu Y. Geng X. Sun J. (2013). Cloning and molecular structure analysis of crustacean hyperglycemic hormone (Ers-CHH) in Eriocheir sinensis. J. Fisheries China.7, 987–993. doi: 10.3724/SP.J.1231.2013.38432
52
Wang D. Zhao W. L. Cai M. J. Wang J. X. Zhao X. F. (2015). G-protein-coupled receptor controls steroid hormone signaling in cell membrane. Sci. Rep.5, 8675. doi: 10.1038/srep08675
53
Waterhouse A. Bertoni M. Bienert S. Studer G. Tauriello G. Gumienny R. et al . (2018). SWISS-MODEL: homology modelling of protein structures and complexes. Nucleic Acids Res.46, W296–W303. doi: 10.1093/nar/gky427
54
Xu Z. Wu J. Zhou J. Zhang Y. Qiao M. Sun H. et al . (2022). Integration of ATAC-seq and RNA-seq analysis identifies key genes affecting intramuscular fat content in pigs. Front. Nutr.9. doi: 10.3389/fnut.2022.1016956
55
Yang X. Huang G. Xu M. J. Zhang C. Cheng Y. Yang Z. (2018). Cloning and functional characterization of the DA2 receptor gene in Chinese mitten crab (Eriocheir sinensis). PloS One13, e0193999. doi: 10.1371/journal.pone.0193999
56
Yang C. Ma L. Xiao D. Ying Z. Jiang X. Lin Y. (2019). Integration of ATAC-seq and RNA-seq identifies key genes in light-induced primordia formation of sparassis latifolia. Int. J. Mol. Sci.21, 185. doi: 10.3390/ijms21010185
57
Young M. D. Wakefield M. J. Smyth G. K. Oshlack A. (2010). Gene ontology analysis for RNA-seq: accounting for selection bias. Genome Biol.11, R14. doi: 10.1186/gb-2010-11-2-r14
58
Yu G. Wang L. G. He Q. Y. (2015). ChIPseeker: an R/Bioconductor package for ChIP peak annotation, comparison and visualization. Bioinformatics31, 2382–2383. doi: 10.1093/bioinformatics/btv145
59
Yue W. Chen Y. Chen X. Hou X. Wang J. Wang C. (2021). Physiological and gene expression profiles of leg muscle provide insights into molting-dependent growth of Chinese mitten crab (Eriocheir sinensis). Reprod. Breeding.1, 32–38. doi: 10.1016/J.REPBRE.2021.02.001
60
Zhang Y. Liu T. Meyer C. A. Eeckhoute J. Johnson D. S. Bernstein B. E. et al . (2008). Model-based analysis of chIP-seq (MACS). Genome Biol.9, R137. doi: 10.1186/gb-2008-9-9-r137
61
Zhao X. F. (2020). G protein-coupled receptors function as cell membrane receptors for the steroid hormone 20-hydroxyecdysone. Cell Commun. Signal.18, 146. doi: 10.1186/s12964-020-00620-y
Summary
Keywords
ATAC-seq, RNA-Seq, Eriocheir sinensis , signal regulation, molting
Citation
Wang B, Li J, Zhang M, Li A, Song Z, He Z, Zhang R, Hao T and Sun J (2025) Integration of ATAC-seq and RNA-seq reveals signal regulation during post-molt and inter-molt stages in muscle of Eriocheir sinensis. Front. Mar. Sci. 11:1529684. doi: 10.3389/fmars.2024.1529684
Received
17 November 2024
Accepted
31 December 2024
Published
21 January 2025
Volume
11 - 2024
Edited by
Youji Wang, Shanghai Ocean University, China
Reviewed by
Sofia Priyadarsani Das, National Taiwan Ocean University, Taiwan
An Liu, Xiamen, China
Updates
Copyright
© 2025 Wang, Li, Zhang, Li, Song, He, Zhang, Hao and Sun.
This is an open-access article distributed under the terms of the Creative Commons Attribution License (CC BY). The use, distribution or reproduction in other forums is permitted, provided the original author(s) and the copyright owner(s) are credited and that the original publication in this journal is cited, in accordance with accepted academic practice. No use, distribution or reproduction is permitted which does not comply with these terms.
*Correspondence: Tong Hao, skyht@tjnu.edu.cn; Jinsheng Sun, skysjs@tjnu.edu.cn
†These authors have contributed equally to this work
Disclaimer
All claims expressed in this article are solely those of the authors and do not necessarily represent those of their affiliated organizations, or those of the publisher, the editors and the reviewers. Any product that may be evaluated in this article or claim that may be made by its manufacturer is not guaranteed or endorsed by the publisher.