 Muzi Zhang
 Qingquan Sun
 Xiaoxue Bai
 Chi Wu
94% of researchers rate our articles as excellent or good
Learn more about the work of our research integrity team to safeguard the quality of each article we publish.
Find out more
METHODS article
Front. Mar. Sci., 23 January 2025
Sec. Ocean Observation
Volume 11 - 2024 | https://doi.org/10.3389/fmars.2024.1528496
This article is part of the Research TopicBest Practices in Ocean ObservingView all 85 articles
This paper extensively investigates the performance of the representative SBE 3 deep-sea thermometer (Sea-Bird Scientific) under various stepwise pressure conditions. A high-precision pressure-temperature vessel was employed to simulate deep sea environments, conducting systematic pressure experiments with precise temperature control (0.5 mK) across a temperature range of -2 to 35°C and from atmospheric pressure to full ocean depth (0–12700 m). A Standard platinum resistance thermometer (SPRT), isolated from the pressure environment and placed adjacent to the SBE 3, served as a calibration reference throughout the experiments. The drift of the SBE 3, reaching up to 10 mK in this study, was meticulously quantified at varying pressures and temperatures. Subsequently, a linear calibration method was developed, ensuring that the thermometer maintained an accuracy of ±0.0005°C (± 0.5 mK) across all tested high-pressure conditions, including a maximum pressure of 1050 bar. Crucially, this study discusses the negative impact of pressure-induced temperature errors on the estimation of ocean heat content in the Pacific, emphasizing the importance of conducting high-pressure calibration tests before and after oceanographic deployments. These measures are vital for ensuring the accuracy of deep-sea temperature measurements, which are critical for understanding global climate dynamics and improving the calibration of deep-sea sensors.
The ocean, covering over 70% of the Earth’s surface, plays a critical role in the global climate system due to its immense heat capacity. As greenhouse gas emissions continue to rise, the ocean has become the principal reservoir for absorbing excess heat from the atmosphere. Over the past few decades, it is estimated that approximately 90% of this excess heat has been absorbed by the ocean, with the heat stored within the upper few meters alone being comparable to that contained in the entire atmosphere. The immediate consequence of this oceanic heat absorption is sea level rise, exerting profound impacts on global climate dynamics and environmental stability. Cloud cover can also influence ocean warming, as it modulates the amount of solar radiation reaching the ocean surface (Bernal, 1991; Khatiwala et al., 2012; Cazenave and Cozannet, 2014; Delgado-Bonal et al., 2020; Smith et al., 2021; Smith et al., 2022).
Deep-sea temperature changes have garnered significant attention in oceanographic research due to their crucial role in global heat absorption and sea level rise. The rate of warming observed in deep-sea (below 2000 meters) and abyssal regions (below 4000 meters) is substantial and exerts a notable influence on the redistribution of global heat and subsequent sea level changes. Between 1991 and 2010, the global mean temperature of waters below 2000 meters increased at an estimated rate of 0.39 ± 0.17 mK per year, with even higher rates of 0.53 ± 0.11 mK per year detected at depths of 4000 to 6000 meters. The Southern Ocean plays a particularly significant role, accounting for 67% of total deep-sea heat absorption. This heat uptake is primarily driven by Antarctic Bottom Water (AABW) formation in high-latitude regions, emphasizing the importance of deep-sea warming for the global climate system (Desbruyères et al., 2016). Observations from 2009 to 2019 at four sites in the Northwestern Argentine Basin indicate a persistent upward trend in both deep-sea and abyssal temperatures, with mean annual increases ranging from 0.02 °C to 0.04 °C (Meinen et al., 2020). Such findings underscore the critical role of deep-sea warming in modulating the global climate system and illustrate how atmospheric and surface ocean changes propagate into deeper oceanic layers through large-scale ocean currents.
Accurate measurement of deep-sea temperatures is vital for constructing robust global climate models and predicting the impacts of global warming (Abraham et al., 2013). However, typical temperature variations in the deep ocean are subtle, necessitating highly sensitive and precise instrumentation. Current deep-sea temperature measurements rely primarily on high-precision thermistor-based sensors, including the widely used SBE 3 and SBE 35 thermometers (Sea-Bird Electronics). These sensors are rigorously calibrated during manufacturing and recalibrated periodically to ensure long-term stability, demonstrating a temperature stability of approximately 0.14 mK per year (Uchida et al., 2015). A measurement uncertainty of 1 mK (0.001°C) is essential for accurately monitoring the subtle temperature fluctuations characteristic of deep-sea environments (Wunsch, 2016). Given that salinity calculations are based on seawater conductivity, which itself is highly temperature-sensitive, even minor temperature measurement errors can introduce substantial errors in salinity, potentially leading to significant misunderstandings in ocean circulation and water mass mixing processes (Wangersky, 2000; Feistel et al., 2010; Intergovernmental Oceanographic Commission, 2015). Furthermore, temperature measurement errors can accumulate during long-term data processing and modeling, leading to amplified inaccuracies in oceanographic research and climate predictions (Palmer et al., 2011; Garry et al., 2019). This cumulative effect underscores the importance of precise temperature measurement and regular calibration to reduce errors in salinity, density, and sound speed calculations, thus providing a reliable data foundation for oceanographic and climate research (Wangersky, 2000; Intergovernmental Oceanographic Commission, 2015).
The accuracy of deep-sea temperature sensors can be affected by various environmental factors, particularly seawater pressure. This pressure can deform sensor encapsulation, transmit pressure through internal filling materials, and create additional stresses on the thermistor, resulting in measurement errors. This pressure effect has been demonstrated in studies conducted at depths of up to 6000 meters (Peruzzi et al., 2017). Even the reference-grade SBE 35 temperature sensor, commonly used for field calibration, exhibits a reproducible pressure dependency that can exceed its specified measurement uncertainty under certain conditions (Uchida et al., 2007). As a result, it is generally recommended that calibration of deep-sea thermometers not rely solely on field comparisons with reference thermometers unless their performance across various temperature and pressure conditions is thoroughly understood (Joung et al., 2020; Peruzzi et al., 2021).
With advancements in deep-sea exploration, the demand for research at extreme ocean depths, including depths approaching 10,000 meters in regions such as the Mariana Trench, has increased significantly (Taira et al., 2005; van Haren et al., 2017; van Haren, 2023). At such depths, the annual variation in seawater temperature is exceedingly subtle (Levitus et al., 2000), requiring temperature sensors with exceptional accuracy and long-term stability under ultra-high pressure conditions. Focusing on the high-performance deep-sea thermometer model SBE-3, designed to withstand the pressures encountered at extreme depths, this study evaluates its measurement accuracy under simulated high-pressure conditions.
In this research, a high-precision pressure vessel was utilized to replicate deep-sea environments. To ensure high measurement precision, a Standard Platinum Resistance Thermometer (SPRT) was isolated within a pressure-resistant pipe filled with silicone oil for thermal conduction. The experimental design comprehensively tests the SBE 3 thermometer’s performance across varying pressures and temperatures, simulating conditions from atmospheric pressure to full ocean depth. Section 2 outlines the theoretical framework, Section 3 describes the experimental setup and procedures, and Section 4 analyzes the pressure-calibrated performance of the SBE 3 thermometer.
Calibration standards for Conductivity-Temperature-Depth (CTD) instruments vary across different countries, with each having its own methods and regulations. For instance, China’s “JJG 763-2019 Calibration Regulation for Temperature-Salinity-Depth Measuring Instruments” (Lili et al., 2019) and the international standard “BS ISO 22804-2023 Marine Technology—General Technical Requirements for Marine Conductivity-Temperature-Depth (CTD) Measuring Instruments” (BS ISO 22804, 2023) outline technical requirements and testing procedures for CTD calibration, which describes the detailed procedures to test and calibrate temperature and conductivity sensors (used to calculate salinity) in a varying temperature thermal bath under one atmosphere pressure, and pressure sensors with varying pressures in the room temperature. These regulations do not account for the effects of environmental pressure on the accuracy of temperature and conductivity sensors, as well as the impact of environmental temperature on the accuracy of pressure sensors.
The current standards predominantly outline temperature calibration methods at standard atmospheric pressure, which have significantly contributed to ensuring the accuracy and reliability of CTD data. However, by incorporating the operational behavior of deep-sea thermometers under high-pressure conditions, a more rigorous assessment of CTD performance could be achieved. This would further enhance the credibility of oceanographic data collected during deep-sea investigations.
For instance, Sea-Bird Scientific provides a drift correction method to address data deviations in CTD instruments during long-term usage. This correction method does not rely solely on single field data but combines laboratory calibration results with pre- and post-cruise drift information. Specifically, users can calculate drift correction coefficients based on pre- and post-cruise calibration data to ensure the accuracy of conductivity, temperature, and pressure measurements throughout the cruise (Sea-Bird Electronics, Inc, 2016). The correction method involves calibrating the temperature sensor using a thermal bath before and after the deployment, calculating the temperature difference (residual) between the pre- and post-deployment calibrations, and then adjusting the temperature readings based on the number of days. The specific steps are as follows: first, calculate the residual (instrument temperature minus thermal bath temperature); then use the Equation, Offset = b * (residual/n), to correct the temperature data, where b is the number of days between the pre-deployment calibration and the measurement, n is the number of days between the pre- and post-deployment calibrations, and residual is the residual from the calibration table. The calibration schematic is shown in Figure 1 below.
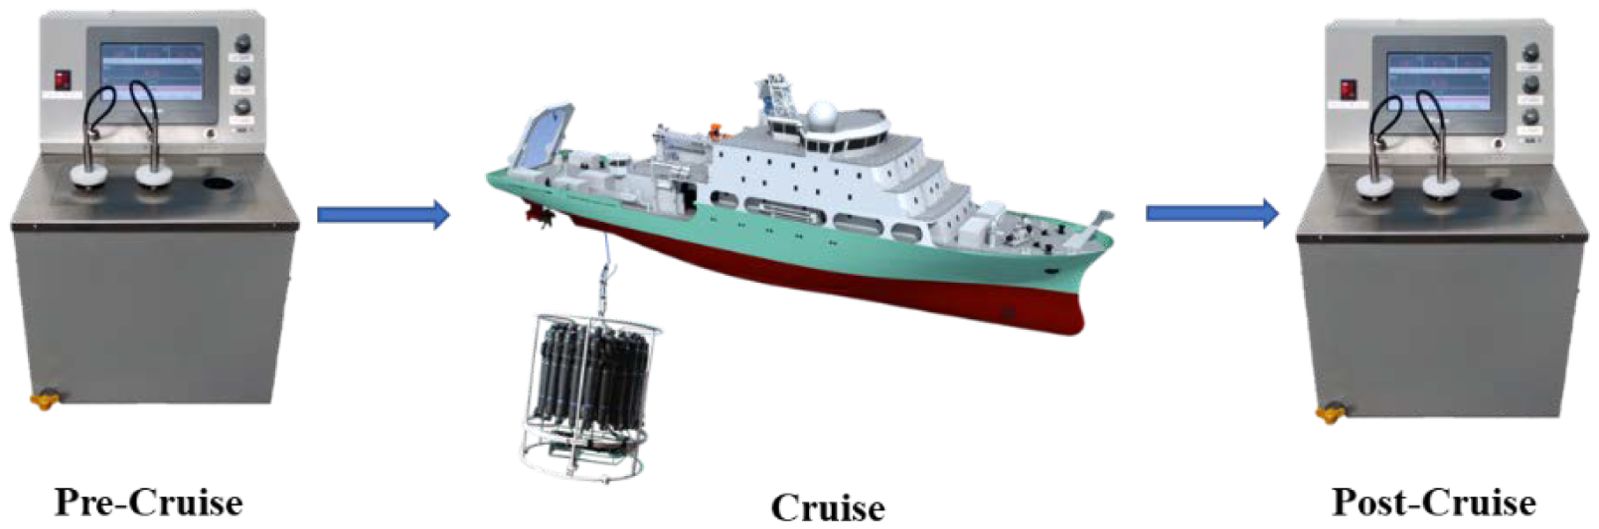
Figure 1. Schematic diagram of pre- and post-deployment of the CTD device.
This method provides a way to correct the offset in instrument readings caused by time drift between pre- and post-calibration, with a focus on adjusting temperature and conductivity data based on the number of days at sea. The Sea-Bird procedure assumes a linear drift, which is a reasonable assumption for SBE 3 sensors. This drift is typically attributed to gradual changes in the instrument’s internal components over time, which may be influenced by environmental factors, as suggested by the slight temperature variations observed between the pre- and post-cruise calibrations shown in Figure 2. However, it is unable to fully correct the measurement errors recorded during deployment under varying deep-sea pressure conditions, primarily resulting from pressure-induced changes in temperature readings (Uchida et al., 2015). In fact, as highlighted in previous studies, the indication of pressure can be significantly affected in the deep-sea environment (Uchida et al., 2007; Peruzzi et al., 2017; Joung et al., 2020; Peruzzi et al., 2021). As the instrument returns to atmospheric pressure after deployment, the transient reading errors occurring under deep-sea pressure conditions become undetectable, making them difficult to detect using the above calibration procedure.
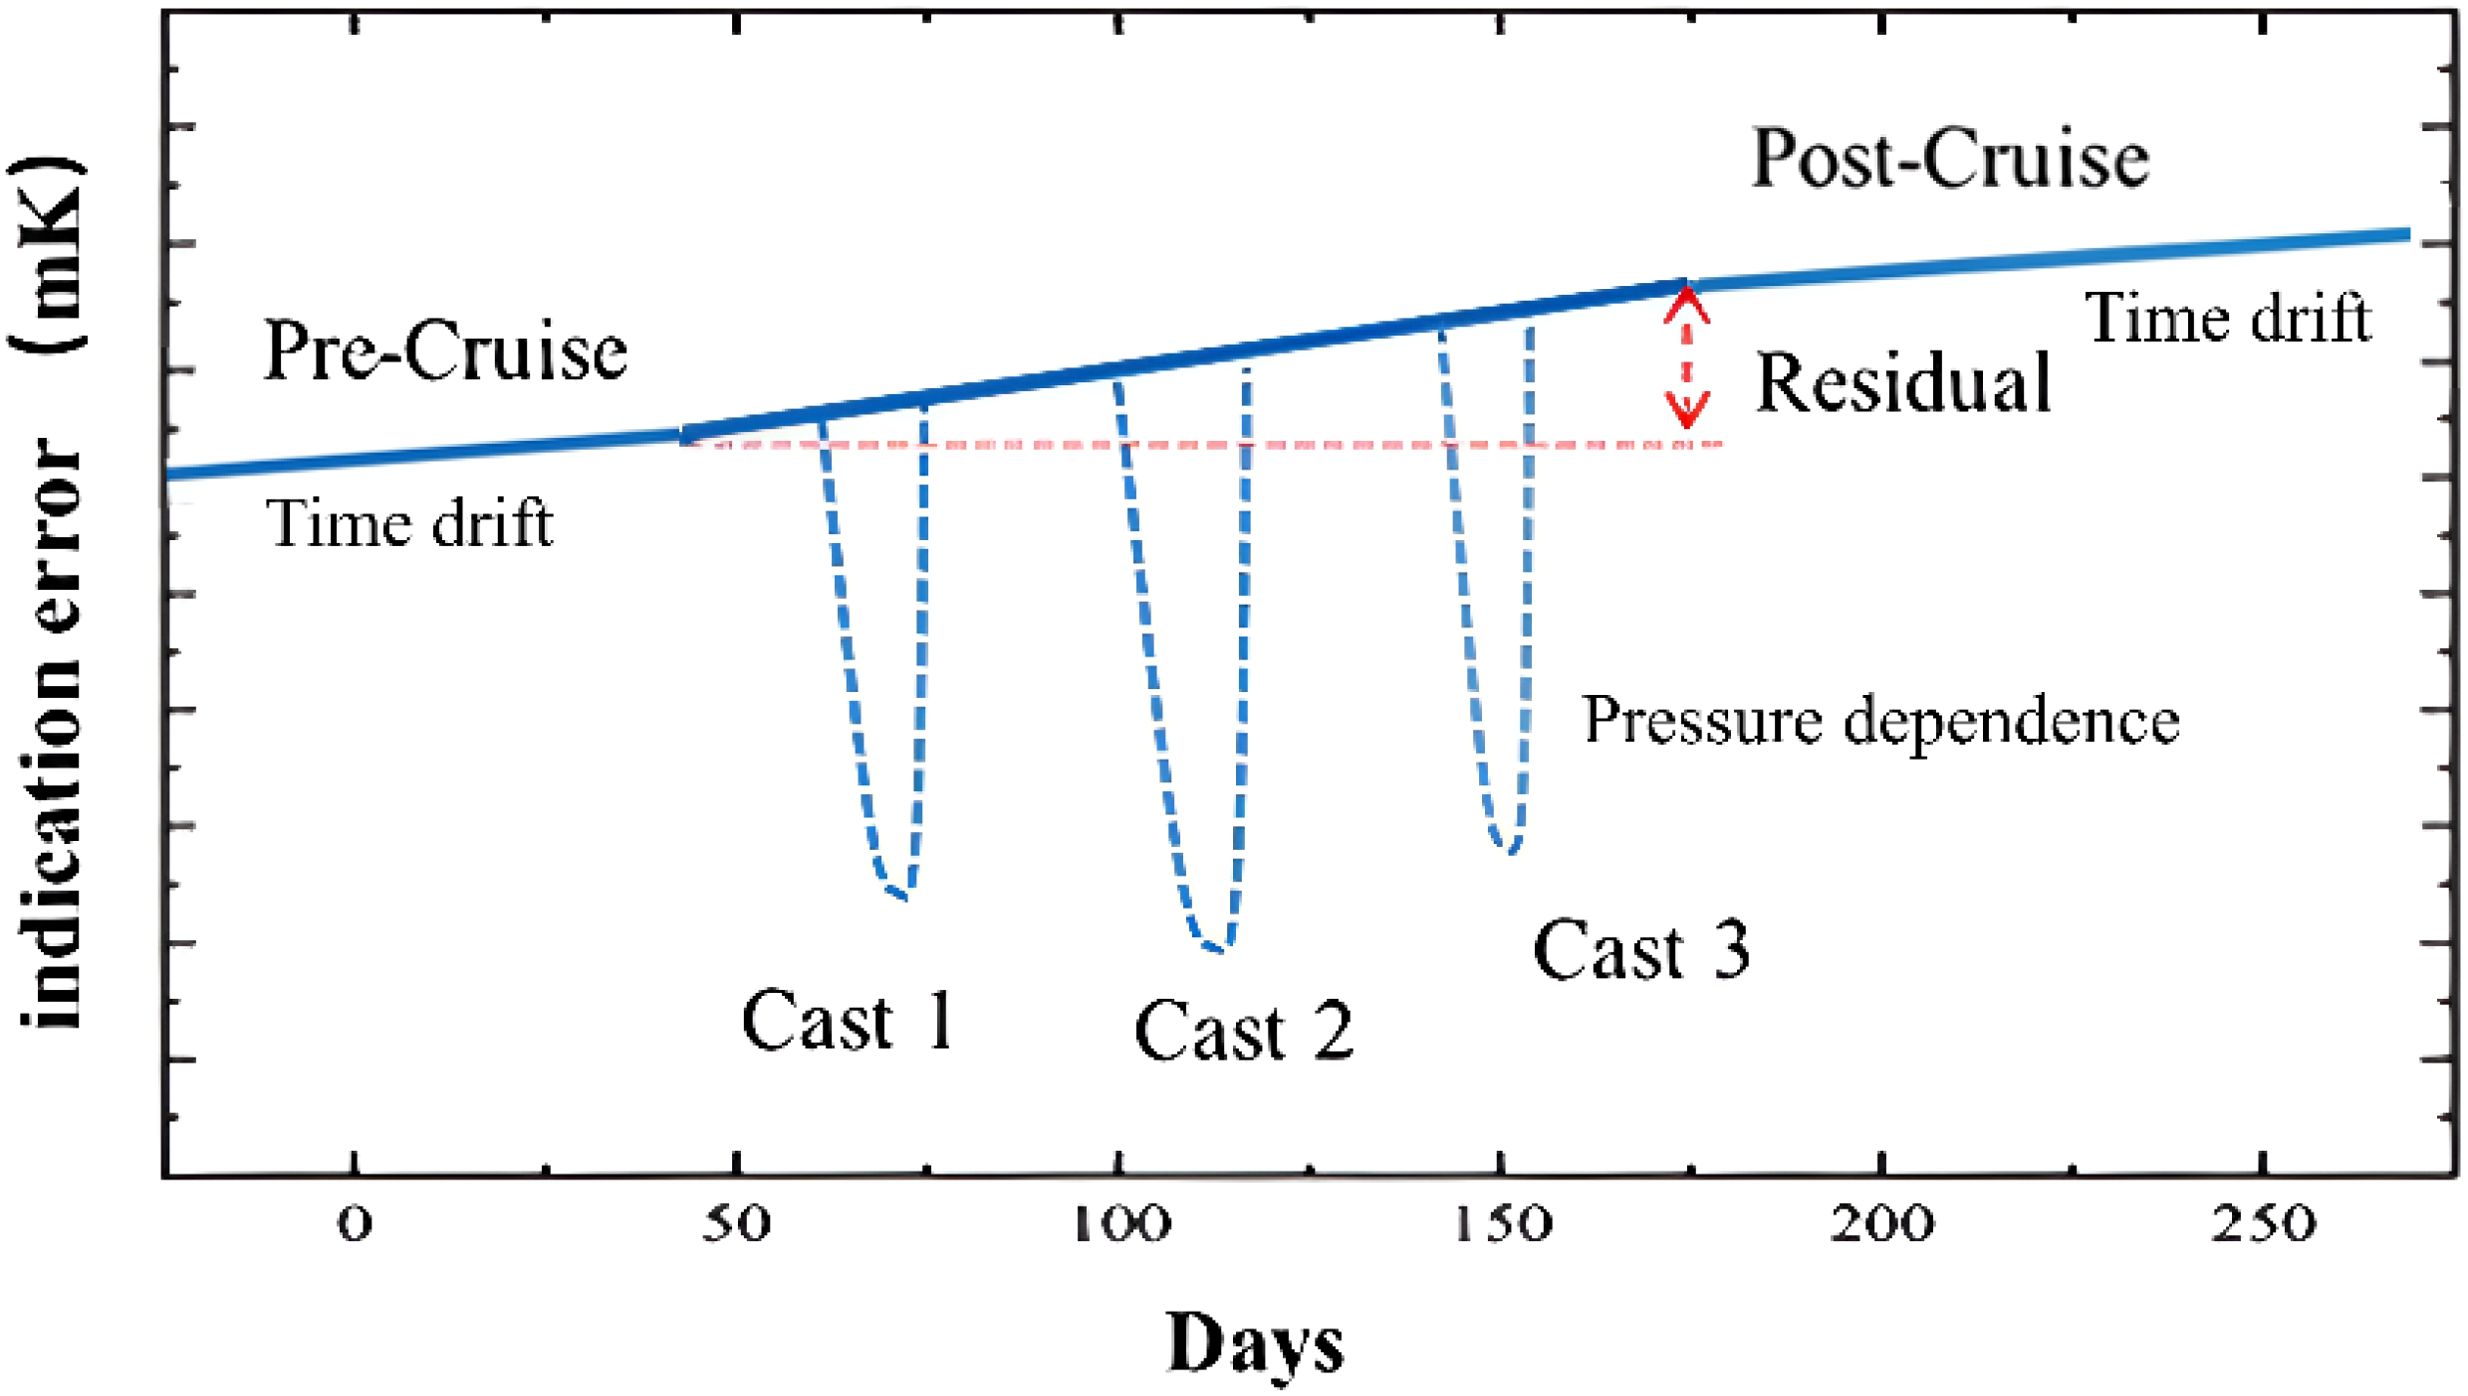
Figure 2. Schematic diagram of the in-situ drifts of the CTD device. and its pre- and post-deployment calibration.
To ensure a rapid thermal response time, manufacturers typically design the pressure-resistant casing of thermometers to be as thin as possible while maintaining environmental durability. A thermally conductive material is placed between the casing and thermistor to enhance heat transfer. Under deep-sea high pressure, the casing compresses, transmitting stress through the thermally conductive material to the thermistor itself. This stress alters the thermistor’s resistivity, leading to drift in temperature readings relative to previous calibration data. Variability in the thermal conductive filling process, casing material uniformity, and thermistor packaging, along with aging-related degradation, can lead to inconsistencies in the temperature-pressure coefficients even among probes from the same batch (Uchida et al., 2015; Peruzzi et al., 2017). Due to the elastic properties of the casing material, deformation under pressure does not cause permanent damage to the thermometer, and part of the deformation recovers when the thermometer is returned to atmospheric pressure in the calibration laboratory. Therefore, drift data calibrated under atmospheric conditions cannot fully reflect the transient drift effects encountered during ocean deployments. This issue is especially prominent in profiling measurements, where the thermometer must continuously respond to depth changes that correspond to rapid pressure variations. Figure 2 illustrates a schematic diagram of this pressure effect. Fortunately, the in-situ pressure effect of deep-sea thermometers (SBE3 and SBE35) may not vary with time. Once the established relationship between pressure and temperature is determined, the drift can be corrected in real time using the pressure measured by the instrument itself (Uchida et al., 2015). This highlights the importance of testing the accuracy of deep-sea thermometers under pressure conditions. By simulating the ocean environmental conditions in the laboratory, a more accurate model can be established to express the relationship between drift and pressure for the instruments, to ensure the quality of the data.
In the calibration procedures of “JJG 763-2019 Calibration Regulation for Temperature-Salinity-Depth Measuring Instruments,” the error in temperature readings under atmospheric pressure is determined by placing the instrument under test and a standard thermometer in a water bath with a constant temperature. The temperature bridge and the thermometer under test simultaneously measure for 3 minutes, with no less than 10 sets of readings taken. The arithmetic mean of the corresponding temperature readings is used as the standard temperature value and the indicated value of the instrument under test at each calibration point. The temperature reading error is calculated as described in Equation 1.
Here, is the temperature measurement error of the instrument under test, whose maximum absolute value is considered as measurement trueness. t is the arithmetic mean of 10 sets of temperature indication values of the instrument under test. is the arithmetic mean of 10 sets of temperature standard values.
To investigate the measurement errors in the SBE 3 deep-sea thermometer caused by increased environmental pressure, the calibration temperature conditions were set to fixed values based on the typical operating conditions, while the pressure was set to increase or decrease stepwise. It is noteworthy that in a closed temperature-pressure system, an increase in pressure can cause a brief rise in the system’s internal temperature. Therefore, after the vessel pressure reaches the required temperature stability, it is necessary to wait for a sufficient amount of time to ensure that the readings of both the SPRT and the thermometer under test are stabilized. Finally, the temperature reading error under a certain environmental pressure condition was obtained by subtracting the SPRT reading from the thermometer reading under test, and then subtracting the difference between the readings of the thermometer under test and the standard thermometer under normal atmospheric pressure. This process is described by Equation 2.
Here, represents the change in the thermometer reading caused by pressure after eliminating the zero-point error under atmospheric pressure. is the reading of the thermometer at the testing pressure. By subtracting the reading, which is not affected by pressure, and then subtracting the obtained from the thermostatic water bath under atmospheric pressure (Equation 1), the effect of pressure on the thermometer reading is obtained. It is important to note that if the standard thermometer is also affected by environmental pressure or if the measured temperature positions of the standard thermometer and the thermometer under test are inconsistent, the result of will lack validity. Therefore, during testing, it is crucial to ensure that the standard thermometer is completely unaffected by pressure and that the temperature sensing elements of both the standard thermometer and the thermometer under test are positioned sufficiently close to each other.
To further validate that the thermometer under test and the standard thermometer produce consistent measurement errors under different environmental pressure conditions, repeated testing is performed for each pressure condition. According to the requirement, both the standard thermometer and the sample thermometer simultaneously measure for 3 minutes, with no fewer than 10 sets of readings. This process is repeated six times. The standard deviation of the measurement errors, calculated using Equation (2) from these six tests, is then determined to represent the repeatability of the measurement differences between the thermometer under test and the standard thermometer due to pressure.
Here, represents the variability of the measurement error caused by pressure on the sensor under test. represents the measurement difference of the sensor under test, calculated from Equation 2. represents the arithmetic mean of the measurement errors from tests, where n=6.
Once we have determined the specific relationship between pressure and the thermometer reading through experimental data and confirmed its repeatability, we can perform precise pressure calibration of the thermometer in situ. This is done by using the environmental pressure value provided by a pressure gauge. As shown in Equation 4, this calibration process typically involves subtracting a correction factor, determined by the pressure, from the raw temperature reading. The correction factor is based on the predetermined relationship. By applying this calibration, we can adjust the raw temperature readings to account for the pressure effect, thus obtaining readings that are closer to the true temperature.
Here, represents the slope of the linear relationship between pressure and temperature measurement error, and is the intercept of this relationship.
By substituting the real-time measured value into Equation 4, the corrected temperature reading can be obtained. This calibration effectively compensates for the pressure-induced error, improving the accuracy and reliability of temperature measurements.
This study focused on the SBE 3 thermometer (SN 6320, from Sea-Bird Scientific Inc.), which is capable of operating at depths up to 10500 meters. To accurately simulate the deep-ocean environment, a full-depth ocean environment emulator was constructed, capable of reproducing conditions up to 1270 bar, equivalent to a depth of 12,700 meters. This system allows for precise control of seawater temperature, pressure, as detailed below:
The full-depth ocean environment simulator was calibrated and tested by the National Institute of Metrology, China (NIM). This simulator consists of a large pressure vessel, a servo motor pressure controller, and a high-precision thermostatic water bath. The pressure vessel, constructed from titanium alloy (TC4), is designed to accommodate and pressurize the entire body of the deep-ocean thermometer up to a pressure of 1270 bar. This pressure range covers the operational limits of existing deep-sea sensors and is the maximum allowable pressure for SBE 3 thermometers.
Figure 3 illustrates the main components and experimental setup of the full-depth ocean environment simulator. The high-pressure vessel, filled with seawater at a salinity of 35, houses the SBE 3 thermometer and the pressure-resistant encapsulated Standard Platinum Resistance Thermometer (SPRT). The temperature control chamber surrounds the high-pressure chamber and maintains precise control of the experimental temperature. A stirring pump is used to eliminate temperature gradients, ensuring uniform temperature distribution within the chamber. A pressure-resistant cable connects the instruments inside the high-pressure chamber to external monitoring and control systems. The SBE 9plus device is illustrated separately and is connected to the SBE 3 inside the pressure chamber via its original pressure-resistant cable and a pressure-resistant adapter.
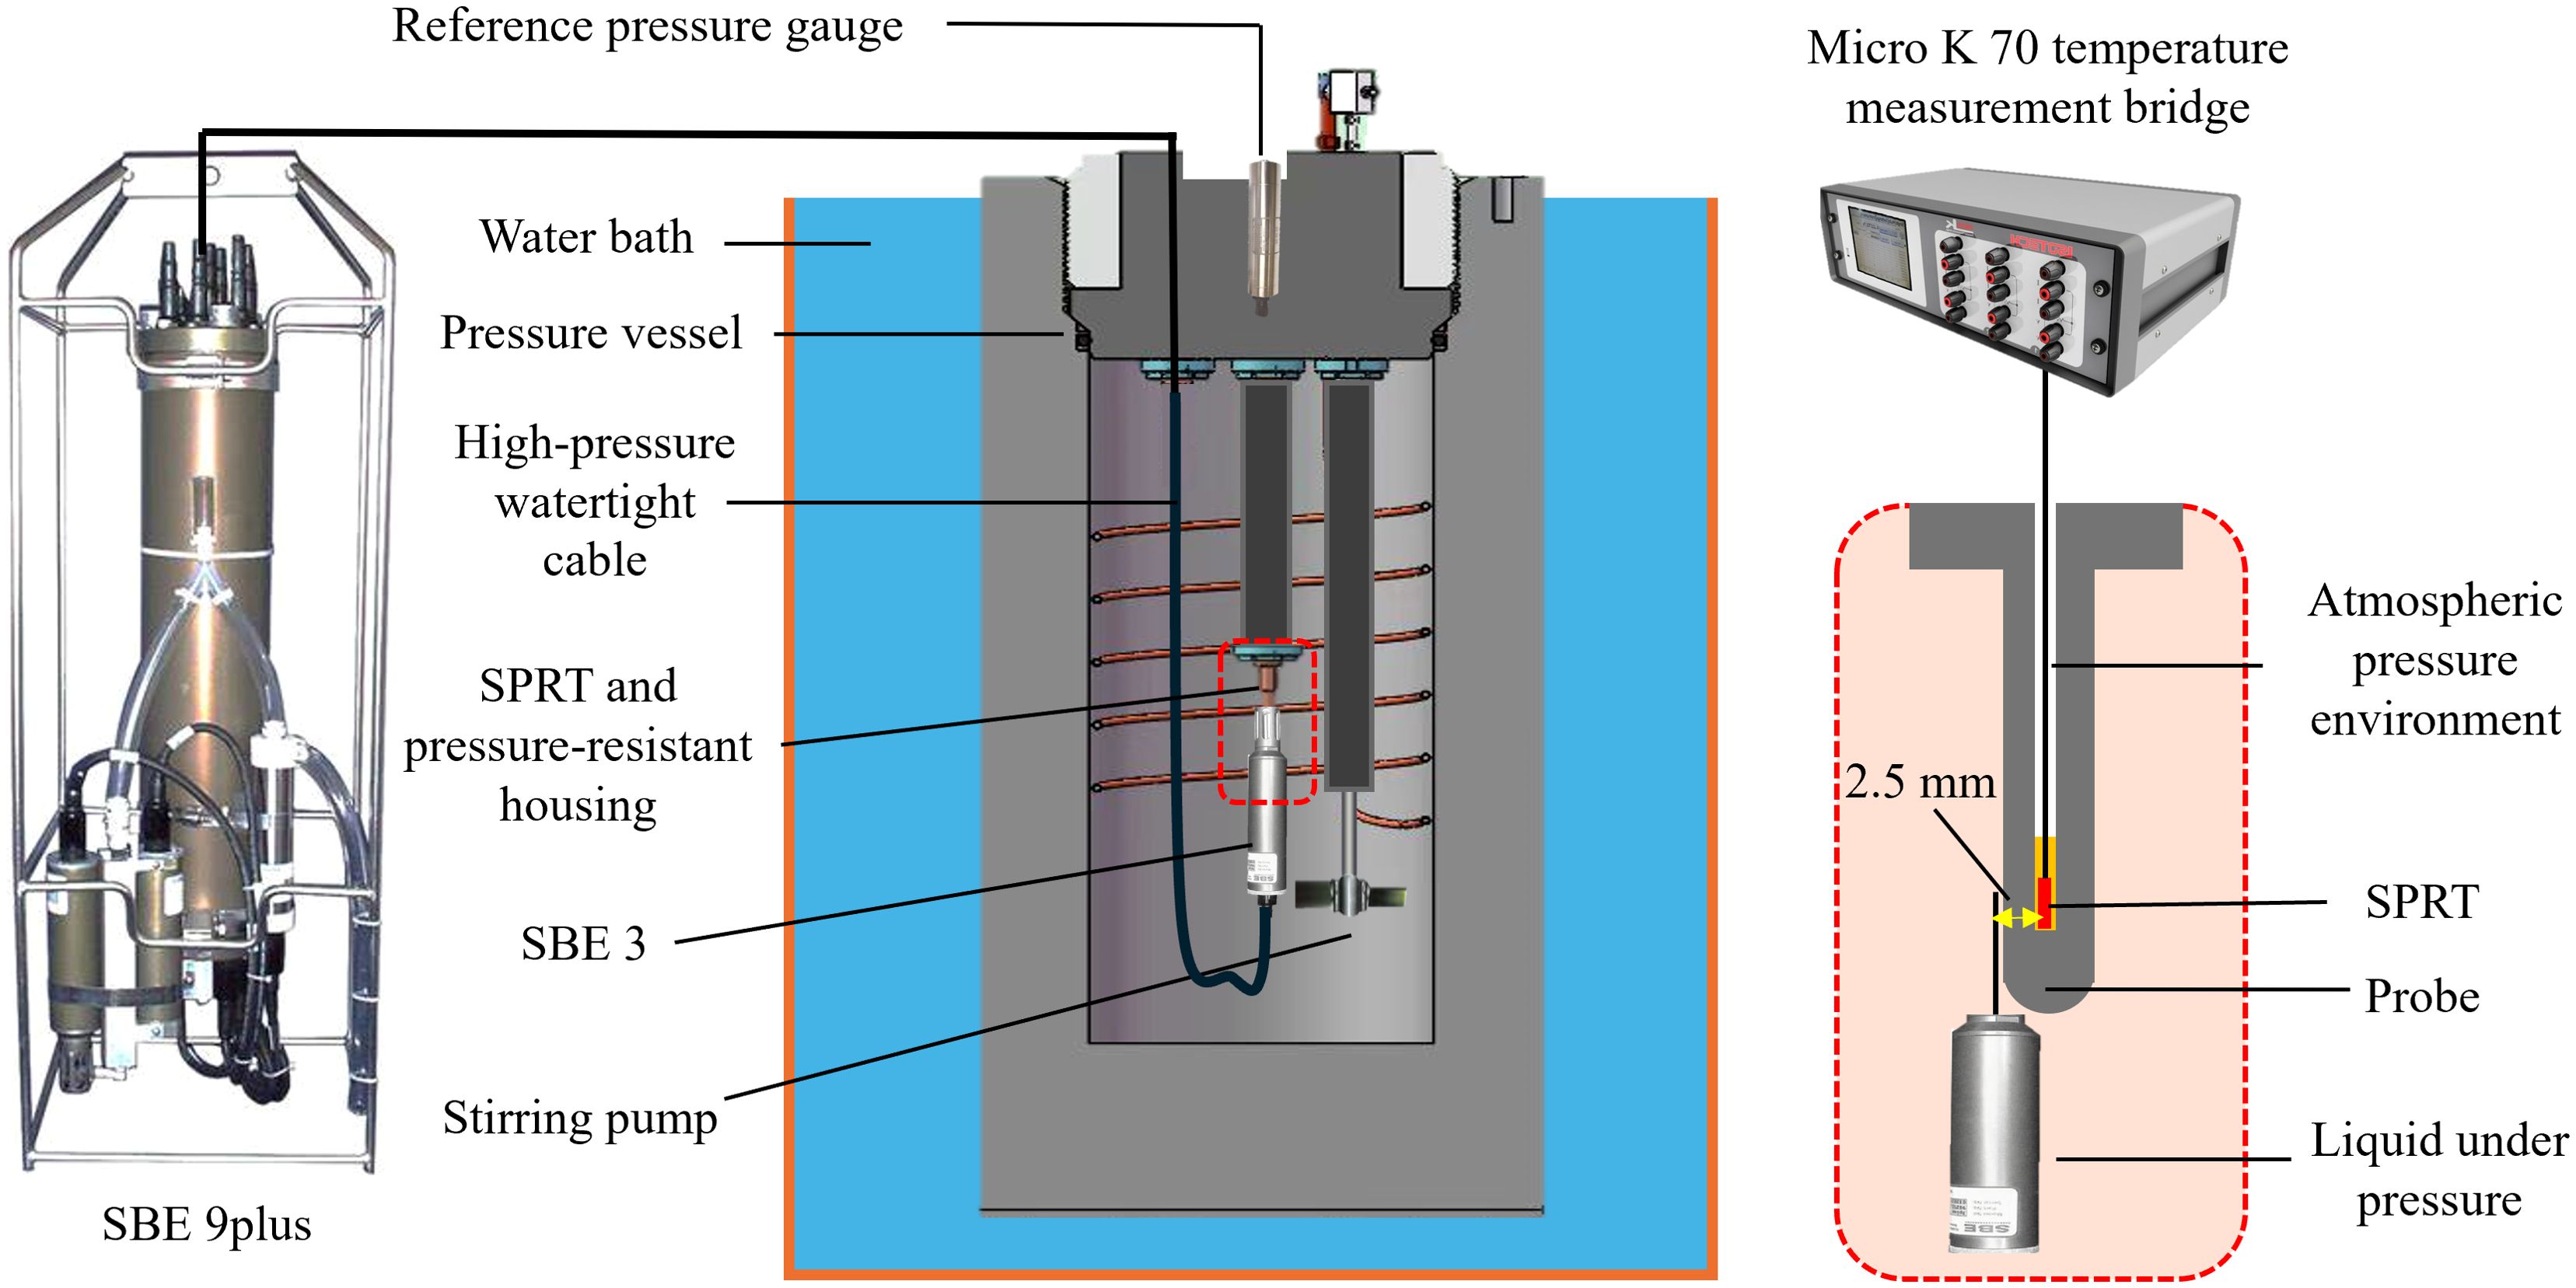
Figure 3. Schematic diagram of the experimental setup for full-depth ocean pressure simulation and temperature comparison experiment setting.
The red dashed box provides a detailed view of the placement of the SBE 3 probe and the pressure-resistant encapsulated SPRT. The SPRT is immersed in thermally conductive silicone oil within the pressure-resistant housing. The design principle of the housing ensures that, even under slight deformation, its inner diameter remains larger than the SPRT, thus fully shielding the SPRT from the simulated chamber pressure. The thermally conductive silicone oil inside the housing is vented to atmospheric pressure through a sufficiently long capillary. This allows the silicone oil to flow slightly when the housing is compressed, preventing stress transmission to the SPRT, which could otherwise occur in closed solid thermal structures. To minimize external temperature effects, the SPRT is positioned at the center of the pressure chamber through the pressure-resistant adapter and is connected to the MicroK 70 temperature measurement bridge via four equidistant copper wires. The SBE 3 is in close contact with the encapsulated housing, ensuring that both measure the same temperature point.
Prior to operation, the system is filled with seawater. A high-pressure gas-driven unidirectional pump generates the required hydrostatic pressure. Once the target pressure is reached, a precision servo cylinder adjusts a piston to maintain pressure fluctuations within ±0.005% FS of the set system pressure. Internal system pressure is continuously monitored by a Paroscientific 745-20k pressure sensor (serial No. 148678). This sensor provides high-precision feedback to the servo cylinder, ensuring stable and precise pressure control within the vessel. This system is vital for the precise calibration and testing of the SBE 3 thermometer under simulated deep-ocean conditions. Figure 4 shows the system’s capability to maintain a pressure of 1000 bar for 16 hours.
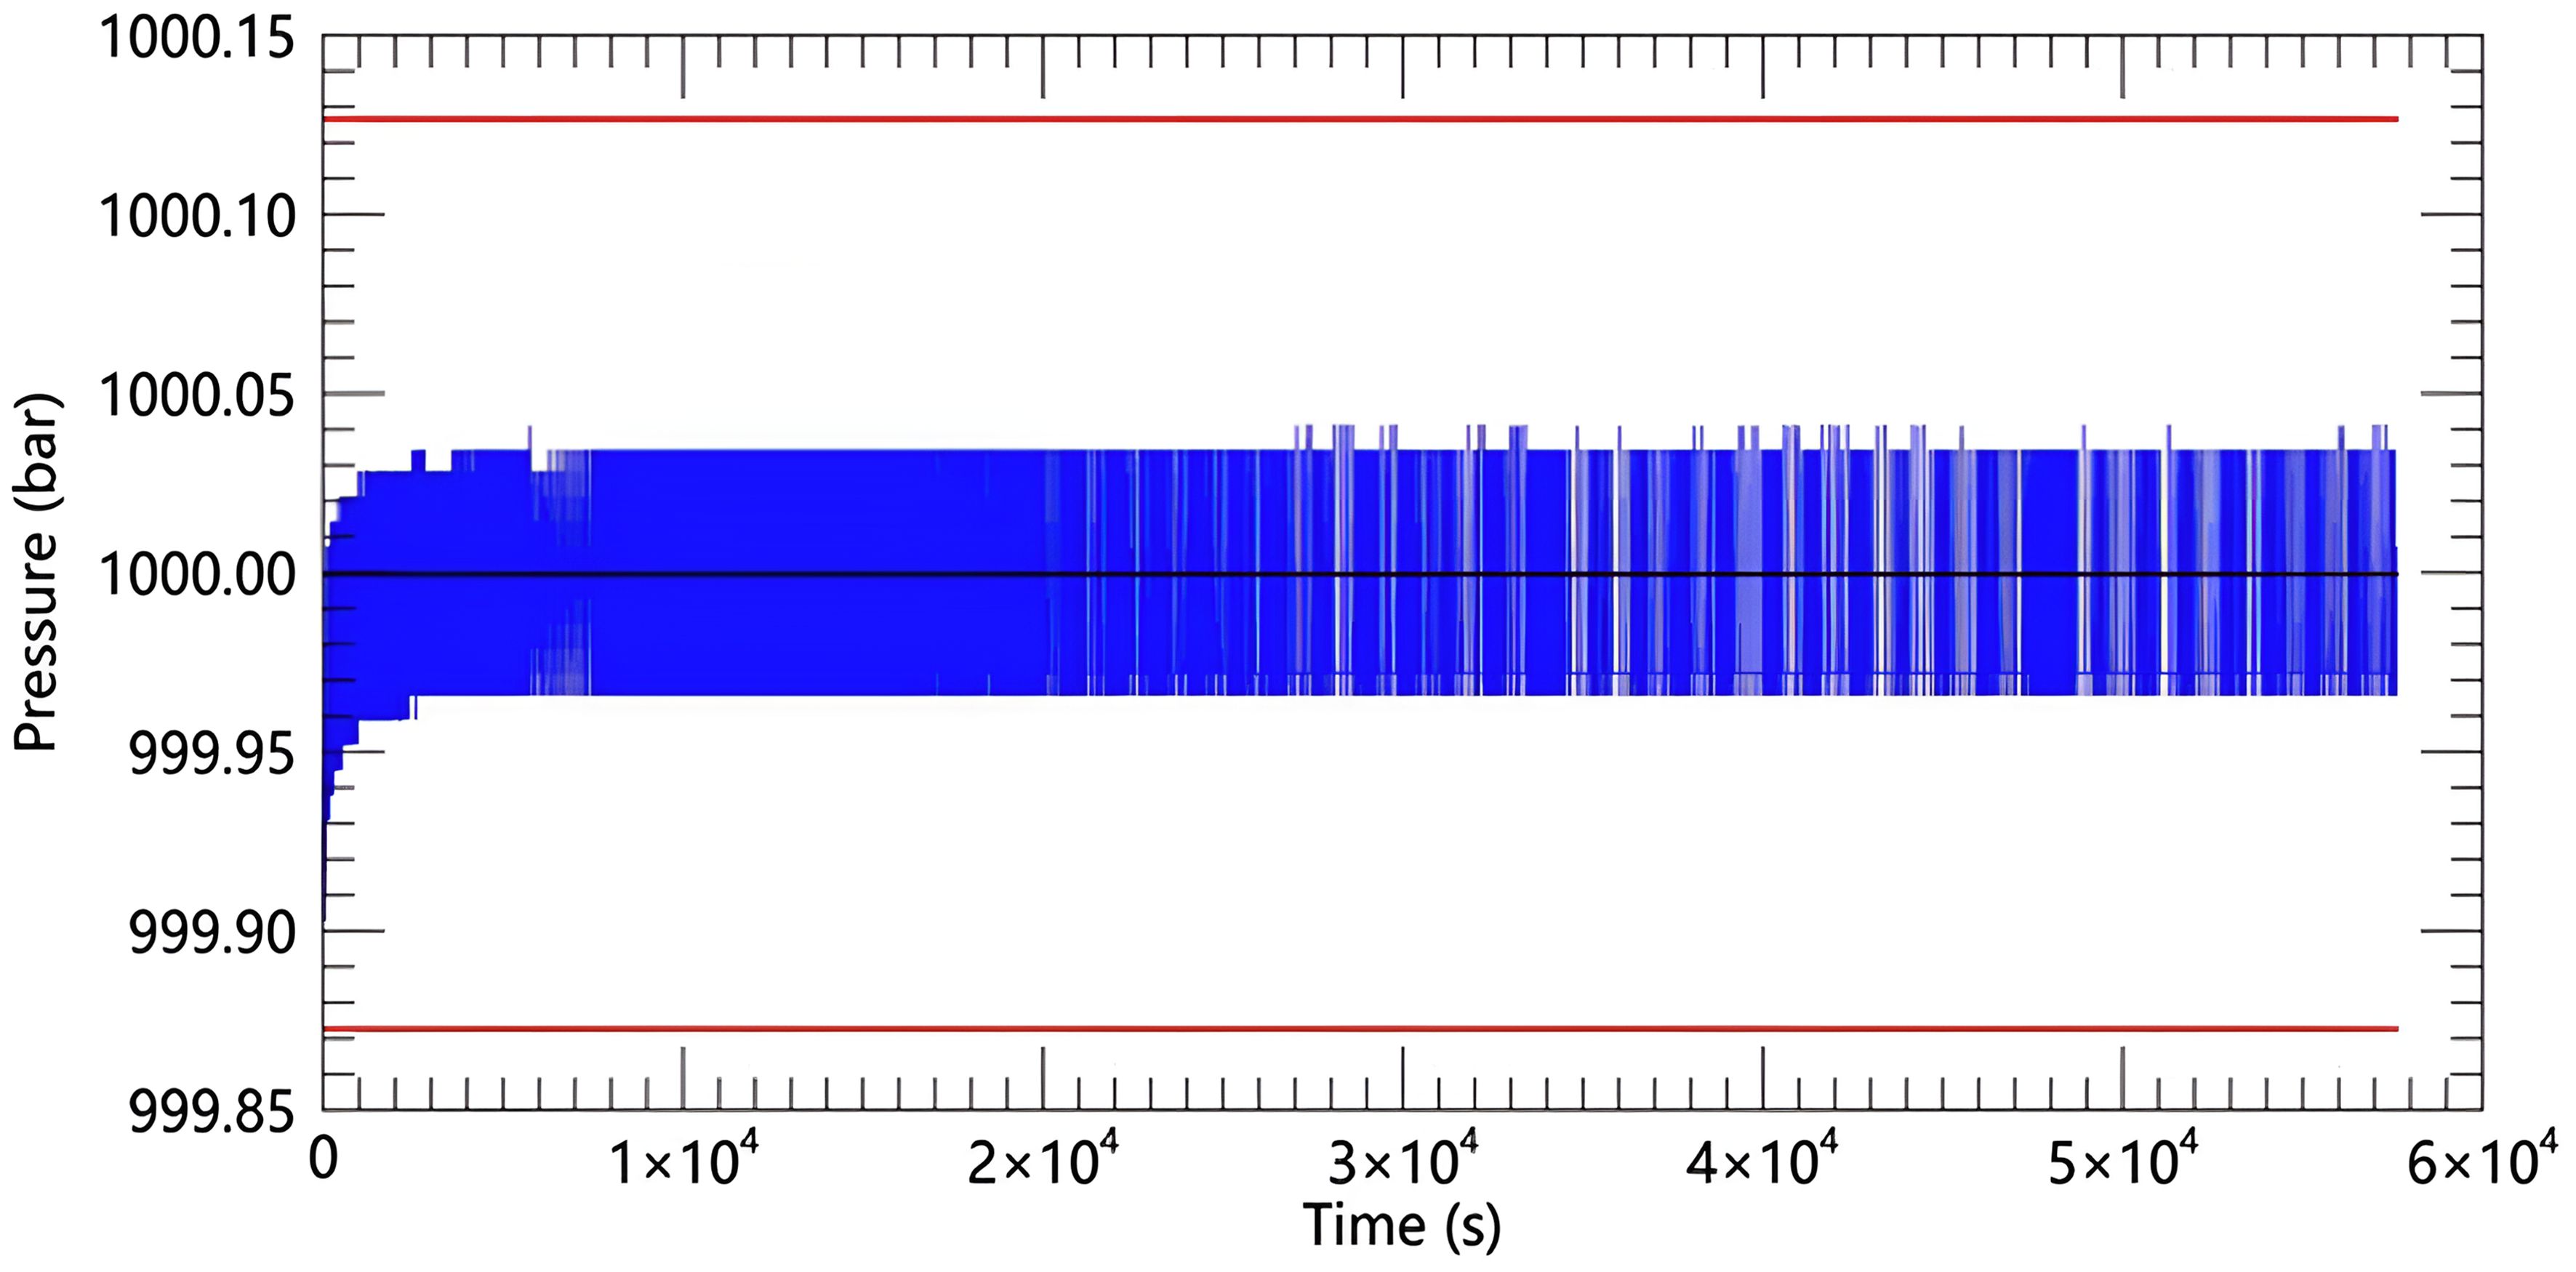
Figure 4. Pressure curve at 1000 bar for 16 hours (blue line). The black line is the pressure setting value, and the red line is the setting value ±0.127 bar(± 0.01%FS).
To control the temperature, a thermostatic water bath was used. The thermostatic water bath achieves internal and external temperature equilibrium of the pressure chamber, which houses the sensor under test through heat transfer from the outside to the inside and by circulating the water within the bath. As shown in Figure 3, an adjustable-speed propeller-type pressure-resistant stirring pump inside the pressure chamber disrupts any stratified temperature layers, accelerating the heat transfer process and reducing the time required for the internal temperature to stabilize. Throughout the experiment, the water temperature is set at 2°C, a common temperature in deep-sea environments.
To reduce temperature field non-uniformity and avoid the influence of the laboratory environment on temperature measurements, the temperature variations measured by the SBE 3 (inside the pressure vessel) and the closely adjacent SPRT (inserted into a pressure-isolated cylindrical sleeve within the pressure vessel) are illustrated in Figure 3. Figure 5 shows the temperature variation over time as the system stabilizes at 1050 bar pressure. The red points represent the readings from the SBE 3 probe, while the blue points represent the readings from SPRT. It can be observed that the readings from both sensors remain highly consistent over time, indicating a close correlation between the two temperature sensors. This consistency indicates that the SPRT can reliably measure the temperature variations near the sensing element of the SBE 3.
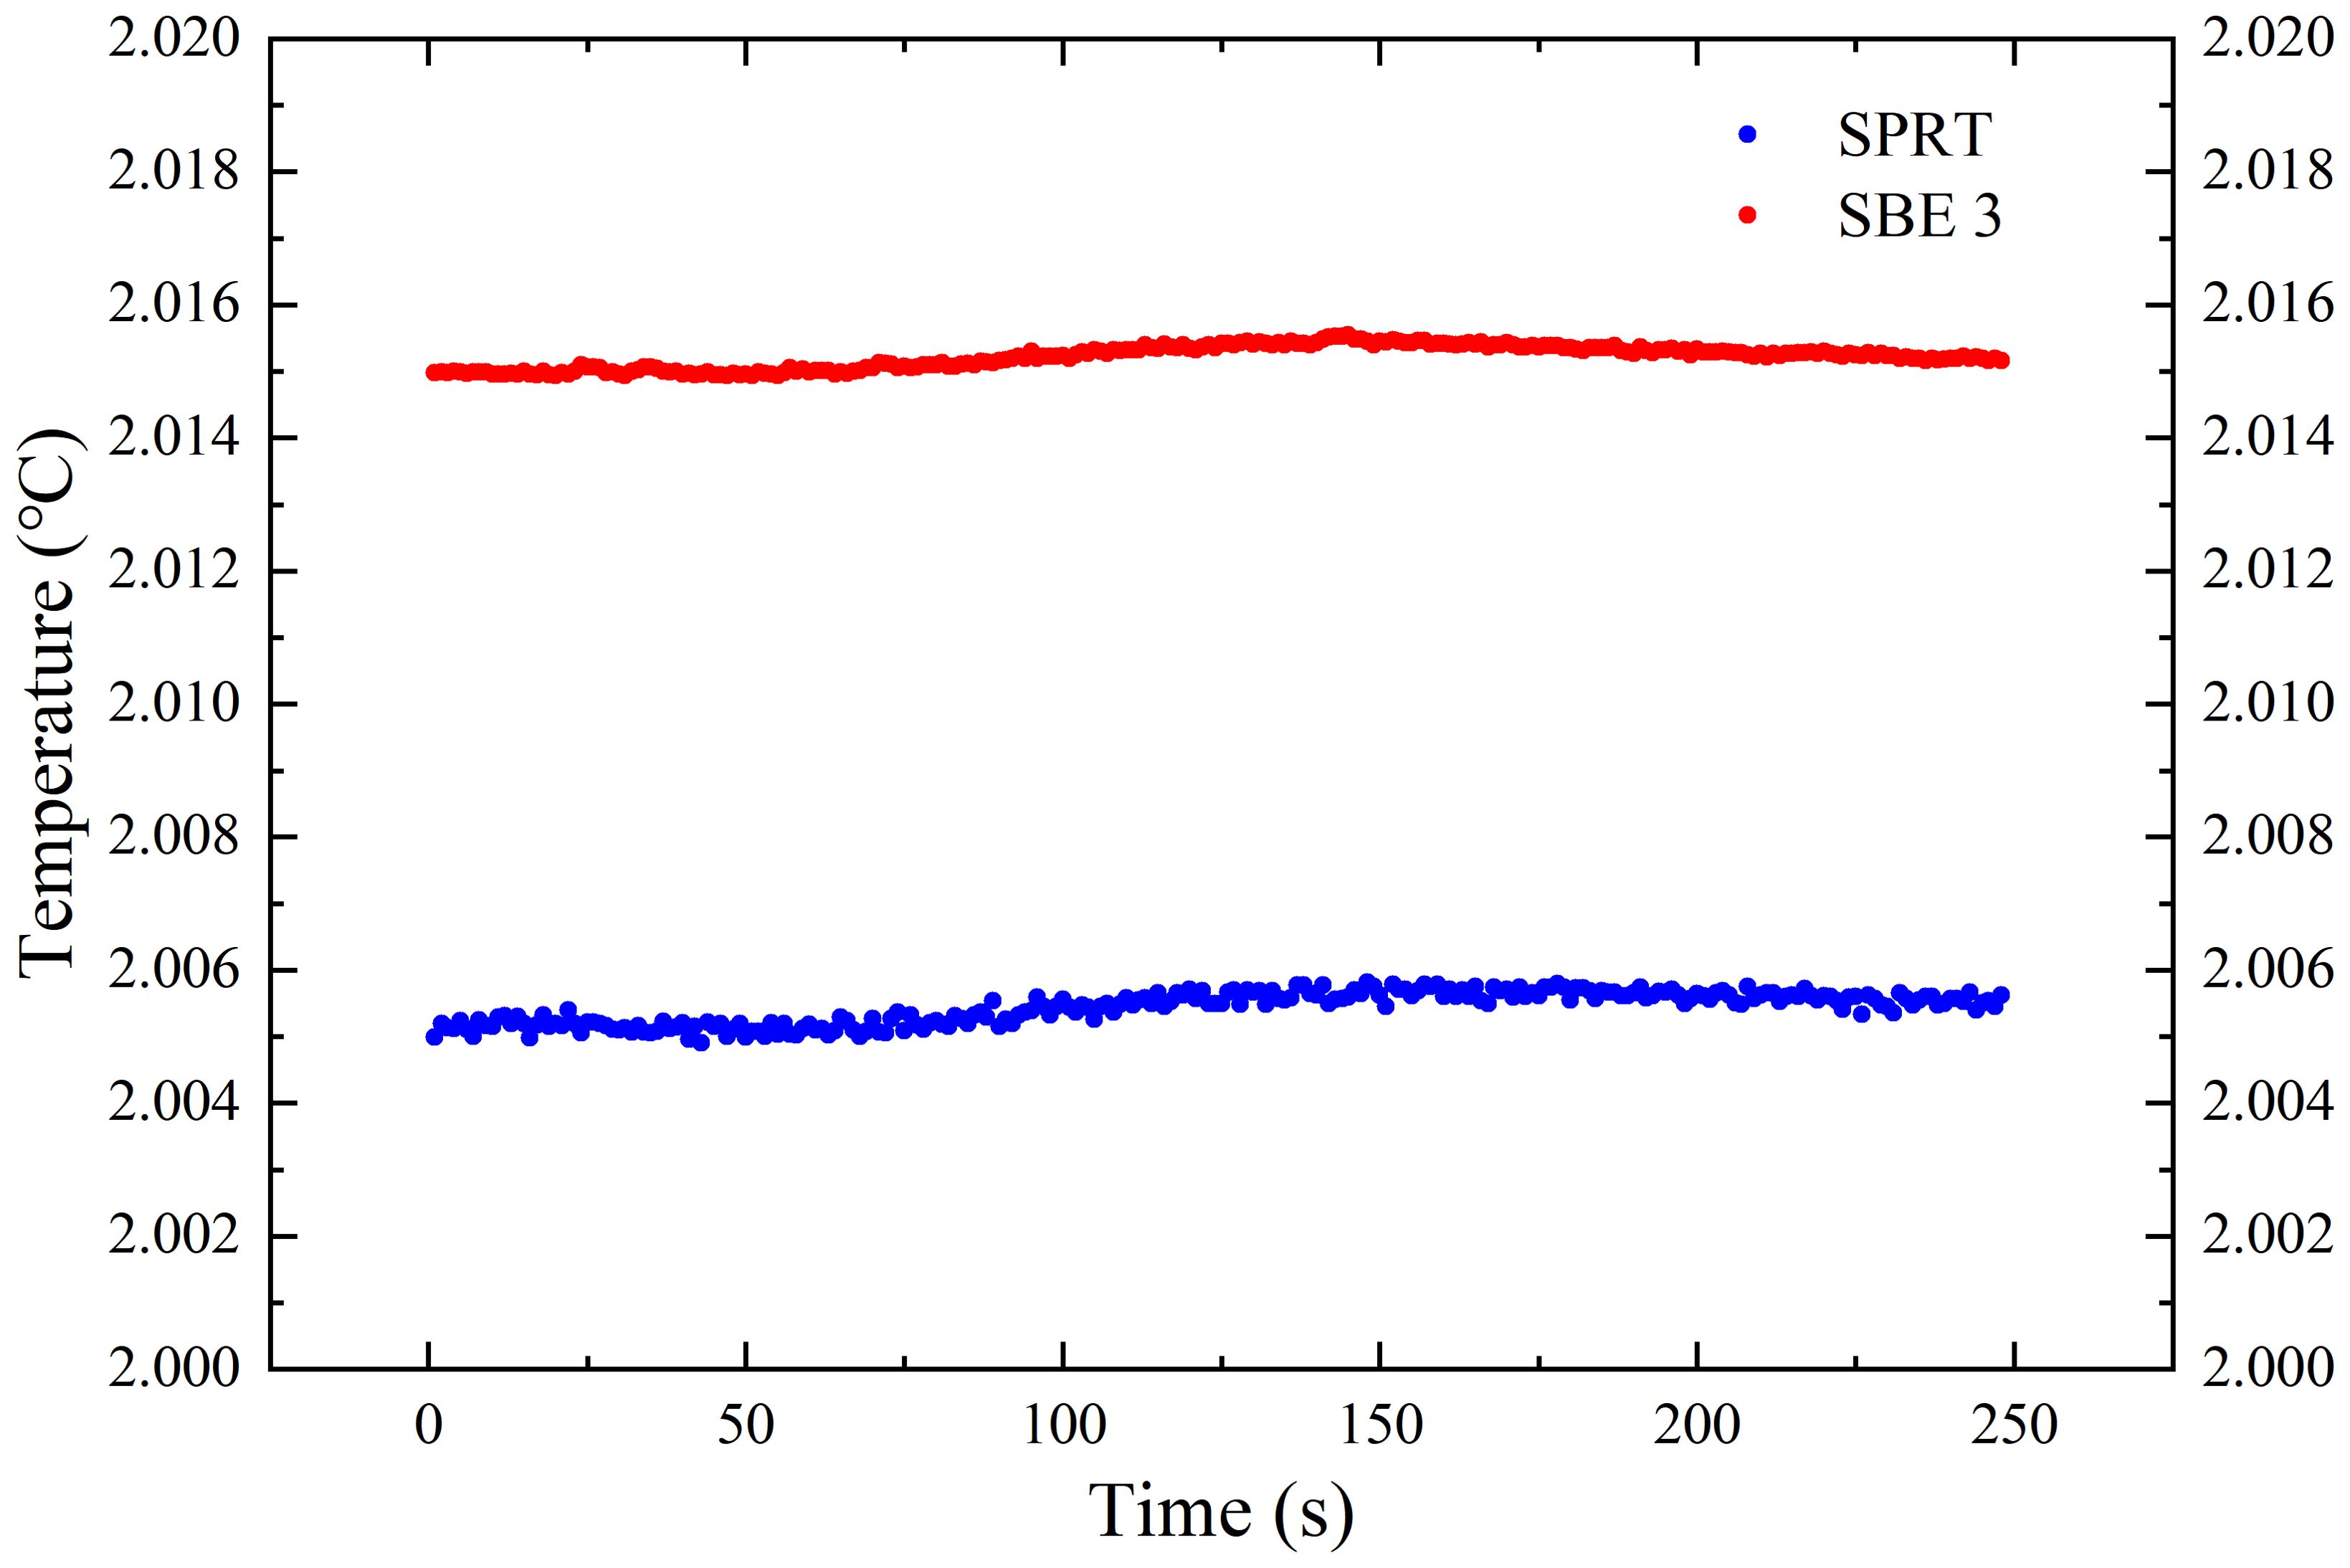
Figure 5. Temperature correlation between the SBE 3 probe and the SPRT, the blue points represent the temperature readings of the SPRT (reference thermometer), while the red points represent the readings of the SBE 3 thermometer.
In conducting this experiment, the pressure within the thermostatic pressure tank was set to 0 bar (atmospheric pressure with no external pressure applied), 300 bar, 600 bar, 900 bar, and 1050 bar. To ensure temperature uniformity and stability within the pressure chamber, the system maintained continuous pressure and temperature control for more than 4 hours at each pressure step.
Figure 6 illustrates the variation of temperature and pressure over time during the test. The red curve represents temperature (left vertical axis, in °C), and the blue stepped curve represents pressure (right vertical axis, in bar). The figure shows that while the pressure increases, there is a brief rise in temperature, which quickly returns to the stable state prior to the pressure increase. This indicates that although the increase in pressure temporarily affects the temperature, the system can quickly restore temperature stability. This record demonstrates the system’s capability to rapidly stabilize temperature, ensuring that the temperature rise effect caused by increased pressure does not persist.
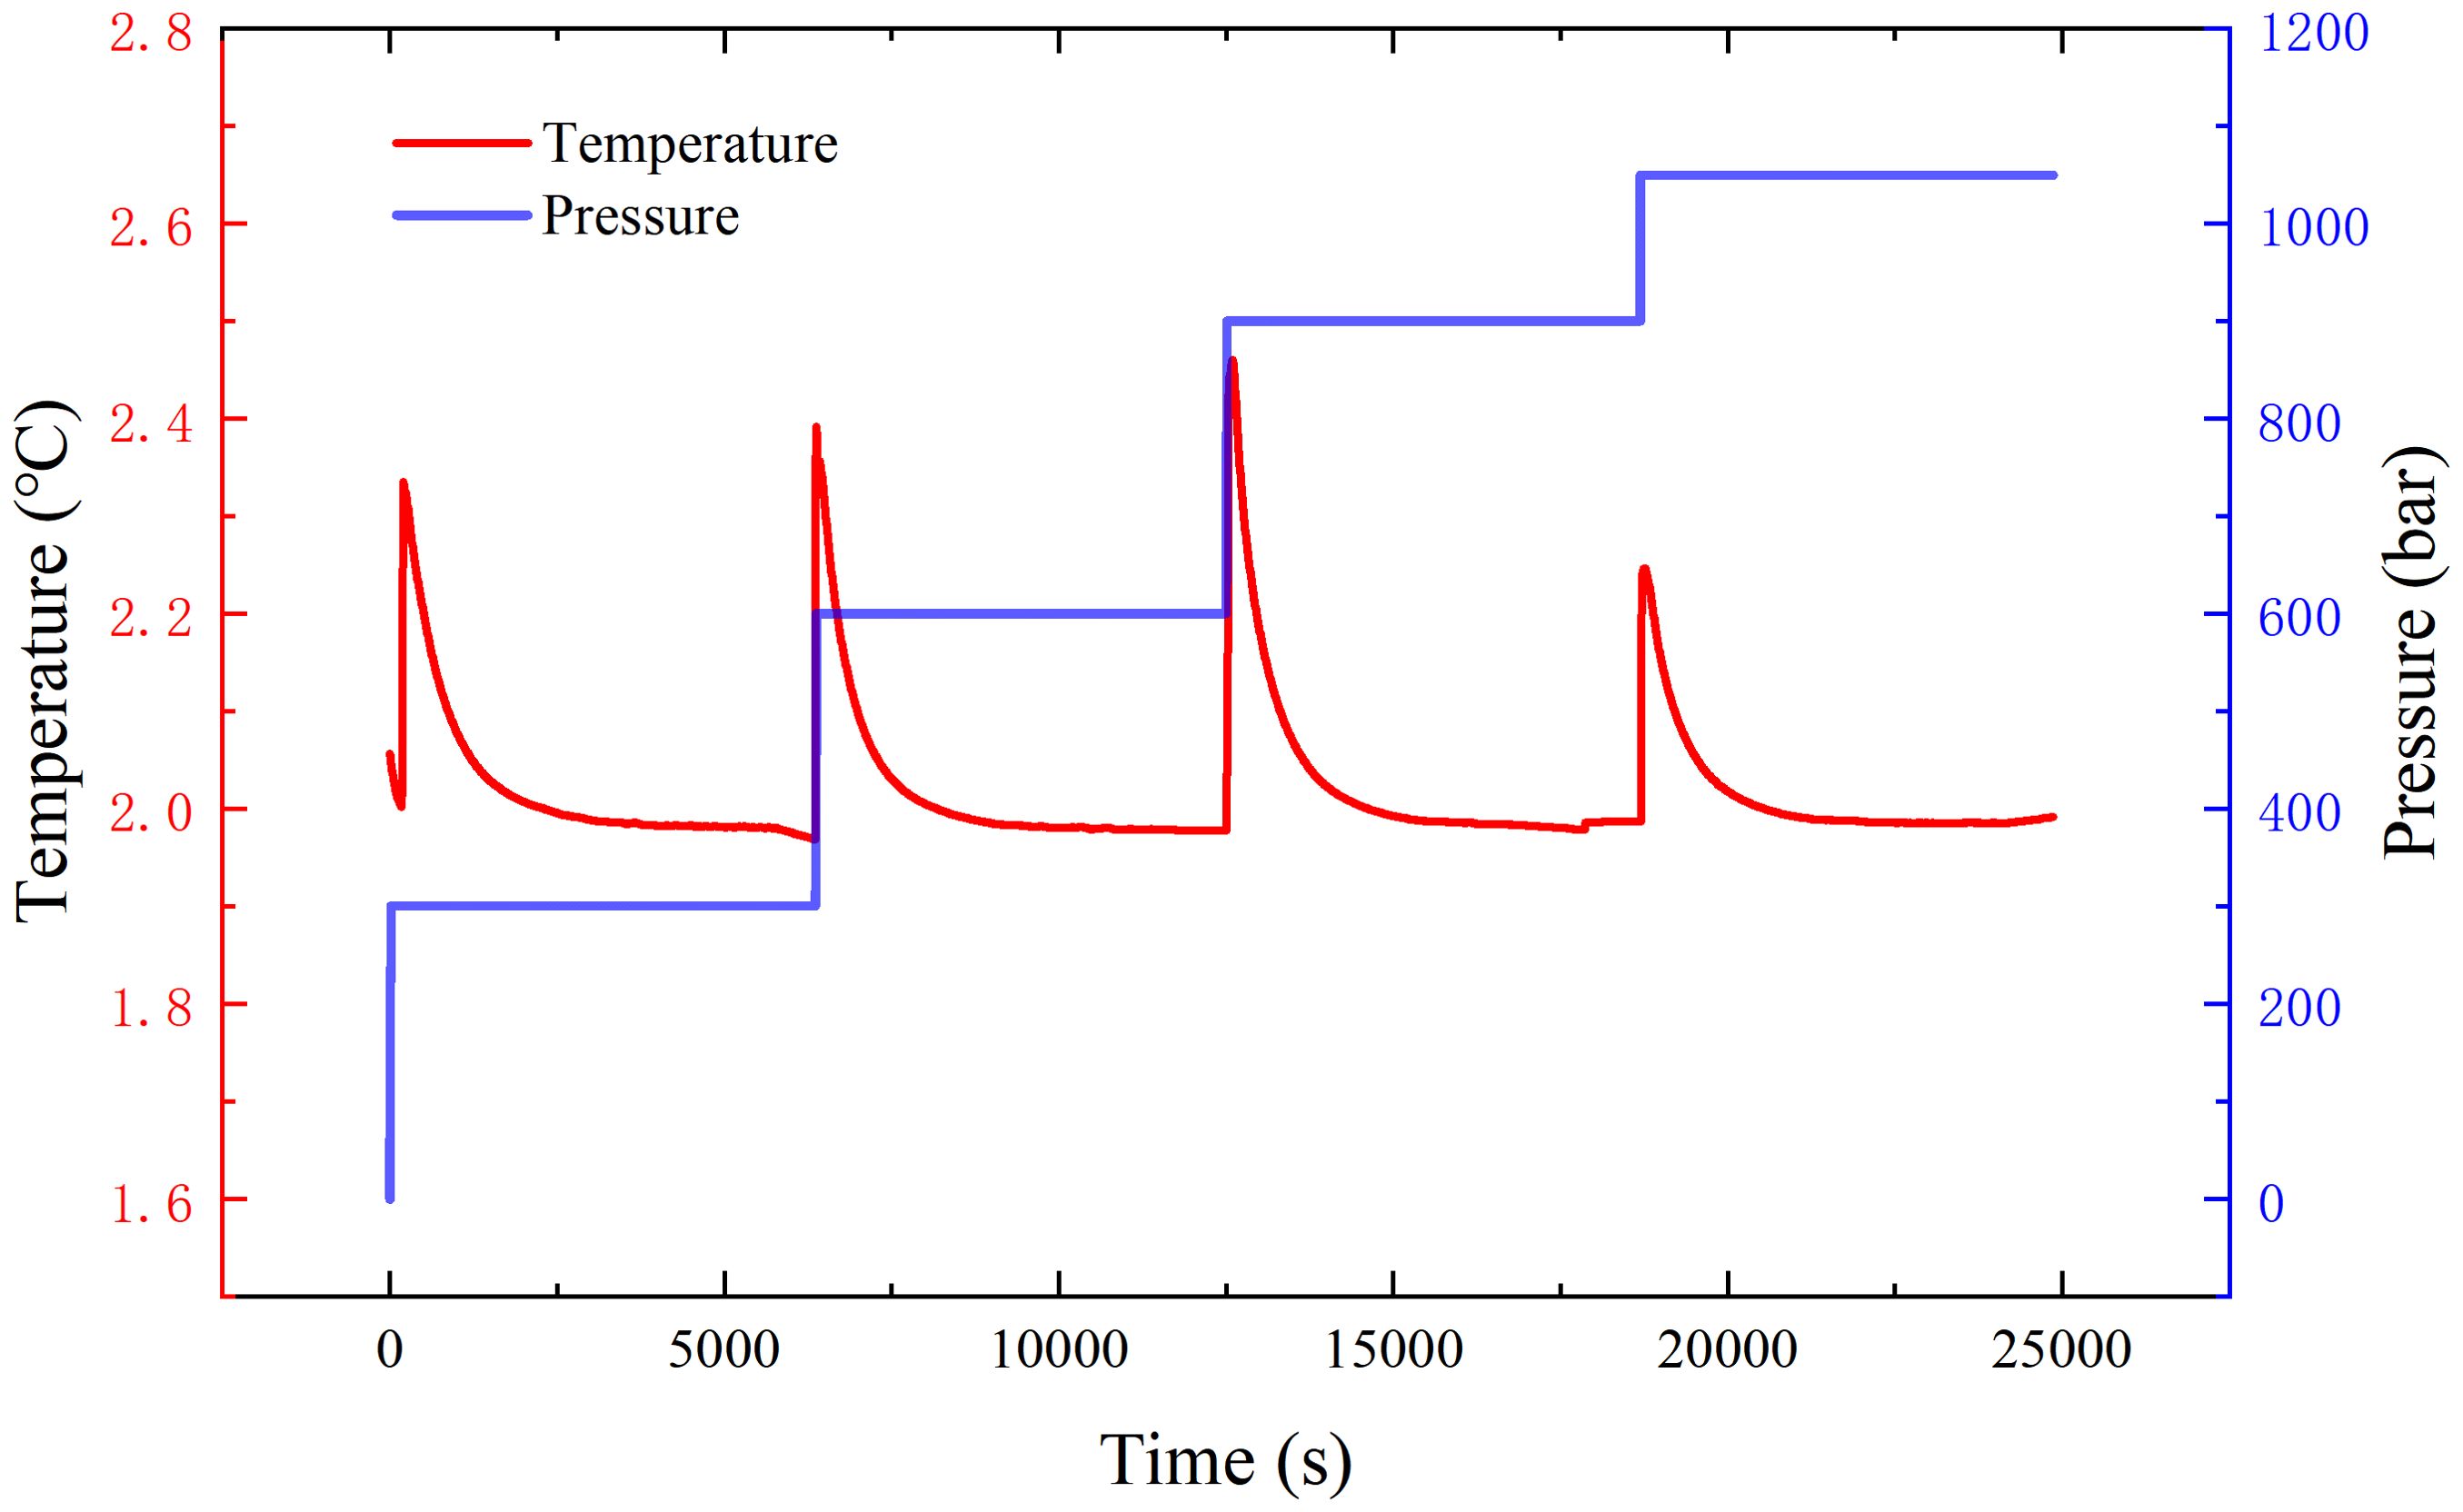
Figure 6. Temperature and pressure variations during testing, the red line represents temperature changes (°C) over time, while the blue line shows pressure variations (bar) throughout the test.
After the readings of the SPRT and the sensor under test have fully stabilized, the temperature readings from the SBE 3 and the SPRT are recorded. In this study, multiple tests were conducted on the SBE 3 thermometer (serial number SN 6320) under different pressure conditions to determine pressure dependence.
The experimental data from this study indicate that, after eliminating the zero-point error using Equation 2, the temperature difference between the Standard Platinum Resistance Thermometer (SPRT) and the SBE 3 probe was observed to gradually increase with increased pressure. Specifically, the SBE 3 probe exhibited a temperature drift of approximately 8.64617×10⁻⁶ °C/bar with increasing pressure. The SBE 3 probe (serial number SN 6320) demonstrated a clear and repeatable pressure dependence, with a significant linear correlation between the temperature measurement error caused by pressure and the environmental pressure value as shown in Figure 7.
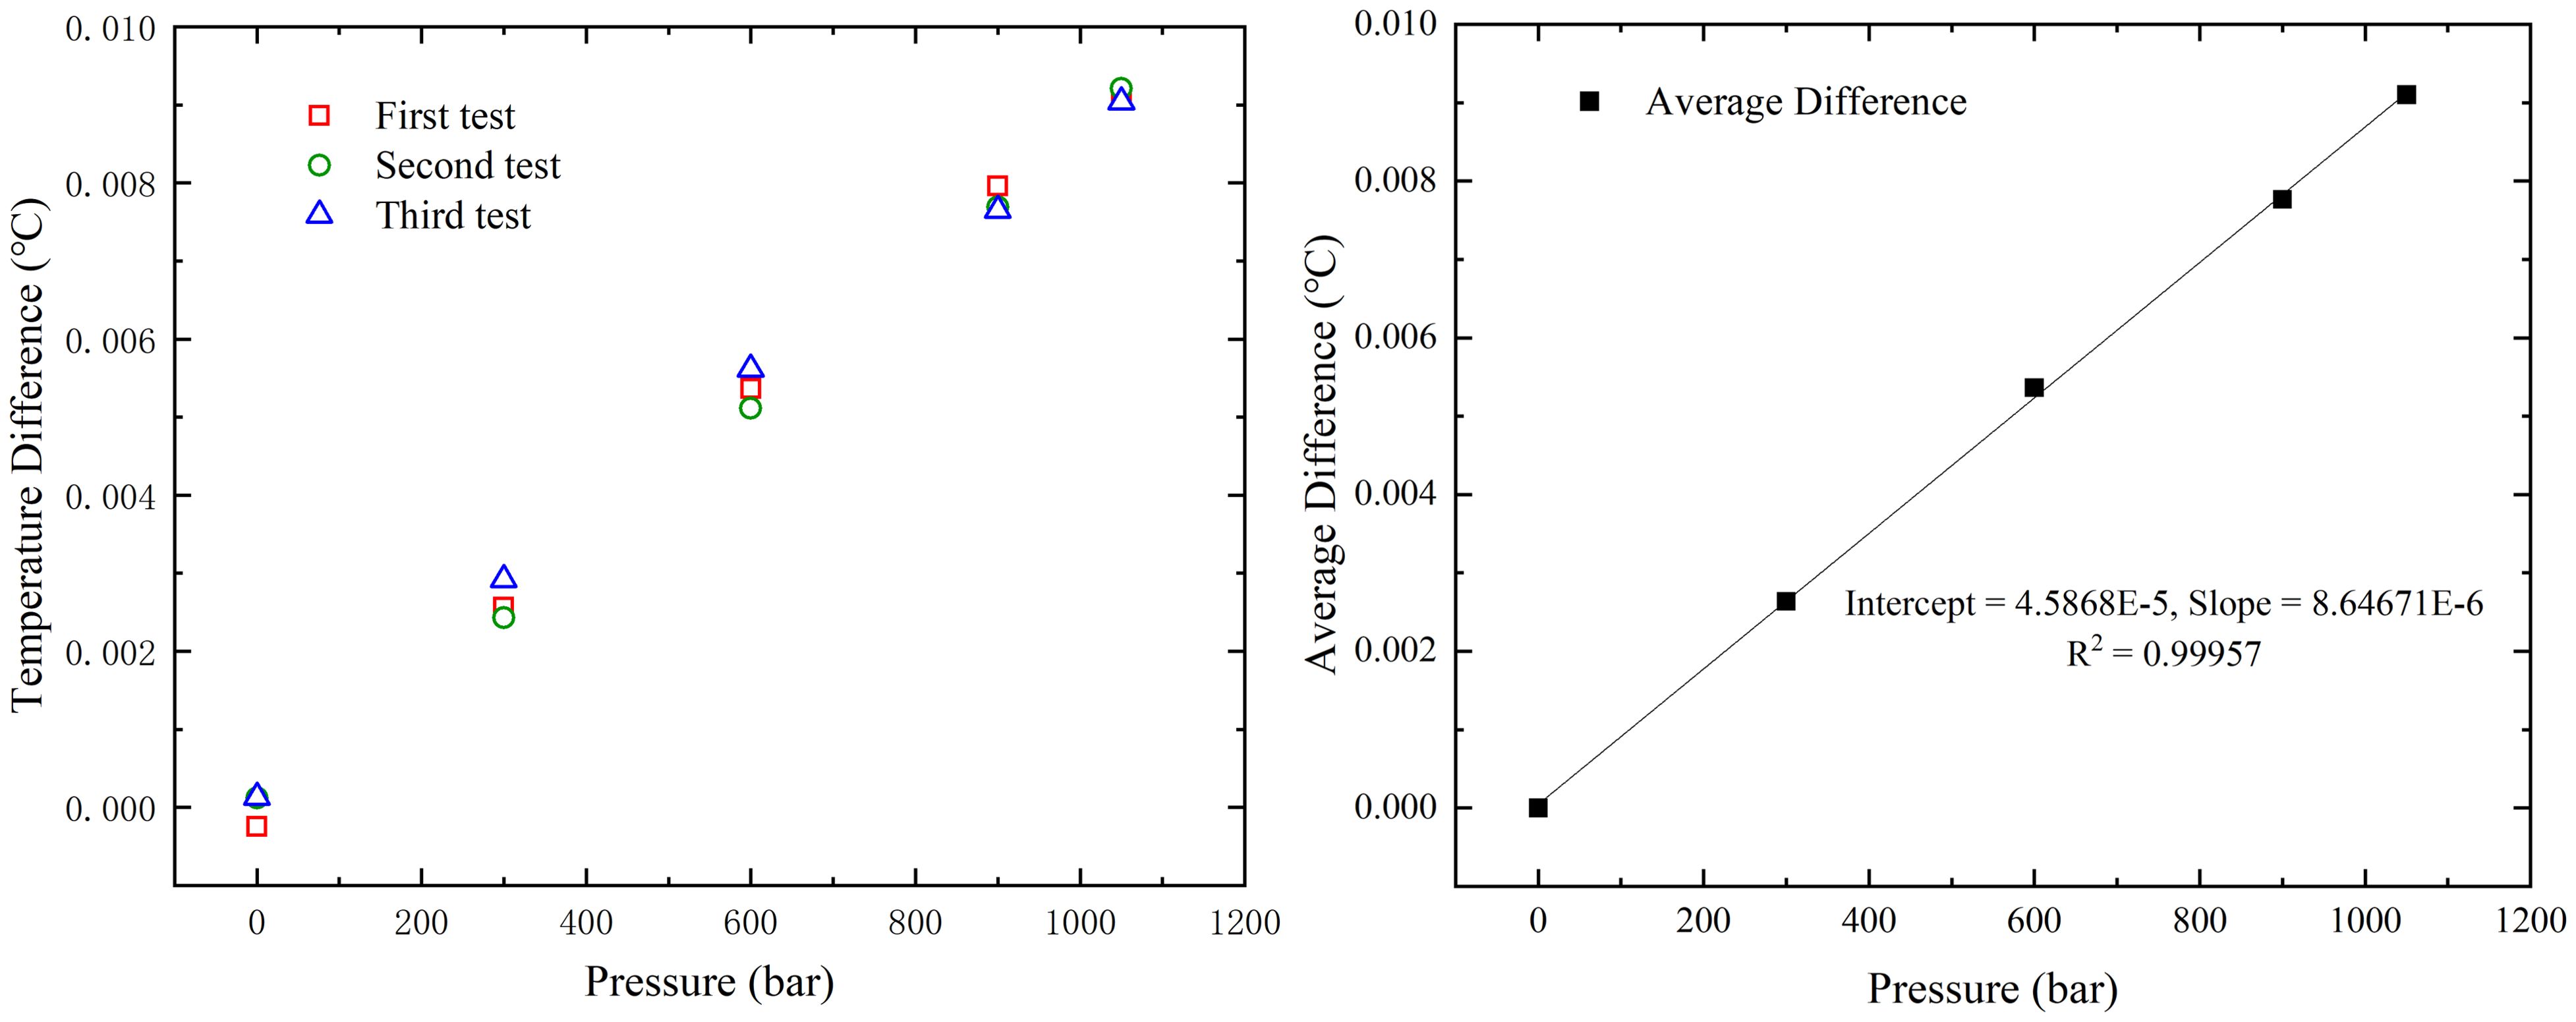
Figure 7. Relationship between temperature indication error and environmental pressure: The left panel shows temperature differences (°C) across three separate tests at various pressure levels. The right panel illustrates the average temperature difference as a function of pressure.
At a hydrostatic pressure of 1050 bar, the SBE 3 probe experienced a pressure-induced temperature drift of nearly 0.01°C (10 mK), which exceeds the manufacturer’s specification of ±0.001°C (1 mK). This drift value was confirmed through three repeated tests, demonstrated the pressure dependent temperature relationship of this SBE 3 probe.
These findings underscore the importance of accurate pressure calibration for the SBE 3 temperature sensor in deep-sea environments, enabling precise in situ temperature measurements. It is important to note that this pressure dependence coefficient is unique to each thermometer. The pressure effect on deep-sea thermometers is due to pressure transmission through the stainless-steel needle containing the thermistor in glass beads, which varies among different thermometers. Thus, the specific pressure response observed in the SBE 3 thermometer is expected. Based on prior studies (Uchida et al., 2015; Peruzzi et al., 2017), in-situ calibration of deep-sea working thermometers (such as the SBE 3) against reference thermometers (such as the SBE 35) should not be performed without considering the unique pressure dependence characteristics of each reference thermometer.
As shown in Table 1, the standard deviation of the environmental pressure , the standard deviation of the SPRT readings , and the standard deviation of the temperature differences between the two thermometers at various pressures were calculated for each test. The experimental data indicate that across a range of pressures from atmospheric pressure to 1050 bar, the standard deviations , and remained at low levels. In the three independent tests, the low values of demonstrate the high stability of the environmental temperature during measurements. The low values of indicate excellent temperature coordination between the SPRT and the thermometer under test, affirming the rigor of the pressure comparison experiments described in this study. Furthermore, the test results show that the temperature control in the experimental environment is highly accurate even under different pressure conditions, ensuring high data reliability. The stability of pressure control was validated by the consistent data obtained at various pressure levels, further proving the precision and repeatability of the experimental method.

Table 1. Standard deviation of environmental parameters and comparison results.
The expanded uncertainty U in this study was calculated based on the combined standard uncertainty and their calculation method is given in the following Equation 5. By applying a coverage factor k=2, corresponding to a 95% confidence level. The combined uncertainty includes contributions from the slight deviation in the temperature readings of the SBE 3 caused by pressure fluctuations, SPRT temperature measurement stability, and the temperature difference consistency between the two thermometers. The expanded uncertainty demonstrates the effectiveness of the calibration process in maintaining the accuracy and consistency of the SBE3 thermometer under varying pressure conditions.
In this equation:
1. This represents the uncertainty in temperature measurement caused by pressure fluctuations for the SBE3 thermometer. It is calculated in Equation 6:
Here, is the coefficient describing the effect of pressure on temperature, with a value of 8.64671×10⁻⁶°C/bar. and is the standard deviation of the pressure fluctuations (in bar).
2. represents the uncertainty of the standard platinum resistance thermometer itself, which reflects the calibration and measurement uncertainty of the SPRT. In this study, the value of is quantified as 0.3 mK.
3. represents the uncertainty due to temperature fluctuations in the controlled thermal bath during the experiment. In this study, the temperature stability of the bath is quantified as 0.3 mK.
4. represents the uncertainty of the temperature bridge measurement using the Micro K 70, which is quantified as 0.07 mK in this study.
The calculated expanded uncertainty for the SBE 3 deep-sea thermometer under varying pressure conditions (Table 1) highlights the reliability and repeatability of the experimental results. The results demonstrate that U remains 1.049 mK across all tested pressure points, from atmospheric pressure up to 1050 bar. This small uncertainty reflects the robustness of the experimental setup and the effectiveness of the calibration process in maintaining temperature measurement accuracy under high-pressure conditions.
In addition to studying the temperature readings at different pressure levels, this paper also investigates the temperature reading errors before and after the rapid pressure drop process. The thermometer was allowed to stabilize at 600 bar for a sufficient amount of time, ensuring that the internal temperature of the chamber was stable and uniform. The pressure was then suddenly released, and the readings of the SBE 3 and SPRT were recorded continuously. The results are shown in Figure 8.
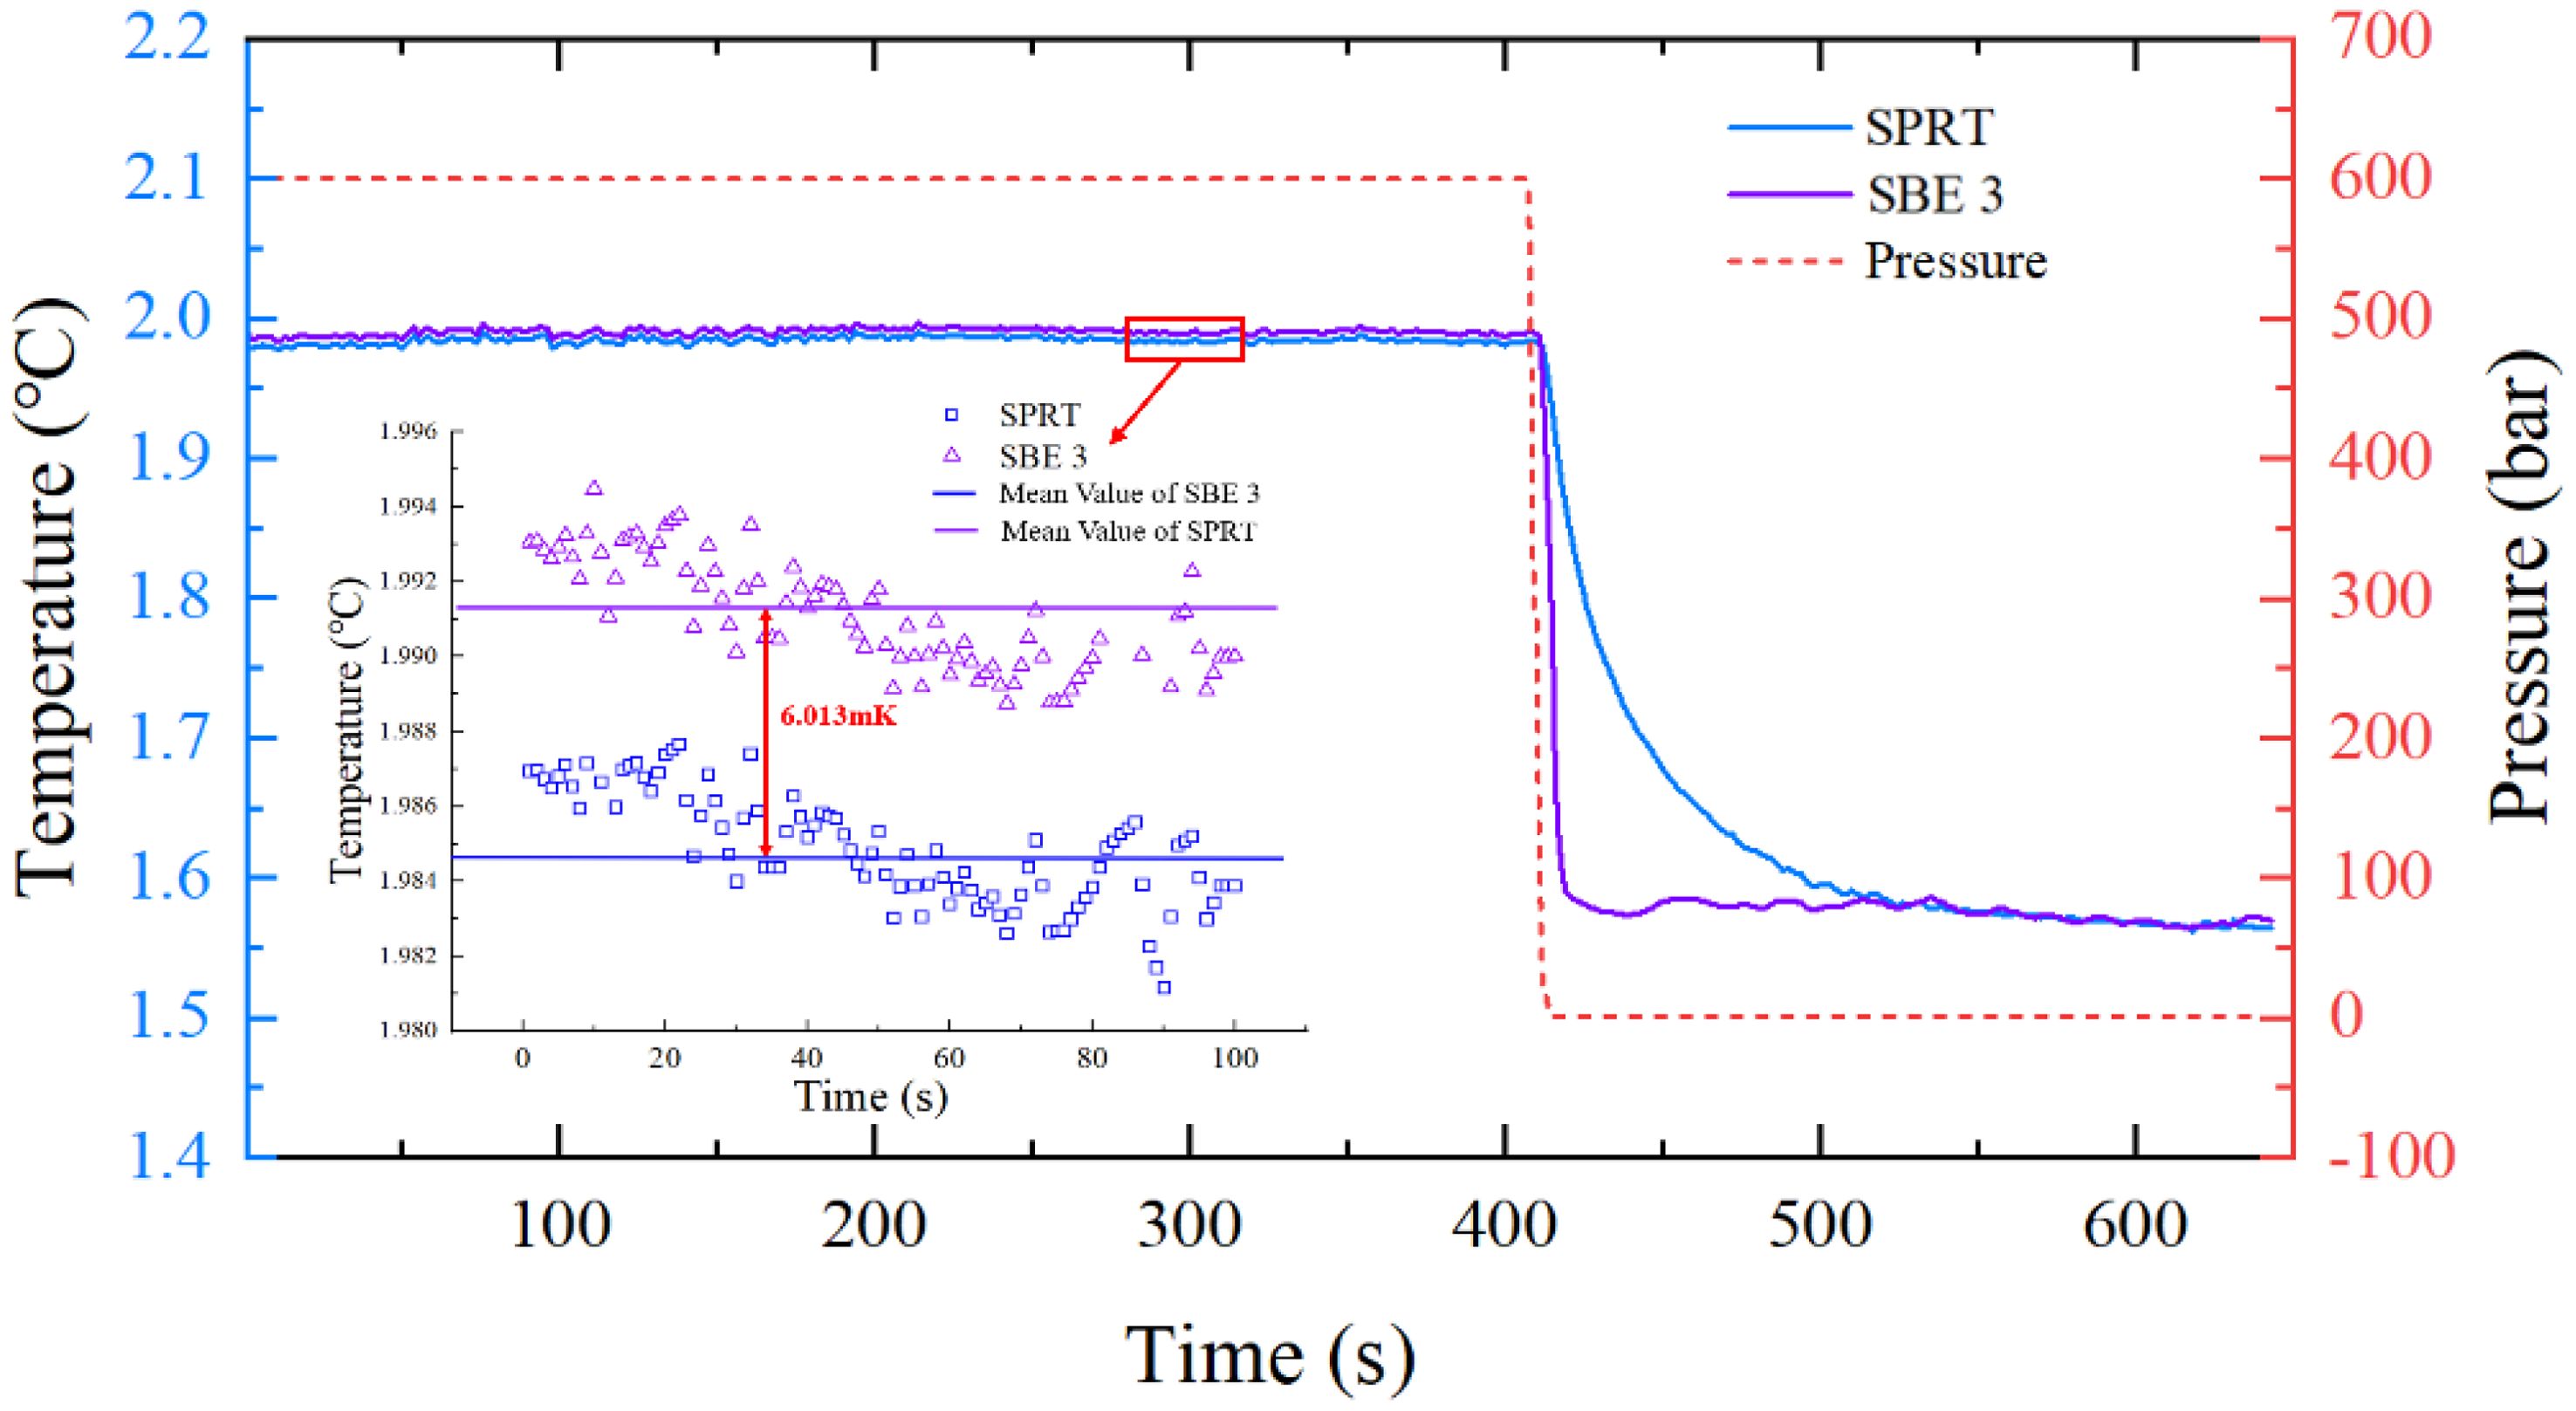
Figure 8. Graph of the change in temperature reading differences during the pressure drop process: This graph shows the temperature readings of the SBE 3 (purple line) and SPRT (blue line) thermometers during a pressure drop, with pressure (red dashed line) decreasing from 500 bar to near atmospheric levels. The inset zooms in on a specific time period, illustrating a temperature difference of 6 mK between the SPRT and SBE 3 readings.
As observed during the rapid pressure release from 600 bar to atmospheric pressure, there is a significant difference in temperature response between the SBE 3 and SPRT. The red dashed line in the figure represents the pressure, which drops rapidly from 600 bar to atmospheric pressure, occurring around 400 seconds. The SBE 3 temperature curve, depicted in purple, demonstrates a very fast response time, quickly reflecting the sudden temperature drop caused by the rapid release of compressed water. Conversely, the SPRT temperature curve, shown in blue, exhibits a slower temperature response due to its robust encapsulation design with a higher safety factor. Following the rapid pressure drop, the SPRT temperature response lags behind that of the SBE 3. Subsequently, due to thermal diffusion driven by the temperature difference, the two sensors gradually reach thermal equilibrium.
Under high pressure, the temperature curves of both sensors exhibit a relatively constant difference. At 600 bar, the temperature reading of the SBE3 is slightly higher than that of the SPRT. After the pressure drops to atmospheric pressure, the temperature readings of the SBE3 and SPRT gradually converge, indicating that both sensors stabilize and approach similar temperature readings once the pressure is relieved. The inset in the figure further illustrates the temperature drift behavior of the SBE3 and SPRT under high-pressure conditions. It can be observed that, at a stable pressure of 600 bar, the two sensors show a consistent temperature difference of approximately 6.01 mK. When the pressure drops to atmospheric pressure, the temperature readings of both sensors stabilize and become closer to each other.
This method of comparing temperature measurement errors under varying pressure conditions proves effective. By maintaining the high pressure for an extended period, sufficient time is allowed for temperature synchronization, overcoming the challenge posed by the slower response time of the SPRT. In conclusion, the SBE3 exhibits a rapid temperature response capability, quickly reflecting temperature fluctuations caused by pressure changes. These results further underscore the importance of pressure calibration for deep-sea thermometers in simulated deep-sea environments.
In this study, a detailed analysis of the pressure effects on the SBE 3 deep-sea thermometer was conducted. Through multiple experiments, the temperature drift characteristics of the SBE 3 at different pressure levels were identified, and a linear relationship between pressure and temperature drift was established. Once the repeatability of this relationship was confirmed, precise pressure calibration of the thermometer in situ could be performed using the environmental pressure value provided by a pressure gauge. This calibration process typically involves subtracting a correction factor, determined by the pressure, from the raw temperature readings. This correction factor is based on the predetermined relationship.
By applying this calibration, we adjust the raw temperature readings to account for the pressure effects, resulting in readings that more accurately reflect the true temperature. Using Equation 4 to calibrate the thermometer, we derived the calibration equation based on the slope and intercept of the linear regression equation: , where t is the raw temperature reading (in °C) and 𝑝 is the pressure reading (in bar). This equation allows for precise calculation and compensation of temperature drift caused by pressure changes.
This calibration method significantly improved the measurement accuracy of the SBE 3 probe under high seawater pressure. The experimental results shown in Figure 9 indicate that the accuracy of the calibrated SBE 3 probe improved under different pressure conditions. Specifically, at a pressure of 1050 bar, the temperature measurement uncertainty of the SBE 3 probe could be maintained within ±0.0005°C (0.5 mK). This high-precision calibration result not only validates the effectiveness of our pressure compensation model but also ensures that the SBE 3 thermometer can provide highly reliable temperature data in actual deep-sea environments. This is crucial for oceanographic research and deep-sea resource exploration activities that require extremely high measurement accuracy.
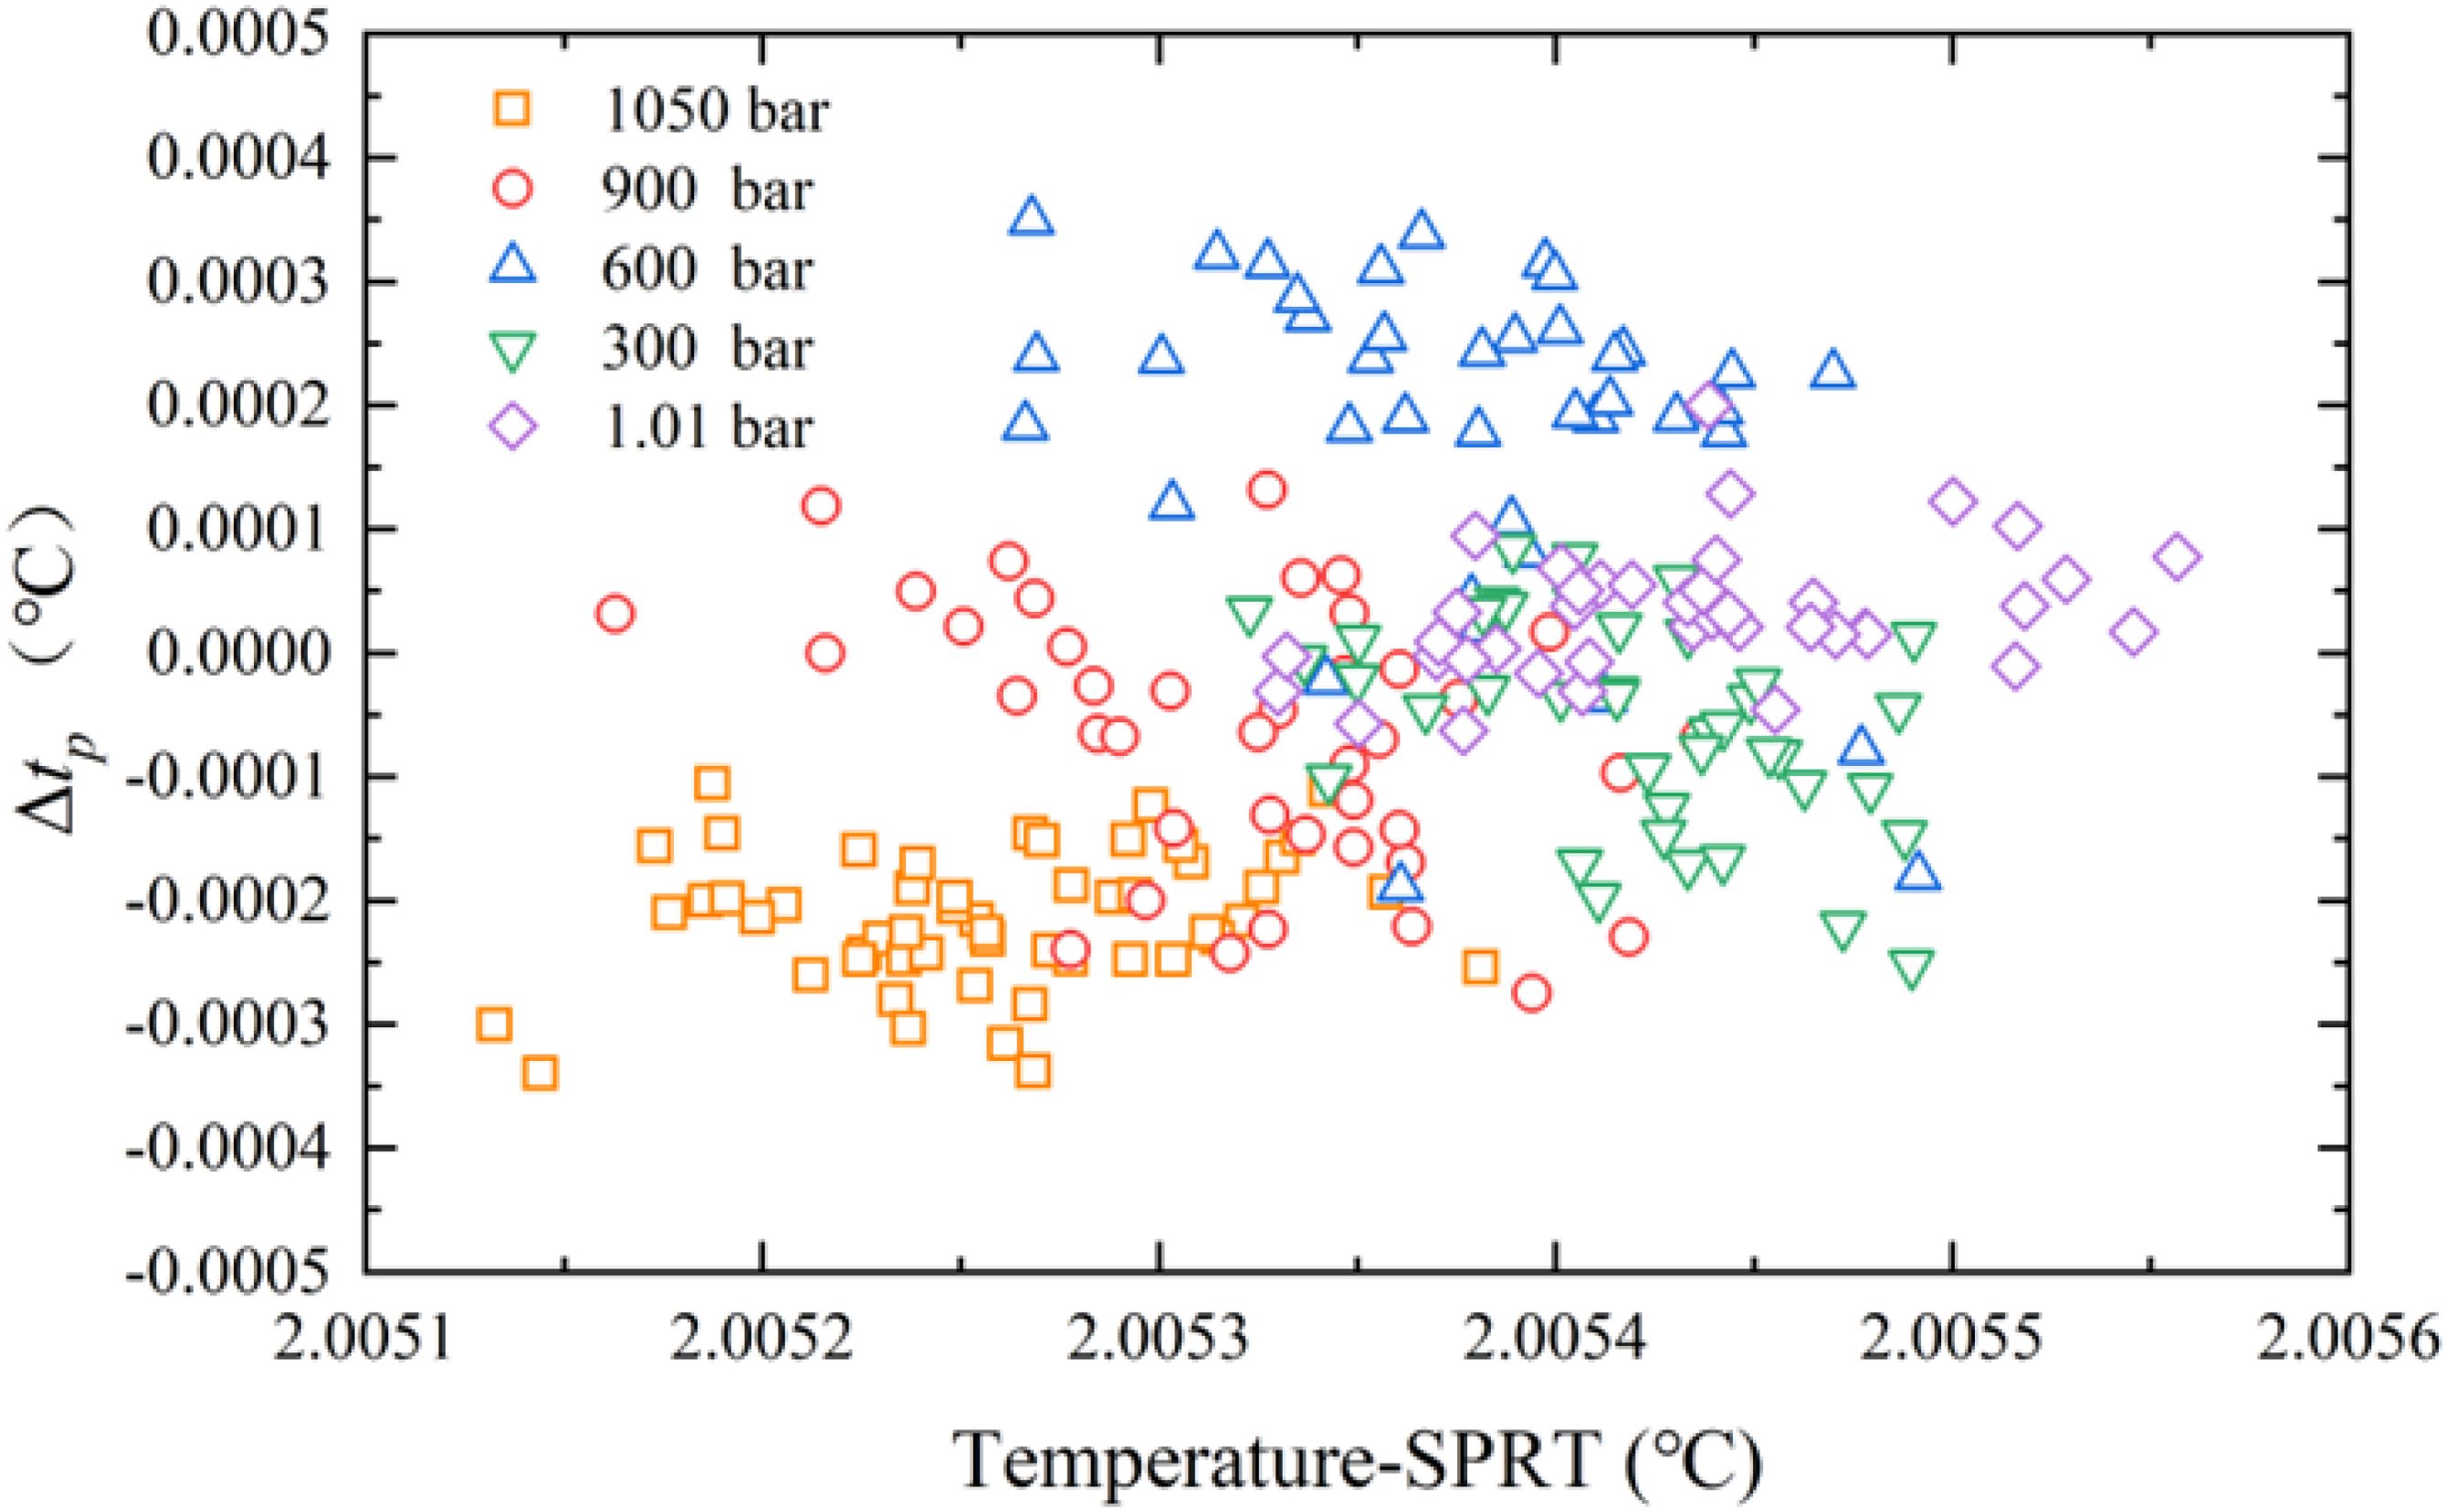
Figure 9. Calibrated indication error of SBE 3 (SN 6320) under various pressure conditions.
Building on previous research, measurement errors in deep-sea thermometers caused by oceanic pressure are subtle and often overlooked, however, they have multiple negative impacts on oceanographic research. These errors can introduce biases in calculating deep-sea heat content, potentially obscuring gradual warming trends in the deep ocean and compromising accurate assessments of ocean heat content and global climate change trajectories (Levitus et al., 2000). Furthermore, without comprehensive studies on the pressure dependency of deep-sea thermometers used in ocean surveys, uncertainty in deep-sea temperature measurements may increase, reducing the quality of input data for global climate models and weakening predictions of sea-level rise and climate change (Chang et al., 2019). The need for on-site calibration in deep-sea environments, or for complex drift corrections during data post-processing, not only adds operational challenges and monitoring costs but also limits the feasibility of sustained, long-term deep-sea observations (Raiteri et al., 2018). The uncertainty evaluation based on CTD data reveals that the indirect measurement of sound velocity heavily relies on input parameters such as temperature, salinity, and hydrostatic pressure. Among these, temperature errors are a critical factor affecting the accuracy of sound velocity calculations. Sensitivity coefficient analysis further indicates that temperature deviations can amplify measurement uncertainty, leading to inaccuracies in the characterization of oceanic processes and introducing bias in marine acoustics, ecological monitoring, and ocean dynamics studies, ultimately compromising the reliability of scientific research and its applications (Grekov et al., 2021). Thus, addressing drift errors in deep-sea thermometers under high-pressure conditions remains a critical challenge in oceanographic research and is vital for improving the accuracy of global climate studies and the reliability of deep-sea ecological monitoring.
This chapter assesses the accuracy of deep-sea thermometers under pressure conditions, based on the proposed pressurized calibration method. Additionally, it utilizes a box model for ocean heat content research to analyze and statistically evaluate the cumulative effects of errors (Kawano et al., 2010). As shown in Figure 10A, the box model divides the Pacific Ocean into multiple vertical layers, each with a thickness of 100 meters. The volume of each layer is determined based on its depth and surface area, allowing for independent calculation of the heat content for each depth layer. This approach ultimately quantifies the negative impact of such errors on the statistical heat content across various depth levels. The heat content of each layer is defined as the product of the layer’s volume , the density of water p, the specific heat capacity c, and the average temperature of the layer, as detailed in Equation 7.
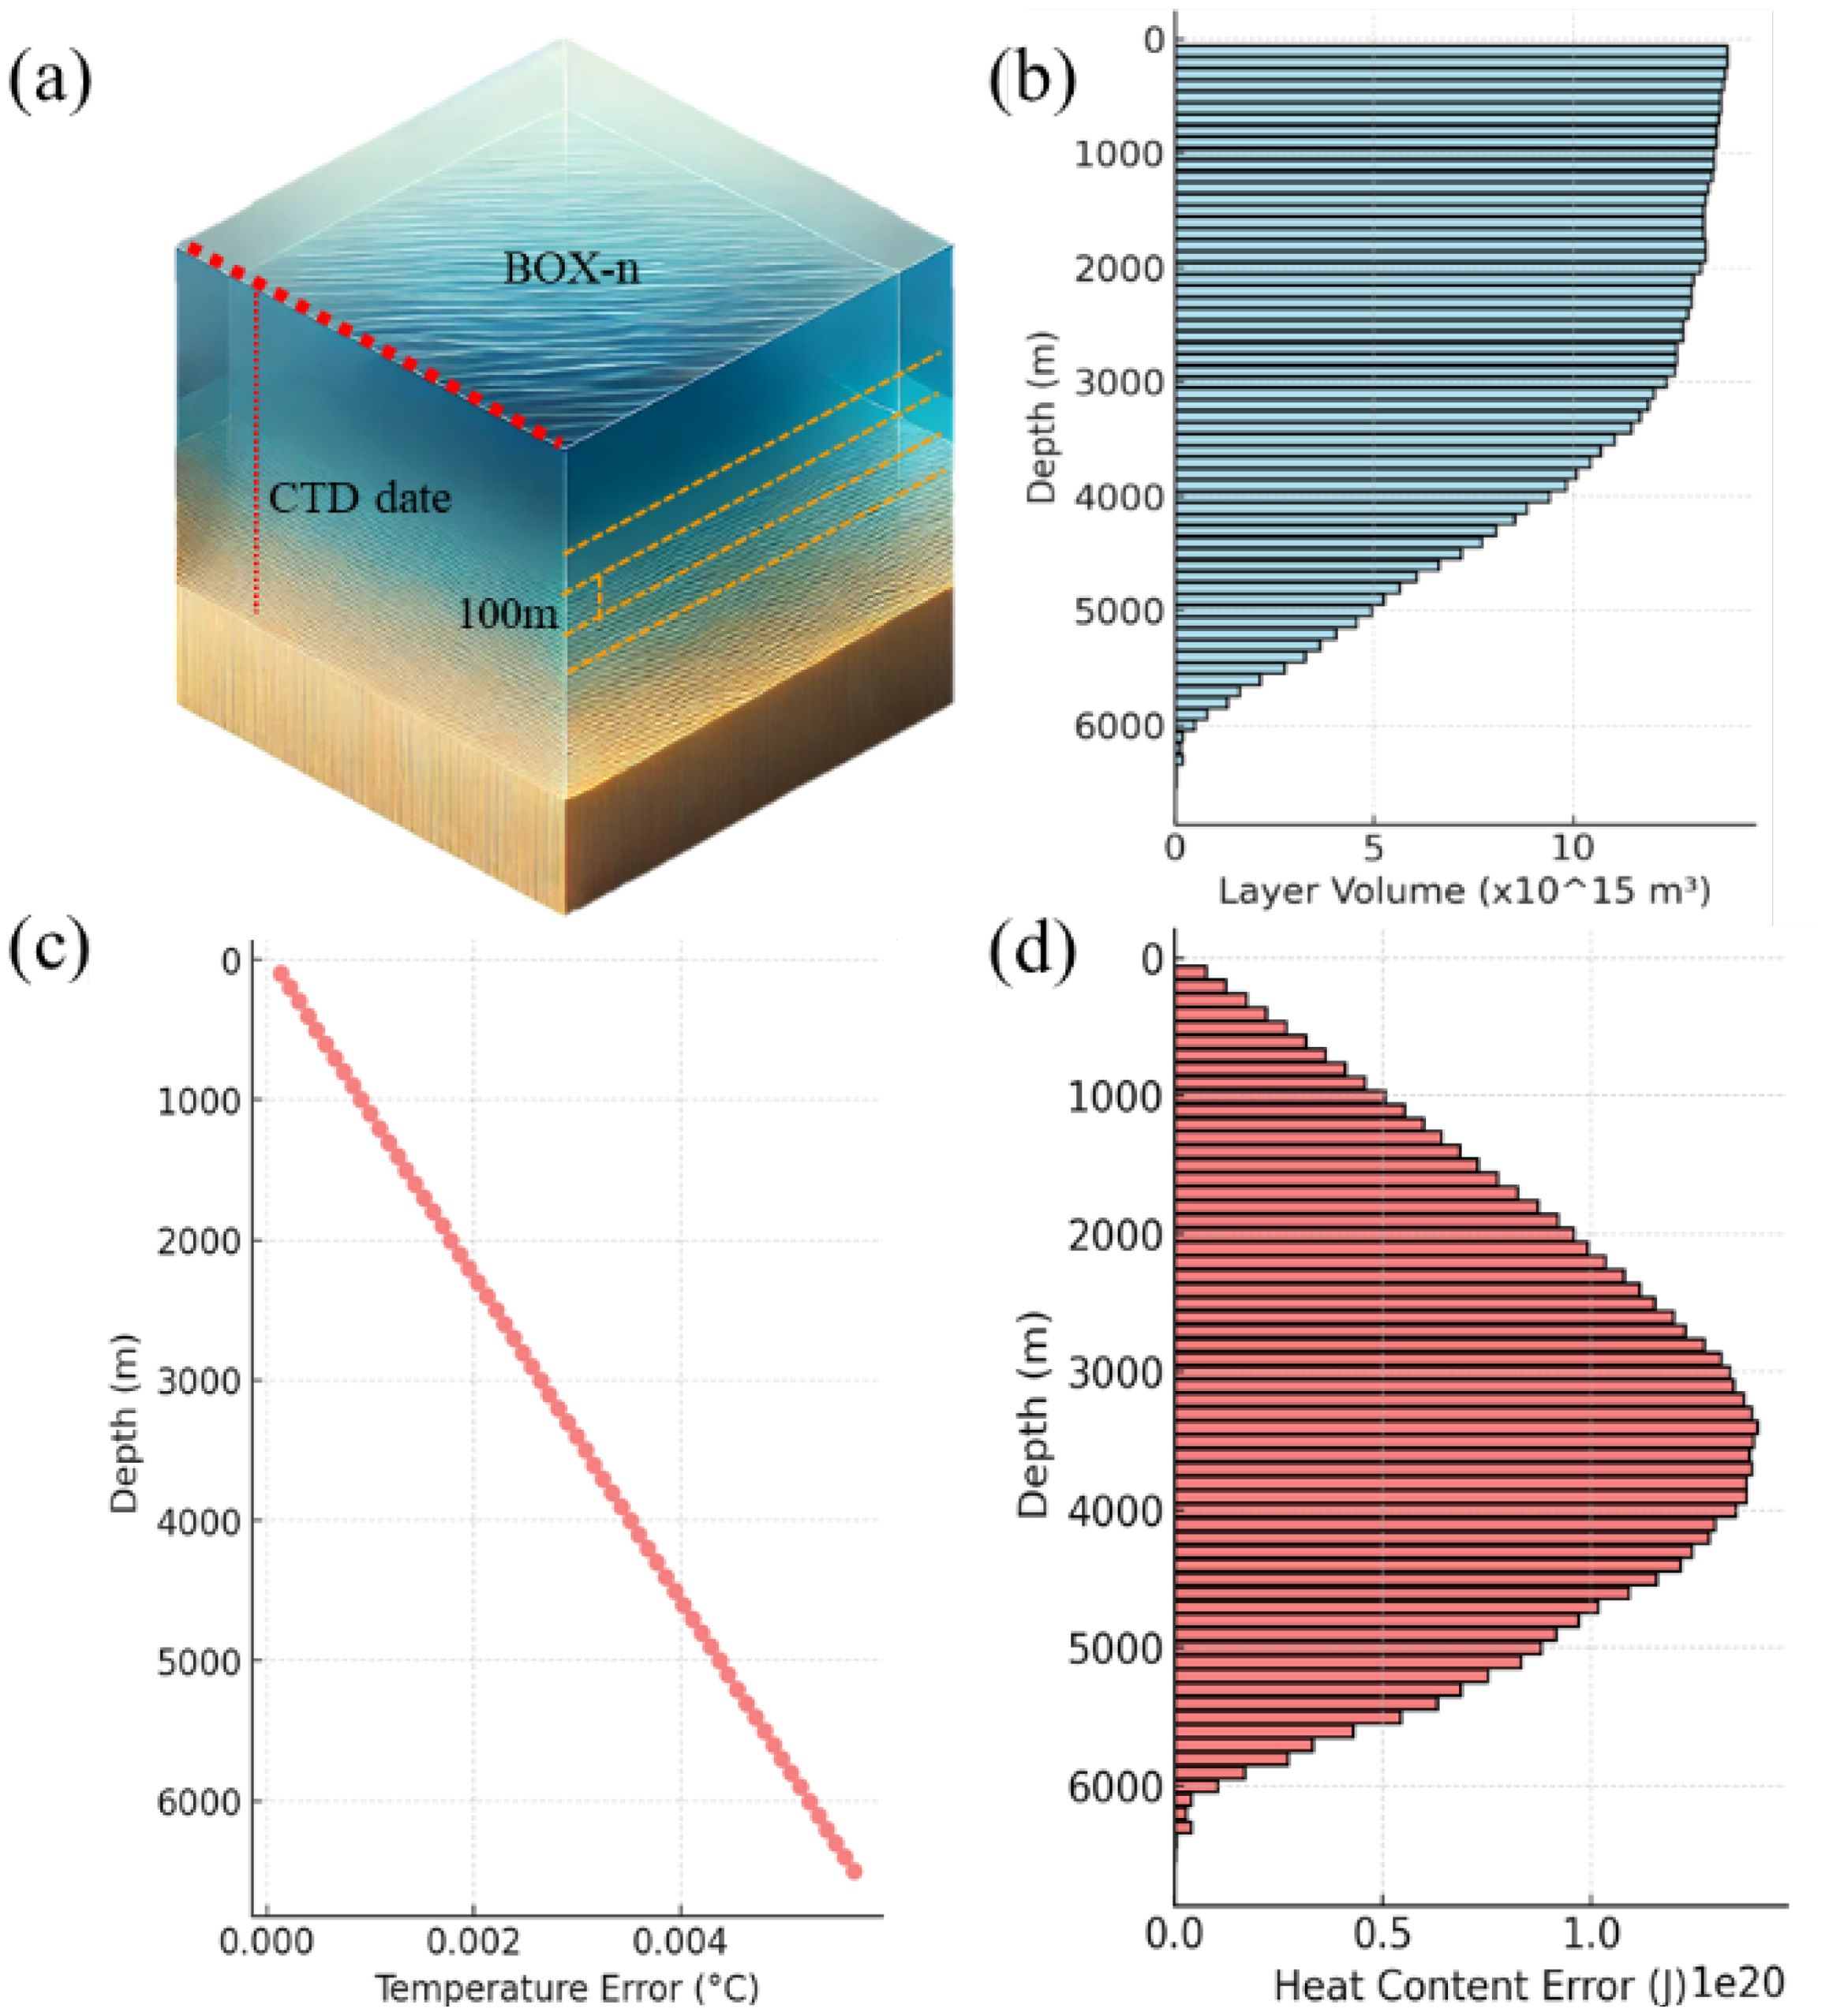
Figure 10. Impact of deep-sea thermometer errors on the assessment of Pacific Ocean heat content. (A) shows a three-dimensional view of the box model, illustrating the ocean divided into multiple vertical layers, each 100 meters thick; (B) depicts the volume of these layers decreasing with depth; (C, D) respectively show the distribution of temperature errors and heat content errors with depth.
Due to drift in thermometers under high pressure in the deep sea, errors in temperature readings occur, significantly affecting the measured values. The average measurement errors for each layer, denoted as , allow for the calculation of the deviation in heat content introduced by these errors for each layer, as shown in Equation 8.
Figure 10B illustrates the overall volume distribution across different depth layers of the Pacific Ocean (Kawano et al., 2010). It can be observed that, with increasing depth, the total volume of each layer gradually decreases. This volume distribution reflects the geometric structure of the Pacific Ocean and serves as the basis for subsequent calculations of heat content errors for each layer. Figure 10C demonstrates that temperature errors SBE3 thermometer with serial number SN 6320 vary with ocean depth. The total heat content error for each layer is calculated as the cumulative error across all depth layers, as presented in Equation 9.
Figure 10D presents the distribution of heat content errors with depth. The heat content error for each layer is calculated based on temperature errors and the volume of each depth layer. It can be observed that the heat content errors are relatively small at shallower depths, as the numerical offsets produced by deep-sea thermometers under low-pressure conditions are minimal. The pressure dependence of deep-sea thermometers does not have the greatest impact on heat content when the reading deviations are at their maximum, but rather has the most significant effect in the depth range of 3000 to 4000 meters. This is attributed to the fact that, although temperature errors at greater depths are larger, the total volume of seawater is much smaller compared to shallower layers. According to the calculations based on Equation 7, the pressure dependence of deep-sea thermometers results in a total heat content difference of 5.18×10²¹, joules for the Pacific Ocean. This value represents approximately one-quarter of the increase in Pacific Ocean heat content reported in previous studies over the past decade (Kawano et al., 2010). Furthermore, this error is equivalent to 8.6 times the amount of heat released from global energy consumption each year (IPCC, 2021).
Although field calibration studies of the Seabird 911 suggest that the pressure dependence phenomenon, once identified, remains relatively stable and does not change over time (Uchida et al., 2015), it is important to note that deep-sea thermometers exhibiting pressure dependence may show consistent reading errors under identical pressure conditions. While this does not affect the statistical evaluation of temperature changes between two cast profiles, it is challenging to ensure that the same SBE3 probe is consistently used throughout oceanographic surveys. The individual variability in pressure dependence among different probes introduces significant uncertainties into long-term assessments of ocean heat content, potentially obscuring or amplifying observed ocean temperature changes over specific periods. Addressing the drift errors of deep-sea thermometers under high-pressure conditions should therefore be a critical priority in oceanographic research. Moreover, the consistency of pressure dependence characteristics in individual instruments under long-term cyclic pressure conditions has yet to be fully verified. Consequently, comprehensive statistical analysis and calibration of the pressure dependence phenomenon in deep-sea thermometers are essential. Such accuracy verification is vital for improving the precision of ocean heat content and carbon sink estimates and is of paramount importance for developing more reliable global climate models.
This study utilized a high-precision ocean temperature-pressure simulation system to conduct an in-depth analysis of the measurement performance of the SBE 3 high-precision deep-sea thermometer under various pressure conditions, with a focus on its temperature reading accuracy from atmospheric pressure up to 1050 bar. Calibration of the test thermometer was performed using a Standard Platinum Resistance Thermometer (SPRT) isolated from pressure effects. The results revealed a significant and repeatable pressure-dependent drift in the SBE 3, with a drift magnitude reaching 10 mK (0.01°C) at 1050 bar, exceeding the manufacturer’s specified accuracy. Compared with the results of previous studies summarized in Table 2, the pressure dependency of this thermometer, identified as serial number 6320, was relatively large. However, it once again confirmed the existence of pressure dependency and demonstrated that significant pressure dependency may not be an isolated phenomenon. Through linear regression analysis, a relationship between temperature drift and pressure was established, and this linear relationship was applied to the SBE 3 for pressure calibration, enhancing its measurement accuracy to within ±0.0005°C under deep-sea high-pressure conditions. This level of precision is critical for research on deep-sea circulation and climate change.
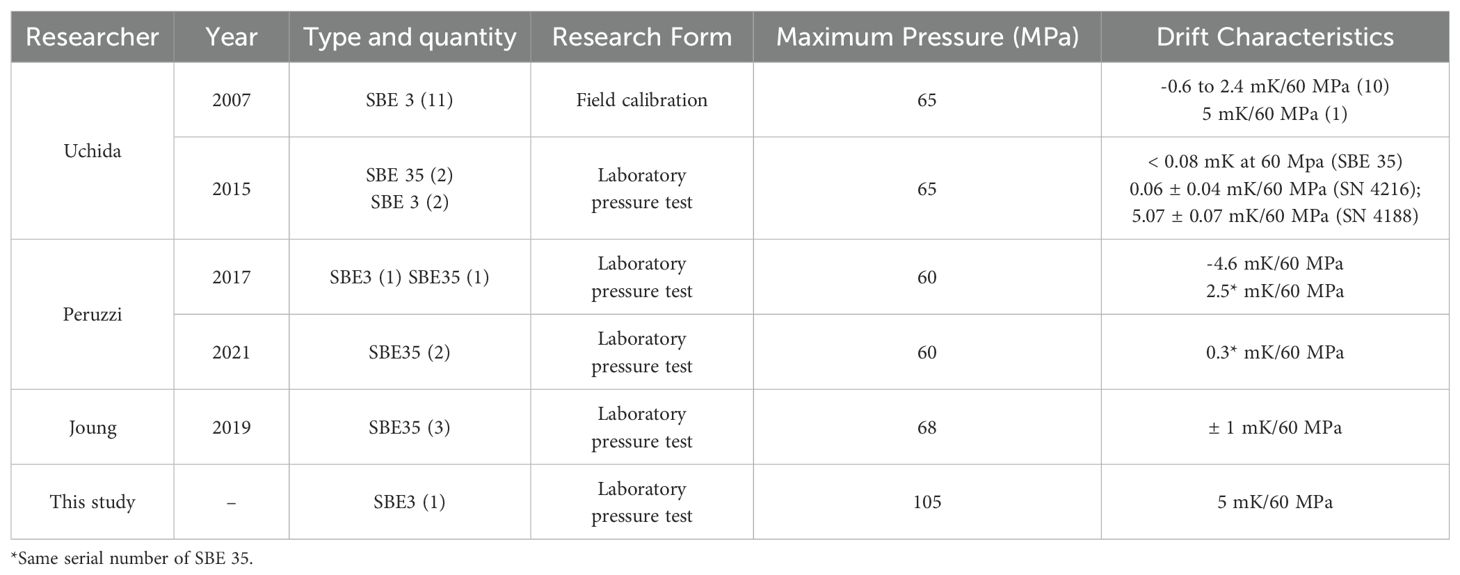
Table 2. Summary of pressure drift characteristics of SBE 3 and SBE 35 from various studies.
Additionally, this study suggests that the pressure dependency of deep-sea thermometers could potentially account for an estimated ocean heat content discrepancy of approximately 5.18×10²¹ joules in the Pacific Ocean, which roughly represents one quarter of the reported increase in the Pacific’s heat content over the past decade. This finding underscores the critical role of high-pressure calibration techniques in accurately assessing global climate change. Importantly, the high-pressure accuracy verification method introduced in this study has revealed subtle but significant pressure-induced drift errors that are often overlooked. This also highlights the importance of establishing a standardized verification process for pressure dependency. Without a detailed characterization of the drift behavior of deep-sea thermometers used in ocean temperature surveys, the widespread and continuous application of thermometers with varying pressure coefficients increases the uncertainty in ocean heat content estimates. This could obscure or exaggerate the true trends of deep-sea temperature changes, thereby degrading the quality of data inputs for climate change models.
In summary, this study provides a reliable method for calibrating deep-sea temperature monitoring instruments under pressure and verifies the calibratability of individual pressure dependency in deep-sea thermometers. By analyzing the drift characteristics of probe SN 6320, the study quantifies the negative impact of subtle pressure-induced drift on ocean heat content calculations, aiming to raise scientific awareness of this issue. This research has the potential to establish new standards for global climate monitoring and deep-sea resource exploration.
Future studies should increase sample sizes to statistically analyze and optimize the pressure-temperature drift relationship in deep-sea thermometers. Additionally, methods such as temperature-pressure cross-verification can be employed to confirm whether the temperature calibration curve of deep-sea probes changes under in situ pressure conditions, ensuring the accuracy of relative ocean temperature variations. Furthermore, investigations should explore whether long-term cyclic pressure exposure leads to fatigue in encapsulation materials, potentially amplifying the pressure dependency of deep-sea thermometers. These efforts are crucial for enhancing the predictive accuracy and reliability of global climate models.
The raw data supporting the conclusions of this article will be provided by the corresponding author upon reasonable request.
MZ: Conceptualization, Formal analysis, Methodology, Writing – original draft, Writing – review & editing. QS: Data curation, Investigation, Validation, Writing – original draft, Writing – review & editing. XB: Investigation, Software, Visualization, Writing – review & editing. CW: Conceptualization, Funding acquisition, Project administration, Resources, Supervision, Writing – review & editing.
The author(s) declare financial support was received for the research, authorship, and/or publication of this article. This project was supported in part by the Southern Marine Science and Engineering Guangdong Laboratory (Guangzhou) (GML2021GD0808).
Author CW was employed by the company Aixsensor Co. Ltd.
The remaining authors declare that the research was conducted in the absence of any commercial or financial relationships that could be construed as a potential conflict of interest.
The author(s) declare that no Generative AI was used in the creation of this manuscript.
All claims expressed in this article are solely those of the authors and do not necessarily represent those of their affiliated organizations, or those of the publisher, the editors and the reviewers. Any product that may be evaluated in this article, or claim that may be made by its manufacturer, is not guaranteed or endorsed by the publisher.
Abraham J. P., Baringer M., Bindoff N. L., Boyer T., Cheng L. J., Church J. A., et al. (2013). A review of global ocean temperature observations: Implications for ocean heat content estimates and climate change. Rev. Geophysics 51, 450–483. doi: 10.1002/rog.20022
Bernal P. (1991). Consequences of global change for oceans: A review. Climatic Change 18, 339–359. doi: 10.1007/BF00139005
BS ISO. 22804 (2023). Marine technology. General technical requirement of marine conductivity-temperature-depth (CTD) measuring instrument (Geneva, Switzerland: British Standards Institution). Available at: https://www.iso.org/standard/73952.html (Accessed January 12, 2025).
Cazenave A., Cozannet G. (2014). Sea level rise and its coastal impacts. Earth’s Future 2, 15–34. doi: 10.1002/2013EF000188
Chang L., Tang H., Wang Q., Sun W. (2019). Global thermosteric sea level change contributed by the deep ocean below 2000 m estimated by Argo and CTD data. Earth Planetary Sci. Lett. 524, 115727. doi: 10.1016/j.epsl.2019.115727
Delgado-Bonal A., Marshak A., Yang Y., Holdaway D. (2020). Analyzing changes in the complexity of climate in the last four decades using MERRA-2 radiation data. Sci. Rep. 10, 922. doi: 10.1038/s41598-020-57917-8
Desbruyères D. G., Purkey S. G., McDonagh E. L., Johnson G. C., King B. A. (2016). Deep and abyssal ocean warming from 35 years of repeat hydrography. Geophysical Res. Lett. 43, 10,356–10,365. doi: 10.1002/2016GL070413
Feistel R., Weinreben S., Wolf H., Marion G. M., Chen C. T. A., Jackett D. R. (2010). Density and absolute salinity of the Baltic Sea 2006–2009. Ocean Science (Berlin, Germany) 6, 3–24. Available at: https://os.copernicus.org/preprints/7/1559/2010/osd-7-1559-2010.pdf (Accessed January 12, 2025).
Garry F. K., Oliver K. I. C., Hall I. R., Baker A. (2019). Model-derived uncertainties in deep ocean temperature trends between 1990 and 2010. J. Geophysical Research: Oceans 124, 1155–1169. doi: 10.1029/2018JC014225
Grekov A. N., Grekov N. A., Sychov E. N. (2021). Estimating quality of indirect measurements of sea water sound velocity by CTD data. Measurement 175, 109073. doi: 10.1016/j.measurement.2021.109073
Intergovernmental Oceanographic Commission. (2015). The International thermodynamic equation of seawater–2010: calculation and use of thermodynamic properties. (Paris, France). Available online at: https://unesdoc.unesco.org/ark:/48223/pf0000233915 (Accessed January 12, 2025).
IPCC. (2021). “Climate change 2021: the physical science basis,” in Contribution of Working Group I to the Sixth Assessment Report of the Intergovernmental Panel on Climate Change (Cambridge, United Kingdom and New York, NY, USA: Cambridge University Press). Available at: https://www.ipcc.ch/report/ar6/wg1/ (Accessed January 12, 2025).
Joung W., Gam K., Pearce J. V. (2020). Pressure dependence of reference deep-ocean thermometers. Meteorological Appl. 27, e1870. doi: 10.1002/met.1870
Kawano T., Doi T., Uchida H., Kouketsu S., Fukasawa M., Kawai Y., et al. (2010). Heat content change in the Pacific Ocean between the 1990s and 2000s. Deep Sea Res. Part II: Topical Stud. Oceanography 57, 1141–1151. doi: 10.1016/j.dsr2.2009.12.003
Khatiwala S., Primeau F., Hall T. (2012). Global ocean storage of anthropogenic carbon. Biogeosciences 9, 1565–1575. doi: 10.5194/bg-10-2169-2013
Levitus S., Antonov J., Boyer T., Stephens C. (2000). Warming of the world ocean. Science 287, 2225–2229. doi: 10.1126/science.287.5461.2225
Lili S., Haiqing Z., Jun W. (2019). Conductivity-temperature-depth measuring Instruments. (Repository of Ocean Best Practices). Available online at: https://repository.oceanbestpractices.org/bitstream/handle/11329/1353/Conductivity-temperature-depth%20Measuring%20Instruments.pdf?sequence=4&isAllowed=y (Accessed January 12, 2025).
Meinen C. S., Perez R. C., Dong S., Piola A. R., Campos E. (2020). Observed ocean bottom temperature variability at four sites in the northwestern Argentine Basin: Evidence of decadal deep/abyssal warming amidst hourly to interannual variability during 2009–2019. Geophysical Res. Lett. 47, e2020GL089093. doi: 10.1029/2020GL089093
Palmer M. D., McNeall D. J., Dunstone N. J. (2011). Importance of the deep ocean for estimating decadal changes in Earth’s radiation balance. Geophysical Res. Lett. 38, L13707. doi: 10.1029/2011GL047835
Peruzzi A., Bosma R., van Geel J., Ober S.. (2021). Metrological evaluation of deep-ocean thermometers. J. Mar. Sci. Eng. 9, 398. doi: 10.3390/jmse9040398
Peruzzi A., Ober S., Bosma R. (2017). Effect of pressure on deep-ocean thermometers. Int. J. Thermophysics 38, 163. doi: 10.1007/s10765-017-2297-4
Raiteri G., Bordone A., Ciuffardi T., Pennecchi F. (2018). Uncertainty evaluation of CTD measurements: A metrological approach to water-column coastal parameters in the Gulf of La Spezia area. Measurement 126, 156–163. doi: 10.1016/j.measurement.2018.05.058
Sea-Bird Electronics, Inc. (2016).Application note 31: Computing temperature & conductivity slope & offset correction coefficients from lab calibration & salinity bottle samples. (Bellevue, WA, USA) Available online at: https://www.seabird.com/asset-get.download.jsa?id=54627861537 (Accessed January 12, 2025).
Smith K. E., Burrows M. T., Hobday A. J., Sen Gupta A., Moore P. J., Thomsen M., et al. (2021). Socioeconomic impacts of marine heatwaves: Global issues and opportunities. Science 372, 977–981. doi: 10.1126/science.abj3593
Smith K. E. L., Smale D. A., Wernberg T., Day M. E., Lemley C., et al. (2022). Biological impacts of marine heatwaves. Annu. Rev. Mar. Sci. 14, 339–367. doi: 10.1146/annurev-marine-032122-121437
Taira K., Yanagimoto D., Kitagawa S. (2005). Deep CTD casts in the challenger deep, mariana trench. J. Oceanography 61, 447–454. doi: 10.1007/s10872-005-0053-z
Uchida H., Nakano T., Tamba J., Widiatmo J. V., Yamazawa K., Ozawa S., et al. (2015). Deep ocean temperature measurement with an uncertainty of 0.7 mK. J. Atmospheric Oceanic Technol. 32, 2199–2210. doi: 10.1175/JTECH-D-15-0013.1
Uchida H., Ohyama K., Ozawa S., Fukasawa M. (2007). In situ calibration of the SeaBird 9plus CTD thermometer. J. Atmospheric Oceanic Technol. 24, 1961–1967. doi: 10.1175/JTECH2093.1
van Haren H. (2023). How and what turbulent are deep Mariana Trench waters? Dynamics Atmospheres Oceans 103, 101372. doi: 10.1016/j.dynatmoce.2023.101372
van Haren H., Berndt C., Klaucke I. (2017). Ocean mixing in deep-sea trenches: New insights from the Challenger Deep, Mariana Trench. Deep Sea Res. Part I: Oceanographic Res. Papers 129, 1–9. doi: 10.1016/J.DSR.2017.09.003
P. J. Wangersky (Ed.) (2000). Marine chemistry Vol. 5 (Weinheim, Germany: Springer Science & Business Media). Available at: https://books.google.com.sg/books?id=h8oM-mMfRwwC&lpg=PP17&ots=m0mnrGN3A5&dq=Marine%20Chemistry%20(Vol.%205).%20Springer%20Science%20%26%20Business%20Media&lr&pg=PP17v=onepage&q=Marine%20Chemistry%20(Vol.%205).%20Springer%20Science%20&%20Business%20Media&f=false.
Keywords: deep-sea thermometric, deep-sea environmental simulation, high-pressure calibration, pressure-dependent drift, ocean heat content
Citation: Zhang M, Sun Q, Bai X and Wu C (2025) Elucidating deep-sea thermometric deviations and their consequences for oceanic heat content assessment via high-pressure calibration. Front. Mar. Sci. 11:1528496. doi: 10.3389/fmars.2024.1528496
Received: 14 November 2024; Accepted: 27 December 2024;
Published: 23 January 2025.
Edited by:
Johannes Karstensen, Helmholtz Association of German Research Centres (HZ), GermanyReviewed by:
Marc Le Menn, Service Hydrographique et Océanographique de la Marine (SHOM), FranceCopyright © 2025 Zhang, Sun, Bai and Wu. This is an open-access article distributed under the terms of the Creative Commons Attribution License (CC BY). The use, distribution or reproduction in other forums is permitted, provided the original author(s) and the copyright owner(s) are credited and that the original publication in this journal is cited, in accordance with accepted academic practice. No use, distribution or reproduction is permitted which does not comply with these terms.
*Correspondence: Chi Wu, cWkud3VAZ21sYWIuYWMuY24=
Disclaimer: All claims expressed in this article are solely those of the authors and do not necessarily represent those of their affiliated organizations, or those of the publisher, the editors and the reviewers. Any product that may be evaluated in this article or claim that may be made by its manufacturer is not guaranteed or endorsed by the publisher.
Research integrity at Frontiers
Learn more about the work of our research integrity team to safeguard the quality of each article we publish.