 Wenlong Xu1
 Shuibo Hu
 Alex Hayward
94% of researchers rate our articles as excellent or good
Learn more about the work of our research integrity team to safeguard the quality of each article we publish.
Find out more
ORIGINAL RESEARCH article
Front. Mar. Sci., 22 January 2025
Sec. Ocean Observation
Volume 11 - 2024 | https://doi.org/10.3389/fmars.2024.1523111
Understanding the variability of bio-optical properties in coastal seas is essential to assessing the impact of natural and anthropogenic activities on the quality of the coastal environments and their resources. This study investigated the vertical distribution of bio-optical properties and their potential driving forces in the Guangdong-Hong Kong-Macao Greater Bay Area (GBA) using a bio-optical dataset collected during the winter dry season. The hydrographic and biogeochemical properties observed across the GBA exhibited significant spatial variability, allowing the classification of the waters into three distinct regions: estuarine diluted water (EDW), Guangdong coastal current water (GCCW), and dense shelf water (DSW). Our findings show that EDW exhibited beam attenuation and optical backscatter coefficients an order of magnitude greater compared to the other two regions, which was attributed to factors such as higher concentrations of suspended particulate matter and organic material from estuarine sources. In contrast, the GCCW was characterized by lower salinity, temperature, and suspended particulate matter and displayed reduced turbidity near the coast, whereas nutrient-rich GCCW waters transported to the mid-shelf region supported increased phytoplankton biomass and a greater abundance of micro-phytoplankton. By exploring the bio-optical characteristics and their underlying processes in the GBA, this study enhances our understanding of the complex dynamics shaping the optical properties of coastal waters in this heavily urbanized region.
Inherent optical properties (IOPs), defined as the light absorption, scattering, backscattering and beam attenuation coefficients (see Table 1 for notations and abbreviations), provide valuable information essential for coastal zone management. For example, absorption and backscattering coefficients are directly linked to a myriad of physical and biogeochemical properties such as light regimes, pigment concentrations, particle size distributions and phytoplankton community composition (Boss et al., 2004, 2009).

Table 1. Notation and abbreviations.
Coastal regions are optically complex due to the impacts of river discharge, freshwater, land, and anthropogenic activities leading to significant variations in their physical and biogeochemical properties (Dai et al., 2008; Gan et al., 2010; Yu and Gan, 2021). As such, collecting in situ bio-optical coastal samples in coastal areas is crucial for accurately assessing seawater from space via optical remote sensing and for parameterizing biogeochemical models (D’Sa et al., 2006; Astoreca et al., 2012).
As one of the world’s four major urban agglomerations, the Guangdong–Hong Kong–Macao Greater Bay Area (GBA) is a region with exceptionally strong economic activity and thus has rapidly developed within China. The coastal area of the GBA covers the Pearl River Estuary (PRE) and its adjacent waters, forming a diverse coastal ecosystem with abundant habitats and rich biodiversity (Zhang et al., 2022). The Pearl River, China’s third longest river, has a drainage area of 450,000 km2 and lies within a subtropical climate zone with an average annual rainfall of 1,470 mm (Dai et al., 2008). The total discharge of the Pearl River is approximately 20,000 m3 s−1 in the summer and approximately 4,000 m3 s−1 in the winter. The depth of the PRE and its adjacent waters varied from 0–50 m (Figure 1C). In this region, multiple forcing mechanisms including bottom topography, freshwater discharge, wind, tides and coastal currents, operate in unison to control regional hydrodynamics and biogeochemistry (Wong et al., 2003). Given the complexity of the PRE, its physical-biogeochemical coupling and the economic importance of its location, the PRE and its adjacent regions have been among the most studied oceanographic regions (Dai et al., 2008; Wang et al., 2010; Shang et al., 2014; Liu et al., 2015).
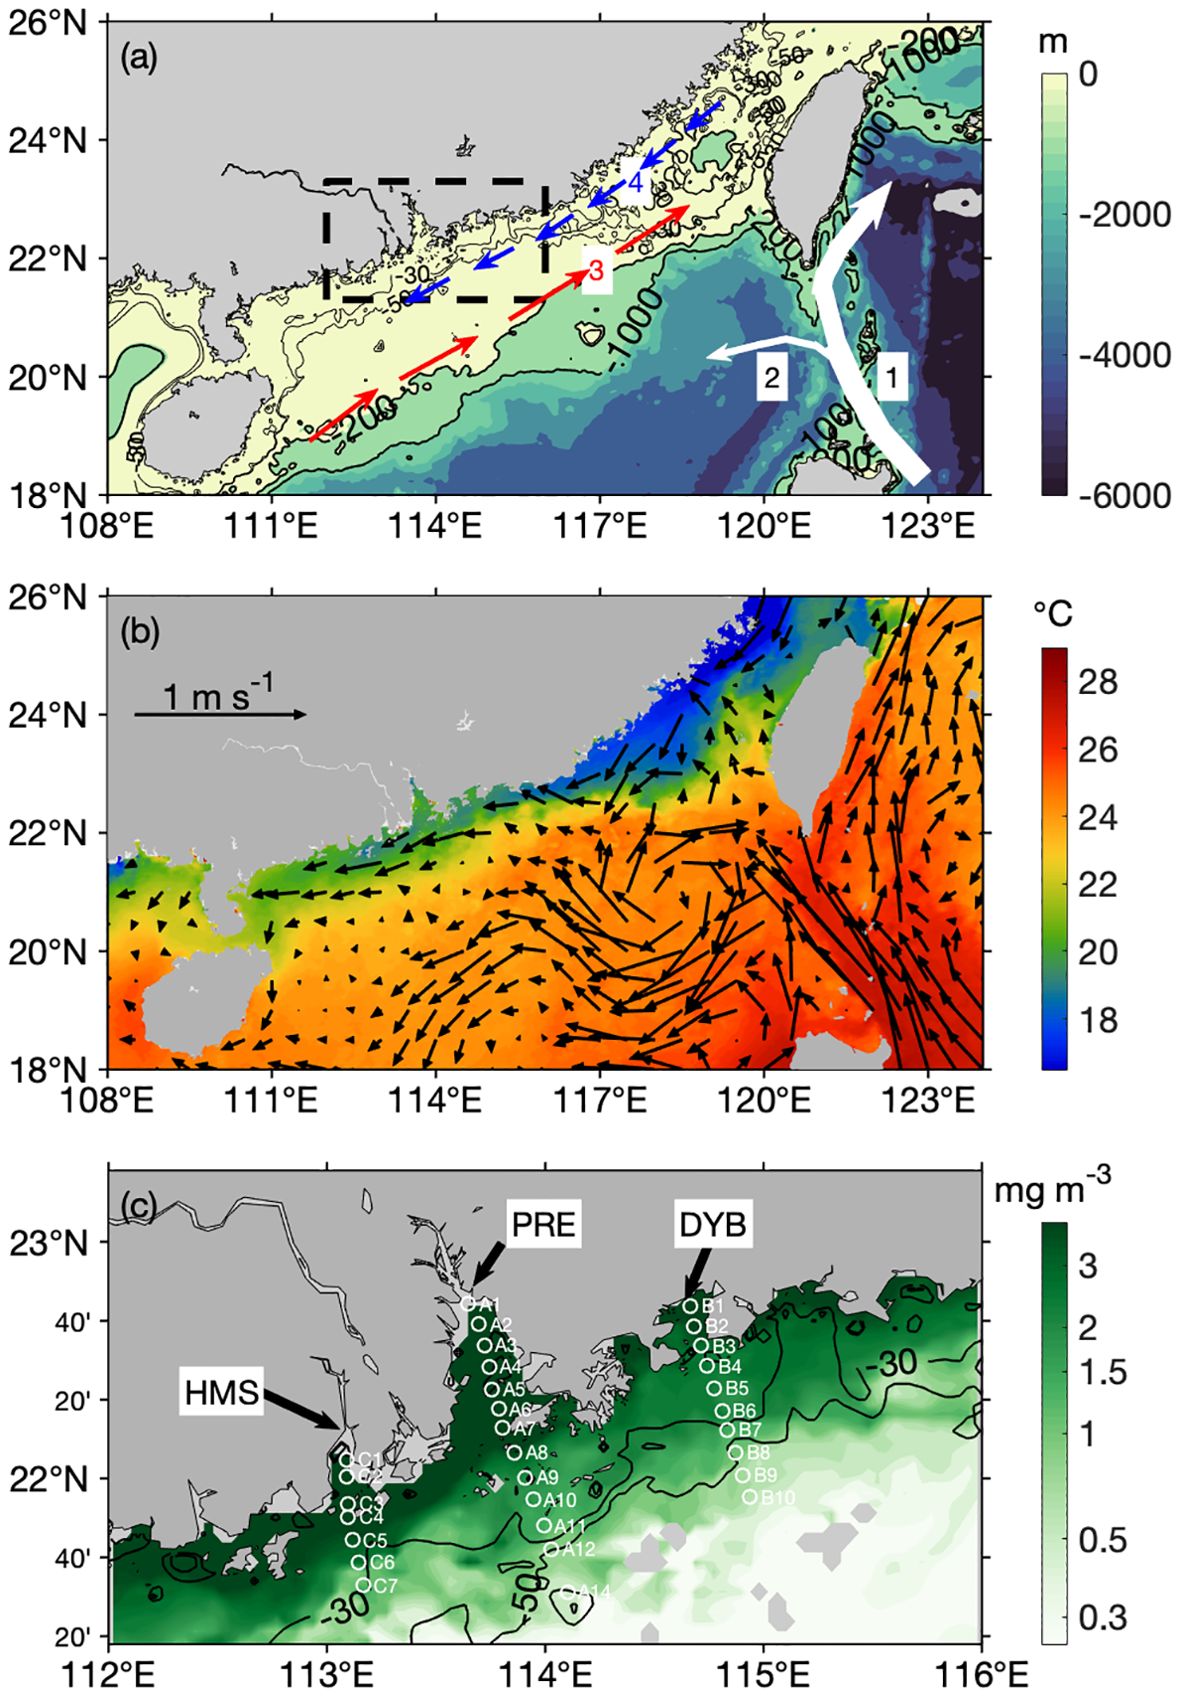
Figure 1. (A) Topography of the northeastern South China Sea (SCS) and schematics for the surface circulation (arrows) in the SCS adapted from Fang et al. (1998). The black isobaths represent depths of 200 and 1000 m. Numbers 1–4: current numbers; 1 Kuroshio Current; 2 Branch of the Kuroshio Current in the SCS; 3 SCS warm current; 4 Guangdong coastal current. The sampling area is shown in the black box. (B) MODIS-Aqua 4 km monthly mean sea surface temperature (color) and OSCAR monthly mean surface current (arrow) in January 2020. (C) Locations of the sampling stations for the bio-optical measurements considered in this study. The background color represents MODIS-Aqua 4 km monthly mean chlorophyll a concentration in January 2020. The black lines represent the 30 and 50 m isobath contours. PRE, Pearl River Estuary; DYB, Daya Bay; HMS, Huangmao Sea.
Many studies of the PRE have focused on its hydrographic features (Xue and Chai, 2002; Liu et al., 2019), including changes in the distribution of surface sediments (Wei et al., 2021). However, in the last decade, research has focused on biogeochemical attributes such as chlorophyll a concentrations (Chl) (Shang et al., 2014), particulate organic carbon (Liu et al., 2015), the spatial distribution and maintenance of summer hypoxia (Cui et al., 2019; Yu and Gan, 2021), and the characteristics of bio-optical properties (Wang et al., 2010). These studies have led to the development of bio-optical algorithms (Liu et al., 2015) and built upon known physical biogeochemical coupling processes (Harrison et al., 2008). Previous studies mainly focused on surface bio-optical properties during the summer, assessing variations in spectral absorption and particulate organic carbon (Cao et al., 2003; Wang et al., 2010). However, there is limited research on the vertical distribution characteristics of bio-optical properties and their response to the Guangdong coastal current (GCC) during the winter in the PRE.
In this study, we present a comprehensive bio-optical dataset collected during a multidisciplinary cruise conducted in January 2020, encompassing a significant portion of the PRE coastal waters. Our study aims to achieve two primary objectives. First, we seek to understand the spatial variability in optical properties and biogeochemical parameters observed within these waters. By examining the distribution patterns of these variables, we can further understand the complex dynamics and processes shaping coastal ecosystems. Second, we aimed to investigate the specific influence of the GCC on bio-optical properties within the PRE waters.
By assessing the impact of the GCC on optical and biogeochemical characteristics, we can better understand the role of these strong coastal currents in shaping the bio-optical dynamics and ecological functioning of the PRE. Through our comprehensive analysis, we aim to contribute to a deeper understanding of the intricate relationships between physical processes, bio-optical properties, and the biogeochemical functioning of coastal waters in the PRE region.
The data presented in this paper comprise 30 stations sampled over a total of 5 days (January 8–12, 2020) in three geographically distinct areas of the PRE and adjacent sea (21–23°N and 113–115°E). Including the Huangmao sea (HMS) subregion, which is located on the west side of PRE and the Daya bay transect (DYB), which is located on the easternmost transect, are located away from the mouth of the PRE. The first transect is located at the PRE. The other two transects are nearshore environments on the west/east side of the PRE, respectively.
All three transects used the same sampling strategy by collecting water samples from a CTD Rosette with Niskin bottles and deploying optical instruments at each station.
The mean circulation over the PRE and the adjacent continental shelf is dynamic and heavily influenced by winds, tides, and buoyant effects of river discharge. Tidal forces, primarily semidiurnal (M2) and diurnal (K1) forces, dominate the region and reach a magnitude of approximately 1.0 m within the PRE, as outlined by Zu and Gan (2015). In terms of broader seasonal circulation patterns around the northern shelf of the South China Sea (SCS), previous studies have provided a clear understanding of the effects of monsoonal winds (Fang et al., 1998; Xue and Chai, 2002; Wong et al., 2003; Gan et al., 2009a) (Figure 1A). During the summer months, the East Asian summer monsoon drives a north-eastward coastal current along the PRE coast. Conversely, in winter, when the northeasterly monsoon takes effect, the surface currents shift, flowing southwestward across the continental shelf (illustrated in Figure 1B). The surface temperatures and currents during these periods have been investigated, with particular attention given to the northern SCS.
Water samples were collected at discrete depths (0, 5, 10 and 20 m) via a CTD rosette multi-bottle array system. Water samples of approximately 0.5–1 L were filtered using a 0.7–μm glass fiber filter (Whatman GF/F), and filters were immediately stored in liquid nitrogen. Then those water samples were analyzed for: (1) Chl and selected pigments via High Performance Liquid Chromatography (HPLC), (2) particulate organic carbon (POC) via an elemental analyzer (Flash EA-Delta V), and (3) suspended particulate matter (SPM) that is determined gravimetrically following the protocol of Tilstone et al. (2002), based on van der Linde (1998) and Neukermans et al. (2012). (4) Dissolved organic carbon (DOC) via an OI700 Analytical total organic carbon analyzer by wet-oxidation. (5) Water samples for nutrient analysis were filtered through GF/F filters onboard and frozen immediately at − 20°C until analyzed. After thawing at room temperature in the laboratory, they were analyzed by an AA3 nutrient auto-analyzer using colorimetric methods (Knap et al., 1996) with detection limits of 0.02 and 0.02 μmol L−1 for nitrate plus nitrite and soluble reactive phosphate, respectively.
Immediately after CTD casts optical profiles of the water column were obtained via spectral optical sensors (WET Labs ac-s absorption-attenuation meter, ECO BB9 backscattering meter and Sequoia LISST–100X type C, hereafter referred to as ac-s, BB9 and LISST).
A 10–cm path length ac-s was used for the acquisition of in situ profiles of the total absorption and attenuation coefficients. The ac-s was cleaned and calibrated in the laboratory following the ac-s User’s Guide before and after each campaign. The absorption and attenuation signals were corrected for temperature and salinity effects according to Pegau et al. (1997). Correction for incomplete recovery of the scattered light in the absorption tube of the ac-s was performed via the proportional method described by Zaneveld et al. (1994). BB9 was coupled with the ac-s in situ measurements of the total backscattering coefficient [bp(λ)] at seven wavelengths (412, 440, 488, 530, 595, 695, and 714 nm), as were the CDOM and chlorophyll fluorescence.
All particle size distribution (PSD) measurements were performed in this study using a LISST—a commercially available instrument that measures the light scattering of a particle suspension at small forward angles and uses this information to estimate the PSD (Agrawal and Pottsmith, 2000). The particle volume concentrations in the 36 size bins (with a size range of 2.5–500 μm) were processed via the LISST-SOPv5.1 software program provided by the manufacturer. The total volume concentration (VC), total cross-sectional area concentration (AC), mean particle size (DA), median particle diameter of the volume distribution () and slope of the PSD (ξ) were subsequently calculated. The specific calculation process for the LISST measurements can be found in Wang et al. (2016).
Chl fluorescence measured by WET Labs ECO BB9 was further validated on the basis of paired HPLC Chl (ChlHPLC) measurements and fluorescence (ChlFluo) match-ups. The point-by-point comparisons for paired observations revealed little noise in the data distribution, except for a few points in low-value regions (Figure 2A). To reduce the uncertainty of ChlFluo, it was calibrated against the ChlHPLC data.

Figure 2. (A) Regression between factory-calibrated in vivo Chl fluorescence from WET Labs ECO BB9 (ChlFluo) and paired HPLC total Chl (ChlHPLC) samples for the regions described in Figure 1. The dashed line represents the 1:1 line and the black line represents the best fit line. (B) Particulate organic carbon concentration as a function of the beam attenuation coefficient, cp(660). The solid line is the best power function fit to the data. The Loisel and Morel (1998) line represents their regression on the basis of data from the upper homogeneous layer in the North Atlantic and Pacific near Hawaii. The Stramska and Stramski (2005) line is from in surface waters of the north polar Atlantic Ocean. The corresponding equation, the values of R2 and N are also shown.
Beam attenuation coefficients are important internal optical properties of seawater and are widely used to explore the characteristics of particulate matter, e.g., the particulate organic carbon (Stramska and Stramski, 2005). Here we investigated the relationship between the cp(660) and POC, which suggested that the cp(660) can be used to quantitatively estimate the POC in the GBA dry season (Figure 2B). Using the empirical relationships developed in this study, we characterized the vertical distribution of POC in the GBA on the basis of in situ cp(660) measurements.
Satellite products were used to analyze the spatial and temporal variability in the physical and dynamic characteristics of the northern SCS. Ocean Surface Current Analyses Real-time (OSCAR) provides global surface current products directly calculated from satellite fields, including sea surface height, wind, and sea surface temperature (SST) (Bonjean and Lagerloef, 2002). The datasets are available at 5–day intervals, at 1/4°×1/4° spatial resolution and are obtained from the National Oceanic and Atmospheric Administration (NOAA) site (www.oscar.noaa.gov). Daily 4 km Chl and SST composites were calculated from MODIS/Aqua Level 1 granules downloaded from the National Aeronautics Space Administration (NASA) Ocean Color website (https://oceancolor.gsfc.nasa.gov). Coincident daily MODIS Chl and SST data (level 2) at the original resolution (approximately 1 km) were also obtained from the same NASA group.
We conducted hydrographic surveys along three cross-shelf transects in the PRE and adjacent seas to investigate the distribution of hydrographic properties (Figures 1C, 3). During the winter, the seawater in the GBA experienced vertical mixing and horizontal stratification. This phenomenon was attributed primarily to the low river discharge and the vigorous stirring and mixing induced by strong northeasterly winds. Three cross-shelf transects were all shown a pronounced horizontal density gradient (Figures 3G–I).
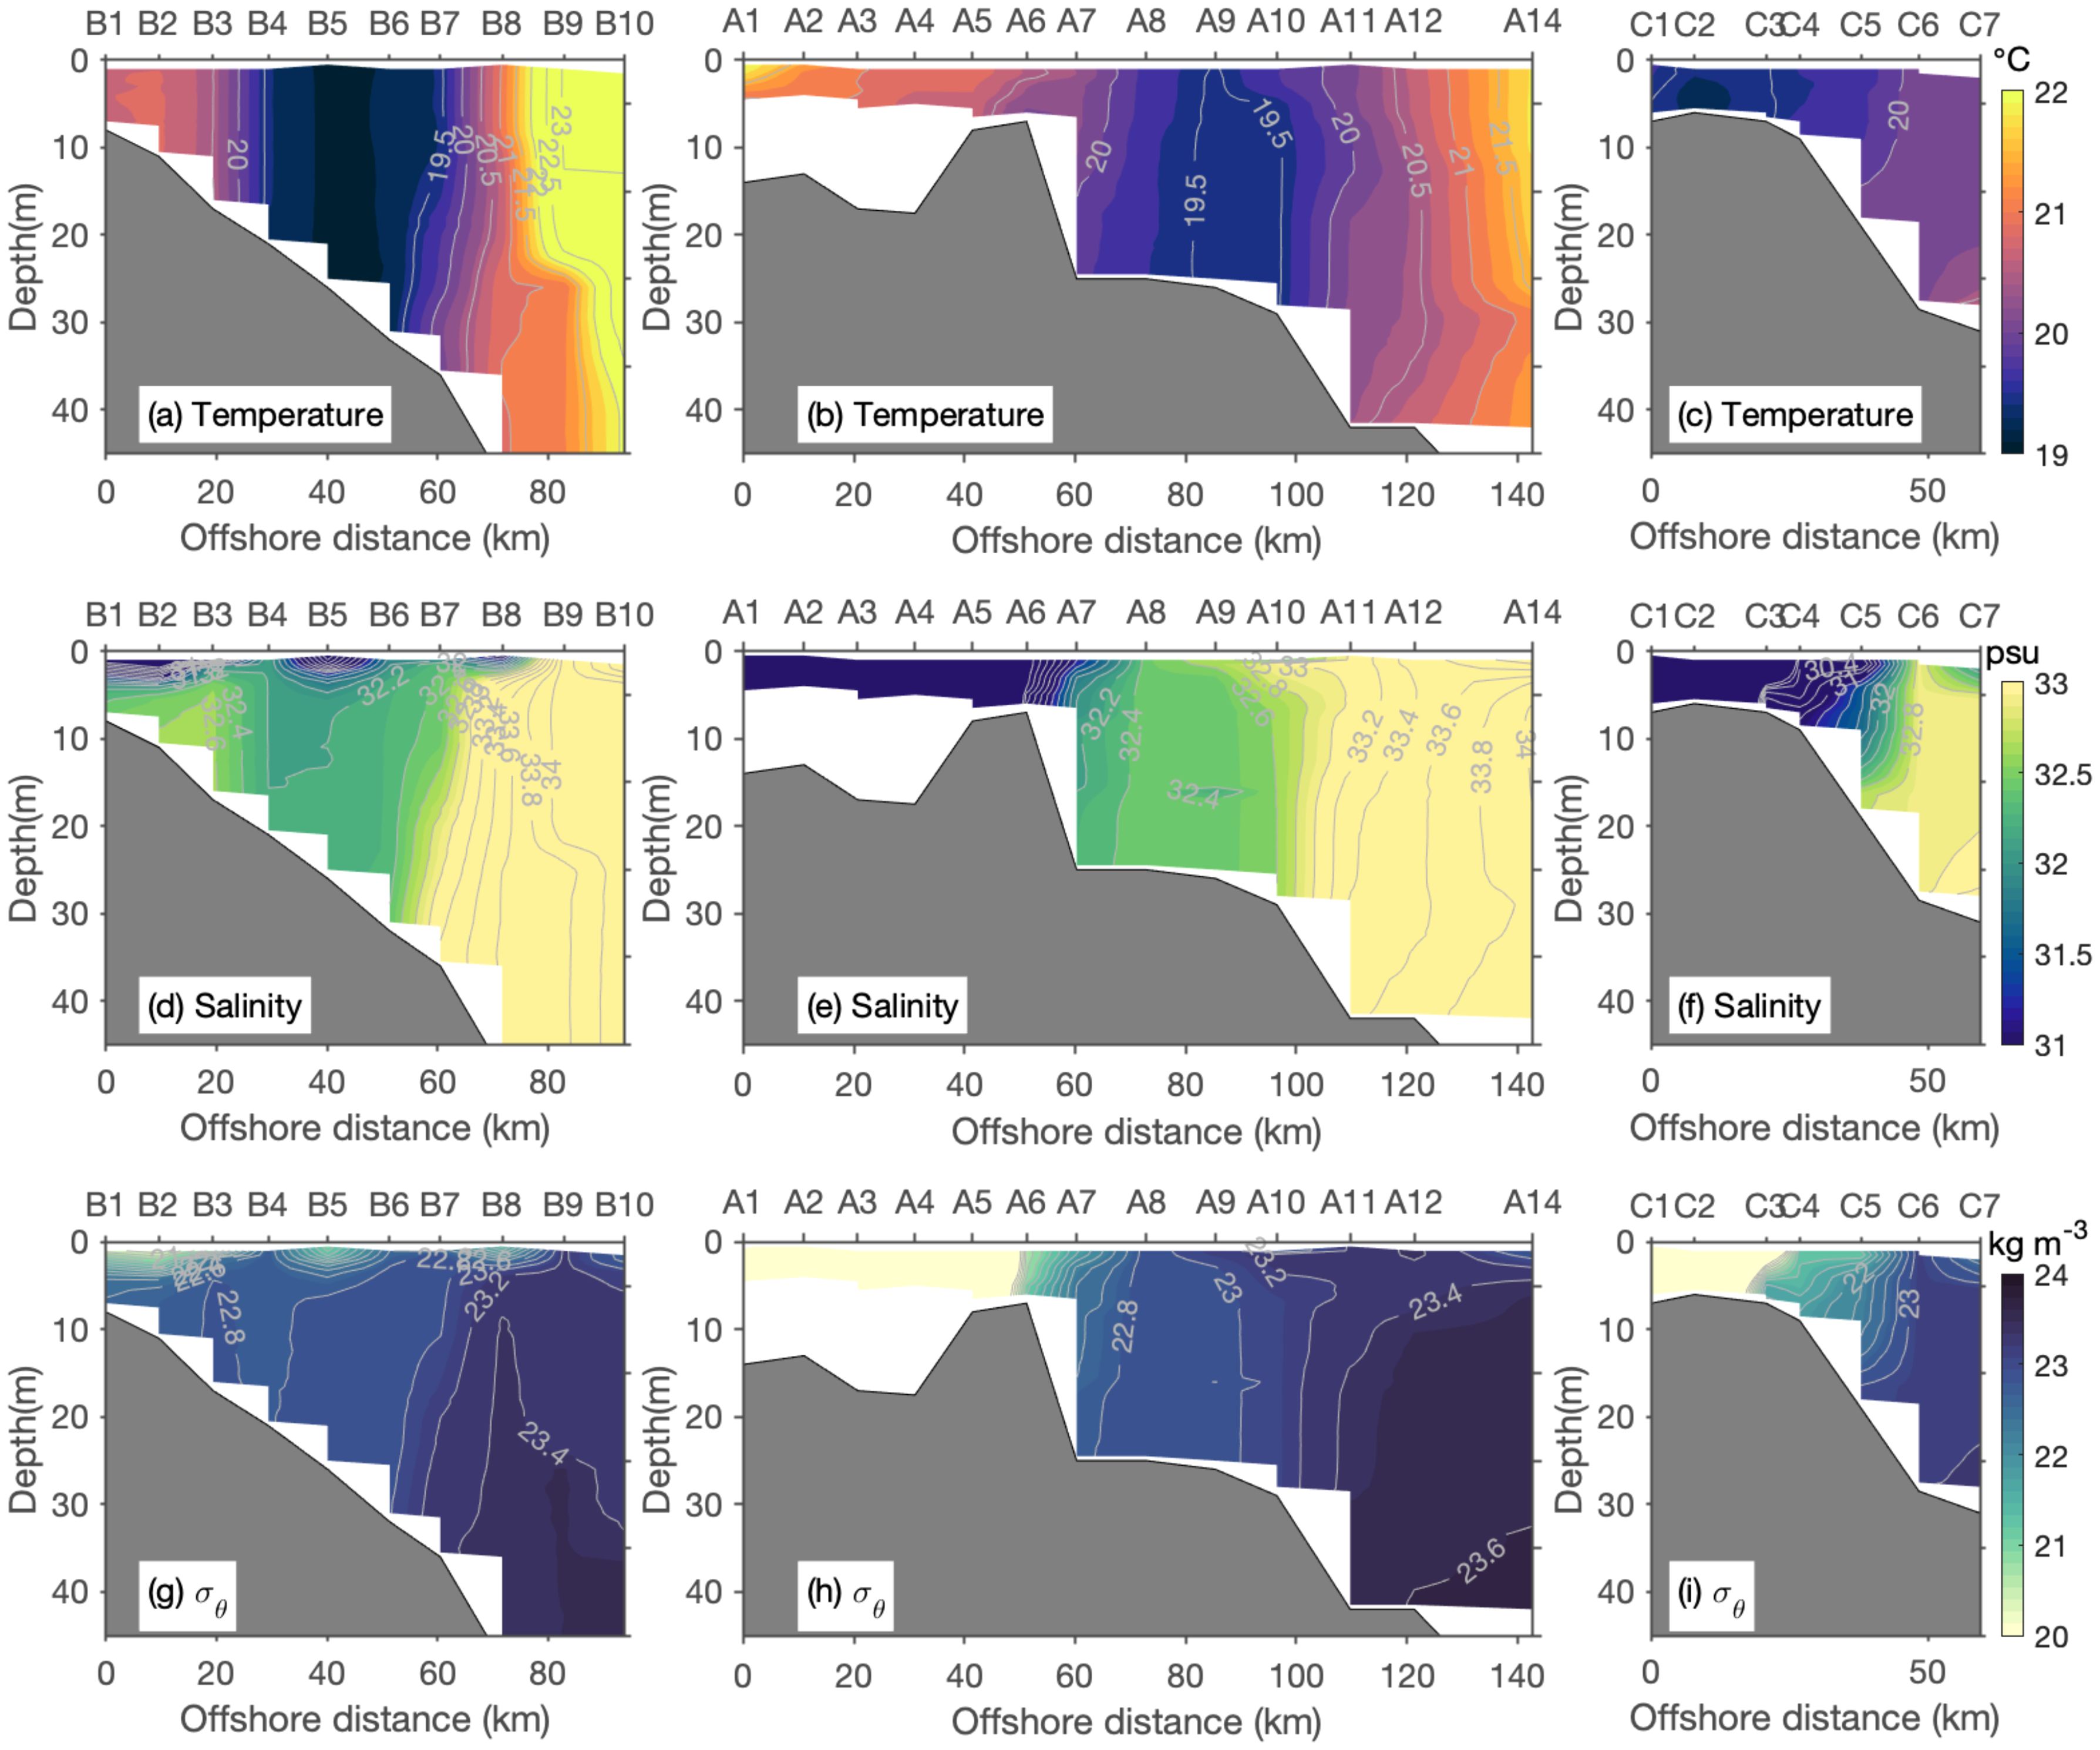
Figure 3. Three cross-shelf transects [left panel (DYB), middle panel (PRE) and right panel (HMS)] against distance. Vertical sections of temperature (A–C), salinity (D–F) and sigma density (G–I) in the upper 45 m. The gray shading color represents topography.
The hydrographic vertical section of the DYB was shown considerable mixing from the surface to the bottom with temperature values varying between 19 and 22°C and salinity values fluctuating between 31 and 33 psu (Figures 3A, D). Notably, a very narrow flow band was found between 20 and 60 km offshore of the DYB, characterized by significantly lower temperatures (19 ± 0.2°C) and maximum Chl and POC (0.5 mg m−3 Chl and POC values of approximately 100 mg m−3, respectively). The temperatures greatly increased offshore (to ~23°C), which was accompanied by a rapid decline in the Chl to ~0.1 mg m−3. This distinct temperature and Chl front were also evident in the MODIS/Aqua L2 Chl and SST products on January 8, 2020 (Supplementary Figure S1). The front consistently separated nearshore waters with lower temperatures (~19°C) and higher Chl (~0.5 mg m−3) from offshore waters with higher temperatures (~23°C) and lower Chl (~0.1 mg m−3) levels.
In the PRE section, the distribution of horizontal salinity gradients also trended positively offshore is largely due to the influence of freshwater runoff occurring near the coast, with salinity ranging from 5–32 psu. Moreover, the concentration gradients of key biogeochemical parameters, namely, Chl, POC, and CODM, consistently were greater near shore. Specifically, the concentrations of Chl, POC, and CODM were greater near the coast and gradually decreased as we moved offshore (Figures 4B, E, H).
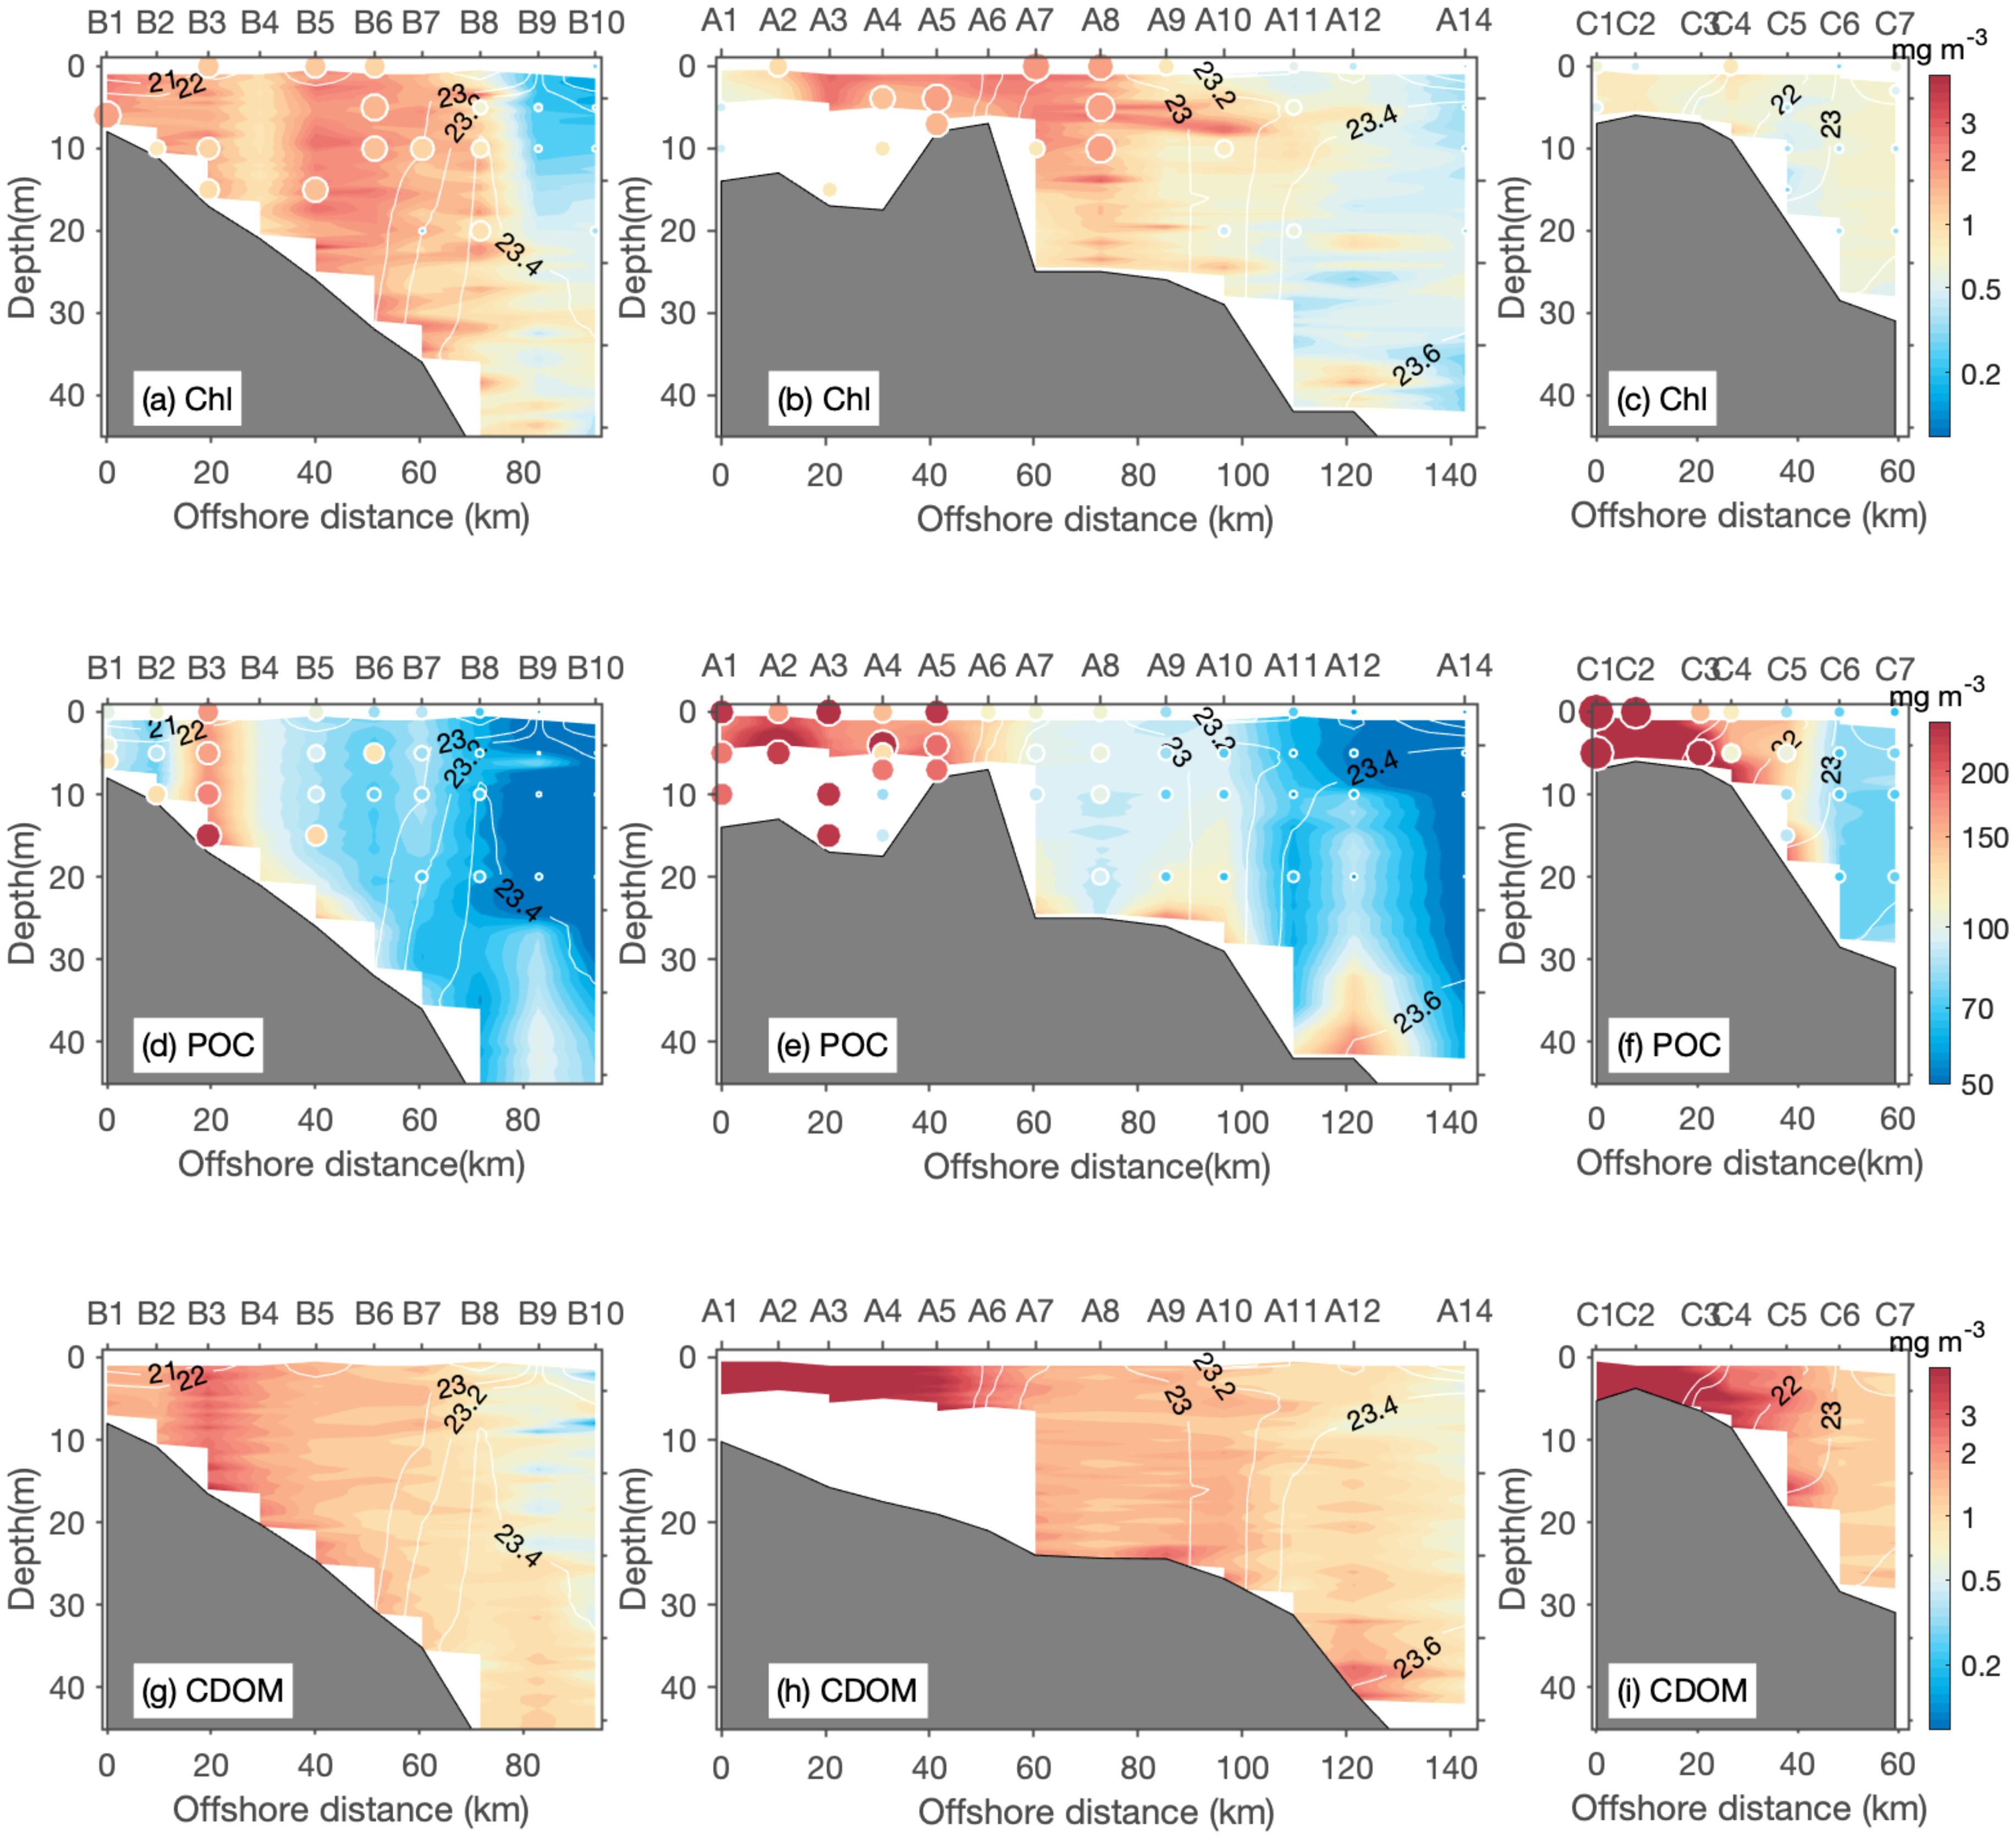
Figure 4. Three cross-slope transects [left panel (DYB), middle panel (PRE) and right panel (HMS)] against distance. Vertical sections of Chl (A–C), POC (D–F) and CDOM (G–I) in the upper 45 m. Both the color and size of the circles in each panel represent water sample measurements. The thick white lines in each panel indicate the isopycnal. The gray shading color represents topography.
The horizontal density gradient observed along the HMS transect was driven primarily by variations in salinity (Figures 3F, I), whereas the temperature exhibited a uniform mixing pattern in the horizontal direction (Figure 3C). The salinity gradient was strongly influenced by freshwater runoff near the coast. Moving offshore, there was a gradual decrease in the concentration of both Chl and CDOM, in contrast to the trend in the PRE. The changes in POC demonstrated a similar trend to those in Chl and CDOM (Figures 4C, F, I).
Three distinct water masses were identified on the basis of their temperature and salinity characteristics. The temperature versus salinity (T–S) diagrams, derived from field measurements, revealed temperature values ranging from 19 to 23°C and salinity values ranging from 7 to 33.5 psu in the PRE and adjacent seas. T–S diagrams provided valuable insights into the characteristics of three end-member water masses (Figure 5): estuarine diluted water masses (EDW), water masses influenced by the GCC (GCCW), and dense shelf water masses (DSW).
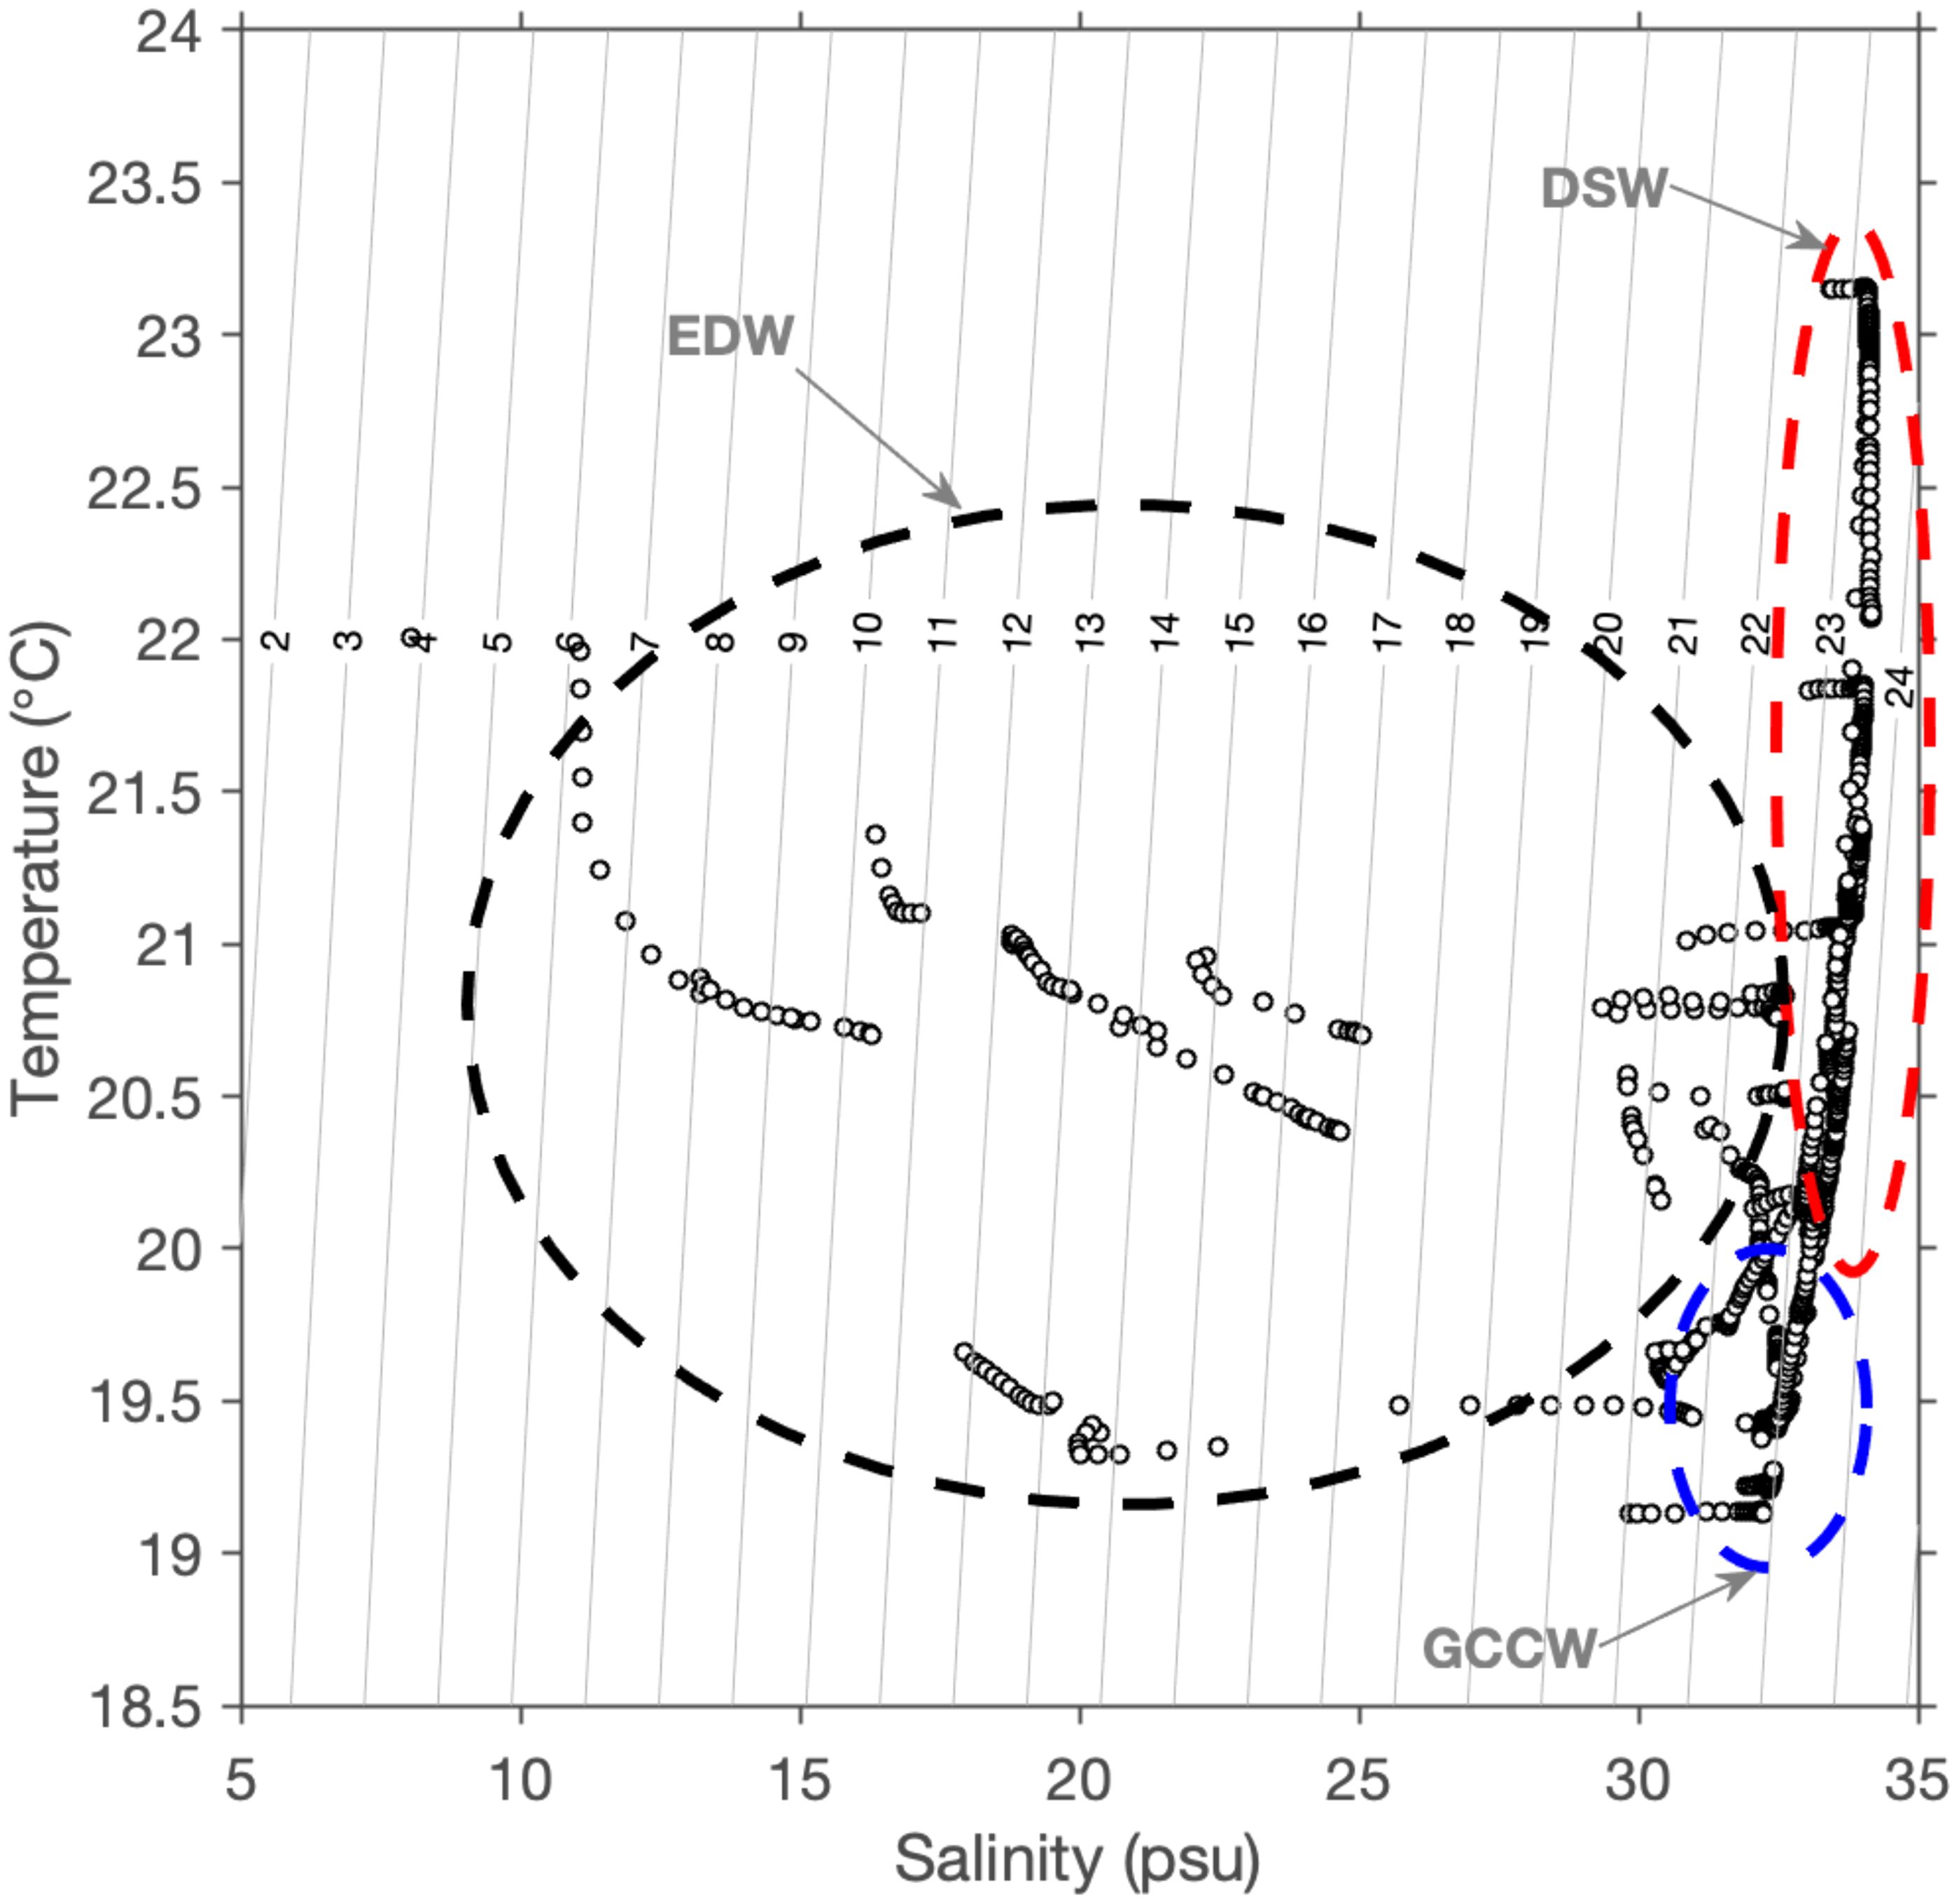
Figure 5. A temperature-salinity diagram indicating distinct water masses in the Pearl River Estuary and adjacent shelf sea. EDW, Estuarine diluted water; GCCW, Guangdong coastal current water; DSW, dense shelf water.
The EDW represented a mixture of the three end-member water masses, exhibiting a broad range of salinity values spanning from 10 to 30 psu. On the other hand, the GCCW was characterized by cold temperatures, with an average temperature of only 19.45°C. The DSW stands out due to its relatively high temperature and salinity, with average values of 21.14°C and 33.54 psu, respectively.
In three stations biogeochemical signatures were particularly pronounced, including station A3, closest to the PRE, station B7, a mid-shelf station and station A14, an offshore station. The lower salinity surface plume waters of station A3 had elevated concentrations of Chl and CDOM, with Chl of approximately 3 mg m−3 (Figure 6A). Conversely, the weakly stratified offshore station (A14) had Chl of less than 0.4 mg m−3. Notably, the lower salinity site (A3) presented higher Chl and CDOM at the surface, resulting in significant attenuation of the light field (Figures 6A, C). This attenuation may have implications for primary production, potentially restricting it to near-surface waters.
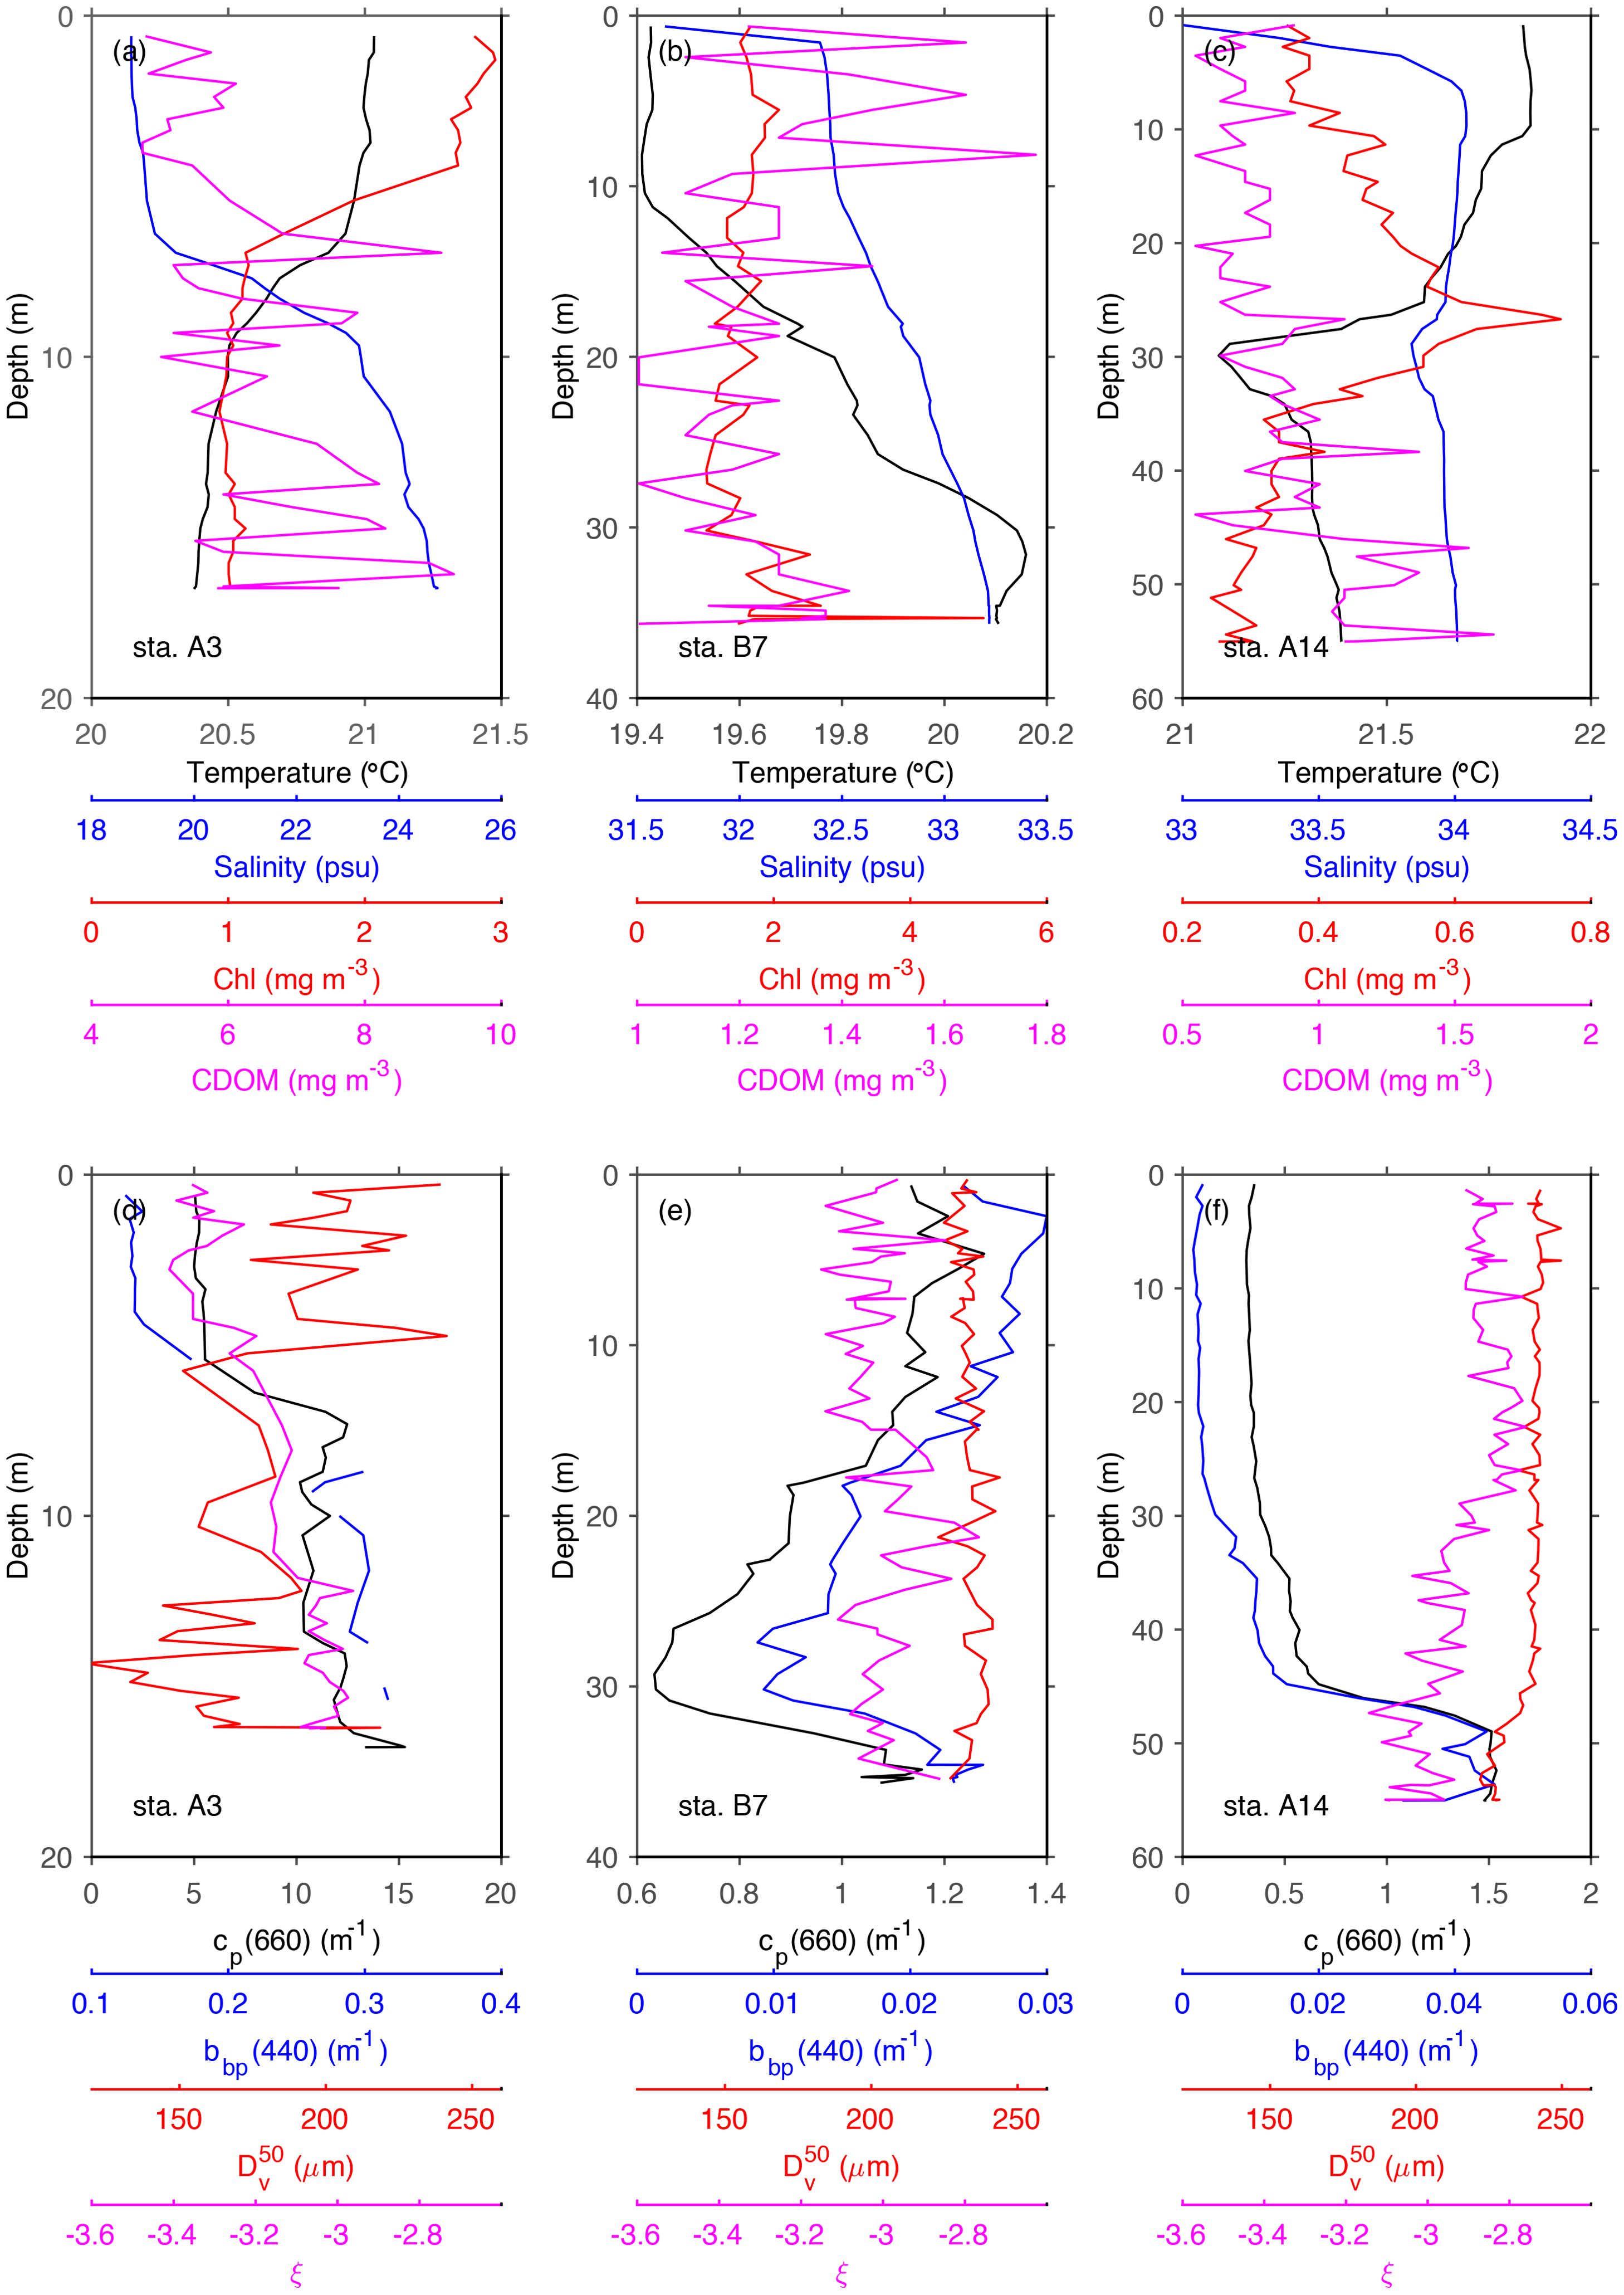
Figure 6. Example vertical distributions of physical (upper panel) and bio-optical properties (bottom panel) for samples representing three distinct water masses, including EDW (A, D), GCCW (B, E) and DSW (C, F). Note that both the x-axis and the y-axis have different scales.
At the mid-shelf station (B7), relatively high and vertically uniform Chl were observed (Figure 6B). The surface layer at this station had a low water temperature of 19.4°C. Similarly, the weakly stratified surface layer at station A14 (Figure 6C) presented a low surface Chl of approximately 0.3 mg m−3. However, as depth increased, the Chl gradually increased, peaking at approximately 0.9 mg m−3 at a depth of 30 m.
The vertical profiles of the total attenuation coefficients, particulate backscattering coefficient median particle diameter and particle size distribution (PSD) slopes ( and ξ) (Figures 6D–F) at the same three representative stations revealed strong horizontal and vertical variability. These high values of attenuation and backscattering were all associated with lower-salinity waters. At the stations near the PRE (A3), and at the cp(660), the values were greater than those at the other stations, which increased with depth, with maximum values recorded at the bottom. At the offshore stations, surface values of cp(660) and bbp(440) sharply decreased to 0.35 m−1 and 0.003 m−1 (A14), respectively.
The distributions of biogeochemical properties across the different water layers of the three distinct water masses are shown in Figure 7. Generally, there was a decreasing trend in the concentrations of all biogeochemical properties from coastal to offshore regions, with no significant variation observed with depth. The EDW had the highest concentrations of POC, DOC, and nutrients (DIN and DIP), highlighting its unique estuarine characteristics. Interestingly, compared with the other two water masses, the GCCW had higher Chl (Figure 7A; Table 2). This phenomenon can be attributed to the GCC transporting nutrient-rich seawater from the north (Figures 7G, H) (Hu et al., 2023). Furthermore, compared with the other two water masses, the GCCW had lower DOC (0.83 ± 0.23 mg m−3) (Figure 7C; Table 2).
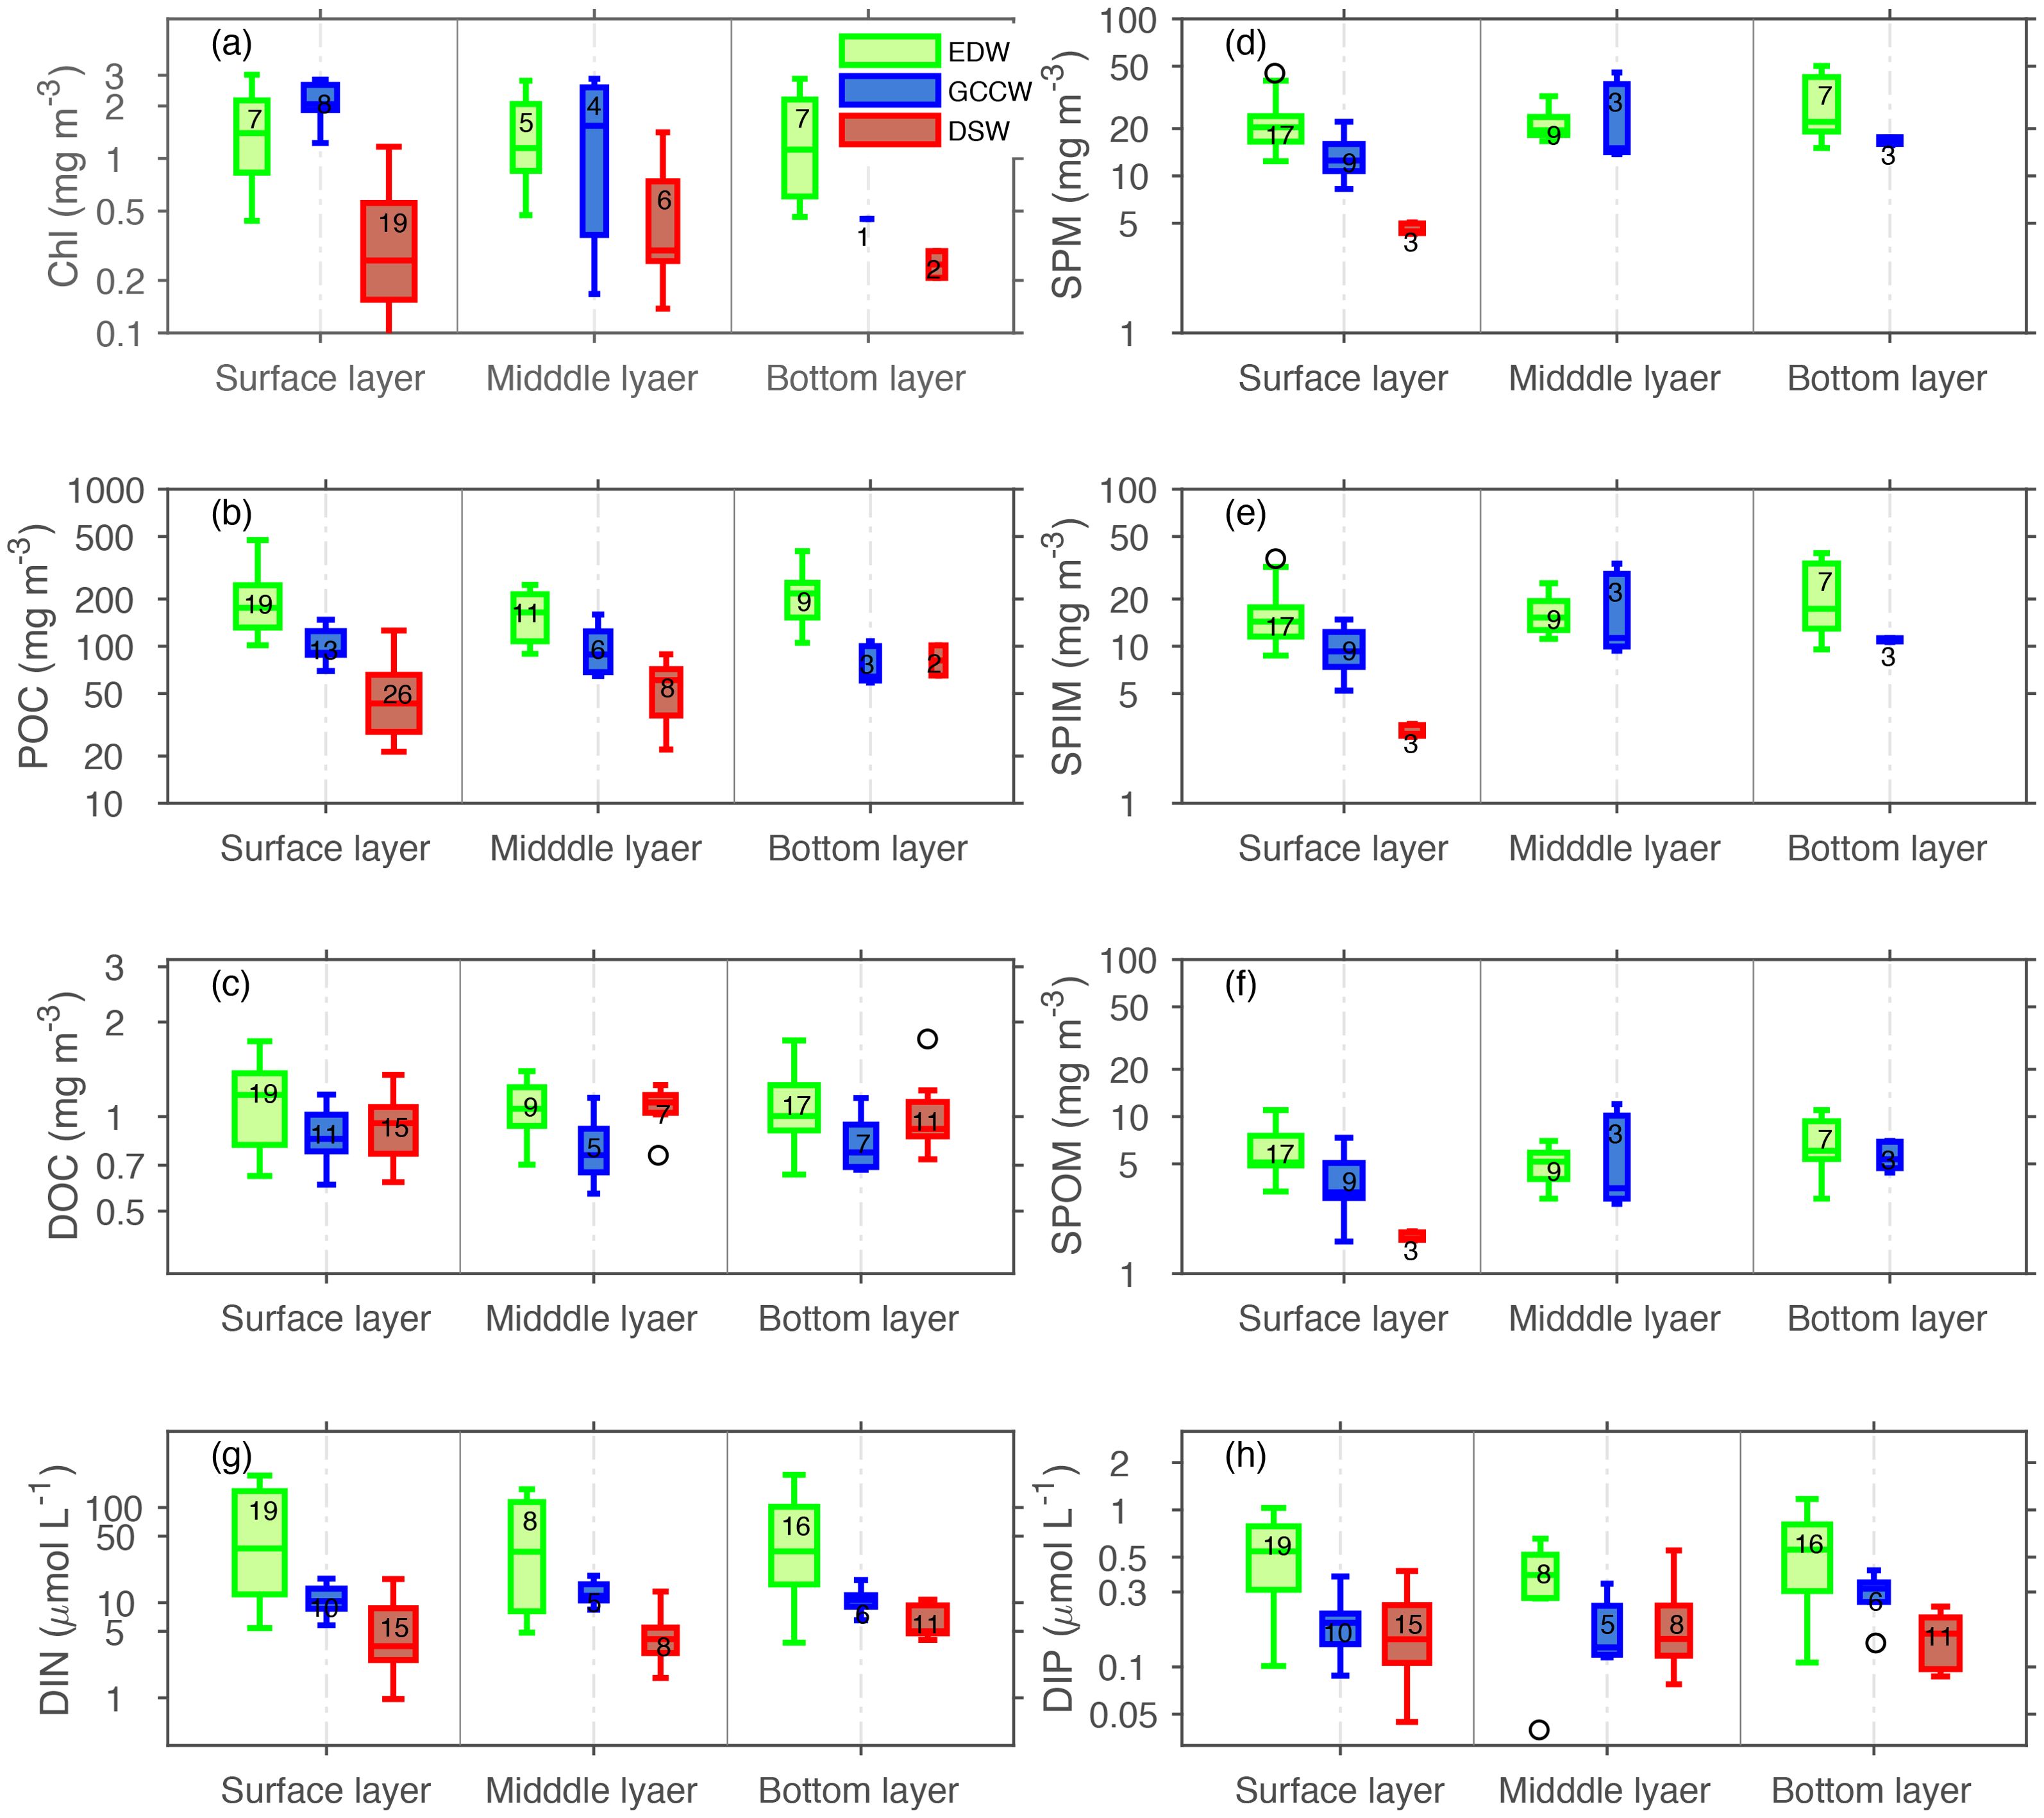
Figure 7. Box plots of biogeochemical properties in different water layers of three water masses. (A) Chl, (B) POC, (C) DOC, (D) SPM, (E) SPIM, (F) SPOM, (G) DIN and (H) DIP. Lines in the boxes denote medians and numbers on the box are the sample numbers. The boxes extend from the lower to the upper quartile values of the data and the whiskers represent the data range, with open gray circles indicating outliers.
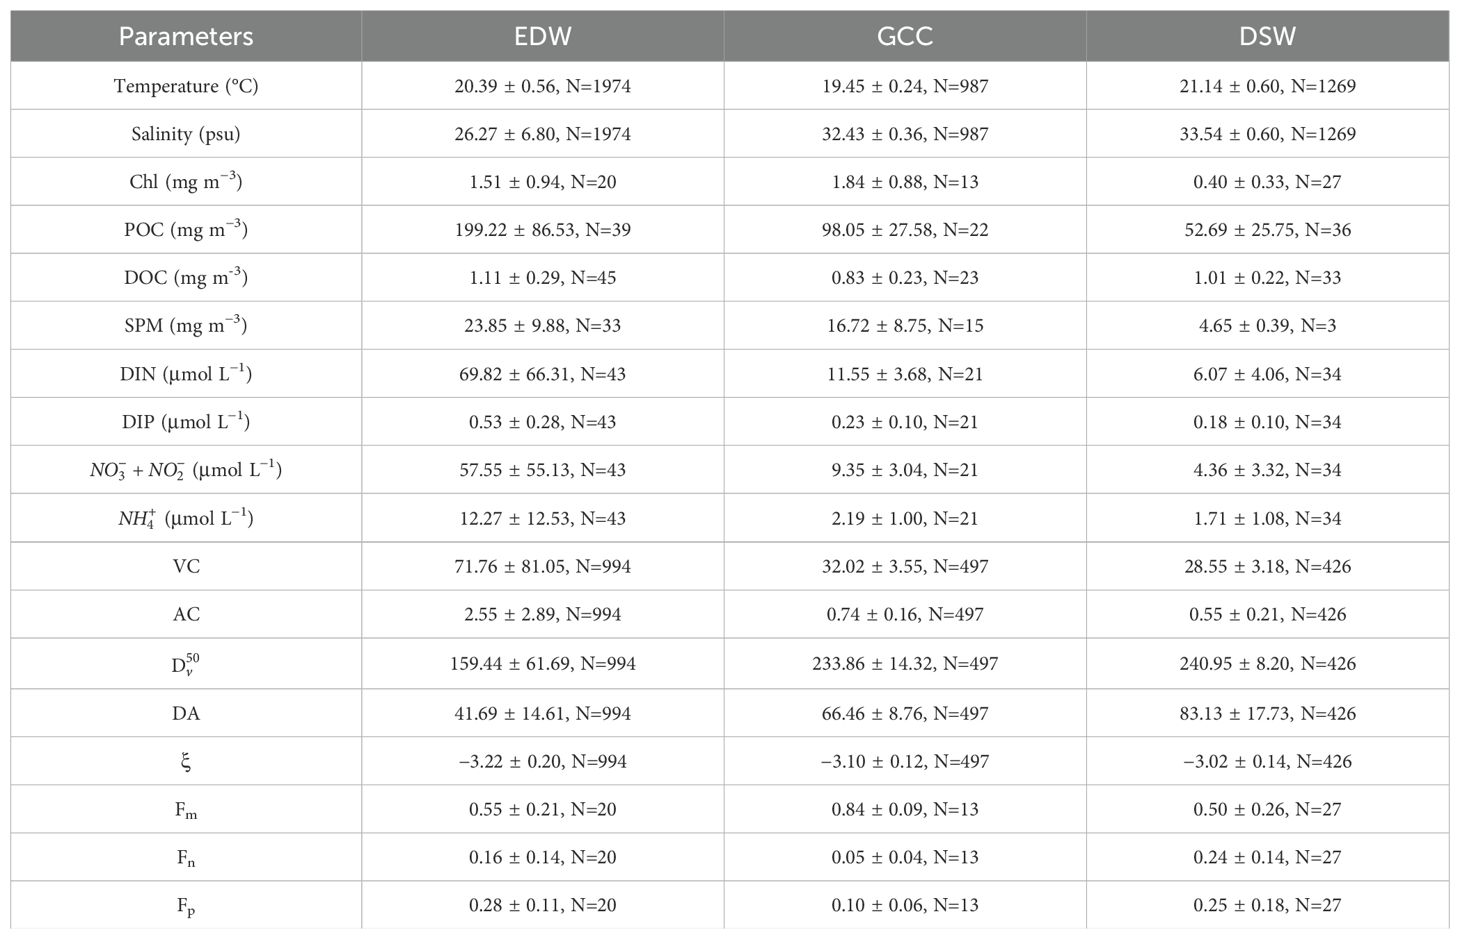
Table 2. The average and standard deviation of physical, biogeochemical and bio-optical properties in three distinct water masses, including EDW, GCCW, and DSW.
As particle size distributions are highly important for both optical properties in the water column and are indicative of phytoplankton size-classes, they were analyzed for each water mass. The total volume concentration (VC) and total cross-sectional area concentration of particle (AC) of the EDW were higher than those of the other water masses, with average values of 71.76 μL L−1 and 2.55 m−2 (Table 2), respectively, and the values were greater closer to the bottom layer (Figures 8A, B). The mean particle diameter weighted by area (DA) and gradually increased with increasing distance from the shore, and the difference within the water layer was small (Figures 8C, D). This distribution of DA characteristics revealed that the particulate matter in the water body was dominated by phytoplankton in the offshore regions, whereas the suspended sediment particles were dominant near the coast. The PSD slopes in the EDW region were relatively low (< −3.8), whereas the values were high in the GCCW and DSW regions (> −3.0) (Figure 8E).
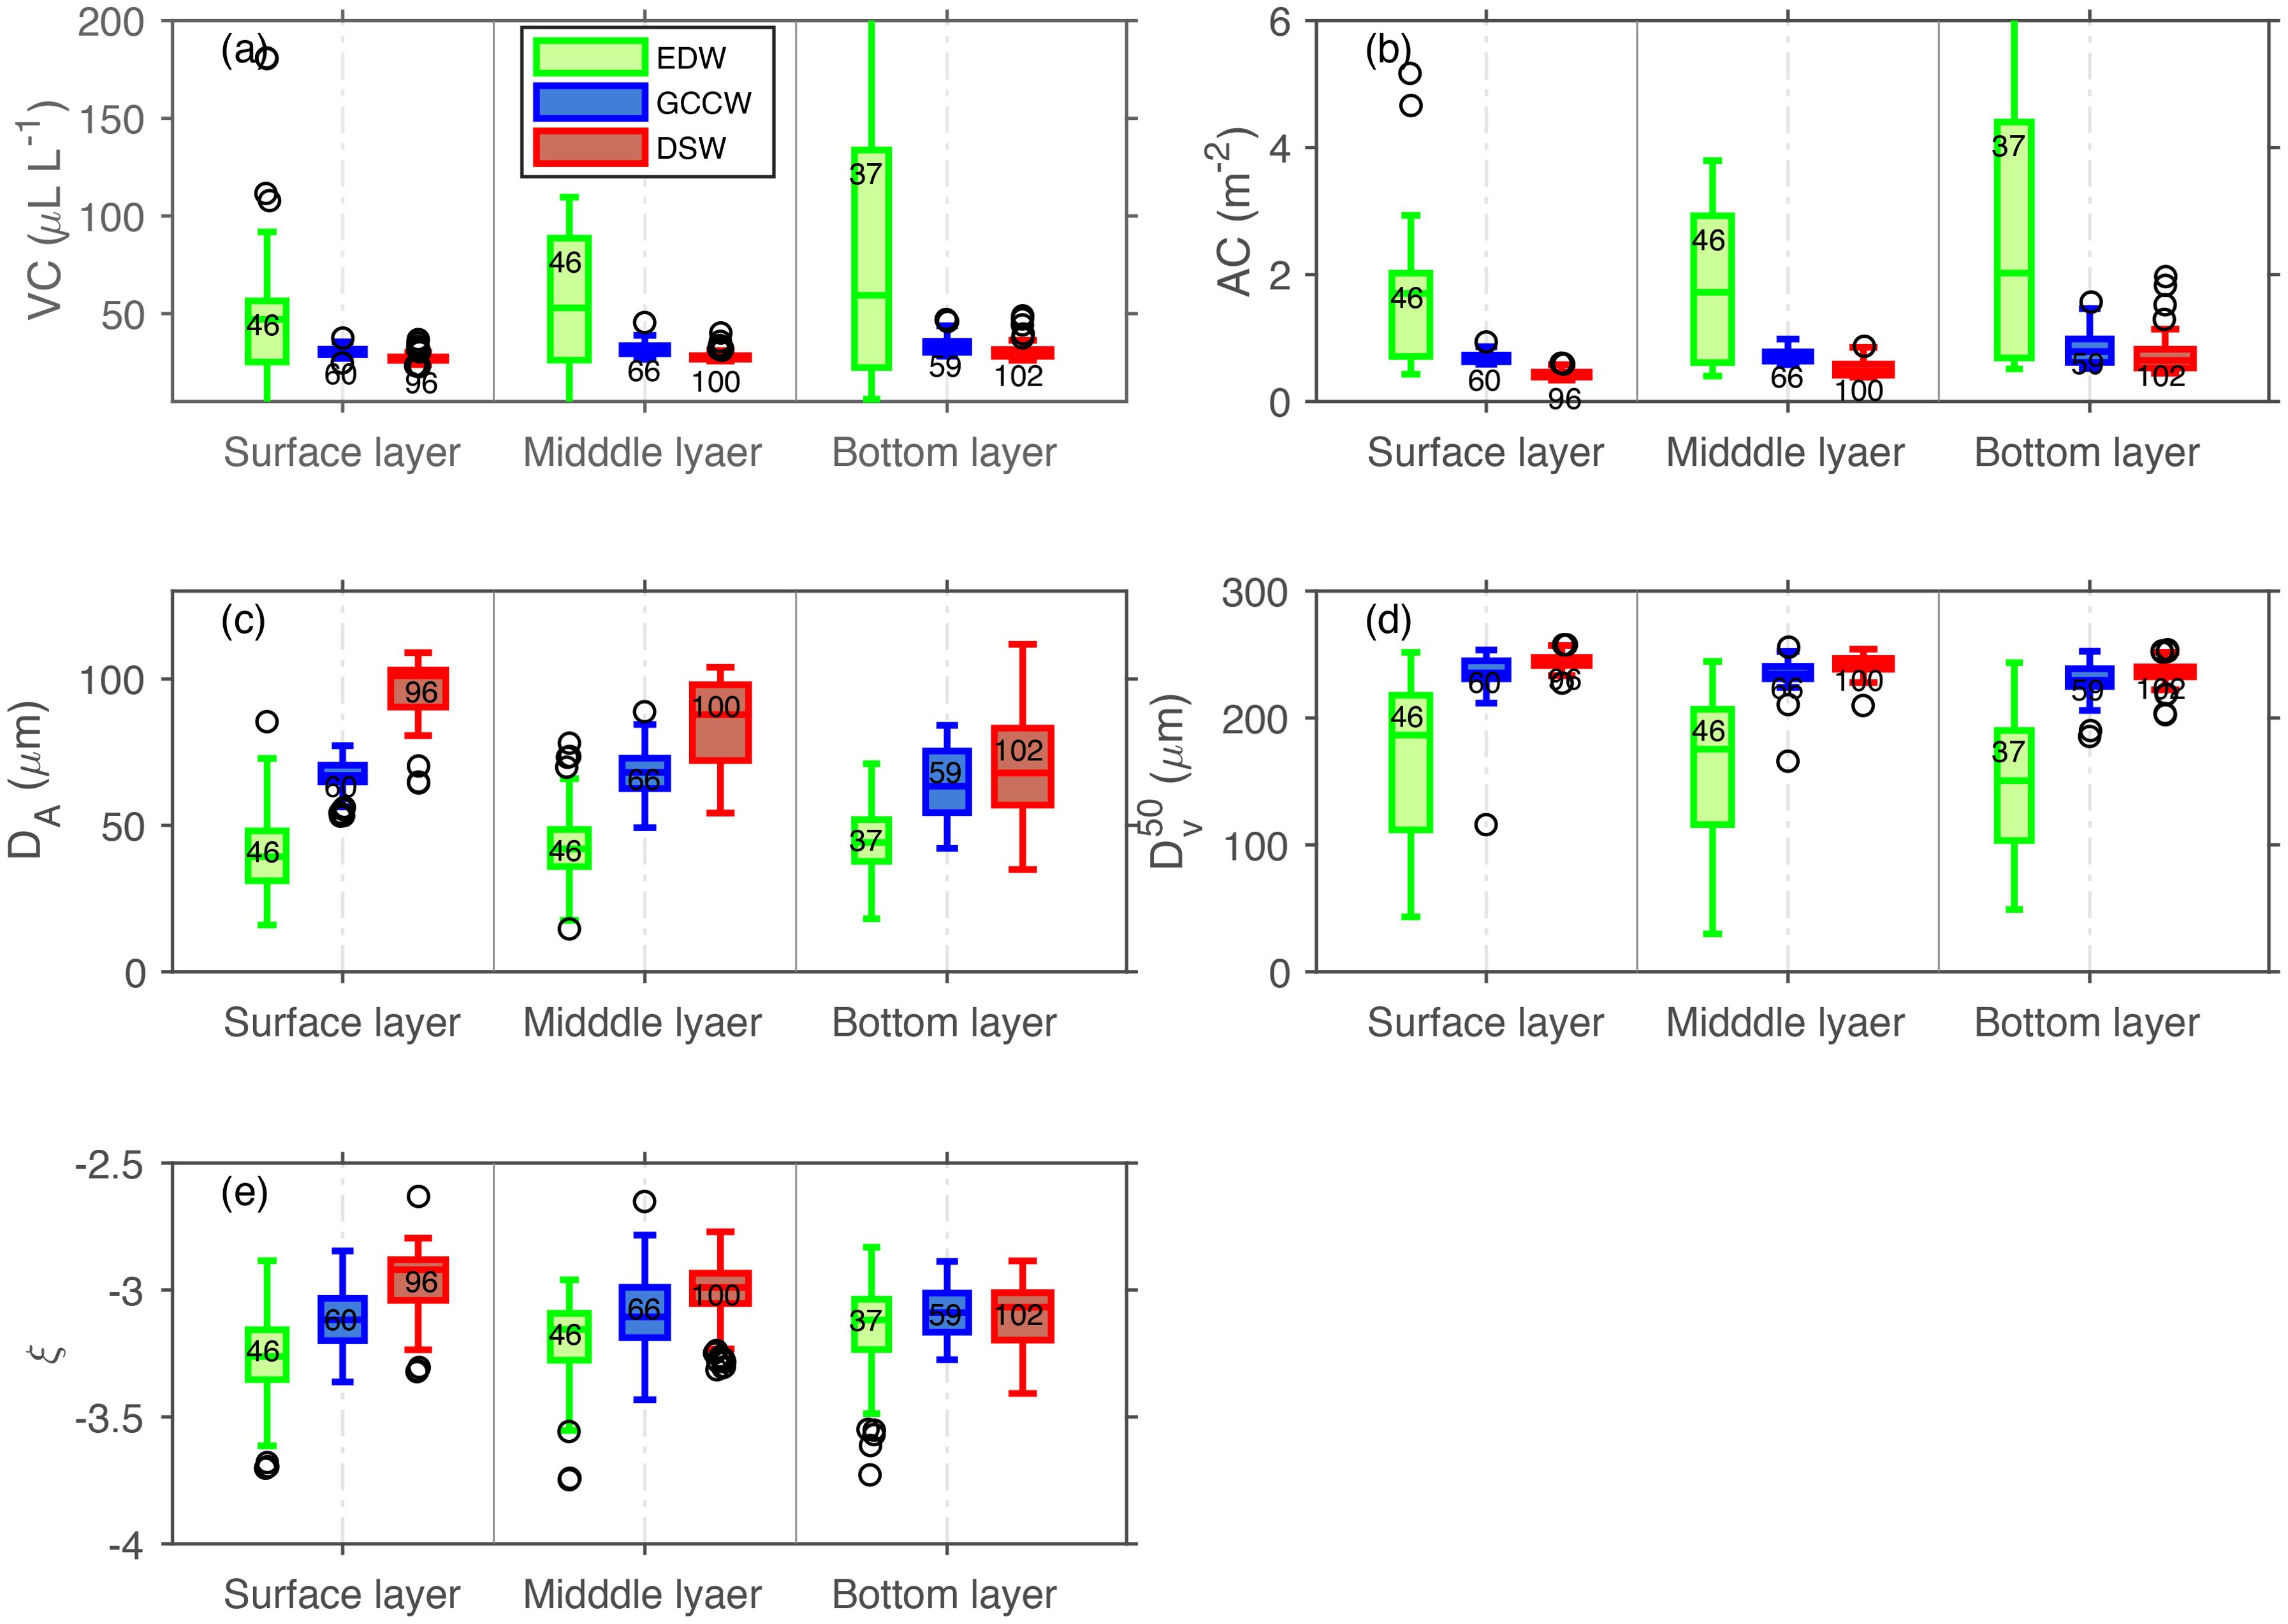
Figure 8. Box plots of parameters derived via the LISST–100X measurements in different water layers of three water masses. (A) VC, (B) AC, (C) DA, (D) D50V and (E) ξ .Lines in the boxes denote medians and numbers on the box are the sample numbers. The boxes extend from the lower to the upper quartile values of the data and the whiskers represent the data range, with open gray circles indicating outliers.
The distributions of particle scattering and backscattering at 530 nm were studied in the three water masses (Figure 9; Table 2). The ratio of backscattering by particles to total scattering by particles is an indicator of particle composition, for example, phytoplankton and detrital material have a low index of refraction relative to inorganic minerals (Boss et al., 2004). Both bp(530) and bbp(530) decreased from the coast to offshore (Figures 9A, B). The backscattering ratio of the surface layer (Figure 9C) decreased from the estuary to the open sea, indicating that the concentrations of inorganic minerals gradually decreased.
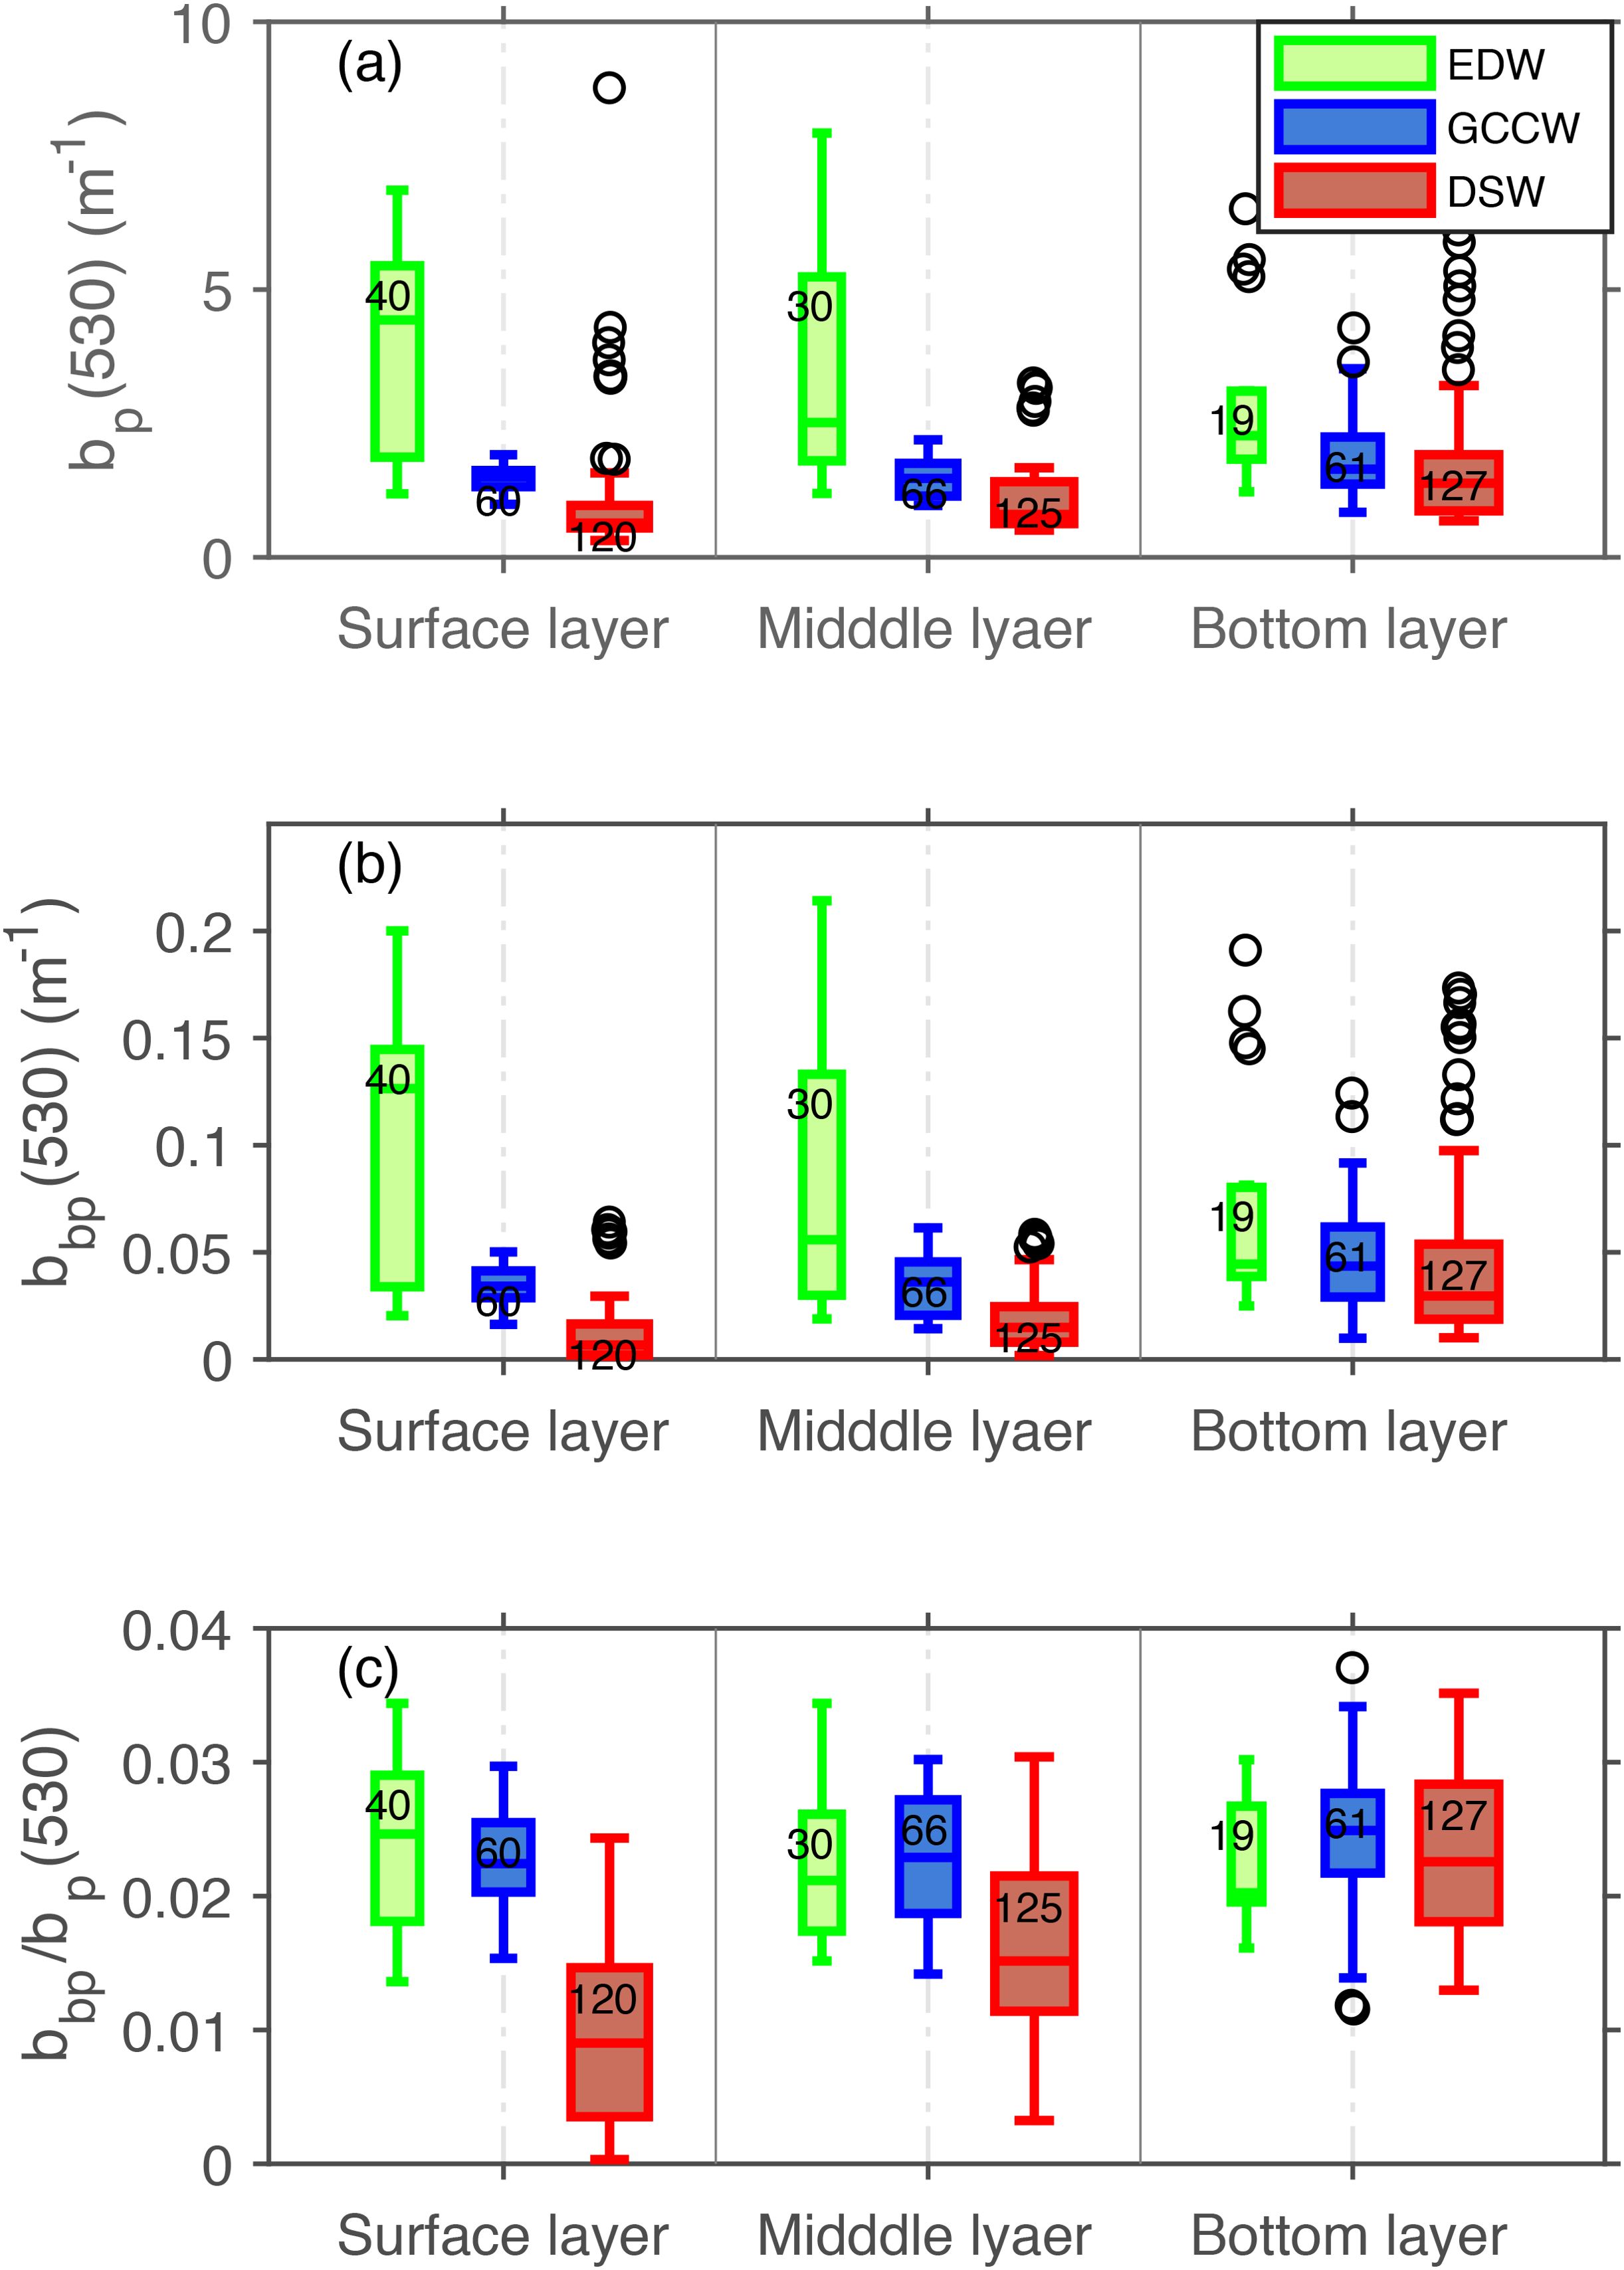
Figure 9. Box and whisker plots of particulate scattering (A), backscattering (B) and the backscattering ratio at 530 nm (C) in different water layers of three water masses. Lines in the boxes denote medians and numbers on the box are the sample numbers. The boxes extend from the lower to the upper quartile values of the data and the whiskers represent the data range, with open gray circles indicating outliers.
Figure 10 shows ternary plots representing the distributions of pico-, nano-, and micro-phytoplankton percentages in the GBA based on the basis of the methodology of Brewin et al. (2015). In winter, the phytoplankton communities in the GBA were predominantly composed of micro- and/or nano-phytoplankton. Their contribution to the Chl exhibited significant variability, ranging from over 80% in the GCCW to less than 60% in the DSW (Table 2). Although pico-phytoplankton contributed mainly to the surface layer of the DSW during winter, their proportion of Chl remained below 30% in most samples.

Figure 10. (A) Ternary plot showing the relative proportions of micro- (Fm), nano- (Fn) and pico-phytoplankton (Fp) in different water depth layers of three different water masses. (B) Same as (A), but the color represents the ratio of POC to Chl. The fractions of different sizes of phytoplankton were estimated from seven diagnostic pigments according to Brewin et al. (2015).
The substantial fraction of micro-phytoplankton and the low ratio of POC to Chl in the GCCW indicated the dominance of large phytoplankton, such as diatoms (Figure 10B; Supplementary Figure S2). Conversely, DSW exhibited the opposite pattern, characterized by a large proportion of pico-phytoplankton and high POC: Chl values, indicating the prevalence of small phytoplankton in the phytoplankton biomass (Figure 10B; Supplementary Figure S2).
Physical processes, including summer upwelling, alongside the Guangdong coastal currents and tides, exerted a substantial influence on bio-optical and biogeochemical properties in the PRE and adjacent waters. Over the last few decades, many studies have focused on the summer upwelling phenomena and the interactions between the Pearl River plume and the coastal currents (Gan et al., 2009b, 2010; Gu et al., 2012). In addition, tidal dynamics induce variations in nutrient supply, light availability, and sediment resuspension, impacting the growth and composition of phytoplankton communities (Tao et al., 2020). However, few studies have investigated the vertical distribution of bio-optical properties and their response to the Guangdong coastal currents during the winter dry season in the GBA.
The GCC, characterized by strong currents along the coast, can transport nutrients, suspended particles, and dissolved matter, strongly influencing the distribution and composition of phytoplankton and particulate matter (Yang and Ye, 2021; Hu et al., 2023). The GCC also can frequently bring strong ocean fronts, which play crucial roles in dynamic and chemical processes (Yang and Ye, 2021). These ocean fronts, characterized by sharp gradients in temperature, salinity, and other properties, serve as dynamic boundaries where water masses with different characteristics interact. During our investigation, the study region was shown obvious frontal structure, with the estuary area related to the river plume, and the shelf area related to the GCC in the open sea. During our investigation, we observed a clear frontal structure in the study region, evidenced by both temperature and salinity distributions (Figure 4) as well as remote sensing images (Supplementary Figure S1). The estuarine region was influenced by the river plume, while the shelf area was associated with the GCC in the open sea. The interactions at these fronts trigger intense mixing and exchange of nutrients, organic matter, and other chemical compounds, influencing the distribution and productivity of marine ecosystems. In our study, we identified three distinct water masses with markedly different bio-optical and biogeochemical properties (Figure 7; Table 2).
On the other hand, the Pearl River, as a major freshwater source, influences the salinity structure and nutrient input, shaping the spatial and temporal patterns of phytoplankton and biogeochemical properties. Our analysis of nutrient concentrations with salinity indicated that dissolved inorganic nutrient concentrations decreased as salinity increased (Supplementary Figure S3). The linear correlations were significant at the 95% confidence level, and the correlation coefficients ranged from 0.55–0.77 (N=98), suggesting that terrestrial input is the major cause of high dissolved inorganic nutrient levels in coastal waters. In contrast, the relationships between nutrients and temperature were very weak.
The variability of bio-optical properties in the PRE is closely related to tidal forces. These tidal forces are primarily semidiurnal (M2) and diurnal (K1) forces, reaching amplitudes of approximately 1.0 m within the estuary (Zu and Gan, 2015). However, our sampling frequency is quite low, lacking hourly observations, which makes it challenging to differentiate the effects of tides from other processes. In the future, we should increase the sampling frequency to better differentiate the effects of tidal currents from other physical processes that influence changes in bio-optical properties.
The findings of this study have significant implications for the development and refinement of bio-optical algorithms used to retrieve key constituents of seawater in complex coastal environments, such as the GBA. The SPM exhibited substantial spatial variations (up to 23.5 mg m−3 in the EDW), which can significantly influence the accuracy of retrieving optical water quality parameters from ocean color algorithms in these regions (Qin et al., 2007; Blondeau-Patissier et al., 2009). Another major constituent is CDOM, which can be present in high concentrations in the GBA (Figure 4). Remote sensing ocean color algorithms for estimating Chl often lack sufficient correction for CDOM effects (Carder et al., 1999). These algorithms typically use constant values for the spectral slope coefficient, assuming that it varies unpredictably (Maritorena and Siegel, 2005; Blondeau-Patissier et al., 2009). Our findings indicate that the modelling and development of ocean color algorithms based on the assumption of constant average values for parameters such as the backscattering power law coefficient or spectral slopes of CDOM, which are commonly used in global algorithms, limit their applicability in similar coastal regions.
In recent years, the occurrence of hypoxia in the PRE and adjacent waters has been associated with high primary production and algal blooms due to increased nutrient concentrations in waters discharged by the Pearl River (Wang et al., 2010; Zhao et al., 2021). This highlights the importance of reliable monitoring of algal blooms, which requires improved knowledge of the optical characteristics of seawater constituents, as presented in this text. Furthermore, the development of better optical models that relate these constituents to inherent optical properties such as absorption and backscattering, as well as apparent optical properties such as remote sensing reflectance, can be improved from our results (D’Sa et al., 2006). The complete coverage of the optical diversity of as many natural waters as possible is also important for the classification of optical water types (Shanmugam, 2011; Bi et al., 2023).
Through comprehensive sampling of the GBA, this study revealed the vertical distributions of bio-optical properties and their potential driving forces during the winter dry season (Figure 11). Our results demonstrate the complex vertical variability of biogeochemical and bio-optical properties in the GBA. Based on the relationship between temperature and salinity, we identified three distinct water masses with significant differences in bio-optical characteristics. Notably, the increase in the Chl and the percentage of micro-phytoplankton in the GCCW, was attributed to the transport of nutrients from the north, which promoted phytoplankton growth.
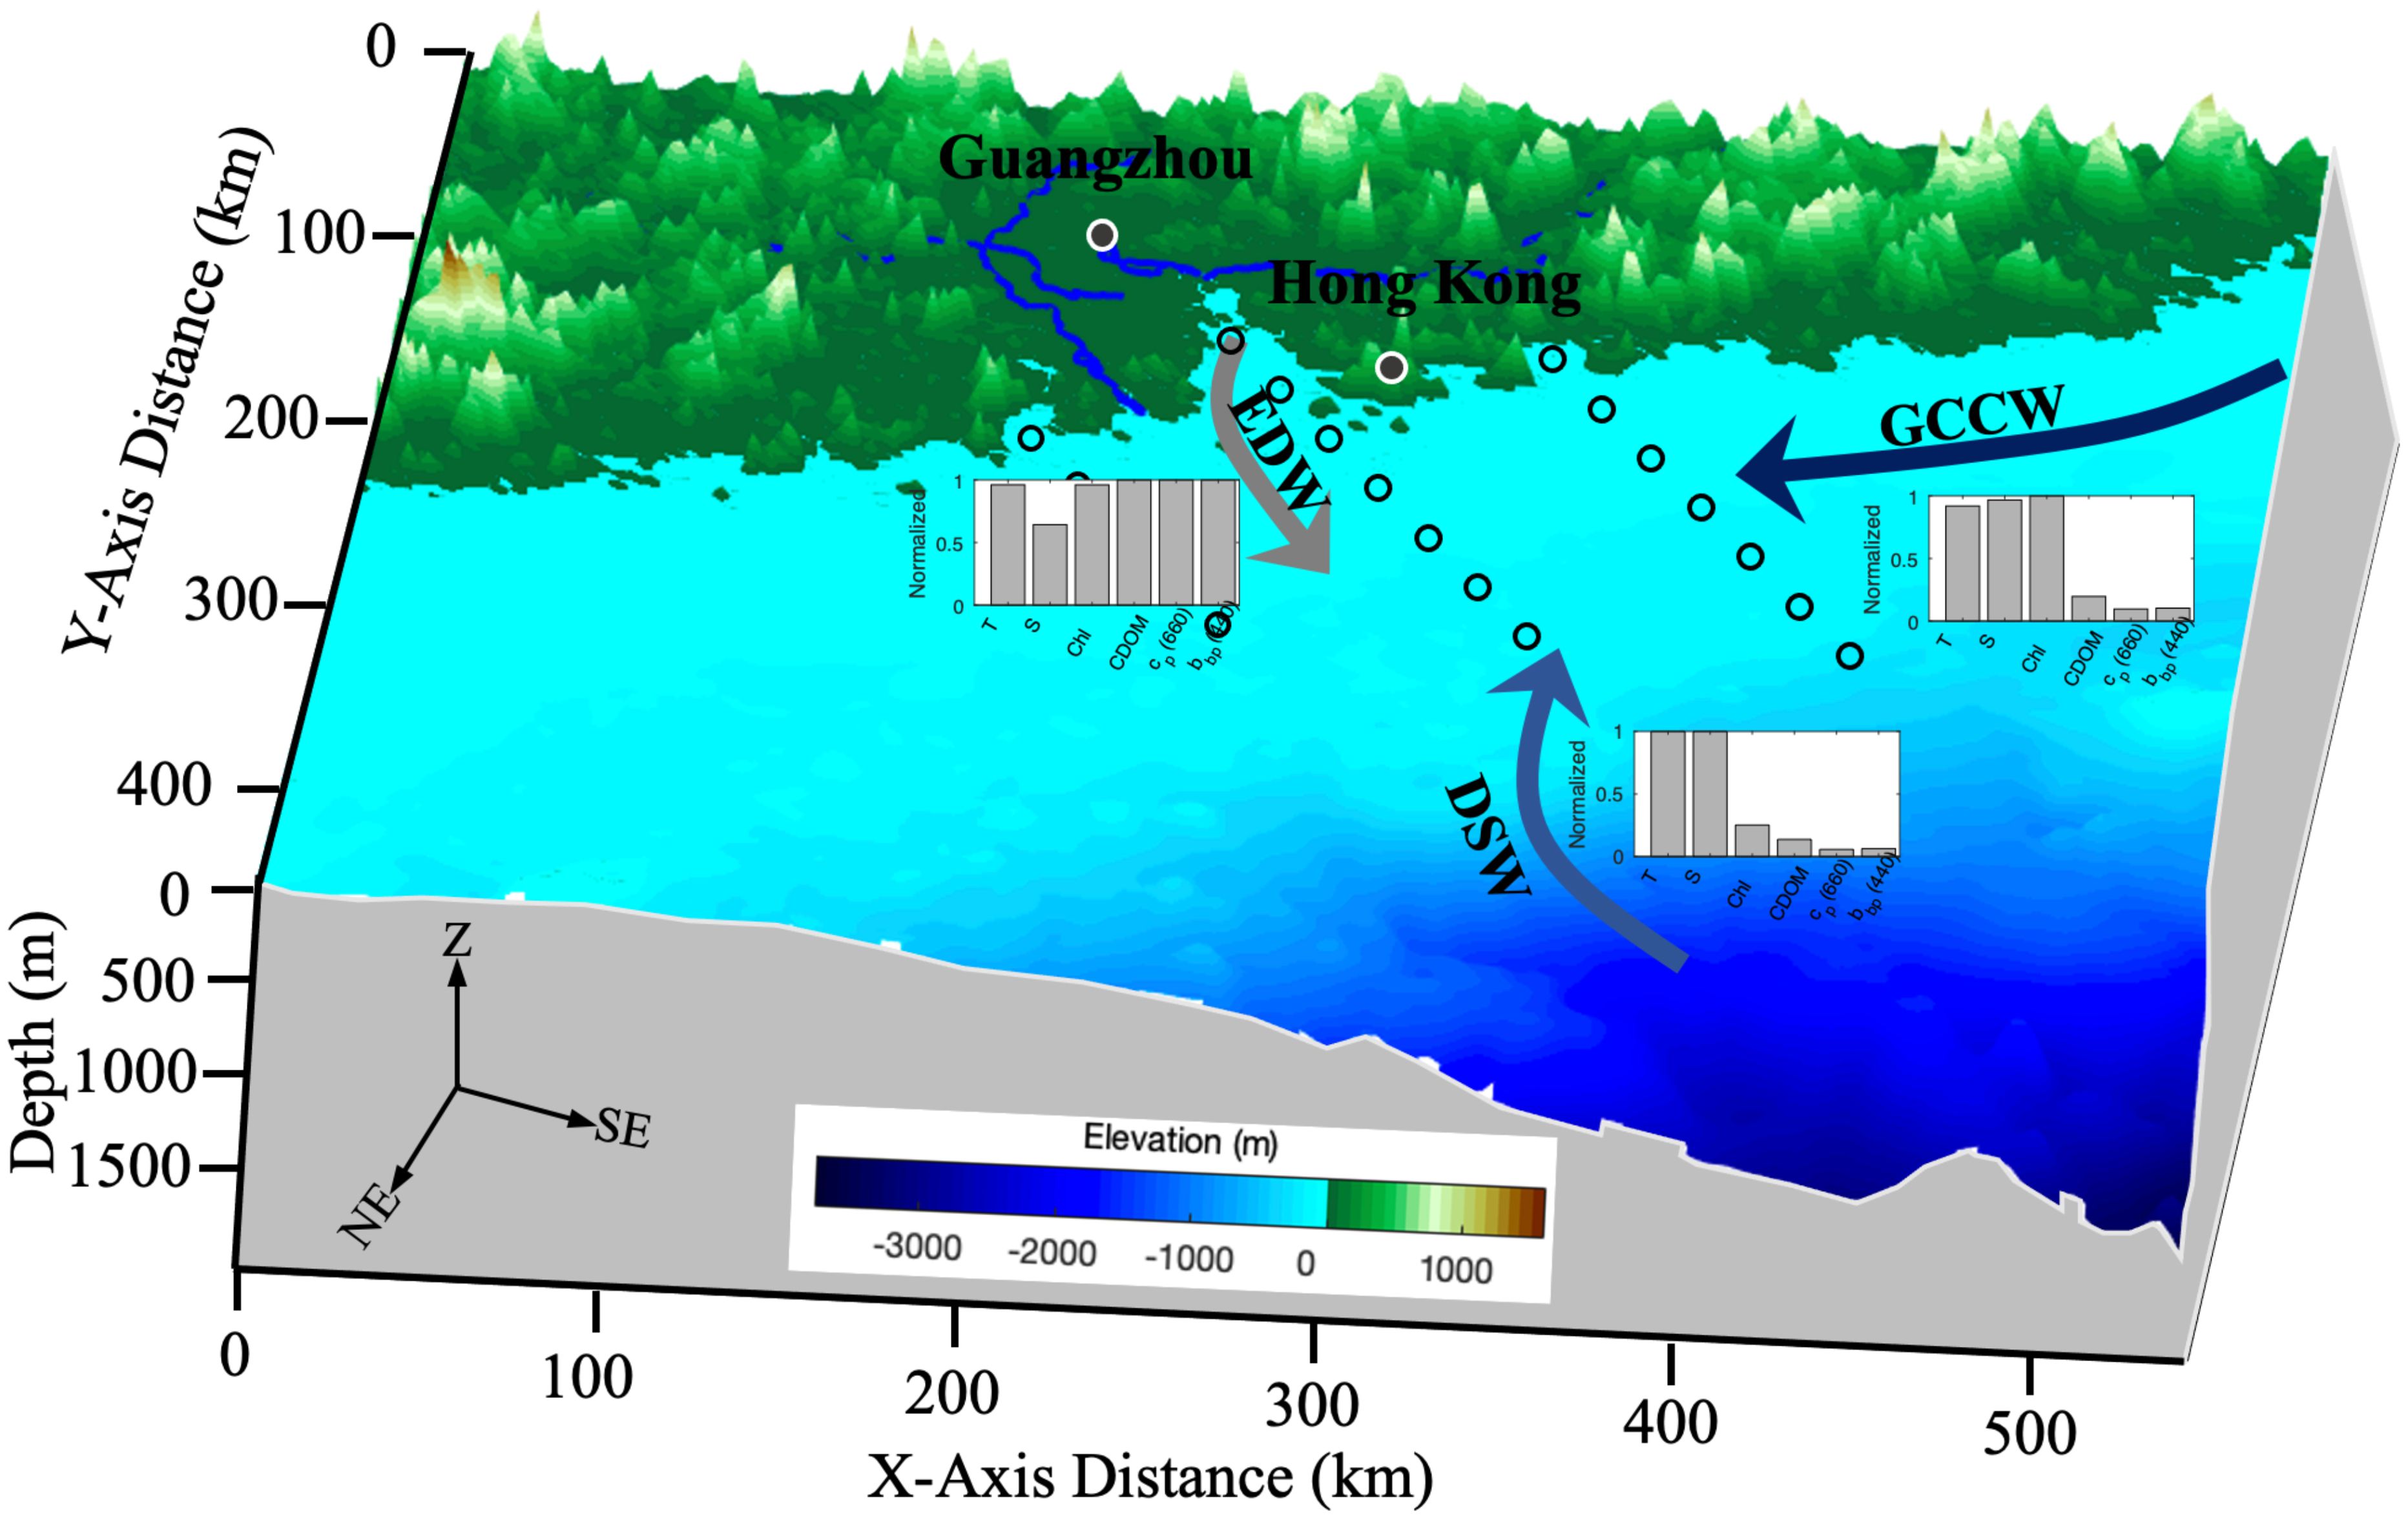
Figure 11. Schematic representation of the variations and drivers of bio-optical properties in the Guangdong-Hong Kong-Macao Greater Bay Area during the winter dry season. Estuarine diluted water (EDW), Guangdong coastal current water (GCCW), and dense shelf water (DSW) were used.
These findings enhance our understanding of the physical processes that determine bio-optical properties and have significant implications for the monitoring of estuarine marine ecosystems. By elucidating the factors that influence phytoplankton dynamics and nutrient distribution, this study can inform the development of more effective monitoring protocols and improved optical algorithms for assessing the health of the GBA’s marine ecosystems.
The original contributions presented in the study are included in the article/Supplementary Material. Further inquiries can be directed to the corresponding author.
WX: Formal analysis, Funding acquisition, Investigation, Methodology, Writing – original draft, Writing – review & editing. SH: Funding acquisition, Investigation, Supervision, Writing – review & editing. AH: Writing – review & editing. ZW: Writing – review & editing. SL: Writing – review & editing.
The author(s) declare financial support was received for the research, authorship, and/or publication of this article. SH was supported by the Shenzhen Science and Technology Program under Grant JCYJ20210324120207020 and the National Natural Science Foundation of China (NSFC) under Grant 41890852. WX was supported by the Natural Science Foundation of Jiangsu Province under Grant BK 20241027 and the National Natural Science Foundation of China (NSFC) under Grant 42406187. AH was supported by the Danish National Centre for Climate research (NCKF).
The authors are grateful to everyone who worked hard collecting the in situ data. For processing and distributing the primary datasets, I would like to express my gratitude to the Ocean Surface Current Analyses Real-time (OSCAR) website (www.oscar.noaa.gov) and the National Aeronautics and Space Administration (NASA) Ocean Color website (https://oceancolor.gsfc.nasa.gov) for their invaluable contribution in providing access to the dataset. We truly appreciate the reviewers who provided constructive suggestions to improve the quality of this manuscript.
The authors declare that the research was conducted in the absence of any commercial or financial relationships that could be construed as a potential conflict of interest.
The author(s) declare that no Generative AI was used in the creation of this manuscript.
All claims expressed in this article are solely those of the authors and do not necessarily represent those of their affiliated organizations, or those of the publisher, the editors and the reviewers. Any product that may be evaluated in this article, or claim that may be made by its manufacturer, is not guaranteed or endorsed by the publisher.
The Supplementary Material for this article can be found online at: https://www.frontiersin.org/articles/10.3389/fmars.2024.1523111/full#supplementary-material
Agrawal Y. C., Pottsmith H. C. (2000). Instruments for particle size and settling velocity observations in sediment transport. Mar. Geol. 168, 89–114. doi: 10.1016/S0025-3227(00)00044-X
Astoreca R., Doxaran D., Ruddick K., Rousseau V., Lancelot C. (2012). Influence of suspended particle concentration, composition and size on the variability of inherent optical properties of the Southern North Sea, Continental Shelf Research 35, 117–128. doi: 10.1016/j.csr.2012.01.007
Bi S., Hieronymi M., Röttgers R. (2023). Bio-geo-optical modelling of natural waters. Front. Mar. Sci. 10. doi: 10.3389/fmars.2023.1196352
Blondeau-Patissier D., Brando V. E., Oubelkheir K., Dekker A. G., Clementson L. A., Daniel P. (2009). Bio-optical variability of the absorption and scattering properties of the Queensland inshore and reef waters, Australia. J. Geophys. Res. 114. doi: 10.1029/2008JC005039
Bonjean F., Lagerloef G. S. E. (2002). Diagnostic model and analysis of the surface currents in the tropical Pacific Ocean. J. Phys. Oceanogr. 32, 2938–2954. doi: 10.1175/1520-0485(2002)032<2938:DMAAOT>2.0.CO;2
Boss E., Pegau W. S., Lee M., Twardowski M., Shybanov E., Korotaev G., et al. (2004). Particulate backscattering ratio at LEO 15 and its use to study particle composition and distribution. J. Geophys. Res. 109. doi: 10.1029/2002JC001514
Boss E., Taylor L., Gilbert S., Gundersen K., Hawley N., Janzen C., et al. (2009). Comparison of inherent optical properties as a surrogate for particulate matter concentration in coastal waters. Limnol. Oceanography-Methods 7, 803–810. doi: 10.4319/lom.2009.7.803
Brewin R. J. W., Sathyendranath S., Müller D., Brockmann C., Deschamps P.-Y., Devred E., et al. (2015). The Ocean Colour Climate Change Initiative: III. A round-robin comparison on in-water bio-optical algorithms. Remote Sens. Environ. 162, 271–294. doi: 10.1016/j.rse.2013.09.016
Cao W., Yang Y., Xu X., Huang L., Zhang J. (2003). Regional patterns of particulate spectral absorption in the Pearl River estuary. Chin. Sci. Bull. 48, 2344–2351. doi: 10.1360/03wd0151
Carder K. L., Chen F. R., Lee Z. P., Hawes S. K., Kamykowski D. (1999). Semianalytic Moderate-Resolution Imaging Spectrometer algorithms for chlorophyll a and absorption with bio-optical domains based on nitrate-depletion temperatures. J. Geophys. Res.: Oceans 104, 5403–5421. doi: 10.1029/1998JC900082
Cui Y., Wu J., Ren J., Xu J. (2019). Physical dynamics structures and oxygen budget of summer hypoxia in the Pearl River Estuary. Limnol. Oceanogr. 64, 131–148. doi: 10.1002/lno.11025
D’Sa E. J., Miller R. L., Del Castillo C. (2006). Bio-optical properties and ocean color algorithms for coastal waters influenced by the Mississippi River during a cold front. Appl. Opt. 45, 7410–7428. doi: 10.1364/AO.45.007410
Dai M., Zhai W., Cai W.-J., Callahan J., Huang B., Shang S., et al. (2008). Effects of an estuarine plume-associated bloom on the carbonate system in the lower reaches of the Pearl River estuary and the coastal zone of the northern South China Sea. Continent. Shelf Res. 28, 1416–1423. doi: 10.1016/j.csr.2007.04.018
Fang G., Fang W., Fang Y., Wang K. (1998). A survey of studies on the South China Sea upper ocean circulation. Acta Oceanogr. Taiwan 37, 1–16.
Gan J., Cheung A., Guo X., Li L. (2009a). Intensified upwelling over a widened shelf in the northeastern South China Sea. J. Geophys. Res. 114. doi: 10.1029/2007JC004660
Gan J., Li L., Wang D., Guo X. (2009b). Interaction of a river plume with coastal upwelling in the northeastern South China Sea. Continent. Shelf Res. 29, 728–740. doi: 10.1016/j.csr.2008.12.002
Gan J., Lu Z., Dai M., Cheung A. Y. Y., Liu H., Harrison P. (2010). Biological response to intensified upwelling and to a river plume in the northeastern South China Sea: A modeling study. J. Geophys. Res. 115. doi: 10.1029/2009JC005569
Gu Y., Pan J., Lin H. (2012). Remote sensing observation and numerical modeling of an upwelling jet in Guangdong coastal water. J. Geophys. Res.: Oceans 117. doi: 10.1029/2012JC007922
Harrison P. J., Yin K., Lee J. H. W., Gan J., Liu H. (2008). Physical–biological coupling in the Pearl river estuary. Continent. Shelf Res. 28, 1405–1415. doi: 10.1016/j.csr.2007.02.011
Hu Z., Li H., Wang D. (2023). Characterizing tidal currents and Guangdong coastal current over the northern south China sea shelf using himawari-8 geostationary satellite observations. Earth Space Sci. 10. doi: 10.1029/2023EA003047
Knap, A., Michaels, A., Close, A., Ducklow, H., and Dickson, A.: , 170 pp., 1996 A., Michaels A., Close A., Ducklow H., Dickson A. Protocols for the Joint Global Ocean Flux Study (JGOFS) Core Measurements, JGOFS Report No 19, 170 pp, 1996
Liu D., Pan D., Bai Y., He X., Wang D., Wei J.-A., et al. (2015). Remote sensing observation of particulate organic carbon in the Pearl river estuary. Remote Sens. 7, 8683–8704. doi: 10.3390/rs70708683
Liu B., Peng S., Liao Y., Wang H. (2019). The characteristics and causes of increasingly severe saltwater intrusion in Pearl River Estuary. Estuarine Coast. Shelf Sci. 220, 54–63. doi: 10.1016/j.ecss.2019.02.041
Maritorena S., Siegel D. A. (2005). Consistent merging of satellite ocean color data sets using a bio-optical model. Remote Sens. Environ. 94, 429–440. doi: 10.1016/j.rse.2004.08.014
Neukermans G., Ruddick K., Loisel H., Roose P. (2012). Optimization and quality control of suspended particulate matter concentration measurement using turbidity measurements. Limnol. Oceanogr.: Methods 10, 1011–1023. doi: 10.4319/lom.2012.10.1011
Pegau W. S., Gray D., Zaneveld J. R. V. (1997). Absorption and attenuation of visible and near-infrared light in water dependence on temperature and salinity. Appl. Opt. 36. doi: 10.1364/AO.36.006035
Qin Y., Brando V. E., Dekker A. G., Blondeau-Patissier D. (2007). Validity of SeaDAS water constituents retrieval algorithms in Australian tropical coastal waters. Geophys. Res. Lett. 34. doi: 10.1029/2007GL030599
Shang S. L., Dong Q., Hu C. M., Lin G., Li Y. H., Shang S. P. (2014). On the consistency of MODIS chlorophyll $a$ products in the northern South China Sea. Biogeosciences 11, 269–280. doi: 10.5194/bg-11-269-2014
Shanmugam P. (2011). A new bio-optical algorithm for the remote sensing of algal blooms in complex ocean waters. J. Geophys. Res. 116. doi: 10.1029/2010JC006796
Stramska M., Stramski D. (2005). Variability of particulate organic carbon concentration in the north polar Atlantic based on ocean color observations with Sea-viewing Wide Field-of-view Sensor (SeaWiFS). J. Geophys. Res.: Oceans 110. doi: 10.1029/2004JC002762
Tao W., Niu L., Liu F., Cai H., Ou S., Zeng D., et al. (2020). Influence of river-tide dynamics on phytoplankton variability and their ecological implications in two Chinese tropical estuaries. Ecol. Indic. 115. doi: 10.1016/j.ecolind.2020.106458
Tilstone G. H., Moore G. F., Sørensen K., Doerffer R., Røttgers R., Ruddick K. G, et al. (2002). REVAMP Regional Validation of MERIS Chlorophyll products in North Sea coastal waters: Protocols document. REVAMP methodol.
van der Linde D. W. (1998). Protocol for the determination of total suspended matter in oceans and coastal zones. Joint Res. Centre Ispra. Technical note I.98.182.
Wang G., Cao W., Yang Y., Zhou W., Liu S., Yang D. (2010). Variations in light absorption properties during a phytoplankton bloom in the Pearl River estuary. Continent. Shelf Res. 30, 1085–1094. doi: 10.1016/j.csr.2010.02.010
Wang S., Qiu Z., Sun D., Shen X., Zhang H. (2016). Light beam attenuation and backscattering properties of particles in the Bohai Sea and Yellow Sea with relation to biogeochemical properties. J. Geophys. Res.: Oceans 121, 3955–3969. doi: 10.1002/2016JC011727
Wei X., Cai S., Zhan W., Li Y. (2021). Changes in the distribution of surface 1628 sediment in Pearl River Estuary 1975–2017, largely due to human activity. Continent. Shelf Res. 228, 104538. doi: 10.1016/j.csr.2021.104538
Wong L. A., Chen J. C., Xue H., Dong L. X., Su J. L., Heinke G. (2003). A model study of the circulation in the Pearl River Estuary (PRE) and its adjacent coastal waters: 1. Simulations and comparison with observations. J. Geophys. Res.: Oceans 108.
Xue H., Chai F. (2002). Coupled physical-biological model for the pearl river estuary: A phosphate limited subtropical ecosystem. Estuar. Coast. Model., 913–928. doi: 10.1061/9780784406281
Yang C., Ye H. (2021). The features of the coastal fronts in the Eastern Guangdong coastal waters during the downwelling-favorable wind period. Sci. Rep. 11, 10238. doi: 10.1038/s41598-021-89649-8
Yu L., Gan J. (2021). Mitigation of Eutrophication and Hypoxia through Oyster Aquaculture: An Ecosystem Model Evaluation off the Pearl River Estuary. Environ. Sci. Technol. 55, 5506–5514. doi: 10.1021/acs.est.0c06616
Zaneveld J. R. V., James C. K., Casey C. M. (1994). Scattering error correction of reflection-tube absorption meters. Proc. SPIE, 44–55. doi: 10.1117/12.190095
Zhang L., Li G., Xiang C., Huang Y., Fu X., Zheng C., et al. (2022). Plankton metabolism in coastal waters of the Guangdong-Hong Kong-Macao greater bay: regional variance and driving factors. Front. Mar. Sci. 9. doi: 10.3389/fmars.2022.844970
Zhao Y., Uthaipan K., Lu Z., Li Y., Liu J., Liu H., et al. (2021). Destruction and reinstatement of coastal hypoxia in the South China Sea off the Pearl River estuary. Biogeosciences 18, 2755–2775. doi: 10.5194/bg-18-2755-2021
Keywords: bio-optical properties, Guangdong coastal current, Pearl River Estuary, Guangdong-Hong Kong-Macao greater bay area (GBA), phytoplankton
Citation: Xu W, Hu S, Hayward A, Wang Z and Liu S (2025) Physical drivers of bio-optical properties in the Guangdong-Hong Kong-Macao Greater Bay Area during the winter dry season. Front. Mar. Sci. 11:1523111. doi: 10.3389/fmars.2024.1523111
Received: 05 November 2024; Accepted: 31 December 2024;
Published: 22 January 2025.
Edited by:
Zhigang Cao, Chinese Academy of Sciences (CAS), ChinaReviewed by:
Jun Zhao, Sun Yat-sen University, ChinaCopyright © 2025 Xu, Hu, Hayward, Wang and Liu. This is an open-access article distributed under the terms of the Creative Commons Attribution License (CC BY). The use, distribution or reproduction in other forums is permitted, provided the original author(s) and the copyright owner(s) are credited and that the original publication in this journal is cited, in accordance with accepted academic practice. No use, distribution or reproduction is permitted which does not comply with these terms.
*Correspondence: Shuibo Hu, aHNiNTE0QDE2My5jb20=
Disclaimer: All claims expressed in this article are solely those of the authors and do not necessarily represent those of their affiliated organizations, or those of the publisher, the editors and the reviewers. Any product that may be evaluated in this article or claim that may be made by its manufacturer is not guaranteed or endorsed by the publisher.
Research integrity at Frontiers
Learn more about the work of our research integrity team to safeguard the quality of each article we publish.