- 1College of Marine Geosciences, Ocean University of China, Qingdao, China
- 2Academy of the Future Ocean, Ocean University of China, Qingdao, China
- 3National Satellite Meteorological Center and National Center for Space Weather, China Meteorological Administration, Beijing, China
- 4College of Oceanic and Atmospheric, Ocean University of China, Qingdao, China
- 5Shandong Continental Shelf Marine Technology Co., Ltd., Qingdao, China
Sediment resuspension primarily occurs within the bottom boundary layer (BBL) of water bodies, particularly in silty coastal environments, and helps form the fluid mud layer (FML). In this study, we report data on the water level, waves, currents, and suspended sediment concentration (SSC) collected from the Bohai Sea over one year, at a vertical resolution of 4 cm, by using the acoustic wave and current profiler, acoustic Doppler current profiler, and an acoustic backscattering system. The aim was to investigate the mechanisms of formation and disappearance of the FML as driven by wave–current interactions on silty seabeds The findings revealed a thin and stable FML within 4–12 cm of the seabed in shallow waters. Strong waves contributed more significantly to sediment resuspension than strong currents. Moreover, the SSC near the seabed was generally governed by the currents, while waves were predominant in this regard in stormy conditions. The index of intensity of the bottom shear β—defined as the ratio of the wave–current-induced shear stress to the critical shear stress—was identified as a sensitive indicator of variations in the SSC. Significant sediment resuspension occurred in case of the coupling of large wave and current events on the fine-grained seabed, when the value of β exceeded 10 for more than 20 h and the Rouse number persisted below 0.01 for over 30 h. Following the storm (β < 10), the sediment gradually accumulated, and this led to the formation of the FML. Prolonged periods in which the value of β surpassed 10 for over 10 h while that of the Rouse number remained below 0.01 for more than 30 h resulted in considerable sediment resuspension and the destruction of the FML. Our results highlight the profound impacts of wave–current interactions on the formation and disappearance of the FML within the BBL in silty, shallow marine environments. The work here offers critical insights into the dynamics of fine-particle sediment, and provides suggestions for mitigating the negative effects associated with the FML.
Highlights
● We used high-resolution observations to identify a thin and stable fluid mud layer (FML) in silty, shallow marine environments.
● The index of bottom shear intensity β controlled the formation, disruption, and disappearance of the FML.
● The concentration of suspended sediment near the seabed was generally controlled by currents, while waves were predominant in this regard during storms.
1 Introduction
Sediment resuspension significantly influences the topography of the seabed as well as the ecosystem, and thus has implications for marine engineering (Weeks et al., 1993). This makes it necessary to investigate the bottom boundary layer (BBL), which is the predominant site of sediment resuspension (Wang et al., 2000; Winterwerp, 2011). The entire water column can be considered to be the BBL in such shallow areas as estuaries and bays, which are characterized by active tidal currents and waves (Wang et al., 2000). Sediment resuspension frequently leads to the formation of the fluid mud layer (FML) in silty coastal environments (Ge et al., 2018). Seabeds with a median grain size (D50) smaller than 0.03 mm are classified as clay seabeds, those with a value of D50 larger than 0.1 mm are categorized as sandy seabeds, while seabeds with value of D50 in the range of 0.03 mm–0.1 mm and clay content below 25% are defined as silty seabeds (Ministry of Transport of the People’s Republic of China, 2022). Fluid mud influences the preservation and use of coastal resources, impacts the safety of navigation and the survival of zoobenthos, and is associated with the development of coastal sedimentary structures (Wu et al., 2022). Therefore, it is important to investigate the formation, transport, and siltation of the FML in the BBL.
Inglis and Allen (1957) coined the term “fluid mud” in the 1950s to characterize water columns with high sediment concentrations near the seabed in the Thames estuary. Since then, a large number of studies has focused on the FML, particularly in estuaries and ports (Flores et al., 2018; Wu et al., 2022; Wan et al., 2014). Researches have used various techniques of field observation to investigate the origins and settling velocities of fluid mud (Maynard, 1985; Kirby, 1988). Li et al. (2001) classified the causes of accumulation of fluid mud in the Yangtze River estuary into three categories: slack flow, a saltwater wedge, and storm surges. He reported that the thickness of the FML exceeded 1 m in dredged channels. Shi (2001) observed that the FML generally appears during floods and ebbing tides, while Yu et al. (2017) showed that the action of strong waves can facilitate the formation of the FML during flood-induced tides. Moreover, Liu et al. (2013) have claimed that the FML dissipates after large storms owing to enhanced tidal forces. Stratification, as driven by the sediment and salinity, has been identified as a critical factor influencing the formation of the FML (Ge et al., 2018, 2020), while extreme weather conditions have been identified as a catalyst for its formation (Tang et al., 2019; Liu et al., 2022).
Fluid mud poses a multi-faceted challenge to research on the marine sediment. The observational datasets used in past work are frequently constrained by their inadequate duration or resolution (Ge et al., 2018; Traykovski et al., 2007). Notably, no study to date has reported observations of near-seabed hydrodynamics and FML processes by using high-resolution equipment (< 0.1 m) over a continuous year in shallow marine environments (Shi, 2010; Azhikodan and Yokoyama, 2018). The lack of measured data on the formation and movement of fluid mud, which is closely related to dynamic conditions, has hindered our understanding of the initiation, transport, and deposition of sediment, as well as the dynamics of formation of fluid mud and its dissipation in the BBL under wave–current interactions (Liu et al., 2023).
In this study, we use acoustic backscatter profile sensors (ABS) to gather data on the suspended sediment concentration (SSC) from station BH02 of western Bohai Bay within 148 cm above the seabed over one year, at a vertical resolution of 4 cm. The aim is to investigate the impact of waves and currents on the formation and dispersion of the FML in shallow marine environments. To this end, we analyze the mechanisms of sediment transport as well as the processes governing the formation and disappearance of the FML in the BBL under wave–current coupling. This is important for better understanding the dynamics of fine particle sediment and addressing issues of siltation in engineering applications.
2 Data and methods
2.1 Study area
Bohai Bay is located in the western Bohai Sea, and has an average depth of 12.5 m (Figures 1A, B). It undergoes irregular semi-diurnal tides, with an average tidal range of 2–3 m and a spring tidal range of approximately 4 m. Notably, ebb tides last longer than flood tides in Bohai Bay. The region is dominated by waves generated by wind, with an average height of 0.6 m and a maximum height of 4 to 5 m (Zhang, 2012). The important ports of Tianjin and Caofeidian are located in Bohai Bay. Its sedimentary composition includes silt, clayey silt, and sandy silt (Figure 1C; Pan et al., 2018), the distribution of which is mainly influenced by runoff from the inlet, tidal currents, and monsoon (Qin and Li, 1982). The Yellow River delivers approximately 1.1 billion tons of sediment to the Bohai Sea each year (Li et al., 2004; Yang et al., 2019). While previous studies have identified an extensive FML in the Yellow River Delta, it has not been found on the silty seabed of the Bohai Sea, where the influence of water and sediment from the Yellow River decreases. We chose station BH02 for our field observations.
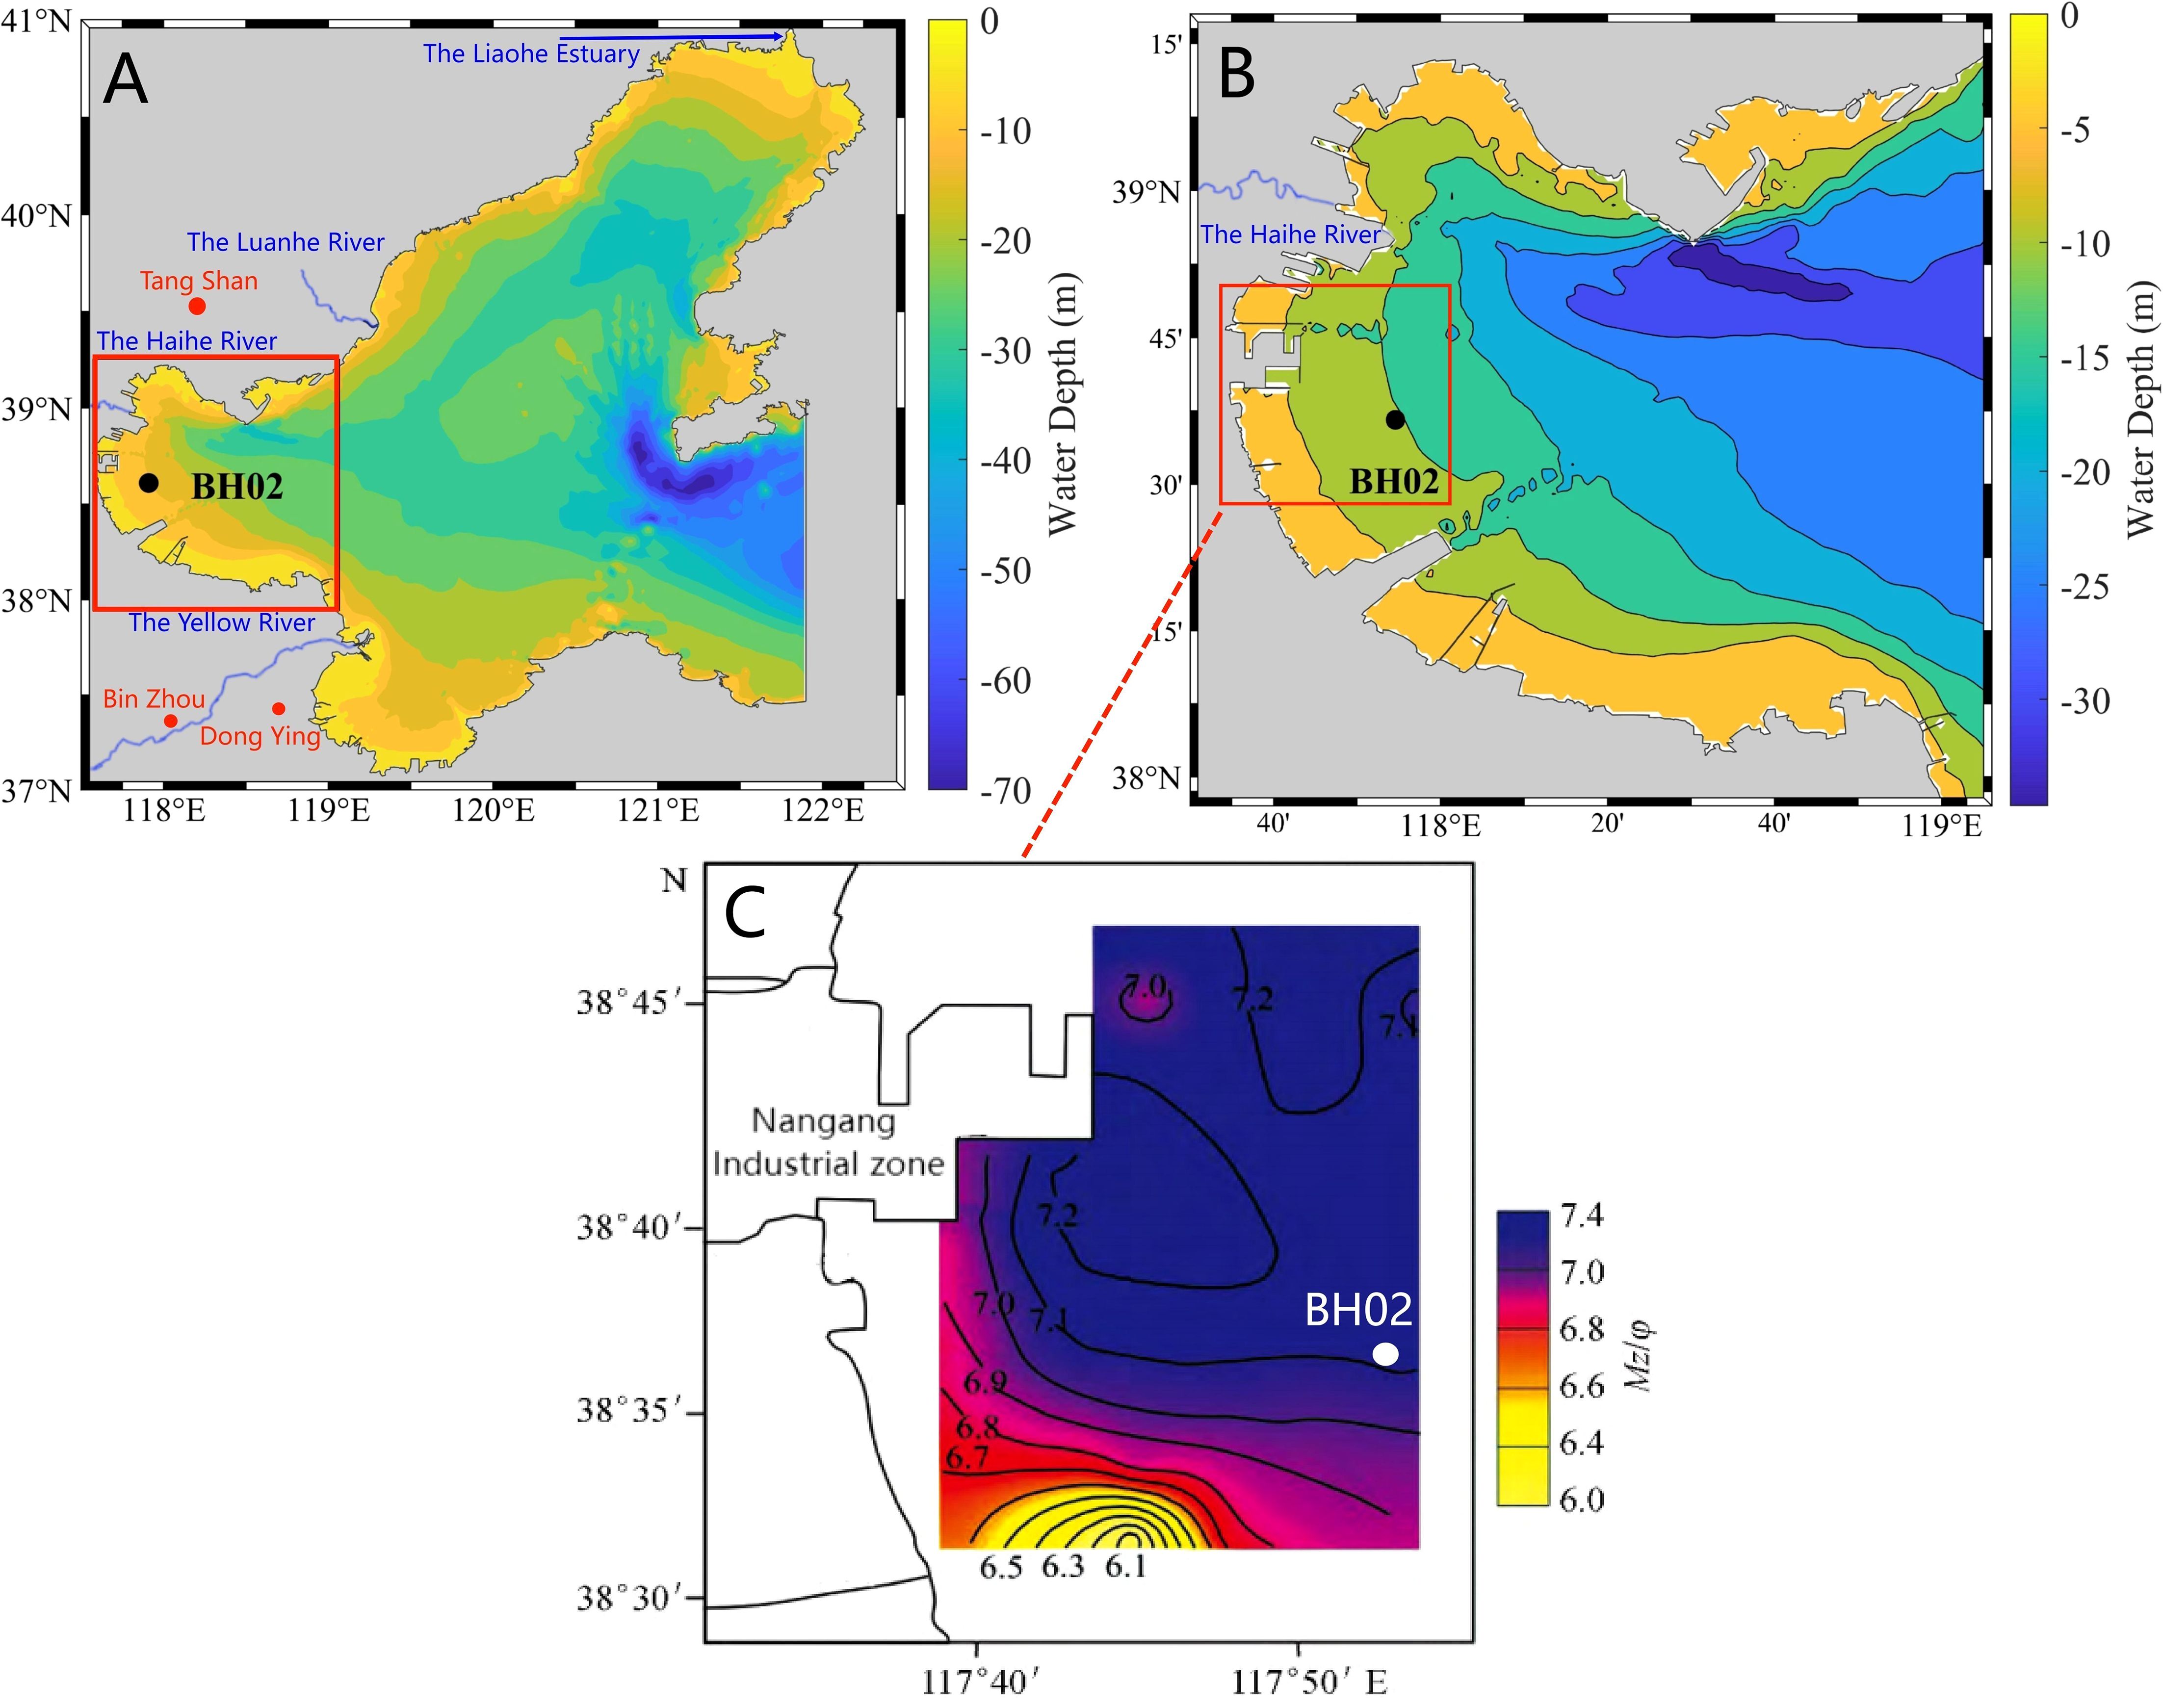
Figure 1. Location of the study area. (A) Bathymetric chart of the Bohai Sea; The area labeled ‘b’ is outlined by the red line. Red dots indicate cities while blue lines indicate the primary rivers flowing into the Bohai Sea. (B) Bathymetric chart of Bohai Bay. Black dot indicates station BH02. (C) Distribution of sediment grain sizes in western Bohai Bay (Pan et al., 2018).
2.2 Observations
The mooring station BH02 (117.91° E, 38.61° N; depth, 11 m) was located in the western Bohai Bay (Figure 1). We collected high-resolution data on the water level, waves, velocity and direction of the current, and SSC at BH02 from June 21, 2016, to July 23, 2017 (Table 1). The station was equipped with a T-frame for downward observations, and an acoustic wave and current profiler (AWAC) (Nortek AWAC–600 kHz) for upward observations (Figure 2). The AWAC transducer was located 1.5 m above the seabed while the T-frame, which was positioned 2 m above the seabed, was equipped with an acoustic backscattering system (ABS) rod (AQUA scat 1000) and an acoustic doppler current profiler (ADCP) (Nortek AS, Norway; 2 MHz). Moreover, we used a downward-looking ABS to measure the SSC near the seabed (0–148 cm) at a vertical resolution of 4 cm (Figure 2). The ABS instrument was deployed by divers, and was not inserted deeper into the seabed to reduce the risk of damage to it. Oysters and seaweed attached to the base observation platform over the study period. The equipment was checked and the batteries replaced every 60 days on average during the spring, summer, and autumn, and every three months in winter. The maintenance periods were short, and the marine biomass attached to the equipment had a minimal impact on the measurements recorded by the sensors. Wind-related data were sourced from the European Centre for Medium-Range Weather Forecasts Reanalysis v5 (ERA5), and had a temporal resolution of 1 h and a spatial resolution of 0.25°.
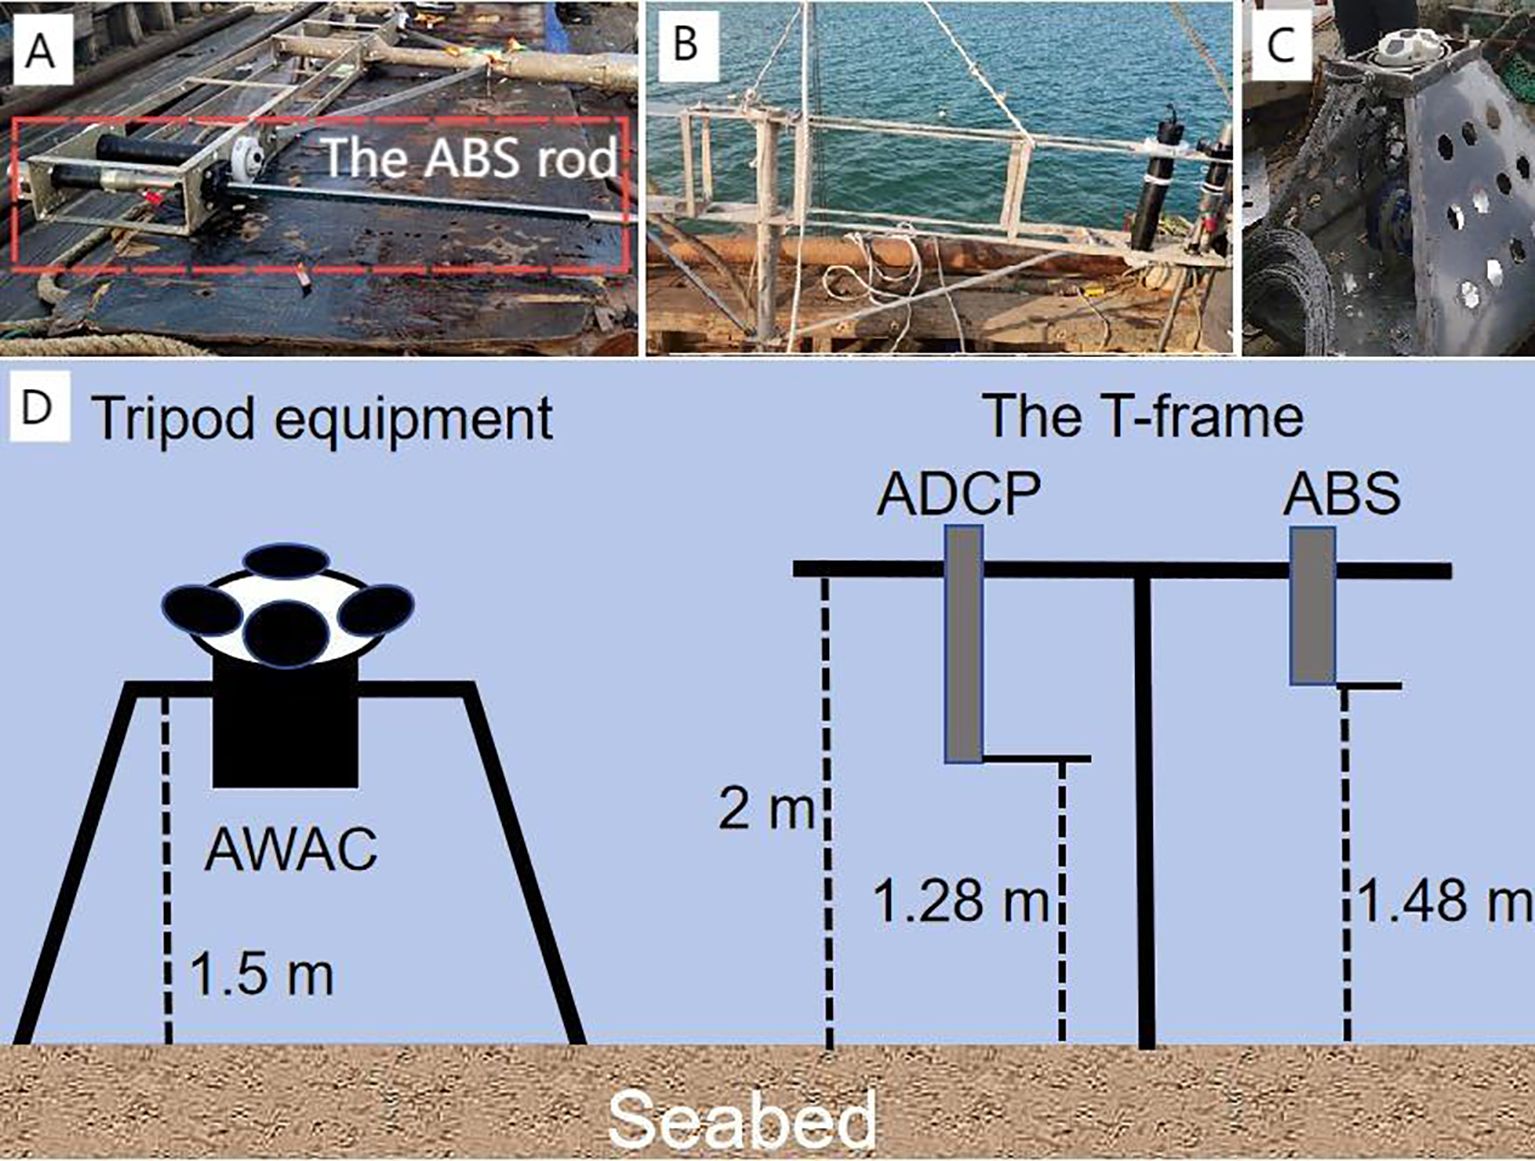
Figure 2. Observation equipment at BH02 station. (A) ABS rod. (B) Field image. (C) Tripod equipment. (D) A schematic diagram of the observation system.
2.3 Methods
2.3.1 Processing of ABS data
We used AQUAtalk software, developed by Aquatec Group Ltd. (UK), to convert the results of measurements of the ABS into SSC values. The raw data acquired by the ABS needed to be corrected for spherical diffusion, attenuation in the water level, variations in the velocity of sound, and the near-field effects of the sensors. The range correction algorithm was used to account for the temperature, salinity, and depth, while the bottom detection algorithm was applied to filter and eliminate data recorded below the seabed. The average noise in each channel was subtracted from the data on backscatter. The SSC profile was obtained by using the method proposed by Thorne and Hanes (2002). According to the principle of acoustic measurement, the intensity of scattering of the source was proportional to the SSC in the water column. We calibrated the results by using data on the particle size of the sediment in the study area.
A comparative analysis of our data with SSC values obtained by suction filtration yielded a minimal average absolute error and a high degree of correlation (Hay and Sheng, 1992; Hu et al., 2016). The correlation coefficient was 0.99 in 1992 (Hay and Sheng, 1992) and 0.93 in 2016 (Hu et al., 2016), which confirmed the accuracy of the SSC derived from measurements of the ABS. Kuang et al. (2011) have shown that the ABS can accurately measure concentrations below 10 g/L, with an upper limit of measurement of 20 g/L.
2.3.2 Definition of FML
Fluid mud is typically characterized based on the SSC. The consensus in research is that the threshold SSC of fluid mud is 10 kg/m3 (Kineke and Sternberg, 1992; Hale and Ogston, 2015; Tu et al., 2022). Liu et al. (2022) have also claimed that the threshold in southern Bohai Bay is 10 kg/m3 (Figure 1A). We thus set the threshold SSC of fluid mud to this value. The SSC of fluid mud exceeded the gel point, and ranged from 10 to 100 g/L (Winterwerp et al., 2002). Values of the SSC on the seabed significantly surpassed this range.
2.3.3 Calculation of bottom shear stress
Currents and waves are critical for controlling sediment resuspension (MacVean and Lacy, 2014), while the bottom shear stress needs to be determined to predict the SSC (Heath et al., 2016). The average velocity of the current in the near-shore bottom boundary layer usually adheres to a logarithmic distribution (Yang et al., 2016).
We applied the log profile (LP) method to data on the profile of the velocity of the current recorded by the ADCP to calculate the current-induced shear stress () in the study area (Chen et al., 2019). The LP method was represented through the von Karman–Prandtl Equation 1 (Soulsby, 1997), while was calculated by using Equation 2.
In the above, U(z) is the average velocity (m/s) above the seabed z (m) during the sampling period, is the frictional velocity (m/s), κ is the Carmen constant (0.4), is the density of seawater (1025 kg/m3), and is the length of roughness of the seabed ( = ks/30, where ks = 2.5D50 is the Nikuradse particle roughness and D50 is the median grain size of the sediment). The sediment at station BH02 was predominantly composed of clayey silt (D50 = 7.8125 µm), with a clay content of approximately 30% (Pan et al., 2018).
We used linear wave theory to calculate the amplitude of the orbital wave velocity and the radius of the major axis of near-bottom wave orbit Awas Equations 3, 4 (Shi et al., 2014).
where Hrms is the root mean-squared height of the wave (m), T is its period (s), d is the depth of water (m), Hrms =Hs/, Hs is the significant wave height (m), and L is the wavelength (m) that was calculated as Equation 5 (Li and Amos, 2001).
The orbital motion of waves enhances the shear stress on the seabed. We calculated the wave-induced shear stress ) as Equation 6 (Soulsby, 1995).
where is the density of seawater (1025 kg/m3) and is the frictional coefficient of the wave that is related to its Reynolds number Rew (Rew =AwUw/ν). In this expression, ν is the kinematic coefficient of viscosity of seawater (10-6 m2/s)).
The wave–current-induced shear stress ) was calculated as Equations 7, 8 (Soulsby, 1995).
where is the average shear stress under the action of waves and currents, the angle of propagation of which is .
2.3.4 Calculation of critical shear stress
We determined the critical shear stress () of the cohesive sediment by Equations 9–11 (Shields, 1936; van Rijn, 1993).
where g is gravitational acceleration, θcr is the critical Shields number, ρs is the density of the sediment (2650 kg/m3), D50 is its median grain size, s is the ratio of the density of sediment to that of seawater, and is the dimensionless grain size number. The critical shear stress was determined to be 0.03 Pa, which aligns with its previously reported values for the same particle size (Mehrdad and Kyle, 2012). In addition to the grain size, the critical shear stress is influenced by the organic matter content (Araújo, 2004). However, the low organic matter content in Bohai Bay had a minimal impact on the critical shear stress (Zhao, 2019).
The index of intensity of bottom shear, denoted by β, is defined as the ratio of the wave–current-induced shear stress to the critical shear stress . It quantifies the capacity of resuspended seabed sediment within the BBL under specific grain sizes.
2.3.5 Gradient Richardson number
The density of suspended sediment concentration ρsed is calculated as Equation 12 (Wang, 2002).
ρpure is the pure water density, ρs is the sediment density, and SSC is the suspended sediment concentration.
The gradient Richardson number Ri quantifies the effect of stratification. It is a dimensionless number that represents the ratio of stratification of seawater (which inhibits vertical mixing) to the velocity shear (which generates vertical mixing) between the upper and lower layers. The gradient Richardson number Ri is defined as Equations 13–15 (Howard, 1961; Miles, 1961).
where is the square of the frequency of buoyancy (s-2), is the square of the vertical velocity shear (s-2), ρ0 is the density of seawater, z is the height above the sea floor, and u and v are the mainstream velocity and the lateral velocity, respectively. The Richardson number represents the instability of fluid structures (Trowbridge and Kineke, 1994; Tang et al., 2023). A higher Richardson number reflects stronger stratification, which inhibits vertical mixing and leads to the stable stratification of the water body. Conversely, a lower Richardson number means that the vertical shear leads to instability in the water body, where this facilitates material exchange. According to linear stability theory (Zhang and Wu, 2018), the critical threshold of Ri is approximately 0.25. We introduce the parameter log10(Ri *4) to clearly differentiate Ri.
2.3.6 Suspension index
When the impact of advection-induced transport is neglected, the particles of sediment are resuspended when the upward turbulent diffusion and downward sedimentation reach an equilibrium under hydrodynamic oceanic forces. The Rouse parameter (R) serves as the index of suspension, and reflects the interplay between gravitational and turbulence-induced effects (Rouse, 1939). The calculations of R are as Equations 16–18 (Rouse, 1939).
where is the settling velocity of the particles of sediment that was calculated according to Stokes’ Law, κ is the Carmen constant (0.4), is the shear velocity, D is the median grain size of the sediment, ν is the kinematic coefficient of viscosity of seawater (10-6 m2/s), is the shear stress on the seabed, and β is a constant related to the eddy viscosity and eddy diffusivity that is sometimes considered, but was neglected here. We instead assumed that it was approximately equal to one (Bassett et al., 2023). When R is lower than 2.5, the sediment is suspended to varying degrees (Bassett et al., 2023). As the Rouse number decreases, the effect of turbulence intensifies, which enables a larger number of particles of the sediment to counteract gravity and remain suspended in the water column (Cheng et al., 2024).
3 Results
Figure 3 shows the time series of the wind speed, depth of water, significant wave height (Hs), velocity of the bottom current, index of intensity of bottom shear β, and SSC at station BH02 over the study period. The annual average wind speed was 5.1 m/s, and peaked at 16.5 m/s (Figure 3A). The average velocity of the bottom current was 0.29 m/s, and reached a maximum value of 0.87 m/s (Figure 3D). Moreover, the average Hs throughout the year was 0.48 m, with a maximum value of 3.2 m (Figure 3C). The time series of the SSC shows its values at heights of 148 cm and 30 cm above the seabed from July 27, 2016 to July 23, 2017 (Figure 3F). It was higher during the summer and autumn, and lower during the winter and spring. The seabed underwent a minimal change in height of only 4 cm (Figure 3F). Throughout this period, the index of intensity of bottom shear β mostly remained below 20 (Figure 3E).
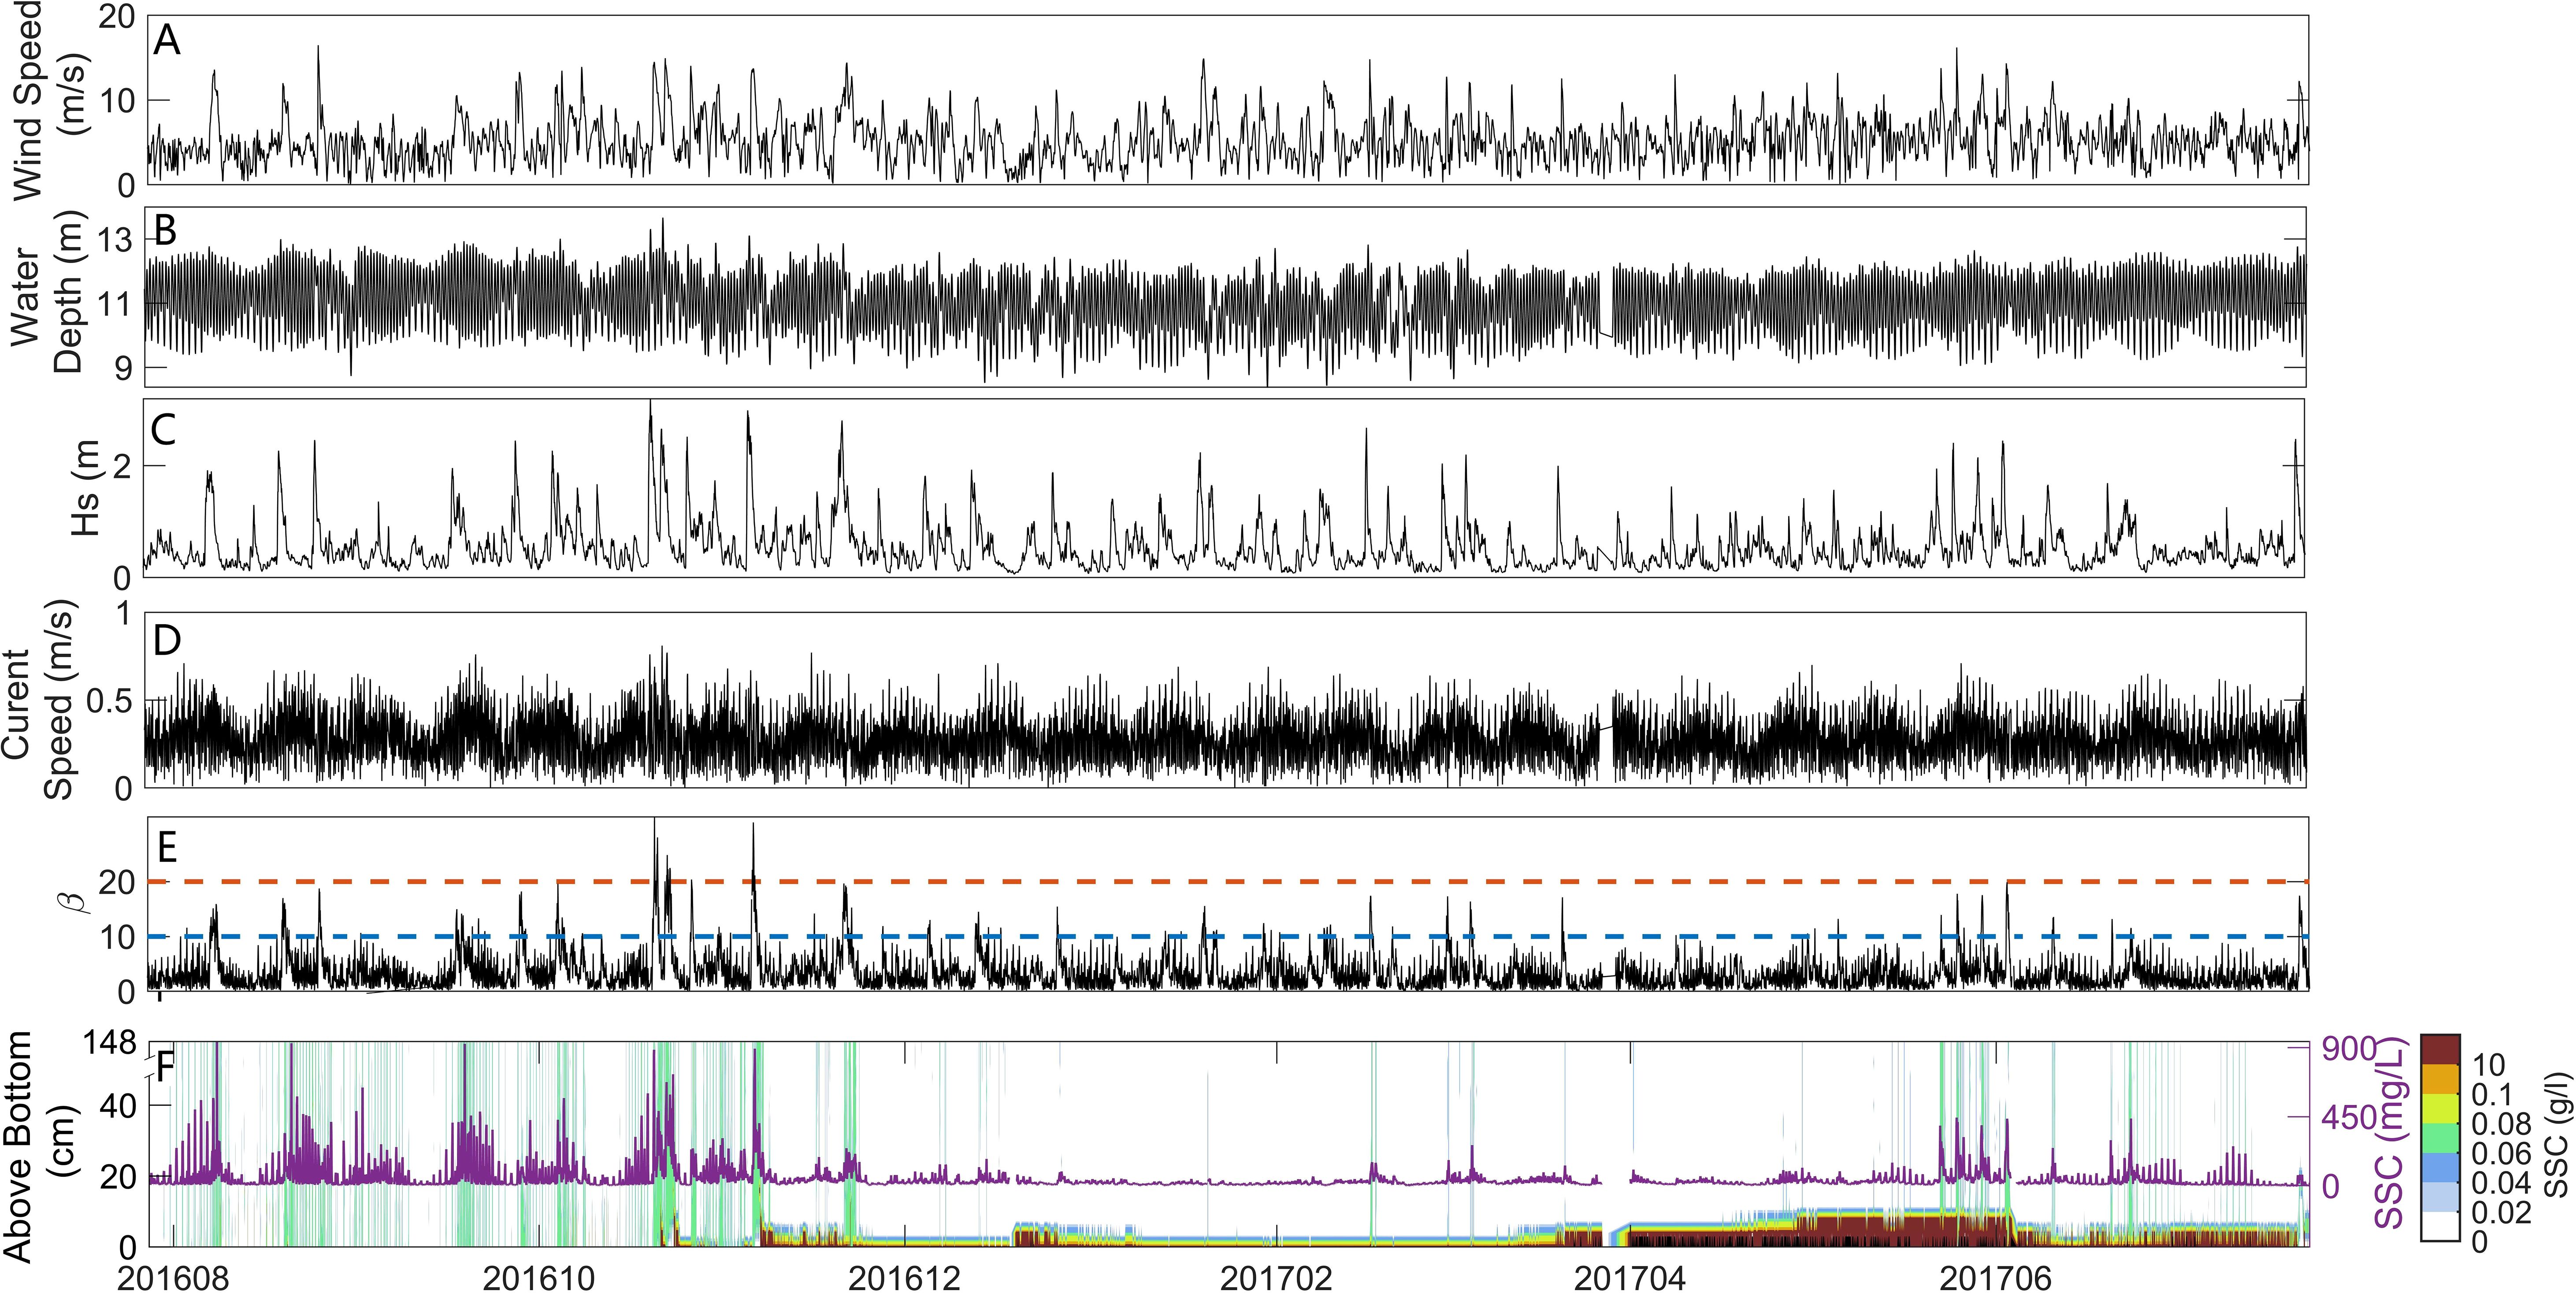
Figure 3. Time series of elements at BH02 station. (A) Wind speed. (B) Water depth. (C) Significant wave height (Hs). (D) Bottom current velocity. (E) Bottom shear intensity index β. (F) SSC measured within 148 cm above the seabed. The purple line indicates the SSC time series at 30 cm above the seabed, while the vertical green lines indicate that the SSC in the BBL ranges from 60 to 80mg/l. The black area at the bottom indicates the seabed.
3.1 Impact of waves and currents on SSC
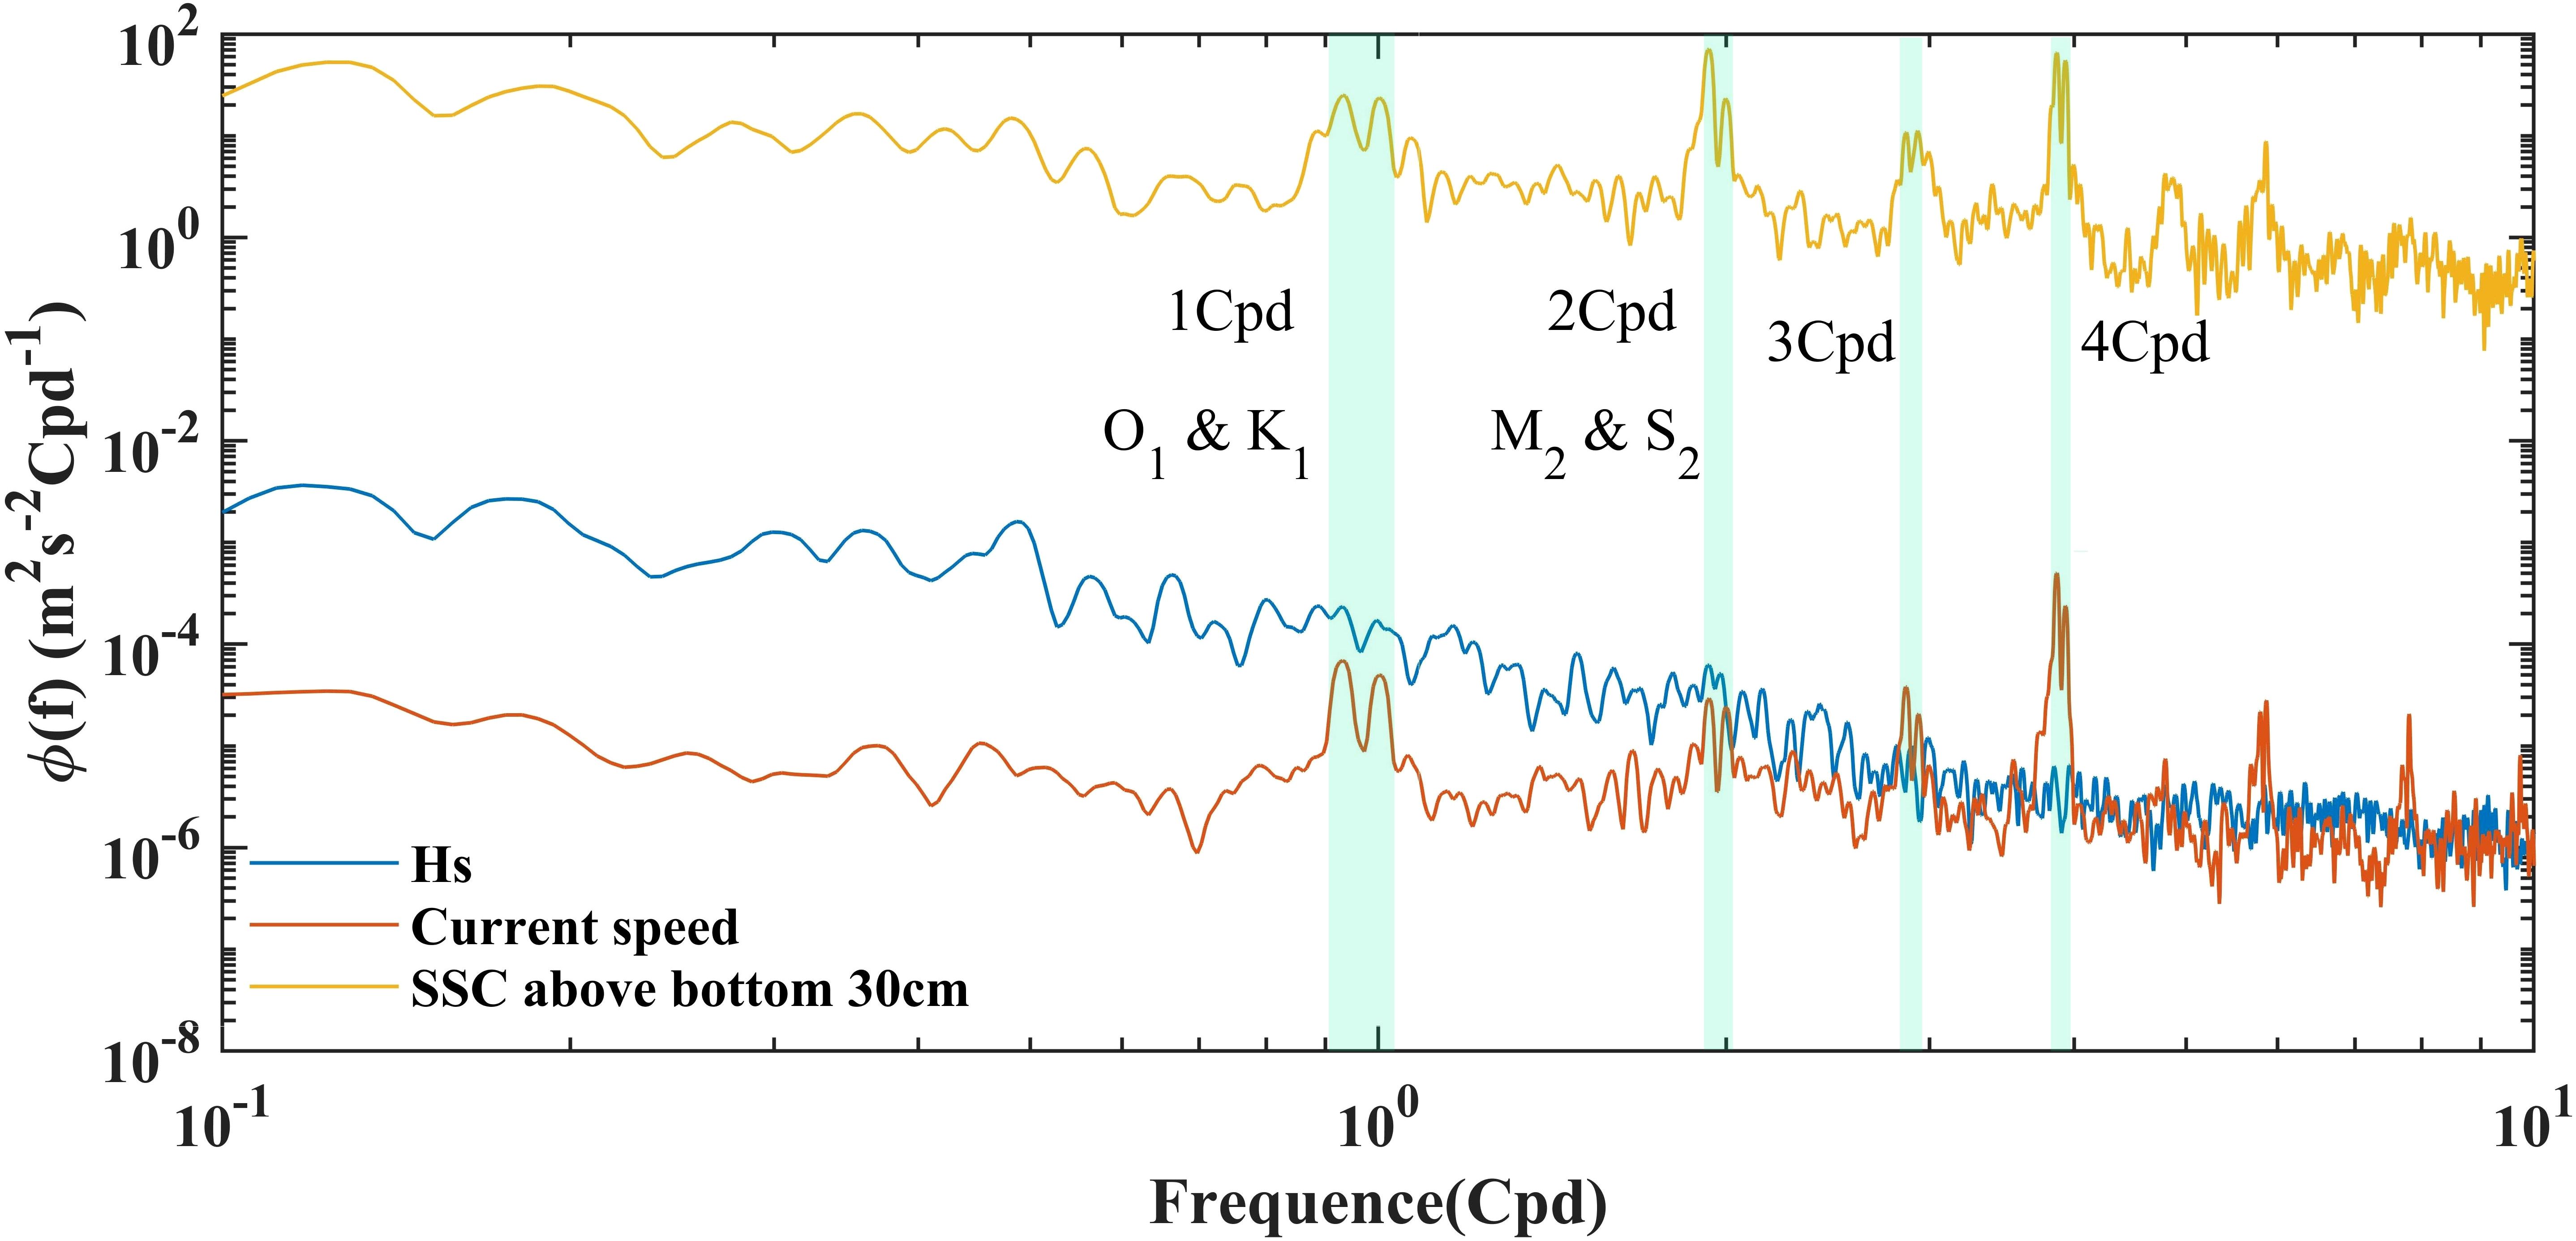
We conducted spectral analyses of the values of Hs, the velocity of the bottom current, and the SSC 30 cm above the seabed at a temporal resolution of 1 h by using the fast Fourier transform (FFT; Figure 4). The spectral peaks of the SSC at 1 cpd (cycle per day), 2 cpd, approximately 3 cpd, and nearly 4 cpd corresponded closely with the spectrum of velocity of the bottom current. The diurnal tidal components, O1 and K1, and the semi-diurnal components, M2 and S2, were aligned with the high spectral values, which shows that variations in the SSC in the BBL were significantly influenced by tidal cycles.
We analyzed values of Hs and the velocity of the bottom current to assess the impacts of the waves and currents on sediment resuspension in the BBL. Values of both exceeding 95% were used to characterize strong waves and currents, while the value of the SSC 30 cm above the seabed served as the indicator of sediment resuspension. The statistics on frequency illustrated in Figure 5A reveal that the average was 0.49 Pa under high-velocity currents and large values of Hs, and was markedly higher than . Consequently, strong currents and waves yielded an average SSC of 302.35 mg/L (Figure 5A). The average was 0.40 Pa in scenarios involving strong waves and weak currents, while the average SSC was 127 mg/L (Figure 5B). Conversely, the average was 0.16 Pa while the SSC was 100.89 mg/L under strong currents and weak waves (Figure 5C), while the average was 0.09 Pa and the SSC was only 31.26 mg/L under weak currents and waves (Figures 5D, E). Furthermore, the coefficient of the correlation between and was 0.82, while that of the correlation between and was only 0.58 (Figure 5F).
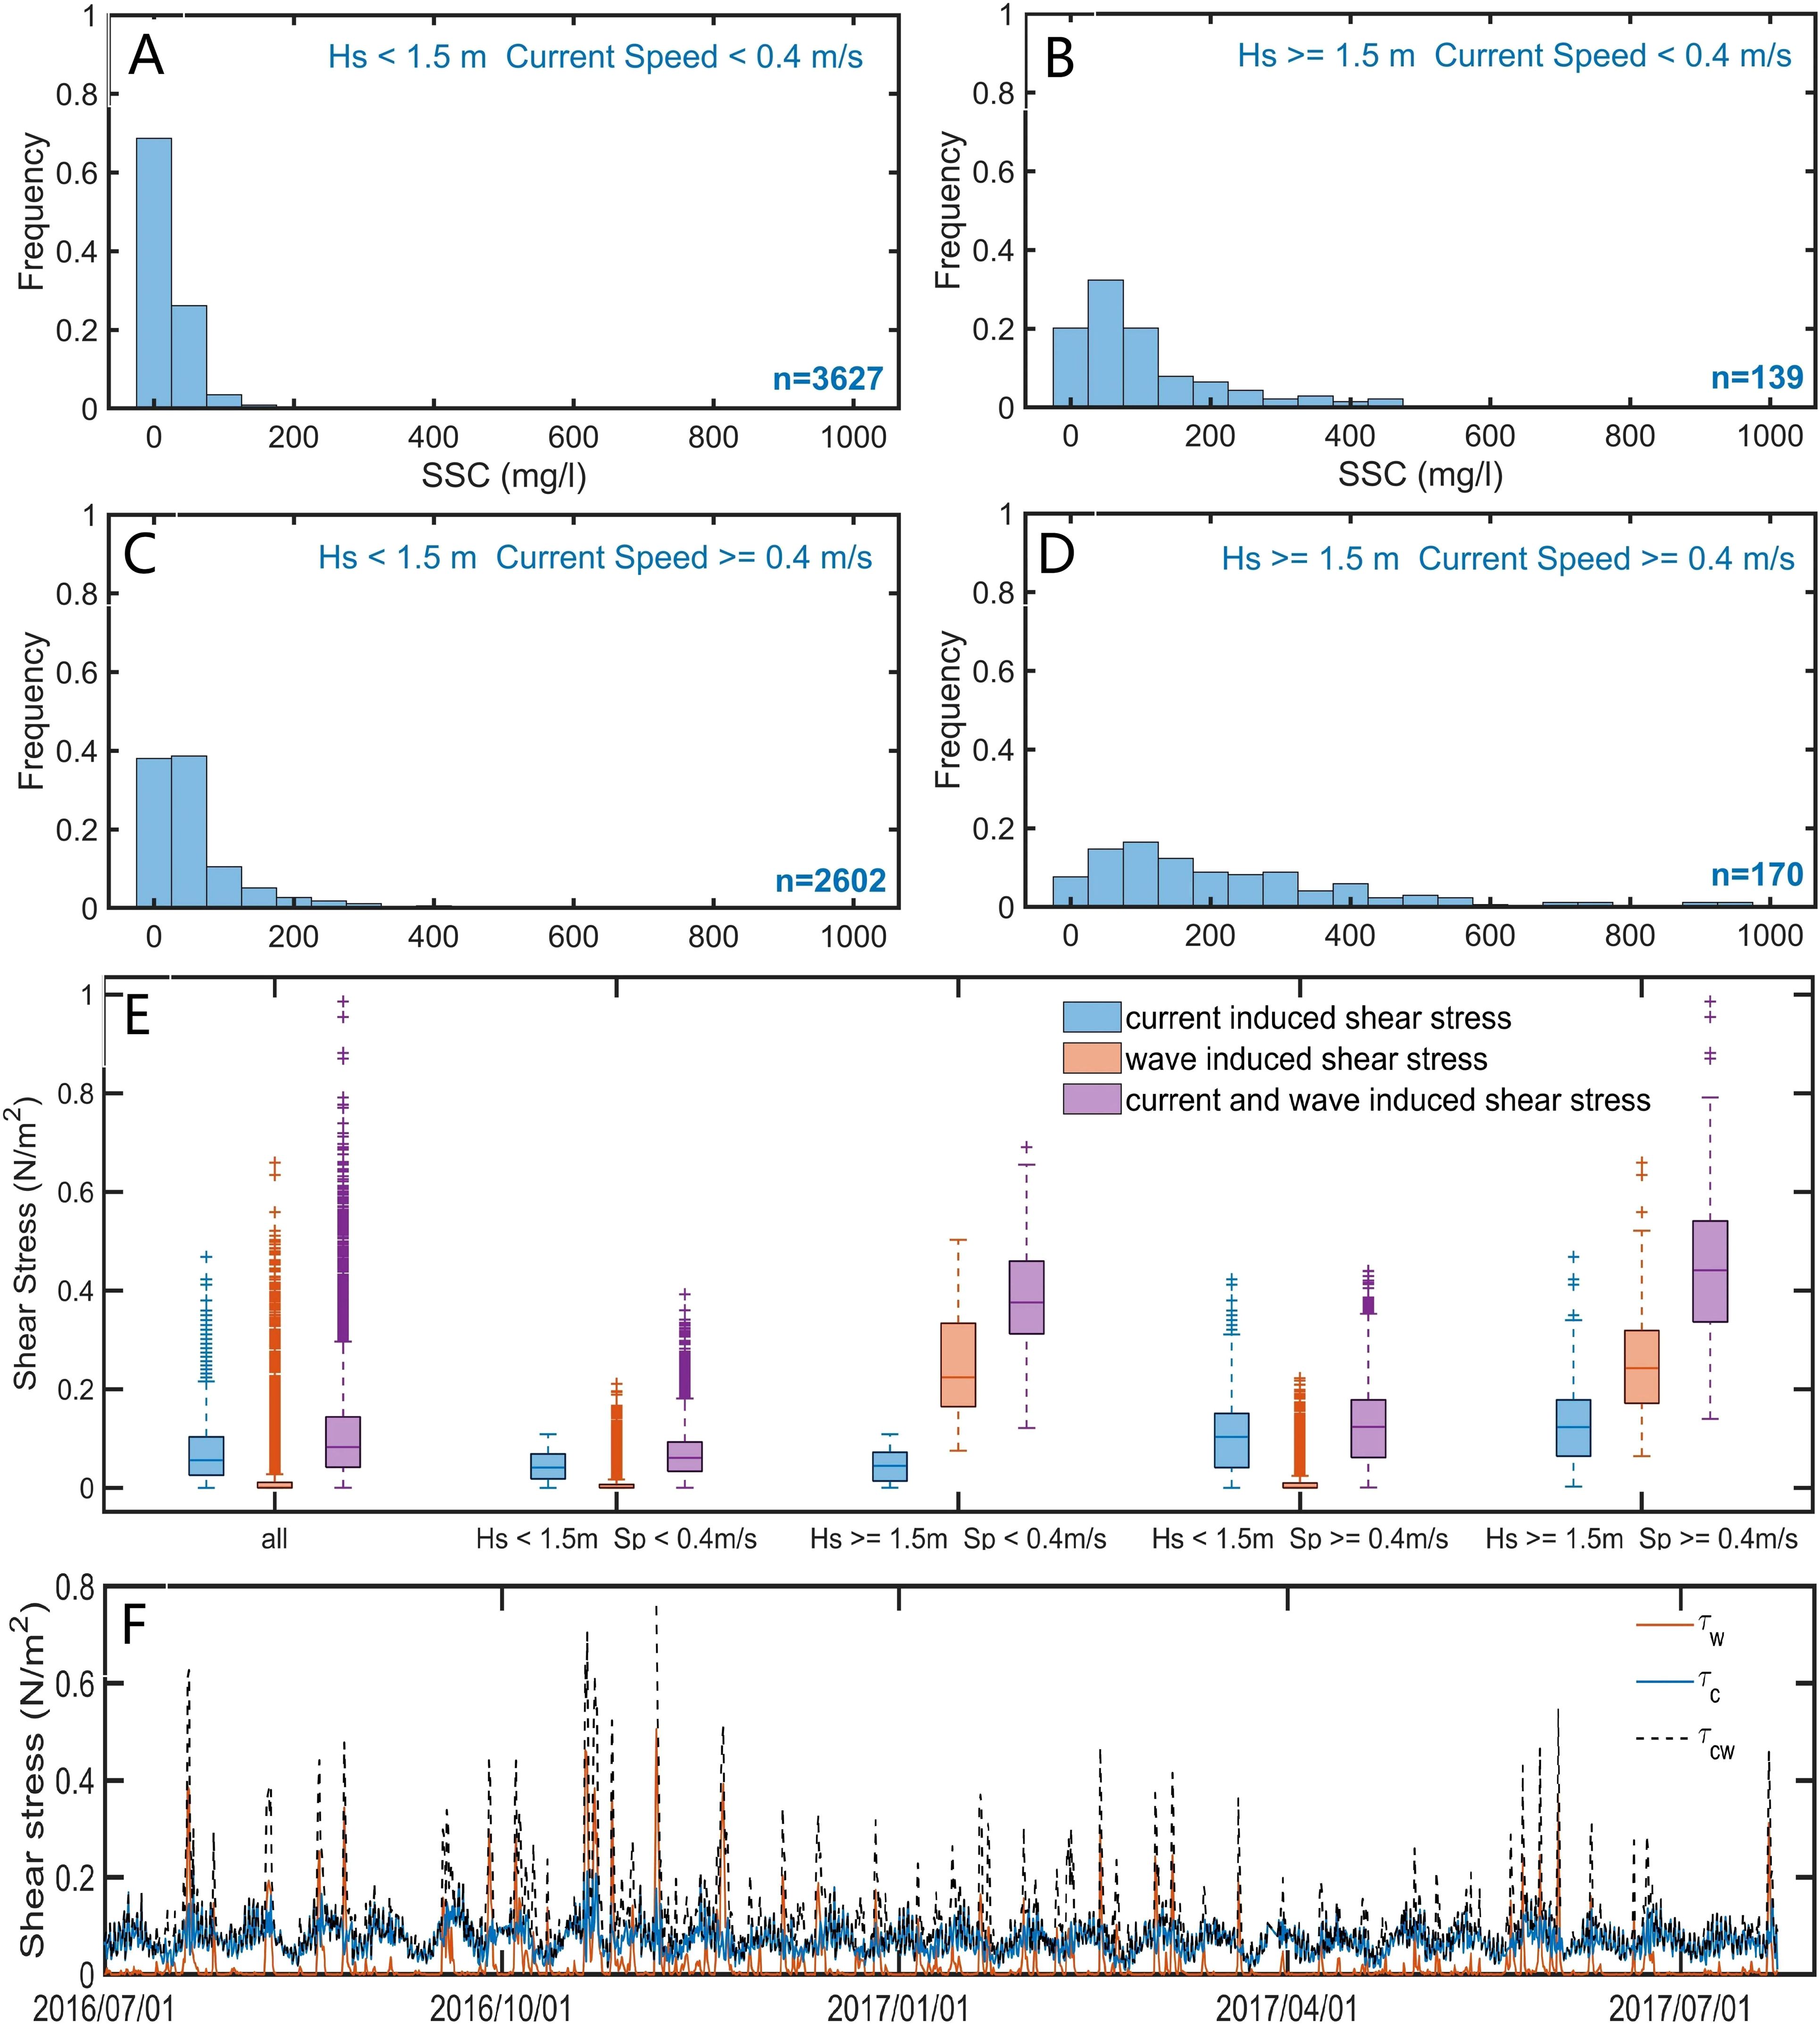
Figure 5. Statistical values of SSC under varying wave and current conditions at BH02 station. (A) Small waves and currents. (B) Strong waves and small currents. (C) Small waves and strong currents. (D) Strong waves and currents. (E) Statistical values of wave-induced shear stress, current-induced shear stress, and wave-current induced shear stress under different wave and current conditions at station BH02. n represents the number of data in this case. (F) The time series of bottom shear stress.
The average values of during flood tides and ebb tides were 0.12 Pa and 0.10 Pa, respectively (Figure 6C), while the corresponding values of the average SSC were 57.10 mg/L and 37.42 mg/L (Figure 6B). The SSC was thus 1.53 times greater during flood tides than during ebb tides, where this can be partly attributed to stronger currents. The ratios of the SSC to were 0.75 and 0.56 during flood tides and ebb tides, respectively. Under an equivalent bottom shear stress, the value of the SSC during flood tides was 1.34 times higher than that during ebb tides (Figure 6A). This shows that the direction of the current, in addition to its velocity, significantly influenced the modulation of the SSC within the BBL (Figure 6D).
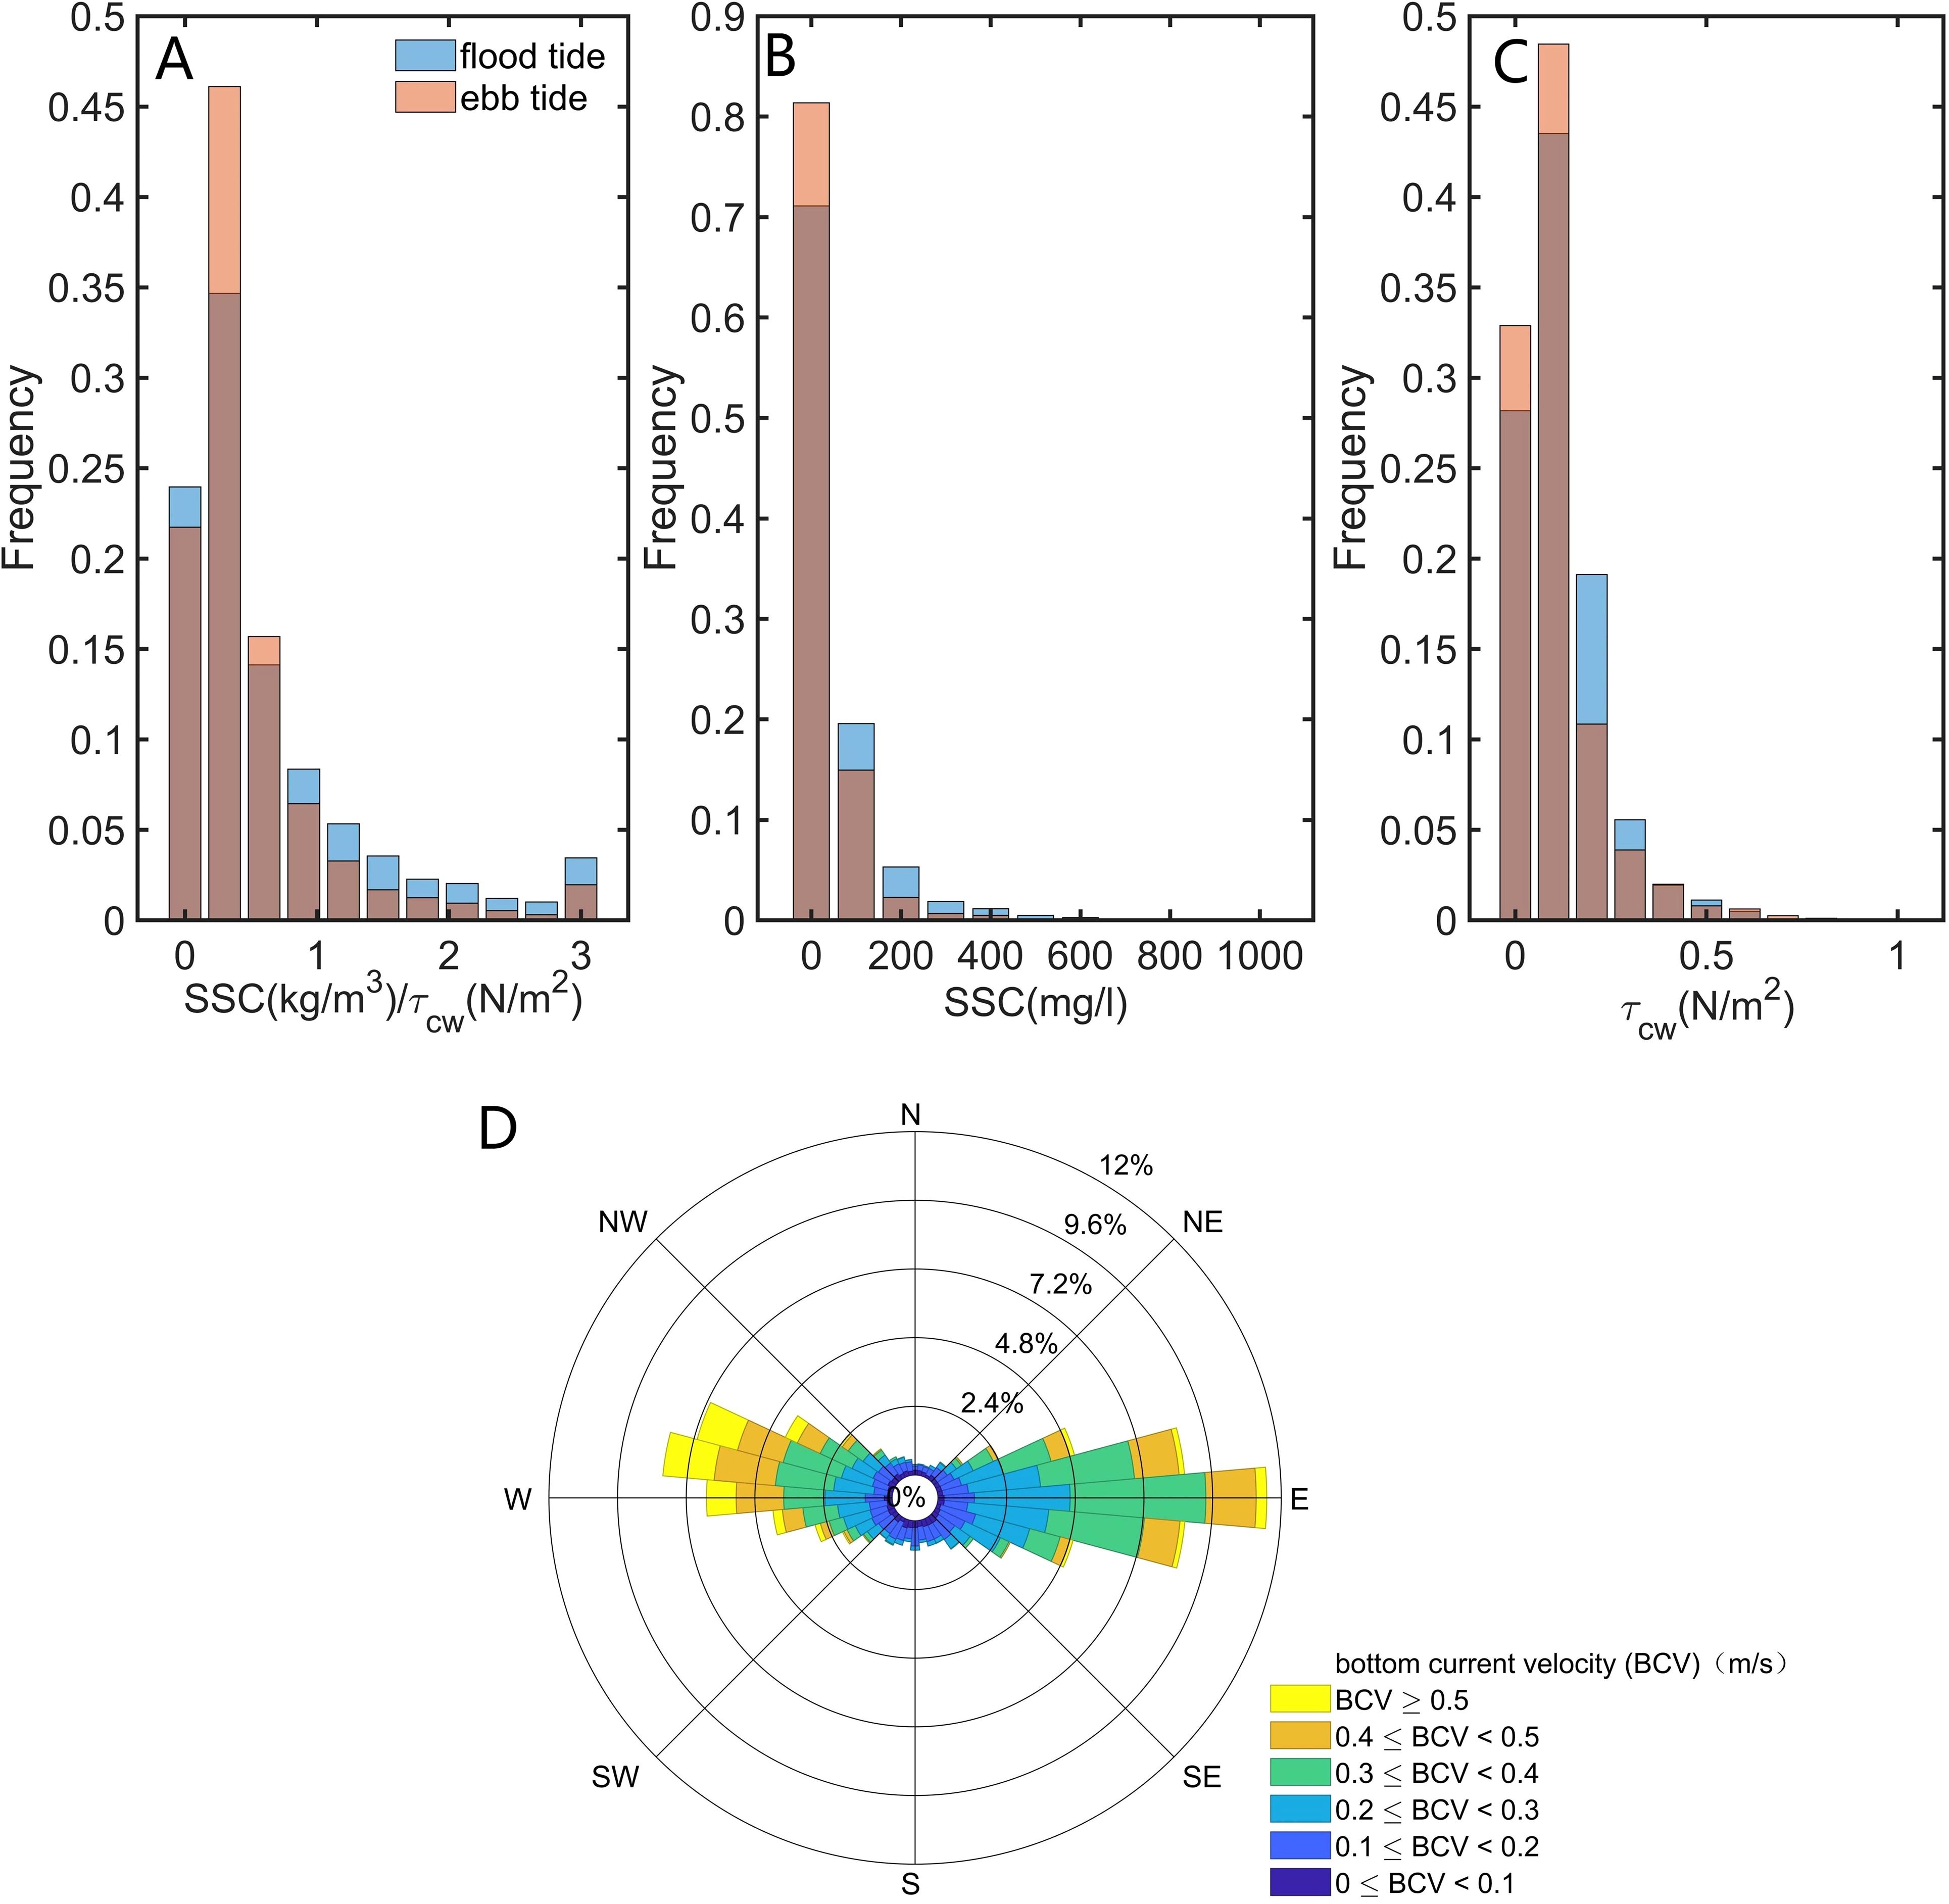
Figure 6. Statistical values of the erosion rate (A), SSC (B), and wave-current induced shear stress (C)during flood and ebb tides at BH02 station. The brown bars indicate the overlap of the flood tide process and ebb tide process. (D) Rose diagram of bottom current.
3.2 Characteristics of FML
The continuous profile of the SSC over a year clearly illustrated a highly concentrated bottom layer (SSC > 10 g/L) 4–12 cm above the seabed. This is referred to as the FML (Figure 7A). High-resolution vertical profiles of the SSC revealed four scenarios—no FML, and FMLs with thicknesses of 4 cm, 8 cm, and 12 cm (Figure 7D)—that led to a clear delineation of the boundaries of the FML. No FML was observed at station BH02 from August 1, 2016 to October 19, 2016, while high-velocity waves (0.15 m/s) and a strong bottom current persisted (Figures 7B, C). The FML appeared on October 20, 2016, and persisted until the observation period ended on July 23, 2017 (Figure 7A). Moreover, Figure 7C shows that the depth of water exhibited seasonal variations that were primarily driven by the atmospheric pressure, wind, and temperature.
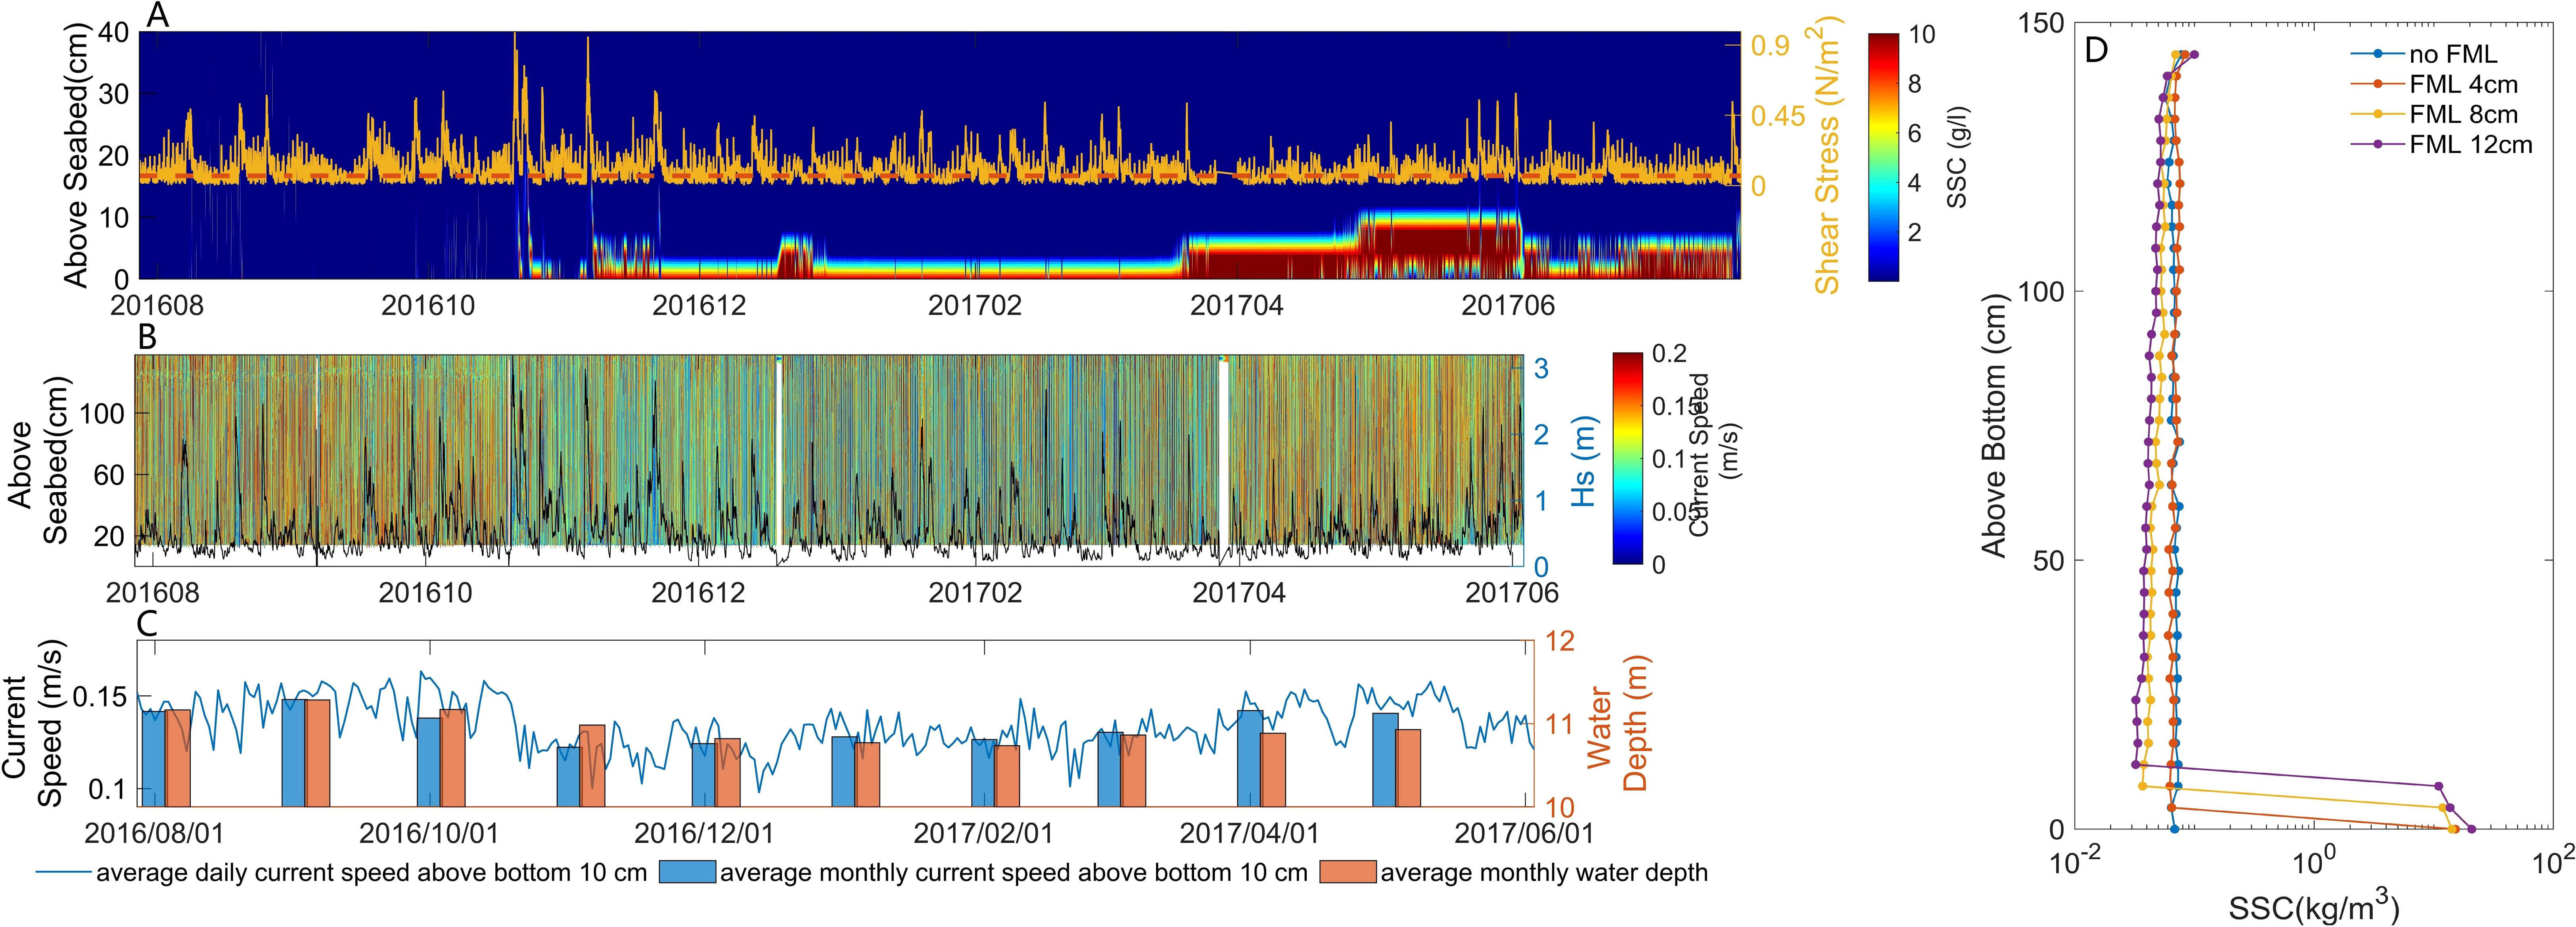
Figure 7. Time series of SSC and current velocity at BH02 station. (A) Time series of SSC within 40 cm above the seabed. The red dashed line indicates critical shear stress and the yellow line indicates the time series of wave-current induced shear stress . (B) Time series of current velocity and Hs in BBL. (C) Daily average current velocity time series, monthly average current velocity statistics at 10 cm above the seabed, and monthly average water depth. (D) High-resolution vertical profile of SSC.
3.3 Formation of FML
Two significant wind-related processes, with peak velocities of 14.5 m/s and 14.9 m/s, were observed from October 20 to 22, 2016, and led to extreme tidal ranges of 3.8 m and 4 m, respectively (Figure 8A). The SSC in the BBL increased rapidly as the value of Hs reached 3.2 m (Figure 8B), and this was accompanied by vigorous currents throughout the BBL. The FML was formed after October 24 (Figure 8E), and persisted until the end of the observation period (July 23, 2017; Figure 7A fig).
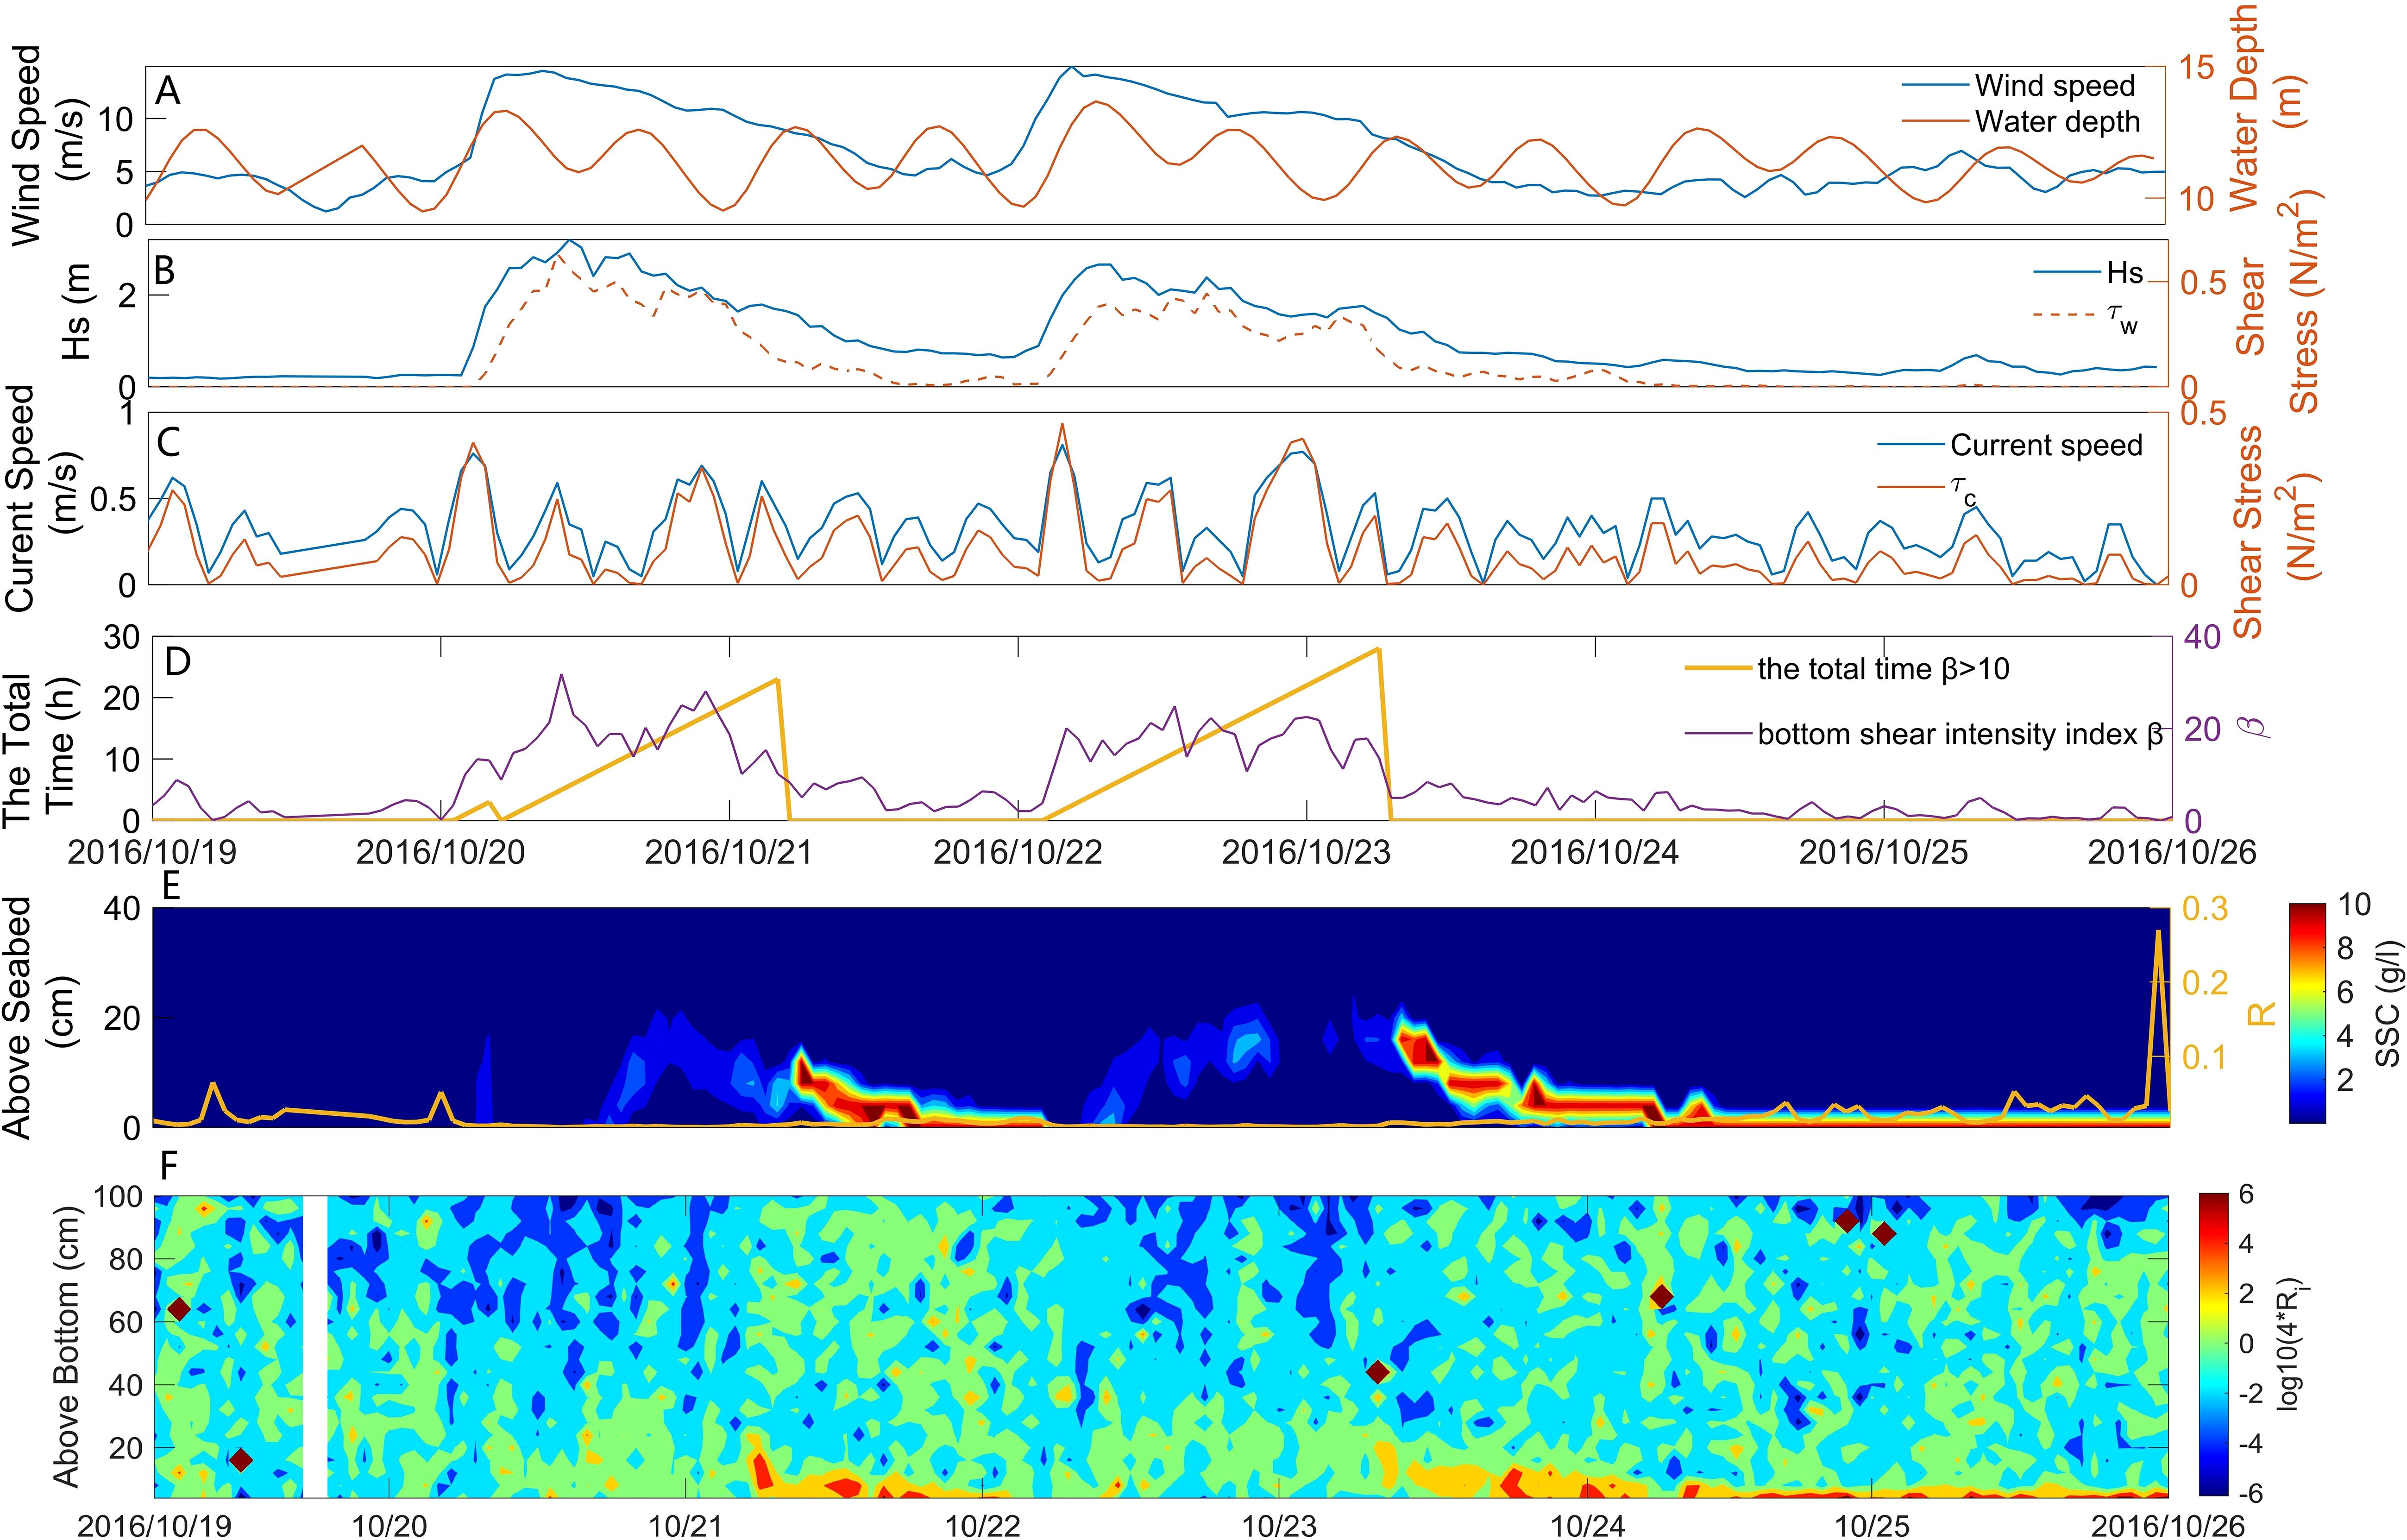
Figure 8. Time series of elements at BH02 station from October 19 to October 25, 2016. (A) Time series of wind speed and water depth. (B) Time series of Hs and . (C) Time series of bottom current velocity and . (D) Time series of the bottom shear intensity index β and the total time β >10. (E) SSC time series within 40 cm above the seabed alongside the Rouse parameter series (yellow line). (F) Time series of log10(Ri *4) within 100 cm above the seabed.
At 3:00 am on October 20, the average velocity of the current reached 0.76 m/s, and led to a high SSC in the BBL with an average concentration of 719.81 mg/L (Figures 8C, E). The higher value of the SSC in the lower layer compared with that in the upper layer suggests that the resuspended sediment on the seabed was the primary source of the SSC. The velocity of the current reached 0.59 m/s during the subsequent, rapid flood tide, with values of Hs and of 2.92 m and 0.99 Pa, respectively. The latter significantly exceeded in value (0.03 Pa). The index of intensity of bottom shear β surpassed 10 for 23 h (Figure 8D). The combination of high-velocity waves and strong currents caused the value of β to exceed 20 several times (Figure 8D), with a high SSC observed throughout the water column. A Rouse parameter smaller than 0.01 for 35 h suggested pronounced effects of turbulence and the intense resuspension of the sediment, which created conditions favorable for the formation of the FML. As decreased to 0.3 Pa (with β falling below 10), the FML formed, and its height decreased with the value of .
The velocity of the flood-induced current was 0.81 m/s while that of Hs was 1.99 m at 4:00 am on October 22, 2016. This yielded a value of of 0.77 Pa. The value of β was above 10 for 28 h, and led to the destruction of the FML. A Rouse parameter smaller than 0.01 for 34 h suggested significant resuspension of the sediment, which in turn caused the average SSC to surge to 530.20 mg/L in the BBL. As Hs decreased, fell below on 10 occasions (β was below 10). This caused the FML to reappear, although its height decreased with the reduction in . After October 24, 2016, the value of Hs stabilized at below 0.6 m, while the thickness of the FML decreased, and it stabilized 4 cm above the seabed.
3.4 Destruction of FML
The velocity of wind increased to 12.25 m/s, Hs was 2.48 m, the tidal range was 2.90 m, while the velocity of the current was 0.49 m/s from 6:00 am to 9:00 am on July 21, 2016 (Figures 9A, B). The maximum was 0.54 Pa, while β persisted above 10 for 13 h (Figure 9C). The Rouse parameter had a value smaller than 0.01 for 16 h, indicating strong turbulence-induced mixing (Figure 9D). The FML was unstable during this period owing to strong ebb currents, which caused it to dissipate into the upper saltwater and ultimately vanish (Figure 9D). As Hs and the velocity of the current decreased, β fell below 10 to facilitate the deposition of the suspended sediment. However, was greater than , because of which the suspended sediment accumulated on the seabed. This caused the FML to recover (Figure 9D).
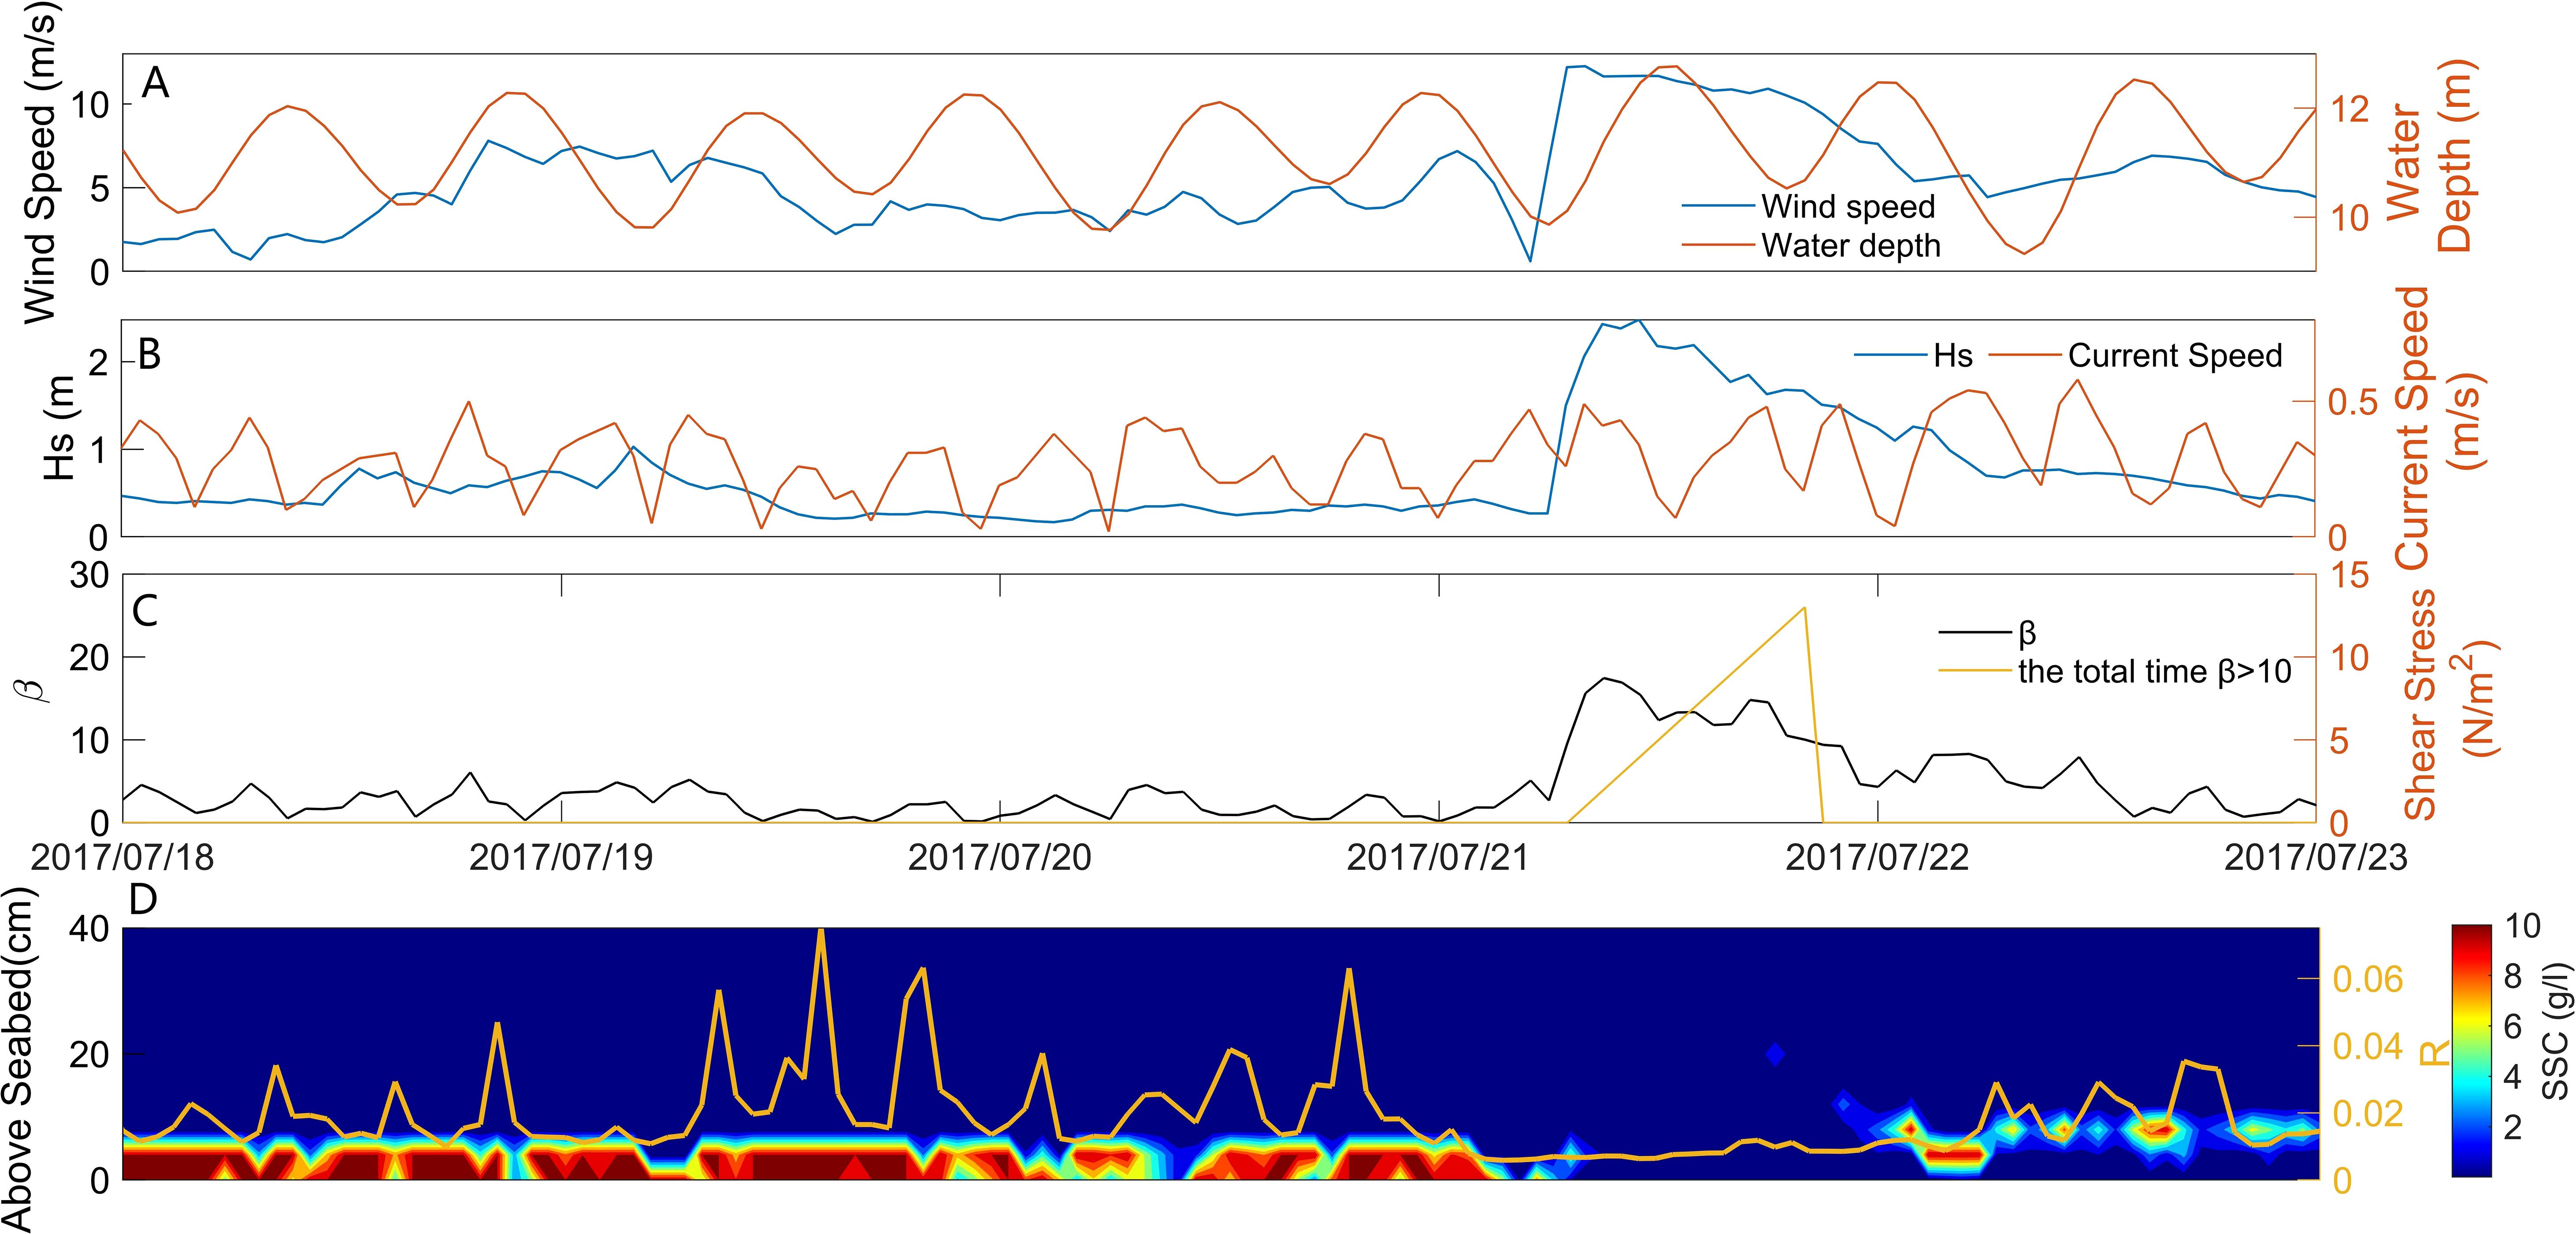
Figure 9. Time series of elements at BH02 station from July 18 to July 22, 2017. (A) Time series of wind speed and water depth. (B) Time series of Hs and bottom current velocity. (C) The bottom shear intensity index and the total time β >10. (D) Time series of SSC within 40 cm above the seabed and Rouse parameter series (yellow line).
The data on the SSC were classified into three categories based on the values of β (Figure 10). The SSC measured 30 cm above the seabed represented the resuspension of the sediment due to the absence of the FML at this height. When β was below one, the average SSC was 22.75 mg/L, while the average Hs and velocity of the current were 0.36 m and 0.18 m/s, respectively. As the value of β fluctuated from one to 10, the average SSC increased to 50.42 mg/L. When β exceeded 10, the average SSC surged to 176.42 mg/L, which was significantly higher than that in previous instances during the study period. Further, the average Hs and velocity of the current were 1.72 m and 0.38 m/s, respectively. Consequently, the severe effects of shearing of the waves and currents instigated considerable sediment resuspension when β surpassed 10. This led to the disruption of the FML.
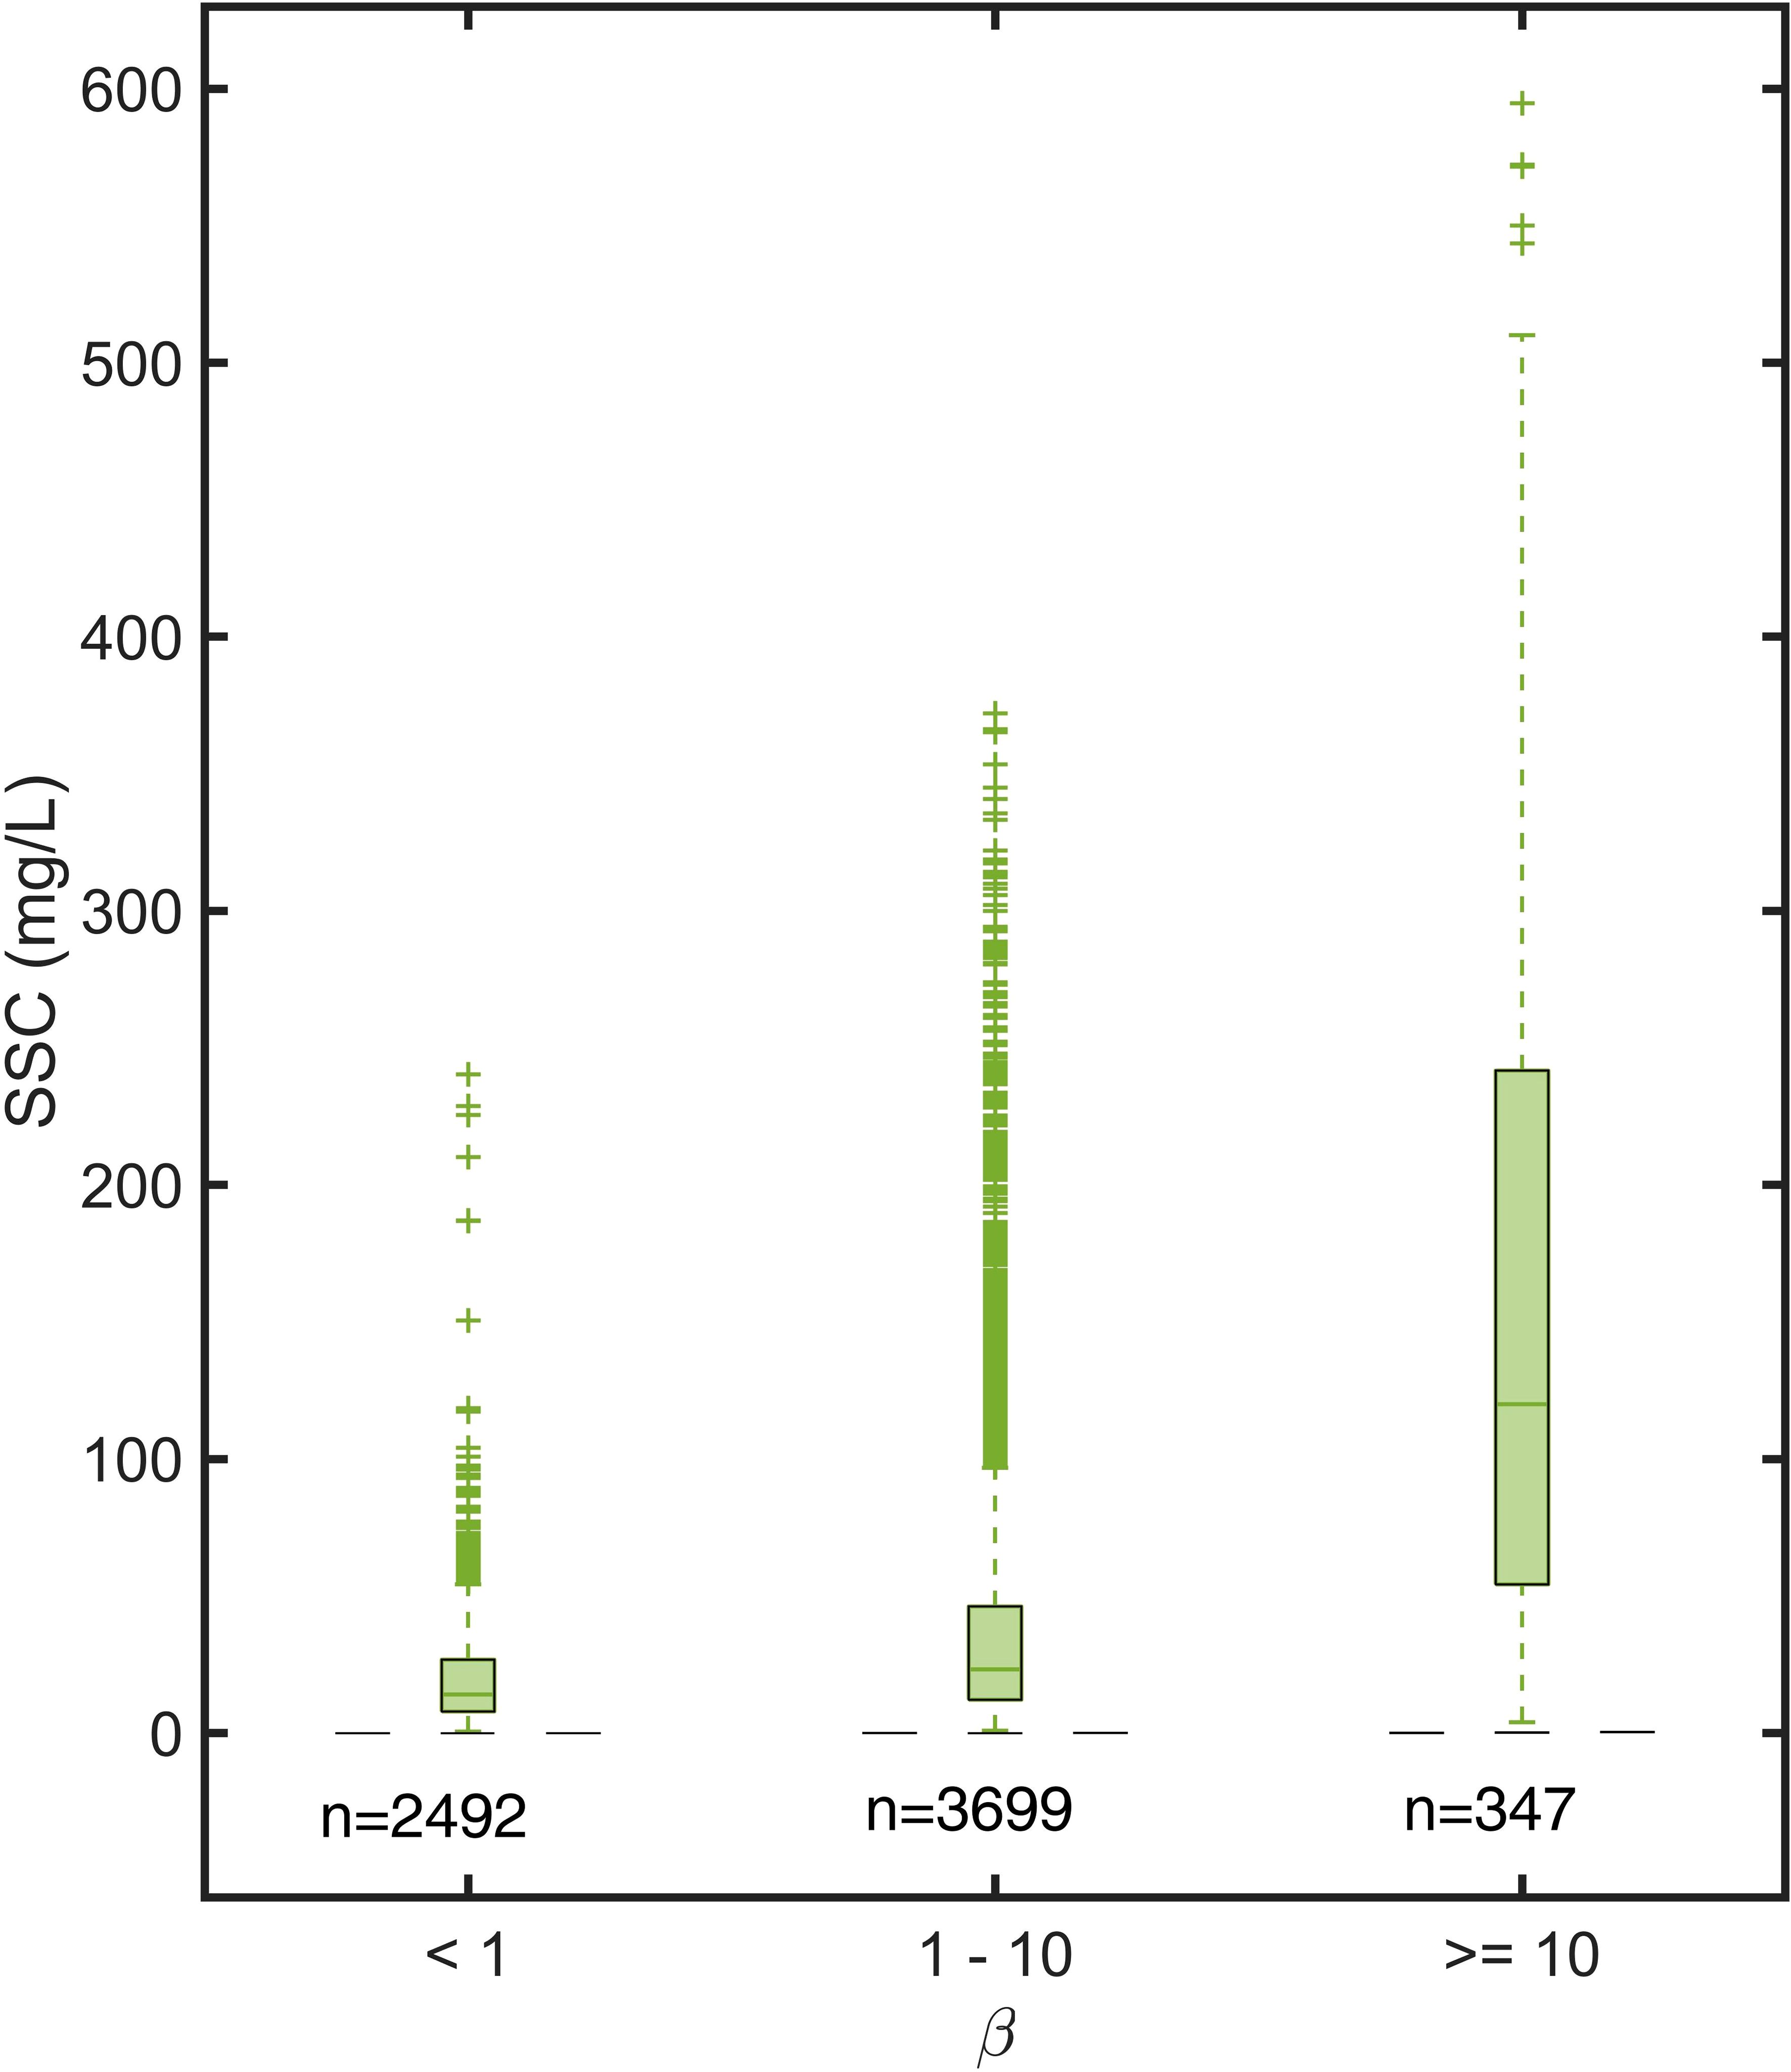
Figure 10. Statistical values of SSC under different conditions at BH02 station. n denotes the number of data in this case and β represents the bottom shear intensity index.
The FML remained stable from October 24, 2016 onward (Figure 7A). When β was greater than 10, only 21% of the data suggested the presence of the FML, primarily owing to the short duration of instances in which β exceeded 10. When β continuously exceeded 10 (strong currents coupled with high-velocity waves), this led to significant sediment resuspension and the disappearance of the FML. As Hs and velocity of the current decreased to β below 10, sediment resuspension diminished, allowing for gradual accumulation on the seabed.
4 Discussion
4.1 Control of wave–current coupling over SSC in BBL
Bed shear stress is a crucial parameter in estimating the sediment transport and SSC variation, impacted by waves, currents, and their combinations (Grant and Madsen, 1979; Wiberg, 1995; MacVean and Lacy, 2014; Brand et al., 2010; Heath et al., 2016). We separately analyzed typical and extreme wave-related conditions. When was below 0.1 N/m2, the correlation coefficient between and was 0.81, indicating that the tidal cycle predominantly governed the SSC in the BBL. Conversely, during storm events in which exceeded 0.1 N/m2, the correlation coefficient between and was 0.85, signifying that the action of waves dominated the SSC in the BBL in this case. In shallow waters, strong waves contributed more significantly to sediment resuspension than strong currents (Larcombe et al., 1995; Uncles and Stephens, 2010).
Localized resuspension and horizontal advection of sediment are two main sources for suspended sediment at a fixed observation point (Weeks et al., 1993; Yu et al., 2012; Xiong et al., 2017). It was higher during flood tides than during ebb tides in the western Bohai Bay, which highlights the dominance of the tidal dynamics of floods (Chen et al., 2019). The interactions between the waves and currents led to the resuspension of a substantial amount of sediment near the Yellow River estuary (Liu et al., 2016). The water mass characterized by a high SSC spread to the western and northern Bohai Bay during flood tides (Zhou et al., 2017; Sun et al., 2020; Zhao et al., 2022). Consequently, the westward current contributed to a larger supply of sediment through advection (Figure 6D). This, coupled with enhanced hydrodynamic forces and sediment resuspension, led to a higher SSC during flood tides compared with that during ebb tides.
4.2 Mechanism of formation and destruction of FML
Past studies have claimed that the FML lasts for a short time. For instance, Tang et al. (2023) reported that fluid mud near a river delta persisted for only 1.5 days. Yu et al. (2017) observed that the appearance of fluid mud was non-periodic, while Shi (2001) have claimed that the SSC generally peaks during surges in floods and ebbs as well as a slack in the former. In a large wave event during the neap tide, Tang et al. (2019) found the FML with thickness of 4-16 cm near the seabed. The FML is formed in the BBL in these cases. However, our results revealed a long-term and stable FML in shallow marine environments that persisted from October until the end of the study period (Figure 11A). The FML thus lasted much longer than has been reported in past work (Tang et al., 2023, 2019; Yu et al., 2017; Shi, 2001; Liu et al., 2022), primarily owing to the significantly smaller grain size of the seabed sediment in the study area compared with areas considered in past research. Therefore, the critical erosion-induced shear stress was lower, and this allowed weaker waves and currents to sustain the FML. We calculated log10(Ri *4) within 100 cm above the seabed (Figures 8F, 11B), and found that its values were lower during storm events preceding the formation of the FML (Figure 8F). This suggests that the waves responded rapidly to intense winds, and this led to a rapid increase in as well as sediment resuspension (Ha and Park, 2012; Tang et al., 2023). As the hydrodynamic forces subsequently decreased, the value of log10(Ri *4) increased (Figure 11B) to reflect a stable water column. The stratification of the water column was more pronounced than the shear instability induced by the current, where this hindered vertical mixing and thus contributed to the maintenance of a stable FML (Tang et al., 2023). The BBL within 1 m of the seafloor can also be stably stratified by suspended sediment (Kineke et al., 1996; Trowbridge and Elgar, 2003).
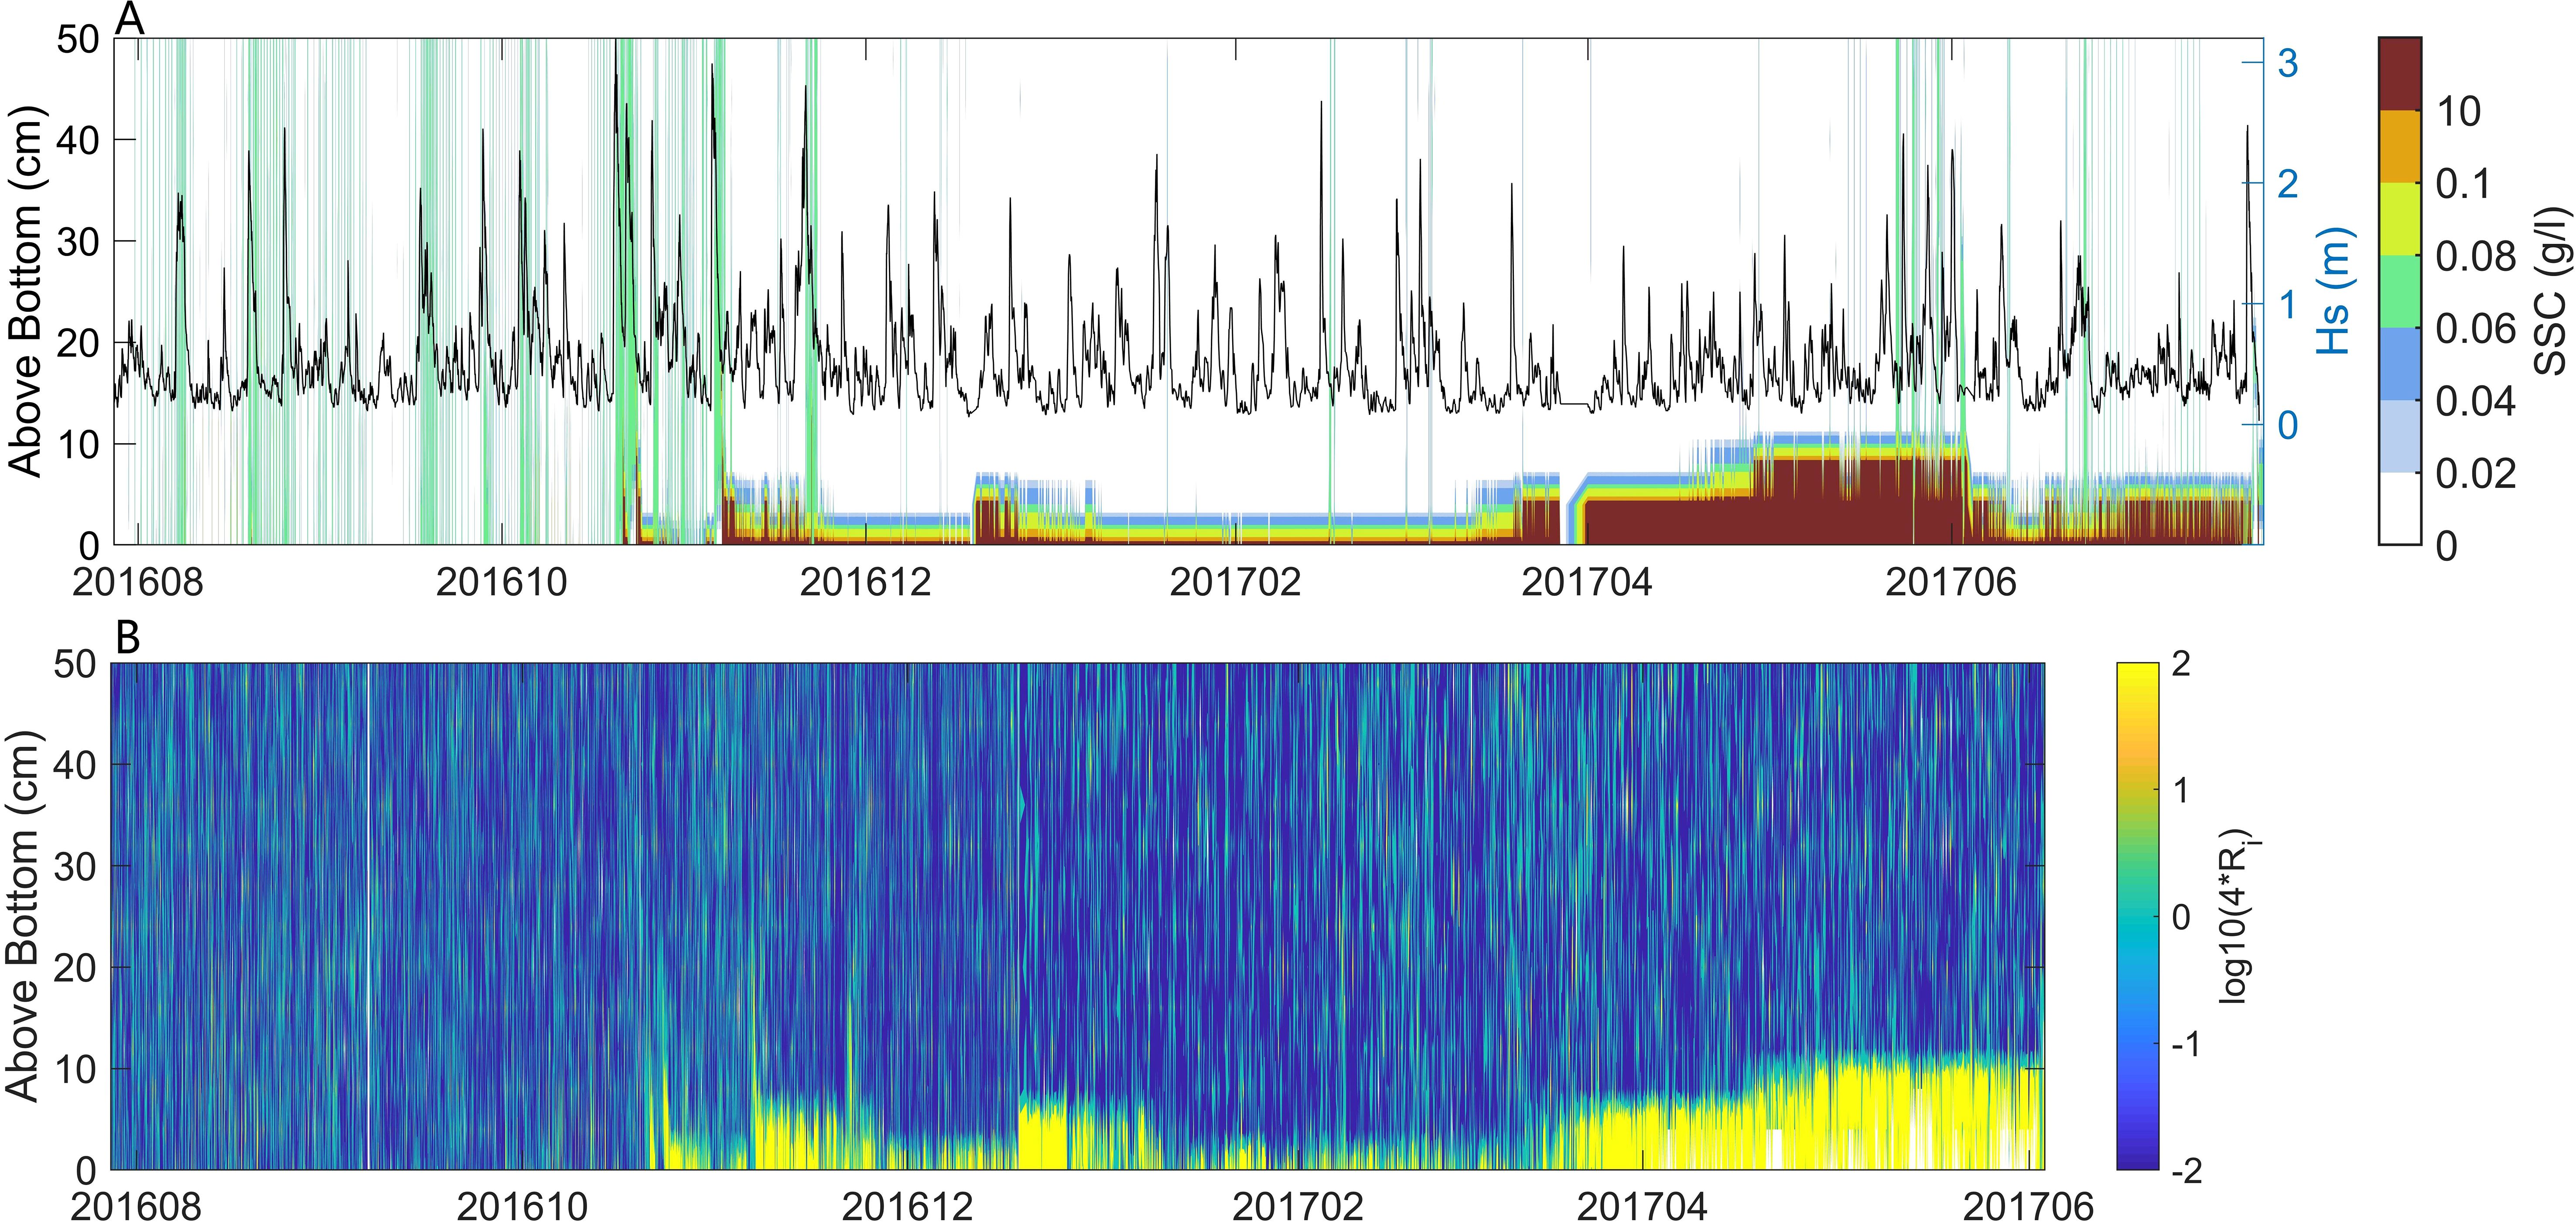
Figure 11. Time series of SSC, Hs and log10(Ri *4) within 50cm above the seabed. (A) SSC and Hs. (B) log10(Ri *4).
Strong wave–current coupling is prevalent in the fine sedimentary regions of Bohai Sea in the Yellow River Delta (Liu et al., 2016; Jiang et al., 2020). Annual variations in the wind, waves, and tidal currents in the area frequently facilitate the formation of the FML (Liu et al., 2022). Wave-induced liquefaction generally leads to the formation of fluid mud (Traykovski et al., 2007; Flores et al., 2018). Tang et al. (2019) have shown that sustained periods of strong waves (longer than 15 h) are essential for the formation of the FML. Significant sediment resuspension occurs during storm events, coupled with strong currents on fine-grained seabeds, when the value of β surpasses 10 for longer than 20 h, where this likely occurs owing to wave-induced liquefaction. When β falls below 10 after a storm, the FML is formed, and can persist for an extended period. The long-term maintenance of the FML can be attributed to two primary factors. On the one hand, the interactions among flocs within the fluid mud could hinder he settling velocity of the fine particles, thus preventing the settlement of highly concentrated suspended sediments (Dyer, 1986; Villaret and Trowbridge, 1991; Whitehouse et al., 2000). On the other hand, sediment with smaller particle sizes (< 0.05 mm) is particularly resistant to deposition after having been suspended (Hjulstrom, 1955). When β exceeded 10 for longer than 10 h, the sediment within the FML underwent significant resuspension, which in turn increased the SSC throughout the BBL and subsequently disrupted the FML. Conversely, when β remained below 10, a new FML was formed. A substantial reduction in the maximum wave–current-induced shear stress can also result in the dissipation of the FML (Tang et al., 2019). If the Rouse number remains below 0.01 for over 30 h while β exceeds 10 for longer than 10 h, the sediment on the seafloor is vigorously resuspended into the water column, which makes it difficult for fine particles to settle after suspension (Whitehouse et al., 2000). This situation may foster conditions that are favorable for the formation of the FML, if one did not previously exist. In case the FML is already present, it may be destroyed by this process.
5 Conclusions
In this study, we used high-resolution observational data on the water level, waves, velocity and direction of the current, and SSC from station BH02 in Bohai Bay over one year to investigate the mechanisms of formation and disappearance of the FML in the BBL under the influence of wave–current interactions. We also calculated the shear stress, Richardson number Ri, and Rouse parameter to this end. We identified a thin (4–12 cm thick) and stable (persisting for almost one year) FML on the seabed in shallow marine environments. The following conclusions can be drawn from our results:
Sediment resuspension on silty seabeds can lead to the formation of fluid mud, where this process is closely associated with wave–current interactions. When was below 0.1 N/m2, the SSC in the BBL was predominantly controlled by the patterns of currents following tidal cycles. Conversely, during storm events in which exceeded 0.1 N/m2, the SSC in the BBL was predominantly controlled by waves. Strong waves contributed more significantly to sediment resuspension than strong currents.
For coupled large storm and current events on the fine-grained seabeds, instances when β exceeded 10 for over 20 h coupled with the Rouse number remaining below 0.01 for over 30 h, resulted in substantial resuspension of fine-grained sediments, thereby supplying material for the formation of the FML. As β decreased to below 10 following the storm, the sediment gradually settled, and this led to the formation of a stable FML. However, if β surpassed 10 for longer than 10 h and the Rouse number was smaller than 0.01 for longer than 30 h, the sediment within the FML underwent significant resuspension that destabilized it, and caused it to eventually disappear. The sustained maintenance of the FML can be attributed to two main factors. First, the interactions among flocs within the fluid mud significantly hindered the settlement of highly concentrated suspended sediment. Second, sediments with smaller particle sizes struggle to settle after having been suspended. Values of the Richardson number Ri indicated that the stratification of water was more pronounced than the instability induced by current shear, thereby inhibiting vertical mixing and ultimately promoting the stability of the FML.
The findings of this study differ from those of past work in the following ways: Previous studies have claimed that large waves caused by storms or strong currents during rapid flood and ebb tides are responsible for the formation of the FML, which persists for only a short time. However, the fine particle size of the seabed sediment in the study area caused the FML to persists for a significantly longer period than has been reported in past work. It is important to recognize that our analysis is based solely on statistical observational data. This highlights the need for further investigation based on flume experiments to clarify the empirical trends reported here.
Data availability statement
The original contributions presented in the study are included in the article/supplementary material. Further inquiries can be directed to the corresponding author.
Author contributions
SYL: Conceptualization, Data curation, Formal analysis, Writing – original draft, Writing – review & editing. GL: Conceptualization, Formal analysis, Funding acquisition, Project administration, Resources, Supervision, Validation, Writing – review & editing. XL: Data curation, Formal analysis, Methodology, Software, Writing – original draft. LQ: Conceptualization, Formal analysis, Supervision, Validation, Writing – review & editing. NW: Software, Supervision, Validation, Writing – review & editing. SDL: Formal analysis, Investigation, Methodology, Supervision, Validation, Writing – review & editing. XW: Data curation, Investigation, Software, Writing – original draft. DY: Data curation, Methodology, Software, Writing – original draft. LZ: Data curation, Methodology, Software, Writing – original draft.
Funding
The author(s) declare financial support was received for the research, authorship, and/or publication of this article. This study was jointly supported by the National Natural Science Foundation of China (grants 42121005, 41806072), and Taishan Scholars Project (GXLI). Any users of the materials are required to clearly acknowledge the support of Ocean University of China.
Conflict of interest
Author XW was employed by the company Shandong Continental Shelf Marine Technology Co., Ltd.
The remaining authors declare that the research was conducted in the absence of any commercial or financial relationships that could be construed as a potential conflict of interest.
Generative AI statement
The author(s) declare that no Generative AI was used in the creation of this manuscript.
Publisher’s note
All claims expressed in this article are solely those of the authors and do not necessarily represent those of their affiliated organizations, or those of the publisher, the editors and the reviewers. Any product that may be evaluated in this article, or claim that may be made by its manufacturer, is not guaranteed or endorsed by the publisher.
References
Araújo M. (2004). Erosion mechanisms in marine sediments (Portugal: Ph.D. Thesis, University of Minho).
Azhikodan G., Yokoyama K. (2018). Sediment transport and fluid mud layer formation in the macro-tidal Chikugo river estuary during a fortnightly tidal cycle. Estuarine Coast. Shelf Science. 202, 232–245. doi: 10.1016/j.ecss.2018.01.002
Bassett C., Lavery A. C., Ralston D., Geyer W. R., Jurisa J. T., Thomson J., et al. (2023). Acoustic backscattering at a tidal intrusion front. Prog. oceanography. 219, 103167. doi: 10.1016/j.pocean.2023.103167
Brand A., Lacy J., Hsu K., Hoover D., Gladding S., Stacey M. (2010). Wind-enhanced resuspension in the shallow waters of South San Francisco Bay: mechanisms and potential implications for cohesive sediment transport. J. Geophys. Res. Ocean. 115, C11024. doi: 10.1029/2010JC006172
Chen D. X., Lan T. F., Pei Y. D., Du J. B., Wang Y. P., Gao J. H. (2019). Hydrodynamics and sediment transport in response to sequential reclamations over subtidal waters near Tianjin Port. Mar. Sci. 10, 113–125. doi: 10.11759/hykx20190225001
Cheng Y. F., Xia J. Q., Zhou M. R., Deng S. S. (2024). Improved formula of sediment transport capacity and its application in the lower Yellow River. J. Hydrology 631, 130812. doi: 10.1016/j.jhydrol.2024.130812
Dyer K. R. (1986). Coastal and Estuarine Sediment Dynamics (Chichester: Wiley). doi: 10.1002/9781118669280.oth1
Flores R. P., Rijnsburger S., Meirelles S., Horner-Devine A. R., Souza A. J., Pietrzak J. D., et al. (2018). Wave generation of gravity-driven sediment flows on a predominantly sandy seabed. Geophysical Res. Letters. 45, 7634–7645. doi: 10.1029/2018GL077936
Ge J. Z., Chen C. S., Wang Z. B., Ke K. T., Yi J. X., Ding P. X. (2020). Dynamic response of the fluid mud to a tropical storm. J. Geophysical Research: Oceans. 125, e2019JC015419. doi: 10.1029/2019JC015419
Ge J. Z., Zhou Z. Y., Yang W. L., Ding P. X., Chen C. S., Wang Z. B., et al. (2018). Formation of concentrated benthic suspension in a time-dependent salt wedge estuary. J. Geophysical Research: Oceans. 123, 8581–8607. doi: 10.1029/2018JC013876
Grant W. D., Madsen O. S. (1979). Combined wave and current interaction with a rough bottom. J. Geophys. Res. Ocean. 84, 1797–1808. doi: 10.1029/JC084iC04p01797
Ha H. K., Park K. (2012). High-resolution comparison of sediment dynamics under different forcing conditions in the bottom boundary layer of a shallow, micro-tidal estuary. J. Geophys. Res. 117, C06020. doi: 10.1029/2012JC007878
Hale R. P., Ogston A. S. (2015). In situ observations of wave-supported fluid-mud generation and deposition on an active continental margin. J. Geophys. Res. Earth Surf. 120, 2357–2373. doi: 10.1002/2015JF003630
Hay A. E., Sheng J. (1992). Vertical profiles of suspended sand concentration and size from multifrequency acoustic backscatter. J. Geophysical Res. 97, 15661–15677. doi: 10.1029/92JC01240
Heath M., Sabatino A., Serpetti N., Mccaig C., Murray R. O. H. (2016). Modelling the sensitivity of suspended sediment profiles to tidal current and wave conditions. Ocean Coast. Management. 147, 49–66. doi: 10.1016/j.ocecoaman.2016.10.018
Howard L. N. (1961). Note on a paper of john W. Miles. J. Fluid Mech. 10, 509–512. doi: 10.1017/S0022112061000317
Hu J., Xu J. S., Niu J. W., Dong P., Qin K. K. (2016). A comparative study of suspended sediment concentrations observed with acoustic and optical methods. Coast. Eng. (01), 47–57. doi: 10.1016/S0380-1330(04)70348-2
Inglis C. C., Allen F. H. (1957). The regimen of the Thames estuary as affected by currents, salinity and river flow. Proc. Institution Civil Engineers 7, 827–868. doi: 10.1680/iicep.1957.2705
Jiang M., Pang C. G., Liu Z. L., Jiang J. B. (2020). Sediment resuspension in winter in an exceptional low suspended sediment concentration area off Qinhuangdao in the Bohai Sea. Estuarine Coast. Shelf Sci. 245, 106859. doi: 10.1016/j.ecss.2020.106859
Kineke G. C., Sternberg R. W. (1992). Measurements of high concentration suspended sediments using the optical backscatterance sensor. Mar. Geology 108, 253–258. doi: 10.1016/0025-3227(92)90199-R
Kineke G. C., Sternberg R. W., Trowbridge J. H., Geyer W. R. (1996). Fluid-mud processes on the Amazon continental shelf. Continental Shelf Res. 16, 667–696. doi: 10.1016/0278-4343(95)00050-X
Kirby R. (1988). “High concentration suspension (fluid mud) layers in estuaries. (Berlin Heidelberg: Springer), 463–487. doi: 10.1007/978-3-642-73691-9_23
Kuang L., Yu H., Ding Y., Li X., Kuang H. (2011). A review on quantitative analysis of suspended sediment concentrations. Mar. Sci. Bull. 13, 51–61. doi: 10.3969/j.issn.1000-9620.2011.02.004
Larcombe P., Ridd P. V., Prytz A., Wilson B. (1995). Factors controlling suspended sediment on inner-shelf coral reefs, Townsville, Australia. Coral Reefs 14, 163–171. doi: 10.1007/BF00367235
Li G. X., Yue S. H., Zhao D. B., Sun Y. T. (2004). Rapid deposition and dynamic processes in the modern yellow river mouth. Mar. Geology Quaternary Geology 24, 29–36. doi: 10.16562/j.cnki.0256-1492.2004.03.018
Li J. F., He Q., Xu H. G. (2001). The fluid mud transportation processes in Changjiang River estuary. Oceanologia EtLimnologia Sin. 32, 302–310. doi: CNKI:SUN:HYFZ.0.2001-03-010
Li M. Z., Amos C. L. (2001). SEDTRANS96: the upgraded and better calibrated sediment-transport model for continental shelves. Comput. Geosciences 27, 619–645. doi: 10.1016/S0098-3004(00)00120-5
Liu J., Cheng H. F., Wang Y. Y., Li W. H. (2013). Analysis of fluid mud changes in the Yangtze estuary 12.5 m deep water channel. Port Waterway Eng. 11, 55–60. doi: 10.16233/j.cnki.issn1002-4972.2013.11.019
Liu J., Guo T. F., Shan H. X. (2016). Dynamic mechanism of sediment resuspension in yellow river delta. Chin. J. Underground Space Eng. 12, 61–69. doi: CNKI:SUN:BASE.0.2016-01-011
Liu X. L., Lu Y., Yu H. Y., Ma L. K., Li X. Y., Li W. J., et al. (2022). In-situ observation of storm-induced wave-supported fluid mud occurrence in the subaqueous Yellow River delta. J. Geophysical Research: Oceans 127, e2021JC018190. doi: 10.1029/2021JC018190
Liu J., Zhou P., Meng C. X. (2023). Summary on characteristics and transport laws of fluid mud. J. Chongqing Jiaotong Univ. (Natural Science) 10, 1–11. doi: 10.3969/j.issn.1674-0696.2023.10.01
MacVean L. J., Lacy J. R. (2014). Interactions between waves, sediment, and turbulence on a shallow estuarine mud flat. J. Geophysical Research: Oceans 119, 1534–1553. doi: 10.1002/2013JC009477
Mehrdad S., Kyle S. (2012). Measurement of critical shear stress for mud mixtures in the San Jacinto estuary under different wave and current combinations. Continental Shelf Res. 47, 78–92. doi: 10.1016/j.csr.2012.07.004
Miles J. W. (1961). On the stability of heterogeneous shear flows. J. Fluid Mech. 10, 496–508. doi: 10.1017/S0022112061000305
Ministry of Transport of the People’s Republic of China (2022). Hydrologic Code for Ports and Waterways (JTS145-2015 (2022 edition) (Beijing: People’s Communications Press).
Pan L., Fang J., Tian L. Z., Li Y., Wang F., Qi W. Y., et al. (2018). Particle size characteristics of surface sediments and sedimentary environment analysis in the marine area of Nangang Industrial Zone, Tianjin. J. Appl. Oceanography. 37, 462–471. doi: 10.3969/J.ISSN.2095-4972.2018.04.002
Qin Y. S., Li F. (1982). Study on the suspended matter of the sea water of the Bohai gulf. Acta Oceanologica Sin. 4, 191–200. doi: CNKI:SUN:SEAC.0.1982-02-006
Rouse H. (1939). “Experiments on the mechanics of sediment suspension,” in Proceedings 5th International Congress on Applied Mechanics (Chichester: John Wiley & Sons).
Shi Z. (2001). Observations of fluid mud in the deepwater navigational channel of Hangzhou Bay. Mar. Sci. Bull. (06), 40–50. doi: 10.3969/j.issn.1001-6392.2001.06.006
Shi J. Z. (2010). Tidal resuspension and transport processes of fine sediment within the river plume in the partially-mixed Changjiang River estuary. Geomorphology 121, 133–151. doi: 10.1016/j.geomorph.2010.04.021
Shi B. W., Yang S. L., Wang Y. P., Yu Q., Li M. L. (2014). Intratidal erosion and deposition rates inferred from field observations of hydrodynamic and sedimentary processes: a case study of a mudflat-saltmarsh transition at the Yangtze delta front. Continental Shelf Res. 90, 109–116. doi: 10.1016/j.csr.2014.01.019
Shields A. (1936). Application of similarity principles and turbulence research to bed-load movement. California Institute of Technology, Pasadena (Translate from German).
Soulsby R. L. (1995). Bed shear stresses due to combined waves and currents. In: Advances in Coastal Morphodynamics, Eds: Stive MJF, De Vriend HJ, Fredsoe J, Hamm L, Soulsby RL, Teisson C, et al. (Delft, NL: Delft Hydraulics), pp 4-20–4-23.
Soulsby R. (1997). Dynamics of Marine Sands (HR Wallingford Titles): A Manual for Practical Applications (New York: Thomas Telford Publications).
Sun S. T., Xu J. S., Li G. X., Liu X., Qiao L. L., Zhou S. (2020). Analysis of suspended sediments concentration in the Bohai Bay in winter based on remote sensing. Oceanologia Et Limnologia Sin. 51 (02), 258–264. doi: 10.11693/hyhz20190700151
Tang J., Wang Y., Zhu Q., Jia J., Xiong J., Cheng P., et al. (2019). Winter storms induced high suspended sediment concentration along the north offshore seabed of the Changjiang estuary. Estuarine Coast. Shelf Sci. 228, 106351. doi: 10.1016/j.ecss.2019.106351
Tang J., Wu H., Xing F., Zhang F., Tang B., Li G., et al. (2023). Formation and transport of fluid mud triggered by typhoon events in front of the subaqueous Changjiang Delta. Mar. Geol. 460, 107052. doi: 10.1016/j.margeo.2023.107052
Thorne P. D., Hanes D. M. (2002). A review of acoustic measurement of small-scale sediment processes. Continental Shelf Res. 22, 603–632. doi: 10.1016/S0278-4343(01)00101-7
Traykovski P., Wiberg P. L., Geyer W. R. (2007). Observations and modeling of wave-supported sediment gravity flows on the Po prodelta and comparison to prior observations from the Eel shelf. Continental Shelf Res. 27, 375–399. doi: 10.1016/j.csr.2005.07.008
Trowbridge J. H., Elgar S. (2003). Spatial scales of stress-carrying nearshore turbulence. J. Phys. Oceanogr. 33, 1122–1128. doi: 10.1175/1520-0485(2003)033<1122:SSOSNT>2.0.CO;2
Trowbridge J. H., Kineke G. C. (1994). Structure and dynamics of fluid muds on the Amazon continental shelf. J. Geophysical Res. Atmospheres 99, 865–874. doi: 10.1029/93JC02860
Tu J. B., Fan D. D., Sun F. X., Kaminski A., Smyth W. (2022). Shear instabilities and stratified turbulence in an estuarine fluid mud. J. Phys. Oceanography 52, 2257–2271. doi: 10.1175/JPO-D-21-0230.1
Uncles R. J., Stephens J. A. (2010). Turbidity and sediment transport in a muddy subestuary. Estuar. Coast. Shelf Sci. 87, 213–224. doi: 10.1016/j.ecss.2009.03.041
van Rijn L. C. V. (1993). Principles of Sediment Transport in Rivers, Estuaries and Coastal Seas (Amsterdam: Aqua Publications).
Villaret C., Trowbridge J. H. (1991). Effects of stratification by suspended sediments on turbulent shear flows. J. Geophys. Res. Ocean. 96, 10659–10680. doi: 10.1029/91JC01025
Wan Y. Y., Roelvink D., Li W. H., Qi D. M., Gu F. F. (2014). Observation and modeling of the storm-induced fluid mud dynamics in a muddy-estuarine navigational channel. Geomorphology 217, 23–36. doi: 10.1016/j.geomorph.2014.03.050
Wang X. H. (2002). Tide-induced sediment resuspension and the bottom boundary layer in an idealized estuary with a muddy bed. J. Phys. Oceanography 32, 3113–3131. doi: 10.1175/1520-0485(2002)032<3113:TISRAT>2.0.CO;2
Wang Y. P., Gao S., Jia J. J. (2000). Flow structure in the marine boundary layer and bedload transport: A review. Mar. Geology Quaternary Geology. 20, 101–106. doi: 10.16562/j.cnki.0256-1492.2000.03.016
Weeks A. R., Simpson J. H., Bowers D. (1993). The relationship between suspended particulate matter and tidal processes in the Irish Sea. Cont. Shelf Res. 13, 1325–1334. doi: 10.1016/0278-4343(93)90086-D
Whitehouse R. J. S., Soulsby R., Roberts W., Mitchener H. J. (2000). Dynamics of Estuarine Muds-A Manual for Practical Applications (London: Thomas Telford), 3–210.
Winterwerp J. C. (2011). Fine sediment transport by tidal asymmetry in the high-concentrated Ems River: Indications for a regime shift in response to channel deepening. Ocean Dynamics. 61, 203–215. doi: 10.1007/s10236-010-0332-0
Winterwerp J. C., Bmens A. W., Gratiot N., Kranenburg C., Toorman E. A. (2002). Dynamics of concentrated benthic suspension layers. Proc. Mar. Sci. 5, 41–55. doi: 10.1016/S1568-2692(02)80007-9
Wu H., Wang Y. P., Gao S., Xing F., Tang J. P., Chen D. Z. (2022). Fluid mud dynamics in a tide-dominated estuary: a case study from the Yangtze River. Cont. Shelf Res. 232, 104623. doi: 10.1016/j.csr.2021.104623
Xiong J., Wang X., Wang Y., Chen J., Shi B., Gao J., et al. (2017). Mechanisms of maintaining high suspended sediment concentration over tide-dominated offshore shoals in the southern Yellow Sea. Estuar. Coast. Shelf Sci. 191, 221–233. doi: 10.1016/j.ecss.2017.04.023
Yang Y., Jia J. J., Zhou L., Gao W. H., Shi B. W., Li Z. H., et al. (2019). Human-induced changes in sediment properties and amplified endmember differences: Possible geological time markers in the future. Sci. Total Environ. 661, 63–74. doi: 10.1016/j.scitotenv.2019.01.115
Yang Y., Wang Y. P., Gao S., Wang X. H., Shi B. W., Zhou L., et al. (2016). Sediment resuspension in tidally dominated coastal environments: new insights into the threshold for initial movement. Ocean Dynamics 66, 401–417. doi: 10.1007/s10236-016-0930-6
Yu Q., Wang Y., Flemming B., Gao S. (2012). Tide-induced suspended sediment transport: depth-averaged concentrations and horizontal residual fluxes. Cont. Shelf Res. 34, 53–63. doi: 10.1016/j.csr.2011.11.015
Yu Q., Wang Y., Shi B., Wang Y., Gao S. (2017). Physical and sedimentary processes on the tidal flat of central Jiangsu Coast, China: Headland induced tidal eddies and benthic fluid mud layers. Cont. Shelf Res. 133, 26–36. doi: 10.1016/j.csr.2016.12.015
Zhang L. K. (2012). Research on the Coastal Environment Evolution and Its’ Controlling Factors of Bohai Bay, PhD dissertation (Qing Dao: Ocean University of China).
Zhang Q., Wu J. (2018). Sediment suspension by straining-induced convection at the head of salinity intrusion. J. Geophysical Research: Oceans 123, 656–671. doi: 10.1002/2017JC013192
Zhao H. (2019). Spatio-temporal Characteristics of Organic Carbon at Bohai Bay and Its Ecohydrodynamic Simulation for Cyclic Process. Ph.D. Thesis. (Tianjin: Tianjin University).
Zhao G., Jiang W., Wang T., Chen S., Bian C. (2022). Decadal variation and regulation mechanisms of the suspended sediment concentration in the Bohai Sea, China. J. Geophysical Research: Oceans 127, e2021JC017699. doi: 10.1029/2021JC017699
Keywords: fluid mud layer, bottom boundary layer, shear stress, sediment resuspension, wave-current coupling
Citation: Liu S, Li G, Liu X, Qiao L, Wang N, Liu S, Wang X, Yu D and Zhang L (2025) Impact of wave–current coupling on the bottom boundary layer in Bohai Bay. Front. Mar. Sci. 11:1521925. doi: 10.3389/fmars.2024.1521925
Received: 03 November 2024; Accepted: 30 December 2024;
Published: 20 January 2025.
Edited by:
Zhuangcai Tian, China University of Mining and Technology, ChinaCopyright © 2025 Liu, Li, Liu, Qiao, Wang, Liu, Wang, Yu and Zhang. This is an open-access article distributed under the terms of the Creative Commons Attribution License (CC BY). The use, distribution or reproduction in other forums is permitted, provided the original author(s) and the copyright owner(s) are credited and that the original publication in this journal is cited, in accordance with accepted academic practice. No use, distribution or reproduction is permitted which does not comply with these terms.
*Correspondence: Guangxue Li, ZXN0dWFyeUBvdWMuZWR1LmNu
 Siyu Liu
 Guangxue Li
 Xue Liu3
 Lulu Qiao
 Nan Wang
 Shidong Liu
