- 1Head AL Hail Aquaculture Unit, Department of Marine Science and Fisheries, College of Agriculture and Marine Science, Sultan Qaboos University, Muscat, Oman
- 2National Institute of Oceanography and Fisheries (NIOF), Cairo, Egypt
- 3Animal Production Department, Faculty of Agriculture, Mansoura University, Mansoura, Egypt
- 4Fish Nutrition Research Laboratory, Animal Production Department, Faculty of Agriculture, Cairo University, Cairo, Egypt
- 5Animal and Fish Production Department, College of Agricultural and Food Sciences, King Faisal University, Al-Ahsa, Saudi Arabia
- 6Department of Fish and Animal Production, Faculty of Agriculture (Saba Basha), Alexandria University, Alexandria, Egypt
The present study was conducted to investigate the interaction of biofloc water supplementations and potential zooplankton abundance and structure in Nile tilapia Oreochromis niloticus-rearing systems on zootechnical performance and biochemical indicators. Nile tilapia juveniles (13.30 g and 9.50 cm) were randomly distributed into 18 fiberglass tanks (500 L/tank with a stocking density of 40 fish/tank) to start the feeding experiment for 60 days. Fish weights were recorded weekly to adjust the feeding rate at 3% of their biomass using a commercial diet. Compared to the control group (T0, zero biofloc water supplementation), the influence of five biofloc supplementation levels was applied as follows: 14.2, 28.4, 42.6, 56.8, and 71 g L−1 (T1, T2, T3, T4, and T5, respectively). The biofloc was prepared in an external fermentor fiberglass tank (300 L) and added to the fish tanks to keep the biofloc levels constant during the experiment. After 30 and 60 days of the experiment, the number of zooplankton was 46,501 and 24,537 Ind. L−1, respectively, which included four families (Rotifera, Copepoda, Cladocera, and free-living nematodes) with the domination of family Rotifera at 81.65% and 93.89%, respectively. The water quality indicated was within the standard values recommended for fish culture. Compared to those of the control group, the values of growth performance, whole-body biochemical composition, and blood biochemical indicators were significantly higher in biofloc groups than in the control group. Group T3 achieved the highest significant growth performance values. In comparison with the control group, T3 achieved the lowest number of cultures and the abundance of small invertebrate prey after 60 days of culture. The fish reared in groups T0 and T1 showed the highest significant urea content and the highest concentrations of liver function enzyme activities. Interestingly, compared to all groups, T3 achieved the best feed conversion ratio (FCR) value (1.68). Principal component analysis (PCA) and Pearson’s correlation coefficient confidence (PCCC) clarified a close positive relationship between T0 and T3 with the total individual, Rotifera abundance, and FCR. The highest PCCC value with T0 was in group T3 (0.947). In conclusion, biofloc supplementation (42.6 g L−1) showed a sustainable clean aquadiet strategy and significantly improved Nile tilapia growth and FCR with regard to the culture of small prey invertebrates for 60 days.
1 Introduction
Recently, the biofloc feeding approach has become increasingly popular in aquaculture as a sustainable, clean aquadiet strategy because of its great ability to enhance fish growth efficiency with a low environmental harmful impact (Mansour et al., 2022a). Biofloc is a mixture of mixed microorganisms (bacteria, diatoms, and microalgae) that grow in aquaculture systems as a result of heterotrophic microorganisms recycling various sources of organic materials. Bioflocs consist of aggregated microorganisms resulting from the manipulation of the carbon/nitrogen (C/N) ratio (Minaz and Kubilay, 2021). By incorporating a biofloc supplementation strategy, aquaculture operations can provide a rich source of biological compounds significantly required for aquatic animals, such as protein, carbohydrates, lipids, organic acids, and various other bioactive compounds (Raza et al., 2024).
Biofloc supplementations provide several advantages for aquatic animals, including improved water quality, improved growth rates, and reduced nutrition costs. These benefits stem from the efficient recycling of nitrogenous waste by diverse microbial species present in the biofloc system (Khanjani et al., 2023). Notably, several aquaculture systems, including traditional (Ekasari et al., 2014), intensive (Pérez-Fuentes et al., 2016), polyculture (Hisano et al., 2019), or recirculating (Hisano et al., 2021) aquaculture, can successfully be applied by biofloc supplementation approach with attractive advantages and promising outcomes.
Gallardo-Collí et al. (2019) revealed that Nile tilapia Oreochromis niloticus can be intensively cultivated in biofloc systems, utilizing recycled water, without experiencing any adverse effects on survival, productivity, growth performance, proximal body composition, or gonadal development. These findings underscore the feasibility and potential of biofloc supplementation as a sustainable approach in aquaculture.
Understanding the relationships between fish and their feeding behavior provides valuable knowledge about their ecological roles (Hunter, 1980). It allows researchers to identify predator–prey dynamics, determine the trophic levels at which different species operate, and uncover the intricacies of food resource utilization (Glassic et al., 2023). For example, knowing the preferred prey species of a particular fish can help predict its impact on prey populations and its potential role as a biological control agent (Glassic et al., 2023). Zooplankton, as a crucial component of aquatic ecosystems, play a significant role as natural live feed for several species of fish and shellfish, both for natural habitats and aquaculture activities. Zooplankton, which are small floating invertebrates, serve as prey for aquatic animals that live in the water column. In aquaculture, zooplankton are often cultured and used as live feed to support the growth of fish larvae and juveniles (Abdullah et al., 2024). The nutritional value and small size of zooplankton make them an ideal choice for feeding young fish during their critical early life stages (Abo-Taleb et al., 2021c). By incorporating zooplankton into the diet of fish in aquaculture systems, farmers can ensure optimal growth, survival, and overall performance of their cultivated species (Kajgrová et al., 2024). Zooplankton can be provided to tilapia as a major or additional source of nutrition, based on the type of aquaculture system. To feed tilapia, zooplankton can be cultivated and harvested in extensive or semi-intensive systems where fish are raised in ponds or tanks (Lertwanakarn et al., 2023). This method has some advantages, such as the possibility of cost savings and giving the fish a diet closer to their natural feed. However, feeding tilapia only zooplankton may not provide them with all the nutrients they need for healthy growth. To ensure that fish are getting a well-balanced diet, it is therefore advisable to add commercial feeds or other protein sources to the diet (Dhont et al., 2013).
Aquaculture sustainability is influenced by several factors, including climate change, economic aspects, feed production costs and availability, water quality, ocean natural productivity, zooplankton and phytoplankton communities, and productivity levels (Bjørndal et al., 2024). Egypt stands as the leading aquaculture producer in Africa and the third-largest producer of Nile tilapia globally. However, like worldwide aquaculture producers, Egypt faces significant challenges in this industry, mainly feed quality and quantity (FAO, 2022). Consequently, Egypt is actively seeking alternative methods and technologies to address these issues. By adopting more sustainable and efficient approaches, the industry has the potential to meet the rising demand for fish while simultaneously reducing its environmental effect (Magouz et al., 2021b; Abo-Taleb et al., 2021a).
Biofloc systems offer several advantages that align with industry requirements (Mansour et al., 2022a). Implementing biofloc technology in global aquaculture operations could address challenges related to feed availability and cost while fostering a more sustainable and resource-efficient approach to fish production. This technology is considered fully implementable by the Egyptian aquaculture industry. By adopting these innovative methods, Egypt can enhance its position as a leading player in the aquaculture sector while reducing the environmental impacts commonly associated with intensive fish farming (Helal et al., 2024). Moreover, the application of the biofloc approach in the Egyptian aquaculture sector could prove instrumental in achieving these sustainability goals. The present study was conducted to assess the influence of biofloc water culture supplementations on water quality and Nile tilapia performance, feed conversion ratio, whole-body analysis, and hemato-biochemical indicators. Furthermore, the objective was to investigate the culture of potential small prey invertebrates (zooplankton) and their abundance at day 0 (D-0), day 30 (D-30), and day 60 (D-60) of culture.
2 Materials and methods
2.1 Biofloc production procedures
The biofloc was made in a fermenter fiberglass tank (300 L) at the Inland Water Branch of the National Institute of Oceanography and Fisheries (NIOF), using filtered water from River Nile, the Delta Barrage located in the Kalubiya Governorate, Egypt, following the protocol presented by Helal et al. (2024). Briefly, in a beaker, sugarcane molasses was diluted with water before being added to the fermentor. The tank bottom was continuously cleaned, and the evaporated water was replaced. To prevent the biofloc from settling, continuous aeration was provided. Sugarcane molasses was used as a carbon source over 30 days, and daily adjustments were made to keep the C/N ratio at 1:10, as previously mentioned by Avnimelech (1999). Each day, the potential volume of biofloc was added to each group after correctly incorporating biofloc, ensuring that the Nile tilapia juveniles received a natural diet. Following the methods previously outlined by Avnimelech (1999), the required volumes of biofloc were examined weekly using the Imhoff cone. Once a week, biofloc volumes were recorded in culture water using an Imhoff cone, which involved dumping 1 L of water from each tank for 15 to 20 minutes. The proximate compositions of biofloc were performed following the recommended protocol by AOAC (2003) based on the dry matter content (%), total protein (44.27%), ether extract (5.29%), ash (4.77%), crude fiber (4.69%), and nitrogen-free extract (40.58%), while gross energy (482,225 kcal kg−1) was calculated.
2.2 Water quality control
Using the standard procedures of American Public Health Association (APHA), as reported by Beutler et al. (2014), a variety of water quality variables were measured during the experimental period. Un-ionized ammonia (NH3), nitrite (NO2), nitrate (NO3), total alkalinity (T-Al), and total dissolved solids (TDS) were assessed weekly, whereas dissolved oxygen (DO), pH, and temperature were measured daily (at midday).
2.3 Nile tilapia acclimatization
Nile tilapia (O. niloticus) juveniles, with an average initial weight of 13.3 g and length of 9.5 cm, were obtained from a private Nile tilapia hatchery and transported to the Inland Water Branch of the National Institute of Oceanography and Fisheries (NIOF) for acclimation. The fish were acclimatized for 15 days, during which time they were manually fed twice a day with a commercial diet from ALER Aqua Egypt Company (28% protein, 6% ether extract, 7% ash, 4% crude fiber, and 55% nitrogen-free extract, with a gross energy of 452,600 kcal kg−1). After 15 days of acclimatization, the fish were randomly chosen and restocked in 18 fiberglass tanks of 500 L, with a rate of 40 fish/tank (three replicates/tank), filled with filtered agricultural water.
2.4 Experimental procedures
In this study, six biofloc groups (with three replicates per group) were tested and supplemented to the water culture for a 60-day rearing period. These selected groups are based on our previous work (Helal et al., 2024). The first group (control) did not have any biofloc addition per volume in a water culture (T0 = 0 g L−1), while in groups 2–5, biofloc was supplemented, as follows: T1 = 14.2 g L−1, T2 = 28.4 g L−1, T3 = 42.6 g L−1, T4 = 56.8 g L−1, and T5 = 71 g L−1. There was no daily water exchange in the fish tanks, except for cleaning the tank’s bottom of remaining food and fish feces. Every day, biofloc volumes for all groups were established by applying the Avnimelech (1999) guidelines. The volumes were then supplemented with new biofloc volumes from the fermentation tank to keep each group’s biofloc levels at the suggested levels. The fish dietary rates were adopted at 3% of the total biomass and changed once a week, following the weekly weighing of randomly selected specimens of fish (Azim and Little, 2008).
2.5 Growth and feed conversion ratio
The initial and final length (IL and FL, respectively) and weight (IW and FW, respectively) of fish were determined to calculate daily weight gain (DWG), weight gain rate (WGR), and length gain rate (LGR). Moreover, specific growth rate (SGR), survival rate (SR), and feed conversion ratio (FCR) were calculated based on the recommended equations as previously reported.
2.6 Proximate biochemical analysis
Following the guidelines of AOAC (2003), the proximate compositions of fish were determined. At the termination of the experiment, random fish samples (n = 5) were chosen from each tank. After fish euthanization, samples were homogenized using a blender, oven-dried, ground, and stocked at −20°C until the analysis. Dry matter, total protein, ether extract, and ash (based on dry matter content %) were determined.
2.7 Biochemical index investigations
To determine serum biochemical composition, blood samples from 15 fish/treatment (5 fish/replicate) were collected at the termination of the experiment. Using a syringe containing 15 units mL−1 of heparin, blood samples were taken from the caudal artery. Serum was obtained by centrifuging the remaining blood samples for 20 minutes at 585 × g. Following the guidelines recorded by Wootton et al. (1982) and Lowry (1951), the total albumin (ALB) and total serum protein (TP) were determined, respectively. The total globulin (GLB) was calculated by subtracting the albumin value from the total serum protein value. The serum creatinine and urea were determined following the protocols by Larsen (1972) and Henry et al. (1974), respectively. The serum aspartate aminotransferase (AST) and alanine aminotransferase (ALT) were determined following the procedures by Reitman and Frankel (1957).
2.8 Small invertebrate (zooplankton) community, structure, and culture
In this study, the zooplankton were identified and counted at three time points: at the start of the experiment (D-0), the middle of the experiment (D-30), and the end of the experiment (D-60). This was to investigate the impact of biofloc water supplementation on the zooplankton community, abundance, and structure, as well as the culture of these small invertebrates as potential prey for cultured Nile tilapia during the experiment period.
To achieve these objectives, a zooplankton net (55-µm mesh size) was used to filter 5 L of water from each subsurface layer of the tank. The samples were then immediately transferred to plastic jars containing a 5% formalin solution for preservation. A 1-mL sub-sample was brought into a Sedgwick Rafter Cell for counting purposes in the laboratory and investigated using a binocular microscope. Using the identification guides by Koste (1978); Einsle (1996), and Smironov (1996), zooplankton organisms were identified at the species levels. Each replication (n = 12) had its standing crop counted every 4 weeks on D-0, D-30, and D-60. The standing crop was computed using the equation given by Santhanam and Srinivasan (1994).
2.9 Statistical analysis
The consistency (Fasano and Franceschini, 1987), homogeneity assumptions (Levene, 1960), and normality (Mudholkar et al., 1995) were estimated before the statistical analysis was carried out. All data percentages were arc-sin transformed (Zar, 1984). The one-way analysis of variance (ANOVA) followed by Tukey’s test was performed, using the SPSS Statistics software, to compare the mean values (means ± standard deviation) at a significance level of 0.05. Moreover, using the Paleontological Statistics software (PAST4.17), the principal component analysis (PCA) and Pearson’s correlation coefficient confidence (PCCC) were performed to analyze the given data. However, the polynomial regression was conducted, using Excel Software, to assess the individual effects of biofloc supplementation levels and zooplankton, WG, SGR, and FCR.
3 Results and discussion
3.1 Water quality assessment
Table 1 shows water quality parameters during the experimental period. The recorded values of water quality for all groups were within the recommended values for fish (El-Sayed, 2006). In all groups, no significant differences (p < 0.05) were observed for T-Al, temperature, and DO. However, the pH, EC, NO2, NO3, NH3, and TDS values showed significant differences (p < 0.05) among the control and all biofloc groups. In the current study, the recorded pH and EC values in T0 (the control group) were lower than those in all biofloc groups (T1–T5), meaning that the biofloc application tended to increase the alkaline and EC. These findings were similar to the findings previously reported by Ekasari et al. (2014) and Mohammady et al. (2023). In Nile tilapia culture, the concentrations of TDS are generally advised to be between 2,000 and 5,000 mg L−1. Nile tilapia exposed to TDS levels of more than 5,000 mg L−1 had slower development rates, higher stress levels, and a lower adaptive response (Nhan et al., 2006). The current study showed that the increase in biofloc volume tended to gradually increase the TDS values between groups, ensuring that all biofloc groups (T5 > T4 > T3 > T2 > T1) were significantly (p < 0.05) higher than the control group (T0), as well as ensuring that all studied biofloc group and the control group were in the recommended values for Nile tilapia. Our findings were confirmed by Mohammady et al. (2023), who concluded that, compared to the control diet, the enrichment of Nile tilapia by bioflocs gradually increased the TDS concentration in the water culture.
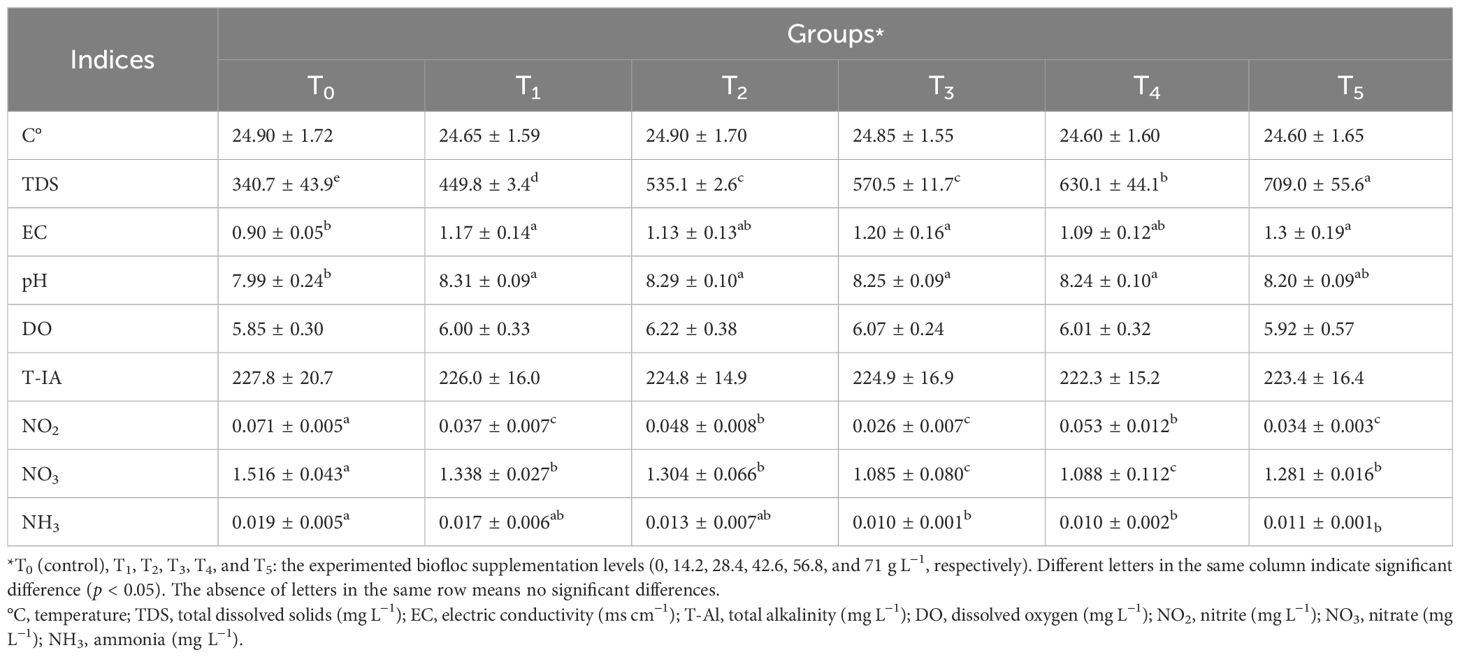
Table 1. Water quality indices during the rearing of Nile tilapia for 60 days on the experimental biofloc concentrations.
NO2 and NO3 are produced as a consequence of nitrification. According to Luo et al. (2014), under controlled laboratory conditions, the NO3 generated in the biofloc condition system is capable of partial denitrification to produce NO2 and dissimilatory reduction of NO3 to un-ionized ammonia (NH3). Nitrite is a transitional phase of oxidation that lies between ammonia (low oxidation states) and nitrate (higher oxidation states). The metabolic oxygenation of ammonia (nitrification) and reduction of nitrate (denitrification) within the water body are the primary processes that produce nitrite (Magouz et al., 2021a). In freshwater and marine aquaculture, the recommended range of NO2 should not increase more than 0.2 and 0.125 mg L−1, respectively. Nitrate is a non-toxic form of N for fish in freshwater or marine aquaculture. It is a non-toxic form of N for fish if less than 90 mg L−1 (Luo et al., 2014).
In this study, Table 1 show that the biofloc-containing groups (T1–T5) significantly reduced NO2, NO3, and NH3 levels compared to the control group (T0) (p < 0.05). Regardless of significance, group T3 achieved the lowest values of NO2, NO3, and NH3 compared to the control group (T0) or the other biofloc groups (T1, T2, T4, or T5). Our results are not in agreement with Mohammedy et al. (2021), who concluded that biofloc supplementation significantly (p < 0.05) increased NO2, NO3, and NH3. This differentiation may be attributed to different scenarios such as i) the differences in biofloc volumes, ii) experimental conditions, iii) fish age, and iv) stock density.
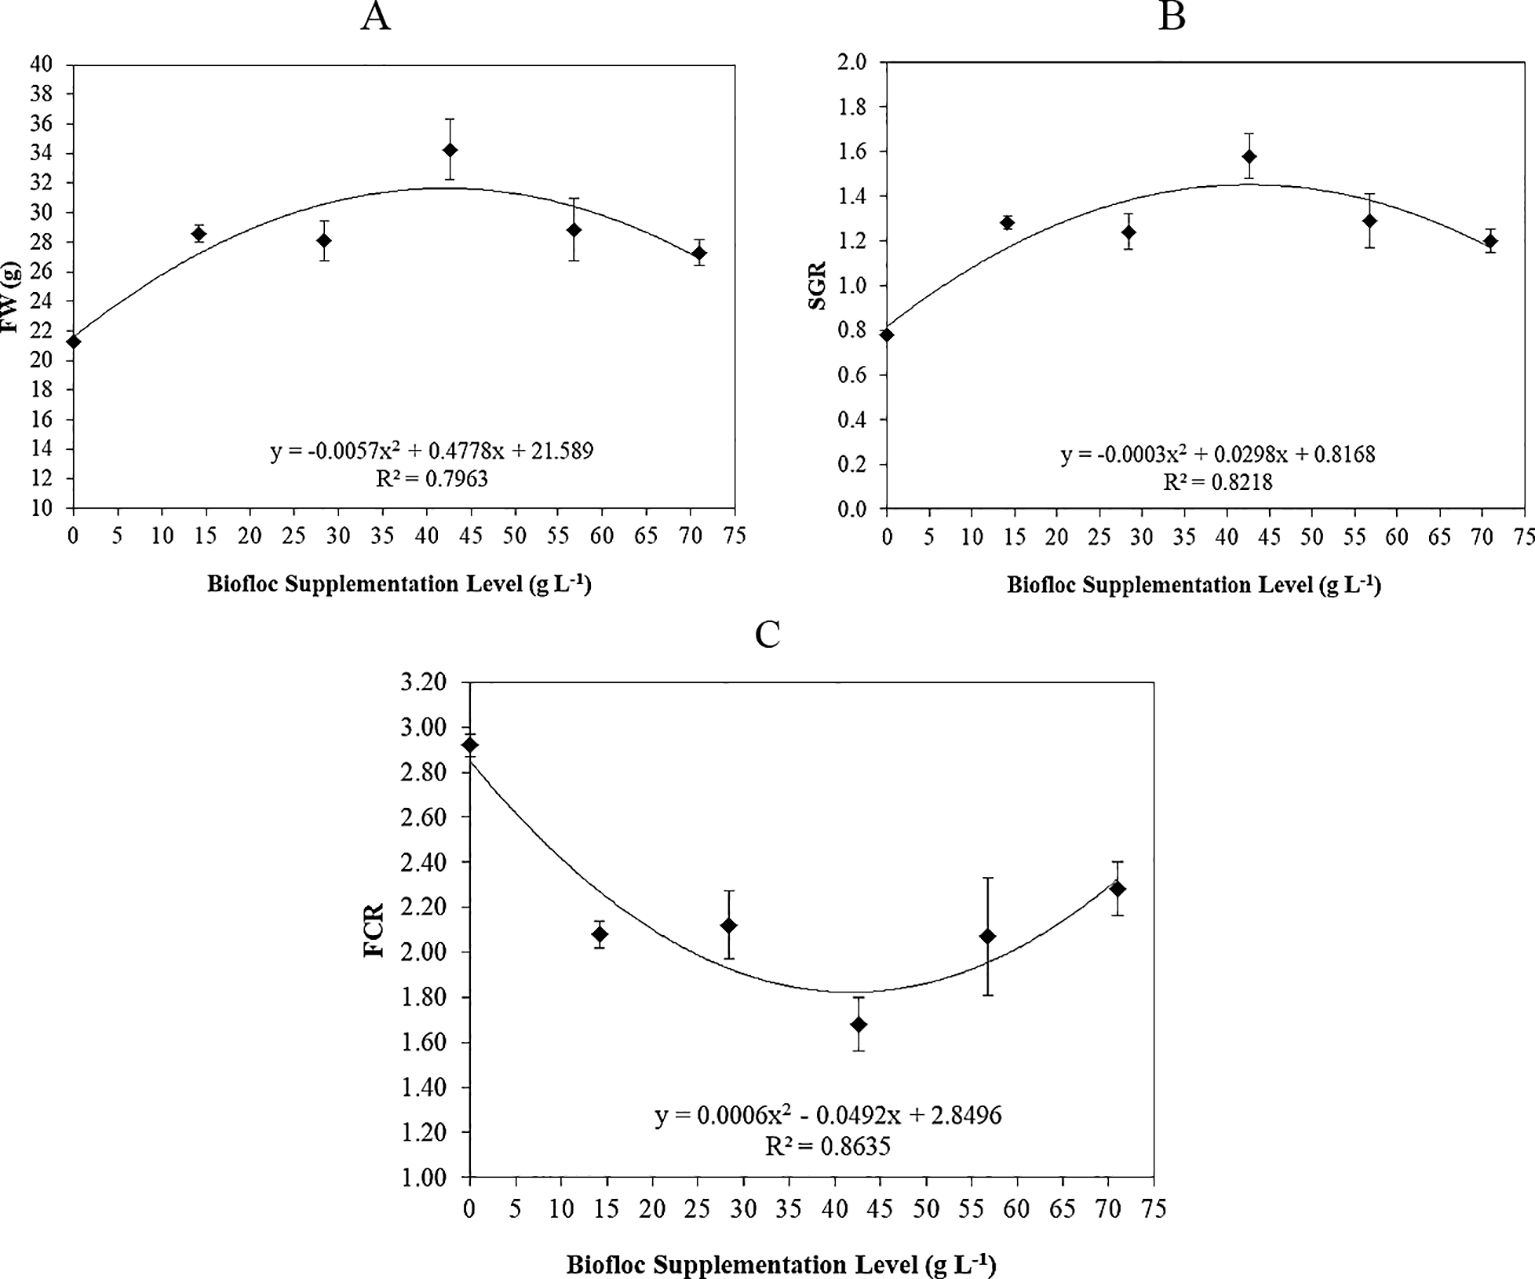
Figure 1. Polynomial regression between biofloc supplementation level (T0 “control”, T1, T2, T3, T4, and T5: 0, 14.2, 28.4, 42.6, 56.8, and 71 g L−1, respectively) and Nile tilapia: (A) final weight (FW, g/fish), (B) specific growth rate (SGR, %, day), and (C) feed conversion ratio (FCR; gain:weight).
3.2 Growth and feed utilization efficiency
Table 2 shows the growth performances and the efficiency of nutrient utilization of Nile tilapia fed different biofloc concentrations during a 60-day experiment. In all biofloc groups (T1–T5), the FW, FL, DWG, WGR, and SGR values were significantly (p < 0.05) higher than those in the control group (T0). Interestingly, the FW, FL, DWG, WGR, LGR, and SGR values of the fish in group T3 were significantly higher (p < 0.05) compared to those in all other groups, while the FCR was significantly lower (p < 0.05) in group T3, compared to the other groups. Our results are confirmed by the conclusions of several reports that the addition of biofloc significantly enhances the growth performances and overall nutrient utilization efficiency of several species such as Nile tilapia, O. niloticus (Kishawy et al., 2020; El-Hawarry et al., 2021; Souza et al., 2019), African catfish, Clarias gariepinus (Chen et al., 2020; Fauji et al., 2018), Indian shrimp, Penaeus indicus (Panigrahi et al., 2020; Das et al., 2022), and whiteleg shrimp, Litopenaeus vannamei (Mansour et al., 2022a, 2022b).
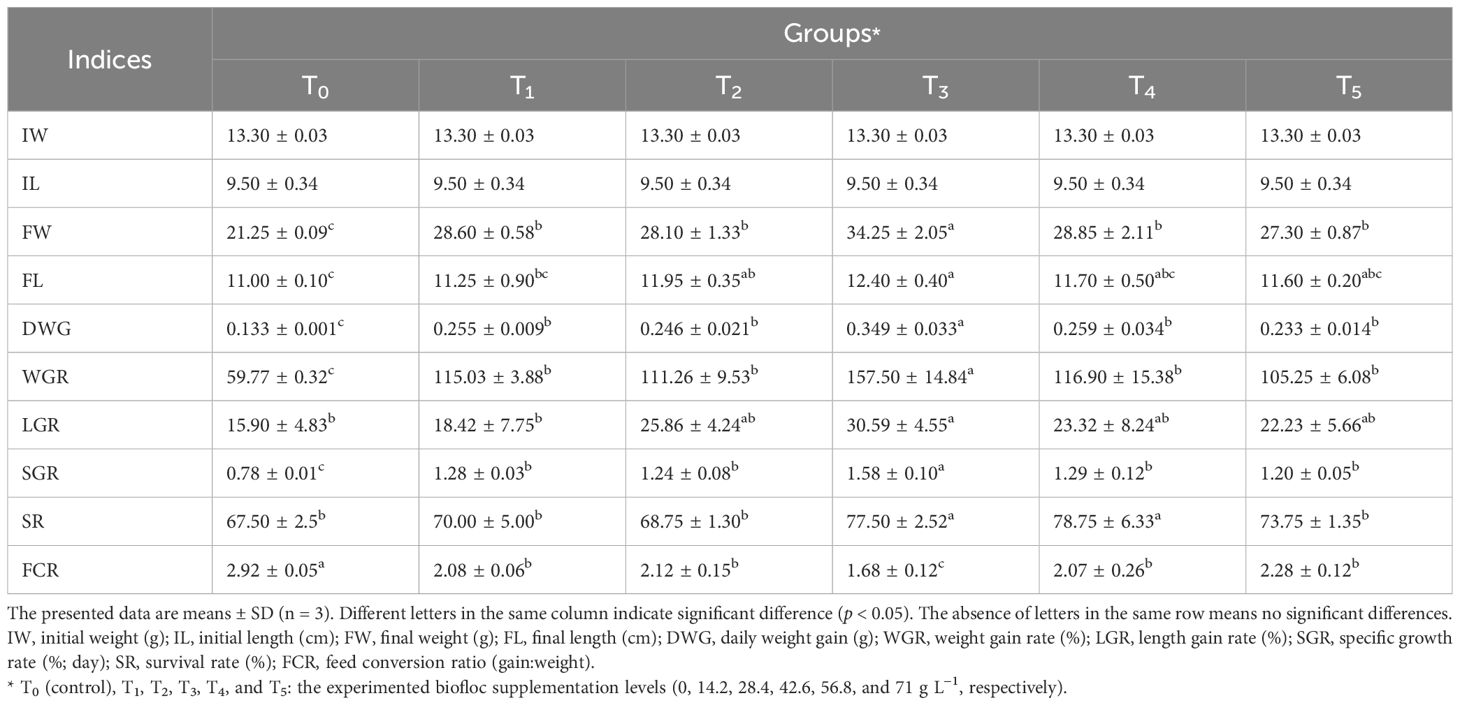
Table 2. Growth and nutrient indices of Nile tilapia fed different biofloc concentrations during 60 days.
Figures 1A–C show the polynomial regression of FW, SGR, and FCR, reporting that with the increase of biofloc supplementation levels of the experimented groups (T0 “control”, T1, T2, T3, T4, and T5: 0, 14.2, 28.4, 42.6, 56.8, and 71 g L−1, respectively), the WG and SGR polynomial regression (Figures 1A, B, respectively) were increased (r2 = 0.7963 and 0.8218, respectively), while FCR polynomial regression (Figure 1C) was decreased (r2 = 0.8735). These findings indicated that the biofloc supplementation levels improve the final weight, specific growth rate, and feed conversion ratio of Nile tilapia O. niloticus (Helal et al., 2024).
3.3 Proximate biochemical analysis
Table 3 shows the whole-body biochemical composition of Nile tilapia fed different biofloc concentrations after 60 days. The dry matter percentage was significantly higher in fish reared in T3, followed by T2, T1, T5, and T4, while the lowest was reported by fish reared in the control group (T0). The ether extract percentage was significantly higher in fish reared in T3, followed by T4, T5, T2, T0, and T1 (Table 3). The percentage of ash was significantly higher in fish reared in T5, followed by T4, T0, T2, T1, and T3. Table 3 shows that increasing biofloc concentration inclusions significantly increased protein percentage, while the lowest protein percentage was reported in T0. The current findings showed that the biofloc groups significantly improved dry matter, total protein, and ether extract, compared to the control group. These findings may be attributed to biofloc supplementation, which has a high total protein and lipid content (44.27% and 5.29%). Our findings were previously confirmed by Long et al. (2015), who concluded that the application of biofloc technology (BFT) in Nile tilapia culture showed increasing trends in protein, lipid, and ash content (%).

Table 3. Biochemical composition of Nile tilapia fed different biofloc concentrations during 60 days.
However, Aliabad et al. (2022) investigated the impact of feeding limitation and stocking density on the body composition of Nile tilapia fry. It was observed that in response to a reduction in the feeding rate, lipid content (%) decreased significantly, while protein (%), ash (%), and moisture (%) increased. The difference between our findings and the findings reported by Aliabad et al. (2022) may be attributed to different scenarios such as experimental design, fish age, feeding rate, stocking density, and water quality parameters.
3.4 Hemato-biochemical indices
Biochemical characteristics are frequently employed to assess the fish health, nutritional status, and capacity for environmental adaptation (Mansour et al., 2022a). Table 4 shows the biochemical profile of Nile tilapia fed biofloc for 60 days. It found that the highest significant TP was observed in fish reared in groups T0 (control group), T1, T3, and T5, followed by T2, while the lowest was observed in T4. The highest significant GLB was observed in fish reared in groups T0 (control group), T2, and T5, followed by T1 and T3, while the lowest was observed in T4. The highest significant ALB was observed in fish reared in group T0 (control group), followed by T1, T3, T2, and T5, while the lowest was observed in T4 (Table 4). The fish reared in group T3 showed the highest significance (p < 0.05) of creatinine, while the fish reared in groups T0 (control group) and T1 showed the highest significance (p < 0.05) of urea content. The highest significant (p < 0.05) values of AST and ALT were reported in groups T1 and T0 (control group).
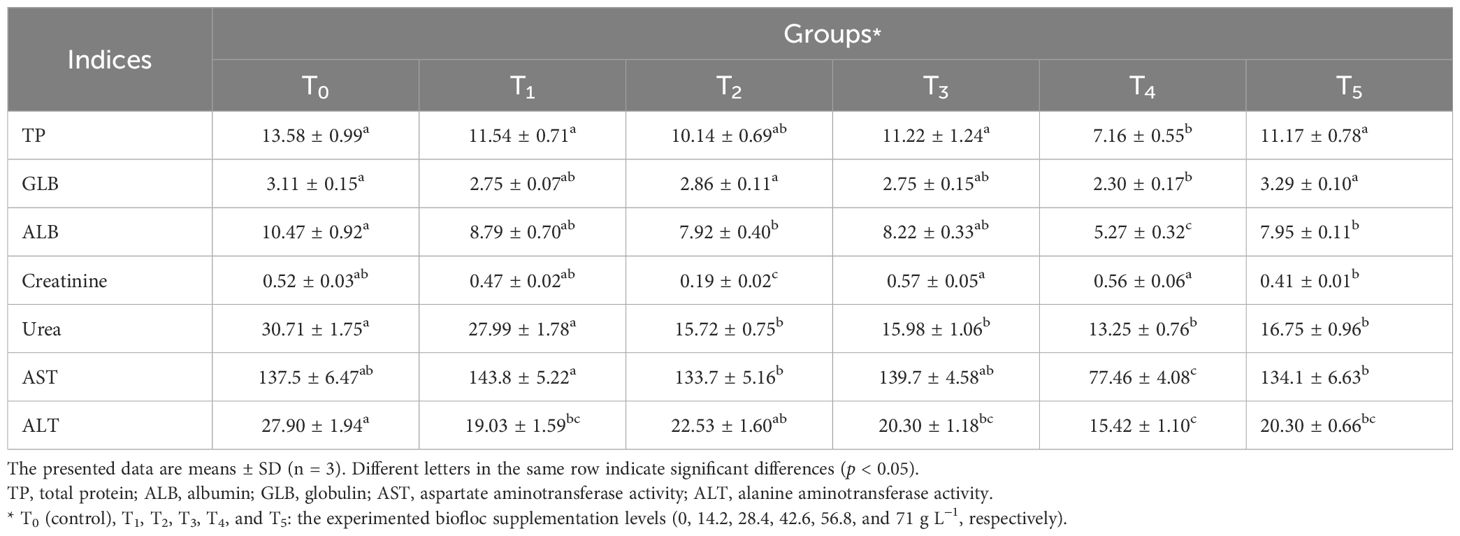
Table 4. Biochemical indices (g dL−1) of Nile tilapia fed different biofloc concentrations after 60 days.
Fish with higher levels of serum protein, globulin, and albumin are thought to have a stronger innate immune response, as these proteins are critical for the immunological response (Mohammady et al., 2023). The present results showed significant differences in serum protein, globulin, and albumin between the control group and biofloc groups. These findings revealed that the serum total protein, globulin, and albumin values reported in fish reared in T3 were the most similar to those in the control group (T0), while other biofloc groups (T1, T2, T4, and T5) had equal to or lower than those in the control group. Our findings were in agreement with those in Haghparast et al. (2020) study, which found that the addition of biofloc did not impact the biochemical parameters of common carp juveniles, contrary to the findings of Mohammady et al. (2023).
ALT and AST activities are helpful markers of liver integrity and function. When there are notable increases of these enzymes in the blood, it suggests that there is liver injury or tissue necrosis (Huang et al., 2015). In the current study, fish reared in biofloc groups had ALT values significantly lower than those of the control group. In addition, fish reared in biofloc groups had AST values significantly lower than or the same as those in the control group. Based on this finding, the current results concluded that the biofloc supplementation did not have harmful effects on liver tissue. Our results were also previously confirmed by several works (Hersi et al., 2023; Haraz et al., 2023, Ahmed et al., 2019; Aliabad et al., 2022). Examining biochemical serum markers including urea and creatinine is an approach for monitoring the prospective harmful adverse effects and the toxicity of the kidney (Abdel-Khalek et al., 2020). In our study, regarding creatinine and urea concentrations, fish rearing in biofloc groups had significant values lower than or the same as the control group. The biofloc supplementation levels also had no harmful effects on the kidneys of Nile tilapia (Haghparast et al., 2020).
3.5 Zooplankton culture, community, and abundance
The present examination of zooplankton was identified and counted on D-0, D-30, and D-60 to investigate the effects of adding biofloc water supplementation on zooplankton (community, quantity, abundance, and structure) and to explore the aquaculture potential of these small invertebrates, in water culture, which will be grown to serve as prey for Nile tilapia during the experimental period under biofloc strategy. Figure 2 shows the standing crop of zooplankton (structure and community) on day 0 (D-0, the initial of the experiment), which is mainly Rotifera.
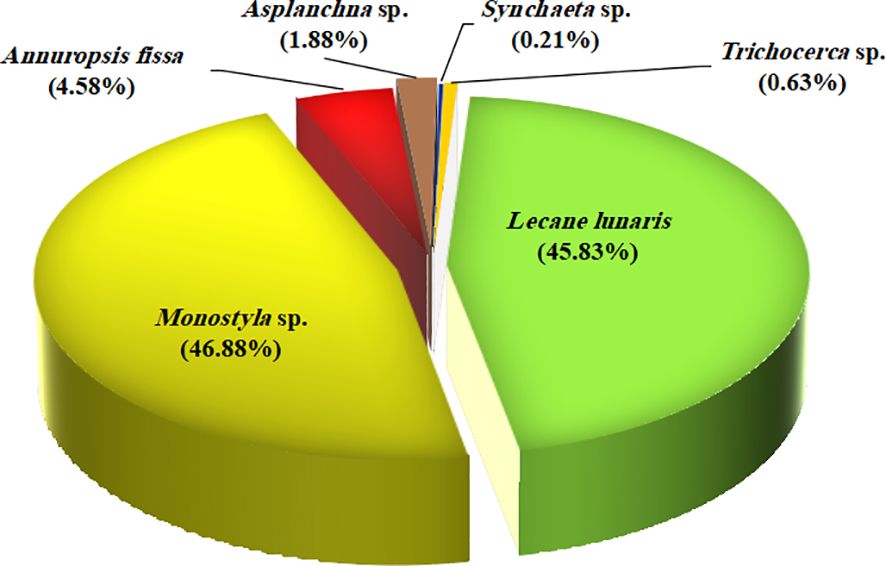
Figure 2. The community structure and abundance of small prey invertebrates in the water culture of Nile tilapia at day 0 (D-0).
On day 0, in all groups, all identified species belonged to the Rotifera family only, with an average total number of 24,000 Ind. L−1. A total of six species comprised 100% of the total community: Lecane lunaris (11,000 Ind. L−1, 45.83%), Monostyla sp. (11,250 Ind. L−1, 46.88%), Annuropsis fissa (1,100 Ind. L−1, 4.58%), Asplanchna sp. (450 Ind. L−1, 1.88%), Synchaeta sp. (50 Ind. L−1, 0.21%), and Trichocerca sp. (150 Ind. L−1, 0.63%).
Figures 3A, B show the culture of small prey invertebrates after 30 days (D-30) and 60 days (D-60) of the experiment. For D-30 and D-60, the total number of zooplankton were 46,501 and 24,537 Ind. L−1, respectively, comprises 100% of the total community, and belongs to four families: Rotifera, Copepoda, Cladocera, and free-living nematodes. This reduced number may be attributed to the high consumption of these invertebrates as live feed by Nile tilapia during the experiment.
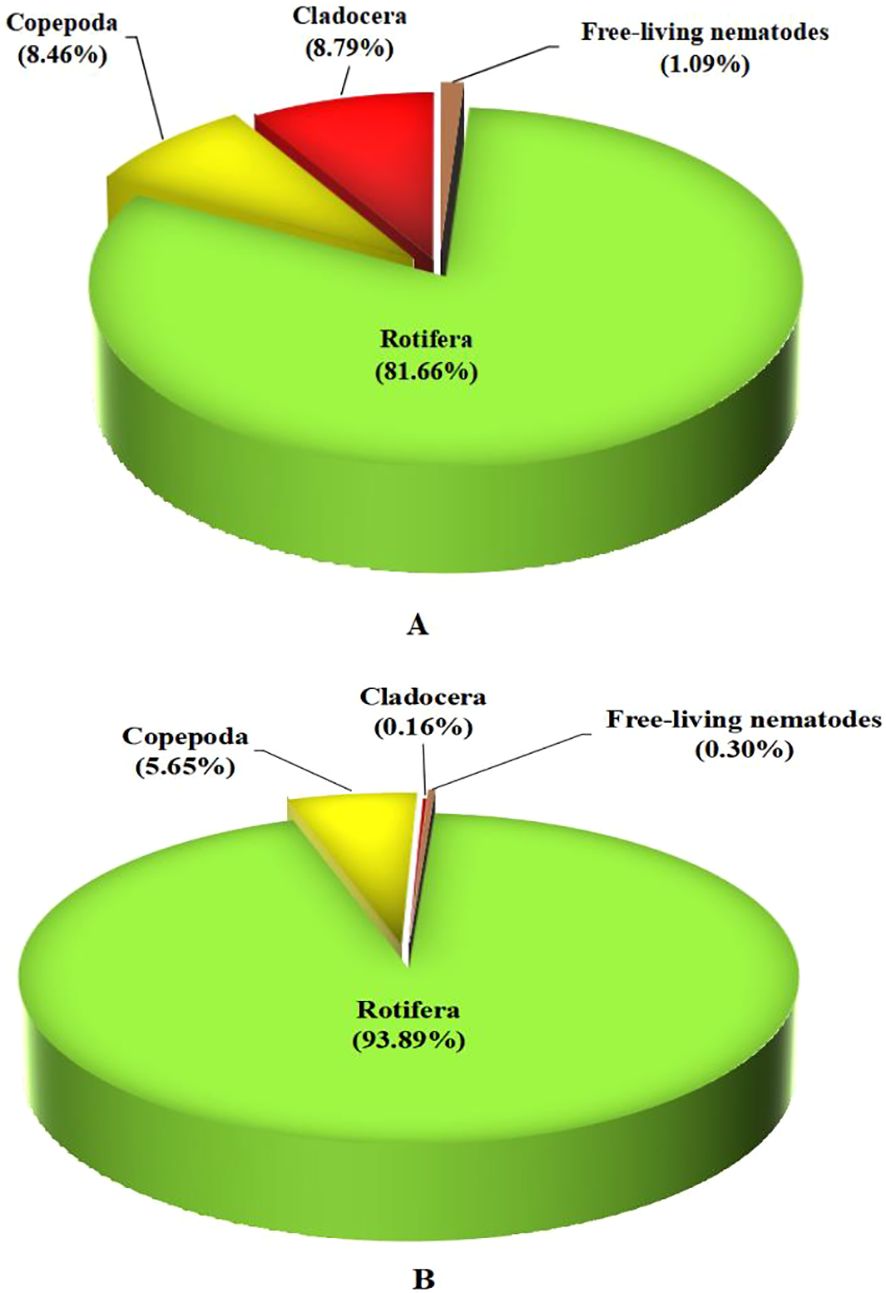
Figure 3. The community structure and abundance of small prey invertebrates in the water culture of Nile tilapia at (A) D-30, day-30 of start culture, and (B) D-60, day-60 of start culture.
All investigated small invertebrate groups were positively utilized as prey by Nile tilapia. Our findings are consistent with those of Tesfahun and Temesgen (2018), who observed that all the zooplankton species identified in the present study are common natural prey consumed by Nile tilapia in African lakes.
For D-30, the total Rotifera, Copepoda, Cladocera, and free-living nematodes were 81.66% (37,973 Ind. L−1), 8.46% (3,932 Ind. L−1), 8.79% (4,087 Ind. L−1), and 1.09% (509 Ind. L−1), respectively (Figure 3A). For D-60, the total of Rotifera, Copepoda, Cladocera, and free-living nematodes were 93.89% (23,038 Ind. L−1), 5.65% (1,386 Ind. L−1), 0.16% (39 Ind. L−1), and 0.30% (74 Ind. L−1), respectively (Figure 3B).
In both D-30 and D-60, the first dominant family was Rotifera (81.65% and 93.89%, respectively). In all our experimental groups, the results recorded that Rotifera was the most dominant prey. This result was confirmed by previous studies conducted by Rao et al. (2015) and Maciel De Lima et al. (2022). For Cladocera, it was the second dominant family on D-30 while the third dominant family on D-60 (8.79% and 0.16%, respectively). However, Copepoda was the third dominant family on D-30 and the second dominant family on D-60 (8.46% and 5.65%, respectively). However, these small invertebrates have been reported previously as good small invertebrates that are excellent feed and prey for aquatic animals (Abo-Taleb et al., 2021b; Helal et al., 2024).
For the free-living nematodes, it was represented in small amounts on both D-30 and D-60 (1.09% and 0.30%, respectively). It was concluded that the biofloc reduced the amount of free-living nematodes after 60 days of culture. The present result is consistent with those of several earlier studies that found that adding biological compounds to the amount of aquaculture water greatly reduced the number of Nematoda (Gallardo-Collí et al., 2019; Aboseif et al., 2022).
Table 5 shows the influence of biofloc supplementation levels on the small prey invertebrates’ culture, community, structure, and abundance in the water culture of Nile tilapia after day 30 and day 60.
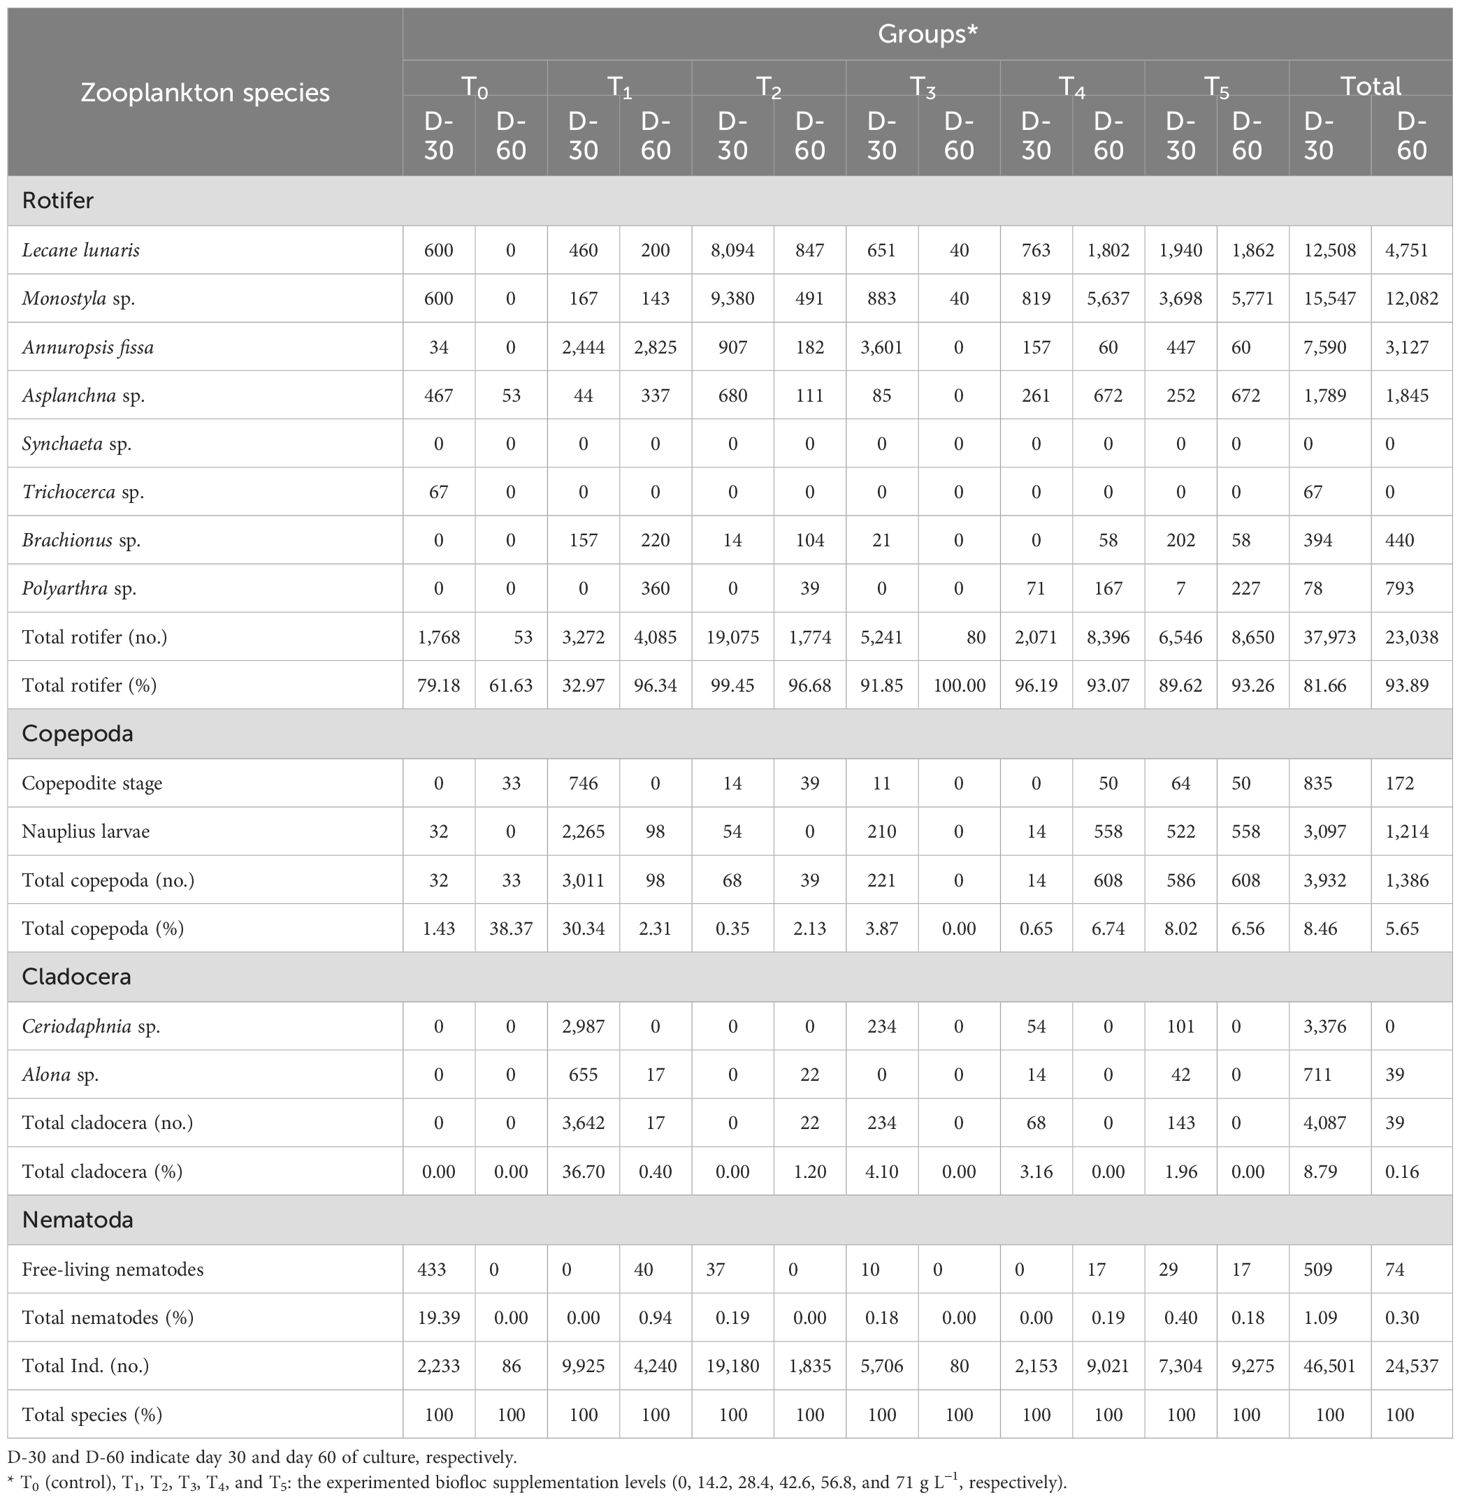
Table 5. Influence of biofloc supplementation levels on the small prey invertebrates’ culture, community, structure, and abundance in the water culture of Nile tilapia after day 30 (D-30) and day 60 (D-60).
As presented in Table 5, during this feeding trial period, 13 different small invertebrate forms were identified in different representations between all the groups (T0–T5). Rotifera was associated with eight species: L. lunaris, Monostyla sp., A. fissa, Asplanchna sp., Synchaeta sp., Trichocerca sp., Brachionus sp., and Polyarthra sp. Cladocera was reported with two species: Alona sp. and Ceriodaphnia sp. Copepoda was represented by two forms: copepodite stage and nauplius larvae. Finally, the Nematoda was represented by their free-living form.
In the case of D-30, the highest total number of individuals was reported in group T2, followed by T1, T5, T3, T0, and T4. The highest percentage of Rotifera was recorded in group T2, followed by T4, T3, T5, and T0, and finally T1. The highest Copepoda percentage was recorded in group T1, followed by T5, T3, T0, and T4, and finally T2. Cladocera was found only in groups T1, T3, T4, and T5. Finally, free-living nematodes were found only in groups T0, T5, T2, and T3 (Table 5).
In the case of D-60, this stage was the linked stage with data from Nile tilapia on growth performance, nutrient utilization efficiency, whole-body composition, and biochemical indicators. However, the highest total number of individuals was reported in group T4, followed by T5, T1, and T2. The lowest total number of individuals was reported in groups T0 and T3. For the other groups, the highest percentage of Rotifera was recorded in groups T5, T4, T2, T1, and finally T0. The highest percentage of Copepoda was recorded in groups T0, T4, T5, T2, and T1. No Copepoda was counted in T0. Cladocera was found only in groups T3 and T2. However, free-living nematode individuals were found only in groups T1, T4, and T5 (Table 5).
The findings of the present study demonstrated that increasing the inclusion levels of biofloc greatly enhanced the structure, diversity, culture, and abundance of small prey invertebrates. This result was in line with several previous studies on shrimp (Da Silva et al., 2022) and Nile tilapia (Helal et al., 2024). According to Nguyen et al. (2021), the biofloc supplementation levels greatly enhanced the plankton diversity and community structure and Nile tilapia performance across growth and feed consumption compared to a clear-water technology. Our results are consistent with those of Said and Taha (2022), who revealed that, in comparison to the clear system, all biofloc administrations had greater zooplankton counts. However, our results were inconsistent with those of Aboseif et al. (2022), who indicated that fish cultured on a control diet showed the highest species diversity and zooplankton abundance when compared to the biofloc groups. The variations in the water quality, fish stock density, and experimental settings could be the explanation for such variance. Stated differently, regarding D-60, the greater biological diversity of small invertebrates in the T1, T2, T4, and T5 groups may suggest that the fish in these tanks are dependent on an artificial feed diet while it is readily available, meet their daily needs, and save the effort of catching swimming prey items. However, the reduced diversity of small invertebrates in group T3 may be an indication that the fish are indeed reliant on prey for food. This decrease in prey, particularly in this biofloc group (T3), may be explained by the FCR value of this group (1.68), which is the lowest one in all experimented groups. This will be clarified, nevertheless, by the statistical analysis of PCA, and PCCC was carried out.
3.6 The data of statistical analysis
3.6.1 Principal component analysis
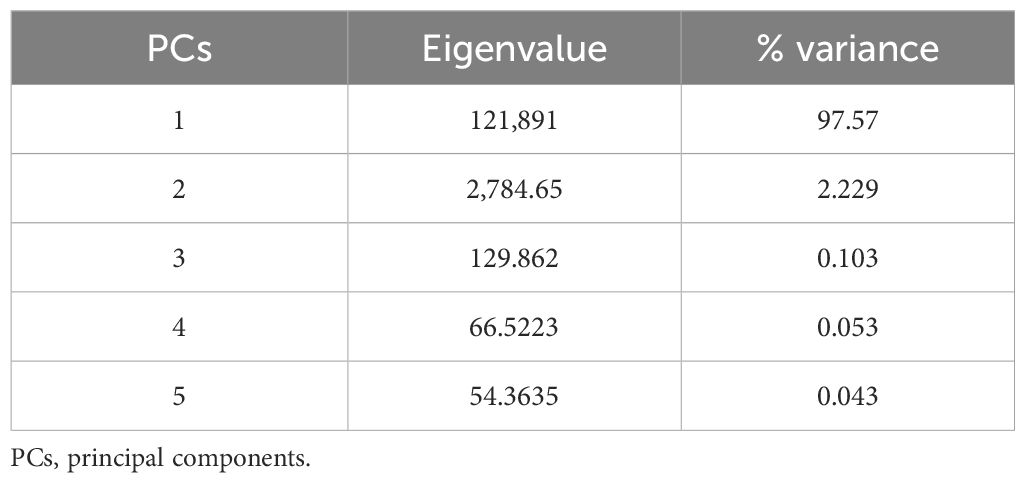
The principal component analysis (Figure 4) was applied to examine the relationship between the experimental biofloc concentrations (T0, T1, T2, T3, T4, and T5), FCR of Nile tilapia, and the total number of individuals and the families’ abundance (Rotifera, Copepoda, Cladocera, and free-living nematodes) of cultured small invertebrates after 60 days (D-60). Moreover, Table 4 shows the eigenvalue and the variance (%) of the PCs. Table 6 demonstrates that eigenvalues and variance (%) for axis 1 tend to be higher than those for axis 2.
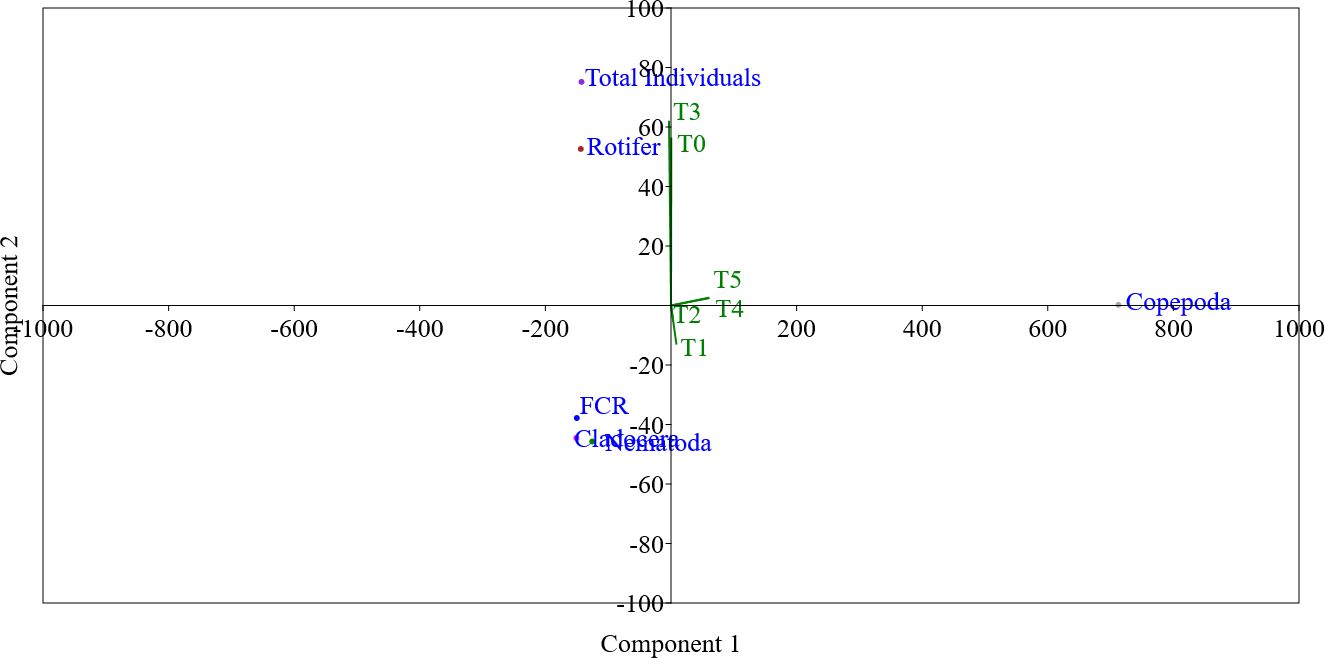
Figure 4. The principal component analysis (PCA) shows the relation between the experimented biofloc concentrations (T0, T1, T2, T3, T4, and T5), feed conversion ratio (FCR) of Nile tilapia, and the total individuals and the families (Rotifera, Copepoda, Cladocera, and free-living nematodes) of cultured small invertebrates after 60 days (D-60).
The PCA in Figure 4 confirms that, regarding component 1, there is a positive close relation between biofloc supplementation groups of T0 and T3 with the total individual, Rotifera abundance, and FCR. It is well known that for fish, when the FCR tends to decrease in value, it is much better than its high values. This fact explains the long distance between T0, T3, the total individual, Rotifera abundance, and FCR on component 1. However, the abundance of Rotifera and total individual do not affect the other biofloc supplementation groups. The rest of all biofloc supplementation groups (T1, T2, T4, and T5) were all related to component 2. However, related to component 2, there is a positive close relation between biofloc supplementation groups of T4 and T5 with Copepoda.
Moreover, Figure 5 shows the strong positive close relation between the total individual, Rotifera abundance, and FCR. However, Figure 5 shows the strong positive close relation between Cladocera and free-living nematodes. However, Copepoda did not show any close relation to other small invertebrates cultured (Figure 5). Based on the results of the PCA, it may be concluded that the positive close relation between FCR and small invertebrate prey (mainly the total individual and Rotifera abundance) may explain the improvement in FCR in T3 compared to the control group (T0) as well as the other biofloc supplementation groups (T1, T2, T4, and T5).
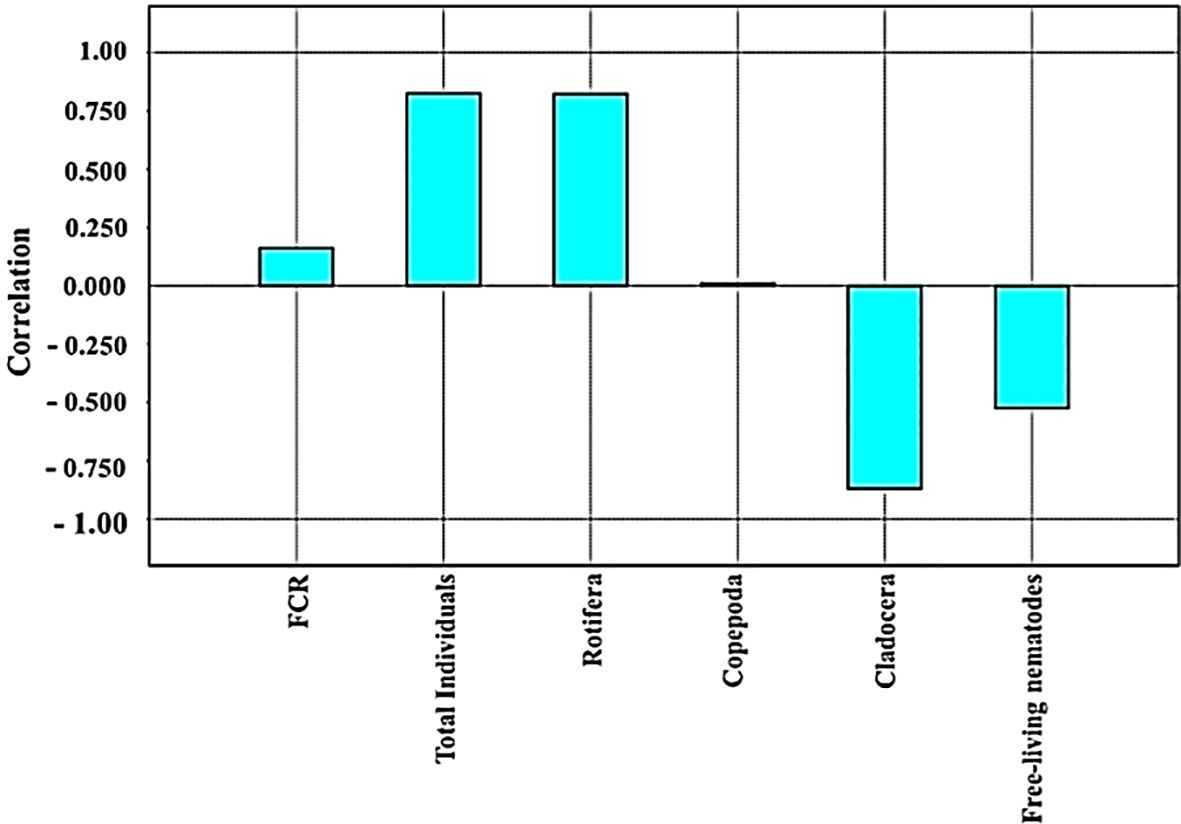
Figure 5. The positive close relation between cultured small invertebrate prey as live feed for Nile tilapia after 60 days.
Figure 6 shows the polynomial regression between zooplankton abundance and biofloc supplementation levels of the experimented groups (T0 “control”, T1, T2, T3, T4, and T5: 0, 14.2, 28.4, 42.6, 56.8, and 71 g L−1, respectively), reporting that with the increase of biofloc supplementation levels, zooplankton abundance polynomial regression (Figure 5) was increased (r2 = 0.204). This finding was previously indicated by Helal et al. (2024).
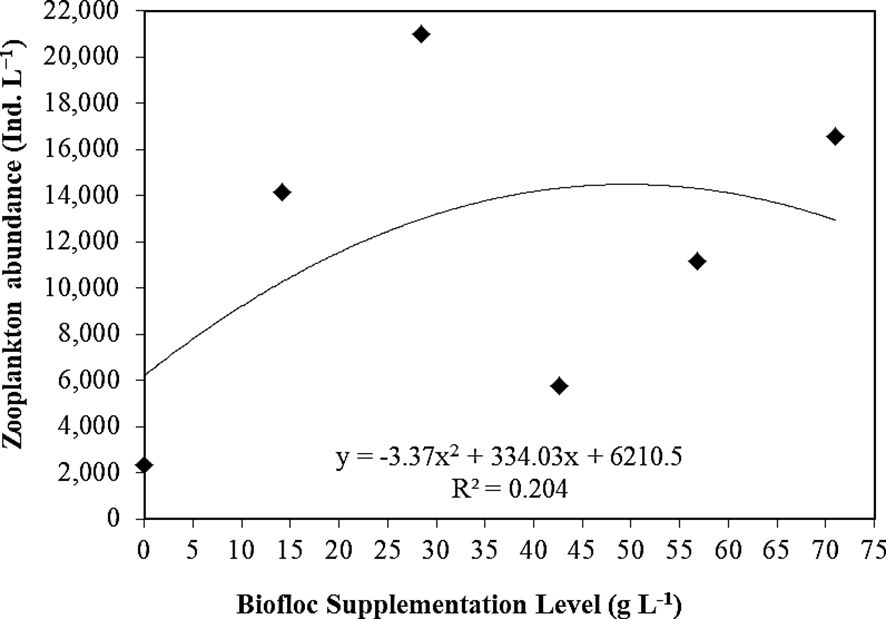
Figure 6. Polynomial regression between biofloc supplementation level (T0 “control”, T1, T2, T3, T4, and T5: 0, 14.2, 28.4, 42.6, 56.8, and 71 g L−1, respectively) and total zooplankton abundance (D-30 and D-60).
3.6.2 Pearson’s correlation coefficient confidence
PCCC examined the correlation relationship between all studied parameters in the current study to investigate the most correlated biofloc supplementation groups (T1, T2, T3, T4, and T5) with the control group (T0), as presented in Figure 7 and Table 7.
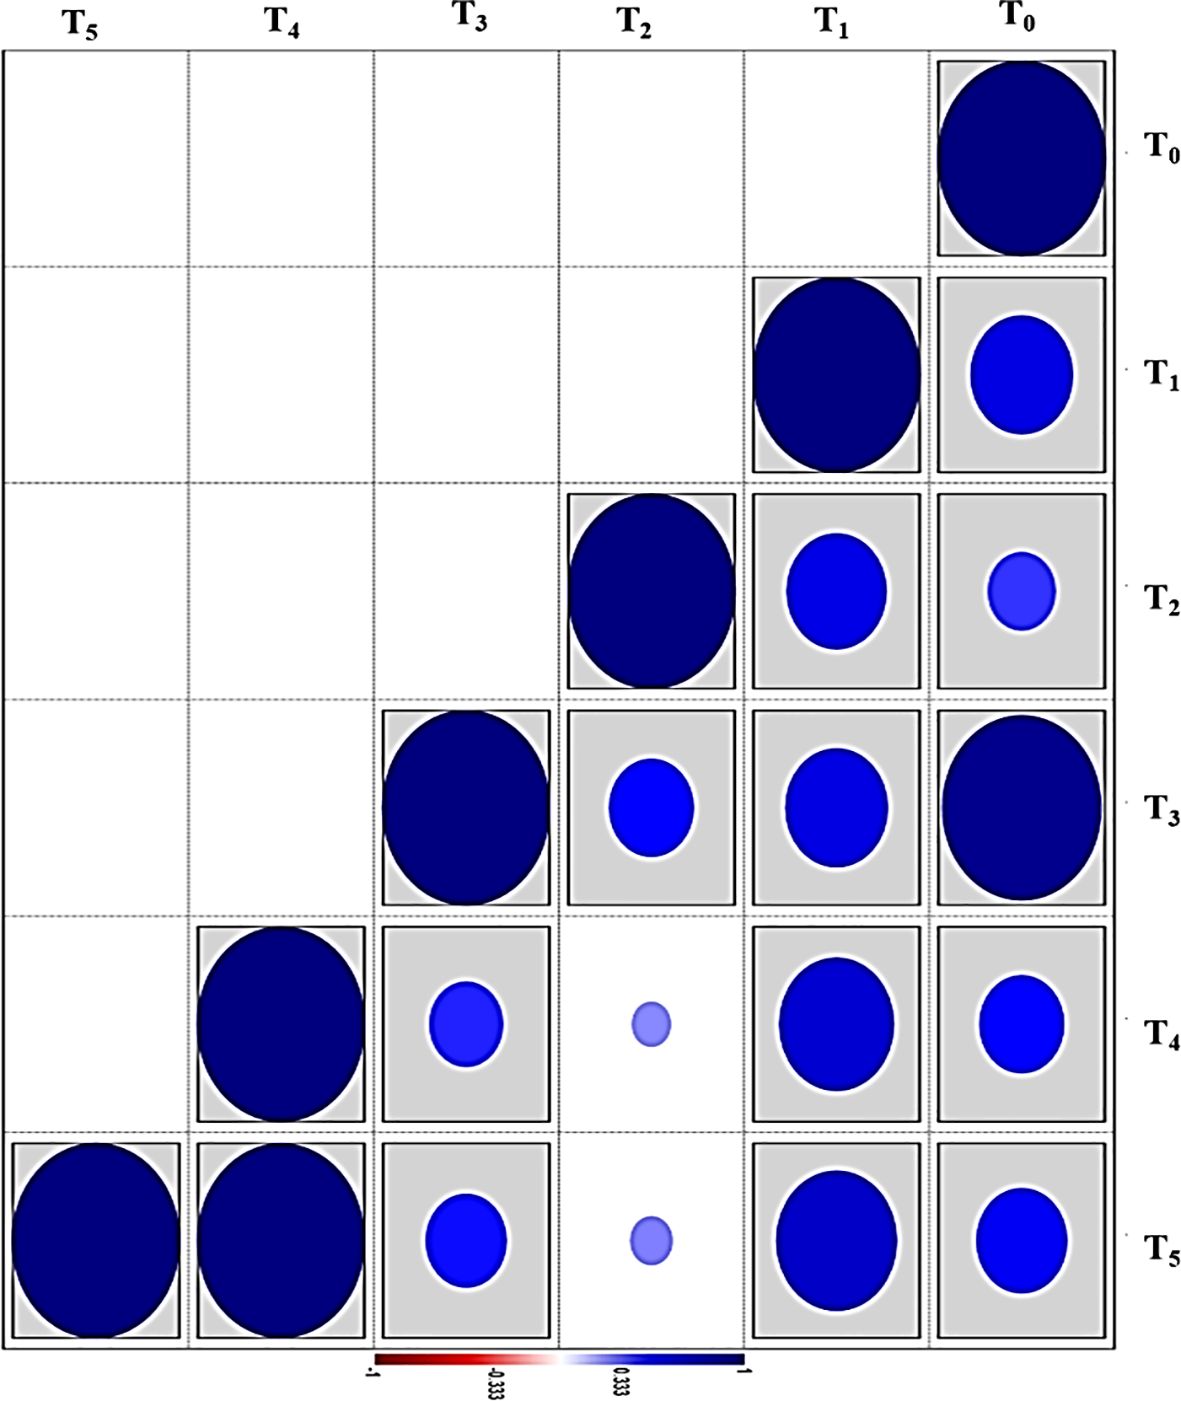
Figure 7. Pearson’s correlation coefficient confidence (PCCC) between biofloc supplementation groups based on all studied parameters in the current study after 60 days. The probability is shown in the sidebar: the circle shape within the box correlates to the significance (p < 0.05). T0 (control), T1, T2, T3, T4, and T5: the experimented biofloc supplementation levels (0, 14.2, 28.4, 42.6, 56.8, and 71 g L−1, respectively).
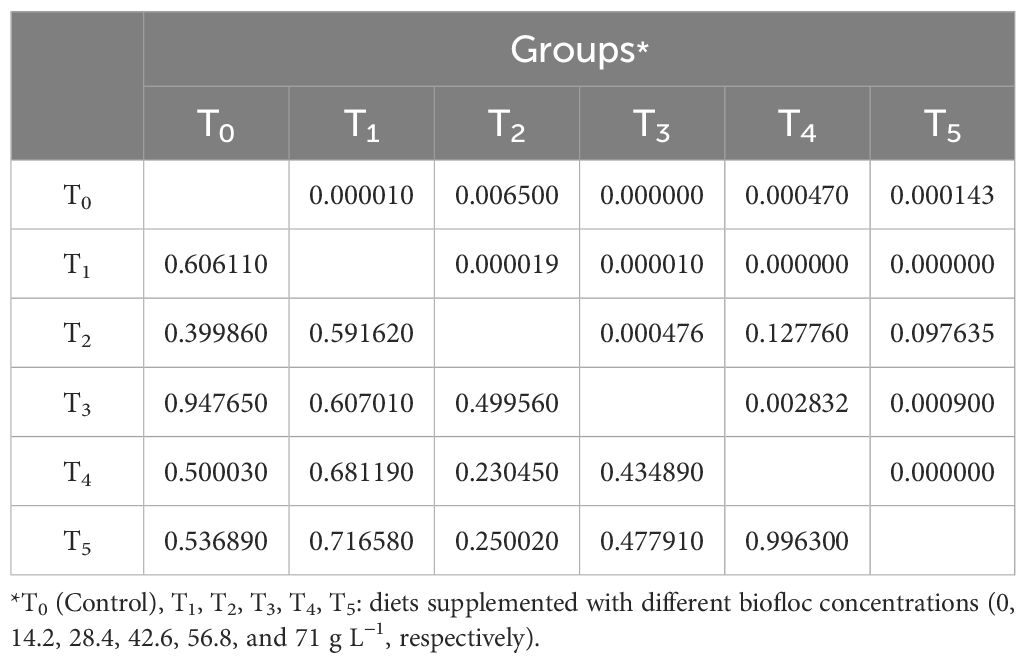
Table 7. Pearson’s correlation coefficient confidence (PCCC) between biofloc supplementation groups based on all studied parameters in the current study after 60 days.
The PCCC was calculated based on the data collected after 60 days (D-60) of cultured small invertebrates and at the end of rearing Nile tilapia in biofloc supplementation levels. The PCCC was performed based on the experimental biofloc concentrations (T0, T1, T2, T3, T4, and T5) in correlation to the cultured prey of small invertebrates of total individuals, families (Rotifera, Copepoda, Cladocera, and free-living nematodes), and species composition (13 forms of Brachionus sp., Monostyla sp., A. fissa, Asplanchna sp., Synchaeta sp., Trichocerca sp., Polyarthra sp., copepodite stage, nauplius larvae of copepods, Ceriodaphnia sp., Alona sp., and free-living nematodes), water quality indices (°C, DO, T.AI, TDS, EC, pH, NO2, NO3, and NH3), and Nile tilapia performance across growth (FW, FL, LGR, WGR, SGR, and SR), nutrient efficiency (FCR), whole-body analysis (CP, EE, DM, and ash), and the hemato-biochemical indicators (TP, ALB, GLB, UA, creatinine, AST, and ALT).
As presented in Figure 7 and Table 7, the results of the current study showed that the highest PCCC with the control group (T0) was group T3 (0.947), followed by T1 (0.606), T5 (0.536), T4 (0.500), and T2 (0.390). However, groups T4 and T4 exhibited the highest PCCC (1.00) among the biofloc supplementation groups. Based on these statistical findings, it can be concluded that the low final individuals in cultured zooplankton in T3 are attributed to the high small invertebrate prey consumption by fish in this group, which relied on this prey as live feed. This conclusion is confirmed by the FCR value in this group (1.68), which is the lowest in all experimented groups.
4 Conclusions
Aquaculture activities face a variety of challenges that affect sustainability and expansion, the most crucial one being the availability of feed. Recently, the application of biofloc supplementation in water culture, as a sustainable clean aquadiet strategy, has increased significantly due to its advantages. In this work, as a sustainable clean aquadiet strategy, the biofloc supplementation (42.6 g L−1) significantly enhanced the growth performance and FCR of Nile tilapia, regarding the culture of small prey invertebrates during 60 days.
Data availability statement
The datasets presented in this study can be found in online repositories. The names of the repository/repositories and accession number(s) can be found in the article/supplementary material.
Ethics statement
The animal study was approved by the National Institute of Oceanography and Fisheries (NIOF) Committee for Institutional Care of Aquatic Organisms and Experimental Animals. The study was conducted in accordance with the local legislation and institutional requirements.
Author contributions
ASA: Funding acquisition, Resources, Writing – review & editing. MMZ: Methodology, Writing – original draft. AMH: Methodology, Writing – original draft, Conceptualization, Resources, Project administration, Formal Analysis. DTM: Investigation, Methodology, Writing – original draft. MDH: Writing – original draft, Investigation. AA-A: Data curation, Methodology, Writing – original draft. MMR: Validation, Writing – original draft. AE-S: Investigation, Supervision, Writing – original draft. EE-H: Investigation, Software, Supervision, Writing – original draft. MN: Data curation, Investigation, Methodology, Writing – original draft. ATM: Software, Supervision, Visualization, Writing – review & editing. MA: Investigation, Writing – original draft, Conceptualization, Data curation, Formal Analysis, Methodology, Resources, Software, Supervision, Validation, Visualization, Writing – review & editing.
Funding
The author(s) declare that no financial support was received for the research, authorship, and/or publication of this article.
Acknowledgments
The authors would like to acknowledge the National Institute of Oceanography and Fisheries (NIOF), Egypt, for supporting this work. Additionally, the authors would like to express their sincere gratitude to Prof. Dr. Hossam El-Saaed, Head of NIOF’s Aquaculture Division, for his essential help throughout the project idea discussions. The authors also thank the researchers and technicians listed in the project proposal, as well as every member of the Fish Rearing Lab (FRL), for their crucial assistance.
Conflict of interest
The authors declare that the research was conducted in the absence of any commercial or financial relationships that could be construed as a potential conflict of interest.
The author(s) declared that they were an editorial board member of Frontiers, at the time of submission. This had no impact on the peer review process and the final decision.
Generative AI statement
The author(s) declare that no Generative AI was used in the creation of this manuscript.
Publisher’s note
All claims expressed in this article are solely those of the authors and do not necessarily represent those of their affiliated organizations, or those of the publisher, the editors and the reviewers. Any product that may be evaluated in this article, or claim that may be made by its manufacturer, is not guaranteed or endorsed by the publisher.
References
Abdel-Khalek A. A., Badran S. R., Marie M.-A. S. (2020). The efficient role of rice husk in reducing the toxicity of iron and aluminum oxides nanoparticles in Oreochromis niloticus: hematological, bioaccumulation, and histological endpoints. Water air Soil pollut 231, 1–15. doi: 10.1007/s11270-020-4424-2
Abdullah A. F., Man H. C., Mohammed A., Abd Karim M. M., Yunusa S. U., Jais N. A. B. M. (2024). Charting the aquaculture internet of things impact: Key applications, challenges, and future trend. Aquaculture Rep 39, 102358. doi: 10.1016/j.aqrep.2024.102358
Aboseif A. M., Flefil N. S., Taha M. K., Tahoun U. M., Mola H. R. A., El-Haroun E., et al. (2022). Influence of dietary C: N: P ratios on Nile tilapia Oreochromis niloticus growth performance and formation of water biotic communities within a biofloc system containment. Aquaculture Rep 24, 101136. doi: 10.1016/j.aqrep.2022.101136
Abo-Taleb H., Ashour M., Elokaby M. A., Mabrouk M. M., El-Feky M. M., Abdelzaher O. F, et al. (2021a). Effect of a new feed daphnia magna (Straus 1820), ailization, histological status, and economic revenue of grey mullet, mugil cephalus (Linnaeus 1758). Sustainability 13, 7093. doi: 10.3390/su13137093
Abo-Taleb H. A., El-Feky M. M., Azab A. M., Mabrouk M. M., Elokaby M. A., Ashour M., et al. (2021b). Growth performance, feed utilization, gut integrity, and economic revenue of grey mullet, mugil cephalus, fed an increasing level of dried zooplankton biomass meal as fishmeal substitutions. Fishes 6, 38. doi: 10.3390/fishes6030038
Abo-Taleb H. A., El-Feky M. M. M., Azab A. M., Mabrouk M. M., Elokaby M. A., Ashour M., et al. (2021c). Growth performance, feed utilization, gut integrity, and economic revenue of grey mullet, mugil cephalus, fed an increasing level of dried zooplankton biomass meal as fishmeal substitutions. Fishes 6, 38. doi: 10.3390/fishes6030038
Ahmed M., N. S., Flefil N., Tayel I., Mahmoud A., Soliman A.-G. (2019). Biological treatment of ammonia using biofloc system for Oreochromis niloticus fish. Egyptian J. Aquat. Biol. Fisheries 23, 639–657. doi: 10.21608/ejabf.2019.60912
Aliabad H. S., Naji A., Mortezaei S. R. S., Sourinejad I., Akbarzadeh A. (2022). Effects of restricted feeding levels and stocking densities on water quality, growth performance, body composition and mucosal innate immunity of Nile tilapia (Oreochromis niloticus) fry in a biofloc system. Aquaculture 546, 737320.
AOAC (2003). Official methods of analysis of the Association of Official Analytical Chemists (The Association).
Avnimelech Y. (1999). Carbon/nitrogen ratio as a control element in aquaculture systems. Aquaculture 176, 227–235. doi: 10.1016/S0044-8486(99)00085-X
Azim M. E., Little D. C. (2008). The biofloc technology (BFT) in indoor tanks: water quality, biofloc composition, and growth and welfare of Nile tilapia (Oreochromis niloticus). Aquaculture 283, 29–35. doi: 10.1016/j.aquaculture.2008.06.036
Beutler M., Wiltshire K., Meyer B., Moldaenke C., Luring C., Meyerhofer M. (2014). APHA (2005), standard methods for the examination of water and wastewater, Washington DC: American Public Health Association. Dissolved Oxyg. Dyn. Model. Case Study A Subtrop. Shallow Lake 217, 95.
Bjørndal T., Dey M., Tusvik A. (2024). Economic analysis of the contributions of aquaculture to future food security. Aquaculture 578, 740071. doi: 10.1016/j.aquaculture.2023.740071
Chen X., Luo G., Tan J., Tan H., Yao M. (2020). Effects of carbohydrate supply strategies and biofloc concentrations on the growth performance of African catfish (Clarias gariepinus) cultured in biofloc systems. Aquaculture 517, 734808. doi: 10.1016/j.aquaculture.2019.734808
Das R. R., Sarkar S., Saranya C., Esakkiraj P., Aravind R., Saraswathy R., et al. (2022). Co-culture of Indian white shrimp, Penaeus indicus and seaweed, Gracilaria tenuistipitata in amended biofloc and recirculating aquaculture system (RAS). Aquaculture 548, 737432. doi: 10.1016/j.aquaculture.2021.737432
Da Silva W. A., Da Silva J. L., Oliveira C. Y. B., De Moraes A. P. M., Shinozaki-Mendes R. A., Silva U. L. (2022). Effect of stocking density on water quality, plankton community structure, and growth performance of Litopenaeus vannamei (Boone 1931) post-larvae cultured in low-salinity biofloc system. Int. Aquat. Res 14, 107.
Dhont J., Dierckens K., Støttrup J., Van Stappen G., Wille M., Sorgeloos P. (2013). “Rotifers, Artemia and copepods as live feeds for fish larvae in aquaculture,” in Advances in aquaculture hatchery technology (Elsevier).
Einsle U. (1996). “Copepoda,” in Cyclopoida Guides the identification of the micro invertebrates of the continental waters of the world (Gustav Fisher Verlag, Stuttgart Jena New Yark), 81.
Ekasari J., Angela D., Waluyo S. H., Bachtiar T., Surawidjaja E. H., Bossier P., et al. (2014). The size of biofloc determines the nutritional composition and the nitrogen recovery by aquaculture animals. Aquaculture 426, 105–111. doi: 10.1016/j.aquaculture.2014.01.023
El-Hawarry W. N., Shourbela R. M., Haraz Y. G., Khatab S. A., Dawood M. A. (2021). The influence of carbon source on growth, feed efficiency, and growth-related genes in Nile tilapia (Oreochromis niloticus) reared under biofloc conditions and high stocking density. Aquaculture 542, 736919. doi: 10.1016/j.aquaculture.2021.736919
El-Sayed A.-F. M (2006). Tilapia culture in salt water: environmental requirements, nutritional implications and economic potentials. Avances en Nutricion Acuicola.
FAO (2022). The state of world fisheries and aquaculture 2022 (Food Agriculture Organization of the United Nations).
Fasano G., Franceschini A. (1987). A multidimensional version of the Kolmogorov–Smirnov test. Monthly Notices R. Astronomical Soc 225, 155–170. doi: 10.1093/mnras/225.1.155
Fauji H., Budiardi T., Ekasari J. (2018). Growth performance and robustness of African Catfish Clarias gariepinus (Burchell) in biofloc-based nursery production with different stocking densities. Aquaculture Res 49, 1339–1346. doi: 10.1111/are.2018.49.issue-3
Gallardo-Collí A., Pérez-Rostro C. I., Hernández-Vergara M. P. (2019). Reuse of water from biofloc technology for intensive culture of Nile tilapia (Oreochromis niloticus): effects on productive performance, organosomatic indices and body composition. Int. Aquat. Res 11, 43–55. doi: 10.1007/s40071-019-0218-9
Glassic H. C., Guy C. S., Tronstad L. M., Lujan D. R., Briggs M. A., Albertson L. K., et al. (2023). Invasive predator diet plasticity has implications for native fish conservation and invasive species suppression. PloS One 18, e0279099. doi: 10.1371/journal.pone.0279099
Haghparast M. M., Alishahi M., Ghorbanpour M., Shahriari A. (2020). Evaluation of hemato-immunological parameters and stress indicators of common carp (Cyprinus carpio) in different C/N ratio of biofloc system. Aquaculture Int 28, 2191–2206. doi: 10.1007/s10499-020-00578-1
Haraz Y. G., Shourbela R. M., El-Hawarry W. N., Mansour A. M., Elblehi S. S. (2023). Performance of juvenile Oreochromis niloticus (Nile tilapia) raised in conventional and biofloc technology systems as influenced by probiotic water supplementation. Aquaculture 566, 739180. doi: 10.1016/j.aquaculture.2022.739180
Helal A. M., Zaher M. M., Meshhal D. T., Ashour M., Younis E. M., Abdelwarith A. A., et al. (2024). Biofloc supplementation improves growth performances, nutrient utilization, and histological status of Nile tilapia (Oreochromis niloticus) while enhancing zooplankton diversity, community, and abundance. Aquaculture 585, 740711. doi: 10.1016/j.aquaculture.2024.740711
Henry J., Todd S., Sanford L., Davidsohn S (1974). Clinical diagnosis and measurement by laboratory methods. Todd-Sanford-Davidsohn. Philadephia: WB Saunders.
Hersi M. A., Genc E., Pipilos A., Keskin E. (2023). Effects of dietary synbiotics and biofloc meal on the growth, tissue histomorphology, whole-body composition and intestinal microbiota profile of Nile tilapia (Oreochromis niloticus) cultured at different salinities. Aquaculture 570, 739391. doi: 10.1016/j.aquaculture.2023.739391
Hisano H., Barbosa P. T. L., De Arruda Hayd L., Mattioli C. C. (2021). Comparative study of growth, feed efficiency, and hematological profile of Nile tilapia fingerlings in biofloc technology and recirculating aquaculture system. Trop. Anim. Health Production 53, 60. doi: 10.1007/s11250-020-02523-z
Hisano H., Barbosa P. T., Hayd L. A., Mattioli C. C. (2019). Evaluation of Nile tilapia in monoculture and polyculture with giant freshwater prawn in biofloc technology system and in recirculation aquaculture system. Int. Aquat. Res 11, 335–346. doi: 10.1007/s40071-019-00242-2
Huang Q., Huang K., Ma Y., Qin X., Wen Y., Sun L., et al. (2015). Feeding frequency and rate effects on growth and physiology of juvenile genetically improved farmed Nile Tilapia. North Am. J. Aquaculture 77, 503–512. doi: 10.1080/15222055.2015.1066472
Hunter J. R. (1980). “The feeding behavior and ecology of marine fish larvae,” in Fish behavior and its use in the capture and culture of fishes, ICLARM Conference Proceedings. 287–330.
Kajgrová L., Pecha O., Roy K., Dvořák J., Let M., Potužák J., et al. (2024). Pond cascades as a tool for ecological aquaculture allowing natural zooplankton succession, nutrient retention, and multiple stocking–harvesting cycles. Aquacultural Eng 104, 102374.
Khanjani M. H., Mozanzadeh M. T., Sharifinia M., Emerenciano M. G. C. (2023). Biofloc: A sustainable dietary supplement, nutritional value and functional properties. Aquaculture 562, 738757. doi: 10.1016/j.aquaculture.2022.738757
Kishawy A. T., Sewid A. H., Nada H. S., Kamel M. A., El-Mandrawy S. A., Abdelhakim T. M., et al. (2020). Mannanoligosaccharides as a carbon source in Biofloc boost dietary plant protein and water quality, growth, immunity and Aeromonas hydrophila resistance in Nile tilapia (Oreochromis niloticus). Animals 10, 1724. doi: 10.3390/ani10101724
Koste W. (1978). Rotatoria Die Rodertiere Mitteleuropas begründet von Max Voigt-Monogononta. 2. Auflage neubearbeitet von Walter Koste. Gebrüder Borntraeger 1, 238.
Larsen K. (1972). Creatinine assay by a reaction-kinetic principle. Clinica chimica Acta 41, 209–217. doi: 10.1016/0009-8981(72)90513-X
Lertwanakarn T., Purimayata T., Luengyosluechakul T., Grimalt P. B., Pedrazzani A. S., Quintiliano M. H., et al. (2023). Assessment of tilapia (Oreochromis spp.) welfare in the semi-intensive and intensive culture systems in Thailand. Animals 13, 2498.
Levene H. (1960). Robust tests for equality of variances. Contributions to probability Stat, 278–292.
Long L., Yang J., Li Y., Guan C., Wu F. (2015). Effect of biofloc technology on growth, digestive enzyme activity, hematology, and immune response of genetically improved farmed tilapia (Oreochromis niloticus). Aquaculture 448, 135–141. doi: 10.1016/j.aquaculture.2015.05.017
Lowry O. H. (1951). Protein measurement with the Folin phenol reagent. J. Biol. Chem 193, 265–275. doi: 10.1016/S0021-9258(19)52451-6
Luo G., Gao Q., Wang C., Liu W., Sun D., Li L., et al. (2014). Growth, digestive activity, welfare, and partial cost-effectiveness of genetically improved farmed tilapia (Oreochromis niloticus) cultured in a recirculating aquaculture system and an indoor biofloc system. Aquaculture 422, 1–7. doi: 10.1016/j.aquaculture.2013.11.023
Maciel De Lima P. C., De Andrade R. J. V., Elins Moreira Da Silva A., Campos C. V. F., d. S., Oliveira C. Y. B., et al. (2022). Effects of different molasses application rates on planktonic composition in low salinity biofloc culture of Nile tilapia, Oreochromis niloticus fingerlings. Chem. Ecol 38, 913–934. doi: 10.1080/02757540.2022.2129623
Magouz F. I., Essa M. A., Matter M., Mansour A. T., Gaber A., Ashour M. (2021a). Effect of different salinity levels on population dynamics and growth of the cyclopoid copepod Oithona nana. Diversity 13, 190. doi: 10.3390/d13050190
Magouz F. I., Essa M. A., Matter M., Tageldein Mansour A., Alkafafy M., Ashour M. (2021b). Population dynamics, fecundity and fatty acid composition of oithona nana (Cyclopoida, copepoda), fed on different diets. Animals 11, 1188. doi: 10.3390/ani11051188
Mansour A. T., Ashry O. A., Ashour M., Alsaqufi A. S., Ramadan K. M., Sharawy Z. Z. (2022a). The optimization of dietary protein level and carbon sources on biofloc nutritive values, bacterial abundance, and growth performances of whiteleg shrimp (Litopenaeus vannamei) juveniles. Life 12, 888. doi: 10.3390/life12060888
Mansour A. T., Ashry O. A., El-Neweshy M. S., Alsaqufi A. S., Dighiesh H. S., Ashour M., et al. (2022b). Effect of agricultural by-products as a carbon source in a biofloc-based system on growth performance, digestive enzyme activities, hepatopancreas histology, and gut bacterial load of Litopenaeus vannamei post larvae. J. Mar. Sci. Eng 10, 1333. doi: 10.3390/jmse10101333
Minaz M., Kubilay A. (2021). Operating parameters affecting biofloc technology: carbon source, carbon/nitrogen ratio, feeding regime, stocking density, salinity, aeration, and microbial community manipulation. Aquaculture Int 29, 1121–1140. doi: 10.1007/s10499-021-00681-x
Mohammady E. Y., Soaudy M. R., Ali M. M., El-Ashry M. A., Abd El-Karim M. S., Jarmołowicz S., et al. (2023). Response of Nile tilapia under biofloc system to floating or sinking feed and feeding rates: Water quality, plankton community, growth, intestinal enzymes, serum biochemical and antioxidant status. Aquaculture Rep 29, 101489. doi: 10.1016/j.aqrep.2023.101489
Mudholkar G. S., Srivastava D. K., Thomas Lin C. (1995). Some p-variate adaptations of the Shapiro-Wilk test of normality. Commun. Statistics-Theory Methods 24, 953–985. doi: 10.1080/03610929508831533
Nguyen H. Y. N., Trinh T. L., Baruah K., Lundh T., Kiessling A. (2021). Growth and feed utilisation of Nile tilapia (Oreochromis niloticus) fed different protein levels in a clear-water or biofloc-RAS system. Aquaculture 536, 736404. doi: 10.1016/j.aquaculture.2021.736404
Nhan D. K., Milstein A., Verdegem M. C., Verreth J. A. (2006). Food inputs, water quality and nutrient accumulation in integrated pond systems: a multivariate approach. Aquaculture 261, 160–173. doi: 10.1016/j.aquaculture.2006.07.015
Panigrahi A., Das R., Sivakumar M., Saravanan A., Saranya C., Sudheer N., et al. (2020). Bio-augmentation of heterotrophic bacteria in biofloc system improves growth, survival, and immunity of Indian white shrimp Penaeus indicus. Fish shellfish Immunol 98, 477–487. doi: 10.1016/j.fsi.2020.01.021
Pérez-Fuentes J. A., Hernández-Vergara M. P., Pérez-Rostro C. I., Fogel I. (2016). C: N ratios affect nitrogen removal and production of Nile tilapia Oreochromis niloticus raised in a biofloc system under high density cultivation. Aquaculture 452, 247–251.
Rao W., Ning J., Zhong P., Jeppesen E., Liu Z. (2015). Size-dependent feeding of omnivorous Nile tilapia in a macrophyte-dominated lake: implications for lake management. Hydrobiologia 749, 125–134. doi: 10.1007/s10750-014-2155-3
Raza B., Zheng Z., Yang W. (2024). A review on biofloc system technology, history, types, and future economical perceptions in aquaculture. Animals 14, 1489. doi: 10.3390/ani14101489
Reitman S., Frankel S. (1957). A colorimetric method for the determination of serum glutamic oxalacetic and glutamic pyruvic transaminases. Am. J. Clin. Pathol 28, 56–63. doi: 10.1093/ajcp/28.1.56
Said M. M., Taha E. M. (2022). Biofloc effects on body composition, plasma protein, lipid profile, zooplankton community, and economics of Nile Tilapia fingerlings reared under different stocking densities. Egyptian J. Aquat. Biol. Fisheries 26, 593–611. doi: 10.21608/ejabf.2022.252927
Santhanam R., Srinivasan A. (1994). A manual of marine zooplankton (Oxford & IBH Publishing Company).
Smironov N. (1996). Cladocera: the chydorinae anssayciinae (Chidoridae) of the world (SPB Academic Publishing bv), 119.
Souza R., Lima E. C. R., Melo F. P., Ferreira M. G. P., Correia E. (2019). The culture of Nile tilapia at different salinities using a biofloc system. Rev. Ciec. Agron 50, 267–275. doi: 10.5935/1806-6690.20190031
Tesfahun A., Temesgen M. (2018). Food and feeding habits of Nile tilapia Oreochromis niloticus (L.) in Ethiopian water bodies: A review. Int. J. Fisheries Aquat. Stud 6, 43–47.
Wootton R., Bryson E., Elsasser U., Freeman H., Green J., Hesp R., et al. (1982). Risk factors for fractured neck of femur in the elderly. Age Ageing 11, 160–168. doi: 10.1093/ageing/11.3.160
Keywords: biofloc, feed conversion ratio, Oreochromis niloticus, physiological performance, PCA, PCCC, small invertebrates
Citation: Al-Souti AS, Zaher MM, Helal AM, Meshhal DT, D. H. M, Al-Afify ADG, Rafaey MM, El-Saharty A, El-Haroun E, Nassif MG, Mansour AT and Ashour M (2025) Relation among zootechnical performance, biochemical indicators, water quality, and small invertebrates (zooplankton) abundance reared in biofloc-supplemented systems. Front. Mar. Sci. 11:1520765. doi: 10.3389/fmars.2024.1520765
Received: 31 October 2024; Accepted: 16 December 2024;
Published: 27 January 2025.
Edited by:
Mohammed Fouad El Basuini, Tanta University, EgyptReviewed by:
Ercüment Genç, Ankara University, TürkiyeJorge Palma, University of Algarve, Portugal
Islam Teiba, Tanta University, Egypt
Jibril Habib Yusuf, Tishk International University (TIU), Iraq
Ayaat Elmaghraby, City of Scientific Research and Technological Applications, Egypt
Copyright © 2025 Al-Souti, Zaher, Helal, Meshhal, D. H., Al-Afify, Rafaey, El-Saharty, El-Haroun, Nassif, Mansour and Ashour. This is an open-access article distributed under the terms of the Creative Commons Attribution License (CC BY). The use, distribution or reproduction in other forums is permitted, provided the original author(s) and the copyright owner(s) are credited and that the original publication in this journal is cited, in accordance with accepted academic practice. No use, distribution or reproduction is permitted which does not comply with these terms.
*Correspondence: Ahmed Said Al-Souti, c291dGlAc3F1LmVkdS5vbQ==; Mohamed Ashour, bWljcm9hbGdhZV9lZ3lwdEB5YWhvby5jb20=
 Ahmed Said Al-Souti
 Marwa M. Zaher2
 Amr M. Helal
 Mohamed M. Rafaey
 Ehab El-Haroun
 Abdallah Tageldein Mansour
 Mohamed Ashour