 SeungYong Lee
 Hanna Na
 Hong Sik Min
 Dong Guk Kim3
 Hirohiko Nakamura
94% of researchers rate our articles as excellent or good
Learn more about the work of our research integrity team to safeguard the quality of each article we publish.
Find out more
ORIGINAL RESEARCH article
Front. Mar. Sci., 31 January 2025
Sec. Physical Oceanography
Volume 11 - 2024 | https://doi.org/10.3389/fmars.2024.1512572
Entering the East China Sea (ECS) through the east of Taiwan, the Kuroshio flows northeastward, with its pathway confined along the continental slope of the Okinawa Trough. Four 75 kHz Acoustic Doppler Current Profilers (ADCPs) were deployed over a 3-year period (June 2020–June 2023), with two placed across the typical path of the Kuroshio in each of the two latitudinal bands, to examine the relationship of current variability between upstream and downstream in the ECS. The along-path and cross-path velocities from the four ADCPs show dominant intraseasonal variability with a period of 8–32 days. Within this frequency band, current velocities exhibit a strong relationship when the upstream precedes the downstream by 6 days. The amplitude of this lagged co-variability tends to be larger from May to August, with an increase in along-path speed variability of up to about 24% at approximately 250 m depth for the onshore sites and an increase in cross-path speed variability of up to about 22% within the 200–300 m layer for the offshore sites. The intraseasonal variability of the sea level anomaly associated with this observed co-variability displays the Kuroshio meanders along its path, propagating northeastward at a speed of about 14.8 km/day. These results provide observational evidence of the Kuroshio meander and its propagation in the ECS, characterized by subsurface intensification during the warm season.
The Kuroshio is a western boundary current in the North Pacific that flows into the East China Sea (ECS) through the east of Taiwan. The Kuroshio transports seawater, heat, and materials poleward, modulating regional ocean circulation and local weather systems in the ECS and other marginal seas (Gan et al., 2019; Park et al., 2023; Qiao et al., 2024; Matsuno et al., 2009; Lian et al., 2016; Liu et al., 2021). The Kuroshio in the ECS follows the steep continental slope of the Okinawa Trough, and its path is tightly constrained by the bathymetry in general (Figure 1). However, the Kuroshio often meanders along its path on various time scales (Vélez-Belchí et al., 2013; Liu et al., 2014; Wu et al., 2017; Kang and Na, 2022; Jo et al., 2022).
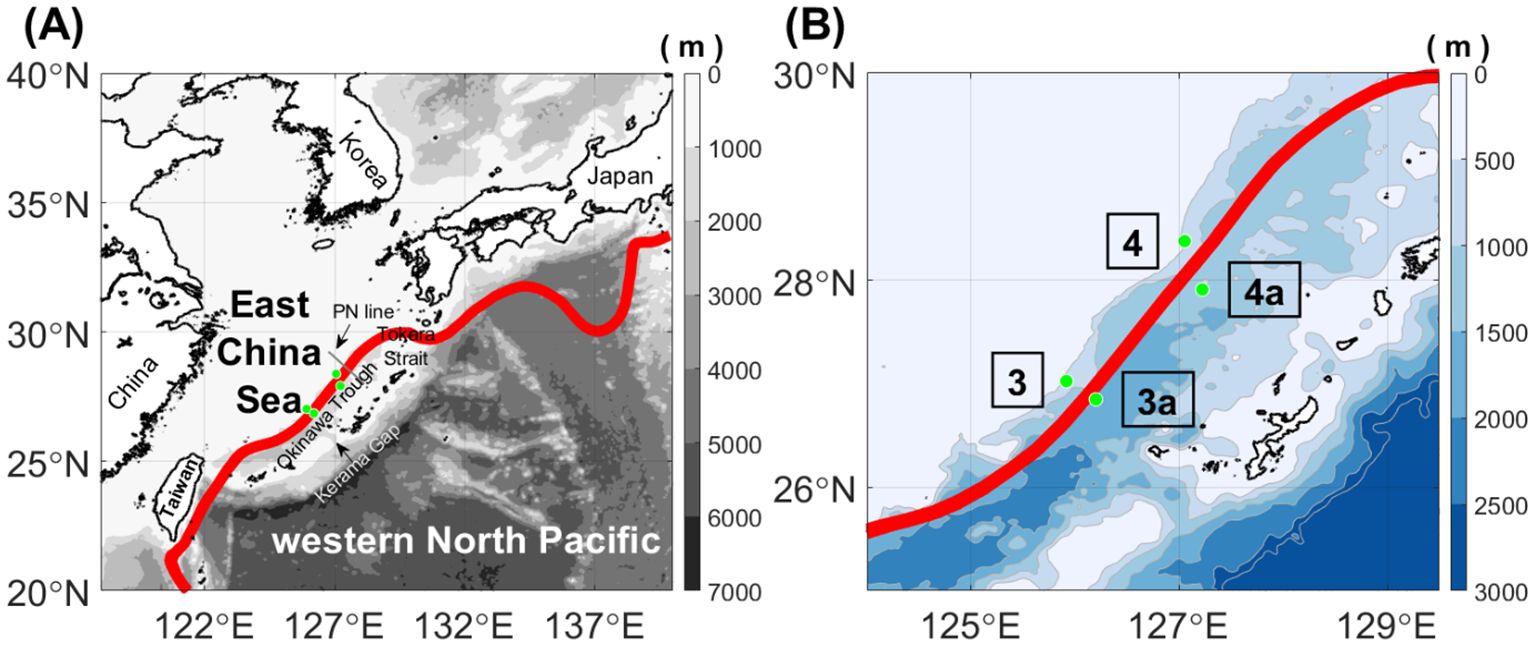
Figure 1. Maps of the western North Pacific and the East China Sea with ADCP mooring locations. (A) Bathymetry (shading) with gray contours every 1000 m. The red contour indicates the 125-cm contour of the mean (June 2020–June 2023) gridded absolute dynamic topography from satellite altimetry; it represents the position of the maximum surface geostrophic velocity. (B) Same as (A), but with blue contours every 500m. Green circles indicate locations of moored ADCP arrays with their station names (St. 3, St. 3a, St. 4, and St. 4a).
The Kuroshio in the ECS tends to weaken during winter, influenced by the prevailing northeasterly wind in the ECS (Tang et al., 2000; Liang et al., 2003; Liu et al., 2014; Nakamura et al., 2015; Zhang et al., 2021a; b). It has also been shown that in winter, the path of the Kuroshio shifts onshore compared to the summer (Guo et al., 2006; Nakamura et al., 2006; Ichikawa et al., 2008; Chang and Oey, 2011; Liu and Gan, 2012; Hsin et al., 2013; Wu et al., 2014; Yin et al., 2017). The strength and path of the Kuroshio in the ECS are further affected by westward-propagating mesoscale eddies and Rossby waves from the North Pacific, particularly from the Subtropical Countercurrent region (Andres et al., 2008b; Zhang et al., 2001; Chang and Oey, 2011; Jo et al., 2022). The anticyclonic eddy east of Taiwan increases the sea level difference across the Kuroshio, enhancing the northeastward flow (Hsin et al., 2013; Soeyanto et al., 2014; Cheng et al., 2017; Chang et al., 2018).
The Kuroshio variability in the ECS is not easily observed by satellite altimetry due to its limitations in spatial and temporal resolution. In-situ observations in the vicinity of the PN line (thin black line in Figure 1A) have shown that the Kuroshio in the ECS, hereafter referred to as the ECS-Kuroshio, exhibits significant spatial and temporal variability despite relatively short periods of measurements (Sugimoto et al., 1988; James et al., 1999; Andres et al., 2008a, b; Nakamura et al., 2003, 2008). Andres et al. (2008a) reported the spatial structure of the ECS-Kuroshio velocity across the continental slope near the PN line based on the mooring of the Acoustic Doppler Current Profilers (ADCP) and Inverted Echo Sounders (IES) for 7 months and 23 months, respectively. They identified two cores of the velocity maxima and noted that the locations of the cores vary by 70 km along the observation line. A countercurrent beneath the Kuroshio has also been investigated over the continental slope (Lie et al., 1998; James et al., 1999; Oka and Kawabe, 2003; Nakamura et al., 2003; 2008; Andres et al., 2008a; Wei et al., 2013). Nakamura et al. (2008) observed the southwestward flowing countercurrent and its persistence using 2-year moored current data, which is associated with eddy motions due to the Kuroshio meander west of Tokara Strait during the winter-spring period (Ichikawa, 2001; Nakamura et al., 2003; Chen et al., 2022).
Regarding the temporal scale of the ECS-Kuroshio meander, Sugimoto et al. (1988) revealed that the ECS-Kuroshio fluctuates with a period of 11–14 days based on one month of moored current meter data at 29°N. They suggested that the ECS-Kuroshio meander propagates downstream at a phase speed of approximately 25.9 km/day. James et al. (1999) also observed that the ECS-Kuroshio meander occurred with a period of 11 days throughout the deployment lasting longer than one year. They deployed the IES along and across the Kuroshio around 28°N and estimated the downstream propagation speed to be 23.6 km/day by calculating the time lag between dynamic height data from each instrument.
Although previous studies have reported the ECS-Kuroshio meander and its variability in the spatial structure of velocity over the continental shelf slope, there is still a limitation in understanding the upstream-downstream connectivity of the ECS-Kuroshio variability due to the lack of simultaneous observation data along the path of the Kuroshio. The observations in the ECS were mainly conducted along a single line (Nakamura et al., 2003, 2008; Andres et al., 2008a, b), either across or along the Kuroshio path, and operated for relatively short periods, ranging from one month to two years (Sugimoto et al., 1988; James et al., 1999; Nakamura et al., 2003, 2008; Andres et al., 2008a, b). Furthermore, most of the current data were not directly measured but were estimated from hydrographic data (Sugimoto et al., 1988; Oka and Kawabe, 2003) or IES (James et al., 1999; Andres et al., 2008a, b). The variability of the ECS-Kuroshio needs to be examined simultaneously both across and along the path of the Kuroshio, as it is crucial for understanding the spatially and temporally varying ECS-Kuroshio and its related upstream-downstream connectivity.
This study aims to examine the relationship between upstream and downstream Kuroshio variability through 3-year-long in-situ observations in order to present the characteristics of the Kuroshio meander and its downstream propagation. The data and methods used in this study, including details of the moored instruments and in-situ data processing, are described in the following section. The characteristics of the observed velocity profiles and covariability between the upstream and downstream are presented in Section 3. The discussions, summary and conclusions follow in Sections 4 and 5.
A total of four 75 kHz ADCPs (Workhorse Long Ranger 75-kHz) were deployed looking upward from June 2020 to June 2023. Two of them at St. 3 and St. 3a (hereafter referred to as upstream) were located at approximately 27°N, while the other two at St. 4 and St. 4a (hereafter referred to as downstream) were located at approximately 28°N (see Figure 1B). It was designed to observe the upper 500 m current velocity at two different latitudinal bands along the path of the Kuroshio in the ECS. Two sites (St. 3 and St. 4) were located at the shelf slope, while the other two (St. 3a and St. 4a) were positioned near the deepest part of the trough in their respective latitudinal bands. Details of the mooring information are summarized in Table 1. The bin length of the ADCP was set to 16 m, with each ping occurring every 3 minutes. The ensemble was produced every 30 minutes; therefore, every ten pings were included in one ensemble.
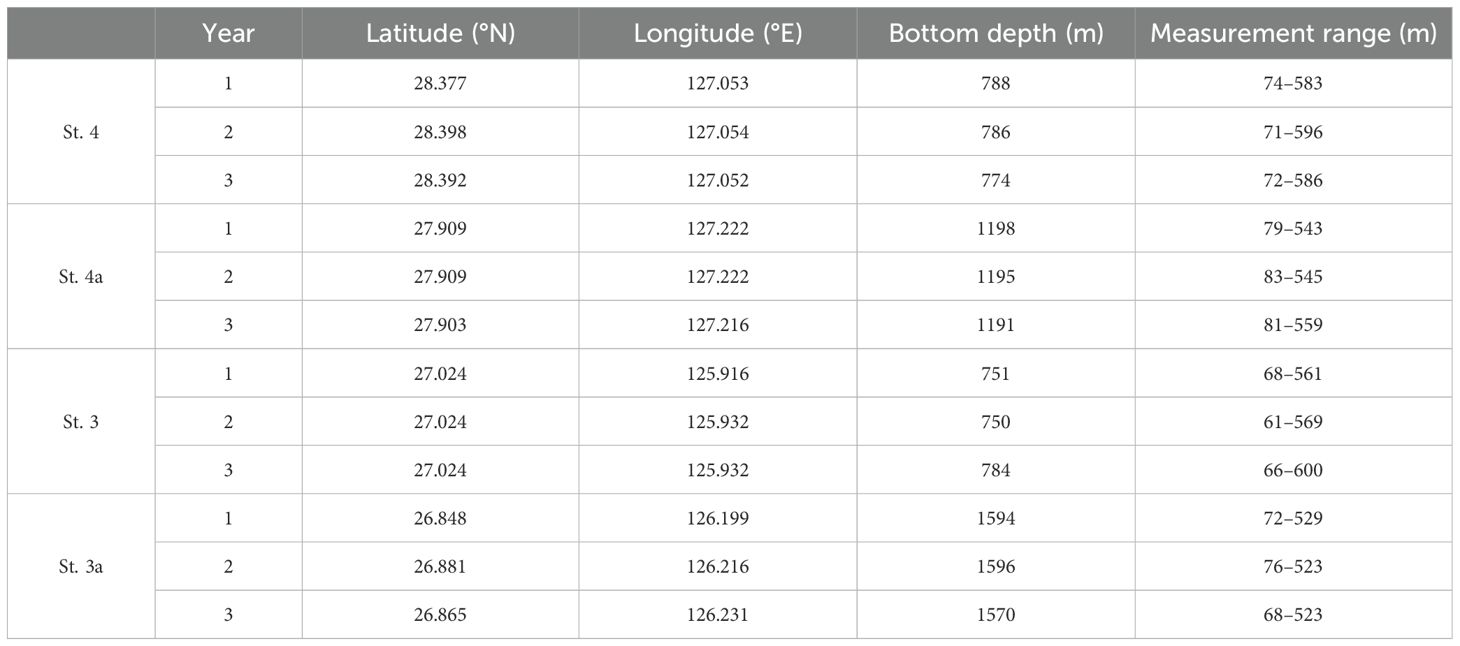
Table 1. ADCP mooring locations and depths.
The ADCP velocity data were used only for the period when the pressure recorded at the instrument was stable after removing the initial (during the deployment operation) and final (during the recovery operation) portions of the data. Record gaps (approximately 30 hours), resulting from battery replacements in June 2021 and June 2022, were interpolated using cubic spline methods. ‘‘Year 1’’, ‘‘Year 2’’, and “Year 3” denote June 2020–June 2021, June 2021–June 2022, and June 2022–June 2023, respectively. The current records were corrected for the local magnetic declination (approximately 5.9°). Quality control (QC) was performed using the following procedures. 1) The magnitude of the velocity should be greater than zero. 2) The percent good should be greater than 90%. 3) Remove near-surface cells with a depth greater than 3.5 times the bin size. 4) Remove any cell if the velocity of the upper cell is more than 10 cm/s less than that of the lower cell. Velocity data from the shallowest common depth, 83 m, to 504 m were linearly interpolated at 1 m intervals for each site and time step. The velocity data for each depth were obtained after applying a 3-day low-pass filter. Finally, the daily averaged velocity was calculated from the low-pass filtered data (hereafter referred to as processed data).
In addition, daily gridded maps of sea surface height above geoid (SSH), sea level anomaly (SLA), and surface geostrophic velocity were obtained with a spatial resolution of 0.25°from CMEMS (https://data.marine.copernicus.eu/; Global Ocean Gridded L 4 Sea Surface Heights And Derived Variables Nrt. E.U. Copernicus Marine Service Information (CMEMS); Global Ocean Gridded L 4 Sea Surface Heights And Derived Variables Reprocessed 1993 Ongoing. E.U. Copernicus Marine Service Information (CMEMS)) for investigating the spatial and temporal characteristics associated with the Kuroshio meander. Wind stress with a spatial resolution of 0.25° was obtained from the fifth generation ECMWF (ERA5; Hersbach et al., 2023). The wind data was subsampled 8 times a day and then averaged to obtain daily values.
Canonical correlation analysis (CCA; Bretherton et al., 1992; Nagano et al., 2017) was conducted to investigate the co-variability among the observed velocities. The CCA is useful for elucidating the common spatial patterns and temporal amplitudes in two data sets by finding the optimal linear combinations. It was applied to the time series of 8–32 day band-pass filtered and upper 400 m averaged along-path and cross-path velocity at all mooring sites, taking into account the periods of Kuroshio meander reported in previous studies, such as 7, 11, and 16 days reported by James et al. (1999), and a period of 8–24 days reported by Nakamura et al. (2003). The upstream components (St. 3 and St. 3a) are represented by , and the downstream components (St. 4 and St. 4a) are represented by , where denotes the velocity components at mooring sites, and denotes time. The two time series are expanded in terms of N vector as
where (, ) are the covarying coefficients and (, ) are spatial patterns with amplitude of the nth canonical mode. A correlation matrix , was computed between and , and singular value decomposition was performed on as;
where is the singular value of the mth canonical mode, (, ) are the left and right singular vectors. The maximum occurs when the upstream leads the downstream by 6 days, indicating the strongest contribution to the relationship between upstream and downstream components at this specific time lag compared to others (Supplementary Figure S1).
Hereafter, the CCA result is presented with the upstream components and downstream components lagged by 6 days. The optimal linear combination—referred to as canonical variables (CVs)—for upstream and downstream are expanded in terms of time series as;
To examine variations in other variables associated with the time-varying correlation between upstream and downstream, the lagged regression onto the CVs was calculated for the SSH, SLA, and wind stress fields.
Simultaneous observations both along and across the path of the Kuroshio reveal the mean direction of the ECS-Kuroshio along the continental slope of the Okinawa Trough. The mean currents at the four mooring sites are characterized by surface-intensified and northeastward flow of approximately 35° clockwise from true north in the upper 400 m layer (Figure 2A). At the onshore sites, St. 3 and St. 4, the velocity decreases sharply with depth, indicating a prominent countercurrent. The countercurrents are intermittently present at depths greater than approximately 200 m at St. 3, and greater than approximately 300 m at St. 4 (Supplementary Figures S2A, S3A). In contrast, at the offshore sites, St. 3a and St. 4a, the velocities decrease more smoothly with depth due to their proximity to the deepest part of the Okinawa Trough (Figure 1B). The standard deviations of the current velocity also vary with the observation site and depth (Figure 2A). At the onshore sites, the variation becomes more dominant in a northeast-southwest direction, while at the offshore sites, the variation becomes rather uniform in all directions. The upper 400 m averaged speeds (U400) show higher mean values in Year 1 compared to Years 2 and 3 at all mooring sites (Figure 2B). At the onshore sites, Year 2 shows a higher speed compared to Year 3, while at the offshore sites, Year 3 shows a higher speed compared to Year 2.

Figure 2. The processed current velocity data from the four ADCPs. (A) The mean velocity and standard deviation ellipse with a 40 m interval for Year 1, Year 2, and Year 3. The principal ellipses represent the major axis as the standard deviation of the along-path velocity (35°, clockwise from true north) and the minor axis as that of the cross-path velocity (125°). (B) The mean velocity of the depth-averaged current velocity in the upper 400 m. Error bars indicate the standard deviation of their sub-inertial velocity profiles (processed with a 72-hour low-pass filter and then averaged daily). All the processed velocity data from the common depths of 83 m to 504 m were linearly interpolated at 1 m intervals at each site and each time.
The current speeds at the shallowest common depth, 83 m, observed from the ADCPs (black lines in Figure 3) and the surface geostrophic speeds derived from satellite altimetry (red lines in Figure 3) appear to coincide well, with correlation coefficients ranging from 0.59 to 0.81 depending on the sites. Despite the high correlation, the ADCP-observed speed exhibits larger fluctuations at higher frequencies, which are difficult to capture via satellite altimetry, likely due to the limitations in the spatial and temporal resolution. The ADCP-observed U400 exhibits significant intraseasonal variability (ISV) with a time period ranging from 8 to 32 days, as determined by continuous wavelet analysis (Supplementary Figure S6). Note that the ISV exhibits more pronounced variance than interannual variability. The period range of ISV corresponds to that of Kuroshio meander in the ECS, as reported by James et al. (1999) and Nakamura et al. (2003). The Kuroshio meander is linked to onshore/offshore shifts of the Kuroshio and its main axis, which is represented by the variation in cross-path velocity. To examine the characteristics of the Kuroshio meander on the intraseasonal time scale, the ADCP-observed velocities are rotated to have the along-path (35°, clockwise from true north) and cross-path (125°) components of velocity, and then subjected to the 8–32 day band-pass filtering.
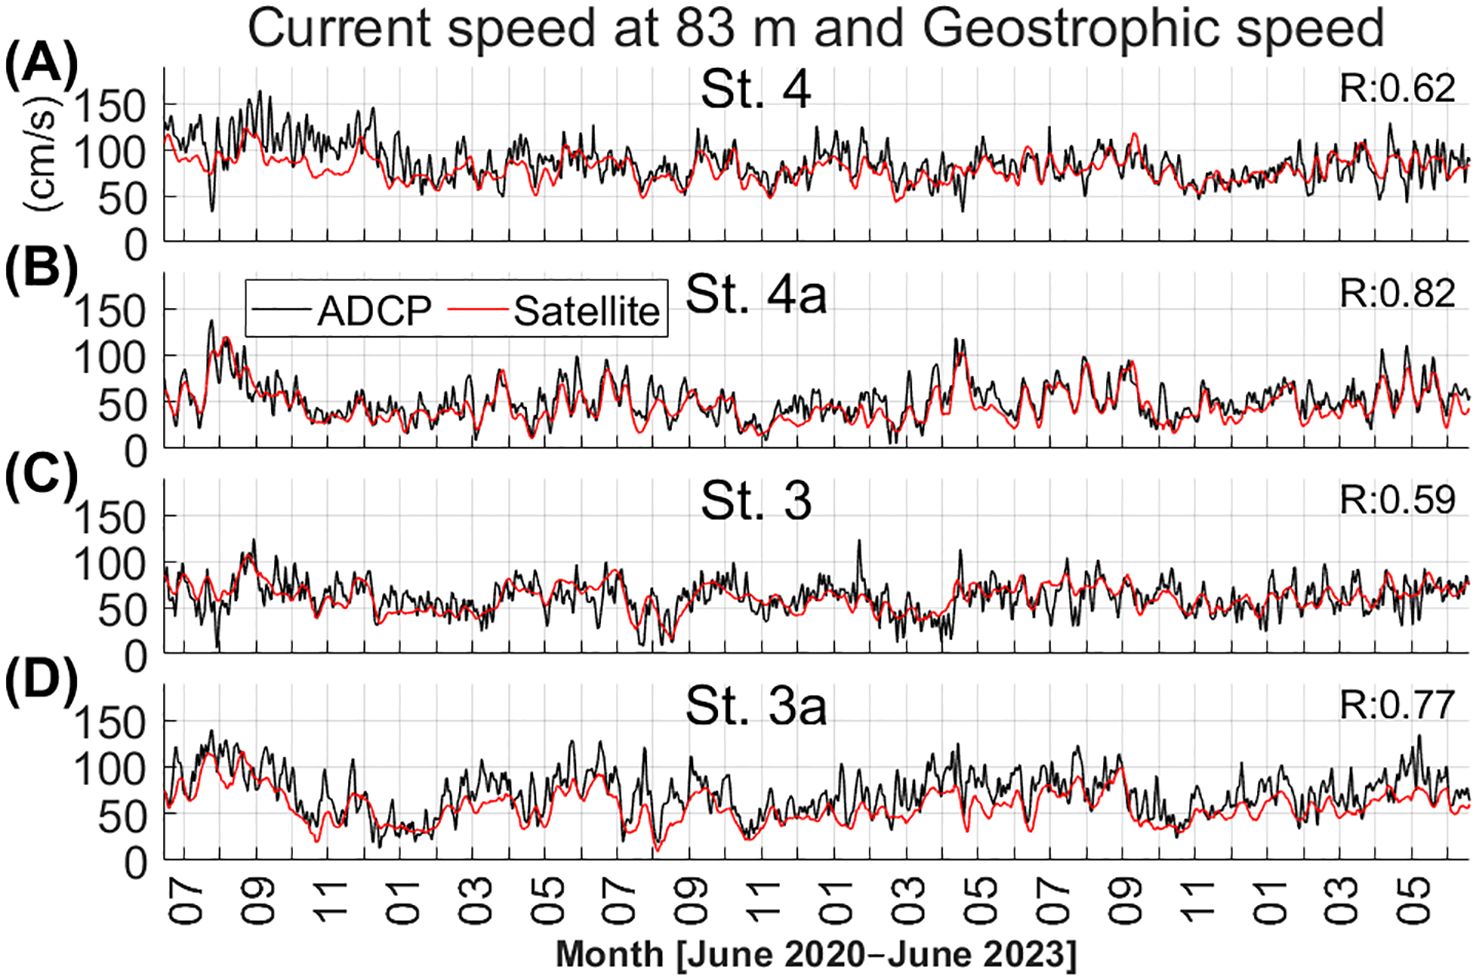
Figure 3. Comparison of the 83 m current speed from ADCPs (black) and surface geostrophic speed from satellite altimetry (red) at (A) St. 4, (B) St. 4a, (C) St. 3, and (D) St. 3a, respectively. The correlation coefficients are shown on the right side of each panel.
Figure 4 shows the standard deviations of the band-pass filtered velocity profiles and their comparison to those before the band-pass filtering. The standard deviations decrease after the band-pass filtering from 16.4 cm/s to 9.9 cm/s in the near-surface layer at 83 m, and from 7.0 cm/s to 4.8 cm/s at 504 m, on average across all mooring sites. The ISV standard deviations account for 60% at 83 m and 69% at 504 m compared to those of the processed (sub-inertial) velocity. The ISV deviations at 83 m are similar between along-path and cross-path velocities at all mooring sites, with amplitudes of 11.1 cm/s and 8.7 cm/s. However, at St. 3 and St. 4, the ISV deviation of a long-path velocity peaks in the subsurface layer at around 250 m with amplitudes of approximately 15.2 cm/s and 15.5 cm/s, respectively. This indicates that the ISV of the ECS-Kuroshio exhibits different characteristics with depth at onshore sites, appearing both upstream and downstream.
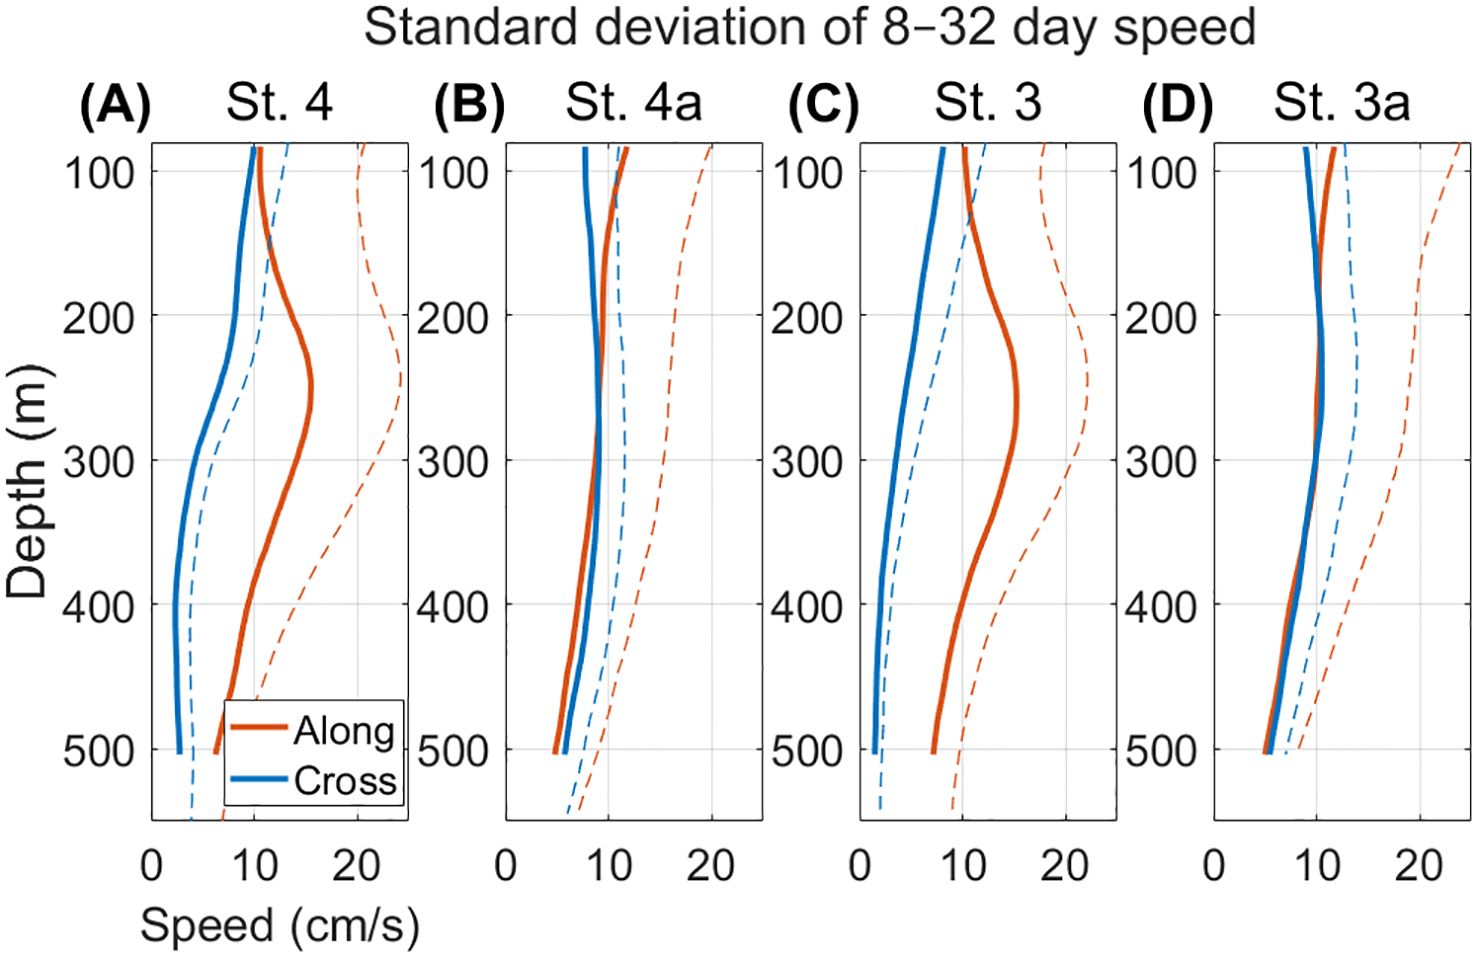
Figure 4. Standard deviation of sub-inertial velocity profiles (processed with a 72-hour low-pass filter and then averaged daily; dashed line) and 8–32 day band-pass filtered velocity profiles (solid line) at (A) St. 4, (B) St. 4a, (C) St. 3, and (D) St. 3a. Velocities are band-pass filtered at each depth by 1 m. “Along”, and “Cross” represent the along-path velocity (35°clockwise from true north) and the cross-path velocity (125°), respectively.
To understand the relationship of the ISV between the upstream and downstream sites, CVs were examined for canonical mode 1 (Figure 5A), which accounted for 75% of the total canonical modes. These CVs represent the correlated amplitude among all the upstream and downstream components with an optimal time lag of 6 days (upstream leads downstream). Note that the CCA results are robust and do not depend on the range of depth averaging, although the southwestward countercurrents are intermittently observed at onshore sites. Considering the velocity changes in direction associated with the Kuroshio meander, the positive and negative periods are defined as times when the normalized CVs for the upstream and downstream exceed one standard deviation. In addition, a 40-day moving window was applied to the standard deviations of the CVs for the upstream and downstream in order to calculate correlations and covariance between the CVs. Based on the time series of covariance shown in Figure 5B, the covariability between the upstream and downstream tends to increase during the warm season, i.e., from May to August. Then, the “co-varying” period of 412 days, which is subsampled to exceed the time-mean covariance, is compared to the “total” period of 1100 days. It is notable that the positive and negative periods of the normalized CVs (cyan and magenta dots in Figure 5A) are predominantly found during the “co-varying” period.
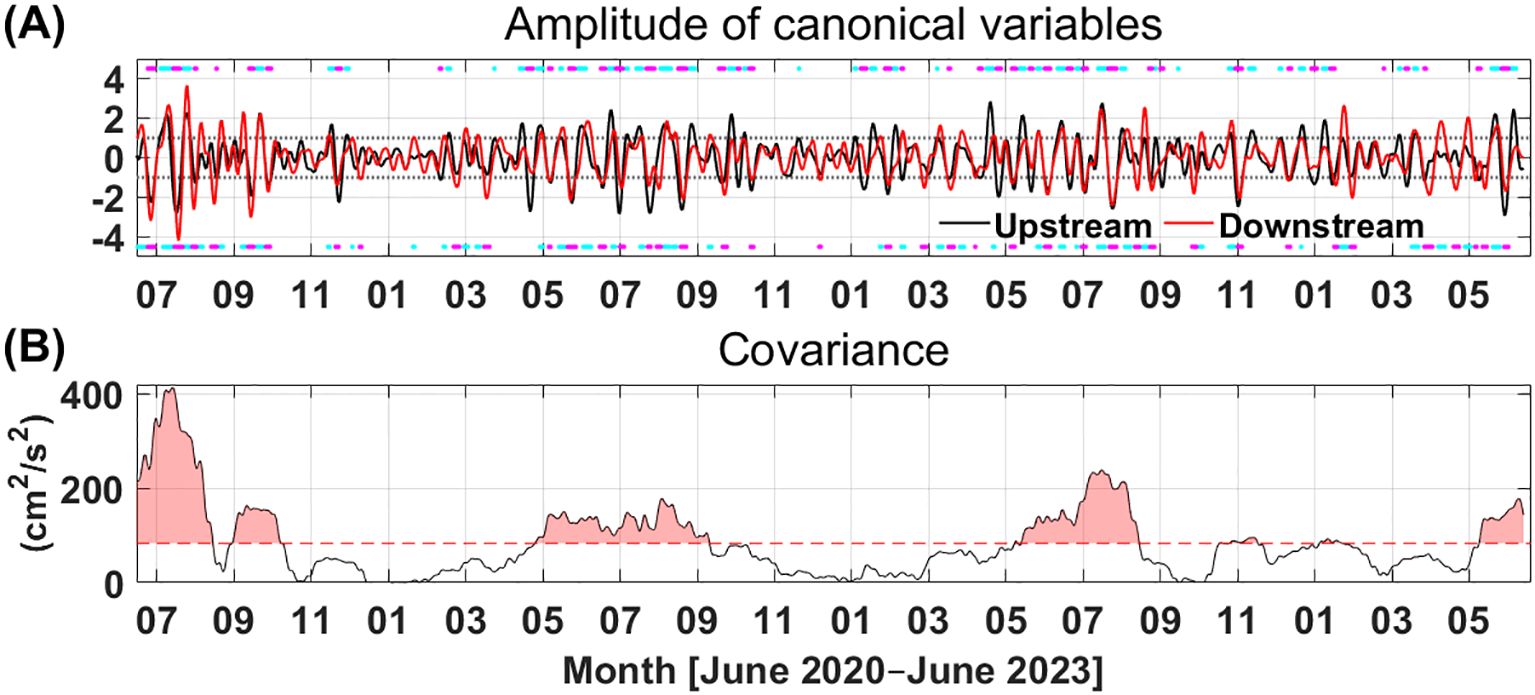
Figure 5. (A) Time series of the first canonical variables for the upstream (black) and downstream (red) velocities. The black and red lines represent the sums of linear combinations that maximize the correlation between them. Time series are normalized by standard deviations. Cyan and magenta dots represent positive and negative phases, respectively. The dots located at the top of the panel correspond to the upstream region, while the dots at the bottom correspond to the downstream region. (B) Covariance of the first canonical variables. The covariance was obtained by multiplying the 40-day moving correlation by the 40-day moving standard deviations. The red-dashed line indicates the time-averaged covariance, and the red-colored regions are above the time-averaged value.
Figure 6 shows the composite velocity vectors for “total” (blue) and “co-varying” (black) periods, together with those for the positive (cyan) and negative (magenta) periods of the CCA mode 1. Although the mean vectors at offshore sites (St. 4a and St. 3a) are slightly larger during the “co-varying” period compared to the “total” period, onshore sites (St. 4 and St. 3) show no significant differences between the two periods. Regarding the positive and negative phases of the CCA mode 1, at the upstream sites, St. 3 and St. 3a, the current vectors are directed onshore during the positive phase relative to the “total” period, while they are directed offshore during the negative phase. However, the downstream sites exhibit different characteristics: at St. 4, currents are directed offshore (onshore) during the positive (negative) phase, while there is a significant decrease (increase) in current speed during the positive (negative) phase at St. 4a, compared to the “total” period. These composite vectors for the positive and negative phases are consistent with the spatial pattern of the CCA mode 1, as depicted in Supplementary Figure S7. A positive pattern of CCA mode 1 exhibits an anticyclonic flow along the ECS-Kuroshio path; the current vector is towards onshore at the upstream sites and offshore at the downstream sites. Note that these patterns capture the covariability between the upstream and downstream components when the upstream leads the downstream by 6 days, which is shorter than the timescale of the ISV in this study.

Figure 6. Composite current velocity profiles for the “total” period (blue) and “co-varying” period (black) at (A) St. 4, (B) St. 4a, (C) St. 3, and (D) St. 3a. The “co-varying” period corresponds to the red-colored region shown in Figure 5B. The cyan and magenta also represent composite current velocity profiles for the positive and negative periods, respectively, which are predominantly found during the “co-varying” period.
Similar to the ADCP observations, the surface geostrophic speed anomaly from satellite altimetry exhibits a dipole pattern during the “co-varying” period, with strengthening on the offshore side and weakening on the onshore side of the Kuroshio axis across the entire ECS (Figure 7A). This pattern suggests that the ECS-Kuroshio intensifies during the “co-varying” period and is accompanied by an offshore shift of its axis. Although the positive SLA are distributed throughout the ECS during the “co-varying” period, notable positive SLA on the offshore side of the Kuroshio axis and along the deep part of the Okinawa Trough could facilitate the strengthening of the SSH gradient (Figure 7B), contributing to an increase in geostrophic current speeds. It indicates that the Kuroshio volume transport could increase during the “co-varying” period of May to August (Ichikawa and Beardsley, 1993; Andres et al., 2008a; Zhang et al., 2001).
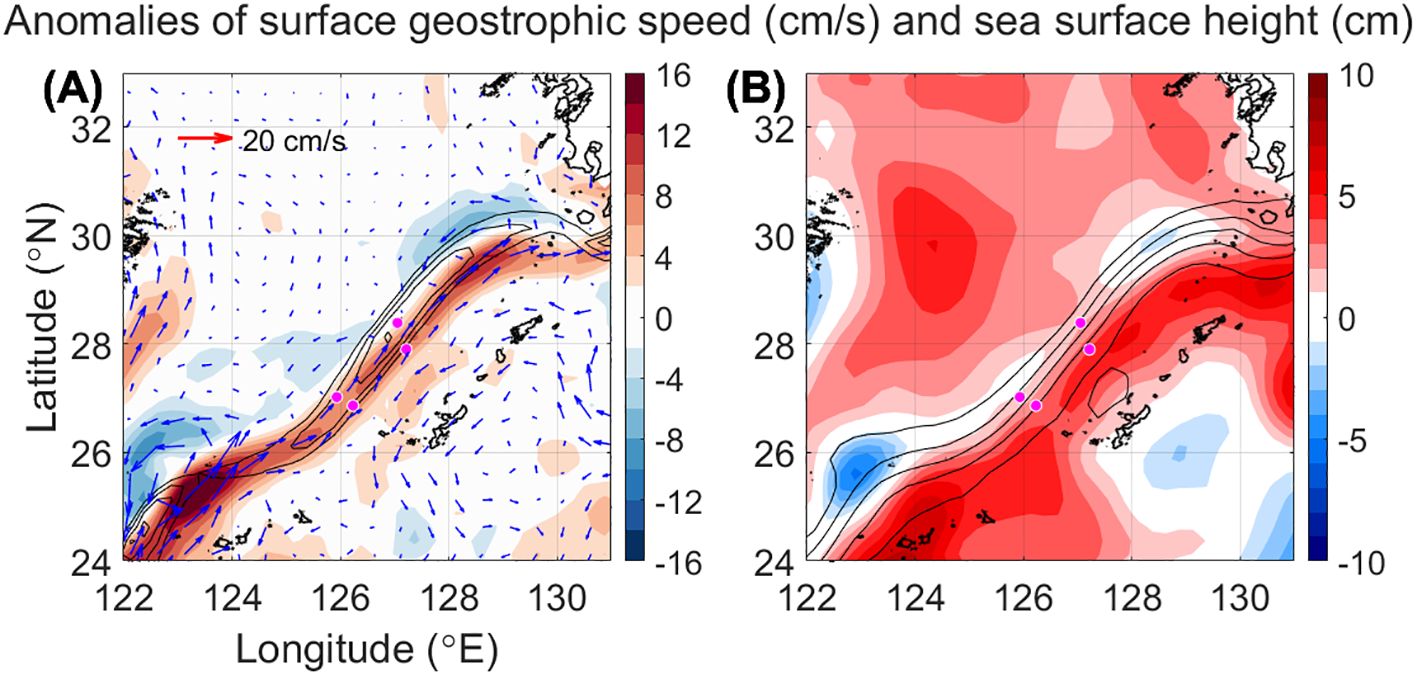
Figure 7. Composite anomaly maps for the “co-varying” period. (A) Surface geostrophic speed anomalies with the black contours representing the “total” period mean speed. Contours are drawn at 10 cm/s intervals, starting from 50 cm/s. (B) Sea surface height (SSH) anomalies with black contours representing the “total” period mean SSH. Contours are drawn at 10 cm intervals, starting from 100 cm.
Figure 8 shows the regression maps of the 8–32-day band-pass filtered SLA onto the CVs with different time lags. At a lag of -15 days (15 days ahead of the “co-varying” period), alternating negative and positive anomalies are observed along the typical Kuroshio path. These anomalies propagate northeastward, and a new positive anomaly is generated at 26°N with a lag of -10 days (Figure 8C). The positive and negative anomalies at 26°N and 27°N show amplitudes greater than ± 0.8 cm, increasing up to 1.2 cm (contour interval: 0.4 cm; Figures 8D, E). It is worth noting that the SLA are elongated in an east-west direction near 26°N (Figures 8D–H) and are remarkably confined to a band between 26°N and 31°N along the typical Kuroshio path (gray lines in Figure 8). The phase propagation speed of the SLA can be estimated from the regression maps, and it is calculated from that with a zero lag to those with a lag of 10 days, considering only the mature phase (Figures 8E–G). The southern boundary of the positive anomaly is located at upstream sites at zero lag (Figure 8E). This positive anomaly reaches St. 4 at a lag of 10 days (Figure 8G), propagating along the Kuroshio path with a phase speed of 14.8 km/day. The wavelength of the Kuroshio meanders is estimated to be 248.9 ± 7.4 km based on these positive and negative SLA patterns. These temporal and spatial scales are consistent with those of the Kuroshio meander, which has a phase speed of 16.0–18.3 km/day within the 11-day and 20-day period range, and a wavelength of 213.3–326.8 km, as reported by James et al. (1999) and Nakamura et al. (2003).
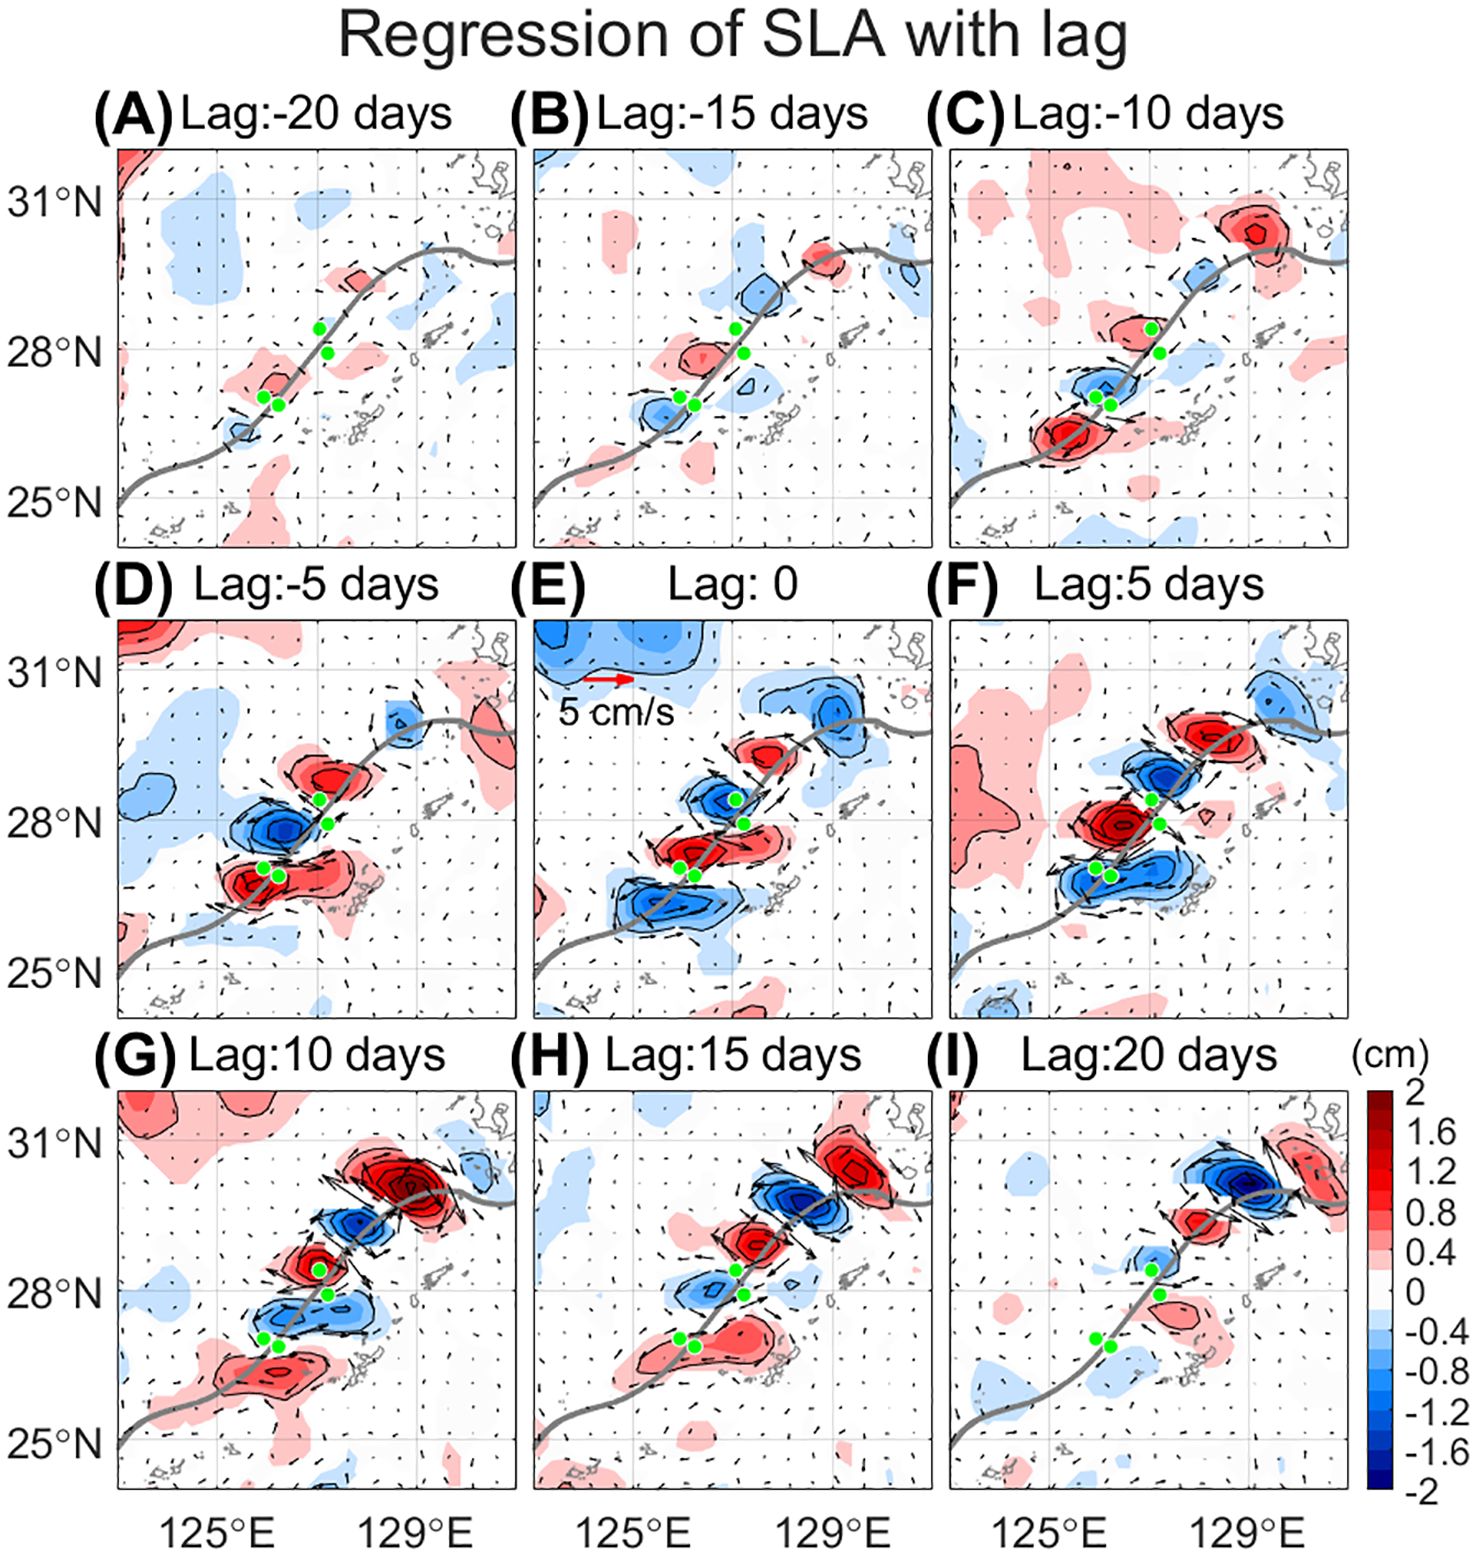
Figure 8. Maps of regressed SLA onto the first canonical variables in Figure 5A for lags ranging from -20 to 20 days (A–I) with an interval of 5 days. The SLA is band-pass filtered for the 8–32 day period. The green circles indicate the locations of moored ADCP arrays. The gray line denotes the mean path of the Kuroshio for the “total” period. Colors are shown only where the regression coefficients are statistically significant at the 95% confidence level.
Andres et al. (2008a) reported that changes in the position of the ECS-Kuroshio axis along the steep continental slope of the Okinawa Trough have a standard deviation of 13 km based on the in-situ measurements over 13 months. Although satellite altimetry cannot solely detect the variation of the Kuroshio axis due to its limited spatial resolution, the impact of the Kuroshio meander can be inferred from the regressed SLA and the SLA-derived geostrophic velocity anomaly in Figure 8E. The regressed SLA indicates an onshore shift of the Kuroshio axis, accompanying both onshore and offshore velocity anomalies with an anticyclonic flow. Furthermore, as shown in the lagged regression maps, the velocity anomalies flow toward the onshore side at St. 3 and St. 3a (Figure 8E), the offshore side at St. 4, and upstream at St. 4a (Figure 8F). It is consistent with the spatial pattern of CCA mode 1 (Supplementary Figure S7), which supports that satellite altimetry can accurately represent the impact of the ECS-Kuroshio meander and its downstream propagation.
The Kuroshio meander is captured along the main axis of the Kuroshio in the form of cyclonic or anticyclonic patterns of velocity anomalies. The changes in the along-path velocity do not directly affect the Kuroshio meander; however, an increase in the along-path velocity can provide favorable conditions for the generation of the Kuroshio meander by enhancing the baroclinic instability, which is driven by an increase in the intensity of vertical shear, as reported by Qin et al. (2015). During the “co-varying” period, the deviations in the “along-path” velocity at approximately 250 m depth increase by 24.6% and 23.0% at the onshore sites, St. 3 and St. 4, respectively, compared to the “total” period (Supplementary Figure S8). Due to topographic constraints of the continental shelf, the along-path velocity anomaly could increase as the cross-path velocity decreases in the subsurface. Despite bottom depths exceeding 700 m, St. 3 and St. 4 exhibit the highest variability in velocity in the 200–300 m layer, consistent with those proposed by Yan et al. (2019). They analyzed the energy conversion rate from eddy available potential energy (EPE) to eddy kinetic energy in the ECS based on the ocean circulation model. The conversion rate showed a peak at around 300 m, where the EPE also has a local maximum.
Previous studies, utilizing both satellite observations and in-situ observation data, have also shown that the Kuroshio induces frontal eddies along its path in the ECS (Qin et al., 2015; Liu et al., 2017). These frontal eddies, which are generated by the horizontal shear of the Kuroshio and associated Kuroshio meander, are asymmetrically distributed: cyclonic eddies predominantly occur on the onshore side of the Kuroshio, while anticyclonic eddies occur on the offshore side (Liu et al., 2017). The larger velocity deviations during the “co-varying” period may be linked with the frontal eddies. The positive phase of CCA mode 1 (Supplementary Figure S7), derived from ADCP measurements, presents anticyclonic velocity anomalies along the Kuroshio path. These anomalies indicate onshore flow at the southern sites, as well as offshore and upstream flow at the northern sites. This pattern is generally consistent between the onshore and offshore sites located at the same latitudinal bands (Figures 8E, F). Additionally, the alternating patterns of anticyclonic and cyclonic flows observed from the lagged SLA regression maps are located on the offshore/onshore side of the Kuroshio, aligned along the Kuroshio path. These results suggest that the co-variability among the four ADCP measurements is closely related to the Kuroshio meander and is influenced by the downstream propagation of these meanders.
This study revealed that the ISV of the ECS-Kuroshio meander exhibits stronger connectivity between the upstream and downstream regions from May to August, accompanied by the downstream propagation of the SLA. It may appear inconsistent with the previous studies that used monthly data sets by Nakamura et al. (2010; 2015), which found that the Kuroshio path tends to shift southward off the southern coast of Kyushu, Japan, during the winter–spring period. The southwestward wind blowing against the Kuroshio from September to November caused an onshore shift of the Kuroshio in the northern Okinawa Trough, which contributed to the development of the Kuroshio meander southeast of Kyushu. However, the differences could be attributed to the study region. The Kuroshio flows northeastward along the slope of the Okinawa Trough in the ECS and veers eastward southeast of Kyushu into the western North Pacific. In this study, observations of the ECS-Kuroshio were conducted inside the ECS, where there are no abrupt changes in the bottom topography. The differences compared to the previous study could also be attributed to the different time scales considered. In this study, the focus has been on the meanders of the ECS-Kuroshio in the 8–32 day band-pass filtered velocity profiles, with seasonality removed.
Figure 9 shows the regression maps of 8–32 day band-pass filtered wind stress anomalies projected onto the CCA mode 1. A southeasterly wind pattern and a negative wind stress curl are depicted around the upstream sites, St. 3 and St. 3a, with a lag ranging from -12 days to -10 days (see Figures 9C, D). Although the wind-induced Ekman transport along the Kuroshio appears to be associated with the occurrence and intensification of the positive SLA south of the upstream sites, with a lag of -10 days (refer to Figure 8C), the Ekman-convergence-induced SLA is more than one order of amplitude smaller than the regressed SLA (not shown). It suggests that the transient (8–32 day band-pass filtered) wind-induced effect may not be a trigger for the Kuroshio meander, and intrinsic oceanic instabilities may play a role in promoting the Kuroshio meander on the intraseasonal time scale.
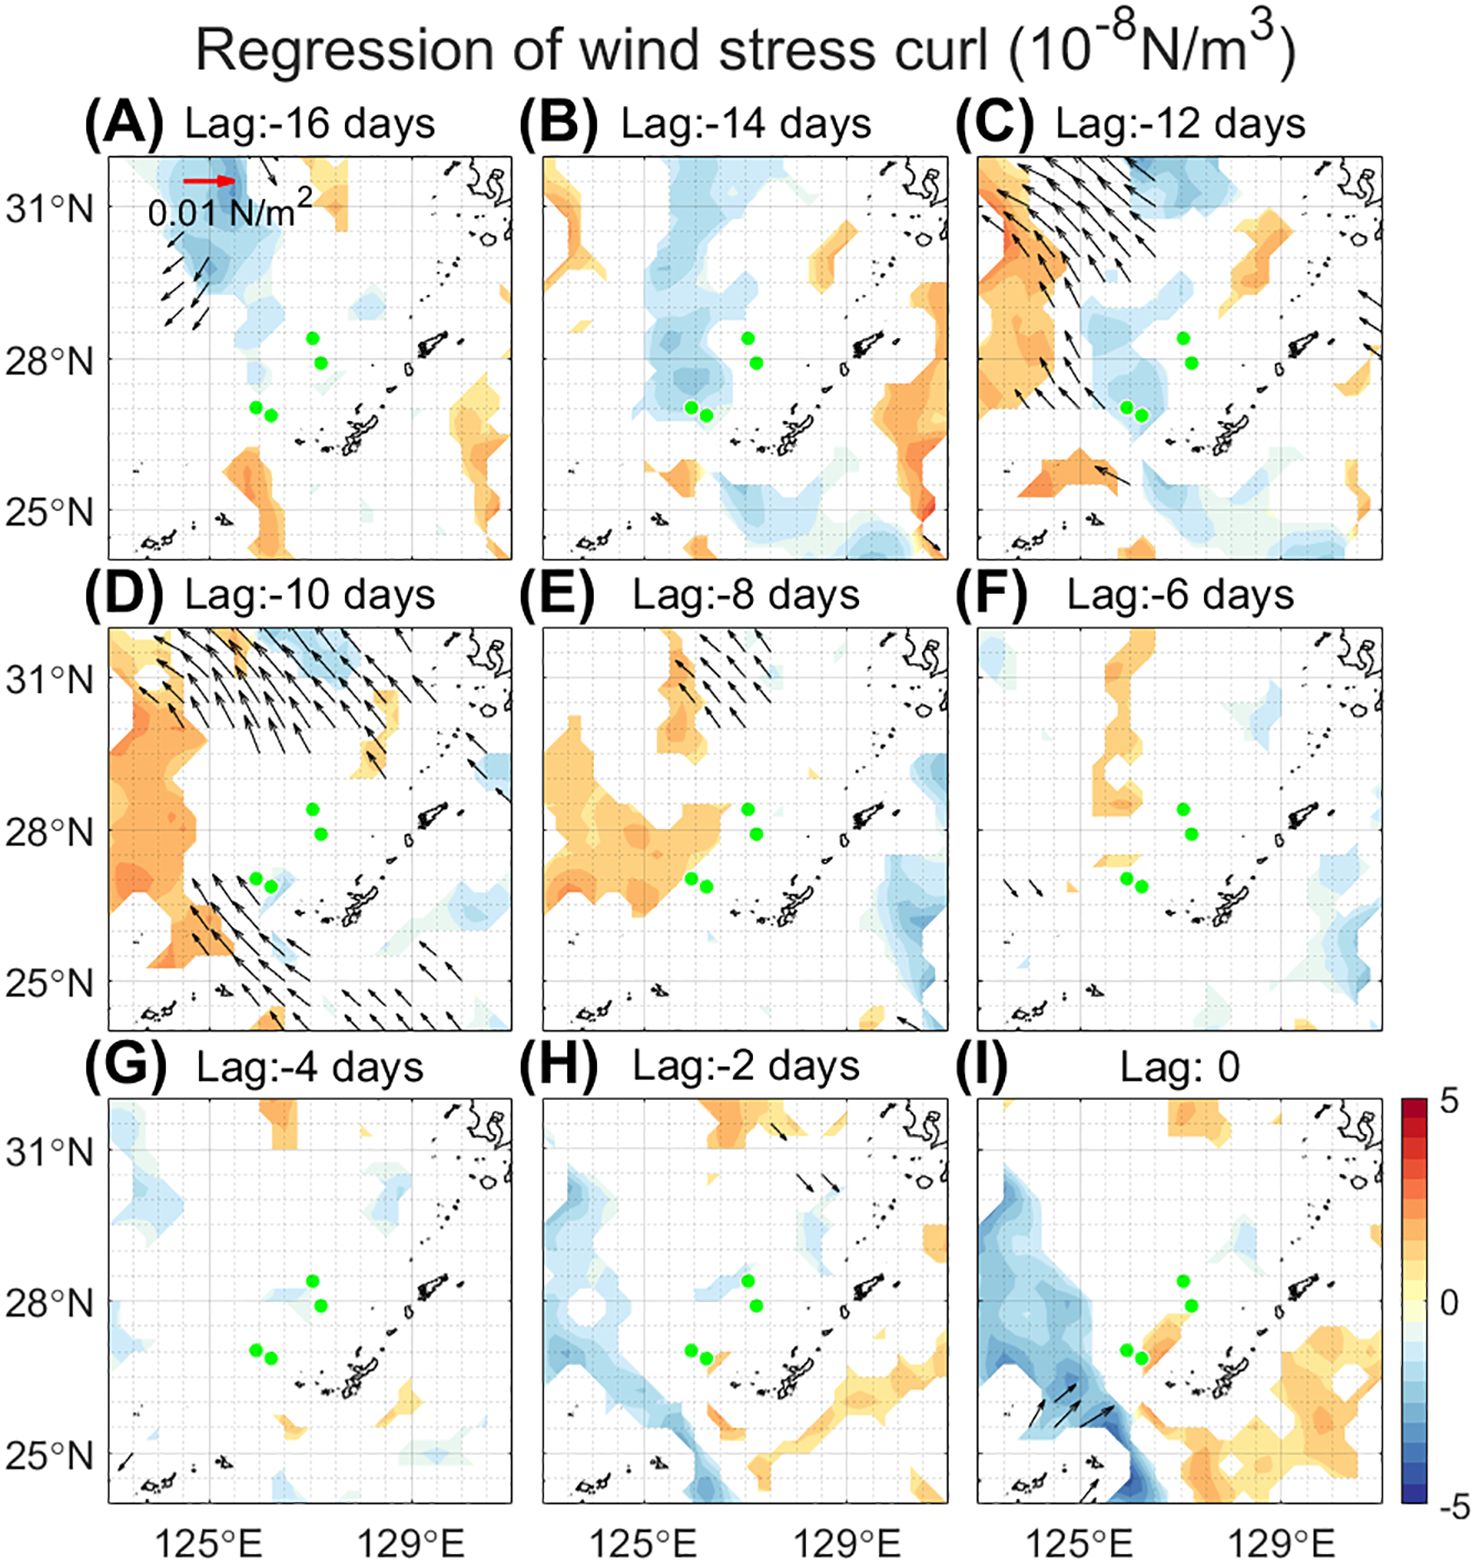
Figure 9. Maps of regressed wind stress and wind stress curl onto the first canonical variables in Figure 5A for lags ranging from -16 days to zero (A–I) with an interval of 4 days. The wind stresses are band-pass filtered for the 8–32 day period. The green circles indicate the locations of moored ADCP arrays. Colors are only shown where the regression coefficients are statistically significant at the 95% confidence level.
The current velocity of the ECS-Kuroshio was continuously observed for three years (June 2020–June 2023) by four upward-looking ADCPs located both across and along the typical path of the Kuroshio in the ECS. The observed velocity profiles do not exhibit stationarity; instead, they show strong ISV with a time period ranging from 8 to 32 days. The relationship between the upstream and downstream in the 8–32 day band-pass filtered data indicates stronger covariability during the warm season, especially from May to August. During this “co-varying” period, the observed mean velocities are faster compared to those during the “total” period at offshore sites, whereas no significant differences are observed at onshore sites in general (Figure 6). The intensification of the ECS-Kuroshio accompanies an offshore shift relative to the “total” period.
Further analysis suggests that the co-variability between the upstream and downstream tends to be stronger as the Kuroshio meander generates and propagates downstream. As a result of the Kuroshio meander, alternating patterns of SLA are observed along the Kuroshio path, with a positive SLA associated with the crest and negative SLA with the trough of the meander. The meander propagates downstream with a phase speed of approximately 14.8 km/day and acts as a connector between the upstream and downstream, enhancing the co-variability along the Kuroshio path.
This study presents observational evidence of the Kuroshio meander and its propagation in the ECS on the intraseasonal time scale, which contributes to an in-depth understanding of the Kuroshio variability in the ECS. The changes in upstream-downstream connectivity could facilitate mass exchange between the Kuroshio and shelf water (Matsuno et al., 2009; Lian et al., 2016; Liu et al., 2021). The three-dimensional characteristics of the Kuroshio meander and its influence on the continental shelf region should be investigated in future studies using a valid high-resolution numerical model.
The data analyzed in this study is subject to the following licenses/restrictions: The band-pass filtered ADCP data will be made available upon request. Other datasets are publicly available, and the sources are described in the article. Requests to access these datasets should be directed to HN, aGFubmEub2NlYW5Ac251LmFjLmty.
SL: Data curation, Formal analysis, Investigation, Methodology, Visualization, Writing – original draft, Writing – review & editing. HaN: Conceptualization, Funding acquisition, Investigation, Project administration, Supervision, Validation, Writing – original draft, Writing – review & editing. HM: Conceptualization, Funding acquisition, Investigation, Methodology, Resources, Supervision, Writing – review & editing. DK: Data curation, Investigation, Methodology, Resources, Writing – review & editing. HiN: Conceptualization, Data curation, Investigation, Methodology, Resources, Supervision, Validation, Writing – original draft, Writing – review & editing. AN: Data curation, Investigation, Methodology, Resources, Writing – review & editing.
The author(s) declare financial support was received for the research, authorship, and/or publication of this article. This research was supported by the National Research Foundation (2022M3I6A1085990) and the Korea Institute of Marine Science & Technology (KIMST) funded by the Ministry of Oceans and Fisheries (RS-2023-00256330, under the ‘Development of risk managing technology tackling ocean and fisheries crisis around Korean Peninsula by Kuroshio Current’ project), Korea.
The authors declare that the research was conducted in the absence of any commercial or financial relationships that could be construed as a potential conflict of interest.
The author(s) declare that no Generative AI was used in the creation of this manuscript.
All claims expressed in this article are solely those of the authors and do not necessarily represent those of their affiliated organizations, or those of the publisher, the editors and the reviewers. Any product that may be evaluated in this article, or claim that may be made by its manufacturer, is not guaranteed or endorsed by the publisher.
The Supplementary Material for this article can be found online at: https://www.frontiersin.org/articles/10.3389/fmars.2024.1512572/full#supplementary-material
Andres M., Park J. H., Wimbush M., Zhu X. H., Chang K. I., Ichikawa H. (2008a). Study of the kuroshio/ryukyu current system based on satellite-altimeter and in situ measurements. J. Oceanogr. 64, 937–950. doi: 10.1007/s10872-008-0077-2
Andres M., Wimbush M., Park J. H., Chang K. I., Lim B. H., Watts D. R., et al. (2008b). Observations of Kuroshio flow variations in the East China Sea. J. Geophys. Res.: Oceans. 113. doi: 10.1029/2007jc004200
Bretherton C., Smith C., Wallace J. M. (1992). An intercomparison of methods for finding coupled patterns in climate data. J. Clim. 5, 541–560. doi: 10.1175/1520-0442(1992)005<0541:AIOMFF>2.0.CO;2
Chang M., Jan S., Mensah V., Andres M., Rainville L., Yang Y.-J., et al. (2018). Zonal migration and transport variations of the Kuroshio east of Taiwan induced by eddy impingements. Deep. Sea. Res. Part I. 131, 1–15. doi: 10.1016/j.dsr.2017.11.006
Chang Y. L., Oey L. Y. (2011). Interannual and seasonal variations of Kuroshio transport east of Taiwan inferred from 29 years of tide-gauge data. Geophys. Res. Lett. 38. doi: 10.1029/2011gl047062
Chen J., Zhu X. H., Zheng H., Nakamura H., Zhao R., Wang M., et al. (2022). Observation of topographic rossby waves triggered by kuroshio path meander in the east China sea. J. Geophys. Res.: Oceans. 127. doi: 10.1029/2022jc018667
Cheng Y.-H., Ho C.-R., Zheng Q., Qiu B., Hu J., Kuo N.-J. (2017). Statistical features of eddies approaching the Kuroshio east of Taiwan Island and Luzon Island. J. Oceanogr. 73, 427–438. doi: 10.1007/s10872-017-0411-7
Gan B., Kwon Y.-O., Joyce T. M., Chen K., Wu L. (2019). Influence of the kuroshio interannual variability on the summertime precipitation over the east China sea and adjacent area. J. Clim. 32, 2185–2205. doi: 10.1175/jcli-d-18-0538.1
Guo X., Miyazawa Y., Yamagata T. (2006). The Kuroshio Onshore intrusion along the shelf break of the east China sea: the origin of the tsushima warm current. J. Phys. Oceanogr. 36, 2205–2231. doi: 10.1175/JPO2976.1
Global Ocean Gridded L 4 Sea Surface Heights And Derived Variables Nrt. E.U. Copernicus Marine Service Information (CMEMS). Marine Data Store (MDS). doi: 10.48670/moi-00149 (Accessed 02 Apr 2024).
Global Ocean Gridded L 4 Sea Surface Heights And Derived Variables Reprocessed 1993 Ongoing. E.U. Copernicus Marine Service Information (CMEMS). Marine Data Store (MDS). doi: 10.48670/moi-00148 (Accessed 02 Apr 2024).
Hersbach H., Bell B., Berrisford P., Biavati G., Horányi A., Muñoz Sabater J., et al. (2023). ERA5 hourly data on single levels from 1940 to present. Copernicus Climate Change Service (C3S) Climate Data Store (CDS). doi: 10.24381/cds.adbb2d47
Hsin Y. C., Qiu B., Chiang T. L., Wu C. R. (2013). Seasonal to interannual variations in the intensity and central position of the surface Kuroshio east of Taiwan. J. Geophys. Res.: Oceans. 118, 4305–4316. doi: 10.1002/jgrc.20323
Ichikawa K. (2001). Variation of the kuroshio in the tokara strait induced by meso-scale eddies. J. Oceanogr. 57, 55–68. doi: 10.1023/A:1011174720390
Ichikawa H., Beardsley R. C. (1993). Temporal and spatial variability of volume transport of the Kuroshio in the East China Sea. Deep-Sea. Res. 40, 583–605.
Ichikawa K., Tokeshi R., Kashima M., Sato K., Matsuoka T., Kojima S., et al. (2008). Kuroshio variations in the upstream region as seen by HF radar and satellite altimetry data. Int. J. Remote Sens. 29, 6417–6426. doi: 10.1080/01431160802175454
James C., Wimbush M., Ichikawa H. (1999). Kuroshio meanders in the east China sea. J. Phys. Oceanogr. 29, 259–272. doi: 10.1175/1520-0485(1999)029<0259:KMITEC>2.0.CO;2
Jo S., Moon J.-H., Kim T., Song Y. T., Cha H. (2022). Interannual modulation of kuroshio in the east China sea over the past three decades. Front. Mar. Sci. 9. doi: 10.3389/fmars.2022.909349
Kang J., Na H. (2022). Long-term variability of the kuroshio shelf intrusion and its relationship to upper-ocean current and temperature variability in the east China sea. Front. Mar. Sci. 9. doi: 10.3389/fmars.2022.812911
Lian E., Yang S., Wu H., Yang C., Li C., Liu J. T. (2016). Kuroshio subsurface water feeds the wintertime Taiwan Warm Current on the inner East China Sea shelf. J. Geophys. Res.: Oceans. 121, 4790–4803. doi: 10.1002/2016jc011869
Liang W. D., Tang T. Y., Yang Y. J., Ko M. T., Chuang W. S. (2003). Upper-ocean currents around Taiwan. Deep. Sea. Res. Part II. 50, 1085–1105. doi: 10.1016/s0967-0645(03)00011-0
Lie H.-J., Cho C.-H., Kaneko A. (1998). On the branching of the Kuroshio and the formation of slope countercurrent in the East China Sea, paper presented at Japan-China Joint Symposium on Cooperative Study of Subtropical Circulation System, Seikai Natl. Fish. Res. Inst. Naha. Japan.
Liu Y., Dong C., Liu X., Dong J. (2017). Antisymmetry of oceanic eddies across the Kuroshio over a shelfbreak. Sci. Rep. 7, 6761. doi: 10.1038/s41598-017-07059-1
Liu Z., Gan J. (2012). Variability of the Kuroshio in the East China Sea derived from satellite altimetry data. Deep. Sea. Res. Part I. 59, 25–36. doi: 10.1016/j.dsr.2011.10.008
Liu Z., Gan J., Hu J., Wu H., Cai Z., Deng Y. (2021). Progress of studies on circulation dynamics in the east China sea: the kuroshio exchanges with the shelf currents. Front. Mar. Sci. 8. doi: 10.3389/fmars.2021.620910
Liu C., Wang F., Chen X., von Storch J. S. (2014). Interannual variability of the Kuroshio onshore intrusion along the East China Sea shelf break: Effect of the Kuroshio volume transport. J. Geophys. Res.: Oceans. 119, 6190–6209. doi: 10.1002/2013jc009653
Matsuno T., Lee J.-S., Yanao S. (2009). The kuroshio exchange with the south and east China seas. Ocean. Sci. 5, 303–312. doi: 10.5194/os-5-303-2009
Nagano A., Hasegawa T., Ueki I., Ando K. (2017). El Niño–Southern Oscillation-time scale covariation of sea surface salinity and freshwater flux in the western tropical and northern subtropical Pacific. Geophys. Res. Lett. 44, 6895–6903. doi: 10.1002/2017gl073573
Nakamura H., Hiranaka R., Ambe D., Saito T. (2015). Local wind effect on the Kuroshio path state off the southeastern coast of Kyushu. J. Oceanogr. 71, 575–596. doi: 10.1007/s10872-015-0309-1
Nakamura H., Ichikawa H., Nishina A., Lie H. J. (2003). Kuroshio path meander between the continental slope and the Tokara Strait in the East China Sea. J. Geophys. Res.: Oceans. 108. doi: 10.1029/2002jc001450
Nakamura H., Nishina A., Ichikawa H., Nonaka M., Sasaki H. (2008). Deep countercurrent beneath the Kuroshio in the Okinawa Trough. J. Geophys. Res.: Oceans. 113. doi: 10.1029/2007jc004574
Nakamura H., Nonaka M., Sasaki H. (2010). Seasonality of the kuroshio path destabilization phenomenon in the okinawa trough: A numerical study of its mechanism. J. Phys. Oceanogr. 40, 530–550. doi: 10.1175/2009jpo4156.1
Nakamura H., Yamashiro T., Nishina A., Ichikawa H. (2006). Time-frequency variability of Kuroshio meanders in Tokara Strait. Geophys. Res. Lett. 33. doi: 10.1029/2006gl027516
Oka E., Kawabe M. (2003). Dynamic structure of the kuroshio south of kyushu in relation to the kuroshio path variations. J. Oceanogr. 59, 595–608. doi: 10.1023/B:JOCE.0000009589.28241.93
Park H.-J., Kim K.-Y., Na H. (2023). The role of the Kuroshio Current on the diurnal cycle of Meiyu-Baiu rainband in mid-June. Atmos. Res. 293. doi: 10.1016/j.atmosres.2023.106903
Qiao Y. X., Nakamura H., Tomita T. (2024). Warming of the kuroshio current over the last four decades has intensified the meiyu-baiu rainband. Geophys. Res. Lett. 51. doi: 10.1029/2023gl107021
Qin D., Wang J., Liu Y., Dong C. (2015). Eddy analysis in the Eastern China Sea using altimetry data. Front. Earth Sci. 9, 709–721. doi: 10.1007/s11707-015-0542-3
Soeyanto E., Guo X., Ono J., Miyazawa Y. (2014). Interannual variations of Kuroshio transport in the East China Sea and its relation to the Pacific Decadal Oscillation and mesoscale eddies. J. Geophys. Res.: Oceans. 119, 3595–3616. doi: 10.1002/2013jc009529
Sugimoto T., Kimura S., Miyaji K. (1988). Meander of the kuroshio front and current variability in the east China sea. J. Oceanogr. Soc Japan. 44, 125–135. doi: 10.1007/BF02302619
Tang T. Y., Tai J. H., Yang Y. J. (2000). The flow pattern north of Taiwan and the migration of the Kuroshio. Cont. Shelf Res. 20, 349–371. doi: 10.1016/S0278-4343(99)00076-X
Vélez-Belchí P., Centurioni L. R., Lee D. K., Jan S., Niiler P. P. (2013). Eddy induced Kuroshio intrusions onto the continental shelf of the East China Sea. J. Mar. Res. 71, 83–108. doi: 10.1357/002224013807343470
Wei Y., Huang D., Zhu X.-H. (2013). Interannual to decadal variability of the Kuroshio Current in the East China Sea from 1955 to 2010 as indicated by in-situ hydrographic data. J. Oceanogr. 69, 571–589. doi: 10.1007/s10872-013-0193-5
Wu C. R., Hsin Y. C., Chiang T. L., Lin Y. F., Tsui I. F. (2014). Seasonal and interannual changes of the Kuroshio intrusion onto the East China Sea Shelf. J. Geophys. Res.: Oceans. 119, 5039–5051. doi: 10.1002/2013jc009748
Wu C. R., Wang Y. L., Lin Y. F., Chao S. Y. (2017). Intrusion of the kuroshio into the south and east China seas. Sci. Rep. 7, 7895. doi: 10.1038/s41598-017-08206-4
Yan X., Kang D., Curchitser E. N., Pang C. (2019). Energetics of eddy–mean flow interactions along the western boundary currents in the north pacific. J. Phys. Oceanogr. 49, 789–810. doi: 10.1175/jpo-d-18-0201.1
Yin Y., Lin X., He R., Hou Y. (2017). Impact of mesoscale eddies on Kuroshio intrusion variability northeast of Taiwan. J. Geophys. Res.: Oceans. 122, 3021–3040. doi: 10.1002/2016jc012263
Zhang D., Lee T. N., Johns W. E., Liu C.-T., Zantopp R. (2001). The kuroshio east of Taiwan: modes of variability and relationship to interior ocean mesoscale eddies. J. Phys. Oceanogr. 31, 1054–1074. doi: 10.1175/1520-0485(2001)031<1054:TKEOTM>2.0.CO;2
Zhang Z., Nakamura H., Zhu X. (2021a). Seasonal velocity variations over the entire Kuroshio path part I: Data analysis and numerical experiments. J. Oceanogr. 77, 719–744. doi: 10.1007/s10872-021-00604-7
Keywords: Kuroshio, East China Sea, acoustic doppler current profilers, meander, propagation, subsurface-variability
Citation: Lee S, Na H, Min HS, Kim DG, Nakamura H and Nishina A (2025) Observational evidence of the Kuroshio meander and its propagation in the East China Sea. Front. Mar. Sci. 11:1512572. doi: 10.3389/fmars.2024.1512572
Received: 16 October 2024; Accepted: 27 December 2024;
Published: 31 January 2025.
Edited by:
Xiaohui Xie, Ministry of Natural Resources, ChinaReviewed by:
Dezhou Yang, Chinese Academy of Sciences (CAS), ChinaCopyright © 2025 Lee, Na, Min, Kim, Nakamura and Nishina. This is an open-access article distributed under the terms of the Creative Commons Attribution License (CC BY). The use, distribution or reproduction in other forums is permitted, provided the original author(s) and the copyright owner(s) are credited and that the original publication in this journal is cited, in accordance with accepted academic practice. No use, distribution or reproduction is permitted which does not comply with these terms.
*Correspondence: Hanna Na, aGFubmEub2NlYW5Ac251LmFjLmty
Disclaimer: All claims expressed in this article are solely those of the authors and do not necessarily represent those of their affiliated organizations, or those of the publisher, the editors and the reviewers. Any product that may be evaluated in this article or claim that may be made by its manufacturer is not guaranteed or endorsed by the publisher.
Research integrity at Frontiers
Learn more about the work of our research integrity team to safeguard the quality of each article we publish.