 Shaodong Wang1
 Hui Du
- 1College of Meteorology and Oceanography, National University of Defense Technology, Changsha, China
- 2School of Remote Sensing & Geomatics Engineering, Nanjing University of Information Science and Technology, Nanjing, China
- 3College of Electronic Information Engineering, Changchun University of Technology, Changchun, China
The research on the propagation and evolution of the second-mode internal solitary waves(ISWs) is receiving more and more attention. In this study, second-mode internal solitary waves in continuous stratification are physically simulated in a laboratory-stratified fluid flume. Meanwhile, the second-mode ISWs and their induced flow field in the same stratification environment are solved based on the eigenvalue problem of the TG equation (Taylor-Goldstein), combined with the weakly non-linear ISW theoretical models. The experimental and theoretical results show that the symmetry of the second-mode ISW wave-flow field can be improved as the thickness ratio of the upper fluid layer and lower one approaches 1. The ISW speed and horizontal and vertical velocity range values in the continuous pycnocline are positively correlated with the changing ISW amplitude, while only the wavelength is negatively correlated with the iSW amplitude. The waveflow fields of the second-mode ISWs calculated by Korteweg-de Vries (KdV) and extended KdV (eKdV) models in the large amplitude cases are more consistent with the experimental results than those in the small amplitude cases. The two theoretical models used to describe second-mode ISWs can be significantly improved when the thickness ratio of the upper and lower fluid layers approaches 1. In this case, the eKdV model is more applicable than the KdV model.
1 Introduction
A second-mode internal solitary wave (ISW) in the stratified ocean is an internal wave with a special wave-flow structure propagating along the continuous density pycnocline (Yang et al., 2009, 2010). Its waveform is characterized by an ‘oval’ shape and the flow field is characterized by a double vortex (Ramp et al., 2012). Second-mode ISWs play a crucial role in vertically transporting marine nutrients. However, they also pose a significant threat to the operation of offshore oil platforms and the safe navigation of underwater vehicles. The generation, evolution, and environmental effects of second-mode ISWs are receiving more and more attention.
Yang et al. (2009) and Duda et al. (2004) observed multiple second-mode ISWs independently propagating on the continental slope in the South China Sea (SCS). Since these studies, field observations of high-mode ISWs, represented by second-mode ISWs, have become a new focus. For example, Shroyer et al. (2010) found a second-mode ISW propagating to the shore in the mooring records near the New Jersey Coast, and the study shows that the local turbulent dissipation of the second-mode ISW is similar to the first-mode ISW observed during the experiment. Jorge and da Silva (2018) detected five continuous and regular second-mode ISWs in the Andaman Sea. Due to the small scale of the second-mode internal isolation in remote sensing images, second-mode ISWs have often been neglected in previous studies, and the frequently observed second-mode ISWs indicate that their existence is more extensive than previously thought. Ramp et al. (2012) observed a convex second-mode ISW occurring near the depth of 100 m in the northeastern SCS, and its horizontal and vertical velocity structures were consistent with the calculations of ISW theory. Due to the relatively scarce field observation data of second-mode ISWs, the research methods mainly rely on numerical simulation, physical model experiments, and theoretical research, and most research focuses on the convex second-mode ISWs, which are easy to observe (Terez et al., 1998; Olsthoorn et al., 2013; Xie et al., 2015; Cheng et al., 2018; Liang et al., 2018; Zhang et al., 2018). For example, Terez et al. (2012) used a numerical simulation method to compare the waveform structure of a second-mode ISW with different wave amplitudes, and the wave characteristics have been clarified, such as the relationship between ISW speed, wavelength, and wave amplitude. Olsthoorn et al. (2013) conducted a numerical simulation to study the asymmetric characteristics of the two-dimensional and three-dimensional double circulation core of second-mode ISWs. The research results show that the asymmetry of the wave envelope and the circulation core near the pycnocline is significant. Second-mode ISWs with inhomogeneous vertical wave-flow structures are usually analyzed by weak non-linear ISW models (Fliegel and Hunkins, 1975; Cai and Gan, 1995; Keben and Hushan, 1997; Kurkina et al., 2017). For example, Kurkina et al. (2017) studied the wave-induced velocity structure of ISWs with different modes in a continuous density pycnocline environment within the framework of weak non-linear theory. The velocity structures of the first mode and second mode were completely different near the bottom and surface of the fluid environment, and the absolute value of the latter velocity reached its maximum in the middle layer. Fliegel and Hunkins (1975) obtained a theoretical vertical structure of ISWs with different modes by calculating the dispersion relation of the internal waves combined with the Thomson-Haskell method. Similarly, using the Thomson-Haskell method, Cai and Gan (1995) solved the dispersion relation of internal waves and the vertical structure of ISWs in the SCS under the non-Boussinesq approximation. However, the applicability of the existing ISW theoretical models in describing the second-mode ISWs in the continuous stratified ocean has not been clearly verified.
The applicability of ISW theoretical models in a strict two-layer fluid to describe first-mode ISWs has been widely reported (Michallet and Bartgélemy, 1998; Huang et al., 2013; Du et al., 2019; Cui et al., 2021). For example, the experimental results of first-mode ISWs with different amplitudes using the KdV (Korteweg-de Vries) and mKdV (Modified Korteweg de Vries) theoretical solutions were compared by Michallet and Bartgélemy (1998), and the results show that the KdV model is suitable for calculating first-mode ISWs with a small amplitude, while the mKdV theory is more suitable for describing the first-mode ISWs with a large amplitude. Cui et al. (2021) compared the application scope of six common ISW theory models for first-mode ISWs by optimizing a large number of numerical and theoretical examples using different thickness ratios and amplitude conditions. The research on the ISW theories for continuous stratification and their description applicability for first-mode ISWs with inhomogeneous vertical structures has also been preliminarily carried out (Peng et al., 2022; Rong et al., 2023). For example, Peng et al. (2022) experimentally studied the vertical structure, the distribution of wave amplitude, and the frequency of first-mode ISWs along the water depth, which verified the effectiveness of the continuous stratification ISW theoretical model in describing first-mode ISWs with inhomogeneous vertical structures.
Whether it is a strictly two-layer or continuous-density fluid environment, the applicability of different ISW theories to describe first-mode ISWs has been widely studied, which has greatly improved the effectiveness of ISW theory. Compared with first-mode ISWs and the wave-induced flow field, second-mode ISWs have more complex wave vertical structures. Due to a lack of systemic observation data and experimental simulations, the applicability of the continuous stratification ISW theories to describe second-mode ISWs in the continuous pycnocline environment is rarely reported. The experimental simulation of second-mode ISWs in continuous stratification is an effective method to verify the applicability of ISW theoretical models, which will be significant in improving the effectiveness of the ISW theory applied to the description of high-mode ISWs.
In view of the above, the physical simulation of the second-mode ISWs in different continuous density pycnocline environments and the wave-flow field measurements were carried out in a physical flume, and the effect of fluid stratification on the experimental characteristics of second-mode ISWs in continuous pycnocline is discussed. The experimental results of ISWs with different amplitudes are compared with the theoretical calculation results to obtain the applicability of weakly non-linear theoretical models for describing high-mode ISWs in a continuous-density pycnocline environment. The chapters of this article are as follows: Sections 1 and 2 contain the introduction and experimental principle respectively. Section 3 contains the experimental characteristics of the second-mode ISW. Section 4 contains the theoretical characteristics of the second-mode ISW. Section 5 describes the applicability of second-mode ISW. Section 6 describes the applicability of the induced flow field. Section 7 is the conclusion.
2 Experimental principle
The experiment was carried out in a large-scale gravity-stratified fluid flume, the main scale of which was 1200 cm × 120 cm × 100 cm (length × width × height). The principle of this experiment is shown in Figure 1, and the coordinate system o-xyz of the right-hand rule established the central position above the left wall of the flume. In order to realize the physical simulation of the second-mode ISW in a stratified environment with continuous density pycnocline, a stratified environment with a three-layer fluid structure was prepared in the flume (Du et al., 2016). The upper layer with a thickness of is the complete fresh water and the lower layer with a thickness of is the complete salt water, and the density pycnocline with a certain thickness of is naturally formed in the junction area due to the mutual mixing of the two, which is defined as the middle layer. A set of typical fluid-stratified density profiles in the experiment is shown in Figure 2.
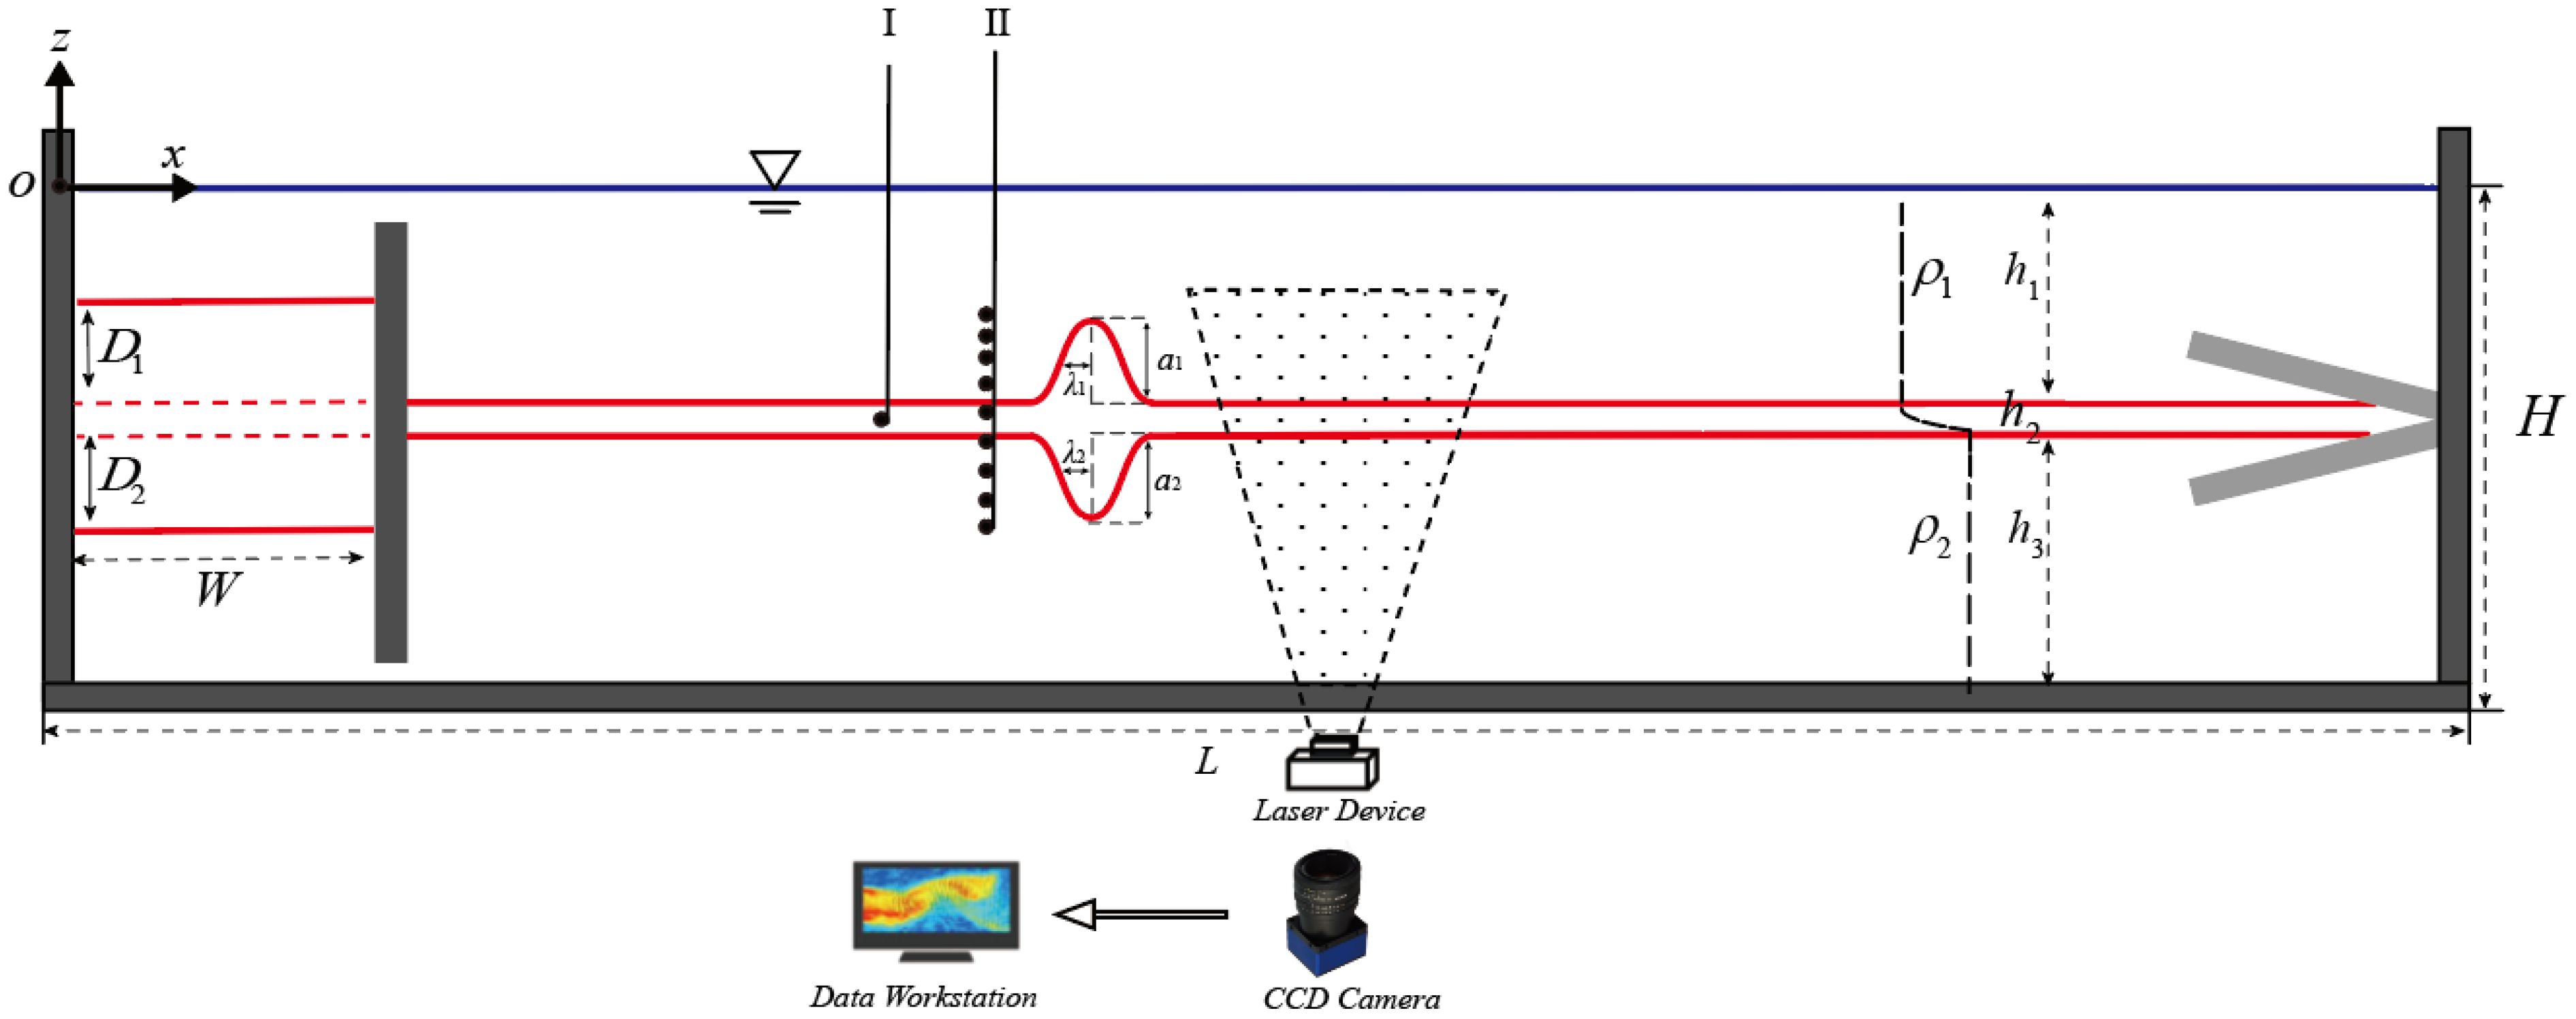
Figure 1. Experimental principle.
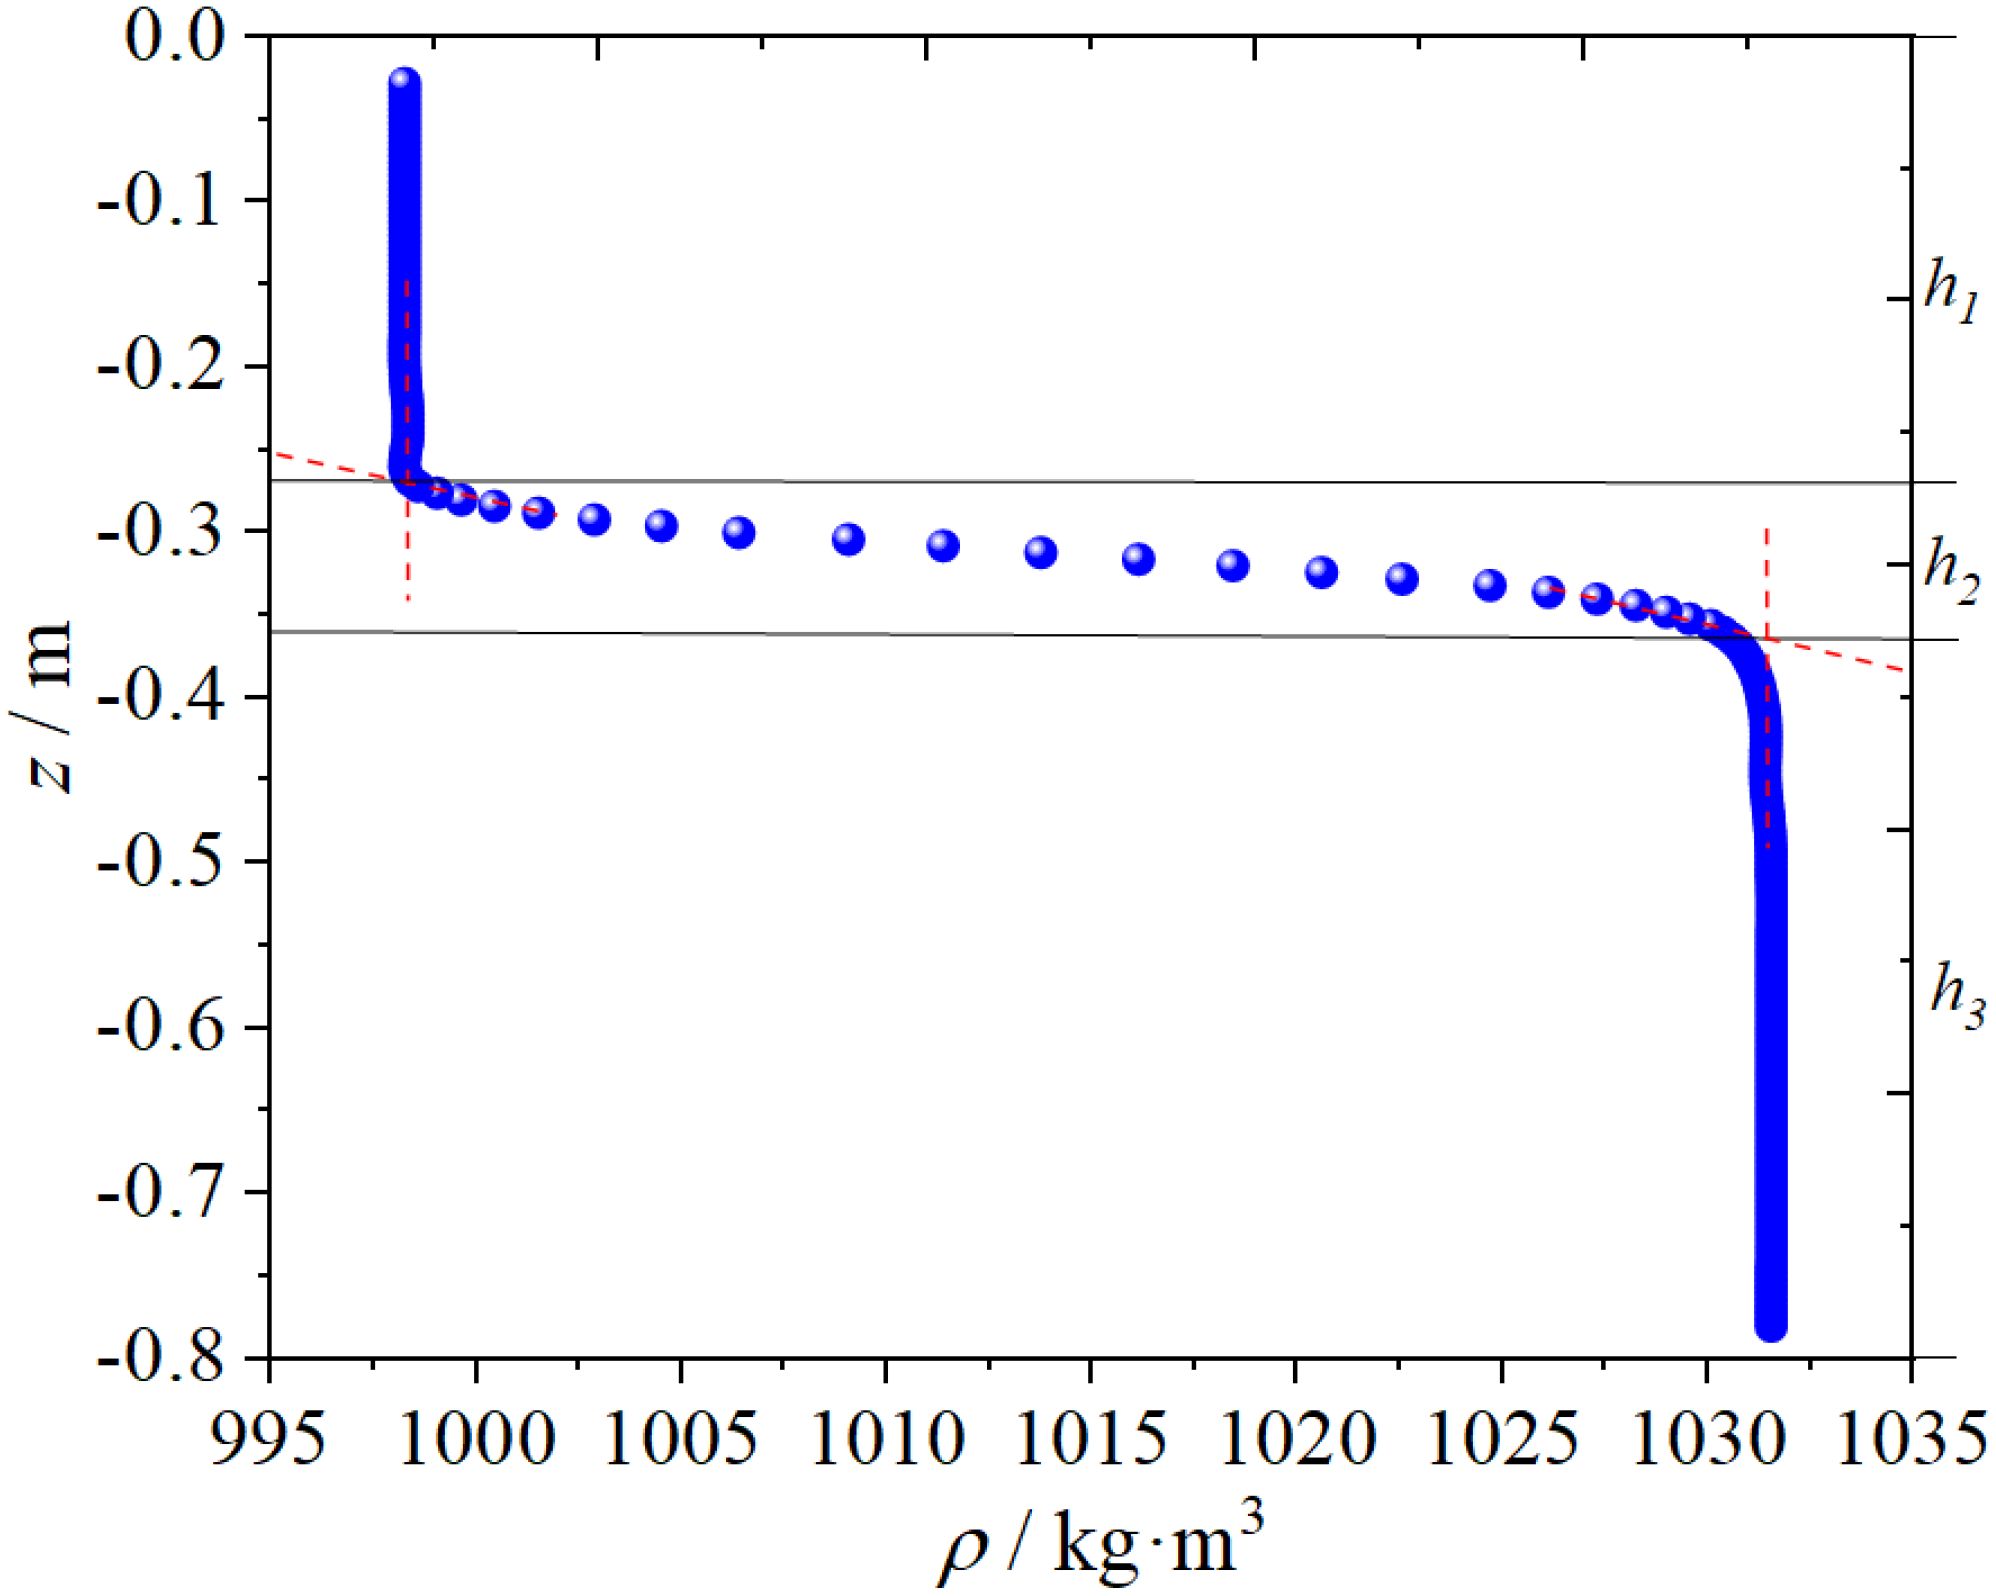
Figure 2. The density distribution of a typical experimental case.
A convex second-mode ISW in the continuous density pycnocline was generated using a gravity collapse generation device with a rotating shutter (Whitham, 1974). The geometric wave shape of the second-mode ISW can be adjusted by the geometric parameters D1, D2, and W of the wave-making region (Maxworthy, 1980). Additionally, a triangular wedge-shaped structure wave-eliminating device composed of two wave-eliminating plates was arranged at the end position along the positive x-direction to achieve an ISW-eliminating effect. The ISW speed and fluid density disturbance values were measured by the electronic conductivity probe arrays, which consist of a single probe and 10 probes arranged at positions I (x = 400 cm) and II (x = 500 cm), respectively. The velocity vector fields induced by second-mode ISWs were quantitatively measured using a two-dimensional particle image velocimetry (PIV) system, which was arranged at the position of (x, y) = (500,0). During operation, the PIV measurement frequency was set to 30 Hz, and the fully evolved velocity vector field and its value in the second-mode ISW in a two-dimensional xoz plane were recorded.
The dimensionless parameters of the environment are introduced as follows: , , which represent the thickness ratio and the density difference of stratification environment respectively. The dimensionless parameters of wave fluctuation are defined as follows: , , , which represent dimensionless wave amplitude, wavelength, and ISW speed. The dimensionless parameters of flow field are as follows: , , , , which represent dimensionless horizontal velocity, vertical velocity, horizontal velocity range, and vertical velocity range. Among these, the isopycnals with the maximum positive and negative vertical displacement are defined as the upward and downward characteristic wave profiles and their respective vertical displacements are defined as the upward amplitude a1 and the downward amplitude a2, respectively. The wavelengths λ1 and λ2 of the upper and lower wave profiles are defined as the half-wave width at the half height of the upper and lower amplitudes, respectively. is the linear internal ISW speed, and and are the horizontal and vertical velocities of the flow field. , and , are the maximum and minimum values of the horizontal velocity and those of the vertical velocity, respectively. The detailed physical parameters of the experimental cases in this experiment are given in Table 1.
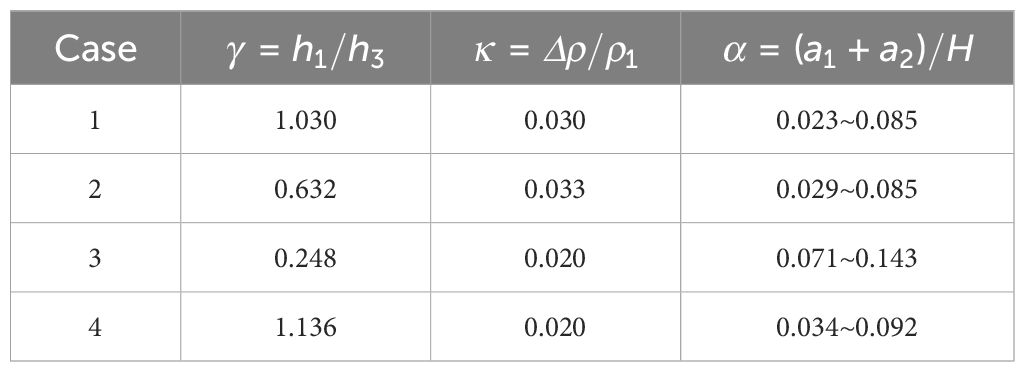
Table 1. Experimental cases.
3 Experimental characteristics of a second-mode ISW
3.1 Overall characteristics of the wave-flow structure
In order to investigate the density field structure and velocity distribution of a second-mode ISW in a typical continuous pycnocline environment, taking the experimental cases of stratified environment and wave amplitude , the density field, velocity field, and vorticity distribution of the fully evolved second-mode ISW in the plane were obtained, as shown in Figure 3.
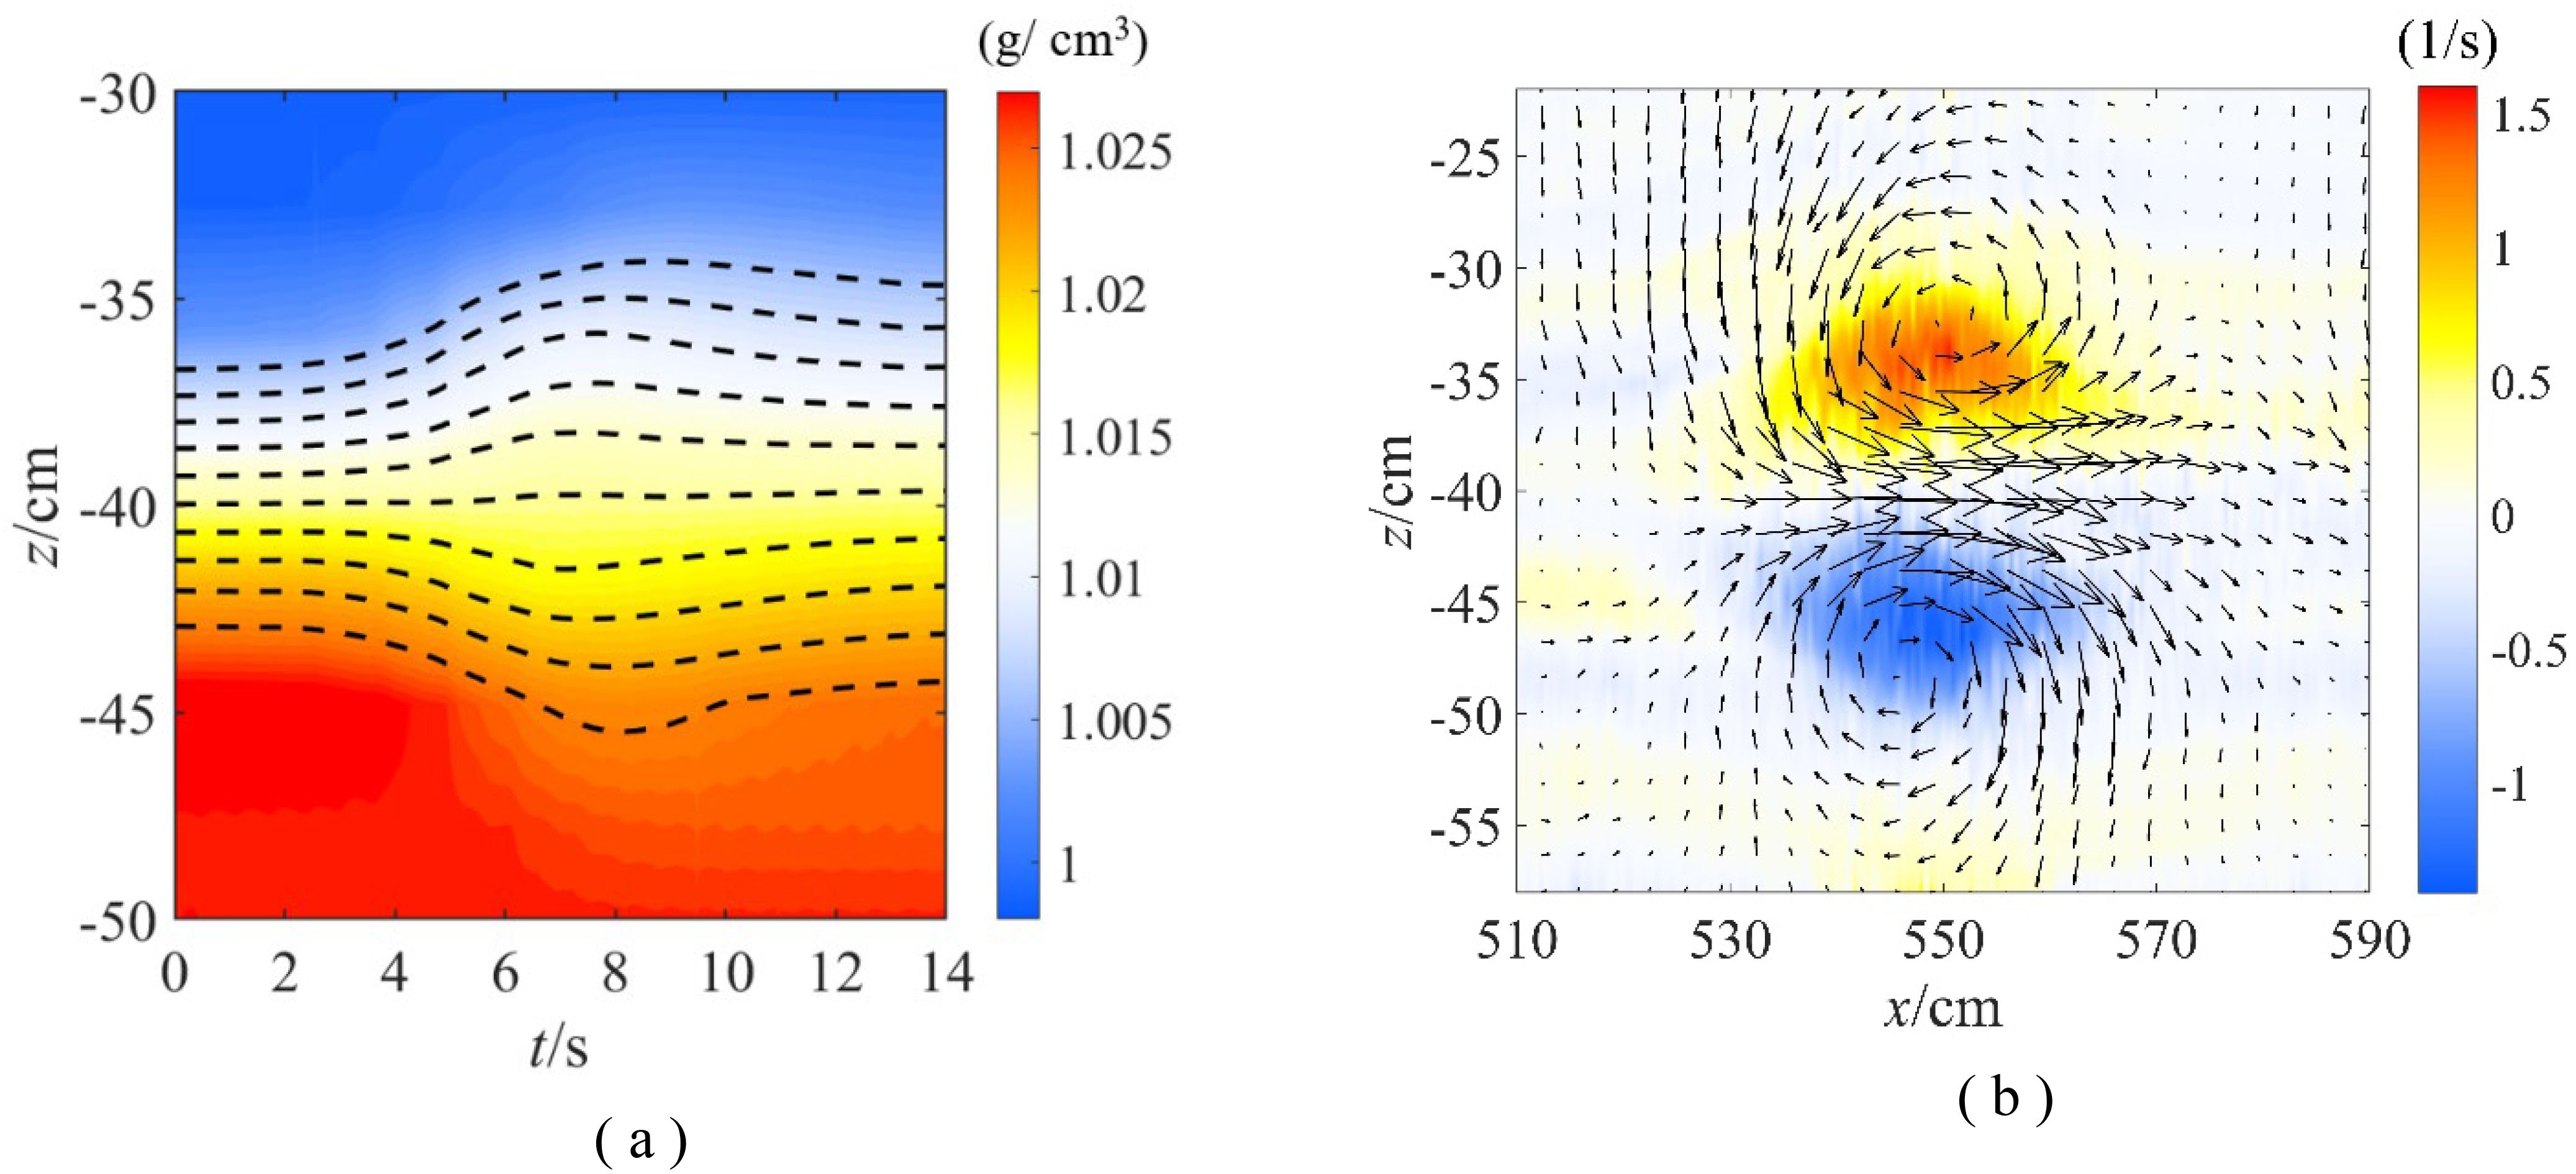
Figure 3. Measurement results of the density and flow field of a second-mode ISW in a continuous pycnocline. (A) Density field structure; (B) flow field structure.
A second-mode ISW has a density field that forms an oval shape with both convex and concave parts, and the horizontal scale of this wave is larger than the vertical scale. On the windward side of the wave, the steepness of the wave surface is greater compared to the leeward side. There is a sharp change in density gradient near the characteristic wave profile, while the change is gradual near the center of the pycnocline. The velocity field of a second-mode ISW consists of a pair of upper and lower antisymmetric flow circulation structures. The upper convex and lower concave envelopes correspond to counterclockwise and clockwise circulations, respectively. The vorticity is mainly concentrated on the side of the upper and lower vortex structures near the pycnocline. The horizontal velocity intensity aligns with the wave propagation direction, surpassing that of the reverse direction. Conversely, the intensity of the upward vertical flow matches that of the downward flow. The experimental features of isopycnals and velocity distribution of the second-mode ISW closely resemble the observational characteristics of a second-mode ISW in the natural stratified ocean documented by Yang [2].
3.2 Asymmetrical characteristics of wave-flow structure
The impact of the thickness of the fluid layer on the asymmetrical characteristics of the ISW waveform was investigated. Taking the cases of stratified environment and wave amplitude and cases of and , the relationship between the upward wave amplitude and downward amplitude of the second-mode ISW with different amplitudes was obtained, as shown in Figure 4.
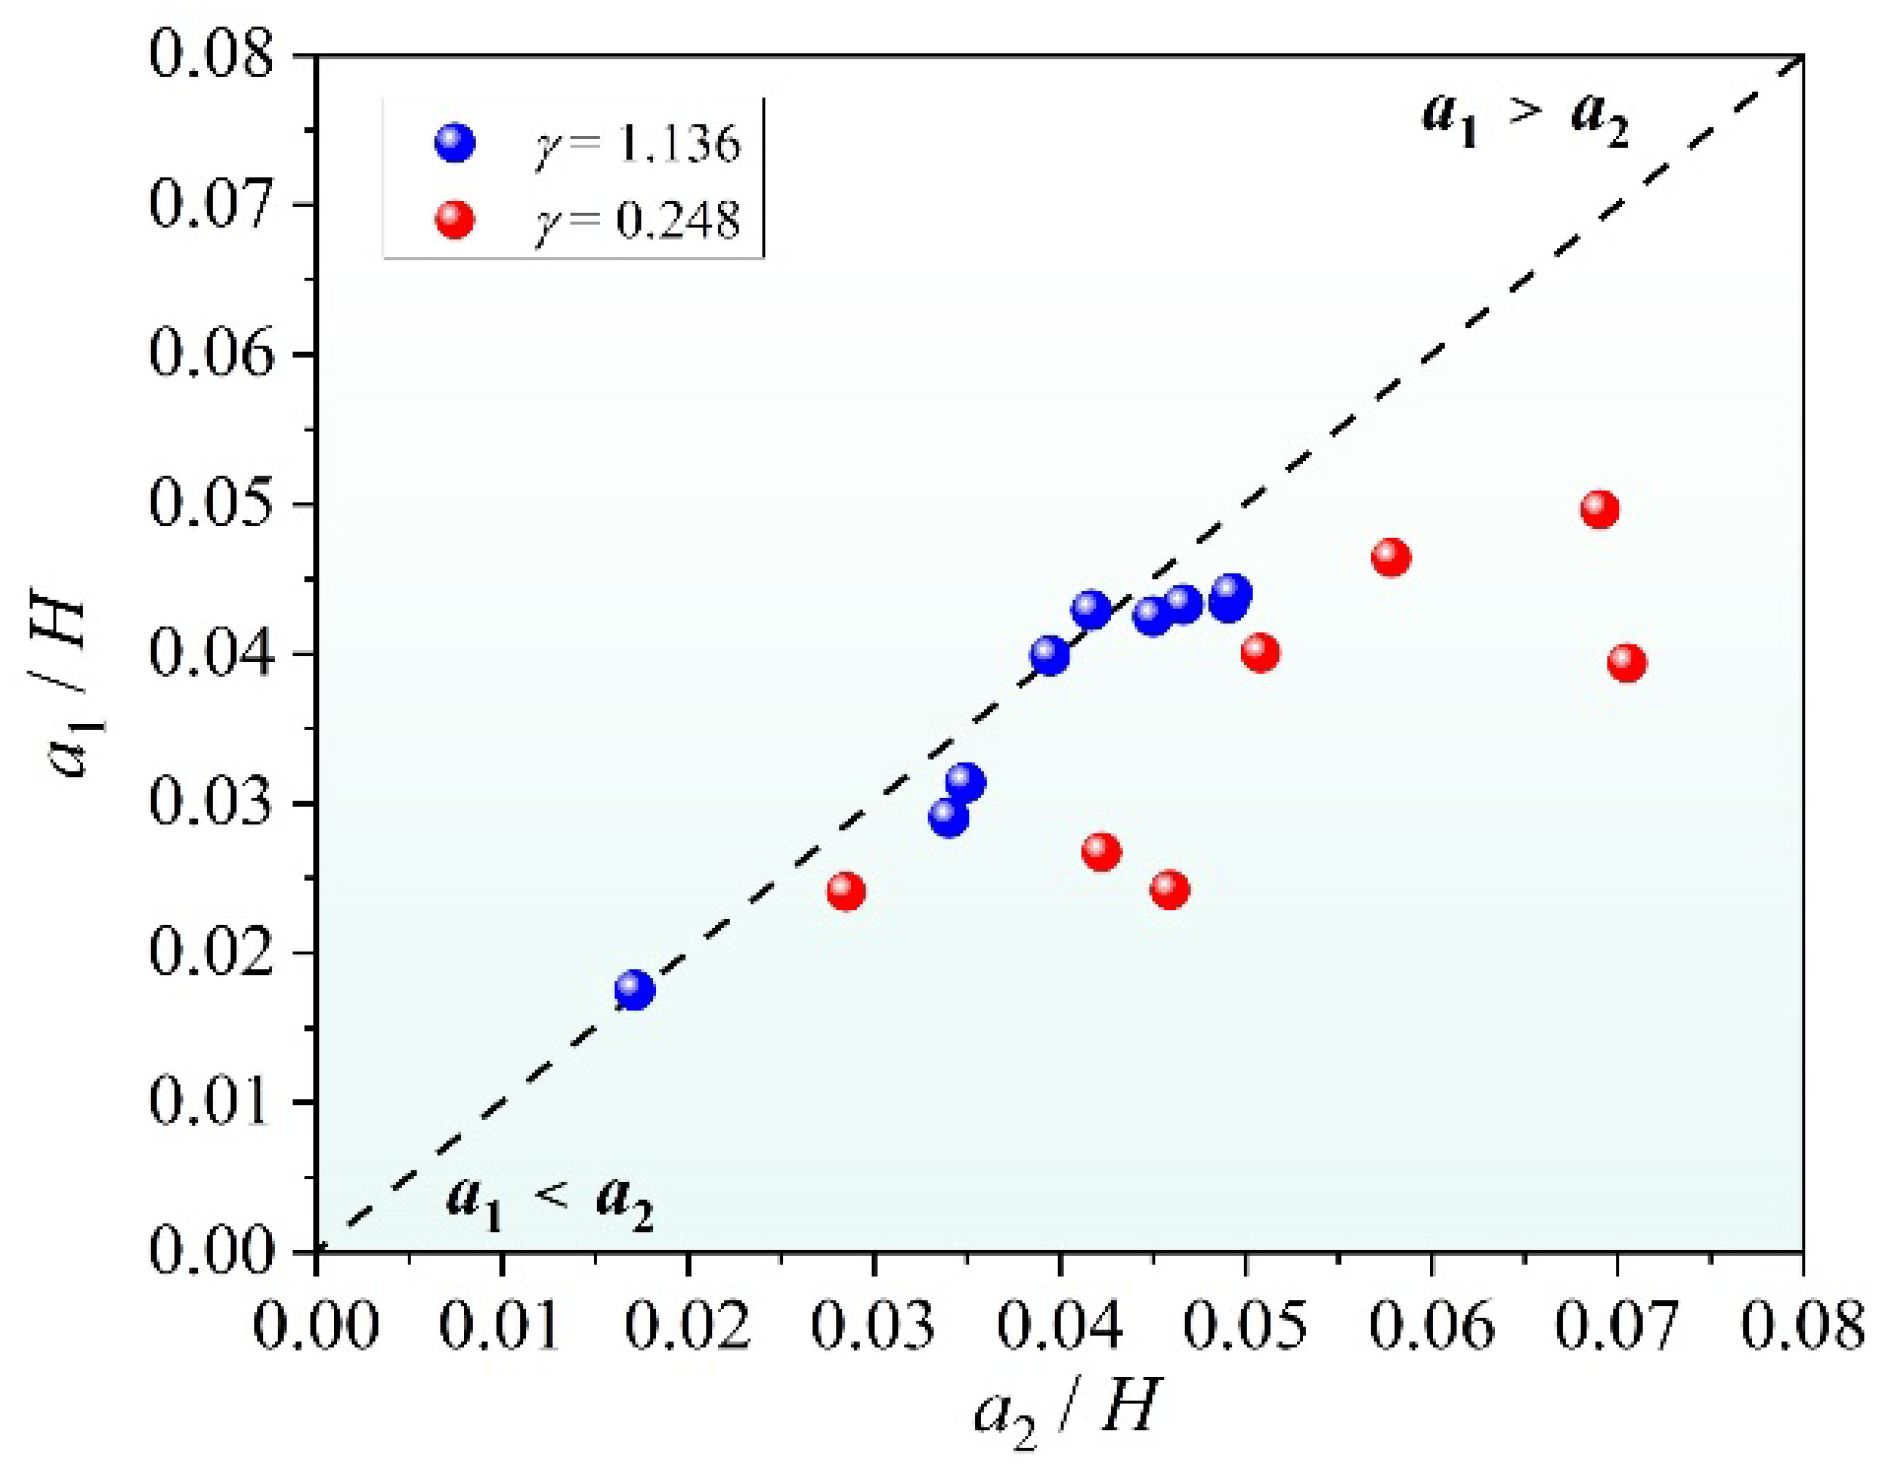
Figure 4. Waveform asymmetrical characteristics of second-mode ISWs with different wave amplitudes in different fluid environments.
The dashed line in Figure 4 indicates that the upward and downward characteristic wave profiles of the second-mode ISW are fully symmetrical. When the thickness ratio is large (), the upper convex amplitude is close to the concave amplitude . When the upper and lower thickness ratio is small (), the amplitude difference is obviously larger than that of the larger thickness (), and the concave amplitude is always larger than the convex amplitude , which is related to the fact that the lower layer thickness of the stratified fluid is larger than the upper layer thickness. The analysis above indicates that the asymmetrical characteristics of a second-mode ISW waveform are closely linked to the geometric thickness ratio of the fluid layer, rather than the initial wave amplitude of the incident ISW.
Furthermore, we investigated the asymmetrical thickness difference between the upper and lower layers of the fluid in the second-mode ISW flow field. Taking the cases of stratified environment and wave amplitude , cases of and , as well as cases of and , the horizontal velocity profile and shear flow profile at the central section of the second-mode ISW packet are obtained. The differences in horizontal velocity above and below the wave envelope and the differences in horizontal shear between the convex and concave domains on the wave envelope were analyzed to investigate the asymmetrical characteristics of the flow field, as illustrated in Figure 5.
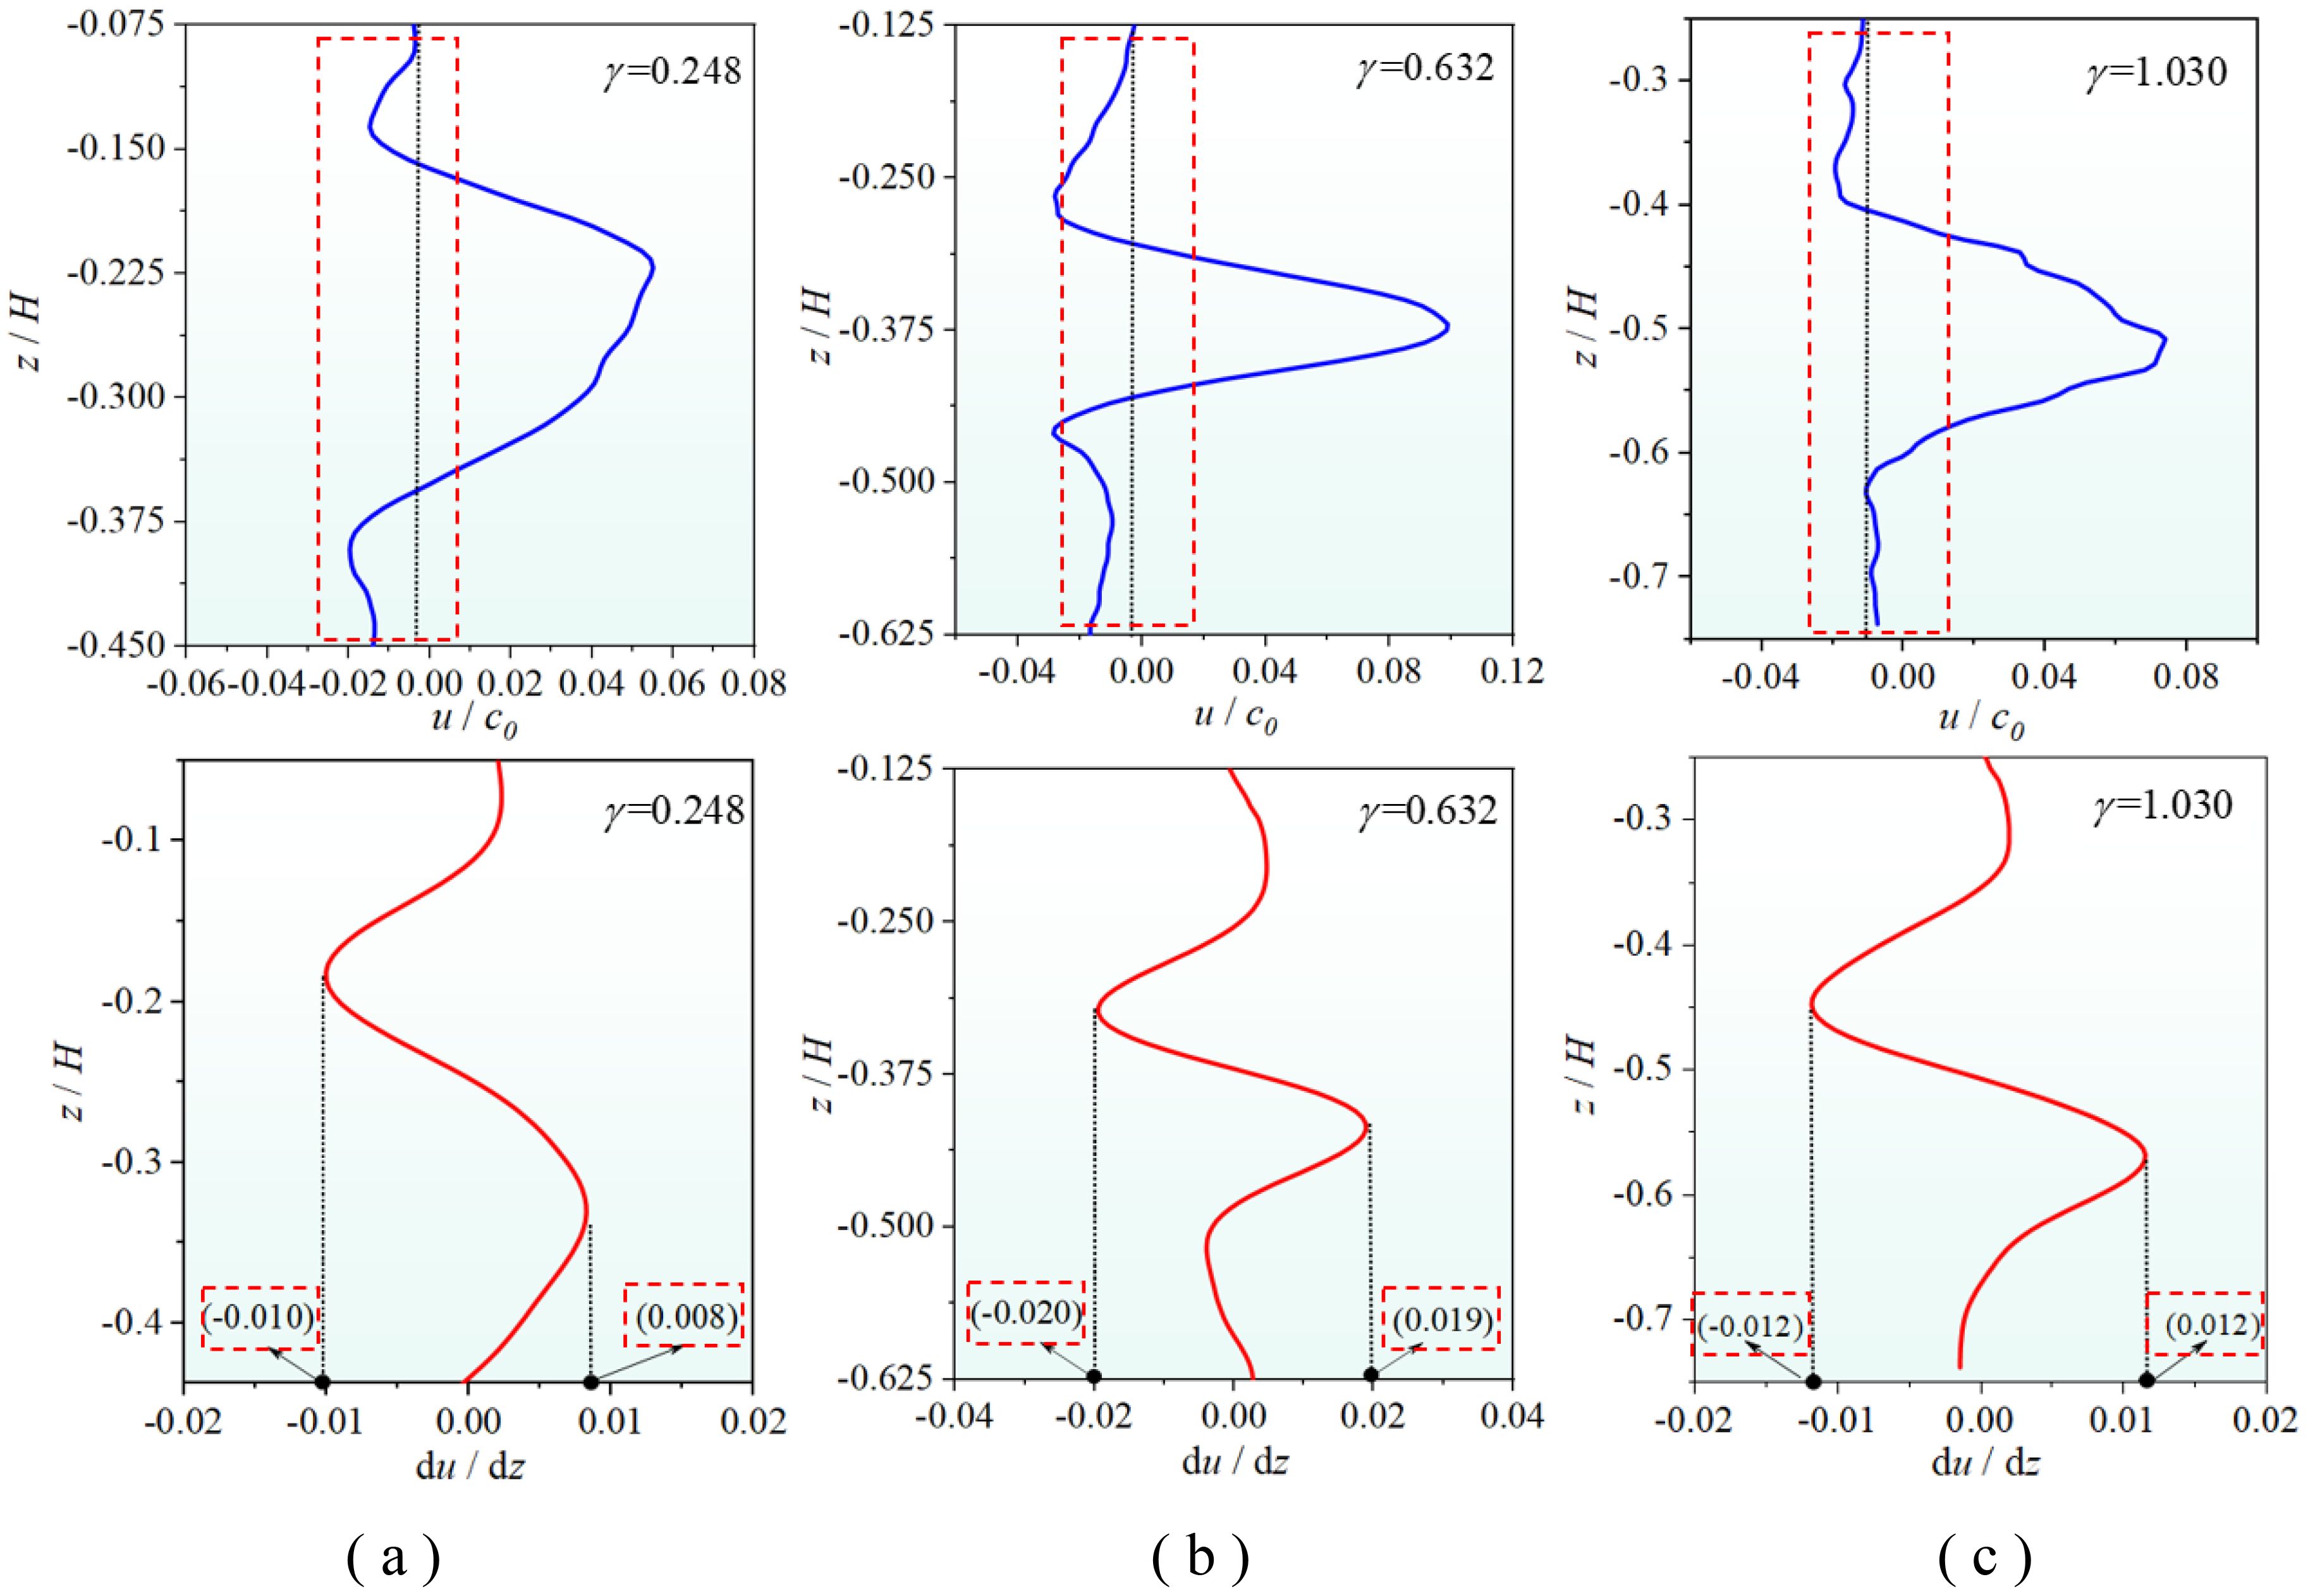
Figure 5. Asymmetrical characteristics of the second-mode ISW velocity field (A) ; (B) ; (C) .
Figure 5A shows the horizontal velocity profile and shear flow profile when the thickness ratio is . The horizontal velocity difference and horizontal shear difference are both large. At this time, the shear magnitude value of the upper convex domain is approximately 25% higher than that of the lower concave domain. Figure 5B shows the horizontal velocity difference and horizontal shear difference when the thickness ratio is , which are significantly reduced compared with the case of . At this time, the shear amplitude of the upper convex domain is approximately 5% higher than that of the lower concave domain. Figure 5C shows that the horizontal velocity difference and the horizontal shear are almost equal when the thickness ratio is large (), and the upward and downward circulations of the second-mode ISW become symmetrical. It has been demonstrated that the asymmetrical characteristics of the second-mode ISW flow field will be diminished with an increase in the geometric thickness ratio, which aligns with the waveform’s asymmetry characteristics.
4 Theoretical characteristics of a second-mode ISW
4.1 KdV model
A Cartesian rectangular coordinate system , the same as in the experimental fluid environment, was established in the computational domain. Considering a finite depth fluid environment with total depth of , a continuous density change of , and a background horizontal velocity of , the Brunt-Vaisala frequency is a continuous function of depth . Under the assumption of fluid statics, frictionless internal motion and ‘rigid cover’ of a free surface, the linear internal wave propagation speed of and vertical mode function of can be obtained by solving the eigenvalue problem in the Taylor-Goldstein (T-G) equation using the Boussinesq approximation (Fliegel and Hunkins, 1975; Grimshaw et al., 2010).
The same experimental fluid environment was constructed. Taking the typical fluid environment of with continuous pycnocline as an example, the background horizontal velocity is taken as zero. A Holmboe-type density distribution was considered.
The corresponding Brunt-Vaisala frequency is
The vertical profile distribution of and , corresponding with the calculation domain, are shown in Figure 6.
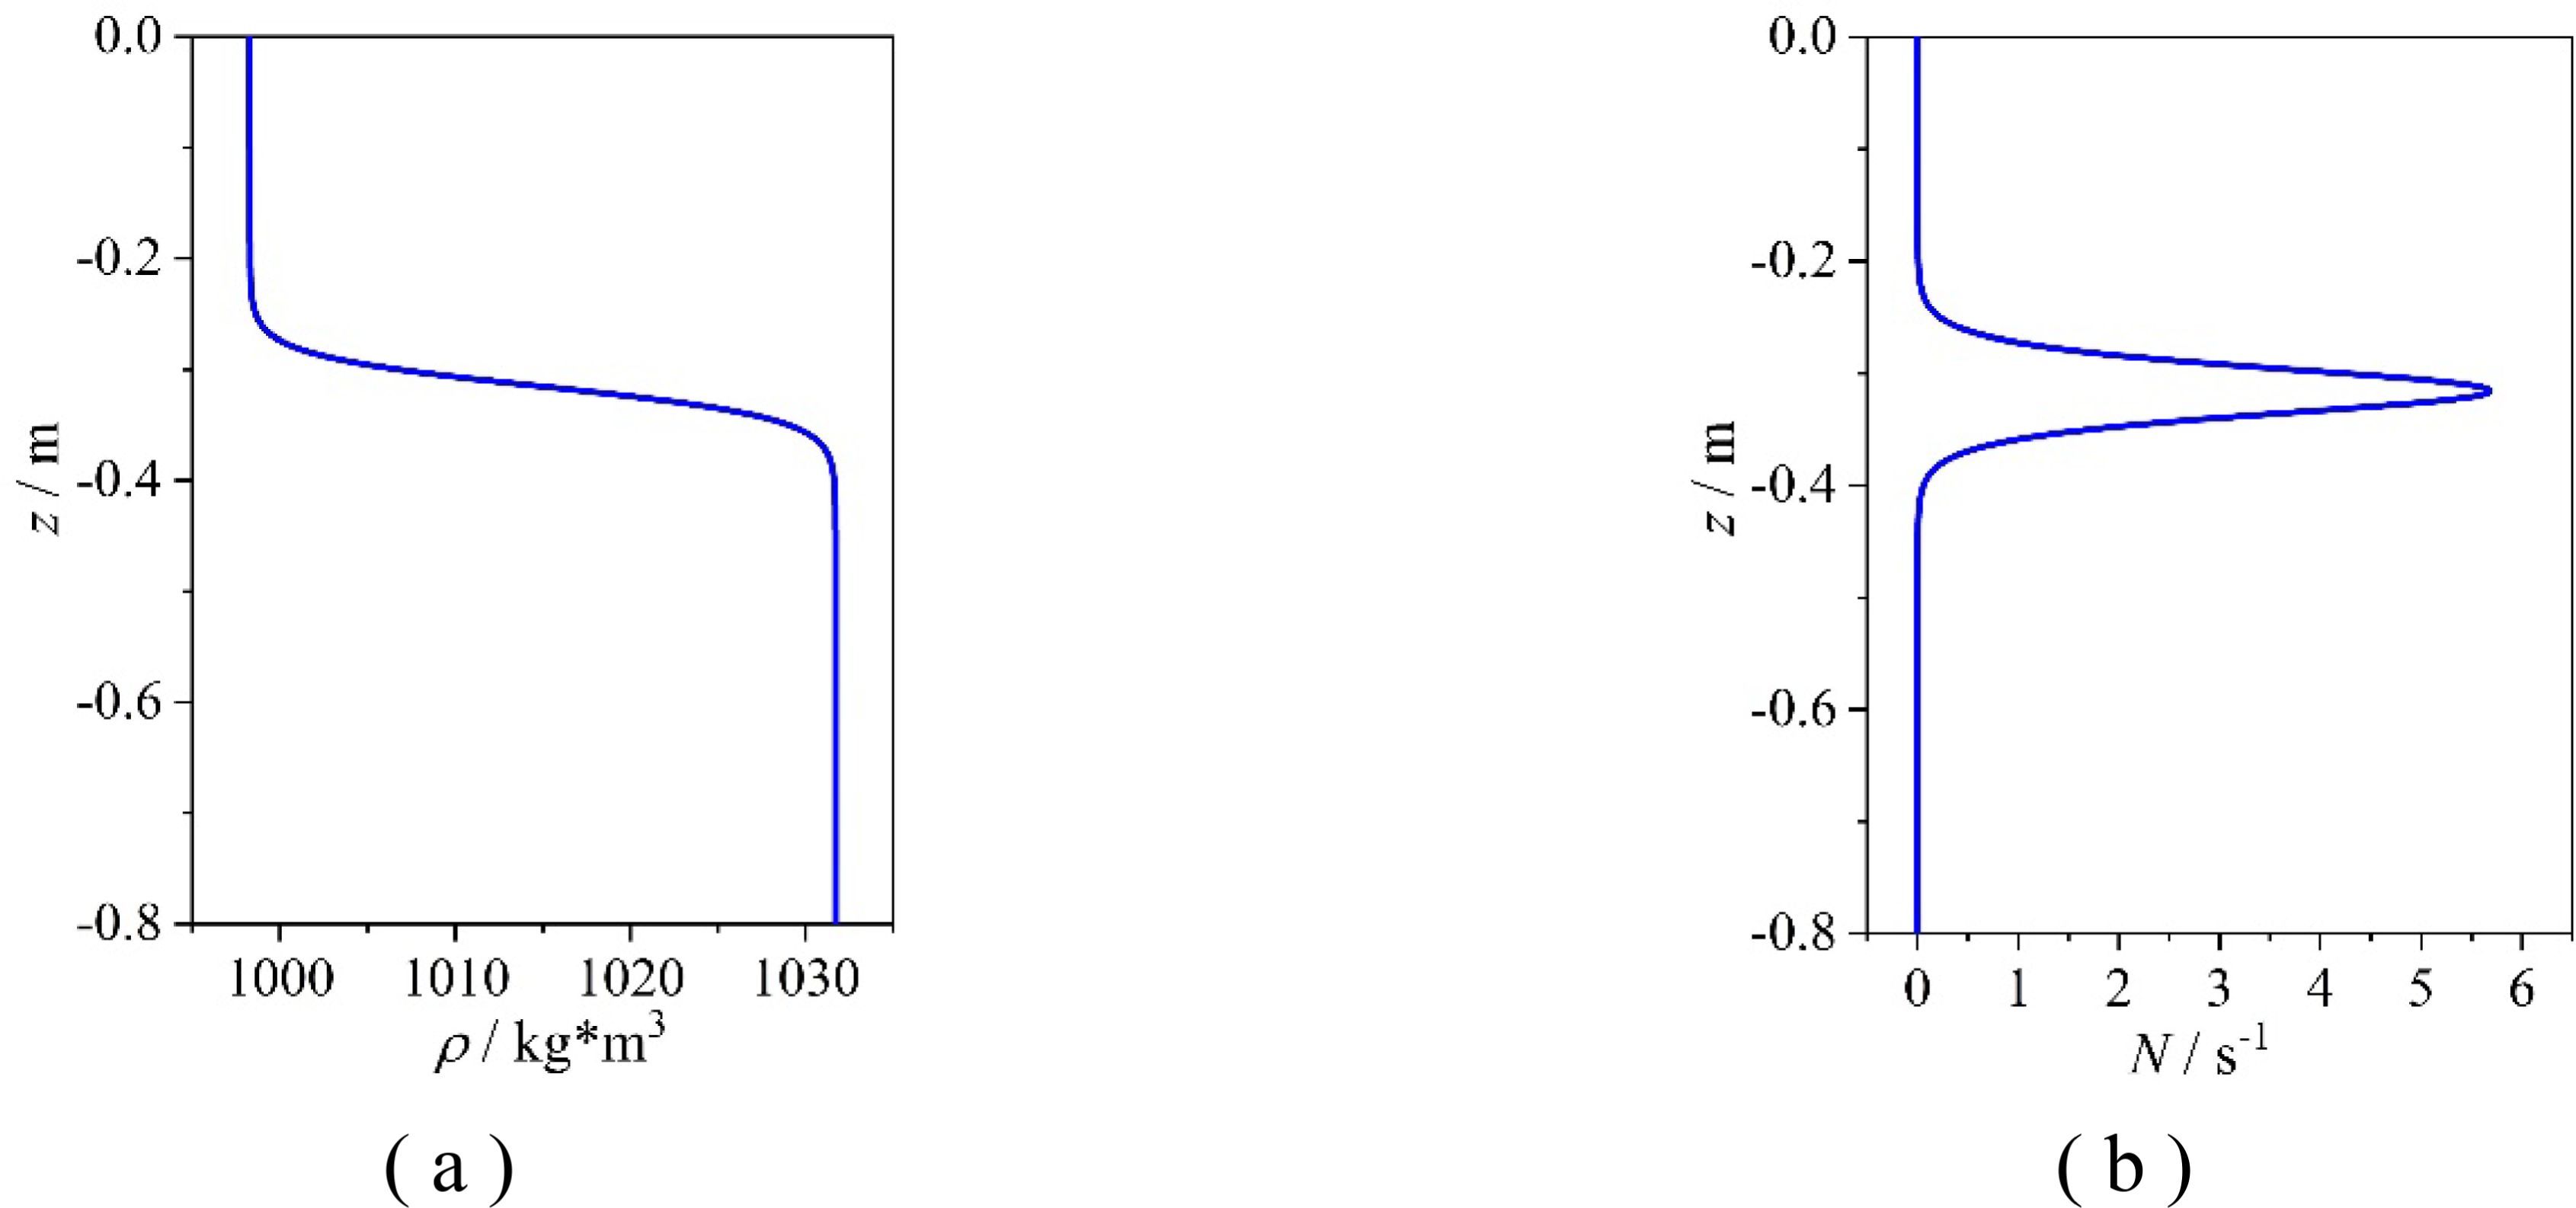
Figure 6. Vertical profile of and in the calculation case. (A) Profile of ; (B) profile of .
We used the first and second vertical mode functions of and , which correspond with the first-mode and second-mode internal waves respectively. After normalizing, we obtained the vertical structure of the first-mode and second-mode internal waves in the continuous density pycnocline environment from Figure 6, as shown in Figure 7. With increasing water depth, increases gradually and then decreases gradually, and increases and then decreases with increasing water depth, and then the polarity is converted, negative increase followed by a decrease is observed, with the maximum values nearing the upper and lower boundaries of the pycnocline, respectively.
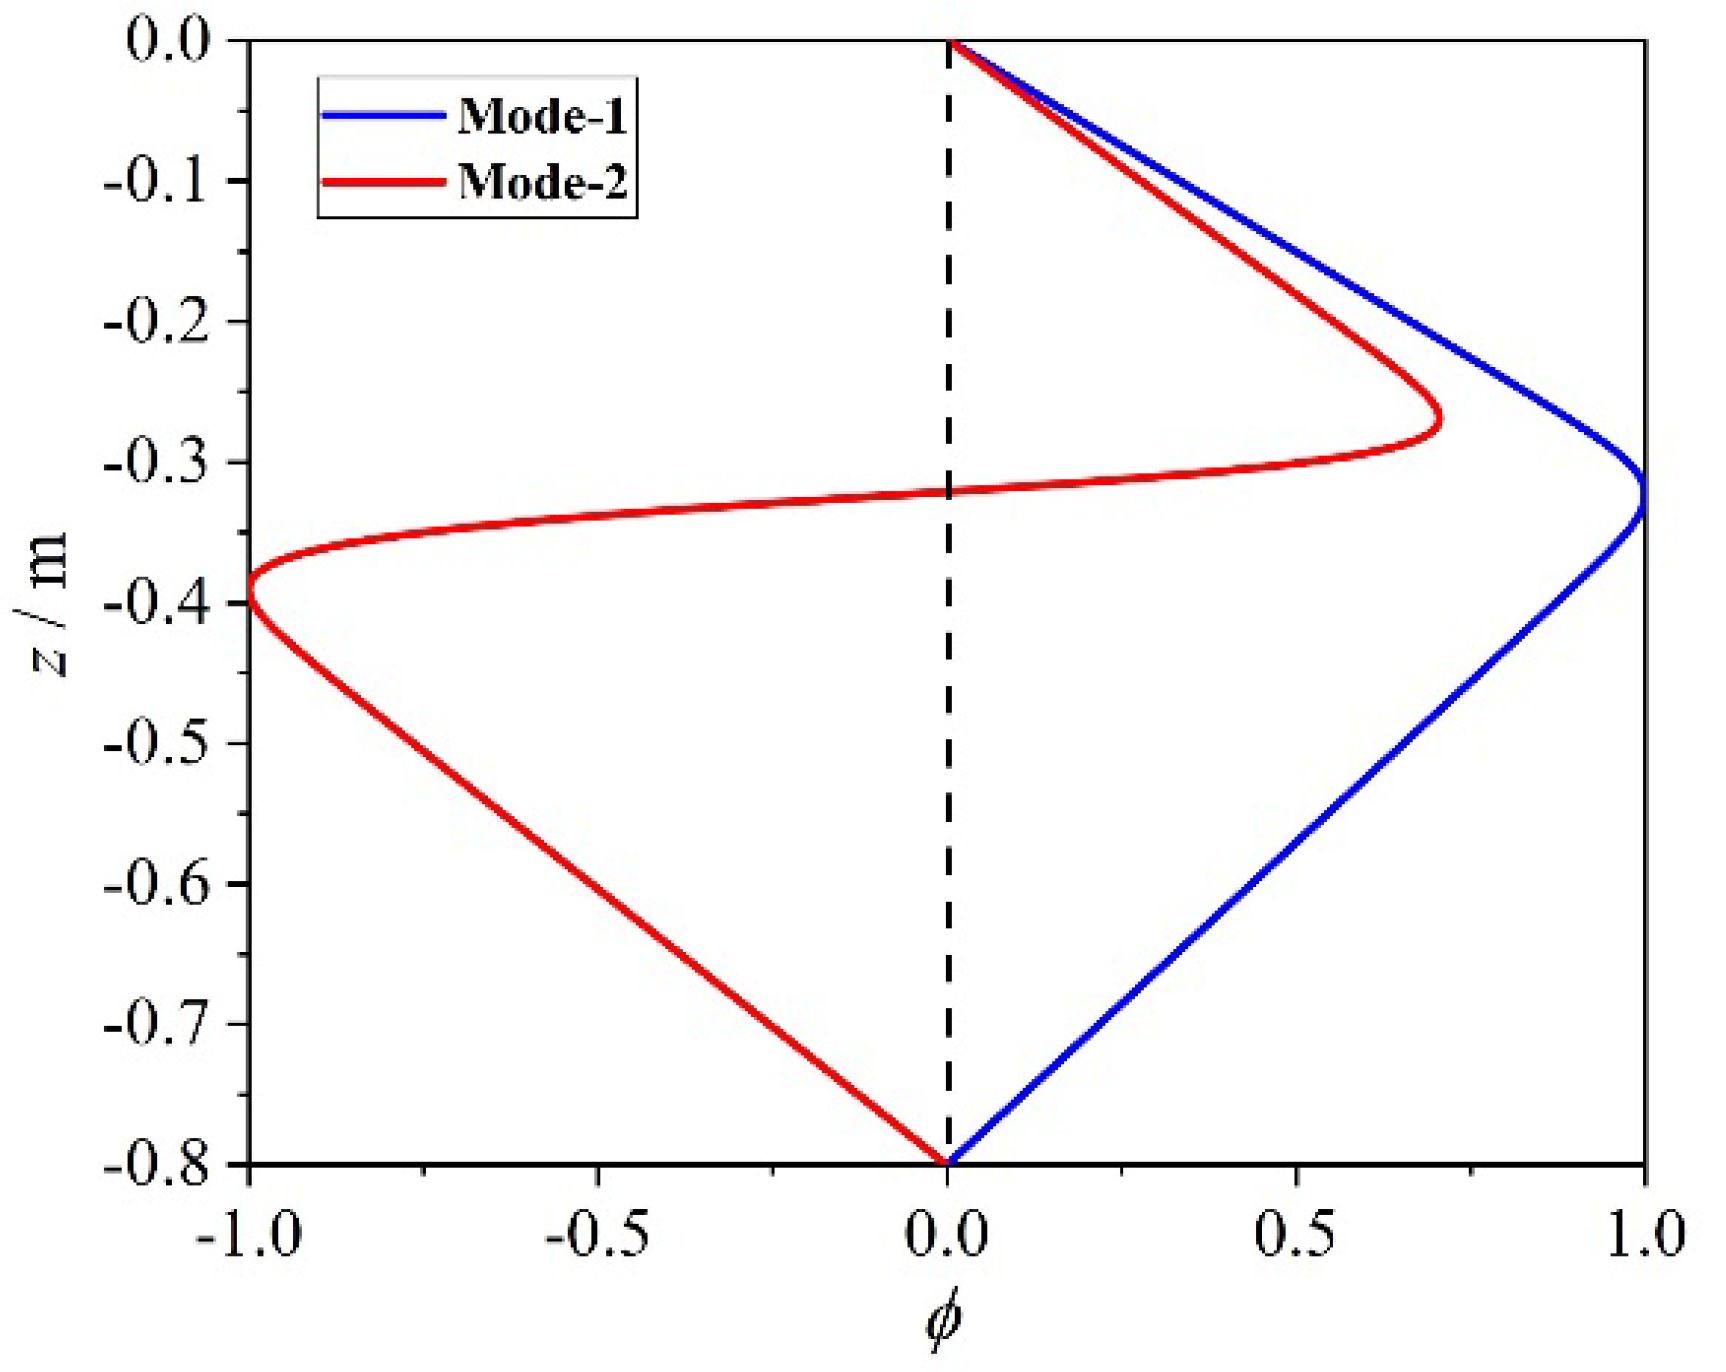
Figure 7. The internal wave vertical mode functions of first-mode and second-mode ISWs.
The KdV or extended KdV (eKdV) theoretical model is usually used to describe solitary waves propagating horizontally along a free surface. It can also be used to describe the horizontal propagation of a second-mode ISW in a continuous-density fluid (Benjamin, 1966). The KdV model, describing the horizontal propagation of weakly non-linear and weakly dispersive internal waves along the pycnocline, is as follows:
Where represents the vertical displacement, represents the time, represents the horizontal distance along the wave propagation direction, and are the coefficients of the non-linear and dispersion terms, respectively, both of which are related to environmental parameters such as stratification and water depth, which are calculated by the following formula.
The ISW solution for Formula 6 can be expressed as
where , and are the wave amplitude, non-linear speed, and wavelength of the ISW, respectively, which are calculated by the following formulae:
After normalization of , for any mode of ISW packet with an amplitude of in continuous pycnocline, the vertical displacement of the KdV ISW packet at different vertical depths is calculated by the following formula:
According to , the vertical velocity induced by the ISW is
The horizontal velocity induced by the ISW can be obtained by the relationship of , and it can be written as
Figure 8A shows the second-mode ISW envelope calculated by the KdV model in a continuous pycnocline environment characterized by non-uniform variation. The horizontal wave width, vertical wave height, and wave steepness gradually increase and then decrease with depth variations downward from the surface and upward from the bottom, the reduction of which becomes more obvious as it moves closer to the center of the pycnocline. In Figure 8B, the calculated flow field characteristics are as follows: a pair of reversely rotating vortices are distributed above and below the center of the pycnocline. The theoretical characteristics of the second-mode ISW calculated by the KdV model are consistent with the experimental one.
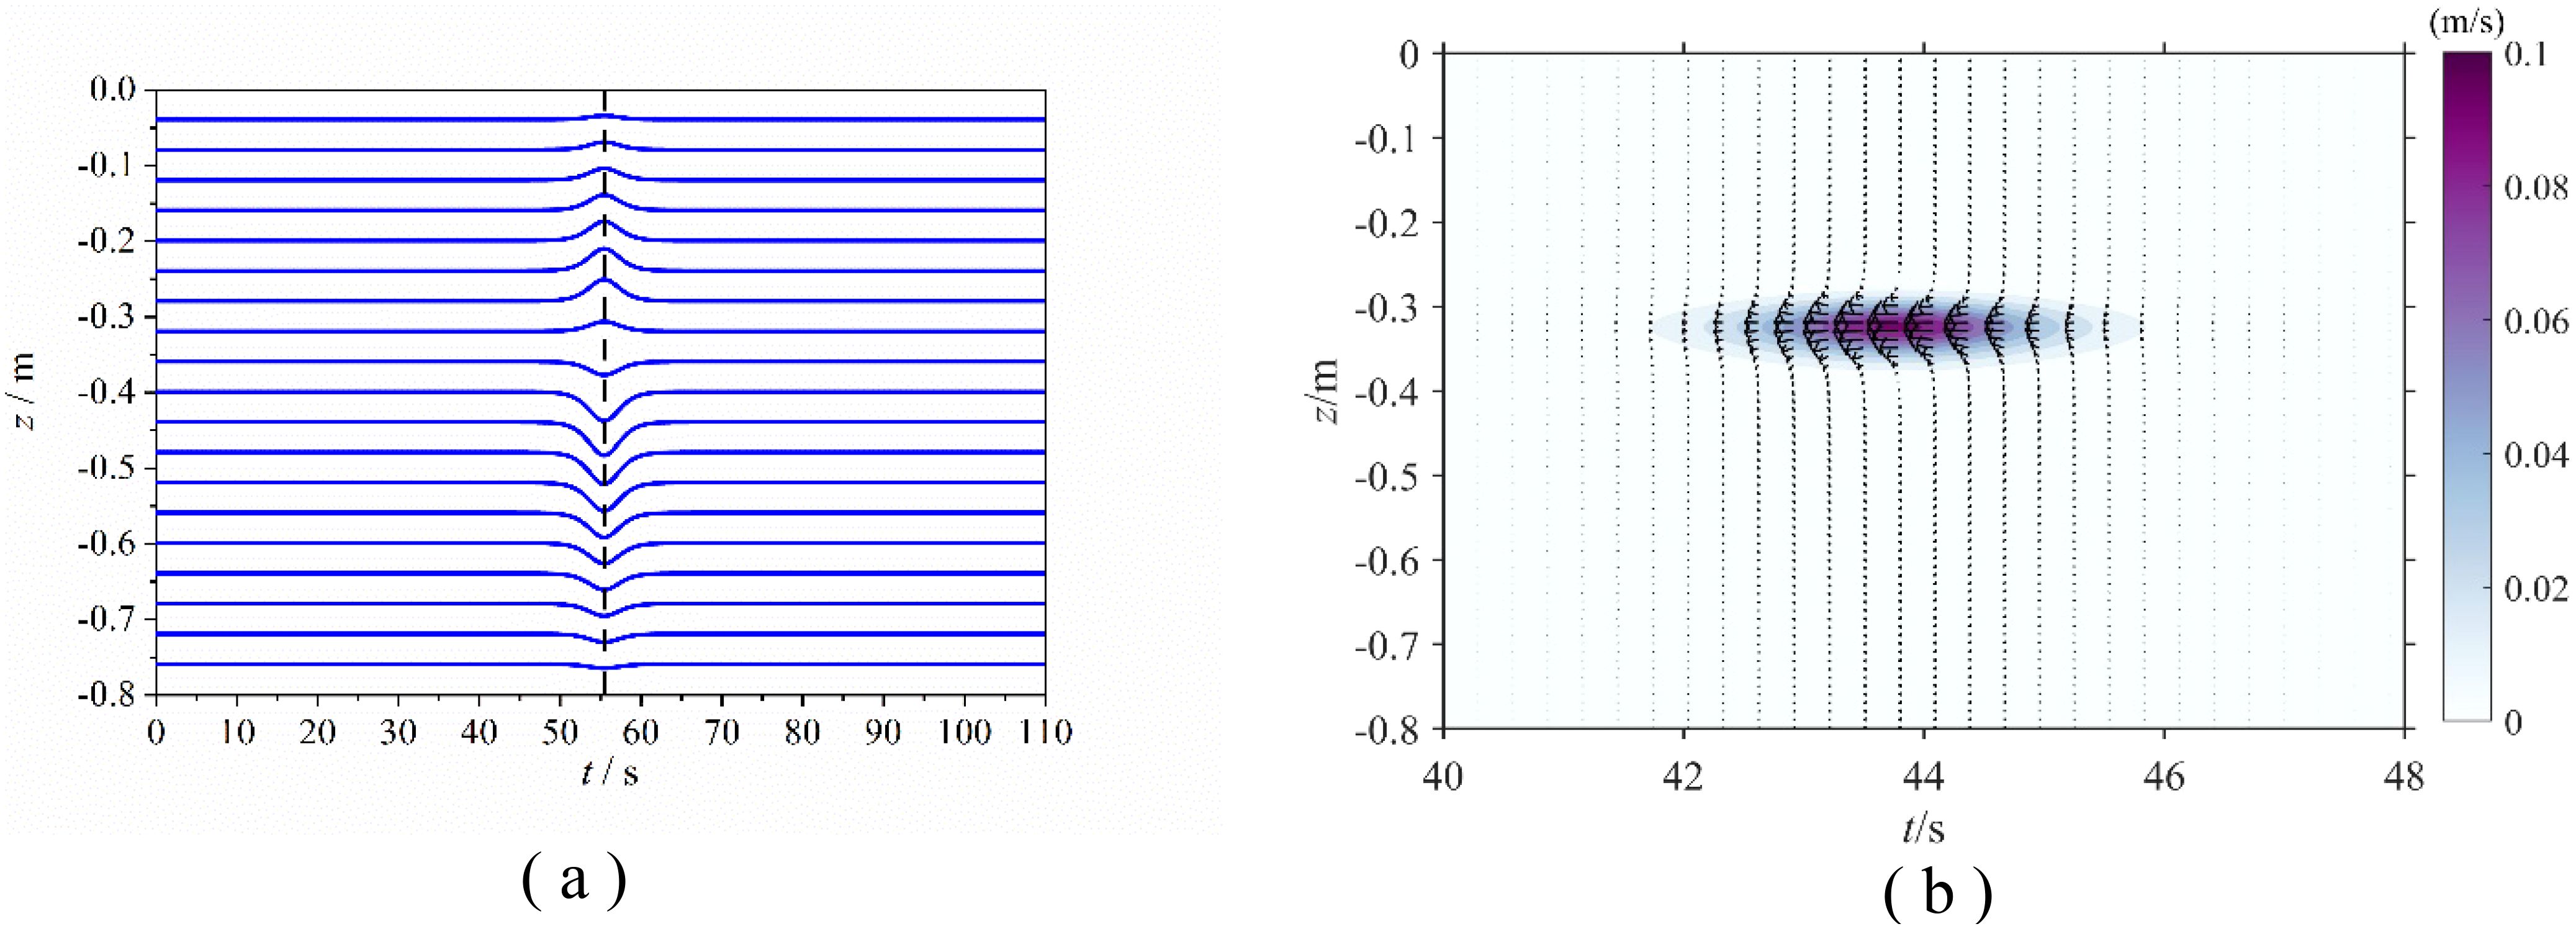
Figure 8. Waveform and velocity distribution of the second-mode ISW calculated by the KdV model. (A) Waveform distribution; (B) velocity vector distribution.
4.2 eKdV model
The eKdV model, with a correction for the non-linear term, can be used to describe an ISW with a large wave amplitude. The equation for the horizontal propagation of this ISW along the pycnocline is as follows (Grimshaw et al., 2004):
In these equations, is the non-linear correction for the vertical modal function , which is obtained from the following inhomogeneous eigenvalue problem (Rong et al., 2023):
The vertical mode function of the ISW calculated by the eKdV model is then obtained as follows and is normalized.
The steady-state solution of the eKdV model is (Helfrich and Melville, 2006):
Where 、 和 º
For an ISW with a wave amplitude of in a continuous-density pycnocline, the isopycnals of the eKdV-type ISW at different vertical depths is
The corresponding vertical and horizontal velocities induced by an ISW are
Under the same calculation conditions as the KdV-type ISW, the calculated isopycnals of the eKdV-type second-mode ISW envelope in the continuous pycnocline along the vertical depth are depicted in Figures 9A, B respectively. Both are similar to the calculation results of the KdV-type ISW. However, the magnitude of the vertical velocity value is increased compared with that of the KdV-type ISW due to the non-linear correction of the vertical mode function by the eKdV-type ISW.
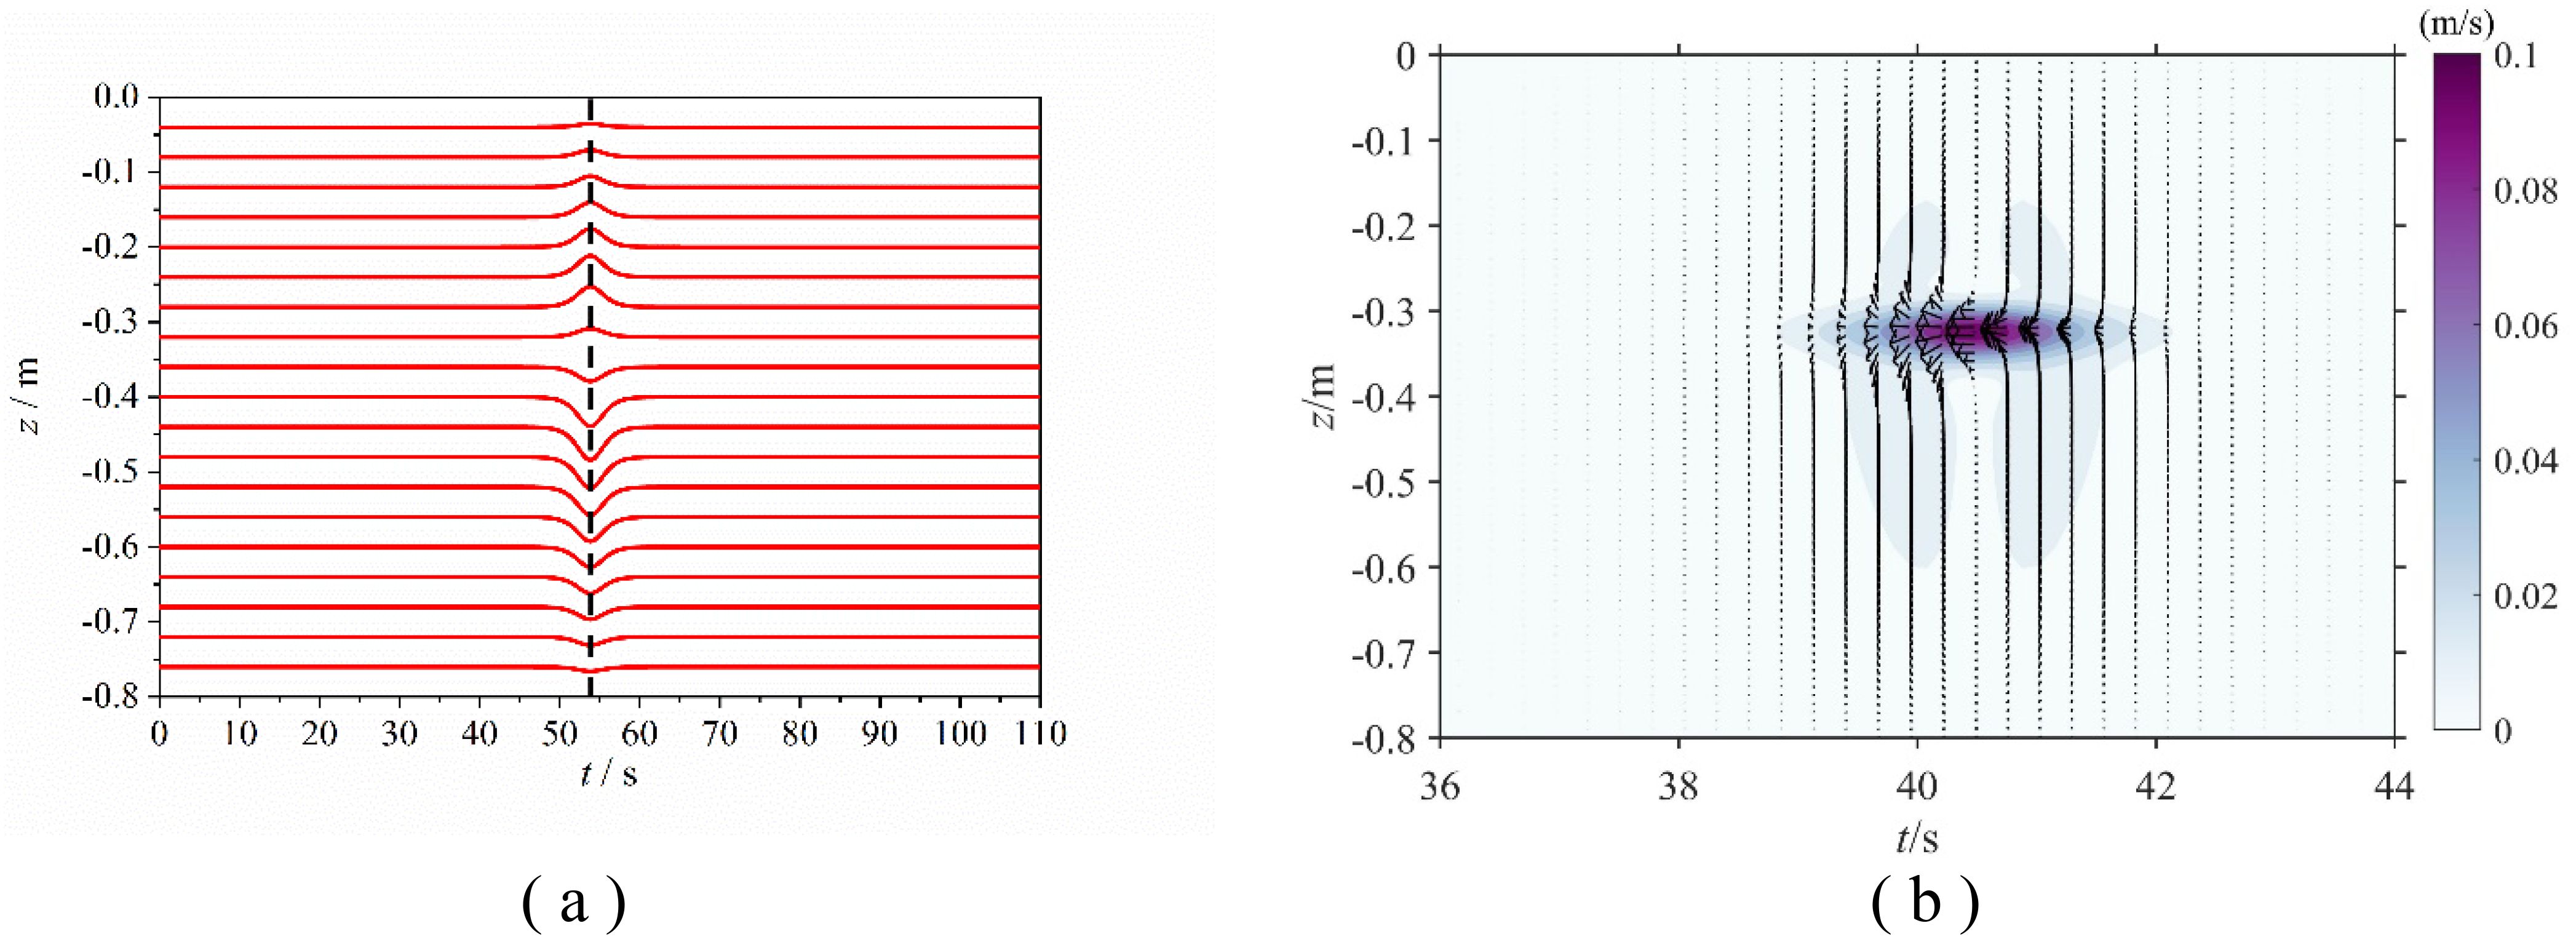
Figure 9. eKdV-type second-mode ISW waveform and velocity vector distribution. (A) Waveform; (B) velocity vector.
5 The applicability of ISW models in describing wave characteristics
Taking the typical case of and as an example, the KdV and eKdV theoretical models in continuous pycnocline were used to calculate the ISW speed and wavelength respectively, and the applicability of the two theoretical models in describing the wave characteristics of the second-mode ISWs was investigated.
The variation in the speed and wavelength of the second-mode ISW with changing wave amplitude is shown in Figure 10. With an increase in wave amplitude , the ISW speed calculated by the two theoretical models increases linearly, while the wavelength decreases gradually, and the attenuation magnitude decreases with increasing wave amplitude. When comparing the calculation and experimental measurement results of the two models, the eKdV model is better than the KdV model in describing the ISW speed and wavelength. This is due to the fact that the former non-linearly modifies the horizontal non-linear propagation equation and the vertical mode function, which improves the applicability of the weakly non-linear model to the second-mode ISW.
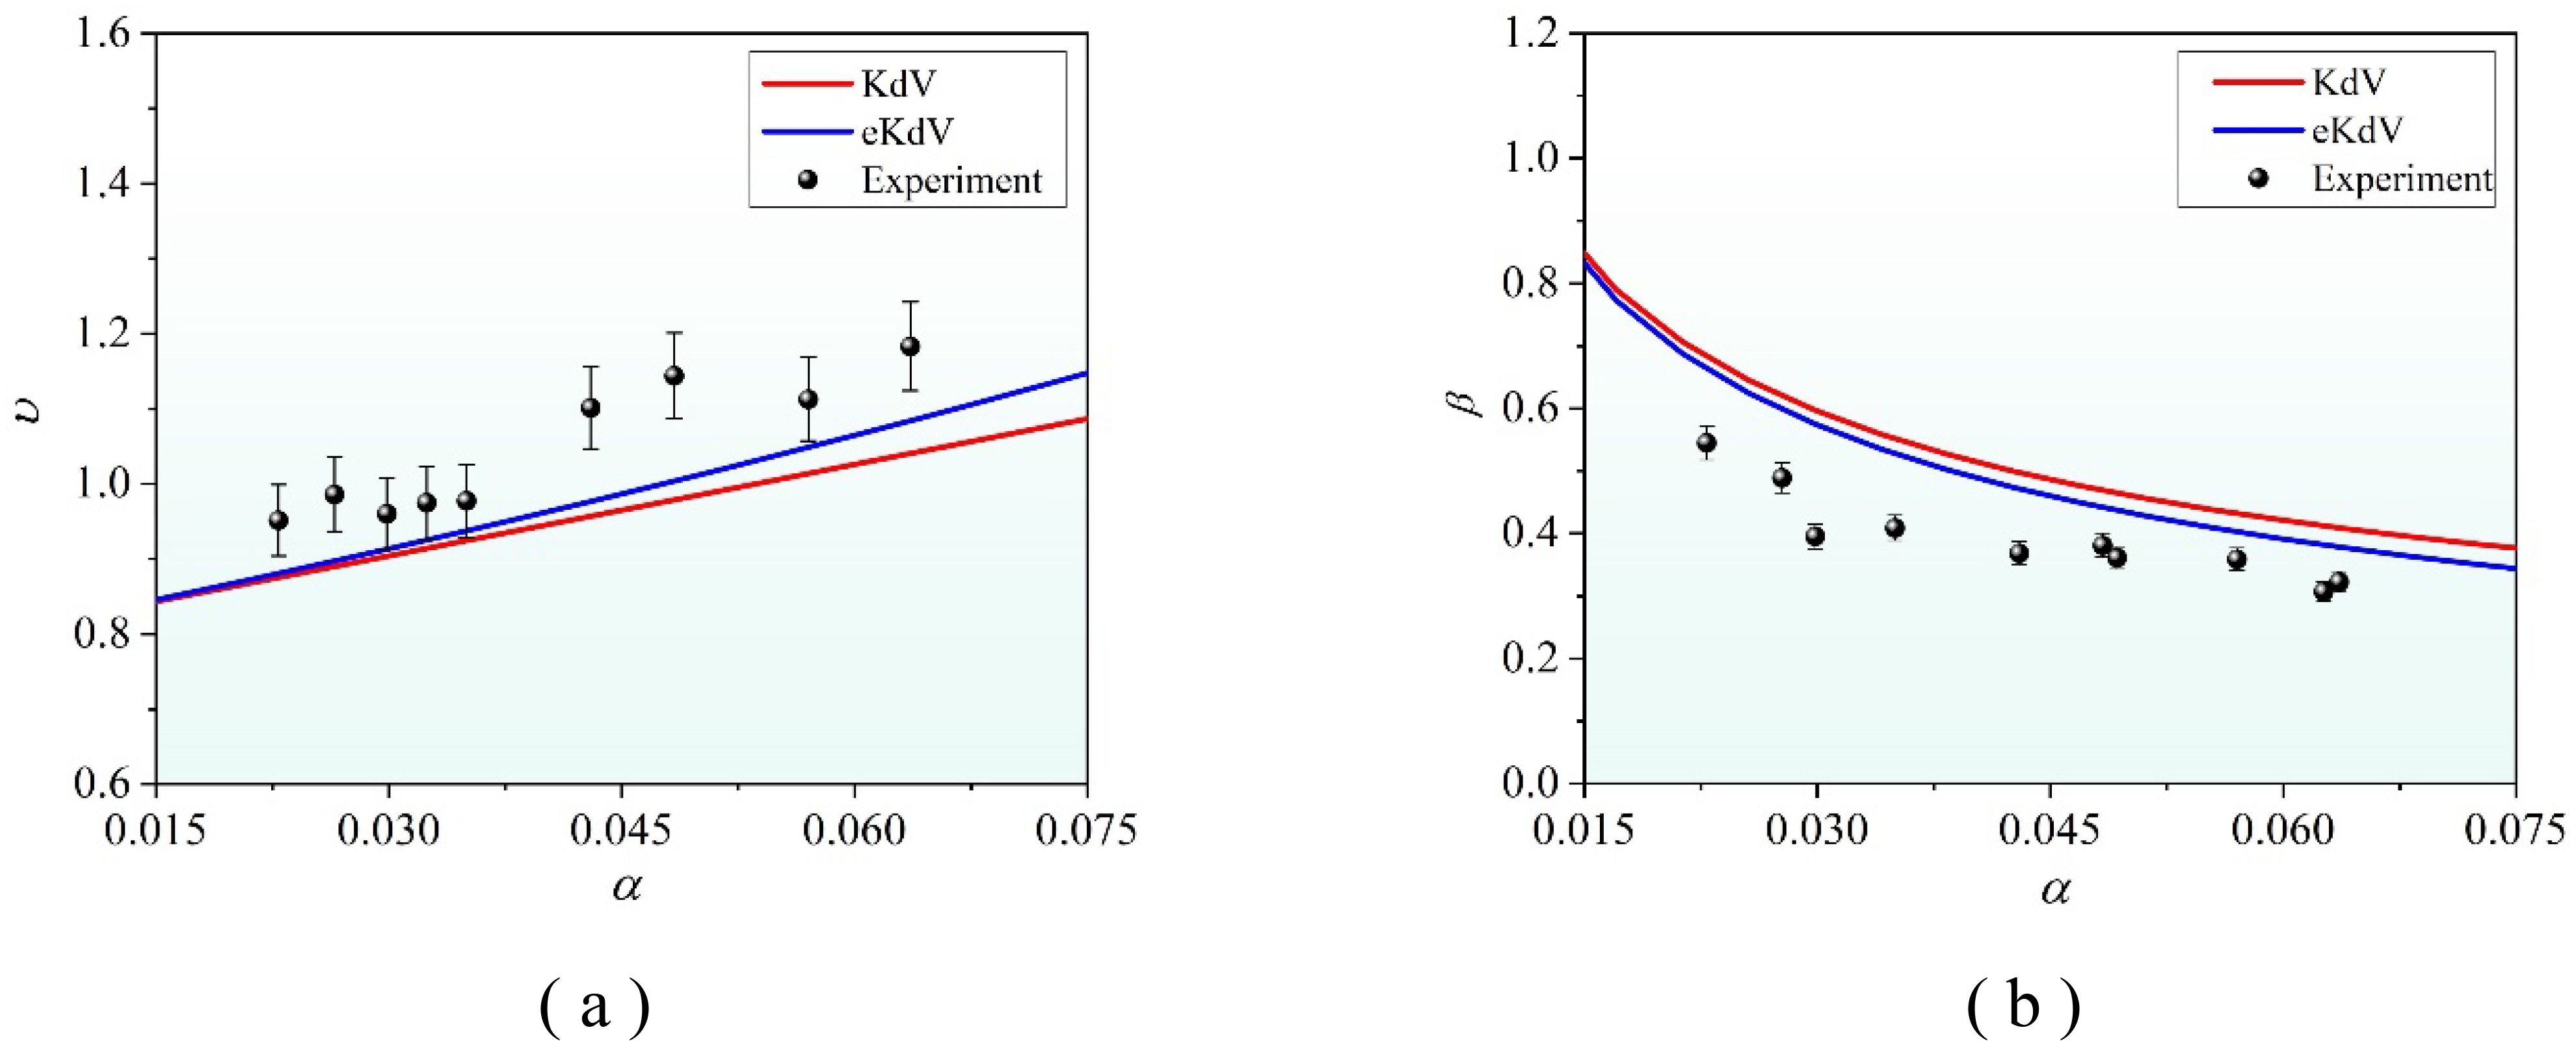
Figure 10. The applicability of the KdV and eKdV theories for describing wave elements. (A) ISW speed changing with wave amplitude; (B) wavelength changing with wave amplitude.
The following is to investigate the difference in the applicability of the two theoretical models in describing the fluctuation factors of a second-mode ISW when the stratified environment changes. Taking the typical case, case 1, of and , case 2 of and , and case 3 of and , the characteristic vertical scale , characteristic horizontal scale , and characteristic ISW speed were calculated by the two theoretical models, and the experimental results were compared.
Figure 11A shows the variation in the characteristic ISW speed of the second-mode ISW with its characteristic vertical scale . As the thickness ratio gradually increases, the applicability of both the KdV and eKdV models to describe the characteristic ISW speed of the second-mode ISWs gradually improved. When the thickness ratio is close to that of the lower layer (), the applicability of the two ISW models to describe the characteristic ISW speed of the second-mode ISW is optimal, and the description range of the eKdV model is better than that of the KdV model. Additionally, the characteristic ISW speed of the second-mode ISW will be enhanced by the increasing in the case of the same characteristic vertical scale . Figure 11B shows the variation in the characteristic horizontal scale of the second-mode ISW with its characteristic vertical scale . Similarly, the applicability of both the KdV and eKdV models to describe the characteristic horizontal scale of the second-mode ISWs gradually improved with the increasing . The description range of the eKdV model was better than that of the KdV model in the three cases with different stratification environments. In addition, in the case of the same characteristic vertical scale, the larger the thickness ratio of the upper and lower layers, the larger the characteristic horizontal scale of the second-mode ISW. Based on the analysis above, it is evident that altering the parameters of the stratified fluid environment will not affect the positive correlation between the speed of a characteristic ISW and the horizontal scale of the second-mode ISW as the vertical scale increases. However, it will only impact the magnitude value of the two and their rate of change with the vertical scale.
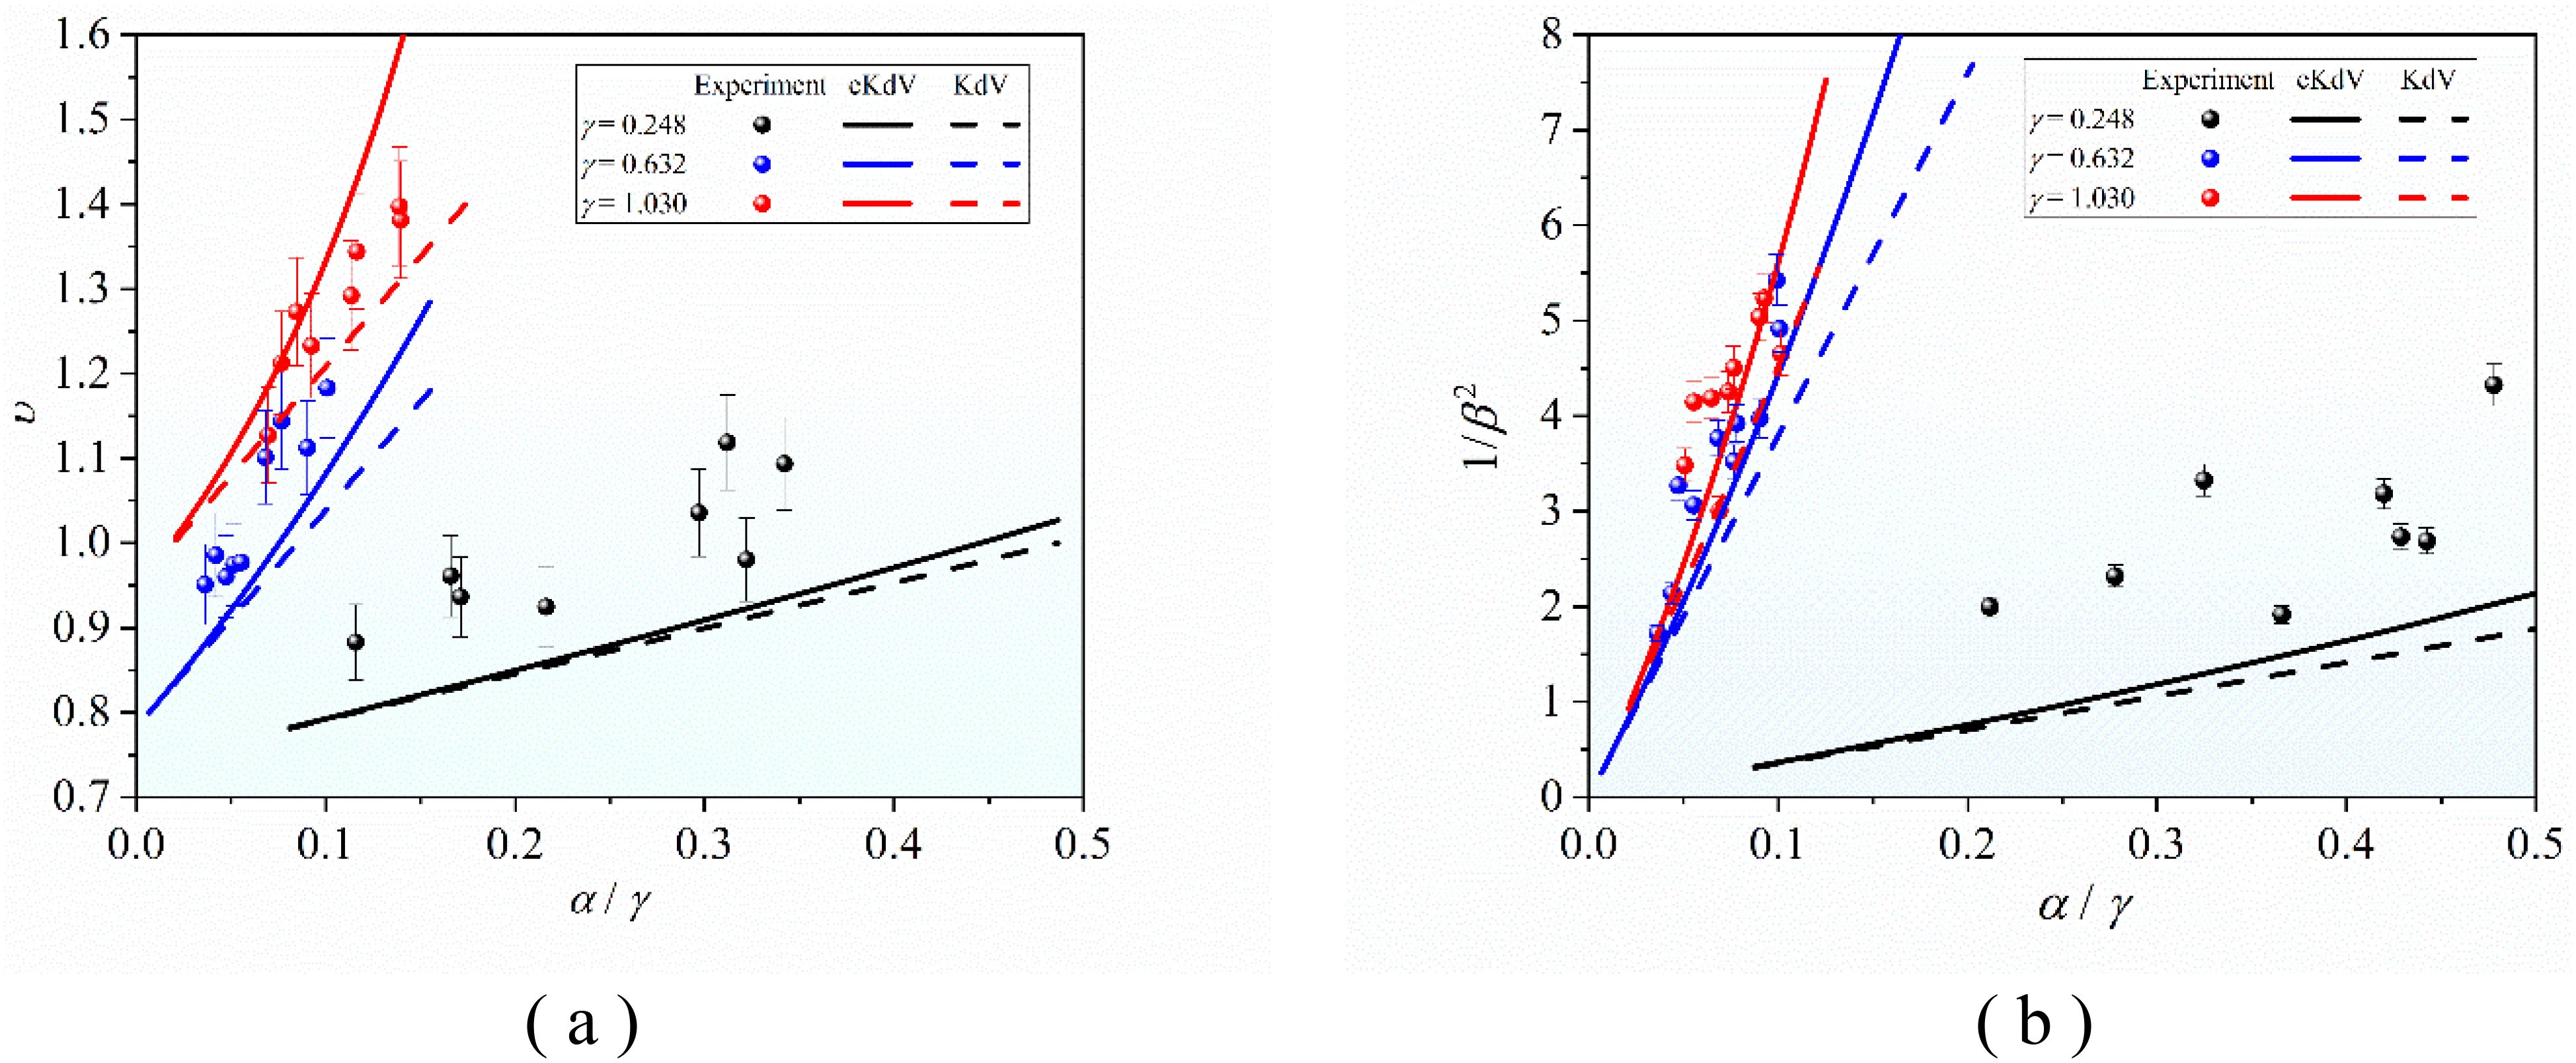
Figure 11. The applicability of the KdV and eKdV models for describing the wave elements in different stratified environments. (A) The characteristic ISW speed changes with the characteristic vertical scale. (B) The characteristic horizontal scale changes with the characteristic vertical scale.
6 The applicability of ISW models for describing flow characteristics
Taking the typical case of and as an example, the KdV and eKdV theoretical models in continuous pycnocline were used to calculate the horizontal velocity range and vertical velocity range respectively, and the description applicability of the two theoretical models for the flow characteristics of second-mode ISWs was examined.
Figure 12 shows how the horizontal and vertical velocity ranges of the second-mode ISW change with varying wave amplitude. Both the horizontal and vertical velocity ranges calculated by the two theoretical models increase as the wave amplitude increases. This is consistent with the positive correlations observed in experimental results. The wave-induced velocity value calculated by the eKdV model is better than that of the KdV model. This suggests that the eKdV model’s non-linear correction regarding the vertical mode function improves the applicability of weakly non-linear theory for second-mode ISWs, particularly in describing the vertical velocity. Additionally, the experimental results of the eKdV model are more consistent in the case with a larger wave amplitude () than in the case with a smaller wave amplitude ().
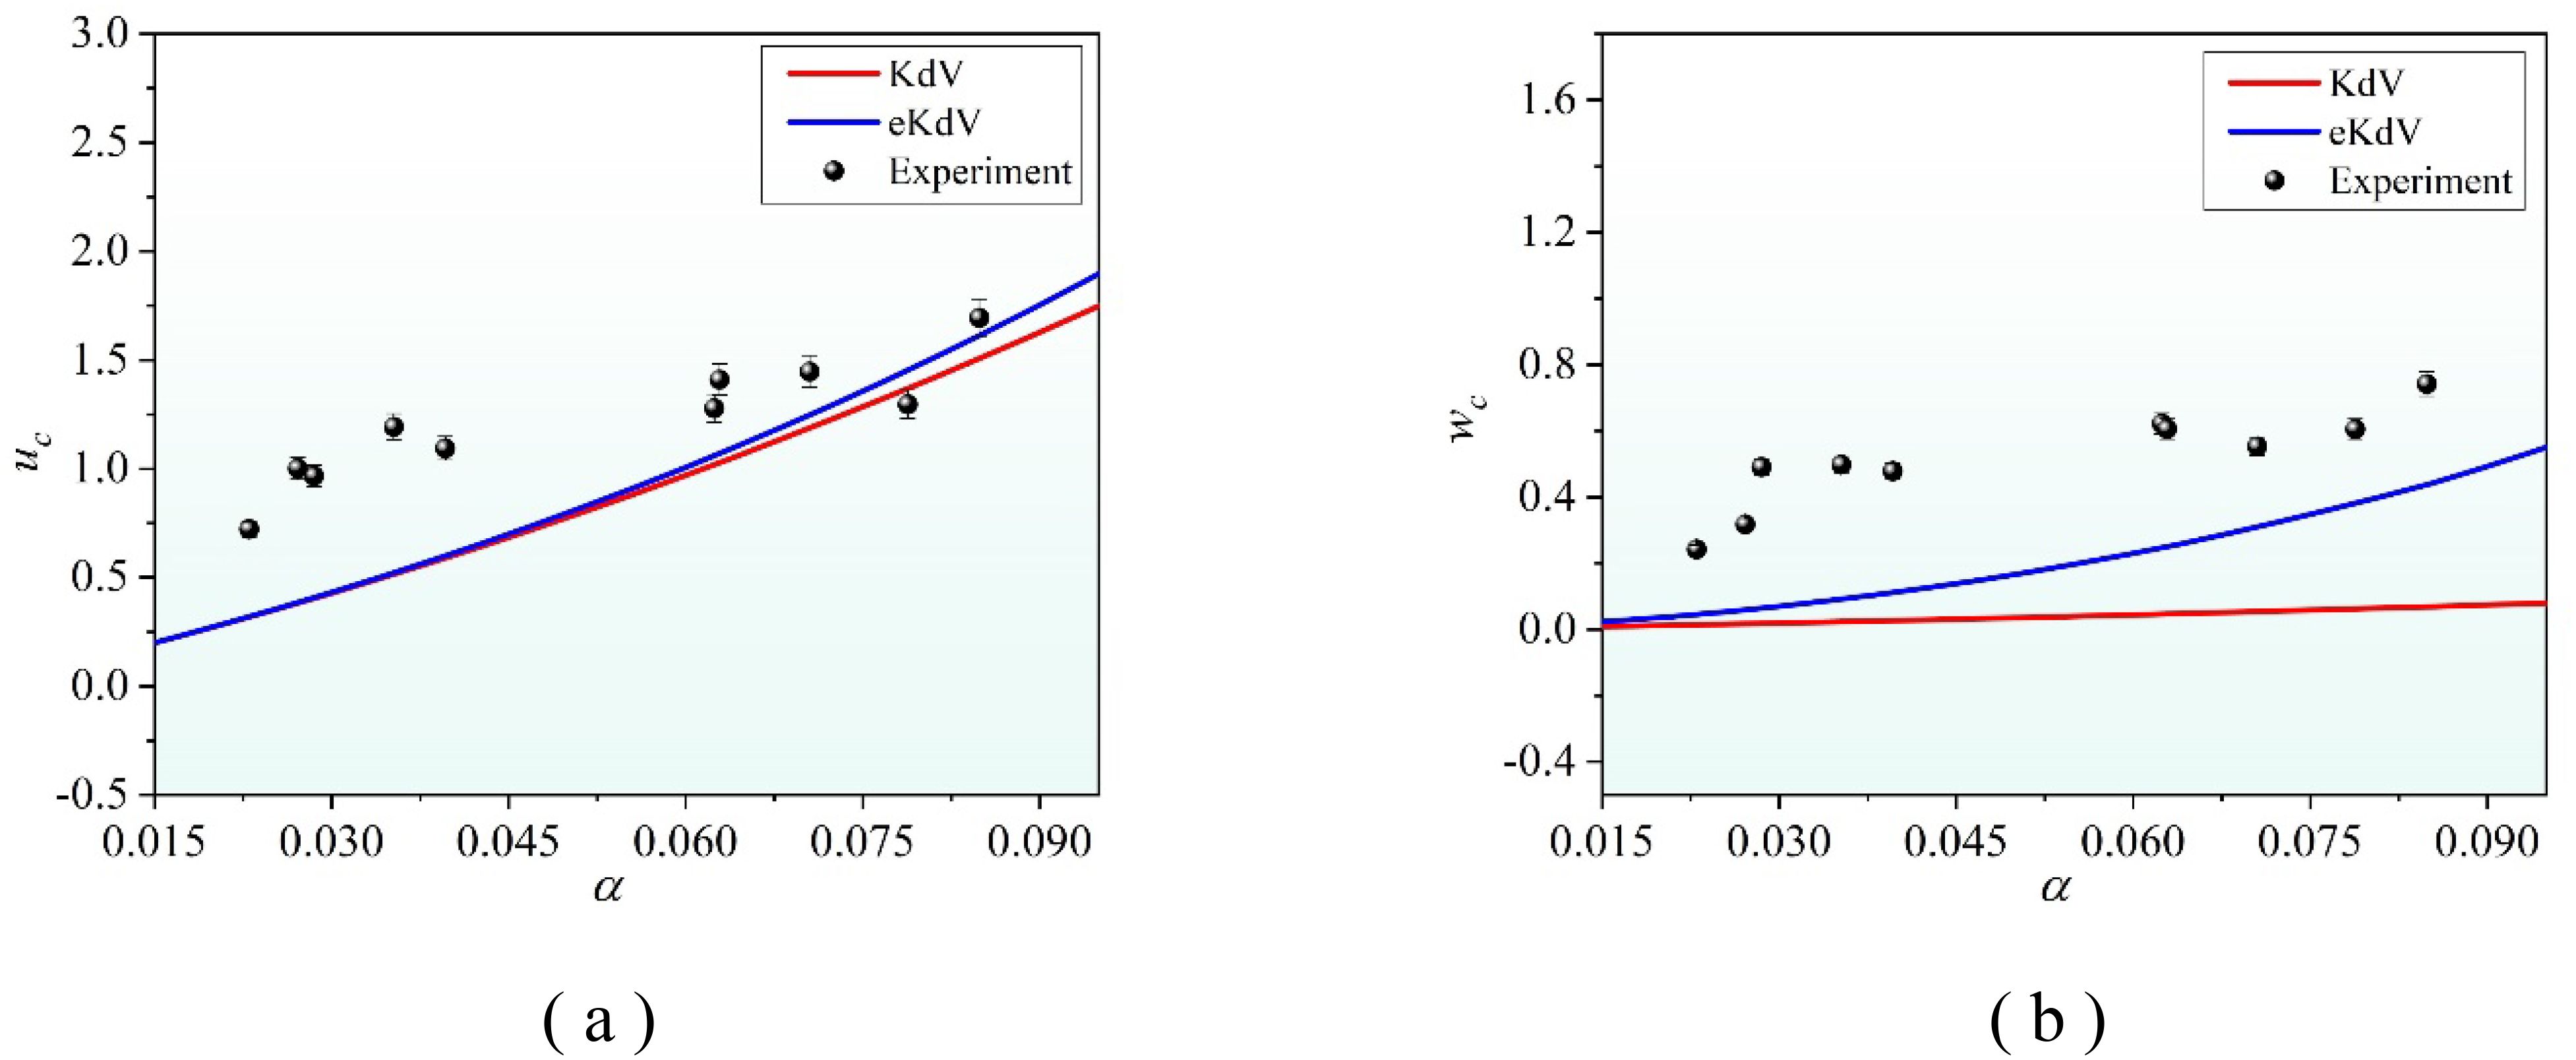
Figure 12. Applicability of KdV and eKdV models for describing the velocity elements of a second-mode ISW. (A) The horizontal velocity range varies with wave amplitude. (B) The vertical velocity range varies with wave amplitude.
The following is to investigate the difference in the applicability of two theoretical models to describe the fluctuation factors of second-mode ISW when the stratified environment changes. Taking the typical case1, case2 and case3, characteristic vertical scale , characteristic horizontal velocity range and characteristic vertical velocity range are calculated by the two theoretical models, and compared with the experimental results.
Figures 13A, B show that the variation in the horizontal velocity range and vertical velocity range of a second-mode ISW with its characteristic vertical scale . As gradually increases, the applicability of both KdV and eKdV models to describe the and gradually improved. When is close to that of the lower layer (), the applicability of the two ISW models to describe the and of a second-mode ISW is optimal, and the description range of the eKdV model is better than that of the KdV model in the three typical stratification environments. Additionally, the and of a second-mode ISW is enhanced by increasing in the case of the same characteristic vertical scale . Based on the analysis above, we can see that altering the parameters of the stratified fluid environment will not impact the velocity intensity of a second-mode ISW as the vertical scale increases. However, it will affect the magnitude of the flow field and the rate at which it changes with the vertical scale.
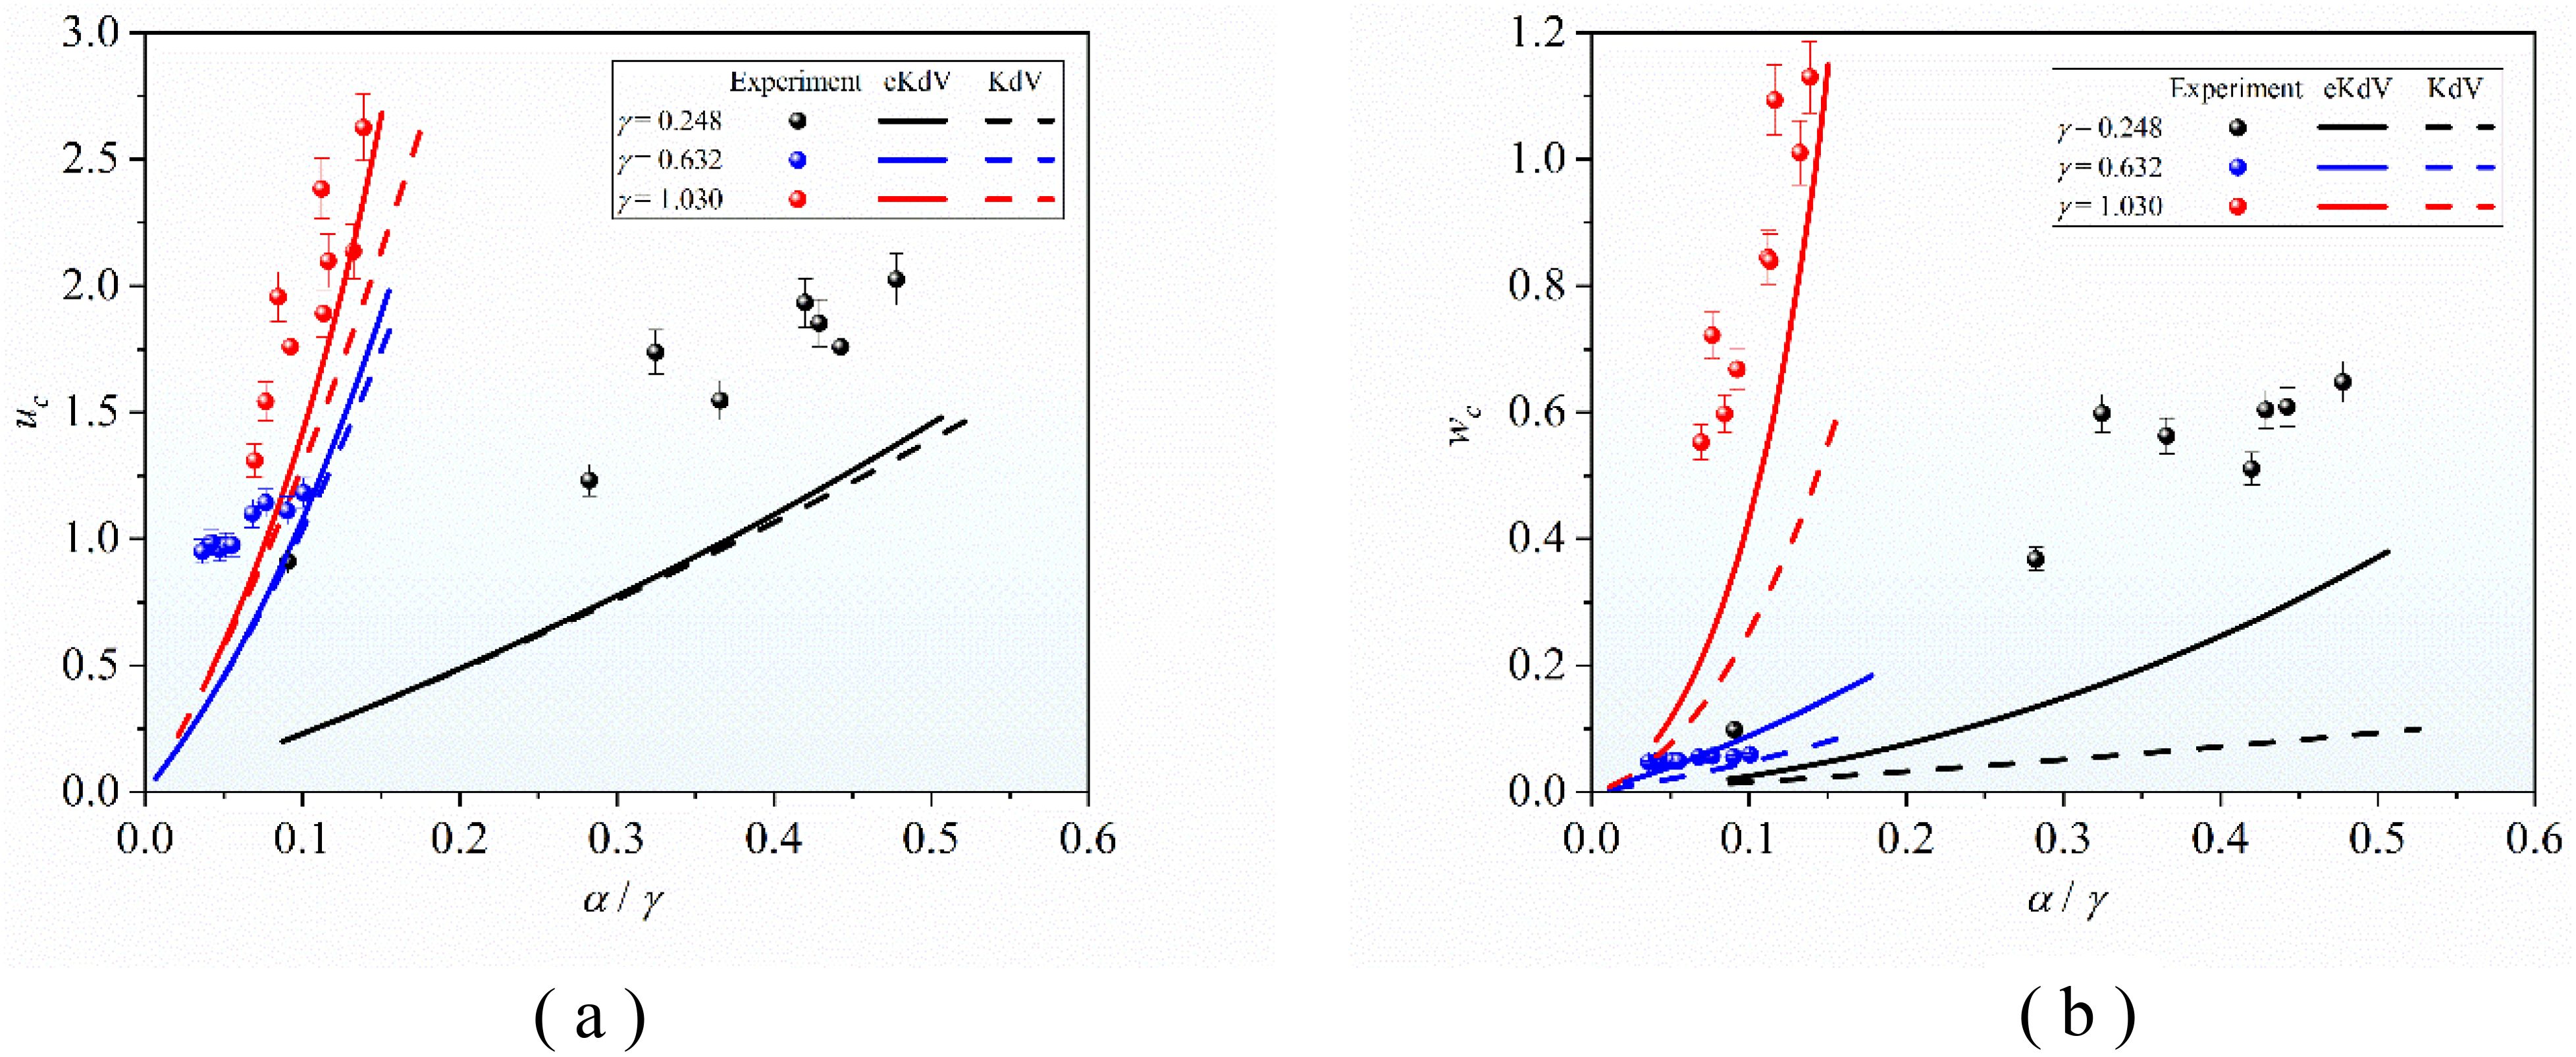
Figure 13. The applicability of the KdV and eKdV models for describing the flow field elements in different stratified environments. (A) The characteristic horizontal velocity range varies with the characteristic vertical scale. (B) The characteristic vertical velocity range varies with the characteristic vertical scale.
7 Conclusions
In this study, we investigated the applicability of ISW theoretical models for describing a second-mode ISW and its induced flow field in a continuous-density pycnocline, which approximates the natural stratified ocean. We compared the ISW theoretical wave-flow field with experimental measurements under the same conditions. The comparison revealed that the inhomogeneous waveform distribution of the second-mode ISW envelope in the continuous-density pycnocline can be described by the KdV and eKdV theories as were the flow field characteristics of a pair of anti-sequence vortices distributed above and below the boundaries of the pycnocline. By increasing the thickness ratio of the two layers above and below the pycnocline, we observed an improvement in the symmetry of the wave-flow structure of the second-mode ISW. Both the KdV and eKdV theoretical models described the variation characteristics of the ISW speed of the second-mode ISW and its wavelength in the continuous pycnocline with the wave amplitude and the variation in its horizontal and vertical velocity range with the wave amplitude. We found that the applicability of the KdV and eKdV theoretical models for describing wave-flow characteristics is obviously influenced by the parameters of the stratified environment, i.e., the closer the geometric thickness of the upper and lower layers, the better the applicability of the theoretical models. However, changes in the thickness ratio of the upper and lower layers did not change the characteristics of the eKdV theoretical model as much compared with the KdV model in describing the flow field of the second-mode ISW.
Data availability statement
The original contributions presented in the study are included in the article/supplementary material. Further inquiries can be directed to the corresponding author.
Author contributions
SW: Conceptualization, Investigation, Methodology, Software, Writing – original draft. HD: Formal analysis, Project administration, Resources, Supervision, Writing – review & editing. GW: Formal analysis, Methodology, Validation, Writing – review & editing. ZC: Data curation, Validation, Writing – review & editing. JS: Data curation, Writing – review & editing. ZL: Writing – review & editing.
Funding
The author(s) declare financial support was received for the research, authorship, and/or publication of this article. This work was supported by the Youth Independent Innovation Science Foundation (ZK24-51), the Science and Technology Innovation Program of Hunan Province (Grant 2023RC3005), and the National Natural Science Foundation of China (Grant 11902352).
Acknowledgments
We appreciate all members for their efforts in the process of this study and we would like to acknowledge the reviewers for their helpful comments.
Conflict of interest
The authors declare that the research was conducted in the absence of any commercial or financial relationships that could be construed as a potential conflict of interest.
Generative AI statement
The author(s) declare that no Generative AI was used in the creation of this manuscript.
Publisher’s note
All claims expressed in this article are solely those of the authors and do not necessarily represent those of their affiliated organizations, or those of the publisher, the editors and the reviewers. Any product that may be evaluated in this article, or claim that may be made by its manufacturer, is not guaranteed or endorsed by the publisher.
References
Benjamin T. B. (1966). Internal waves of finite amplitude and permanent form. J. Fluid Mech. 25, 241–270. doi: 10.1017/S0022112066001630
Cai S., Gan Z. (1995). A numerical method of internal waves dispersion relation. J. Trop. Oceanogr. 14 (1), 22–30.
Cheng M. H., Hsieh C. M., Hwang R. R., Hsu J. R. C. (2018). Effects of initial amplitude and pycnocline thickness on the evolution of mode-2 internal solitary waves. Phys. Fluids 30, 34–45. doi: 10.1063/1.5020093
Cui J., Dong S., Wang Z. (2021). Study on applicability of internal solitary wave theories by theoretical and numerical method. Appl. Ocean Res. 111, 102629. doi: 10.1016/j.apor.2021.102629
Du H., Wei G., Gu M., Wang X., Xu J. (2016). Experimental investigation of the load exerted by nonstationary internal solitary waves on a submerged slender body over a slope. Appl. Ocean Res. 59, 216–223. doi: 10.1016/j.apor.2016.05.003
Du H., Wei G., Wang S. D. (2019). Experimental study of elevation- and depression-type internal solitary waves generated by gravity collapse. Phys. Fluids 31, 102104. doi: 10.1063/1.5121556
Duda T. F., Lynch J. F., Irish J. D., Beardsley R. C., Ramp S. R., Chiu C. S., et al. (2004). Internal tide and nonlinear internal wave behavior at the continental slope in the northern South China Sea. IEEE J. Ocean. Eng. 29, 1105–1130. doi: 10.1109/JOE.2004.836998
Fliegel M., Hunkins K. (1975). Internal wave dispersion calculated using the Thomson-Haskell method. J. Phys. Oceanogr. 5, 541–548. doi: 10.1175/1520-0485(1975)005<0541:IWDCUT>2.0.CO;2
Grimshaw R., Pelinovsky E., Talipova T., Kurkin A. (2004). Simulation of the transformation of internal solitary waves on oceanic shelves. J. Phys. Oceanogr. 34, 2774–2791. doi: 10.1175/JPO2652.1
Grimshaw R., Pelinovsky E., Talipova T., Kurkina O. (2010). Internal solitary waves: propagation, deformation and disintegration. Nonlinear Process. Geophys. 17, 633–649. doi: 10.5194/npg-17-633-2010
Helfrich K. R., Melville W. K. (2006). Long nonlinear internal waves. Annu. Rev. Fluid Mech. 38, 395–425. doi: 10.1146/annurev.fluid.38.050304.092129
Huang W. H., You Y. X., Wang X., Hu T. Q. (2013). Wave-making experiments and theoretical models for internal solitary waves in a two-layer fluid of finite depth. Acta Phys. Sin. 8, 354–367. doi: 10.7498/aps.62.084705
Jorge M., da Silva J. (2018). Internal solitary waves in the Andaman sea: New insights from SAR imagery. Remote Sens. 10, 861–877. doi: 10.3390/rs10060861
Keben Z., Hushan G. A. (1997). numerical method for vertical structure of internal waves in ocean. Tropic Oceanol. 16 (4), 62–67.
Kurkina O., Rouvinskaya E., Kurkin A., Giniyatullin A., Pelinovsky E. (2017). Vertical structure of velocity field induced by I and II mode solitary waves in a stratified fluid. WSEAS Trans. Fluid Mech. 12, 65–72.
Liang J. J., Li X., He M., Du T. (2018). Generation of mode-2 internal waves in a two-dimensional stratification by a mode-1 internal wave. Wave Motion 83, 227–240. doi: 10.1016/j.wavemoti.2018.09.014
Maxworthy T. (1980). On the formation of nonlinear internal waves from the gravitational collapse of mixed regions in two and three dimensions. J. Fluid Mech. 96, 47–64. doi: 10.1017/S0022112080002017
Michallet H., Bartgélemy E. (1998). Experimental study of interfacial solitary waves. J. Fluid Mech. 366, 159–177. doi: 10.1017/S002211209800127X
Olsthoorn J., Baglaenko A., Stastna M. (2013). Analysis of asymmetries in propagating mode-2 waves. Nonlinear Process. Geophys. 20, 59–69. doi: 10.5194/npg-20-59-2013
Peng P., Du H., Wei G., Wang S., Xuan P., Cai S., et al. (2022). Experimental investigation on the vertical structure characteristics of internal solitary waves. J. Mar. Sci. Eng. 10, 1045. doi: 10.3390/jmse10081045
Ramp S. R., Yang Y. J., Reeder D. B., Bahr F. L. (2012). Observations of a mode-2 nonlinear internal wave on the northern Heng-Chun Ridge south of Taiwan. J. Geophys. Research-Oceans 117, C03043. doi: 10.1029/2011JC007662
Rong L., Xiong X., Chen L. (2023). Assessment of KdV and EKdV theories for simulating internal solitary waves in the continental slope of the South China Sea. Continent. Shelf Res. 256, 104944. doi: 10.1016/j.csr.2023.104944
Shroyer E. L., Moum J. N., Nash J. D. (2010). Mode 2 waves on the continental shelf: Ephemeral components of the nonlinear internal wavefield. J. Geophys. Res. 115, C07001. doi: 10.1029/2009JC005605
Terez D. E., Knio, Omar M. (1998). Numerical simulations of large-amplitude internal solitary waves. J. Fluid Mech. 362, 53–82. doi: 10.1017/S0022112098008799
Xie J., Pan J., Jay D. A. (2015). Multimodal internal waves generated over a subcritical ridge: impact of the upper-ocean stratification. J. Phys. Oceanogr. 45, 150114114710008. doi: 10.1175/JPO-D-14-0132.1
Yang Y. J., Fang Y. C., Chang M. H., Ramp S. R., Kao C.-C., Tang T. Y.. (2009). Observations of second baroclinic mode internal solitary waves on the continental slope of the northern South China Sea. J. Geophys. Research-Oceans 114, C10003. doi: 10.1029/2009JC005318
Yang Y. J., Fang Y. C., Tang T. Y., Ramp S. R. (2010). Convex and concave types of second baroclinic mode internal solitary waves. Nonlinear Process. Geophys. 17, 605–614. doi: 10.5194/npg-17-605-2010
Keywords: continuous stratification environment, physical experiment, second-mode internal solitary wave, wave-flow structure, applicability of weakly nonlinear theoretical models
Citation: Wang S, Du H, Wei G, Chen Z, Shi J and Lan Z (2025) Experimental investigation of the second-mode internal solitary wave in continuous pycnocline and the applicability of weakly nonlinear theoretical models. Front. Mar. Sci. 11:1510119. doi: 10.3389/fmars.2024.1510119
Received: 12 October 2024; Accepted: 16 December 2024;
Published: 15 January 2025.
Edited by:
Henrik Kalisch, University of Bergen, NorwayReviewed by:
Malek Abid, Aix Marseille Université, FranceEvgueni Dinvay, UiT The Arctic University of Norway, Norway
Copyright © 2025 Wang, Du, Wei, Chen, Shi and Lan. This is an open-access article distributed under the terms of the Creative Commons Attribution License (CC BY). The use, distribution or reproduction in other forums is permitted, provided the original author(s) and the copyright owner(s) are credited and that the original publication in this journal is cited, in accordance with accepted academic practice. No use, distribution or reproduction is permitted which does not comply with these terms.
*Correspondence: Hui Du, ZHVodWkxN0BudWR0LmVkdS5jbg==