
94% of researchers rate our articles as excellent or good
Learn more about the work of our research integrity team to safeguard the quality of each article we publish.
Find out more
ORIGINAL RESEARCH article
Front. Mar. Sci., 23 December 2024
Sec. Ocean Observation
Volume 11 - 2024 | https://doi.org/10.3389/fmars.2024.1508233
 Junjie Wu1,2
 Shizhe Chen1,2,3*
 Shixuan Liu1,2,3
 Miaomiao Song1,2,3
 Bo Wang1,2,3Qingyang Zhang1,2Yushang Wu1,2,3Zhuo Lei1,2,3Jiming Zhang1,2,3Xingkui Yan1,2,3Bin Miao1,2,3
Waves are crucial in ocean observation and research. Stereo vision-based wave measurement, offering non-contact, low-cost, and intelligent processing, is an emerging method. However, improving accuracy remains a challenge due to wave complexity. This paper presents a novel approach to measure wave height, period, and direction by combining deep learning-based stereo matching with feature matching techniques. To improve the discontinuity and low accuracy in disparity maps from traditional wave image matching algorithms, this paper proposes the use of a high-precision stereo matching method based on Pyramid Stereo Matching Network (PSM-Net).A 3D reconstruction method integrating Scale-Invariant Feature Transform (SIFT) with stereo matching was also introduced to overcome the limitations of template matching and interleaved spectrum methods, which only provide 2D data and fail to capture the full 3D motion of waves. This approach enables accurate wave direction measurement. Additionally, a six-degree-of-freedom platform was proposed to simulate waves, addressing the high costs and attenuation issues of traditional wave tank simulations. Experimental results show the prototype system achieves a wave height accuracy within 5%, period accuracy within 4%, and direction accuracy of ±2°, proving the method’s effectiveness and offering a new approach to stereo vision-based wave measurement.
With the advancement of marine scientific research and the increase in ocean development activities, the accurate measurement and monitoring of ocean waves have become increasingly important (Zhang et al., 2017; Chowdhury et al., 2021). Wave measurement techniques can be categorized into contact and non-contact methods. Contact measurement techniques (Li et al., 2012; Lin and Yang, 2020) rely on sensors that make direct contact with the sea surface to detect wave fluctuations. This technique high measurement accuracy and provides reliable wave data, making it widely used in wave measurement. However, such instruments are limited to collecting localized, single-point data, which prevents comprehensive analysis of the wave field. To minimize interference with the wave surface, non-contact measurement technologies, such as acoustic wave gauges (Yang et al., 2018), radar (Zhang et al., 2022; Zhang et al., 2024), satellite remote sensing (Gao et al., 2023b; Zhang et al., 2023), and stereo photogrammetry (Benetazzo, 2006; Nie, 2020), have emerged. These methods avoid the risk of equipment damage caused by contact with seawater. However, acoustic wave gauges can have their measurement accuracy compromised by water splashes; radar systems are expensive, difficult to install, retrieve, and maintain, and the interpretation of the data they collect is complex; satellite remote sensing offers low measurement accuracy, poor data reliability, is highly susceptible to weather conditions, and comes with high costs.
The basic working principle of stereo photogrammetry for wave measurement involves continuously capturing images of the sea surface using cameras, acquiring wave image data, and then processing these images with a computer to calculate the fundamental wave parameters. Compared to radar and satellite remote sensing technologies, stereo photogrammetry has the advantage of high-precision observation using only cameras, making it relatively low-cost, with simple and convenient installation and maintenance. This technology is already widely applied in other systems (Fan et al., 2020; Cao et al., 2022; He et al., 2022; Sun et al., 2022; Tani et al., 2023). The earliest efforts to develop a remote sensing system for wave measurement using stereo photogrammetry date back to the late 1980s, initiated by Shemding (Shemdin and Wu, 1988; Shemdin and Tran, 1992) and Banner et al (Banner et al., 1989). In recent years, the rapid advancements in computer and image processing technologies have led to the emergence of numerous methods for calculating wave parameters. In 2017, Yan L (Yan, 2017). applied template matching technology to measure wave height, enabling tsunami prediction. That same year, Bergamasco introduced WASS (Waves Acquisition Stereo System) (Bergamasco et al., 2017), an open-source software package for marine 3D reconstruction. WASS uses cutting-edge stereo technology to automate the generation of dense point clouds from stereo images, facilitating the reconstruction of the ocean’s three-dimensional shape. In 2019, Shi L (Shi et al., 2019). proposed a stereo vision method for obtaining ocean wave parameters, employing the Scale-Invariant Feature Transform (SIFT) (Lowe, 2004) stereo matching algorithm along with template matching techniques to calculate wave parameters. The final results indicated a maximum measurement error of 10% for wave height, a period accuracy of 0.5 seconds, and a wave direction accuracy of ±10°. In 2021, Wang Z (Wang, 2021). replaced SIFT with the Semi-Global Block Matching (SGBM) (Hirschmuller, 2007) algorithm for stereo matching to compute wave height and used interleaved spectrum and time delay to calculate wave direction. The final measurement results showed that the relative standard deviation of wave height ranged from 2.5% to 12.5%, with a maximum relative error of 4.97% for wave direction.
In recent years, the widespread application of deep learning across various fields has driven the development of related technologies. Within ocean data processing, deep learning techniques have been widely applied to tasks such as image classification, data processing, and scene reconstruction. For example, deep learning methods have shown notable success in ship detection and fish detection (Raveendran et al., 2021; Gao et al., 2023c; Gao et al., 2023a; Zhang et al., 2024). Additionally, these techniques have been broadly utilized in ocean science (Kandimalla et al., 2022; Cao et al., 2024; Gao et al., 2024). In these applications, deep learning’s robust feature extraction and adaptive capabilities have markedly enhanced the accuracy of image processing and analysis. The successful deployment of these technologies offers valuable guidance for the approach introduced in this paper.
Accurate estimation of wave parameters is essential for a wide range of oceanographic and engineering applications. However, existing computational methods for wave motion analysis still face significant challenges. Traditional stereo matching algorithms often generate disparities with substantial errors and noise, limiting the precision of wave direction and motion calculations. Furthermore, while methods like template matching and interleaved spectrum are effective for two-dimensional space, they fail to capture the complexities of wave motion in three-dimensional space, which is crucial for accurate three-dimensional wave motion analysis. Moreover, traditional wave tank testing is expensive and challenging, particularly when simulating multi-directional wave motion.
To address these limitations, this paper proposes a novel solution: replacing traditional stereo matching techniques with a deep learning-based Pyramid Stereo Matching Network (PSM-Net) (Chang and Chen, 2018). PSM-Net, with its ability to effectively handle large-scale disparities and complex textures, provides a more accurate and robust approach for wave motion estimation. Additionally, to further improve the accuracy of three-dimensional wave motion analysis, we combine the PSM-Net with the SIFT feature point matching algorithm, enabling precise calculation of wave parameters in three-dimensional space. And we propose using a six-degree-of-freedom platform as an alternative for indoor experiments, offering a cost-effective and feasible solution for validating the proposed algorithm. This innovative approach not only improves computational accuracy but also opens up new possibilities for ocean wave simulation and analysis.
The system architecture is illustrated in Figure 1. The principle of wave measurement using stereo vision is based on stereo vision technology, employing two cameras to simultaneously capture images of the waves. After preprocessing the images, a stereo matching algorithm is used to compute the disparity map, and the depth of each pixel is calculated based on the principles of triangulation. This allows for the acquisition of the three-dimensional shape and motion parameters of the target. The overall system flowchart, shown in Figure 2, is divided into four main stages: preprocessing, stereo matching, three-dimensional reconstruction, and wave parameter estimation.
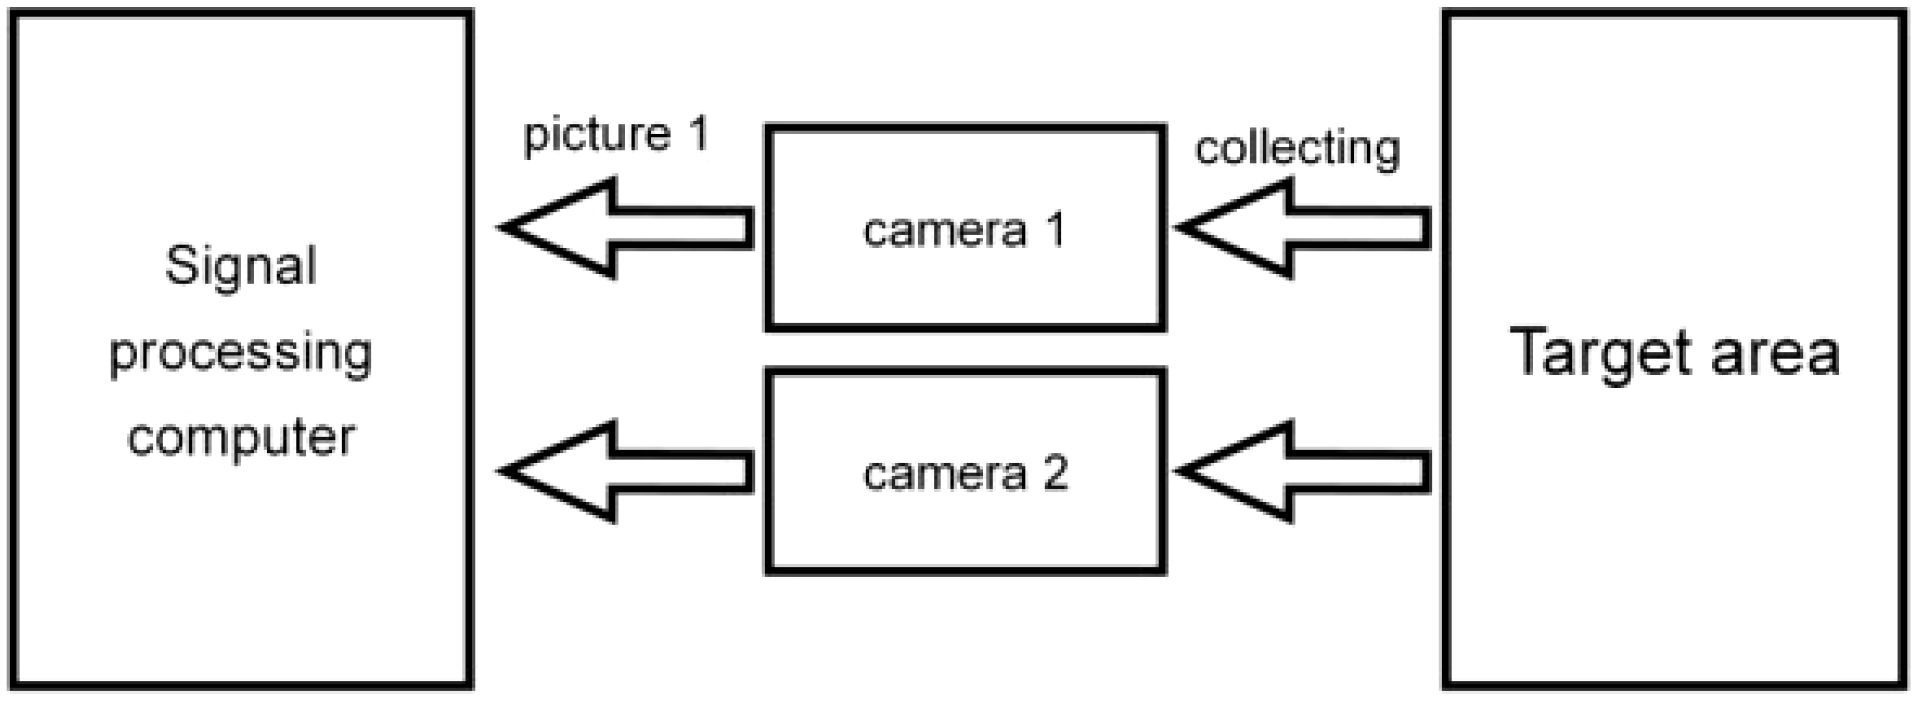
Figure 1. System architecture diagram.
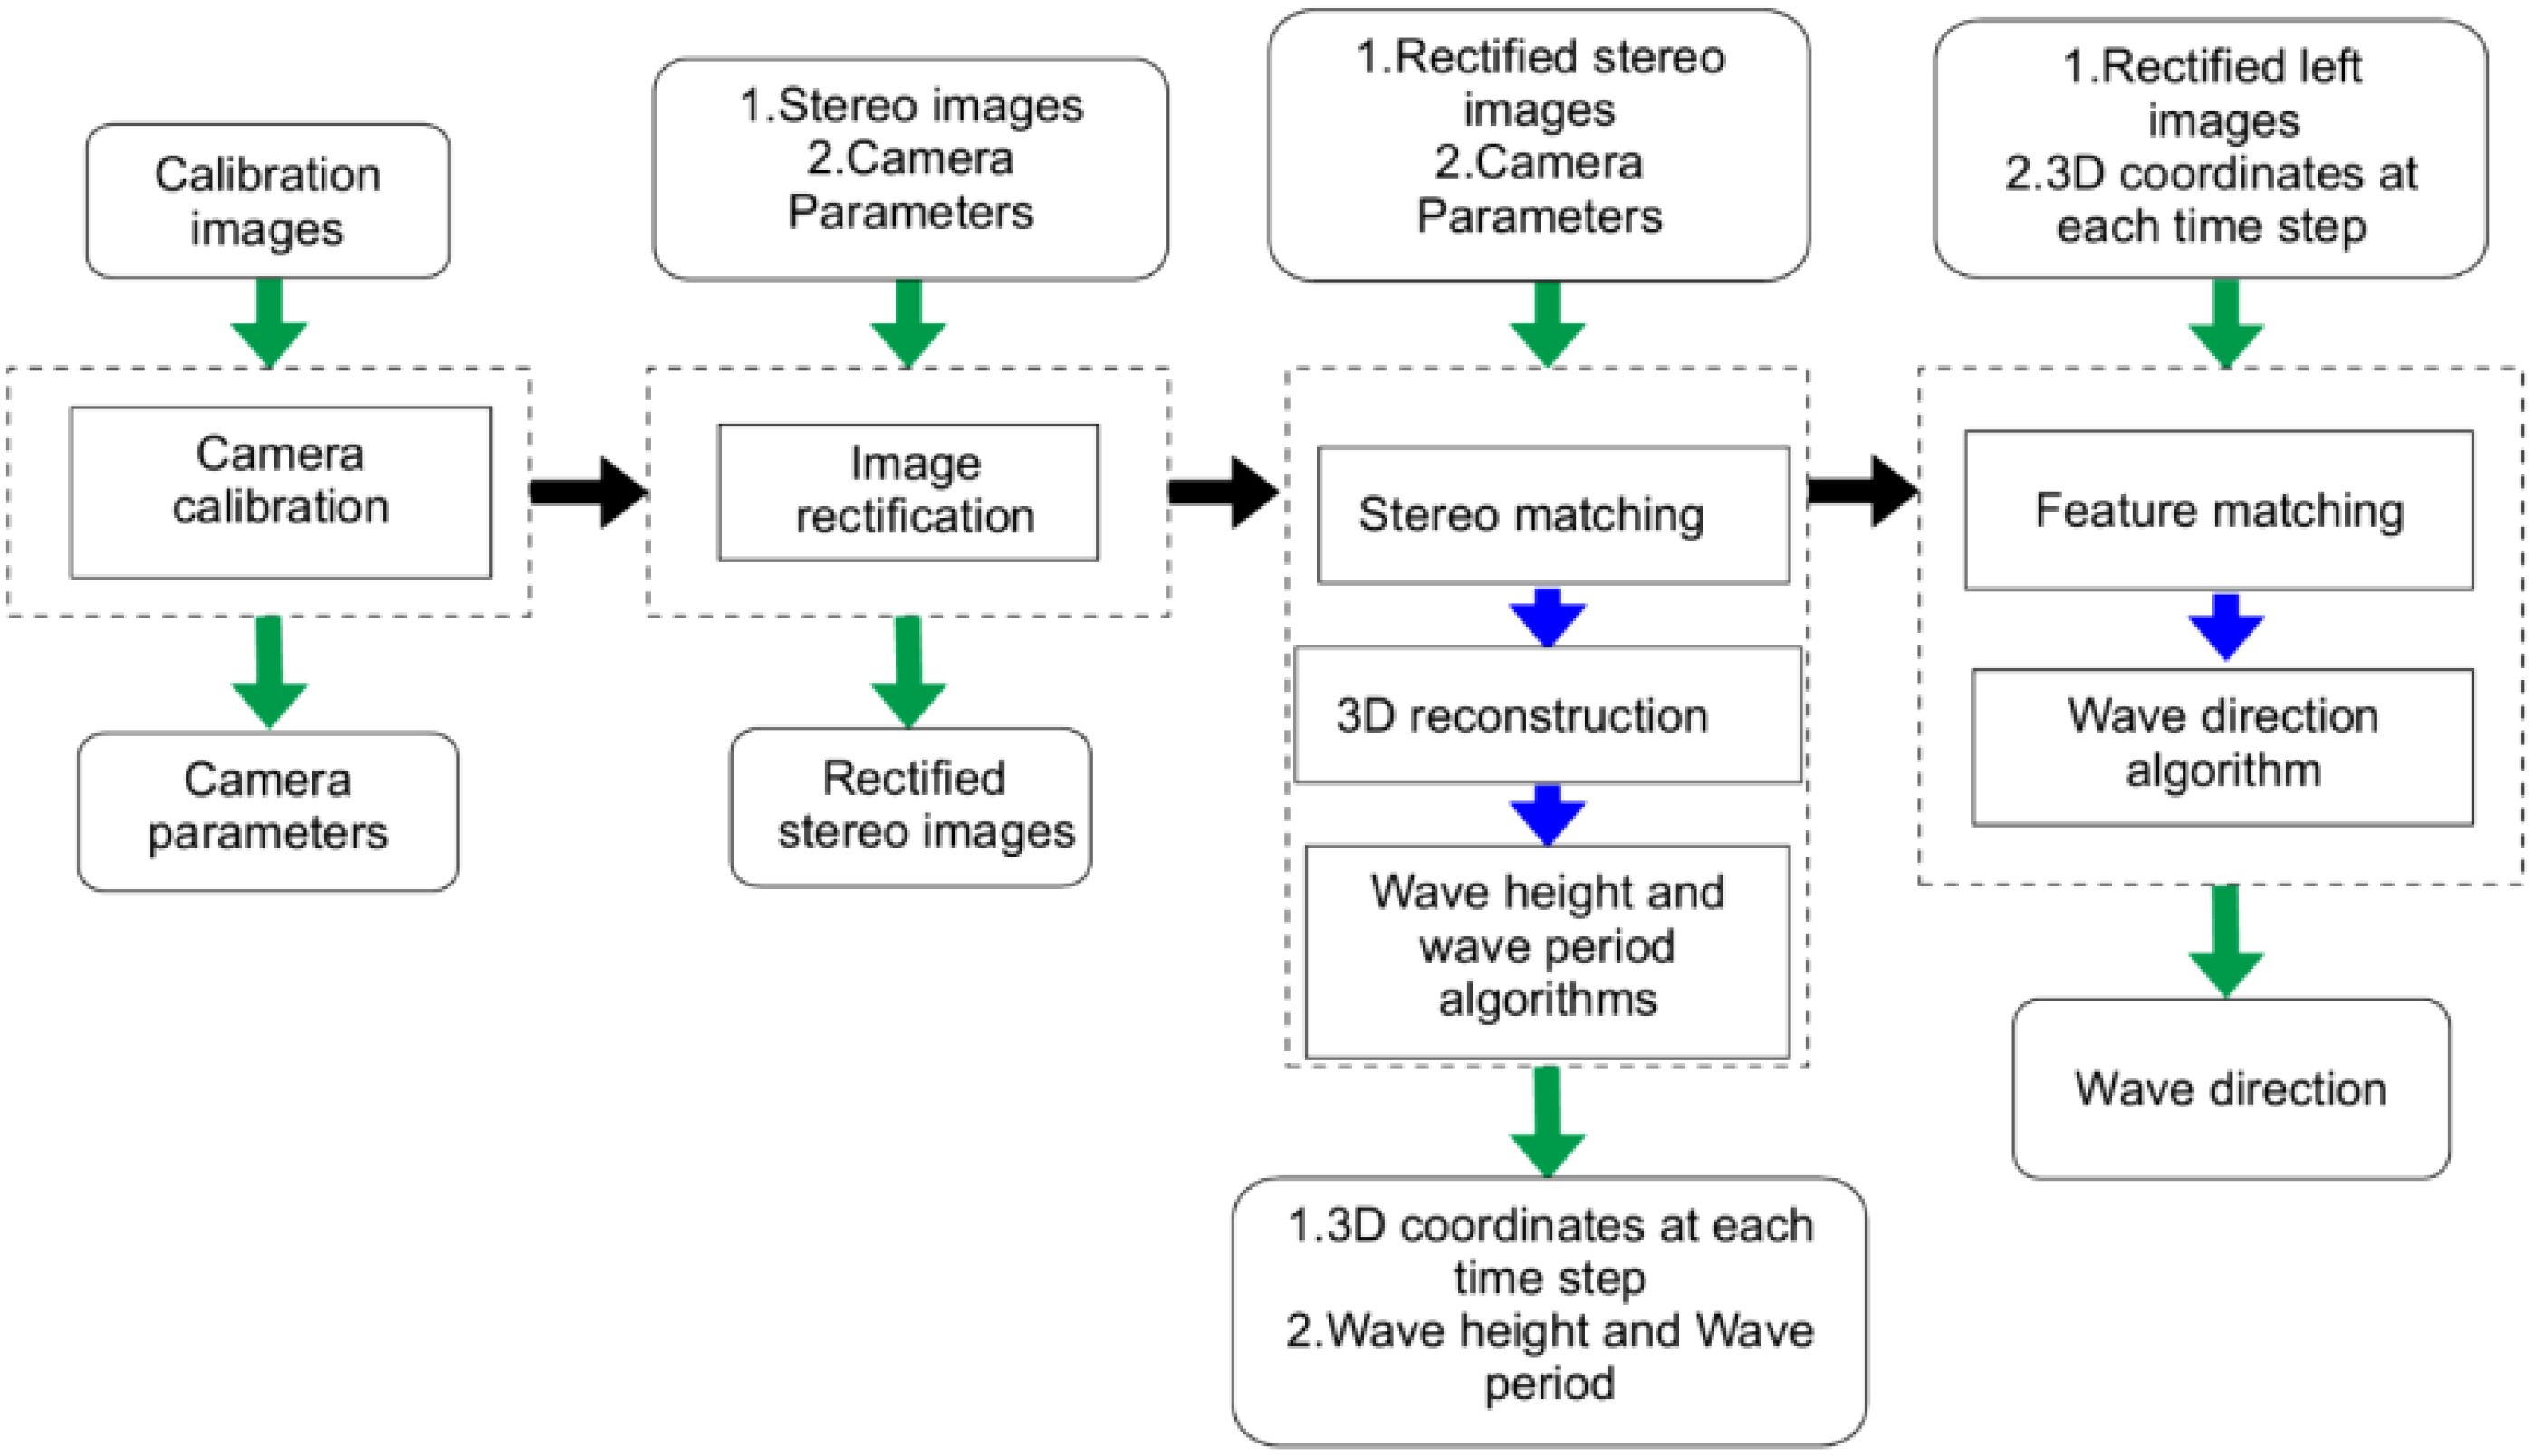
Figure 2. Overall system workflow diagram.
Preprocessing of stereo images is a crucial step in stereo vision systems, as it enhances the accuracy and efficiency of subsequent processing. This step consists of two parts: calibration and image rectification. The first step in preprocessing is the calibration of the stereo cameras. In this study, the Zhang Z. calibration method (Zhang, 2000) is employed, which involves capturing images of a calibration board from various poses and detecting the corners of the board in each image to calculate the camera parameters. The preprocessing steps are illustrated in Figure 3. During image rectification, to address the issue of ensuring that the imaging planes are coplanar and aligned for three-dimensional coordinate reconstruction, this paper adopts distortion correction and epipolar rectification techniques. This transforms the image planes of the left and right cameras into a coplanar and aligned state, thereby simplifying the calculations involved in stereo matching.
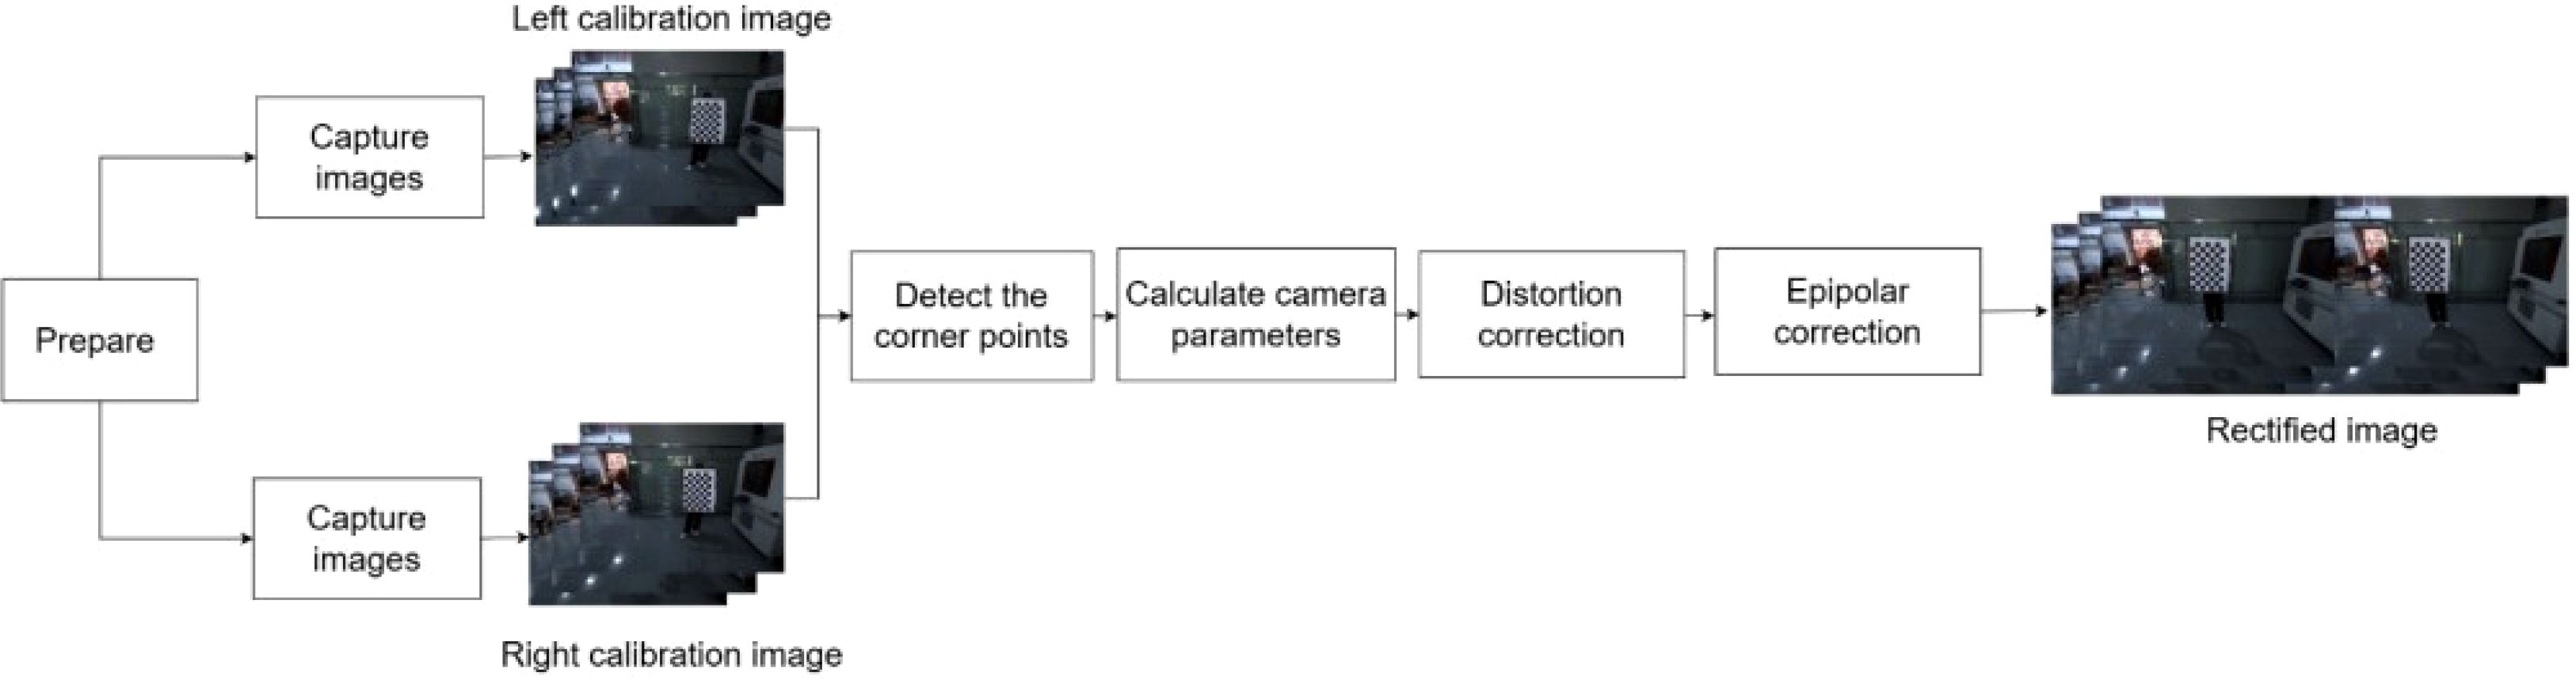
Figure 3. Steps for preprocessing.
The detailed preprocessing steps are as follows:
1. Design a calibration board of appropriate size, ensuring that its relative position to the camera can cover the entire field of view.
2. Position the calibration board at different angles and locations within the cam-era’s field of view to capture multiple images. Make sure the board covers the entire visual range and that at least 20 pairs of images are collected for thorough calibration.
3. Detect the corner points of the chessboard in the acquired images.
4. Using the detected corner points and the specified dimensions of the calibration board, calculate the camera’s intrinsic parameter matrix. Next, compute the extrinsic parameter matrix between the two cameras using images taken together.
5. By comparing the ideal and actual positions of the detected corner points, calculate the image reprojection error to obtain the distortion coefficients. Then, use these coefficients to correct the new images.
6. Calculate the correction matrix with the camera parameters and apply geometric transformations to the two images for epipolar rectification.
The stereo matching algorithm is a key component of stereo vision and plays an essential role in obtaining disparity maps for three-dimensional coordinate reconstruction. The effectiveness of a good stereo matching algorithm directly influences the quality of the 3D reconstruction. Given the complex textures present in ocean waves and the varying weather and lighting conditions outdoors, traditional dense stereo matching algorithms, such as SGBM, and sparse matching algorithms, like SIFT, often produce disparity maps that are not continuous and may exhibit significant deviations. To ad-dress this issue, this paper adopts a deep learning-based PSM-Net network to replace traditional algorithms for calculating image disparity.
The overall network structure is illustrated in Figure 4. PSM-Net is an end-to-end deep learning model. Initially, the left and right images are fed into two weight-shared Convolutional Neural Networks (CNNs) for feature extraction. The model then utilizes a pyramid structure to extract multi-scale features from the left and right images, which is particularly well-suited for handling the complex textures and dynamic changes of ocean surfaces. By capturing features at multiple scales, the pyramid structure ensures a more comprehensive representation of the intricate patterns and varying depths inherent in marine environments, thereby improving the accuracy of disparity estimation. Feature fusion is performed through convolutional layers, leveraging the pyramid structure to create a robust and enriched feature representation. Next, the model employs a cost volume for cost aggregation and regularization. Finally, a three-dimensional convolutional network integrates both global and local information to extract the final disparity map using a regression approach from the cost volume. This stepwise optimization method, progressing from global to local, effectively enhances the accuracy and robustness of stereo matching, resulting in high precision, high matching rates, and continuous, smooth disparity maps that improve measurement accuracy.
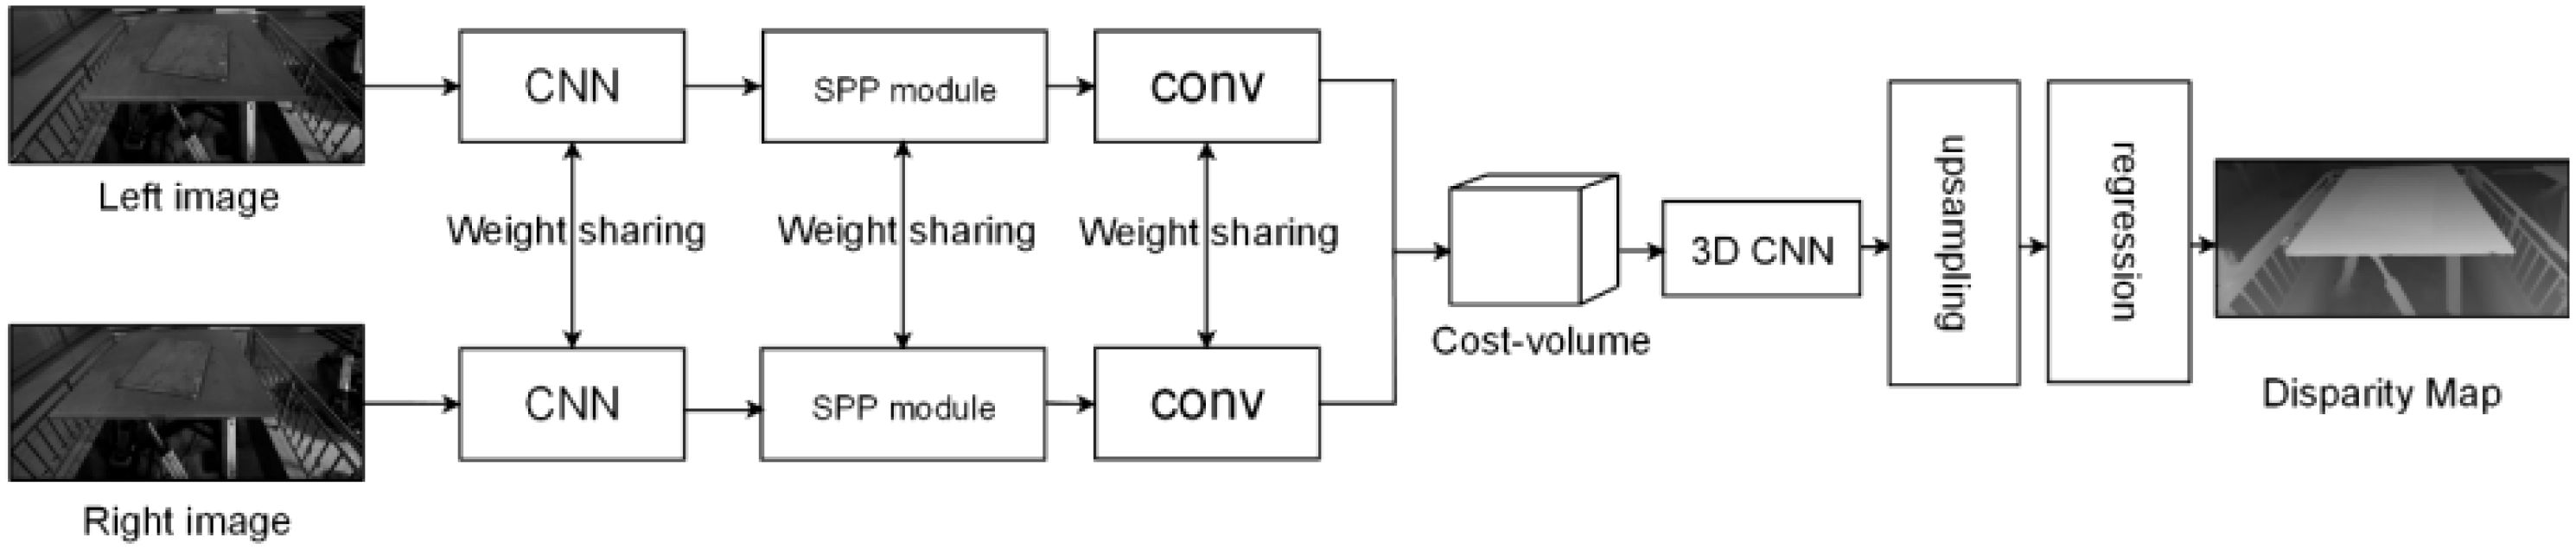
Figure 4. PSM-Net structure.
After obtaining the camera parameters and the disparity map, the world coordinates of the pixel points can be inferred using the principle of triangulation. The schematic representation is illustrated in Figure 5, and the corresponding formula is given in Equation 1.
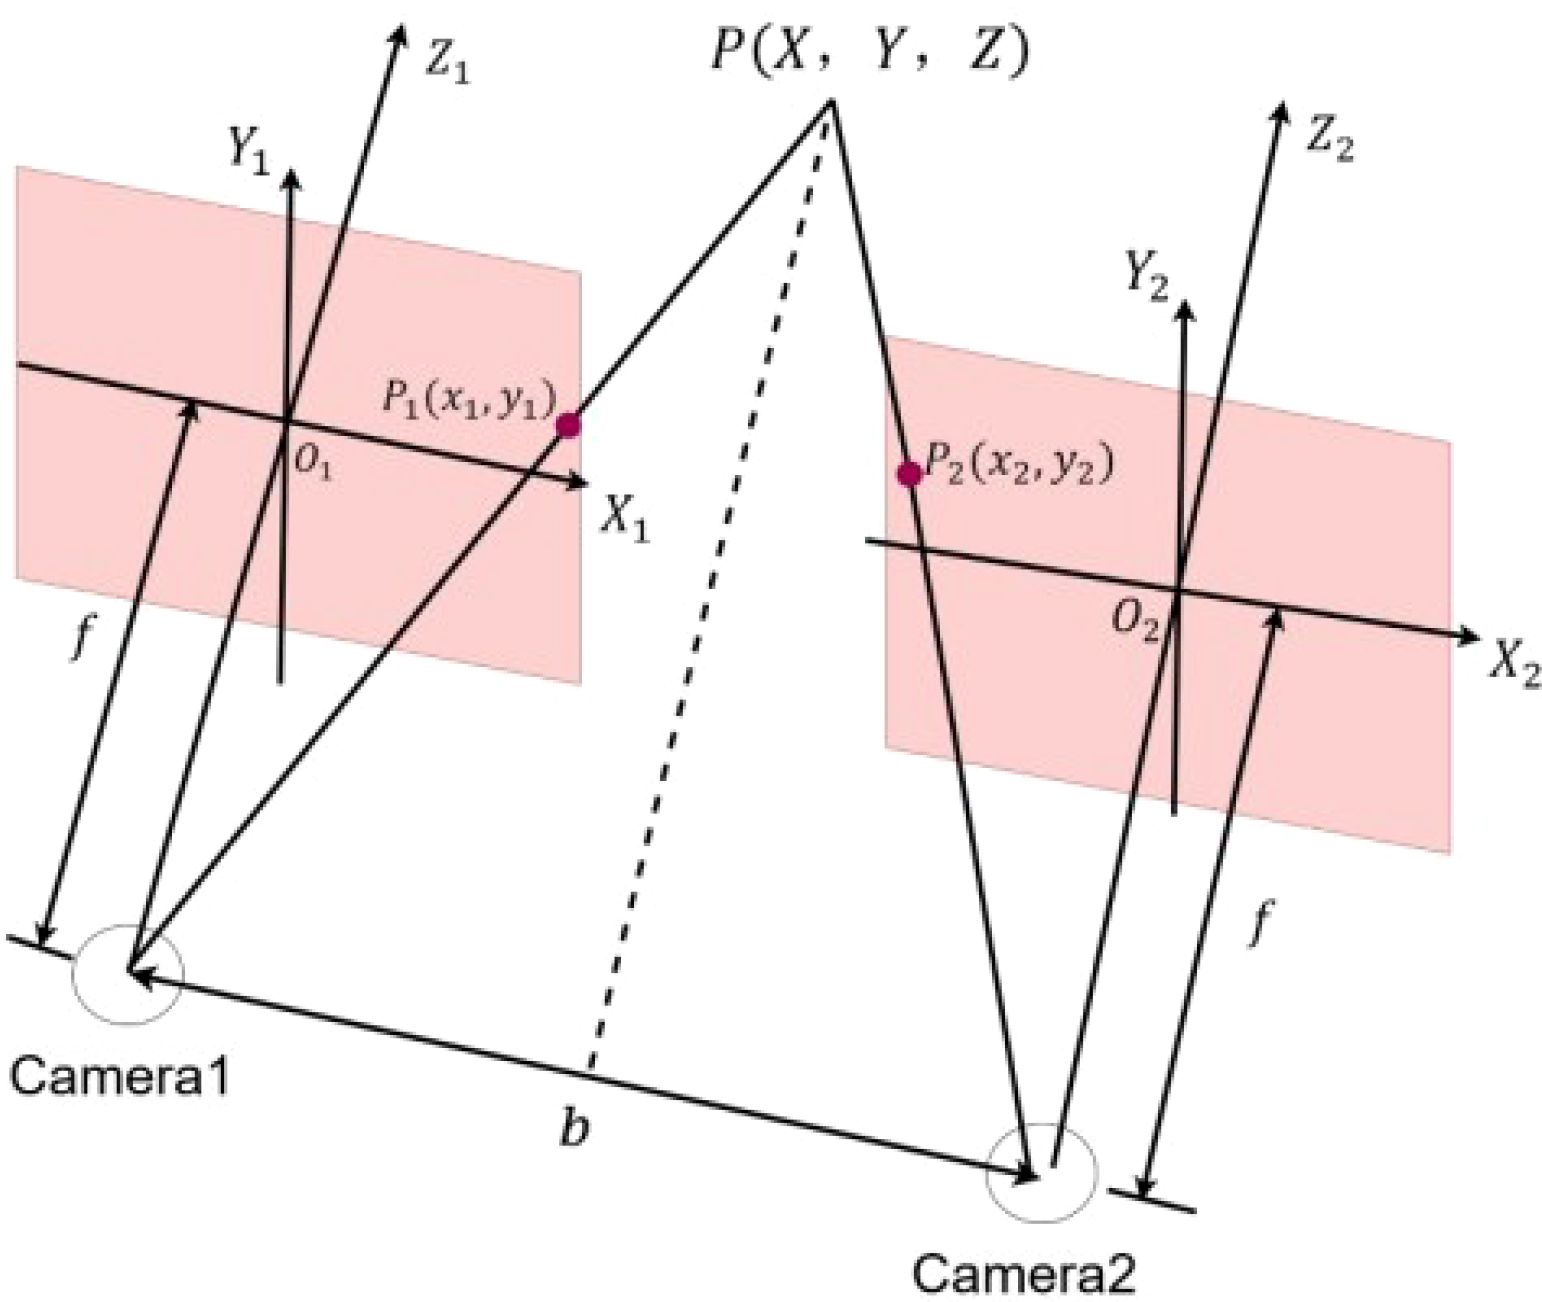
Figure 5. Principle diagram of 3D reconstruction.
This leads to the formulation of Equation 2.
In this equation, is the focal length and is the baseline length, both calculated in Section 2.1. The disparity has been determined in Section 2.2. With these parameters, the world coordinates of the pixel points can be obtained.
After the three-dimensional coordinates of the pixels have been acquired, selecting a measurement area. Then, computes the equation of the average sea level, and the distance from points to this plane is used to determine the height and period variations of the wave points. In this study, the calculation process for wave height and wave period is illustrated in Figure 6.
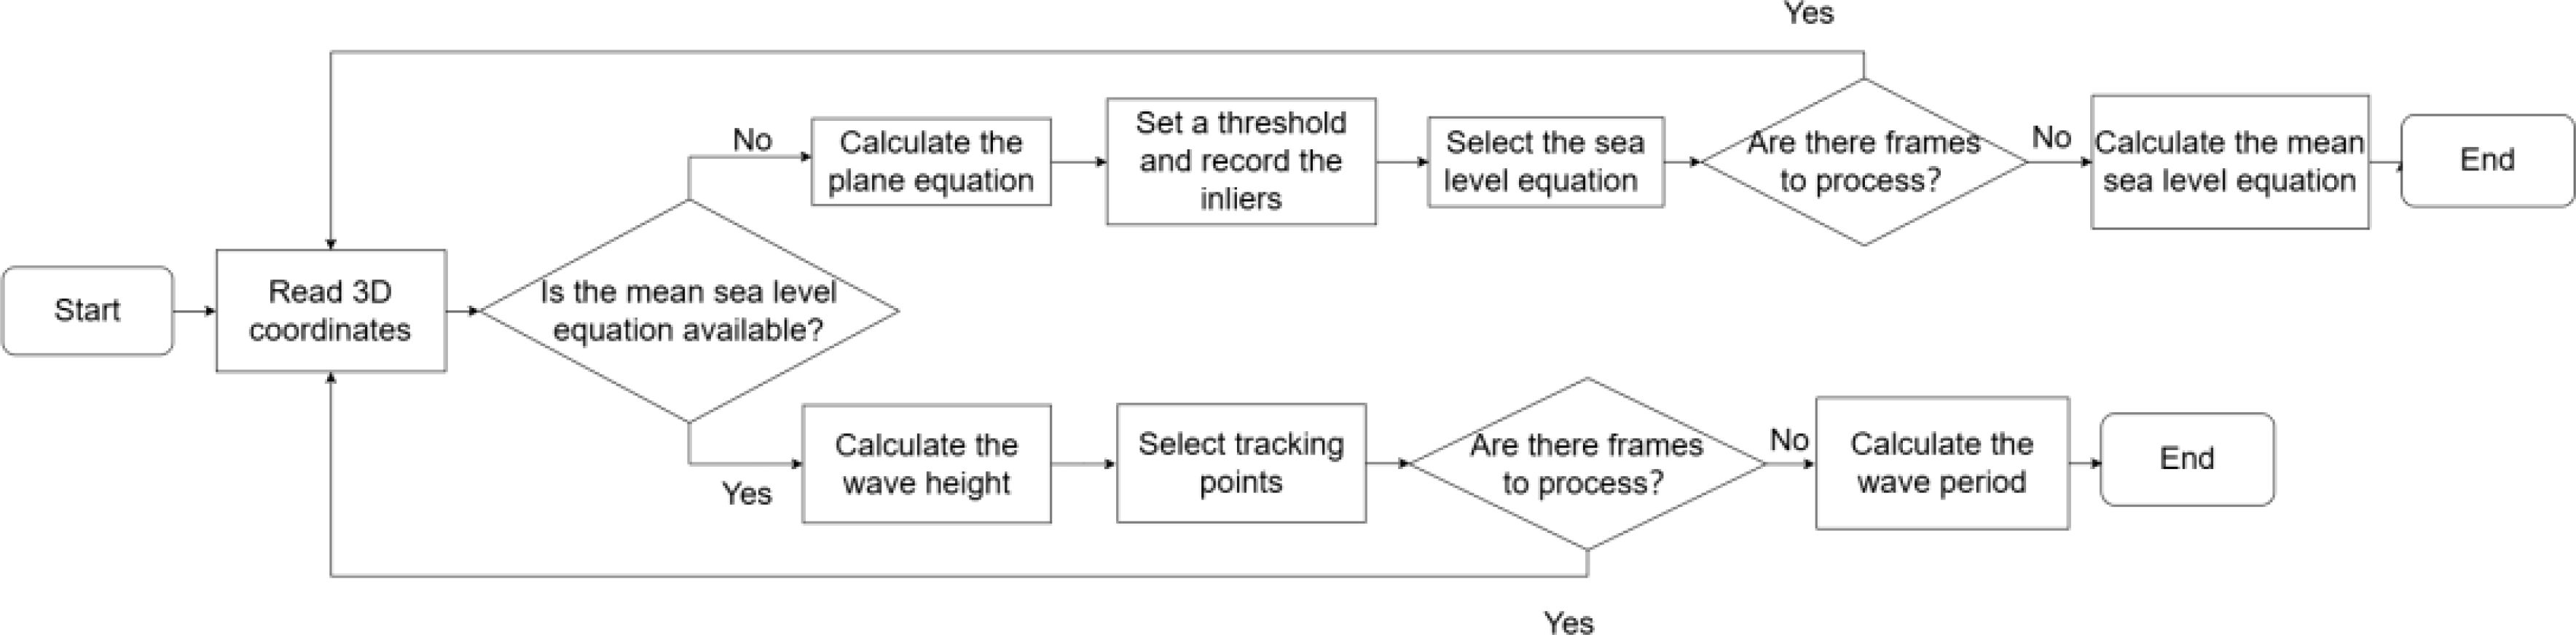
Figure 6. Process diagram for calculating wave height and wave period.
The specific estimation steps are designed as follows:
1. Read the three-dimensional reconstruction results of the current frame.
2. Select n data points within the range of the water surface captured by the cam-era and compute the sea level equation.
3. Set a distance threshold l, and calculate the distance from each point to the sea level. Points with a distance less than l are recorded as inliers.
4. Repeat the experiment m times to identify the inlier set with the maximum number of inliers. Use the coordinates of these inliers to recalculate the sea level equation, which will serve as the current sea level equation. After obtaining the results, read the next frame.
5. Repeat steps 1-4 for N sets of images to derive N sea level equations. Calculate the mean of the coefficients to obtain the average sea level equation.
6. Compute the distance from each point in the N sets of images to the average sea level, which represents the wave height for those images. Calculate the mean of all wave heights to get the average wave height.
7. Select M fixed points and record their height variations over time. Apply smoothing filtering to process the curves, and use the zero-crossing method to calculate the wave period from the smoothed curves. Compute the mean wave period from all points to obtain the average wave period.
Stereo matching focuses on identifying corresponding points in the left and right views to obtain depth information. However, in this section, feature matching is used to find correspondences between features in consecutive frames of the same scene. By com-paring the descriptors of these feature points, similar regions or corresponding points in the images can be identified. These points are typically significant and unique, providing important information about the structure of the images.
Waves are typically irregular and nonlinear, with their shape, size, and direction continuously changing. Different sizes of waves contain various scale features. Feature matching algorithms can extract multi-scale feature points and accurately find correspondences between feature points, even in the presence of noise and partial occlusion, effectively addressing the complex variations of wave characteristics. Therefore, this study employs the SIFT feature point matching algorithm to detect key point information in consecutive frames and combines it with the results of 3D reconstruction to calculate wave direction. Compared to traditional methods such as template matching and phase-shifting techniques, this approach integrates 3D information, allowing for a more accurate capture of wave motion characteristics and enhancing the robustness and precision of wave direction prediction.
The steps of the SIFT algorithm are illustrated in Figure 7, which divides the over-all process into three main stages: feature point detection, feature description, and feature matching. The principle of feature point detection is based on the detection of extrema in the scale space. First, a scale space is constructed by applying Gaussian blur for multi-scale processing, resulting in a scale space pyramid. After constructing the Gaussian pyramid of the image, subtracting adjacent layers produces a Difference of Gaussian (DoG) pyramid. Next, extrema points are identified within the DoG pyramid, which serve as the feature points. Feature description involves mathematically characterizing these feature points by capturing their position, scale, and orientation in-formation, resulting in the generation of keypoint descriptors. Finally, the feature matching step is completed by comparing the sets of keypoint descriptors from the two images and matching corresponding keypoints.
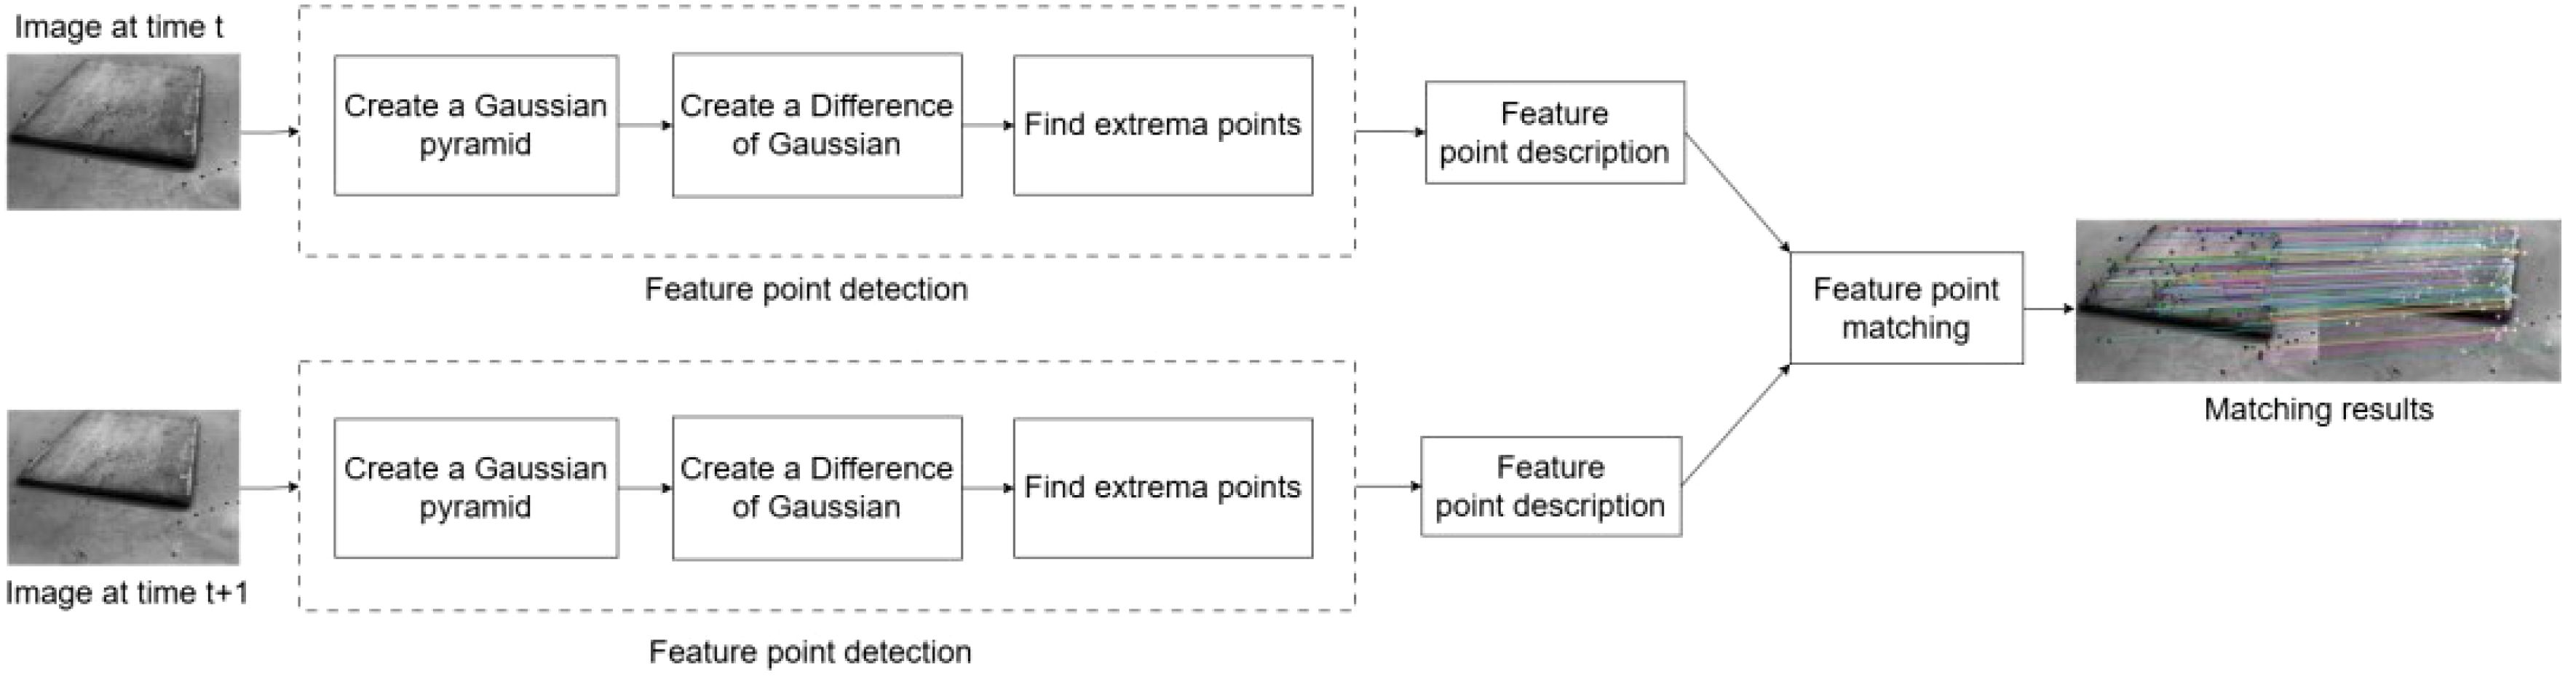
Figure 7. The steps of the SIFT algorithm.
To address the issue that using template matching can only provide the two-dimensional motion direction of waves and cannot comprehensively reflect their movement in three-dimensional space, this paper employs the SIFT algorithm to calculate the feature descriptors of each keypoint and perform matching. By accurately determining the two-dimensional movement of keypoints between consecutive frames and integrating this with the results from stereo matching and three-dimensional re-construction, the two-dimensional movement of keypoints is extended to three-dimensional movement. This allows for the calculation of the three-dimensional motion direction of the waves. The specific design is illustrated in Figure 8. This meth-od ingeniously combines depth learning-based stereo matching technology with feature matching techniques, effectively integrating the two-dimensional movement of feature points with the results of three-dimensional reconstruction to provide a com-prehensive analysis of wave movement, thereby significantly enhancing the accuracy and reliability of wave direction parameter measurements.
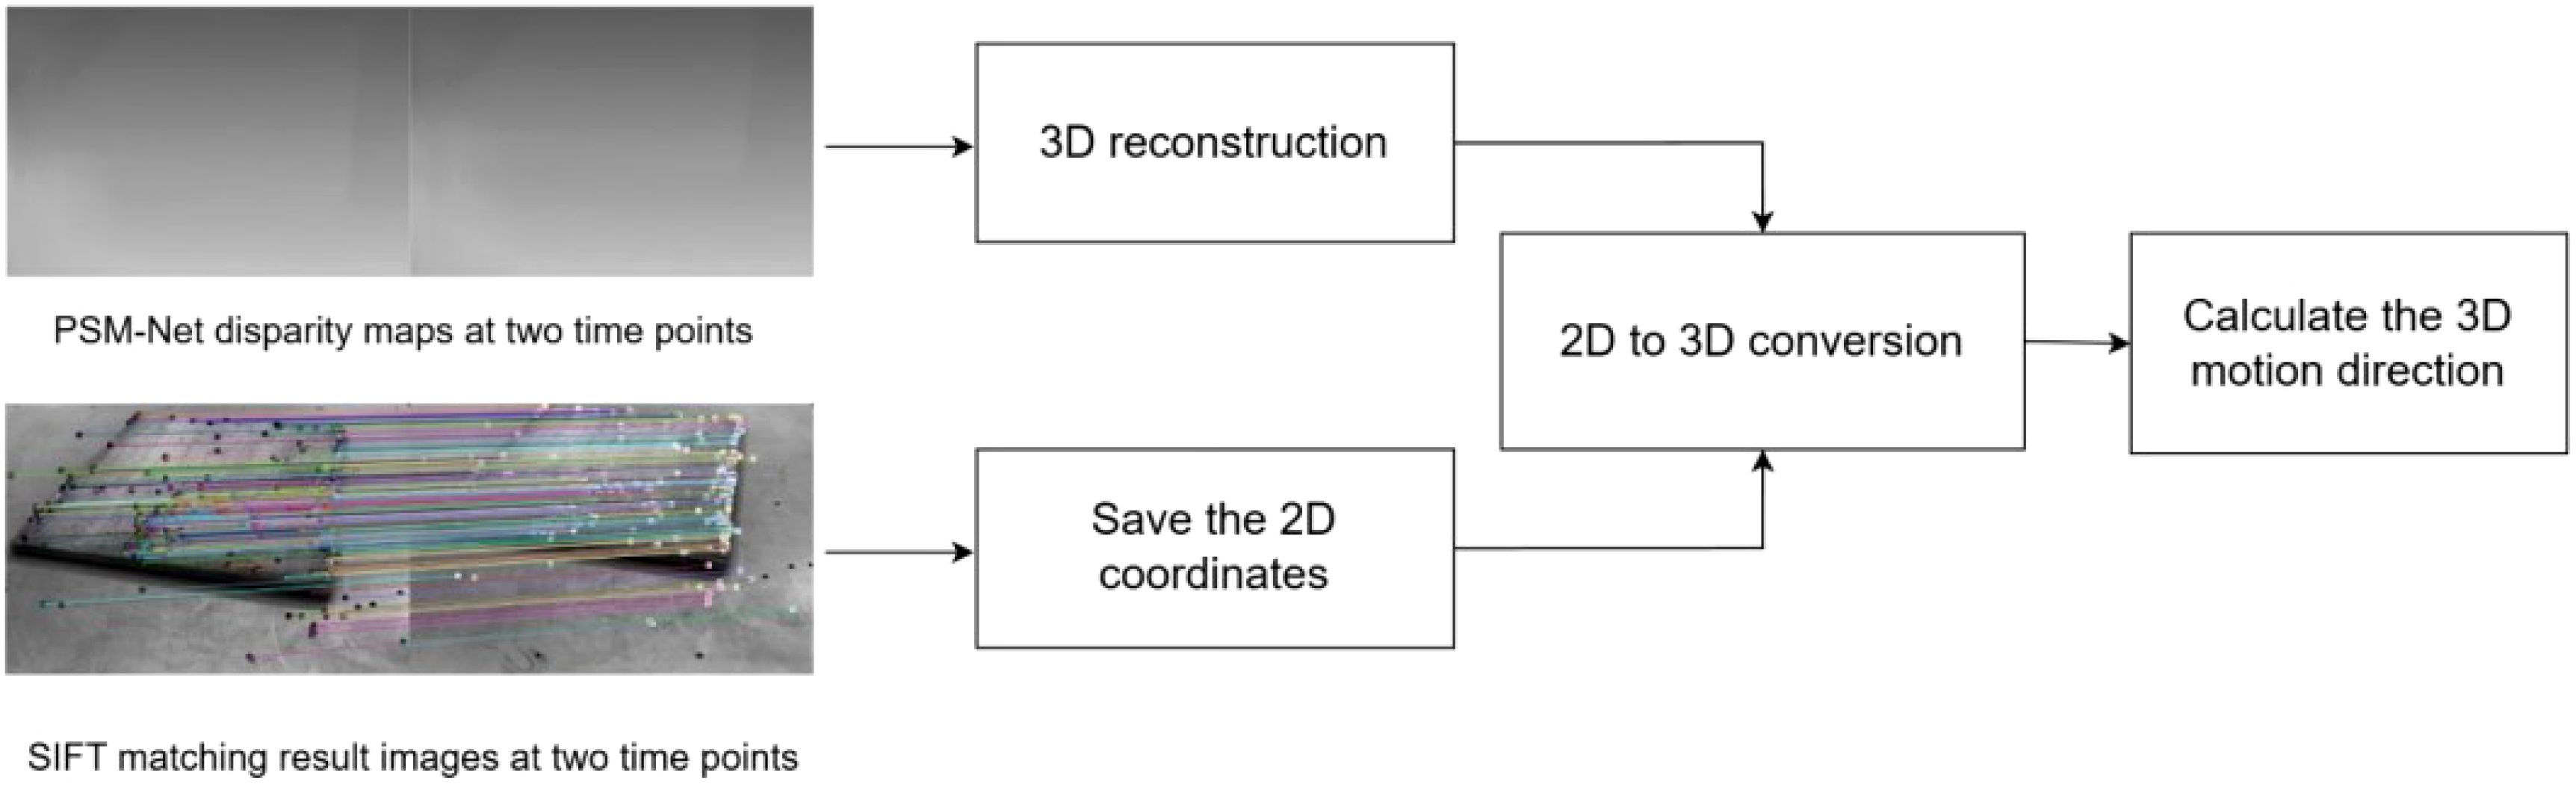
Figure 8. Integrated design of PSM-Net and SIFT.
Building on the design from the previous section, this study employs the SIFT method to process two consecutive frames of images, matching the keypoints between them and calculating their two-dimensional positional changes within the images. By integrating the results from the three-dimensional reconstruction, the three-dimensional coordinate changes of the keypoints can be inferred, enabling the calculation of wave direction. The detailed flow of wave direction computation is illustrated in Figure 9.
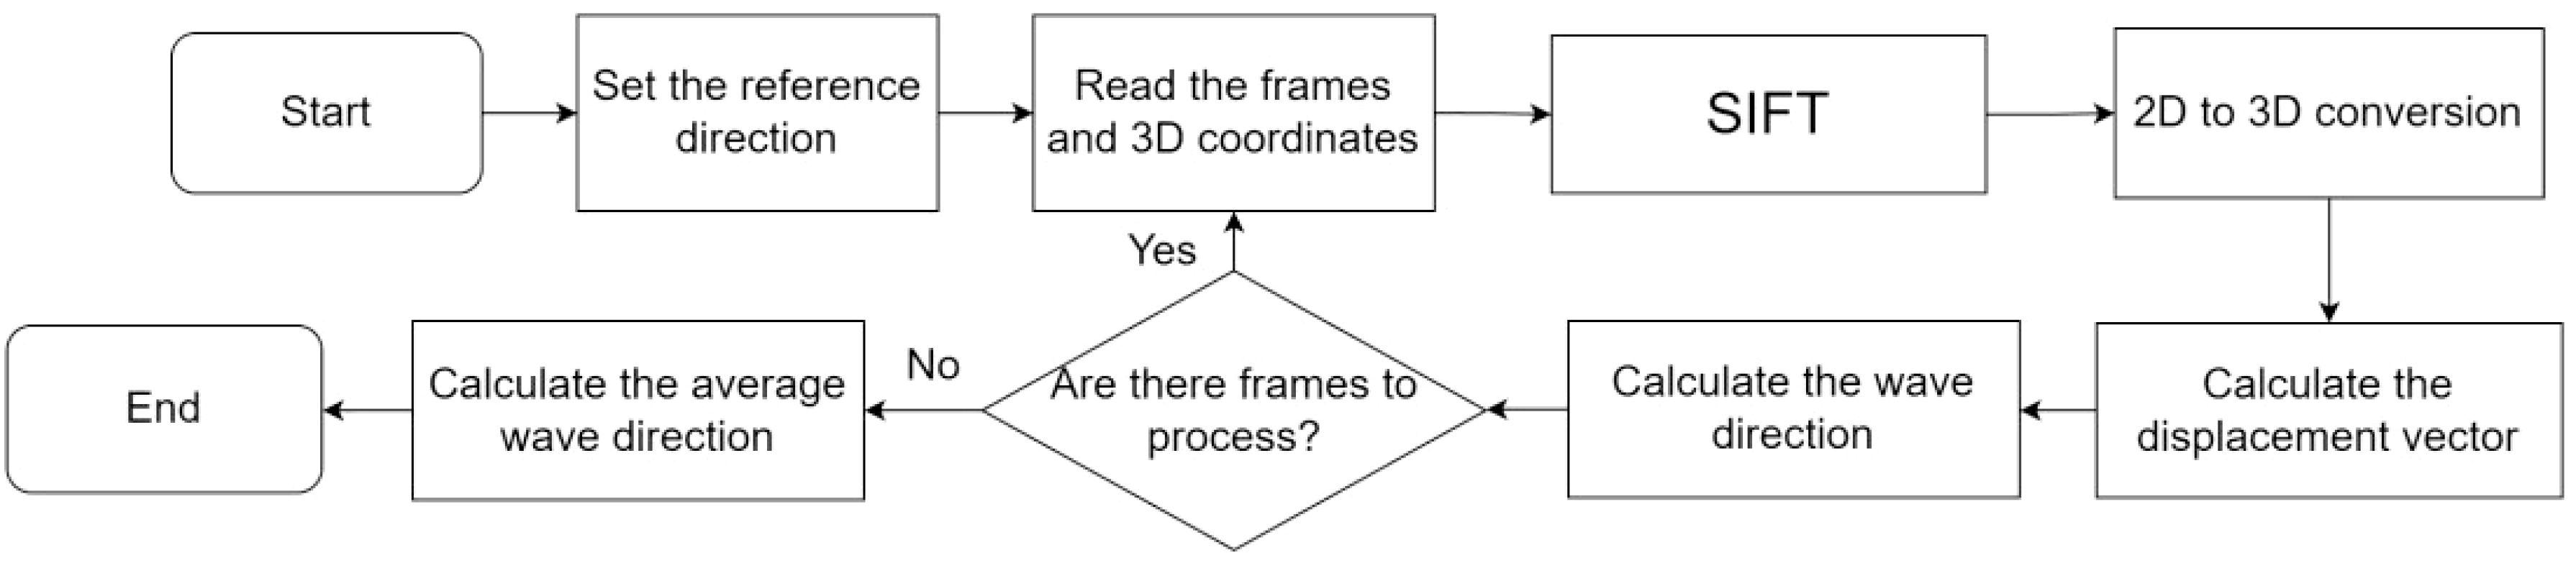
Figure 9. Process diagram for calculating wave direction.
The specific estimation steps are designed as follows:
1. Set the reference direction (typically North) as 0°.
2. Use the SIFT algorithm to match feature points between the two images taken at different times and extract their two-dimensional coordinates.
3. Convert the two-dimensional coordinates into the corresponding three-dimensional world coordinates using the calculations from Section 1.3.
4. Subtract the old three-dimensional world coordinates from the new coordinates to obtain the displacement vector.
5. Calculate the average displacement vector by taking the mean of the velocity vectors.
6. Determine the azimuth of the average velocity vector to obtain the average wave direction at that moment.
7. Repeat steps 2-4 for N sets of images until all time instances of wave direction are obtained, then calculate the mean to derive the average wave direction over this time period.
The entire system consists of two main components: hardware and software. The hardware component includes the various hardware elements, while the software component encompasses the algorithm modules and their processing workflows. The following sections provide a detailed introduction to both components.
The overall composition of the system’s hardware is illustrated in Figure 10. The camera system consists of the Alvium G1-1236c camera paired with an LM6FC24M lens. The Alvium G1-1236c features a resolution of 4112 (H) × 3008 (V), providing high-resolution images that facilitate the capture of intricate details on the ocean sur-face, making it suitable for high-precision marine parameter collection. Compared to consumer-grade cameras, this camera offers advantages such as stable image trans-mission capabilities and high interference resistance, allowing it to operate reliably in complex environments. The LM6FC24M lens boasts a wide field of view, enabling coverage of a larger marine observation area. Its precision design effectively reduces im-age distortion while preserving color fidelity, making it well-suited for industrial ap-plications. The combination of these two components significantly enhances the over-all performance of the system.
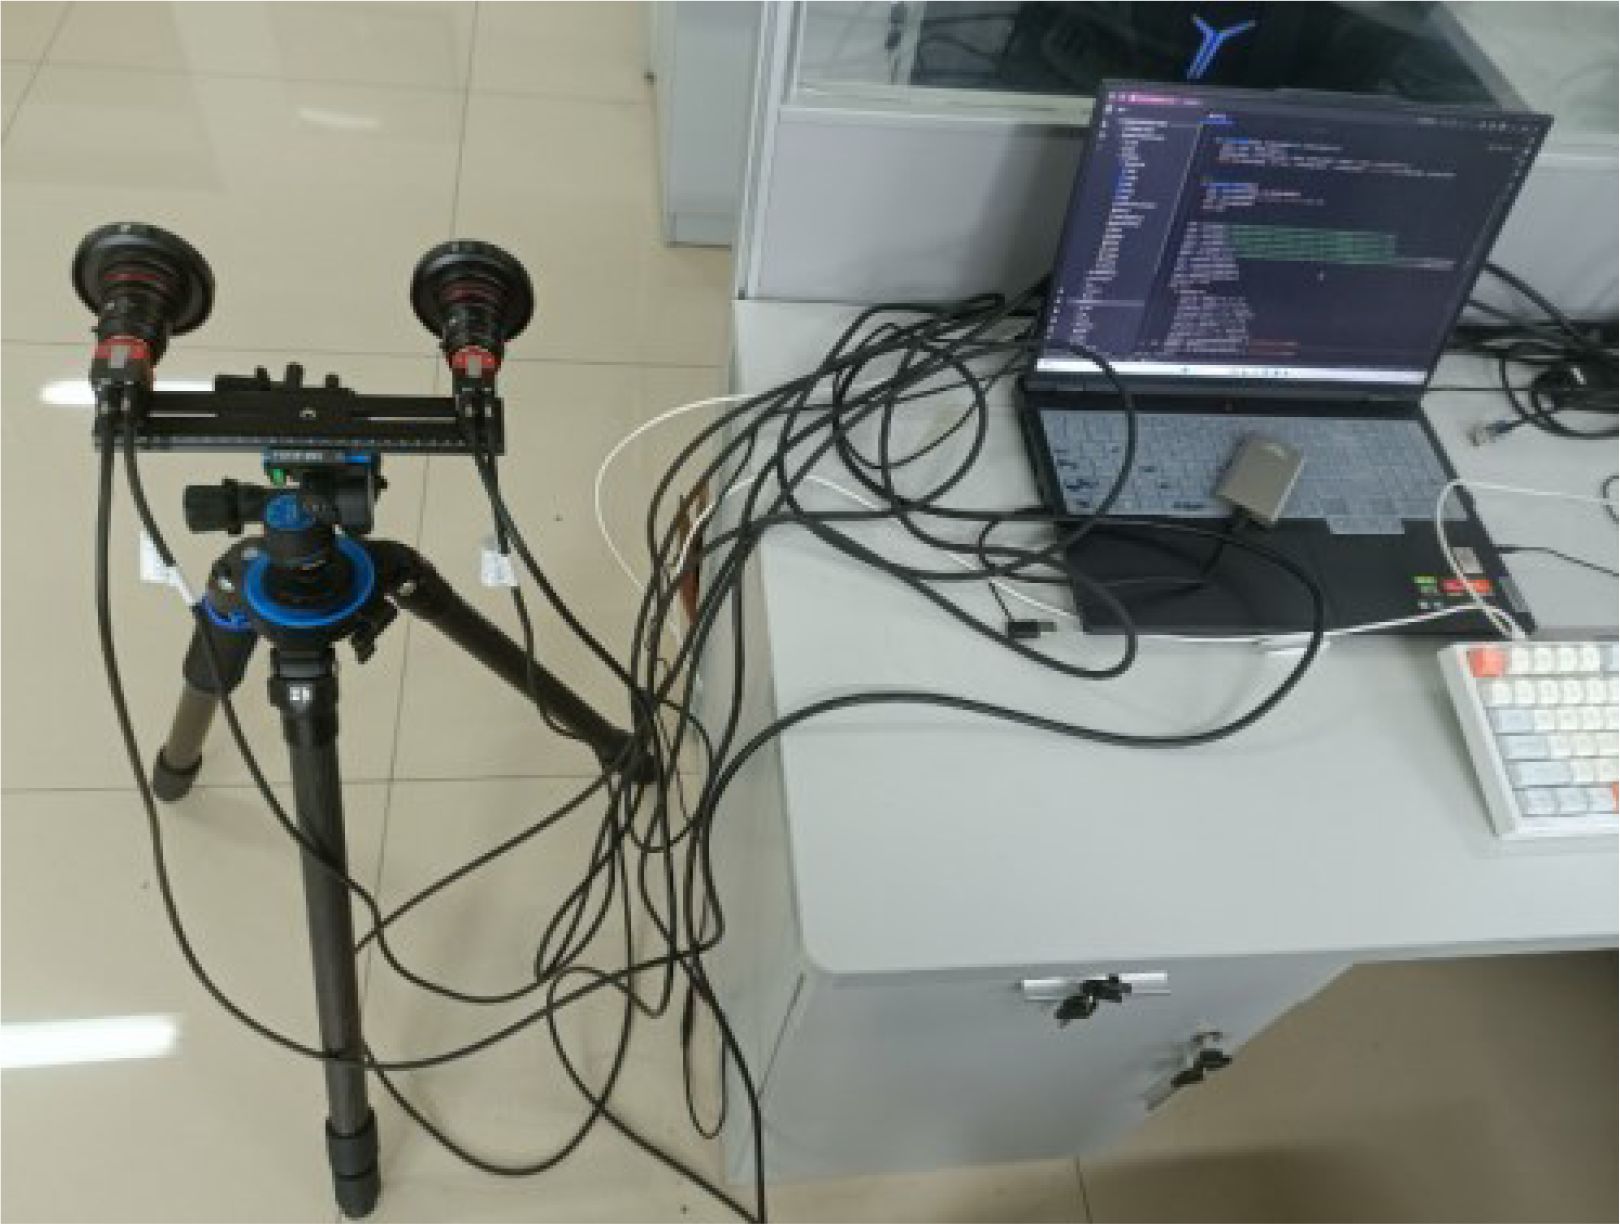
Figure 10. Hardware configuration of the system.
The camera is securely mounted using a tripod, a gimbal, and a stereo board. The tripod provides excellent support, ensuring stable camera operation under various conditions. The gimbal allows for precise adjustments and corrections of the camera’s angle and direction as needed. The stereo board facilitates quicker setup and adjustments, making it convenient and efficient to reposition the cameras. This entire mounting system effectively enhances the reliability of image acquisition, ensuring that the camera maintains a stable posture during the shooting process, thus allowing it to operate reliably in different environments. Finally, the system is equipped with a computer featuring a high-performance GPU for data processing, ensuring efficient handling of image data.
The overall module structure of the software is illustrated in Figure 11. The cam-era calibration module is responsible for image acquisition, calibration, and preprocessing, aiming to synchronize the left and right views of the same scene and transmit the image data to the computation unit. This module eliminates distortions in the im-ages and performs geometric correction based on calibration parameters to ensure the alignment of the left and right images.
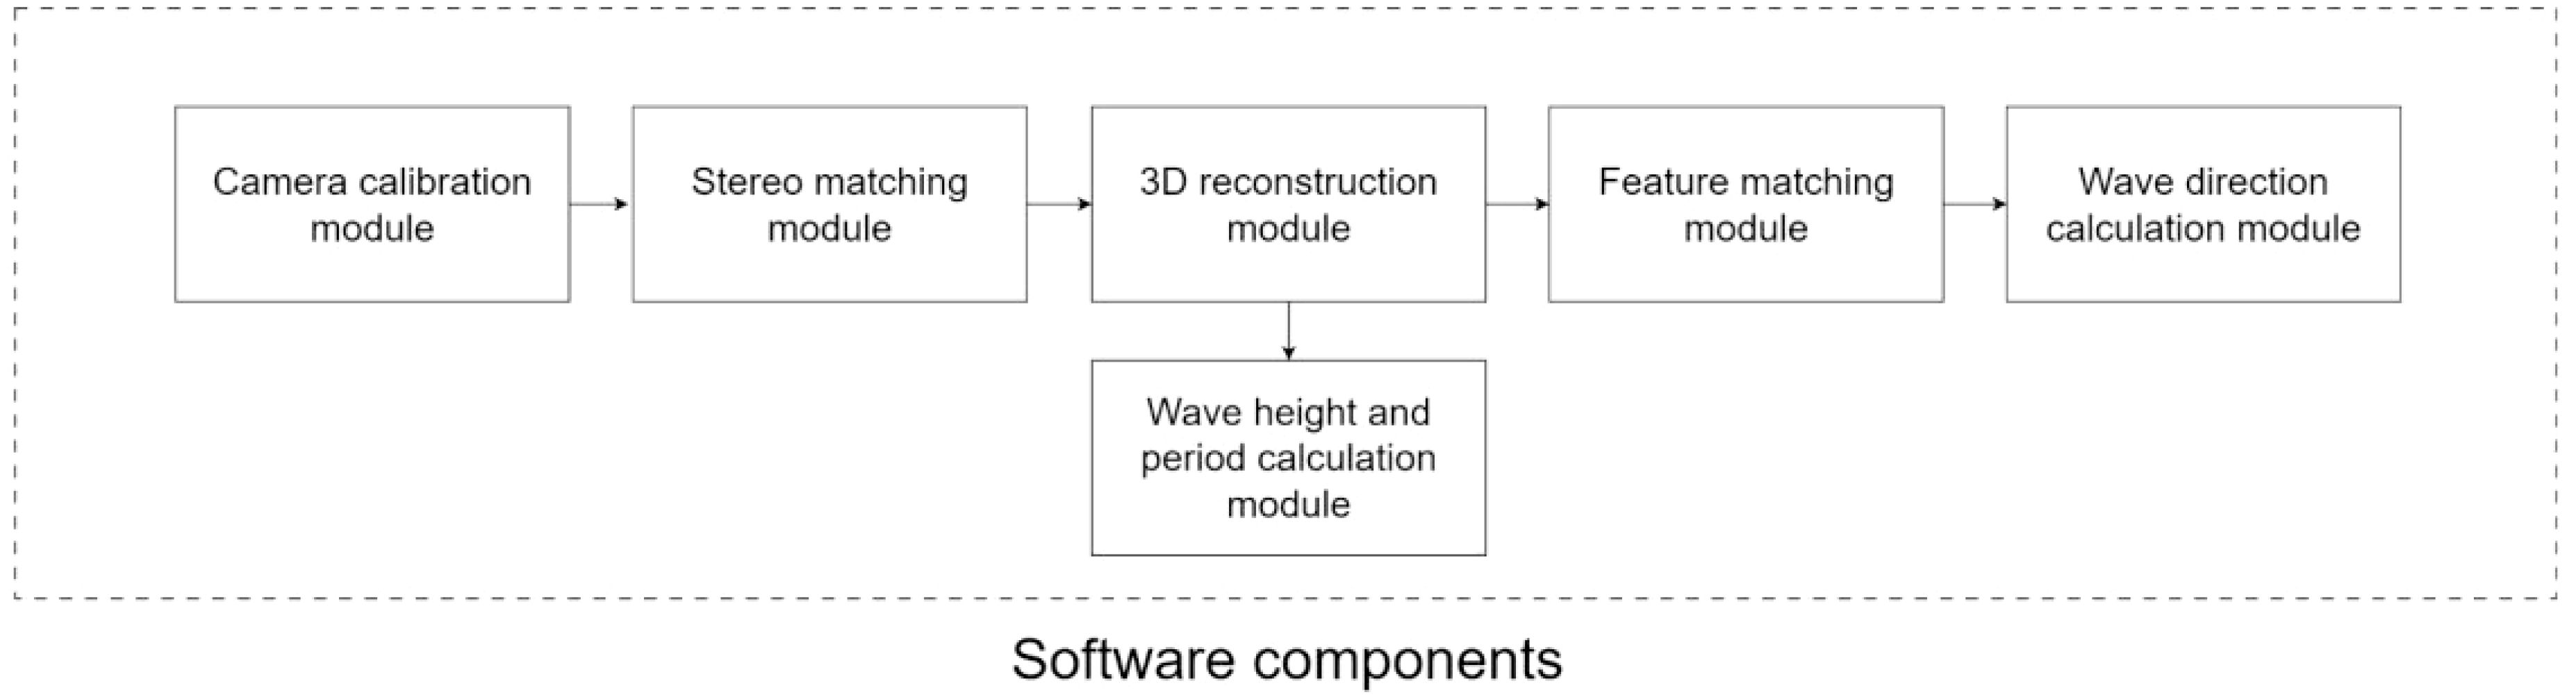
Figure 11. Software configuration of the system.
The stereo matching module calculates the disparity of each pixel in the left and right images, generating a disparity map to obtain depth information about the scene. The 3D reconstruction module utilizes the results from stereo matching to reconstruct the 3D information of each pixel, providing foundational data for subsequent analysis of the wave’s three-dimensional morphology. The wave height and wave period calculation module employs the results from the 3D reconstruction to calculate the wave height and wave period.
The feature matching algorithm is used to extract and match feature points in the front and rear frame images, identifying the positional changes of the waves at different time points and analyzing their dynamic characteristics. The wave direction calculation module combines feature matching and 3D reconstruction results to compute the wave direction.
These modules collaborate with each other to ultimately achieve the parameter calculation of the waves.
The software section is built in a coding environment that uses Python 3.7 or higher. The primary algorithm libraries utilized include Vmbpy for controlling the camera, OpenCV for image processing, PyTorch for establishing the stereo matching deep learning network, NumPy for scientific computing, Open3D for point cloud processing, Pandas for data manipulation, and Matplotlib for data visualization. These libraries collectively support the implementation of various algorithms required for the system’s functionality.
To verify the accuracy of the algorithms, this paper innovatively proposes a solution using a six-degree-of-freedom platform to simulate waves, addressing the issues of attenuation and the difficulty of simulating multi-directional waves commonly found in traditional wave tanks. The parameters of the six-degree-of-freedom platform are shown in Table 1. The overall plan is as follows: First, the six-degree-of-freedom plat-form is restored to the neutral position, serving as the average sea level. An object is placed on this level to simulate the cur-rent wave state, and the distance from the object to the average sea level is calculated and compared with the actual height to verify the accuracy of the average sea level and wave height algorithms. Next, the platform is returned to the mid-position, and a fixed periodic back-and-forth motion around the axis is set to simulate the cyclical fluctuations of waves. The computed period is compared with the set period to verify the accuracy of the wave period algorithm. Finally, the platform is again restored to the mid-position, and it is set to move in any direction to simulate the wave propagation direction. The computed wave direction is compared with the actual motion di-rection to validate the accuracy of the wave direction algorithm. Compared to traditional wave tanks, the six-degree-of-freedom platform can accurately simulate com-plex multi-directional wave movements, avoiding attenuation during motion and eliminating the high costs associated with wave tank devices, thereby providing a more economical and efficient solution for research.
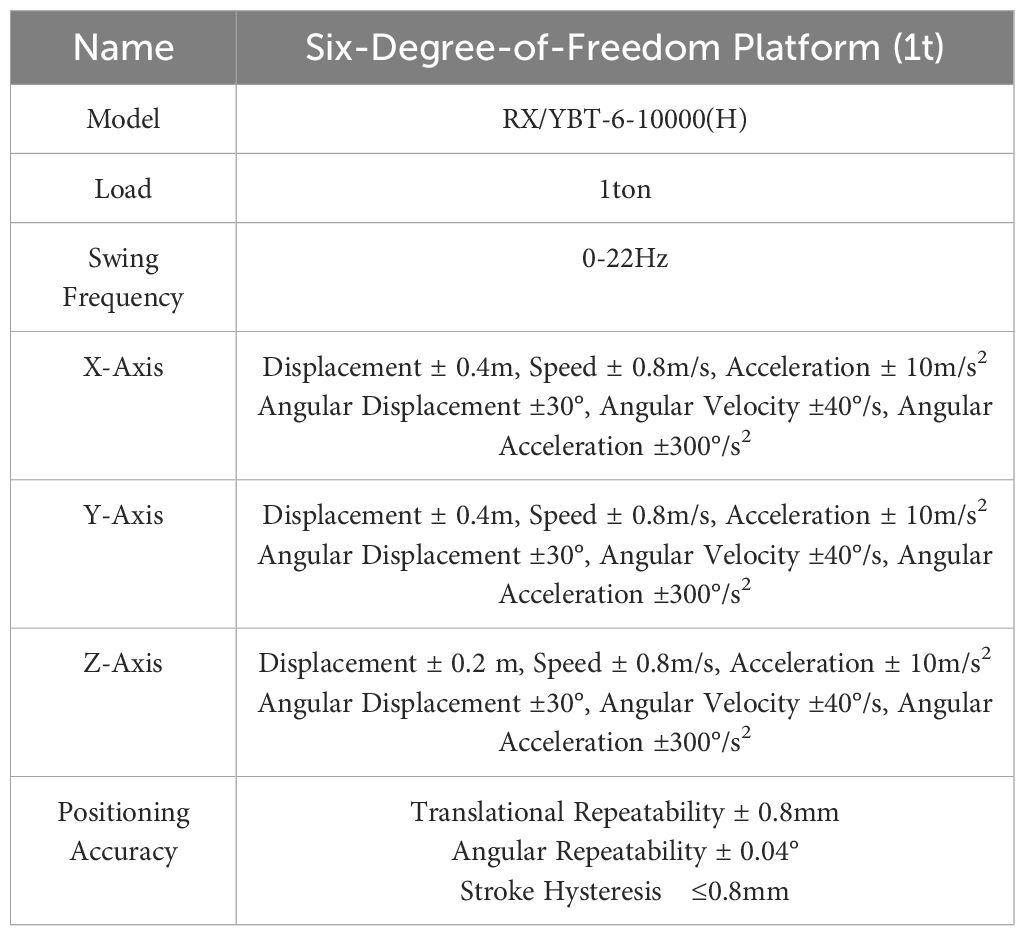
Table 1. Main technical parameters of the six-degree-of-freedom platform.
The platform setup is illustrated in Figure 12, where a support is used to fix the camera in a position that covers the entire motion area of the six-degree-of-freedom platform, which is connected to a computer for data processing. Objects are placed on the six-degree-of-freedom platform, and after capturing images, algorithms are used to calculate the platform’s motion parameters. By comparing these with the actual motion parameters, the accuracy and reliability of the 3D reconstruction algorithm and the wave parameter algorithm are evaluated.
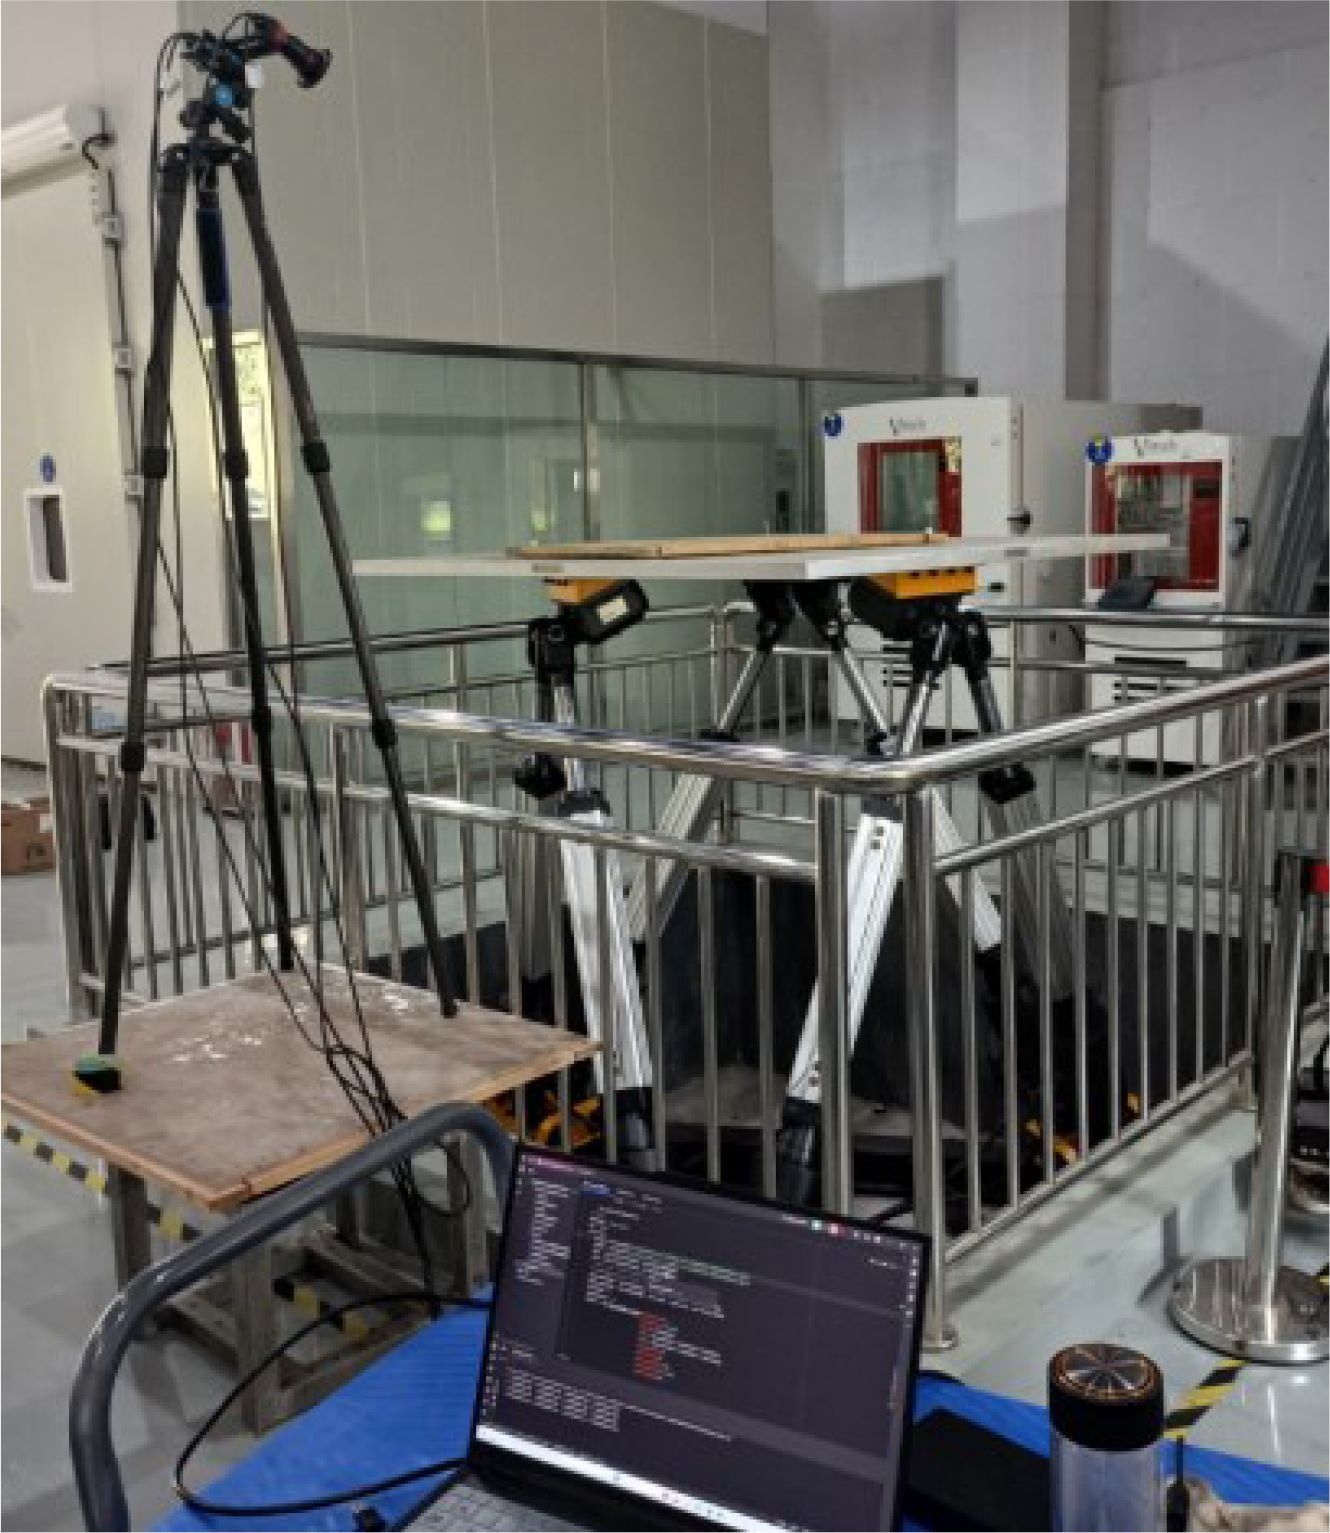
Figure 12. Platform setup.
In order to validate the effectiveness of the method proposed in this paper, a laboratory scene was chosen, where disparity maps were generated for both an initial flat plane and a plane with objects placed on it, using SGBM and PSM-Net trained with the Scene Flow dataset (Mayer et al., 2016). The height of the objects in relation to the initial plane was calculated and compared to the actual object heights to assess the accuracy and reliability of the 3D reconstruction and sea-level estimation algorithms. The disparity map generation results are shown in Figure 13, and the object heights calculated via 3D reconstruction using the camera parameters are presented in Table 2.
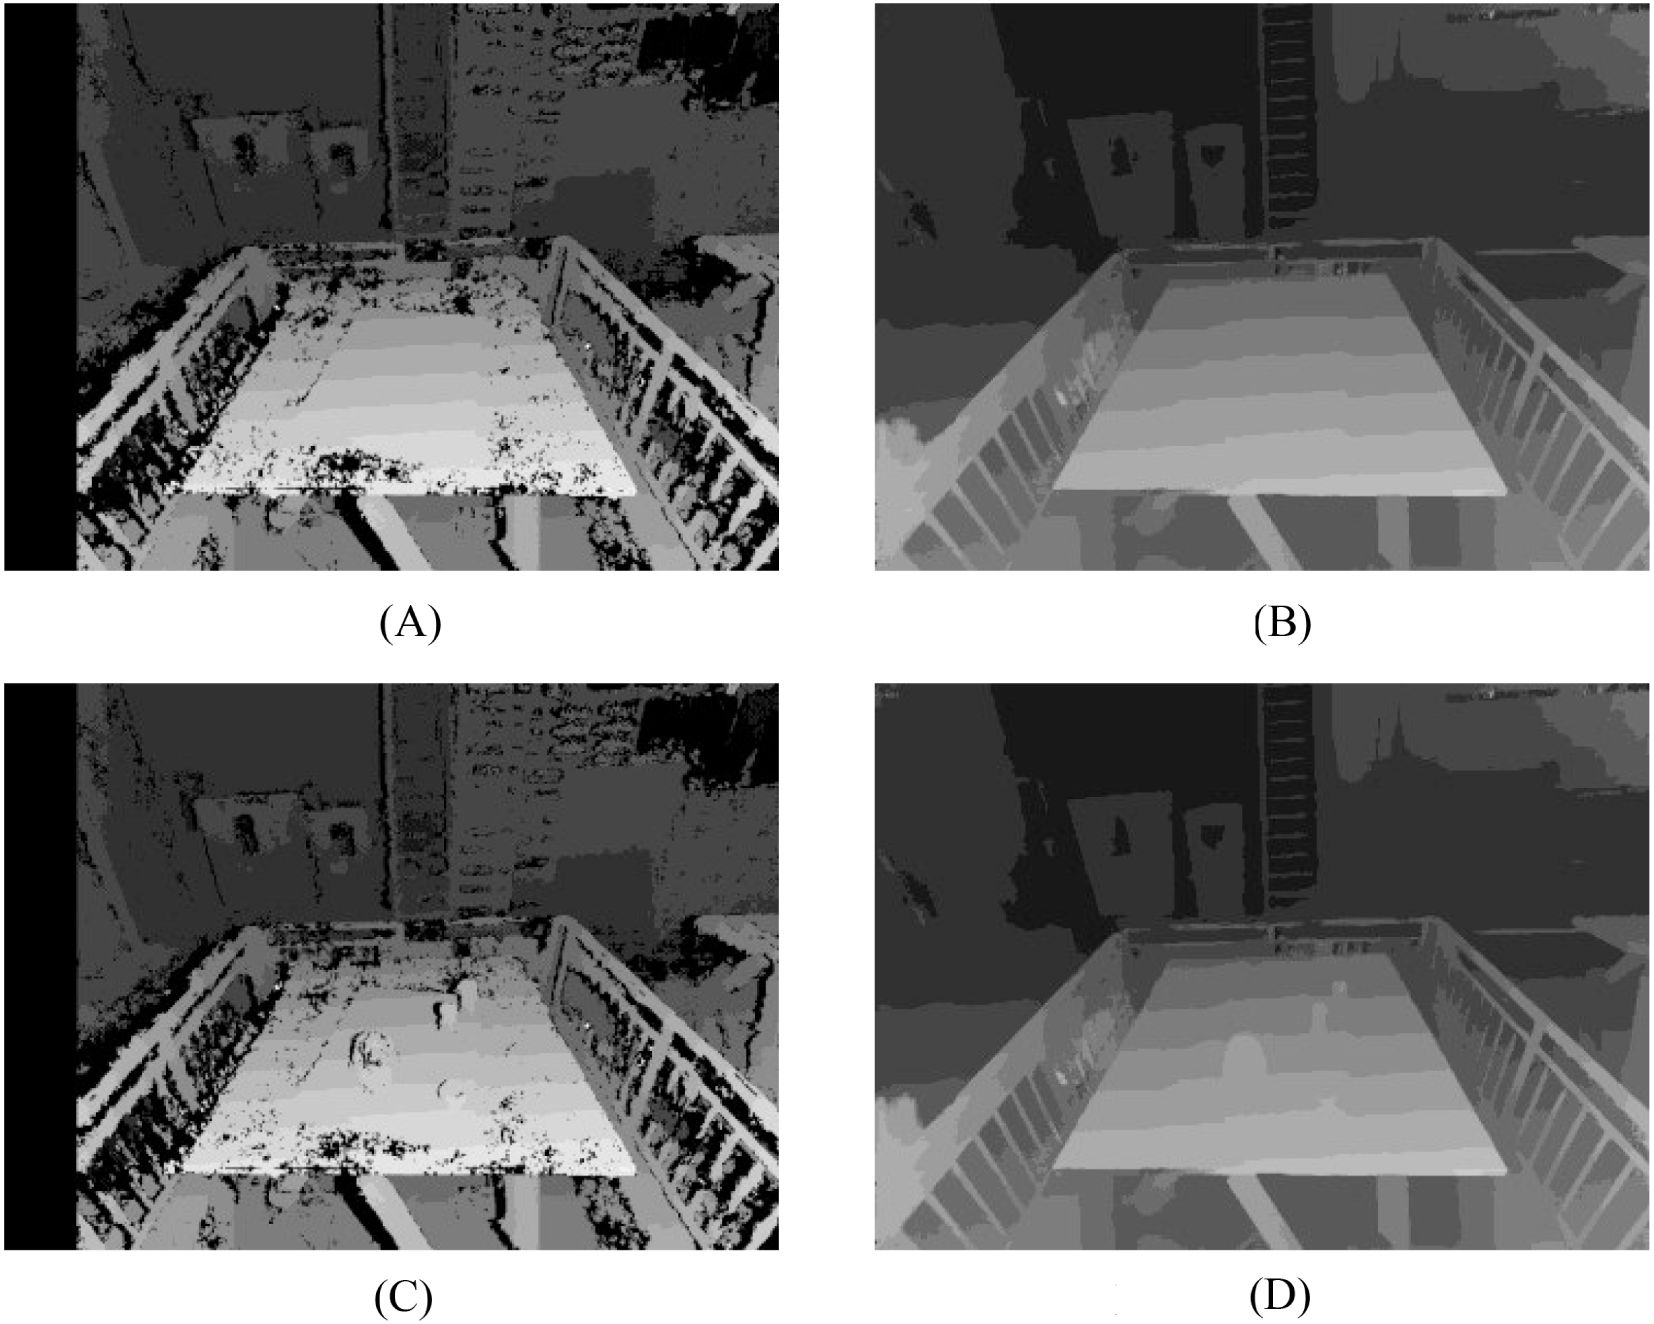
Figure 13. Experimental results of height measurements. (A) Disparity Map of the Baseline Plane (SGBM), (B) Disparity Map of the Baseline Plane (PSM-Net), (C) Disparity Map of the Object (SGBM), (D) Disparity Map of the Object (PSM-Net).
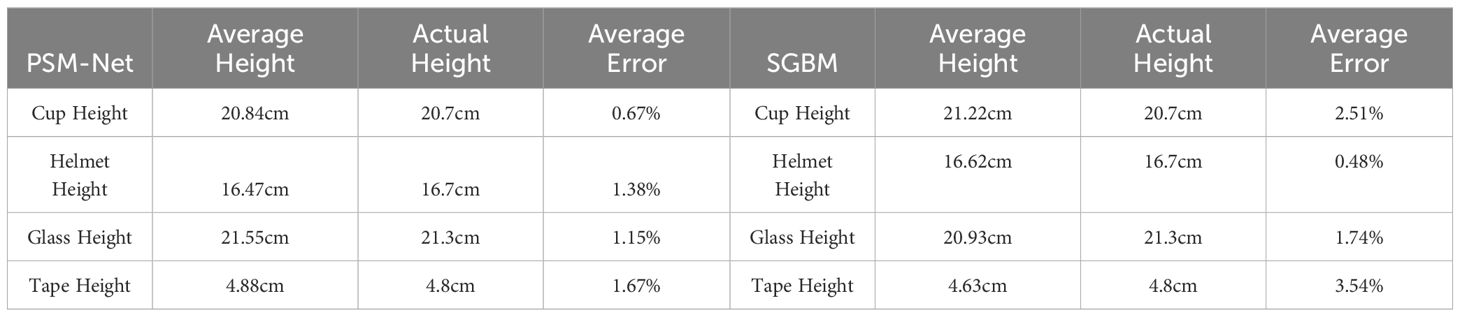
Table 2. Height measurement results of the six-degree-of-freedom platform.
The disparity maps show that, in comparison to traditional algorithms, the disparity maps generated by PSM-Net are more continuous and smoother, effectively avoiding the discontinuities often encountered in traditional methods. From the experimental results, it can be seen that the object height measured by the 3D reconstruction algorithm has an error within 2%, confirming the algorithm’s high accuracy in wave height measurement. PSM-Net, in particular, achieves higher precision, highlighting its advantages over conventional algorithms.
The six-degree-of-freedom platform is set to perform periodic reciprocating motion for 20 seconds, capturing a total of 201 images over 67 seconds at a rate of 3 frames per second. A target area is selected, and the average sea level equation is calculated. Seven random points within the selected area are chosen, and the distances from these points to the average plane are tracked, recording the height variations. The height data is converted into the time domain, and a curve graph is plotted. This curve is processed using smoothing filters. The time difference between two zero crossings is calculated using the zero-crossing method, yielding the wave period. The mean of the calculated periods is taken as the average motion period, which is then compared with the actual period to compute the system error. The selected target area, point locations, obtained disparity maps, curves, and the curves smoothed using the Savitzky-Golay filter are shown in Figure 14. The results are presented in Table 3.
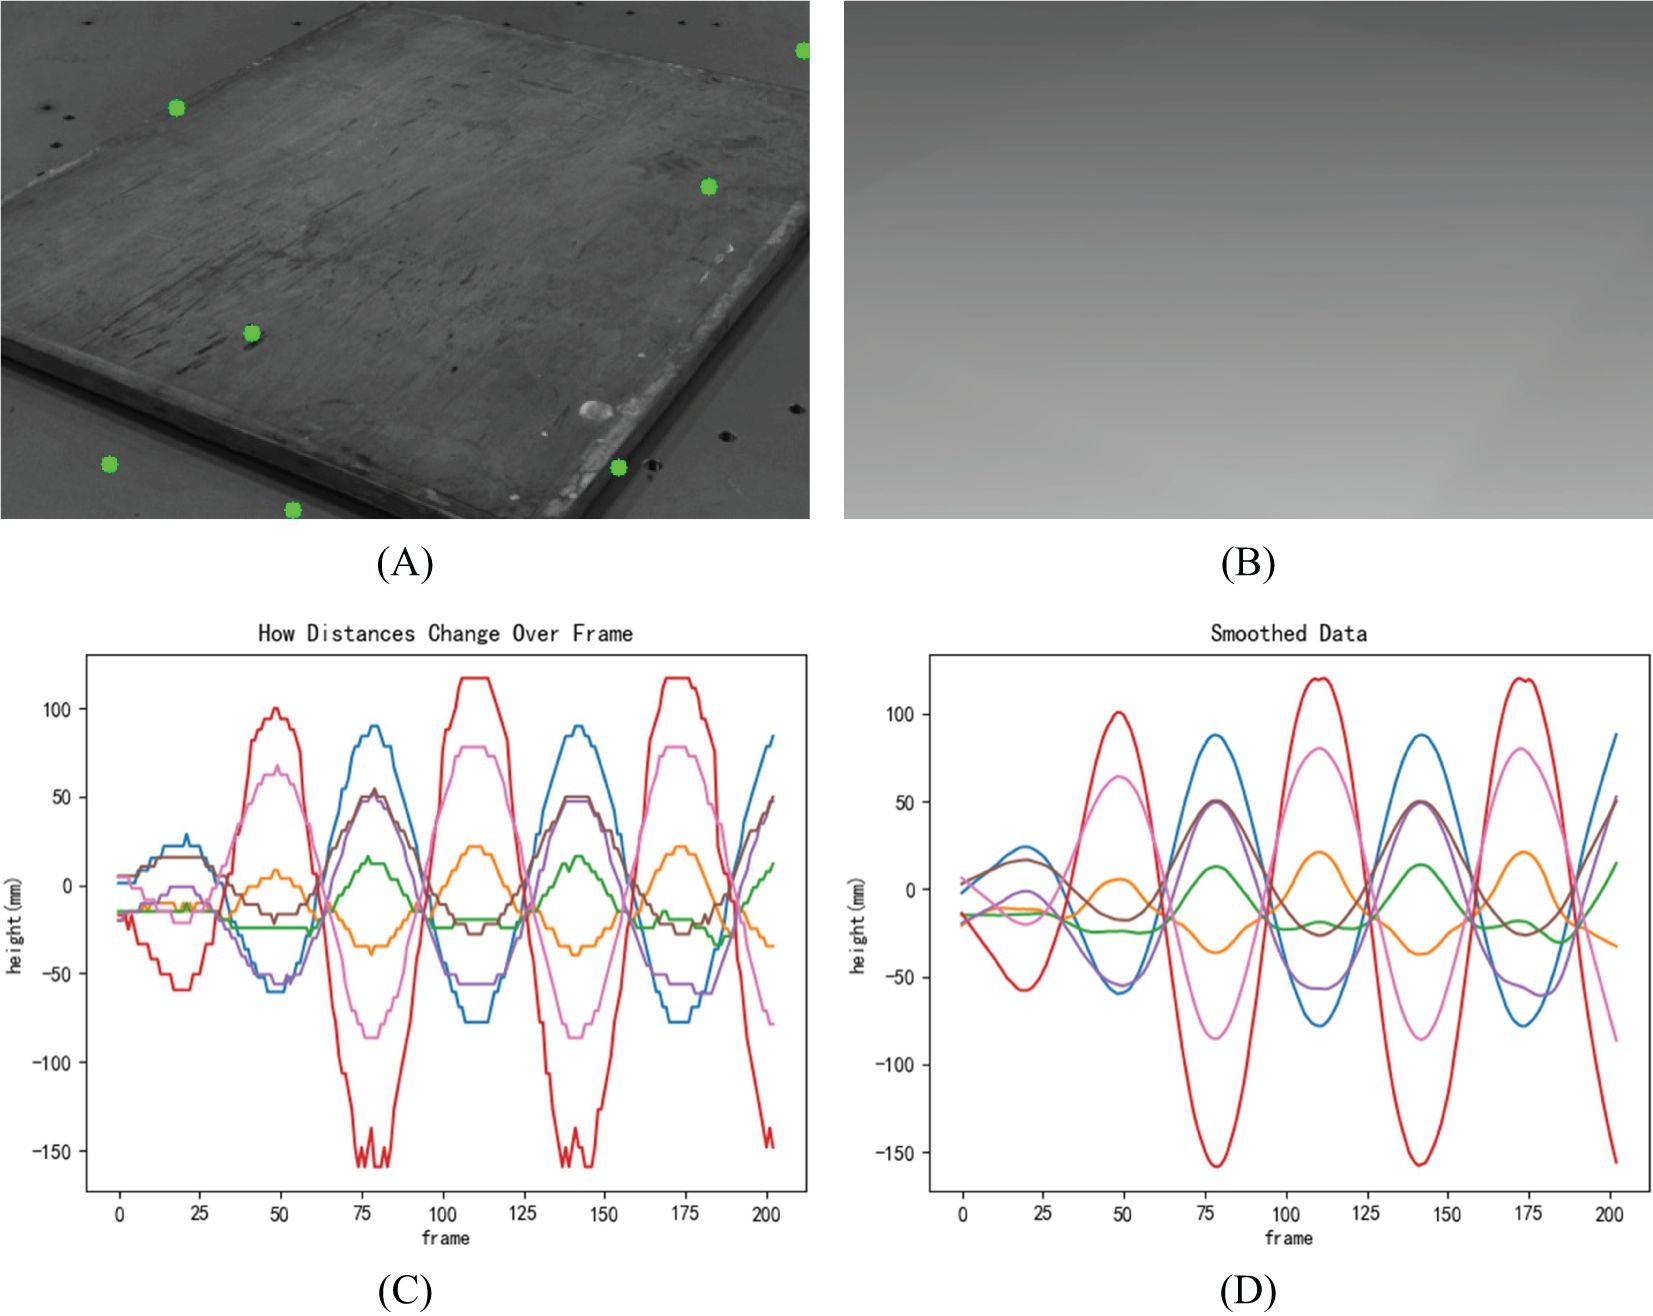
Figure 14. Experimental results of period measurements. (A) Randomly Selected Points in the Area, (B) Disparity Map of the Area, (C) Distance Variation over Time, (D) Smoothed Data.
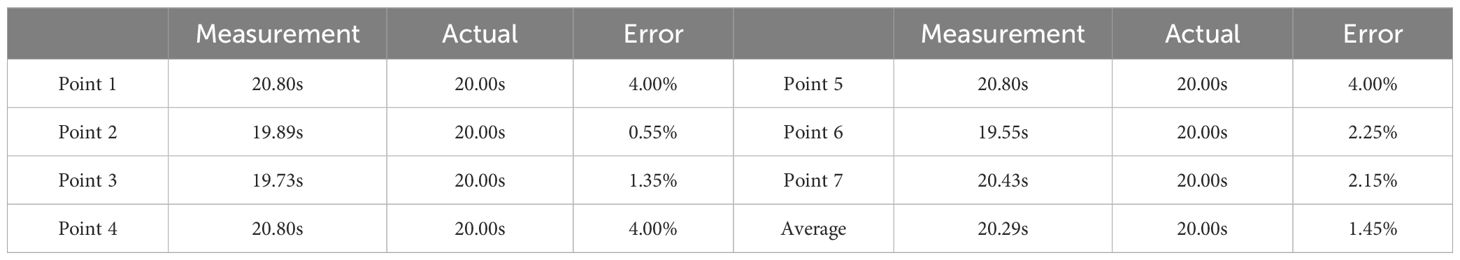
Table 3. Six-degree-of-freedom platform period measurement results.
The analysis of the data reveals that the errors in the periods measured by the period algorithm range from 0.55% to 4.00%. These results indicate that the period algorithm performs well in indoor experiments, demonstrating high accuracy and reliability.
The initial position and motion trajectory parameters of the six-degree-of-freedom platform are set, with the reference direction defined as the positive y-axis of the plat-form. The calculations are carried out using the template matching algorithm, SIFT, and the proposed method. The computed results are compared to the actual motion parameters to assess the validity and effectiveness of the algorithm, proving the superiority of the method used in this paper. Figure 15 shows the matched points obtained by SIFT and the matching results from the template matching algorithm. The experimental results are summarized in Table 4.
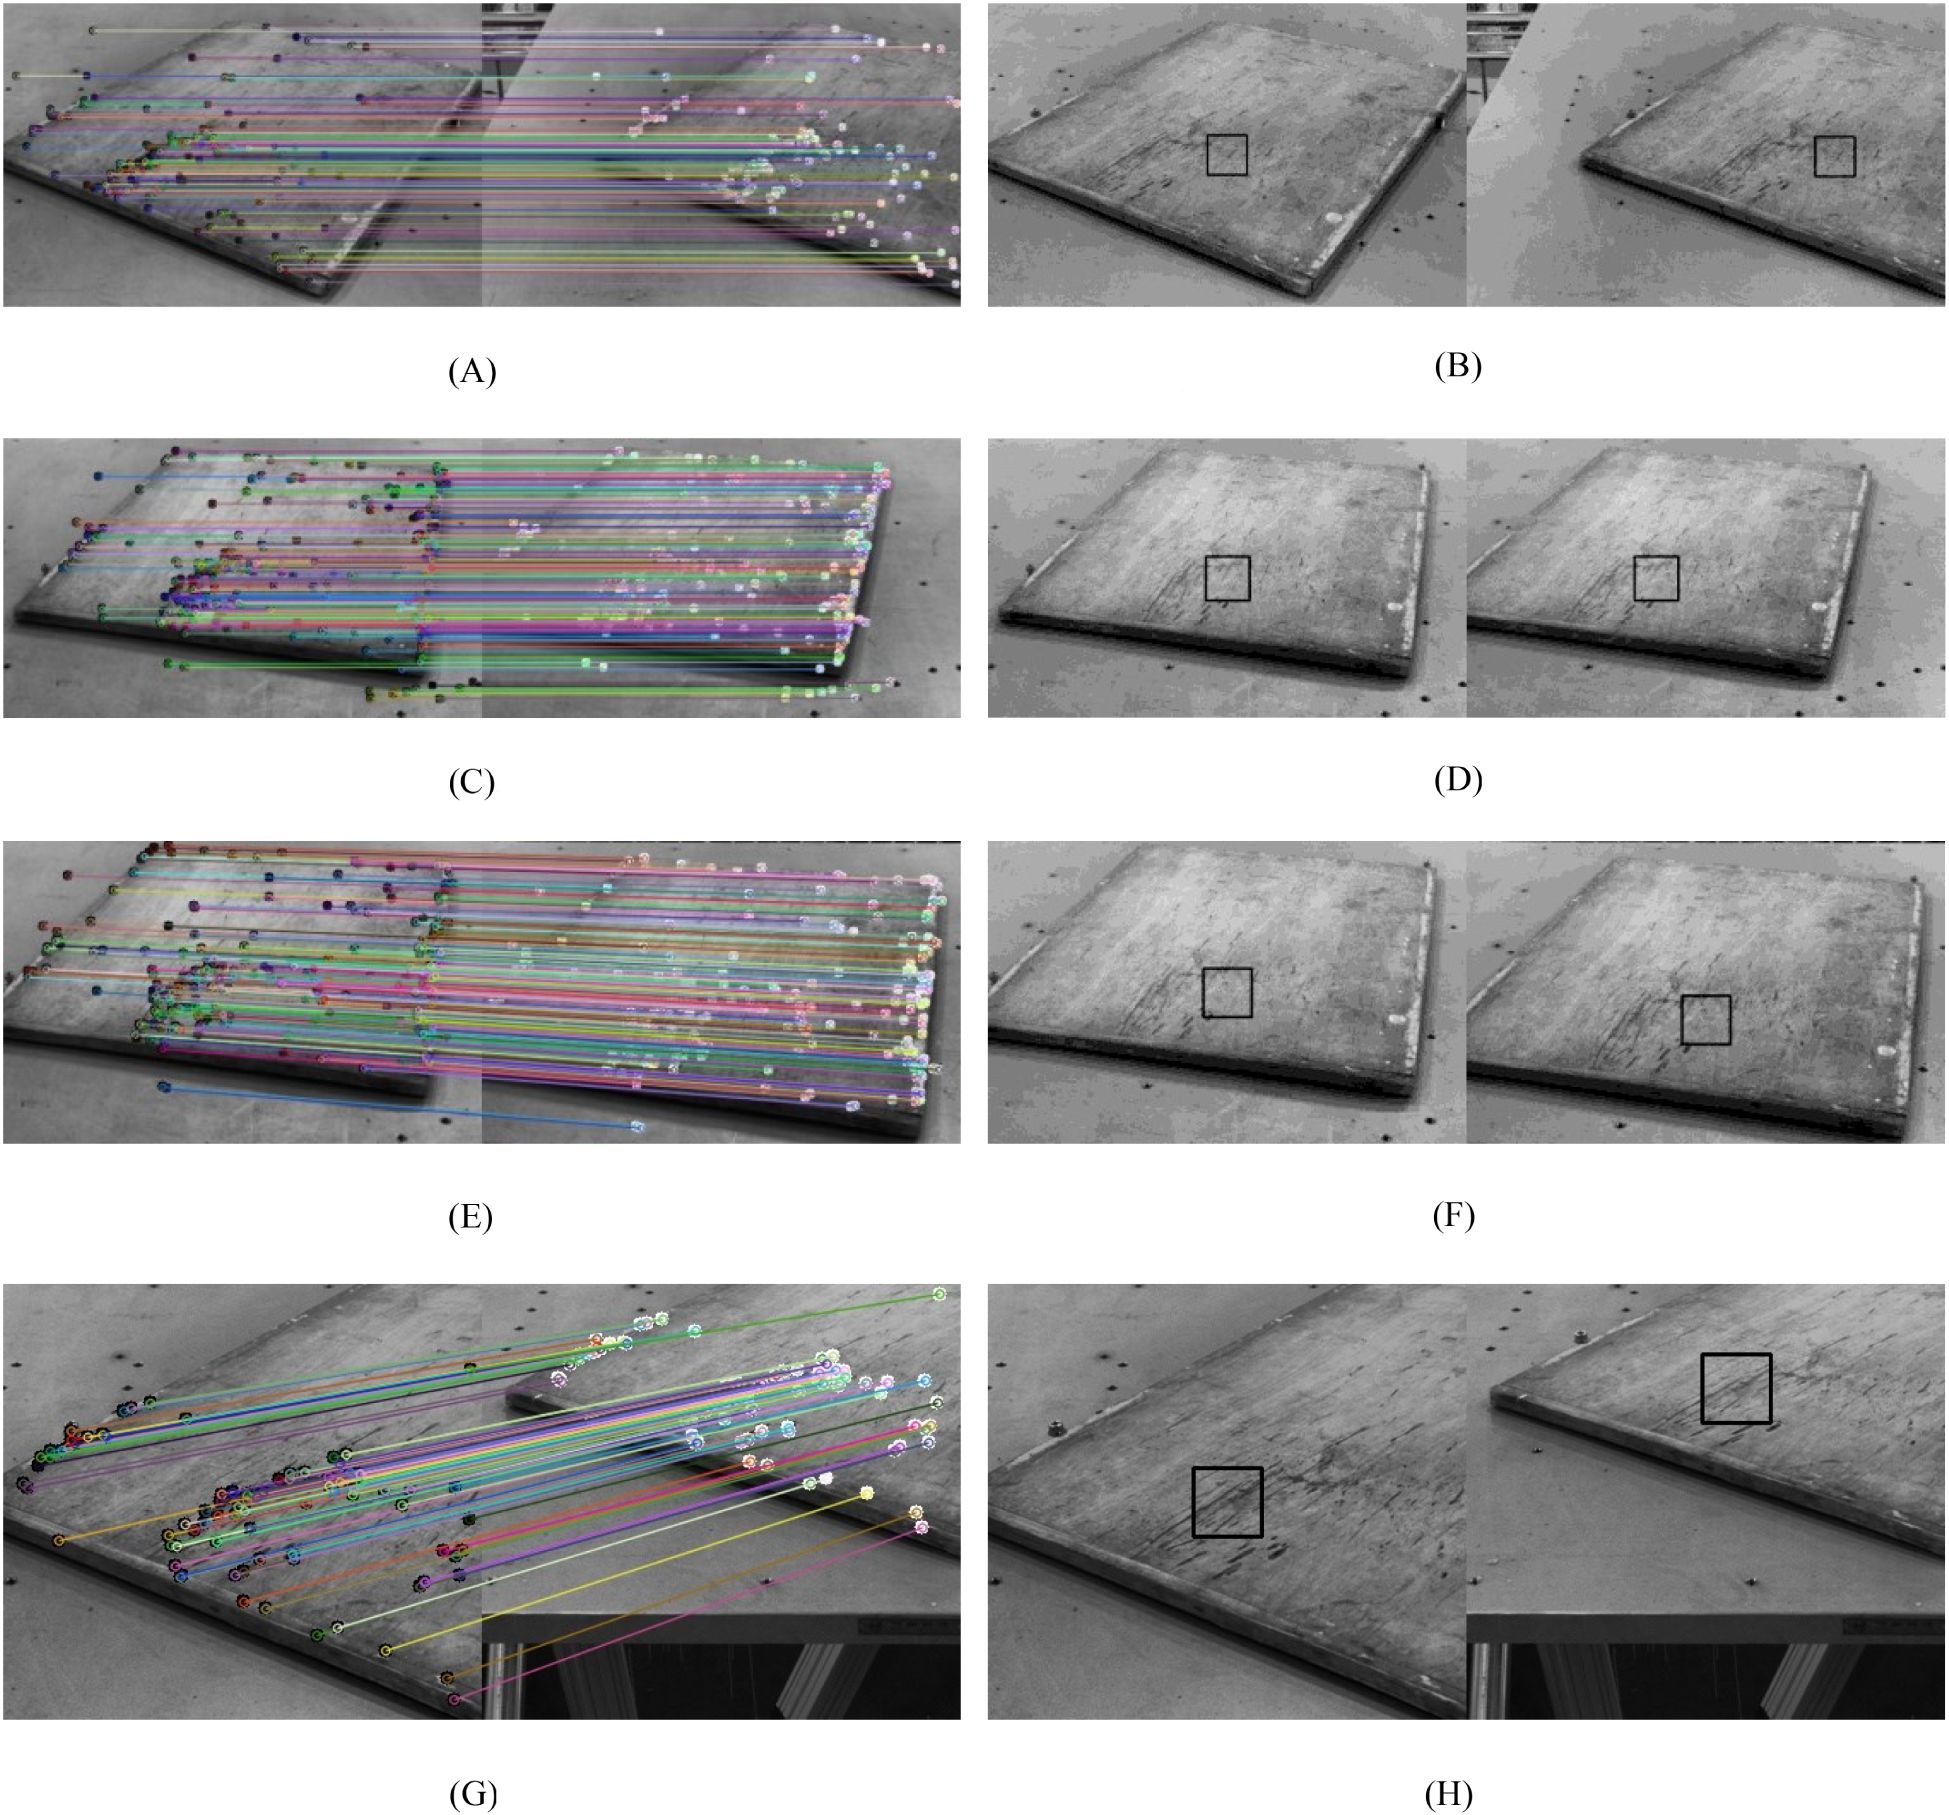
Figure 15. Experimental results of direction measurements. (A) Move Along the Positive Y-Axis (SIFT), (B) Move Along the Positive Y-Axis (Template Matching), (C) Move Along the Negative Y-Axis (SIFT), (D) Move Along the Negative Y-Axis (Template Matching), (E) Move Along the Positive X-Axis (SIFT), (F) Move Along the Positive X-Axis (Template Matching), (G) Move Along the Negative X-axis (SIFT), (H) Move Along the Negative X-axis (Template Matching).
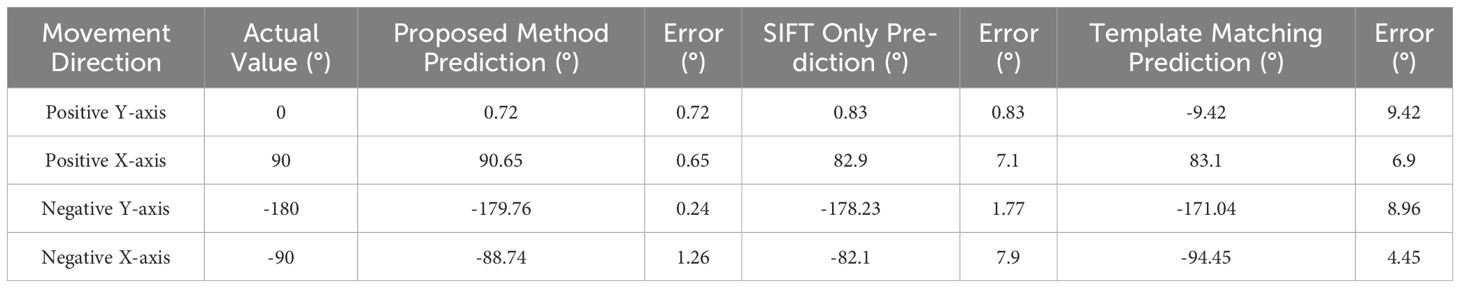
Table 4. Comparison of wave direction measurement results on the six-degree-of-freedom platform.
The experimental results shown in Figure 15 and the data in Table 4 clearly indicate that the proposed method has a significant advantage in the accuracy of wave direction calculation, especially when there is a change in the depth (X-axis) of the six-degree-of-freedom platform. The results demonstrate that the proposed method maintains higher accuracy during platform depth adjustments or in complex motion scenarios. Future research could further explore the algorithm’s applicability in more complex environments, aiming to promote its application and development in real-world engineering.
This paper presents a method for calculating wave parameters using the principles of binocular vision. To address the issues of discontinuity in disparity maps and insufficient accuracy generated by traditional stereo matching methods, this study proposes the use of the PSM-Net, based on deep learning, for stereo matching to obtain high-precision depth maps and enhance overall accuracy. To overcome the limitation of template matching in providing only the two-dimensional motion direction of waves and failing to comprehensively reflect their movement in three-dimensional space, this study introduces the use of the SIFT algorithm in conjunction with stereo matching and three-dimensional reconstruction results to analyze the changes in the three-dimensional coordinates of feature points, thereby inferring the three-dimensional motion direction of the waves. To tackle the high cost and difficulty of simulating multi-directional waves with traditional wave flumes, this paper pro-poses replacing the flume with a six-degree-of-freedom platform to simulate wave motion. Experimental data analysis indicates that the algorithm can accurately estimate wave parameters simulated by the six-degree-of-freedom platform, yielding results with a maximum wave height error of <5%, a maximum period error of <4%, and a wave direction error of <2°, demonstrating high reliability. The successful experiments conducted in the indoor six-degree-of-freedom platform showcase its potential for re-al-world applications, providing a solid foundation for further research and development of binocular vision-based wave parameter measurement technology.
Although this study has achieved preliminary results, there are still several areas that require further exploration and improvement. Firstly, the current methods primarily focus on indoor wave simulation. While the six-degree-of-freedom platform experiment effectively simulates certain wave motion scenarios, real-world marine observations often face challenges such as adverse weather conditions, which can degrade camera image quality and affect image processing algorithms. Additionally, although the proposed method demonstrates high accuracy, real-time processing of stereo images remains a challenge in large-scale marine environments. Future work could focus on improving real-time wave parameter estimation through hardware acceleration or algorithm optimization. In conclusion, this research offers an effective solution for wave parameter measurement, yet there is significant potential for further development to enable broader application in real-world conditions.
The raw data supporting the conclusions of this article will be made available by the authors, without undue reservation.
JW: Investigation, Methodology, Software, Validation, Writing – original draft. SC: Conceptualization, Data curation, Formal analysis, Funding acquisition, Investigation, Project administration, Resources, Supervision, Writing – review & editing. SL: Formal analysis, Project administration, Software, Supervision, Writing – review & editing. MS: Conceptualization, Formal analysis, Project administration, Resources, Supervision, Writing – review & editing. BW: Conceptualization, Project administration, Supervision, Writing – review & editing. QZ: Conceptualization, Formal analysis, Software, Writing – original draft. YW: Supervision, Validation, Writing – review & editing. ZL: Data curation, Formal analysis, Writing – review & editing. JZ: Supervision, Validation, Writing – review & editing. XY: Supervision, Validation, Writing – review & editing. BM: Supervision, Validation, Writing – review & editing.
The author(s) declare that financial support was received for the research, authorship, and/or publication of this article. This work is supported by the National Key Research and Development Program (2022YFC3104201), National Natural Science Foundation of China (41976179).
We would like to especially thank all teams involved in the research and development for their help.
The authors declare that the research was conducted in the absence of any commercial or financial relationships that could be construed as a potential conflict of interest.
The author(s) declare that no Generative AI was used in the creation of this manuscript.
All claims expressed in this article are solely those of the authors and do not necessarily represent those of their affiliated organizations, or those of the publisher, the editors and the reviewers. Any product that may be evaluated in this article, or claim that may be made by its manufacturer, is not guaranteed or endorsed by the publisher.
Banner M. L., Jones I. S. F., Trinder J. C. (1989). Wavenumber spectra of short gravity waves. J. Fluid Mechanics 198, 321–344. doi: 10.1017/S0022112089000157
Benetazzo A. (2006). Measurements of short water waves using stereo matched image sequences. Coast. Eng. 53, 1013–1032. doi: 10.1016/j.coastaleng.2006.06.012
Bergamasco F., Torsello A., Sclavo M., Barbariol F., Benetazzo A. (2017). WASS: An open-source pipeline for 3D stereo reconstruction of ocean waves. Comput. Geosciences 107, 28–36. doi: 10.1016/j.cageo.2017.07.001
Cao C., Bao L., Gao G., Liu G., Zhang X. (2024). A novel method for ocean wave spectra retrieval using deep learning from Sentinel-1 wave mode data. IEEE Trans. Geosci. Remote Sens. 62, 1–16. doi: 10.1109/TGRS.2024.3369080
Cao Z., Wang Y., Zheng W., Yin L., Tang Y., Miao W., et al. (2022). The algorithm of stereo vision and shape from shading based on endoscope imaging. Biomed. Signal Process. Control 76, 103658. doi: 10.1016/j.bspc.2022.103658
Chang J. R., Chen Y. S. (2018). “Pyramid stereo matching network,” in Proceedings of the IEEE Conference on Computer Vision and Pattern Recognition. IEEE. 5410–5418. doi: 10.1109/CVPR.2018.00567
Chowdhury M. S., Rahman K. S., Selvanathan V., Nuthammachot N., Suklueng M., Mostafaeipour A., et al. (2021). Current trends and prospects of tidal energy technology. Environment Dev. Sustainability 23, 8179–8194. doi: 10.1007/s10668-020-01013-4
Fan R., Wang L., Bocus M. J., Pitas I. (2020). Computer stereo vision for autonomous driving. arXiv:2012.03194 [cs.CV]. doi: 10.48550/arXiv.2012.03194
Gao G., Bai Q., Zhang C., Zhang L., Yao L. (2023a). Dualistic cascade convolutional neural network dedicated to fully PolSAR image ship detection. ISPRS J. Photogrammetry Remote Sens. 202, 663–681. doi: 10.1016/j.isprsjprs.2023.07.006
Gao G., Yao B., Li Z., Duan D., Zhang X. (2024). Forecasting of sea surface temperature in Eastern Tropical Pacific by a hybrid multiscale spatial–temporal model combining error correction map. IEEE Trans. Geosci. Remote Sens. 62, 1–22. doi: 10.1109/TGRS.2024.3353288
Gao G., Yao L., Li W., Zhang L., Zhang M. (2023b). Onboard information fusion for multisatellite collaborative observation: Summary, challenges, and perspectives. IEEE Geosci. Remote Sens. Magazine 11, 40–59. doi: 10.1109/MGRS.2023.3274301
Gao G., Zhou P., Yao L., Liu J., Zhang C., Duan D. (2023c). A bi-prototype BDC metric network with lightweight adaptive task attention for few-shot fine-grained ship classification in remote sensing images. IEEE Trans. Geosci. Remote Sens. 61, 1–16. doi: 10.1109/TGRS.2023.3321533
He P., Hu D., Hu Y. (2022). Deployment of a deep-learning based multi-view stereo approach for measurement of ship shell plates. Ocean Eng. 260, 111968. doi: 10.1016/j.oceaneng.2022.111968
Hirschmuller H. (2007). Stereo processing by semiglobal matching and mutual information. IEEE Trans. Pattern Anal. Mach. Intell. 30, 328–341. doi: 10.1109/TPAMI.2007.1166
Kandimalla V., Richard M., Smith F., Quirion J., Torgo L., Whidden C. (2022). Automated detection, classification and counting of fish in fish passages with deep learning. Front. Mar. Sci. 8, 823173. doi: 10.3389/fmars.2021.823173
Li J., Chen R., Wang S., Mao H., He Y., Sui D., et al. (2012). Trends in international marine observation technology development and the practice of deep-sea station construction in China. J. Trop. Oceanography 02, 123–133. Available at: https://kns.cnki.net/kcms2/article/abstract?v=92B8ThN9IcuClrvzntcCzCwVELaLiAYANNXmVjJx5kxrNWC_cPKovm0UnhmK_8V8asYsYnG4vxSNyiqIyLh81ncG1AB33r2S-I0Qxecko4tkOB2G_ZfrHJ-_RIk0duQeDuUvEQD12BeDXhSTkqc6kbRg7pC-RXhkuCA_okZm_WHIB93Mu6pdTMWHbE6dDuod&uniplatform=NZKPT&language=CHS (Accessed December 14, 2024).
Lin M., Yang C. (2020). Ocean observation technologies: A review. Chin. J. Mechanical Eng. 33, 32. doi: 10.1186/s10033-020-00449-z
Lowe D. G. (2004). Distinctive image features from scale-invariant keypoints. Int. J. Comput. Vision 60, 91–110. doi: 10.1023/B:VISI.0000029664.99615.94
Mayer N., Ilg E., Häusser P., Fischer P., Dosovitskiy A., Brox T. (2016). “A large dataset to train convolutional networks for disparity, optical flow, and scene flow estimation,” in Proceedings of the IEEE Conference on Computer Vision and Pattern Recognition (CVPR). IEEE. 4040–4048. doi: 10.1109/CVPR.2016.438
Nie W. (2020). Research on wave elevation measurement method and 3D visualization technology based on binocular vision (Master's thesis, Harbin Engineering University). China Natl. Knowledge Infrastructure. doi: 10.27060/d.cnki.ghbcu.2020.001047
Raveendran S., Patil M. D., Birajdar G. K. (2021). Underwater image enhancement: a comprehensive review, recent trends, challenges and applications. Artif. Intell. Rev. 54, 5413–5467. doi: 10.1007/s10462-021-10025-z
Shemdin O. H., Tran H. M. (1992). Measuring short surface waves with stereophotography. Photogrammetric Eng. Remote Sens. 58, 311–316. doi: 10.1109/OCEANS.1990.584829
Shemdin O. H., Wu S. (1988). Directional measurement of short ocean waves with stereophotography. J. Geophysical Research: Oceans 93, 13891–13901. doi: 10.1029/JC093iC11p13891
Shi L., Zhu H., Yu Y. (2019). Research on wave parameter telemetry method based on binocular stereo vision. J. Electronic Measurement Instrumentation 33, 99–104. doi: 10.13382/j.jemi.B1801549
Sun H., Wu G., Wang X., Zhang T., Zhang P., Chen W., et al. (2022). Research on a measurement method for the ocean wave field based on stereo vision. Appl. Sci. 12, 7447. doi: 10.3390/app12157447
Tani S., Ruscio F., Bresciani M., Nordfeldt B. M., Bonin-Font F., Costanzi R. (2023). Development and testing of a navigation solution for Autonomous Underwater Vehicles based on stereo vision. Ocean Eng. 280, 114757. doi: 10.1016/j.oceaneng.2023.114757
Wang Z. (2021). Research on wave parameter observation technology based on binocular vision (Master's thesis, Harbin Engineering University). China Natl. Knowledge Infrastructure. doi: 10.27060/d.cnki.ghbcu.2021.001155
Yan L. (2017). Long-distance wave measurement based on 3D image measurement technology. (Master's thesis, Nanjing University of Science and Technology). China National Knowledge Infrastructure. Available at: https://kns.cnki.net/kcms2/article/abstract?v=ufuULlVWCsNqBVOcqdKJh2KqZinolM0oxTxYZ9oEuTP0YePSffKX0BKIjKGAc-shV7Mw3RP69tgKVaZxqdPl9vEC96sIjcvEjO09Drp3zseRimVvWpjqNVu7T-PZI85axP_J05qloth29uLQCS_3QMgHz-2IhXsbPgNh6eEKijvoSZvnaBuIZDV8XwHWH-Rvm7V3mjXzTLbQ=&uniplatform=NZKPT&language=CHS (Accessed December 14, 2024).
Yang Y., Hui L., Wan J. (2018). Design of an acoustic wave gauge based on ATxmega256A1. Meteorological Hydrological Mar. Instruments 35, 32–36. doi: 10.19441/j.cnki.issn1006-009x.2018.02.009
Zhang Z. (2000). “Flexible camera calibration by viewing a plane from unknown orientations,” in Proceedings of the IEEE Computer Society Conference on Computer Vision and Pattern Recognition. IEEE. 666–673. doi: 10.1109/ICCV.1999.791289
Zhang C., Zhang X., Gao G., Lang H., Liu G., Cao C., et al. (2024). Development and application of ship detection and classification datasets: A review. IEEE Geosci. Remote Sens. Magazine. 12, 12–45. doi: 10.1109/MGRS.2024.3450681
Zhang X., Gao G., Chen S.-W. (2024). Polarimetric autocorrelation matrix: A new tool for joint characterizing of target polarization and Doppler scattering mechanism. IEEE Trans. Geosci. Remote Sensing 62, 1–22. doi: 10.1109/TGRS.2024.3398632
Zhang L., Gao G., Chen C., Gao S., Yao L. (2022). Compact polarimetric synthetic aperture radar for target detection: A review. IEEE Geosci. Remote Sens. Magazine 10, 115–152. doi: 10.1109/MGRS.2022.3186904
Zhang D., Wang J., Lin Y., Si Y., Huang C., Yang J., et al. (2017). Present situation and future prospect of renewable energy in China. Renewable Sustain. Energy Rev. 76, 865–871. doi: 10.1016/j.rser.2017.03.023
Keywords: stereo vision, deep learning, stereo matching, feature matching, wave parameter measurement, wave height, wave period, wave direction
Citation: Wu J, Chen S, Liu S, Song M, Wang B, Zhang Q, Wu Y, Lei Z, Zhang J, Yan X and Miao B (2024) Research on wave measurement and simulation experiments of binocular stereo vision based on intelligent feature matching. Front. Mar. Sci. 11:1508233. doi: 10.3389/fmars.2024.1508233
Received: 09 October 2024; Accepted: 09 December 2024;
Published: 23 December 2024.
Edited by:
Xi Zhang, Ministry of Natural Resources, ChinaReviewed by:
Shaowei Zhang, Chinese Academy of Sciences (CAS), ChinaCopyright © 2024 Wu, Chen, Liu, Song, Wang, Zhang, Wu, Lei, Zhang, Yan and Miao. This is an open-access article distributed under the terms of the Creative Commons Attribution License (CC BY). The use, distribution or reproduction in other forums is permitted, provided the original author(s) and the copyright owner(s) are credited and that the original publication in this journal is cited, in accordance with accepted academic practice. No use, distribution or reproduction is permitted which does not comply with these terms.
*Correspondence: Shizhe Chen, Y2hlbnN6QHFsdS5lZHUuY24=
Disclaimer: All claims expressed in this article are solely those of the authors and do not necessarily represent those of their affiliated organizations, or those of the publisher, the editors and the reviewers. Any product that may be evaluated in this article or claim that may be made by its manufacturer is not guaranteed or endorsed by the publisher.
Research integrity at Frontiers
Learn more about the work of our research integrity team to safeguard the quality of each article we publish.