- 1No.8 Institute of Geology and Mineral Resources Exploration of Shandong Province, Key Laboratory of Nonferrous Metal Ore Exploration and Resource Evaluation of Shandong Provincial Bureau of Geology and Mineral Resources, Shandong, Rizhao, China
- 2Rizhao Big Data Research Institute of Geology and Geographic Information, Shandong, Rizhao, China
- 3Rizhao Key Laboratory of Land Quality Evaluation And Pollution Remediation, Rizhao, China
- 4College of Earth Science and Engineering, Shandong University of Science and Technology, Qingdao, China
- 5Key Laboratory of Gold Mineralization Processes and Resource Utilization of Ministry of Natural Resources of the People’s Republic of China, Jinan, China
- 6Shandong Provincial Key Laboratory of Metallogenic Geological Process and Resource Utilization, Jinan, China
In light of ongoing global warming and the accelerated melting of Antarctic sea ice, this study aims to analyze the recent changes in the principal modes of Antarctic sea ice over the past decade, utilizing Empirical Orthogonal Function (EOF) and Singular Value Decomposition (SVD) techniques. The results indicate that Antarctic sea ice has shifted from a growth trend of 1.7% per year in the previous decade to a melting trend in almost all regions, except the Amundsen Sea. The decline is particularly pronounced during autumn and winter, with rates of -7.1% and -6.5% per year, respectively. The Weddell Sea and West Pacific exhibit the fastest declines at -6.1% and -5.8% per year, leading to an overall average melting trend of -4.6% per year. Furthermore, the dominant mode of Antarctic sea ice has shifted from the Antarctic Dipole (ADP) pattern in the previous decade to a melting trend in the most recent period. This transition is closely linked to the increase in sea surface temperatures (SST) and surface air temperatures (SAT) in the Southern Ocean, which contribute to the pronounced ice melt observed in recent years. This research enhances our understanding of Antarctic sea ice dynamics and provides valuable insights for future studies on sea ice variability and prediction.
1 Introduction
Antarctic sea ice plays a pivotal role in the global climate system, influencing major climatic and oceanic processes through its modulation of radiative fluxes, heat, and momentum exchanges between the ocean and atmosphere (Porter et al., 2011; Peterson et al., 2017; Smith et al., 2017), which acts as an early indicator of climate change (Simpkins et al., 2012; Bintanja et al., 2013). The seasonal cycle of sea ice, expanding and contracting over 16 million square kilometers annually (Bonan et al., 2024), affects Southern Ocean productivity, carbon exchange, cloud dynamics and also global ocean circulation through mechanisms like brine rejection and freshwater input (Smith and Comiso, 2008; Fogwill et al., 2020; DuVivier et al., 2021). Antarctic sea ice differs significantly from Arctic patterns. While Arctic sea ice has shown a consistent decline since 1979 (Wang et al., 2019a; Wang et al., 2022a), Antarctic sea ice experienced a modest increase from 1979 to 2014 (Turner et al., 2017), a sharp decline in 2016 (Parkinson, 2019), reaching unprecedented lows in 2022 and 2023 (Liu et al., 2023), suggesting a possible transition to a new sea ice state that has intensified scientific scrutiny (Eayrs et al., 2021; Fogt et al., 2022; Purich and Doddridge, 2023).
Various mechanisms have been proposed to explain the slow growth and rapid decline of the total Antarctic Sea Ice Extent (SIE). The expansion of SIE has been associated with a deepened Amundsen Sea Low (ASL), a positive Southern Annular Mode (SAM), a negative phase of the Interdecadal Pacific Oscillation (IPO), and strengthened circumpolar westerlies that cool the surface through enhanced northward Ekman heat transport (Liu and Curry, 2010; Holland and Kwok, 2012; Fan et al., 2014; Meehl et al., 2016; Turner et al., 2016). Additionally, increased freshwater input from ice shelf melt, combined with changes in precipitation and evaporation, is thought to enhance subsurface stratification. This stratification inhibits warm deep waters from reaching the surface, thereby contributing to sea ice growth (Bintanja et al., 2013; Pauling et al., 2016; Sadai et al., 2020).
Since 2015, Antarctic SIE has undergone a significant decline, driven by a combination of dynamic and thermodynamic factors. One prominent driver was the emergence of a prominent quasi-stationary wavenumber-3 pattern (ZW3), which facilitated anomalous poleward heat and moisture transport, resulting in significant ice loss, particularly in the Indian Ocean, West Pacific, and Bellingshausen Sea sectors (Turner et al., 2017; Schlosser et al., 2018; Wang et al., 2019). Weakened circumpolar westerlies and stratospheric vortex anomalies, influenced by the variability of ENSO, the Indian Ocean Dipole (IOD), and SAM, also played key roles in this decline (Stuecker et al., 2017; Schlosser et al., 2018; Purich and England, 2019; Wang et al., 2019). Furthermore, subsurface heat accumulation in the Southern Ocean, particularly in the Weddell and Ross Seas, contributed to sea ice retreat due to oceanic preconditioning (Meehl et al., 2019; Zhang et al., 2022).
While previous studies have extensively analyzed changes and mechanisms in Antarctic sea ice variability, they primarily focused on extreme events, such as the record-low SIE in 2016, 2022, and 2023, or the long-term trend from 1979 to 2014. However, the decadal changes of the primary modes of sea ice concentration (SIC) variability remain understudied. Antarctic sea ice exhibits significant variability, particularly in the Antarctic Dipole (ADP) region, driven by complex interactions among ENSO, SAM, ASL, ZW3, anthropogenic forcing, ozone depletion, and Pacific and Atlantic decadal variability through both dynamic and thermodynamic processes (Turner et al., 2009; Thompson and Solomon, 2002; Yuan and Li, 2008; Pezza et al., 2012; Turner et al., 2016; Scott et al., 2019; Wang et al., 2019b; Wang et al., 2022c).
To address this, our study systematically investigates the decadal changes in the dominant modes of Antarctic sea ice variability. Using Empirical Orthogonal Function (EOF) analysis, we compare SIC variability patterns between two decades: 2004–2013 (P1) and 2014–2023 (P2). EOF analysis extracts the leading spatial and temporal variability modes, representing the key signals embedded in the SIC dataset. By quantifying the variance explained by these modes and analyzing their spatial and temporal characteristics, we identify significant decadal changes in the primary patterns of Antarctic sea ice variability. Furthermore, we employ Singular Value Decomposition (SVD) analysis to examine the coupled variability between SIC and other key climate drivers. The combined EOF and SVD approaches provide a robust framework for dissecting the spatial and temporal decadal variability of Antarctic sea ice, as well as its dynamic and thermodynamic links to atmospheric and oceanic processes. This analysis provides new insights into the evolving characteristics of Antarctic sea ice and facilitates its prediction in the context of rapid climate change in Antarctica (Wang et al., 2022b; Wang et al., 2023a; Wang et al., 2023b).
2 Data and methods
2.1 Data
Monthly SIC on 25 km × 25 km grids from 1979 to 2020 are obtained from the National Snow and Ice Data Center (NSIDC) (Comiso, 2017). This dataset is produced using brightness temperatures obtained from several sources: the Nimbus-7 Scanning Multichannel Microwave Radiometer (SMMR); the Defense Meteorological Satellite Program (DMSP) satellites F8, F11, and F13 Special Sensor Microwave/Imager (SSM/I); and the DMSP-F17 Special Sensor Microwave Imager/Sounder (SSMIS), all utilizing the bootstrap algorithm. Additionally, the 2-meter air temperature (SAT), 850 hPa geopotential height (Z850), and sea surface temperature (SST) data, which have a spatial resolution of 1° × 1°, are derived from the European Centre for Medium-Range Weather Forecasts (ECMWF) reanalysis product ERA5 (Hersbach et al., 2020). These datasets represent atmospheric and oceanic conditions. ERA5 is generated using version CY41R2 of ECMWF’s Integrated Forecast System (IFS), employing a hybrid incremental 4D-Var approach with 137 hybrid sigma/pressure levels in the vertical, extending to a top level of 0.01 hPa.
2.2 Methods
To extract the leading modes of Antarctic sea ice variability (including trend), an EOF analysis (Kutzbach, 1967; Lorenz, 1956) was conducted. EOF analysis, also known as Principal Component Analysis (PCA), is a statistical technique widely employed in climate studies to transform multidimensional datasets into orthogonal temporal and spatial modes (Preisendorfer and Mobley, 1988). The data processing method for EOF analysis involves several key steps. Initially, the climatology is removed from the time series to focus on anomalies. Each grid point’s time series is then standardized by dividing it by the monthly standard deviation to account for variability and ensure comparability across different regions. Subsequently, an area weighting is applied to the data to appropriately reflect the spatial contribution of each grid cell in the EOF analysis. Eigenvectors represent spatial patterns, while eigenvalues indicate the percentage of variance explained by each mode. Here is an example illustrating the EOF decomposition of SIC:
Let X be the SIC matrix of size m×n, where m represents the number of spatial points and n represents the length of time series. First, the covariance matrix is calculated as:
where is the transpose of X. Next, eigen decomposition is performed on the covariance matrix C, yielding eigenvalues λi and corresponding eigenvectors ei, which satisfy
These eigenvectors ei represent the spatial patterns (eigenvectors) in EOF analysis, while the eigenvalues λi and are used to compute the percentage of variance explained by each mode as:
The time components (principal components, PCs) are computed as follows:
The SVD analysis, also known as Maximum Covariance Analysis (MCA), is a robust decomposition method used to extract the co-variability between two climate fields (Bretherton et al., 1992). We employ SVD to investigate the coupled modes between Antarctic SIC and other climatic factors. Initially, we preprocess the data for both variables like the approach used in EOF analysis. These preprocessed matrices, denoted as S and P, are used to construct a covariance matrix Q = STP. Next, SVD is performed on matrix Q to decompose it into matrices U, L, and V, satisfying Q = ULVT. Expansion coefficients are then determined as A = SU and B = PV. These coefficients describe the temporal characteristics of the coupled patterns. By analyzing the singular values and singular vectors, we can identify the dominant coupled modes and their physical implications.
It is worth noting that both EOF and SVD results generate spatial patterns and their corresponding time components. The spatial patterns represent the spatial structures of variable variability, while the PC time series describe their temporal evolution. Importantly, the sign of a spatial pattern is arbitrary, as multiplying both the spatial pattern and its PC by -1 does not change their physical meaning. Therefore, the spatial pattern and PC time series must be interpreted together to understand the evolution of the mode.
3 Result and Discussion
3.1 Changes in Antarctic sea ice trends and variability
Sea ice variability offers insights into changes and instability, with higher variability indicating more intense Antarctic climate change. Compared to P1, P2 shows a general increase in variability (Figure 1). Seasonally, the Weddell Sea experiences significant variability increases in winter and spring, while the Amundsen Sea sees rises in summer and autumn, between 20% and 40%. The Indian Ocean marginal seas in the cold season and the Ross Sea in the warm season show negative anomalies. Over the past decade, SIE has decreased significantly, while variability in winter (summer) has increased from 0.31 (0.46) million square kilometers during P1 to 0.71 (0.61) million square kilometers in P2, according to data statistics from the NSIDC. This reflects intensified Antarctic and global climate changes in the recent decade.
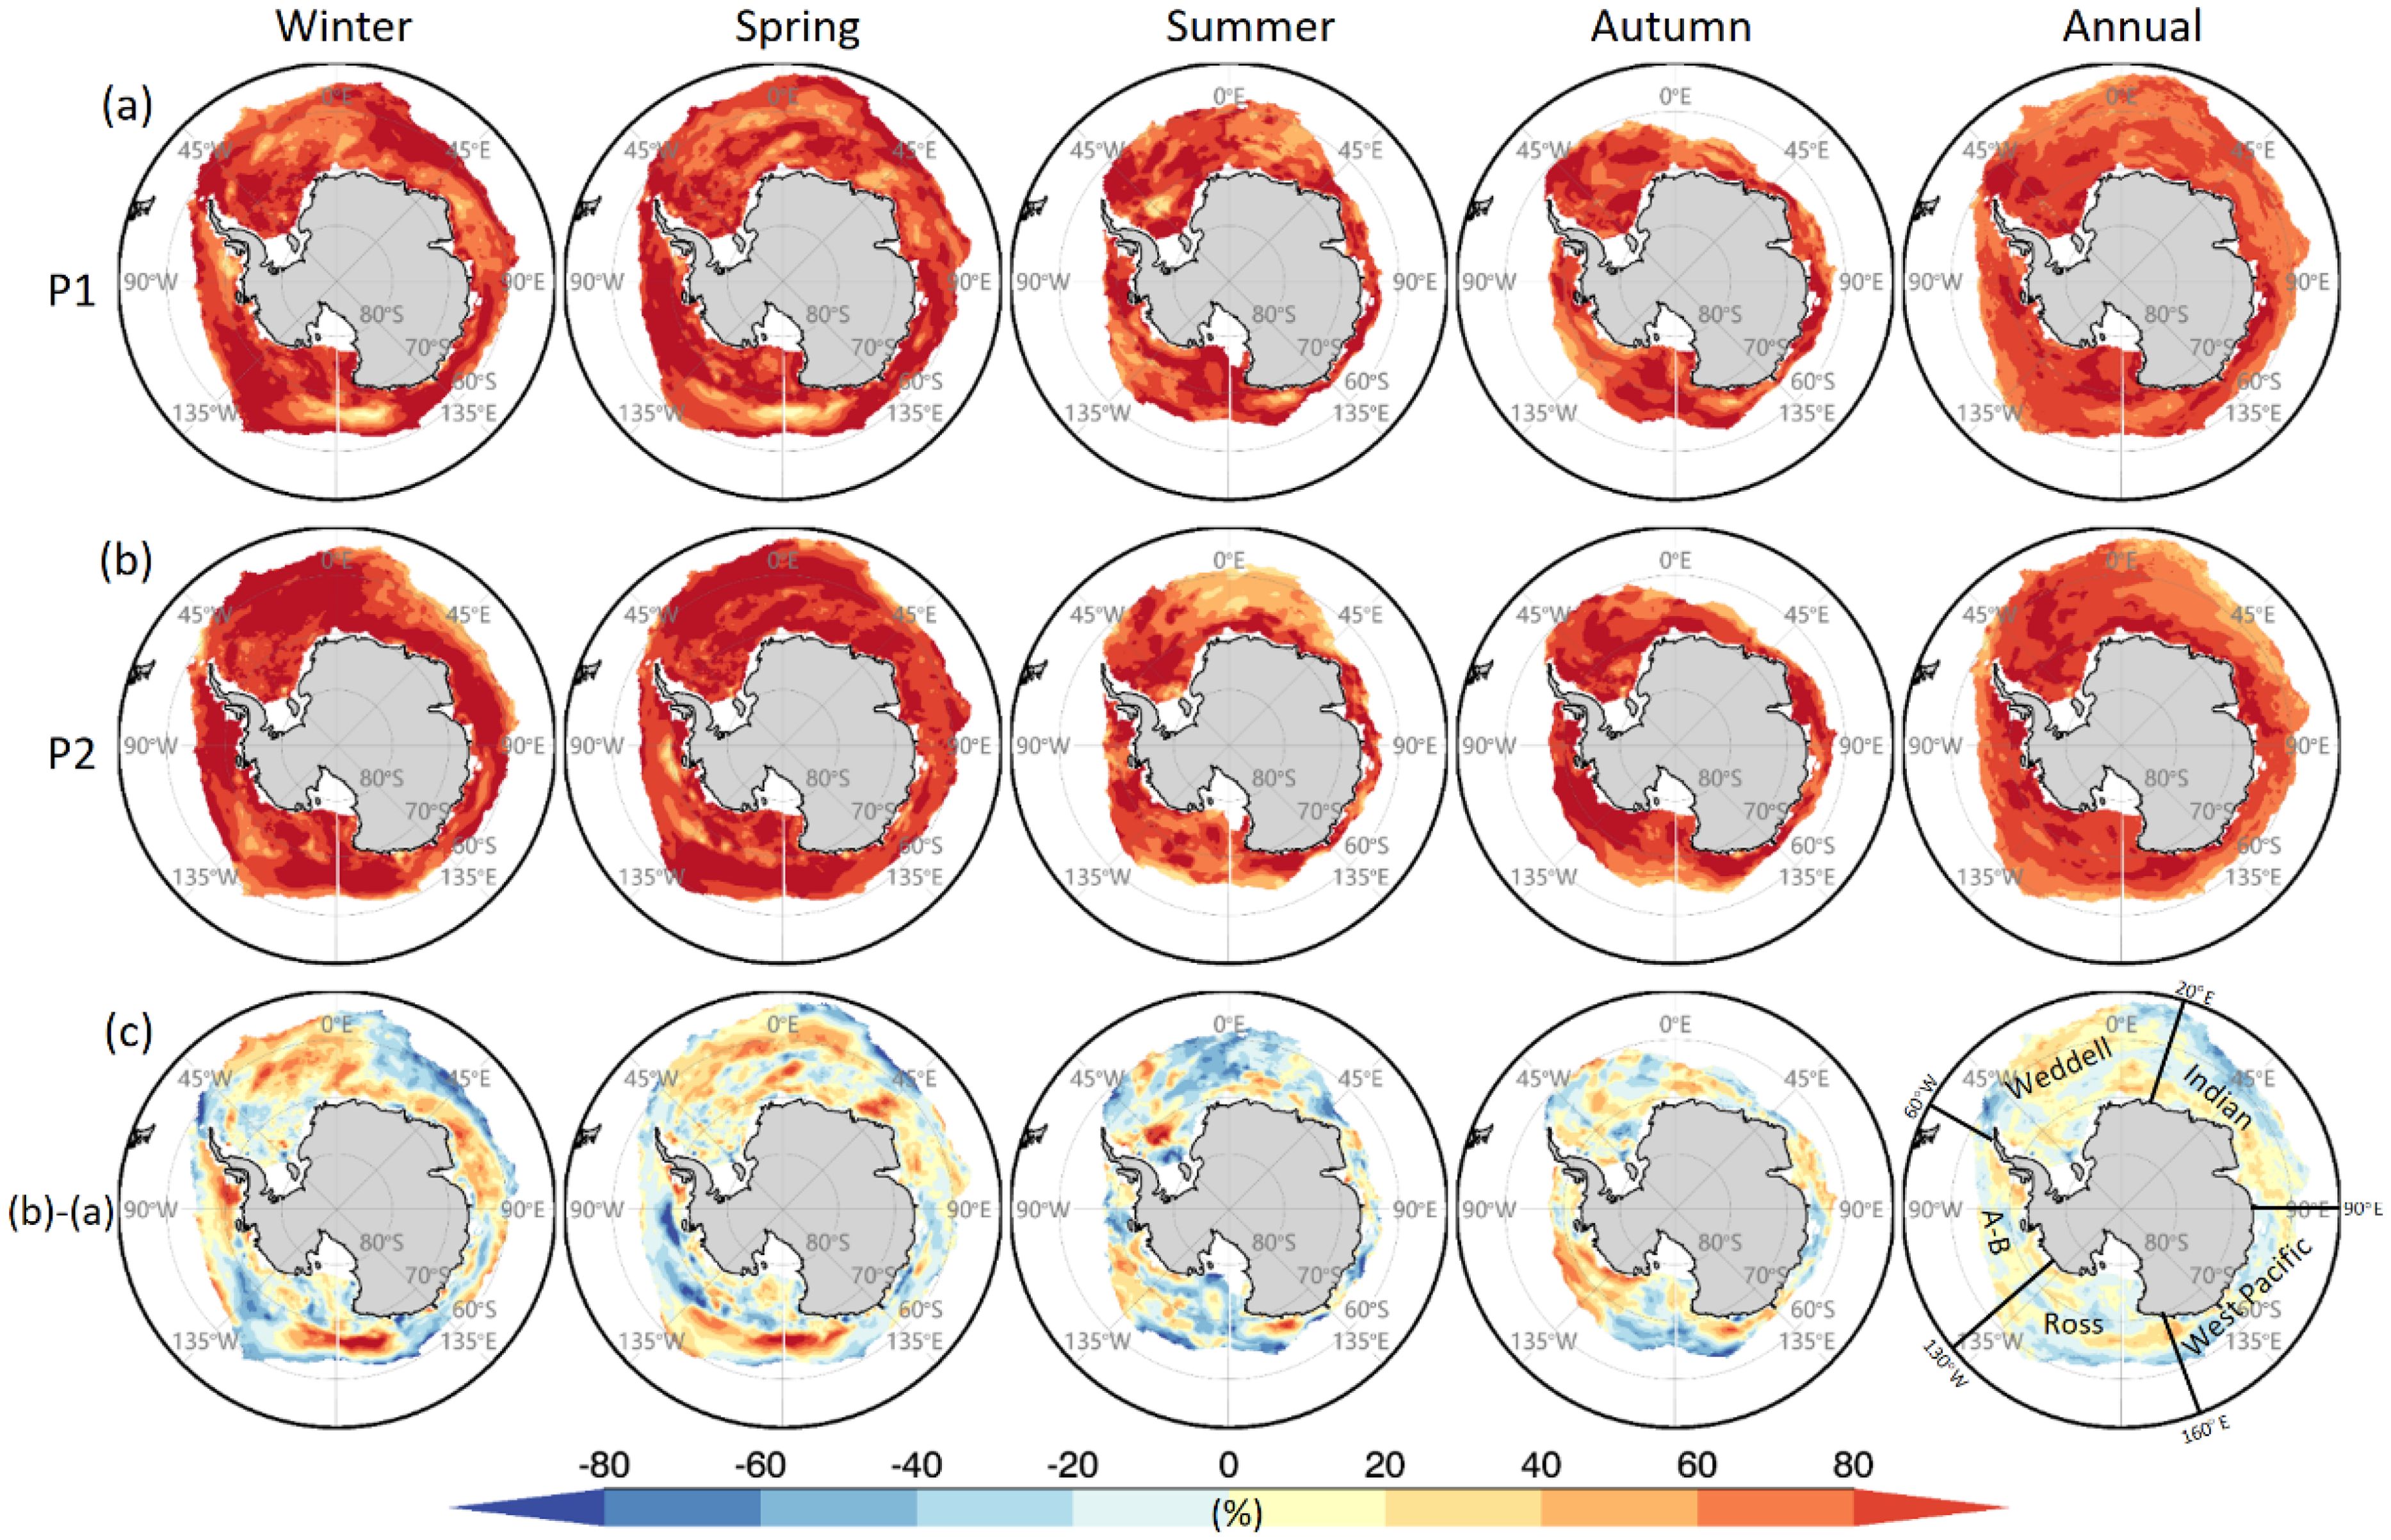
Figure 1. Seasonal variability of Antarctic sea ice. (A) Antarctic sea ice variability in different seasons during the P1 period. (B) Similar to (A) but for the P2. (C) Variability difference between the two decades, obtained by (b) - (a). The Antarctic regions are labeled in the lower-right panel, with “A-B” representing the Amundsen and Bellingshausen Seas.
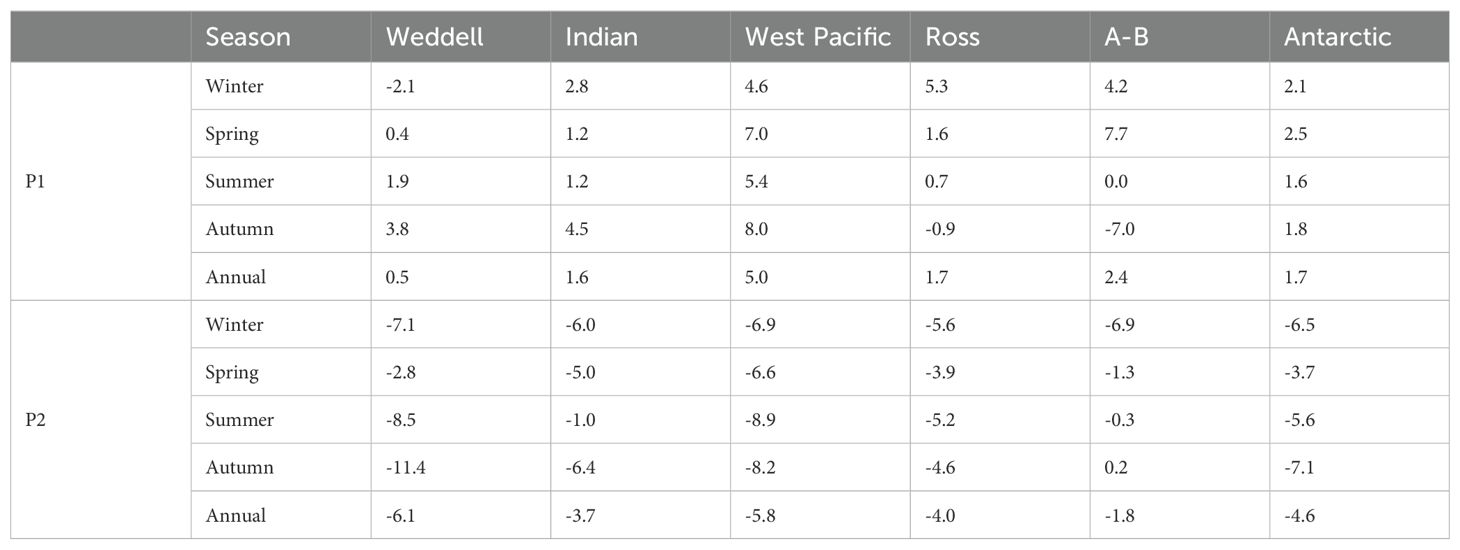
As an interface between the atmosphere and ocean, sea ice blocks moisture and heat transfer, crucial for maintaining ocean mass and energy balance. Changes in sea ice trends highlight shifts in the polar ocean-ice-atmosphere coupling system. Investigating the sea ice changes over the past decade is of great significance for understanding polar and global climate change. During P1, Antarctic sea ice generally grew, except in parts of the Weddell Sea-Indian Ocean sector and Amundsen–Ross Sea interiors (Figure 2A). Table 1 shows the West Pacific had the fastest growth (5.0% per year), especially in autumn (8.0% per year). The A-B (Amundsen and Bellingshausen) region showed intense seasonality, with rapid spring growth (7.7% per year) and autumn melting (-7.0% per year). In P2, most Antarctic regions showed melting, except the Amundsen Sea (Figure 2B). The Weddell Sea had the fastest decline (-6.1% per year), particularly in the freezing period (autumn-winter). Autumn saw the fastest melting across seasons (-11.4% per year). The West Pacific had the second fastest decline (-5.8% per year), especially in the summer melting period (-8.9% per year). The A-B Sea declined the slowest (-1.8% per year), with autumn growth (0.2% per year). Overall, P2 exhibited a pervasive melting trend, fastest in autumn (-7.1% per year) and slowest in spring (-3.7% per year), with an annual change of -4.6% per year. The most notable feature is the widespread Antarctic sea ice decline in the past decade, except for the Amundsen Sea, prompting further exploration of sea ice modes and driving factors behind this trend.
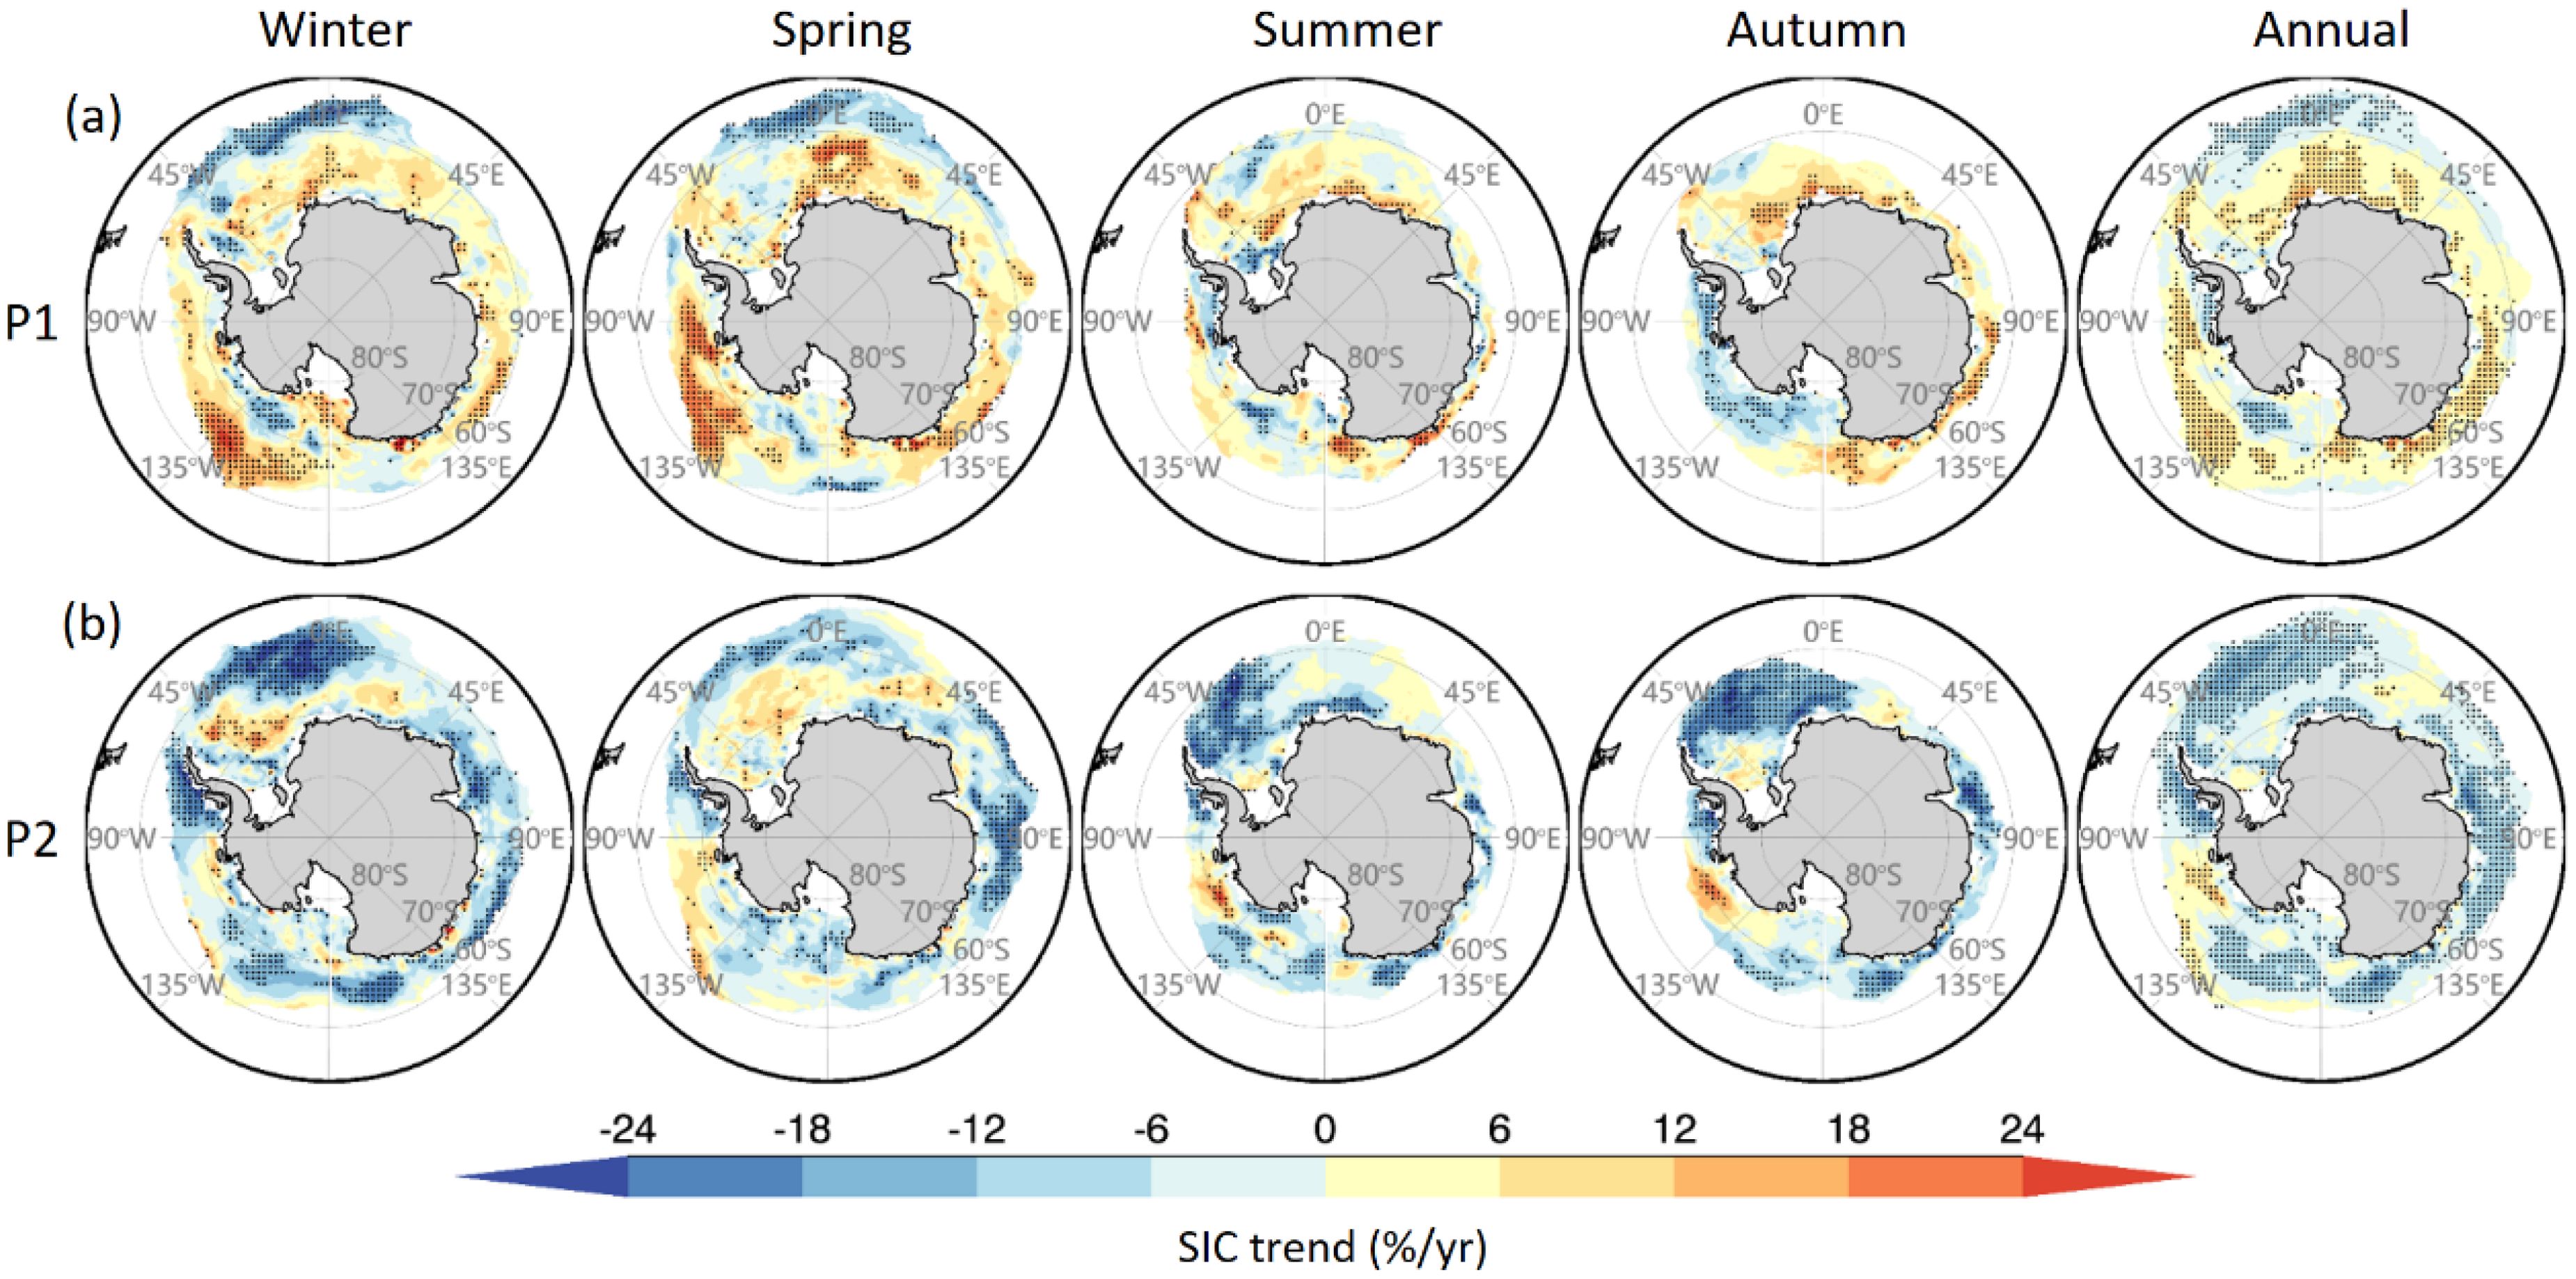
Figure 2. Seasonal trends of Antarctic sea ice. (A) Trends during the P1. (B) Similar to (A) but for the P2. The black dots indicate that the trends have reached a 95% significance level based on the Student’s t-test.
3.2 Shifts in the leading modes of Antarctic sea ice
We use EOF analysis to decompose the modes of Antarctic sea ice over two consecutive decades. Only the first four modes are presented (Figure 3A), as later modes explain less than 5% of the variance and fail to reflect stable physical processes. During P1, the primary mode in the West Antarctic demonstrates the ADP pattern characteristics (Yuan and Martinson, 2001). The ADP has a notable interannual timescale and is characterized by a seesaw effect in sea ice, as well as anomalies in SST and sea level pressure between the Amundsen Sea and the Weddell Sea. This pattern is closely linked to climate modes in the Antarctic region, such as SAM, ASL, and variations in tropical ENSO. The Indian Ocean and West Pacific also show significant negative and positive anomalies, respectively. The second mode exhibits positive anomalies across most of the Antarctic, with only slight negative anomalies along the Weddell Sea and Antarctic Peninsula, representing the sea ice growth trend during P1. The corresponding principal component (PC) time series has a correlation coefficient of 0.71 with Antarctic SIE at a significance level exceeding 99% (Figure 3B). The third mode features a dipole characteristic between the A-B Sea and Ross Sea, while the fourth mode signifies patterns more influenced by zonal circulation, as its anomalies extend farther zonally.

Figure 3. Leading modes of Antarctic sea ice. (A) Spatial component. The percentage in the upper left indicates the explained variance. (B) Temporal component. The dashed line in the plot represents the trend line, and ‘r’ denotes the anomaly correlation coefficient between the time series and the corresponding temporal Antarctic SIE. Both the fitted line and the anomaly correlation coefficient have achieved a significance level of 99%.
In P2, the first mode reflects a melting trend, showing negative anomalies across nearly all regions, except for a positive anomaly in the Amundsen Sea, consistent with the spatial distribution of sea ice trend changes shown in Figure 2B. The correlation coefficient with the rest of the Antarctic SIE is as high as -0.85. This negative value stems from the PC’s positive value indicating a melting trend, opposing the SIE. The second mode shows in-phase anomalies in most of the A-B Sea and Weddell Sea, synchronizing with changes near the Ross Sea and 0° longitude. The third mode depicts dipole oscillations between the Weddell Sea and the Amundsen-Ross Sea margins, differing from the primary mode in P1. The fourth mode highlights dipole oscillations between the Weddell Sea and A-B regions. Consequently, the leading mode of Antarctic sea ice shifts from the ADP pattern in P1 to a melting trend in P2.
Next, we examine seasonal modes in the Antarctic to determine in which season the melting mode occurs. In P1, the leading mode across all four seasons corresponds to the sea ice dipole pattern, indicating its stable presence throughout P1 (Figure 4). The first mode in autumn also illustrates growth trends alongside the dipole feature, showing positive anomalies across most regions except the negative anomalies in the A-B Sea, correlating with a growth trend in its PC time series (Figure 5). The second mode in spring similarly reflects a growth pattern, with most regions displaying positive anomalies, and the PC indicating a growth trend. In P2, the first mode consistently represents the melting trend across all seasons with spatially negative anomalies and a growing PC, aligning with the first annual mode. The explained variance of the first mode exceeds 17% across all seasons, significantly more than the second mode, highlighting the dominant role of melting in P2 Antarctic sea ice. The second mode in winter corresponds to the third annual mode, and the second mode in spring aligns with the second annual mode. The second mode in summer and autumn primarily corresponds to the fourth annual mode. Therefore, both the sea ice ADP pattern in P1 and the melting pattern in P2 exhibit no pronounced seasonality and remain the primary modes throughout their respective periods. This raises a question: why did the ADP pattern, dominant in sea ice variability during P1, nearly vanish in P2, replaced by pervasive sea ice melting? What physical processes and mechanisms underlie this shift?
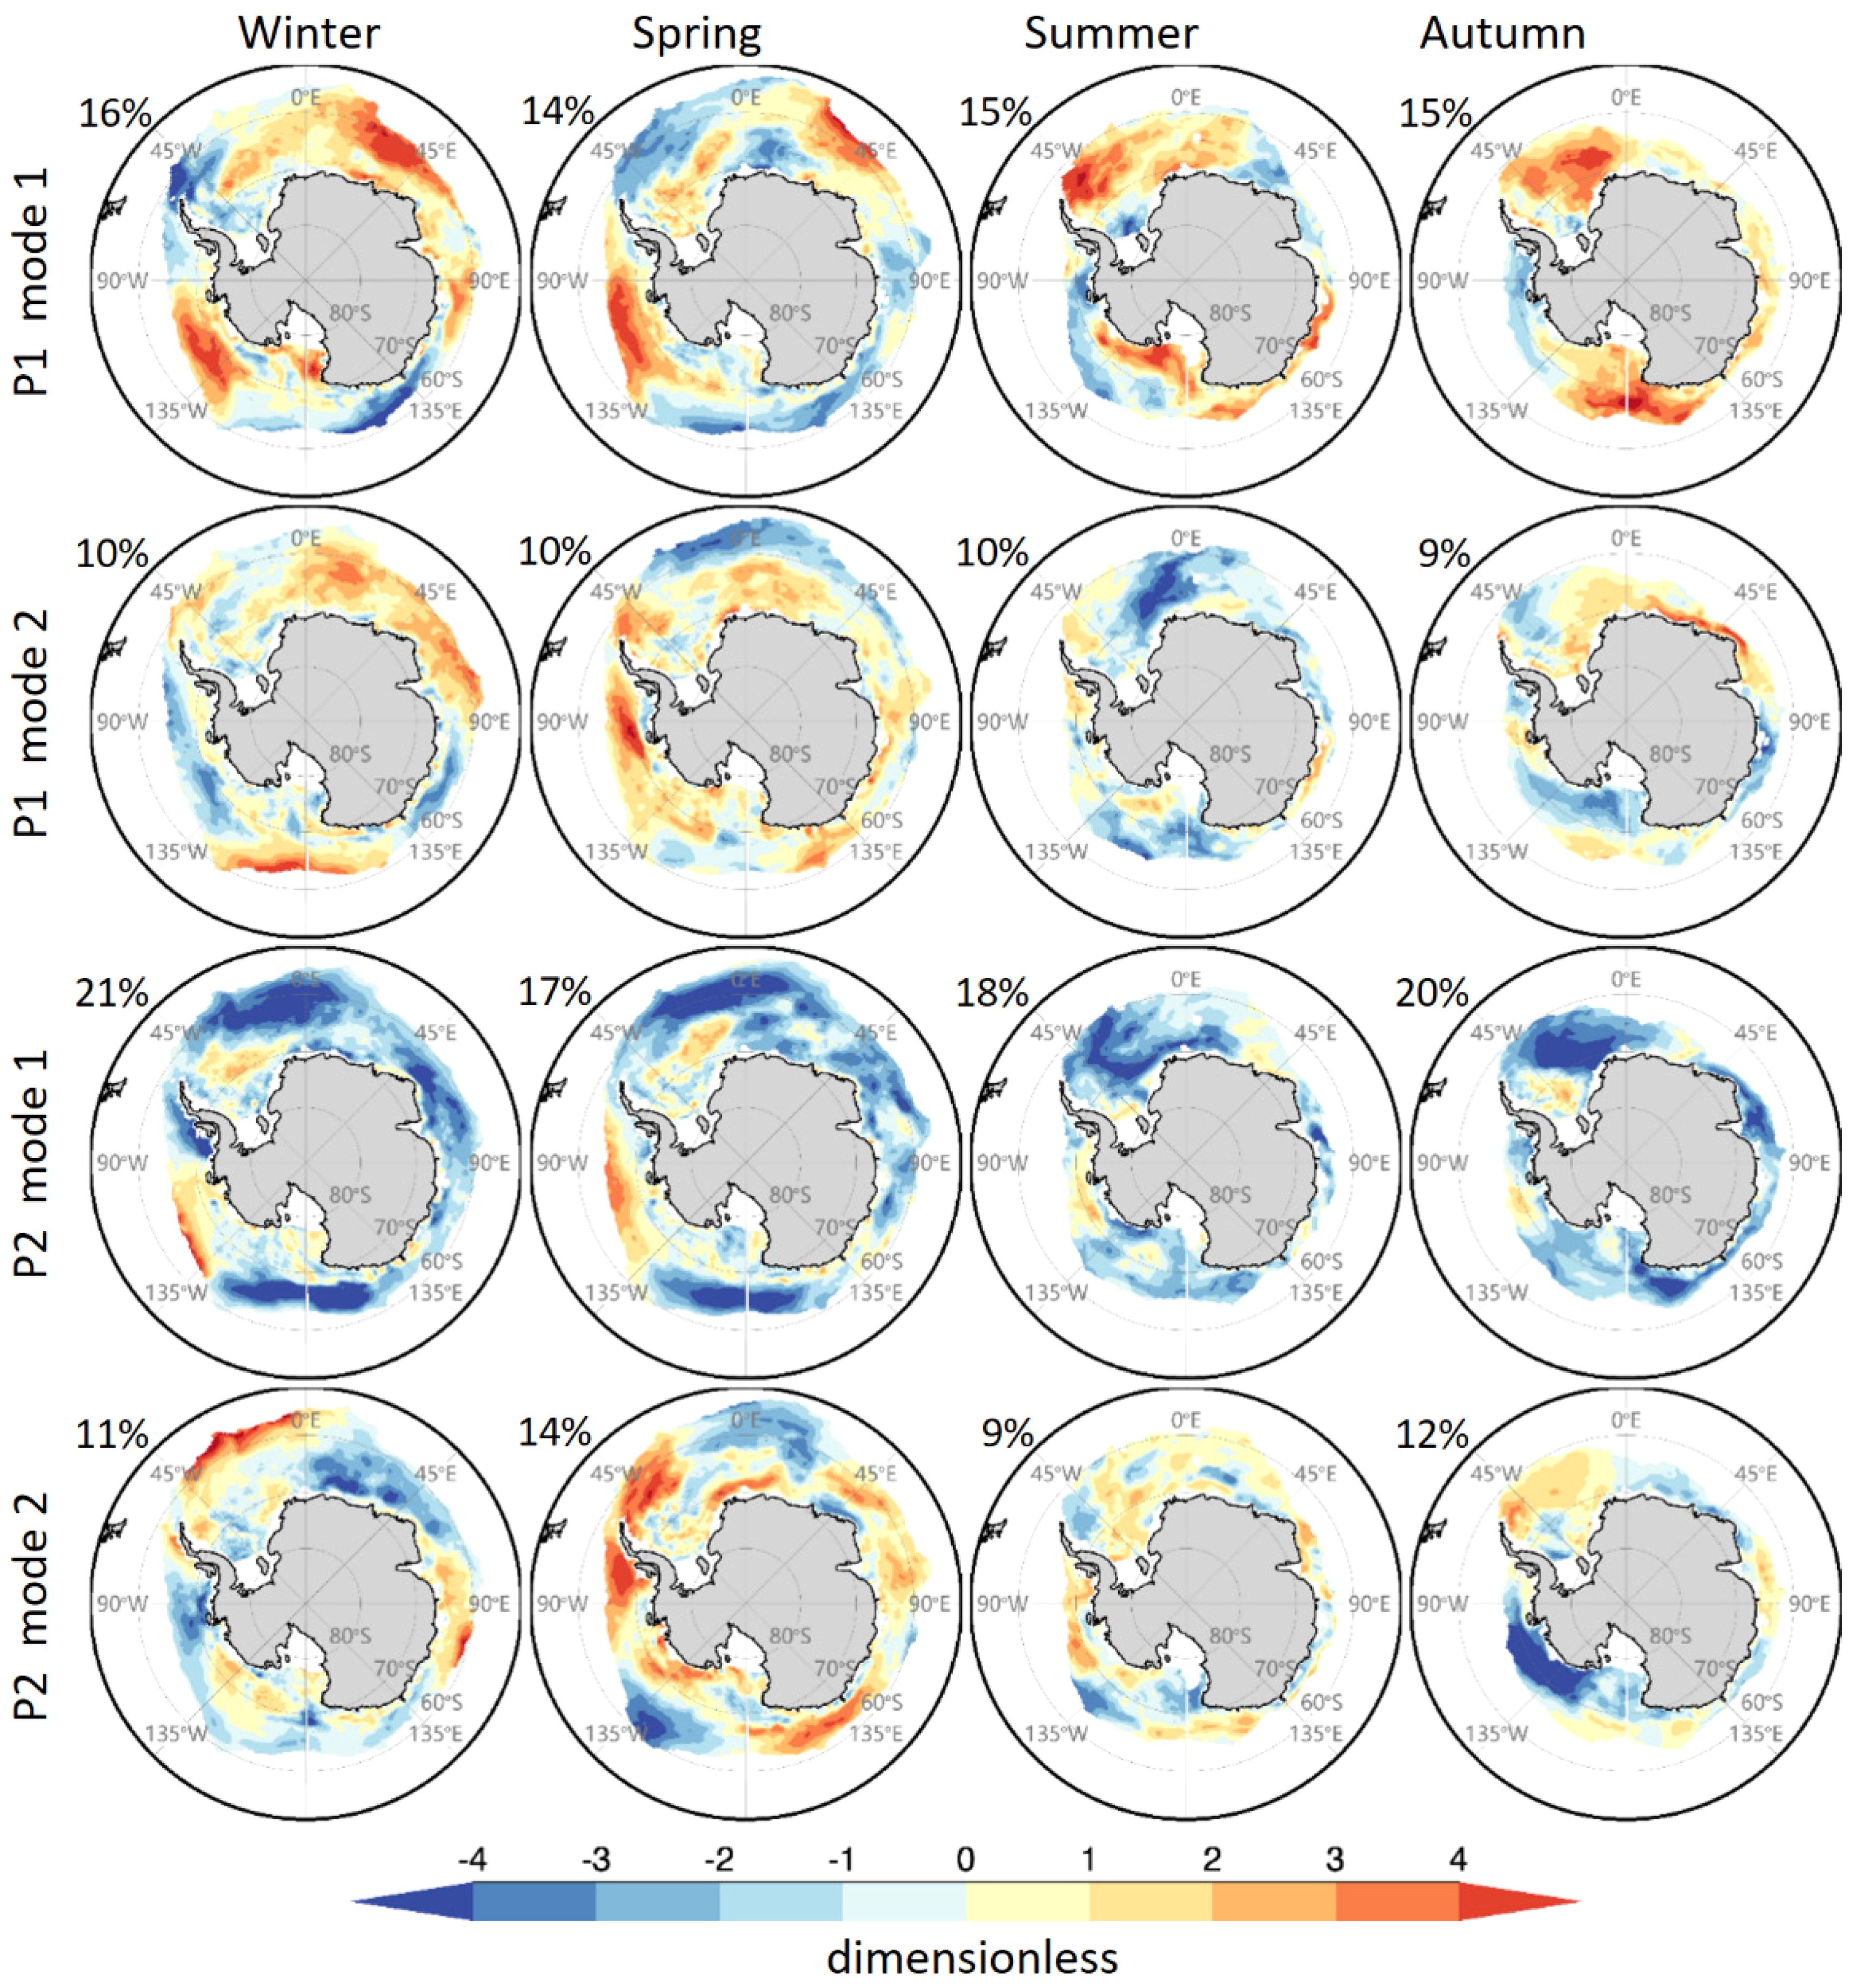
Figure 4. Spatial components of the leading modes of Antarctic sea ice for each season. The percentage in the upper left indicates the explained variance.
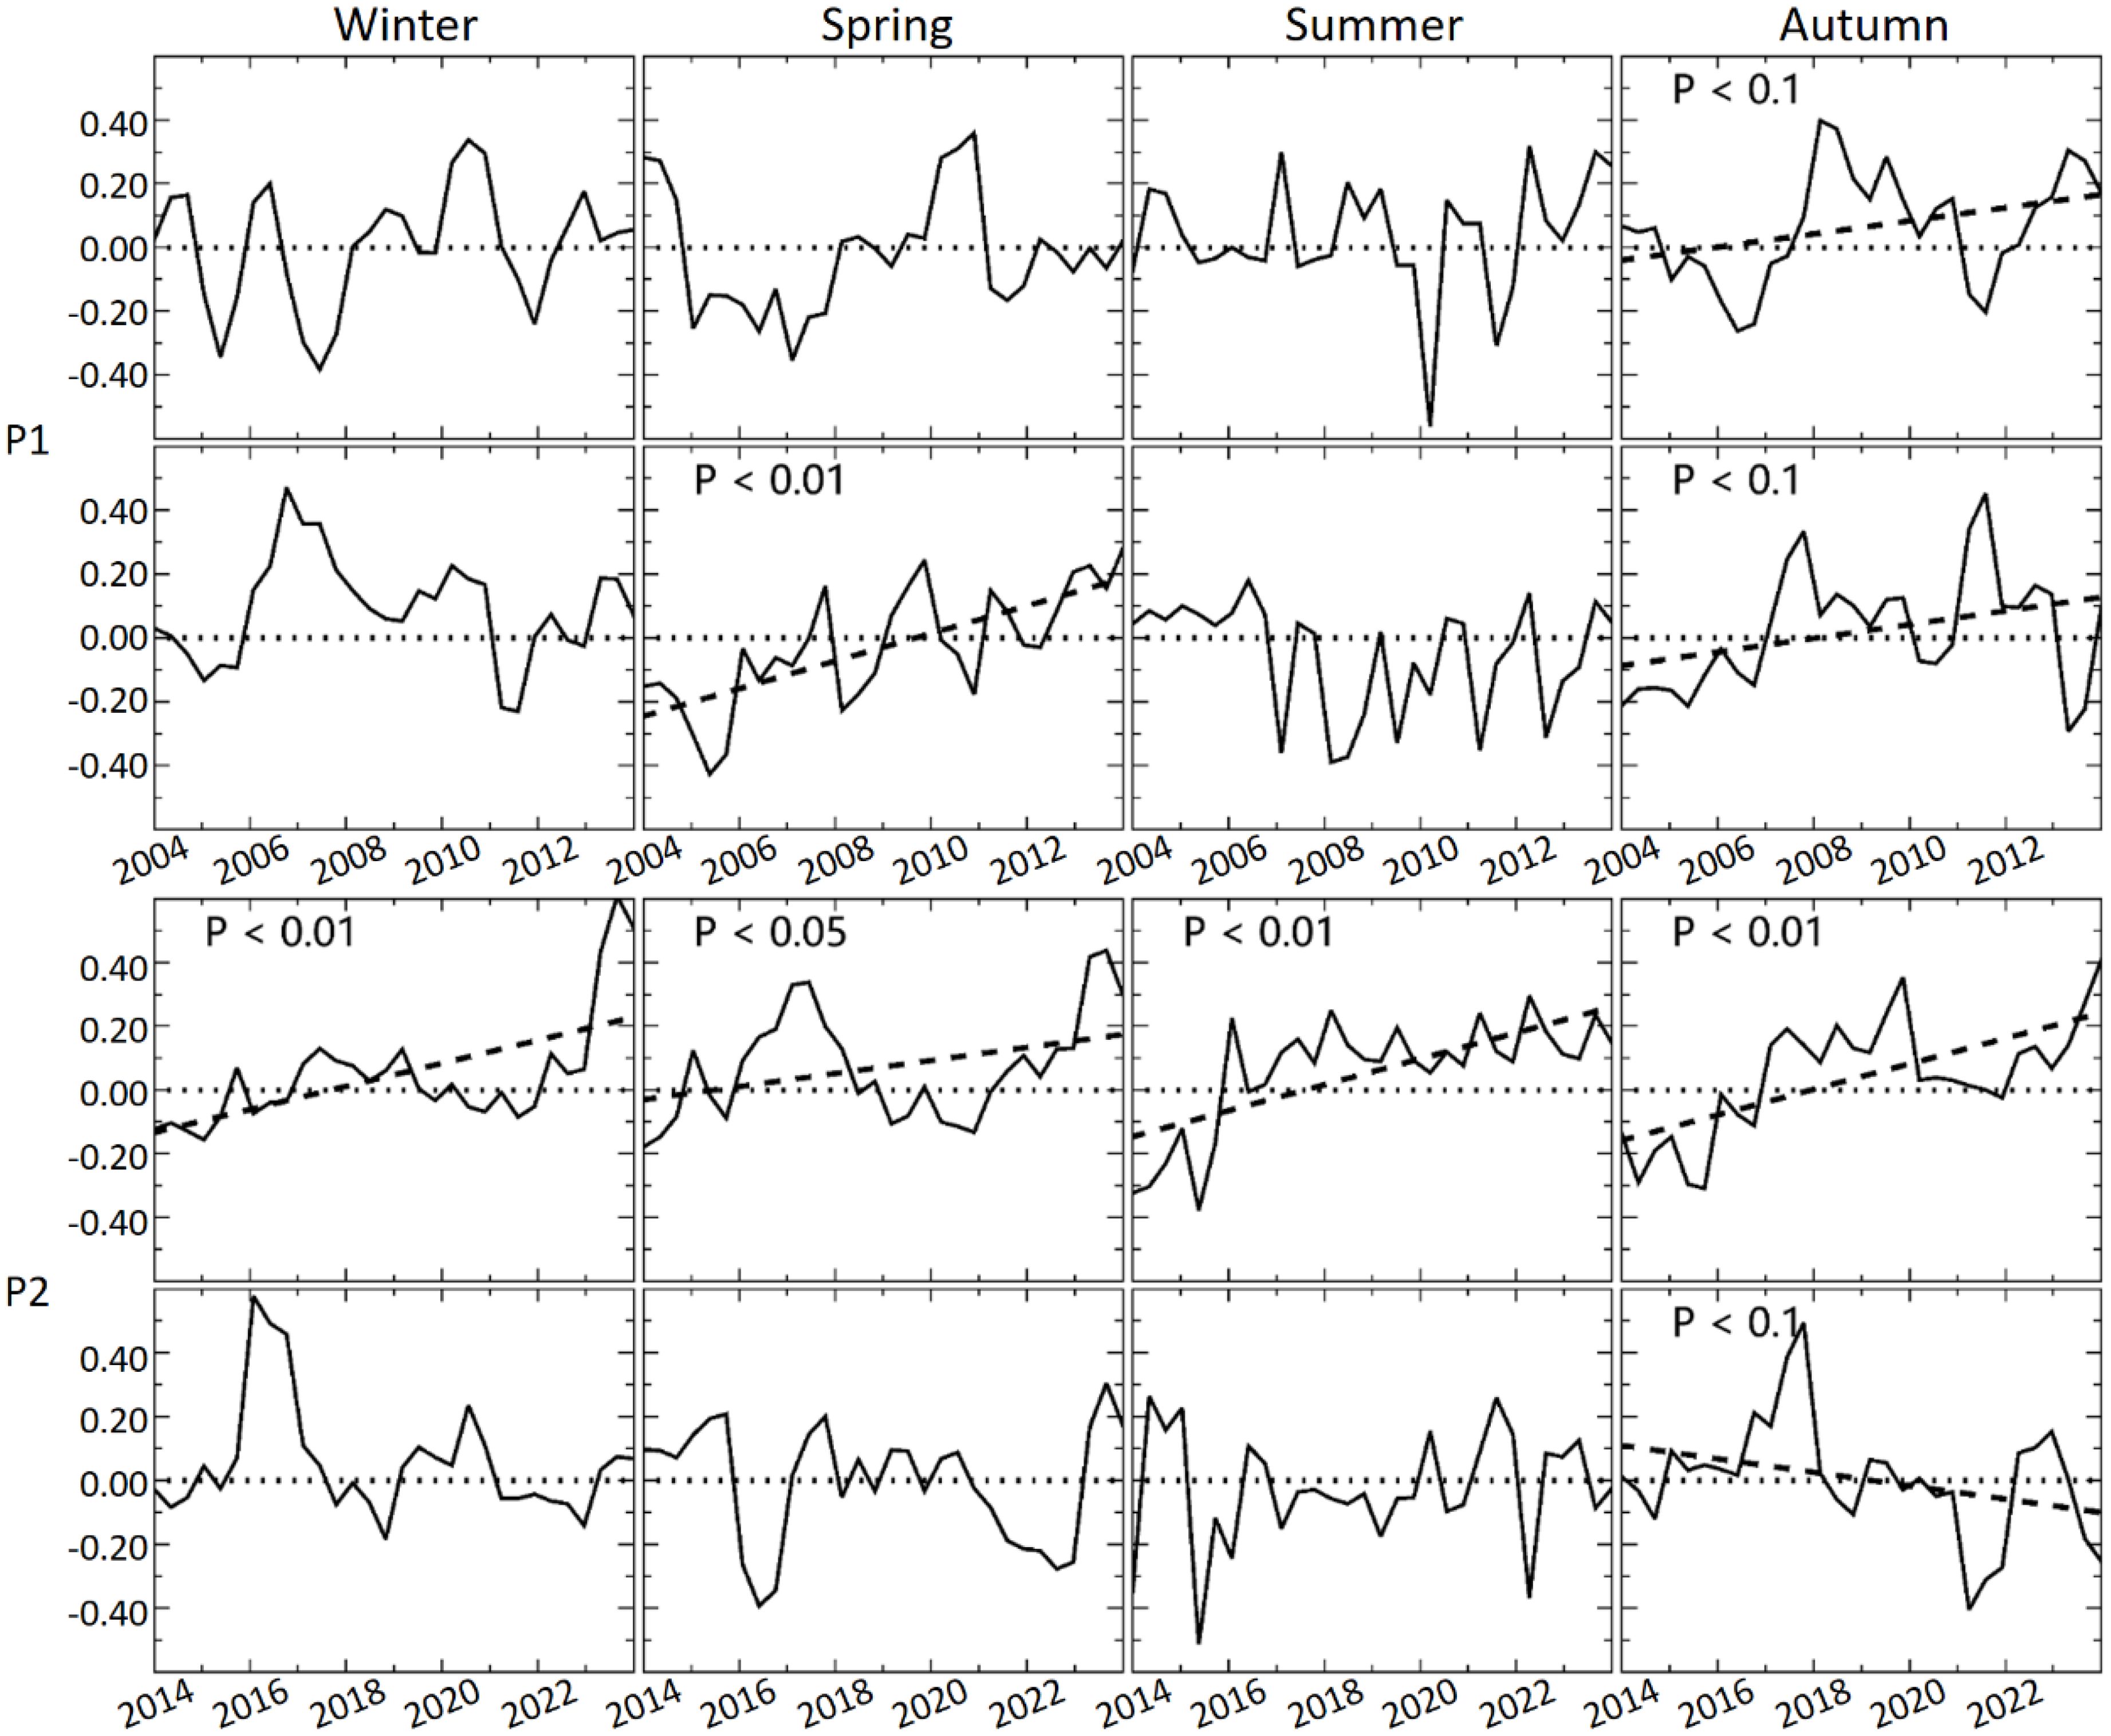
Figure 5. Time series of the leading modes of Antarctic sea ice in each season. The dashed line in the plot represents the fitted line, and ‘P’ indicates the P value reflecting the significance level of the fit.
3.3 Linkages of Antarctic dominant mode shifts
We conducted SVD analysis between SIC and other climate variables, including 850hPa geopotential height, SAT at 2m, and SST, to explore the causes of changes in the leading mode of Antarctic sea ice between the two periods. Figure 6 shows that the first mode of geopotential height during both P1 and P2 is dominated by a deformed SAM, displaying a weak wavenumber-3 pattern compared to the normal SAM. The second mode is dominated by a low-pressure anomaly over the Bellingshausen Sea, and the third by Amundsen-Ross pressure anomalies. However, the leading modes of sea ice and geopotential height do not show patterns similar to the leading sea ice modes—neither the dipole pattern in P1 nor the sea ice decline in P2. This indicates that the shifts in leading modes of Antarctic sea ice between the two periods are not directly driven by pressure anomalies, ruling out SAM, ASL, and the wavenumber-3 pattern as direct contributors.
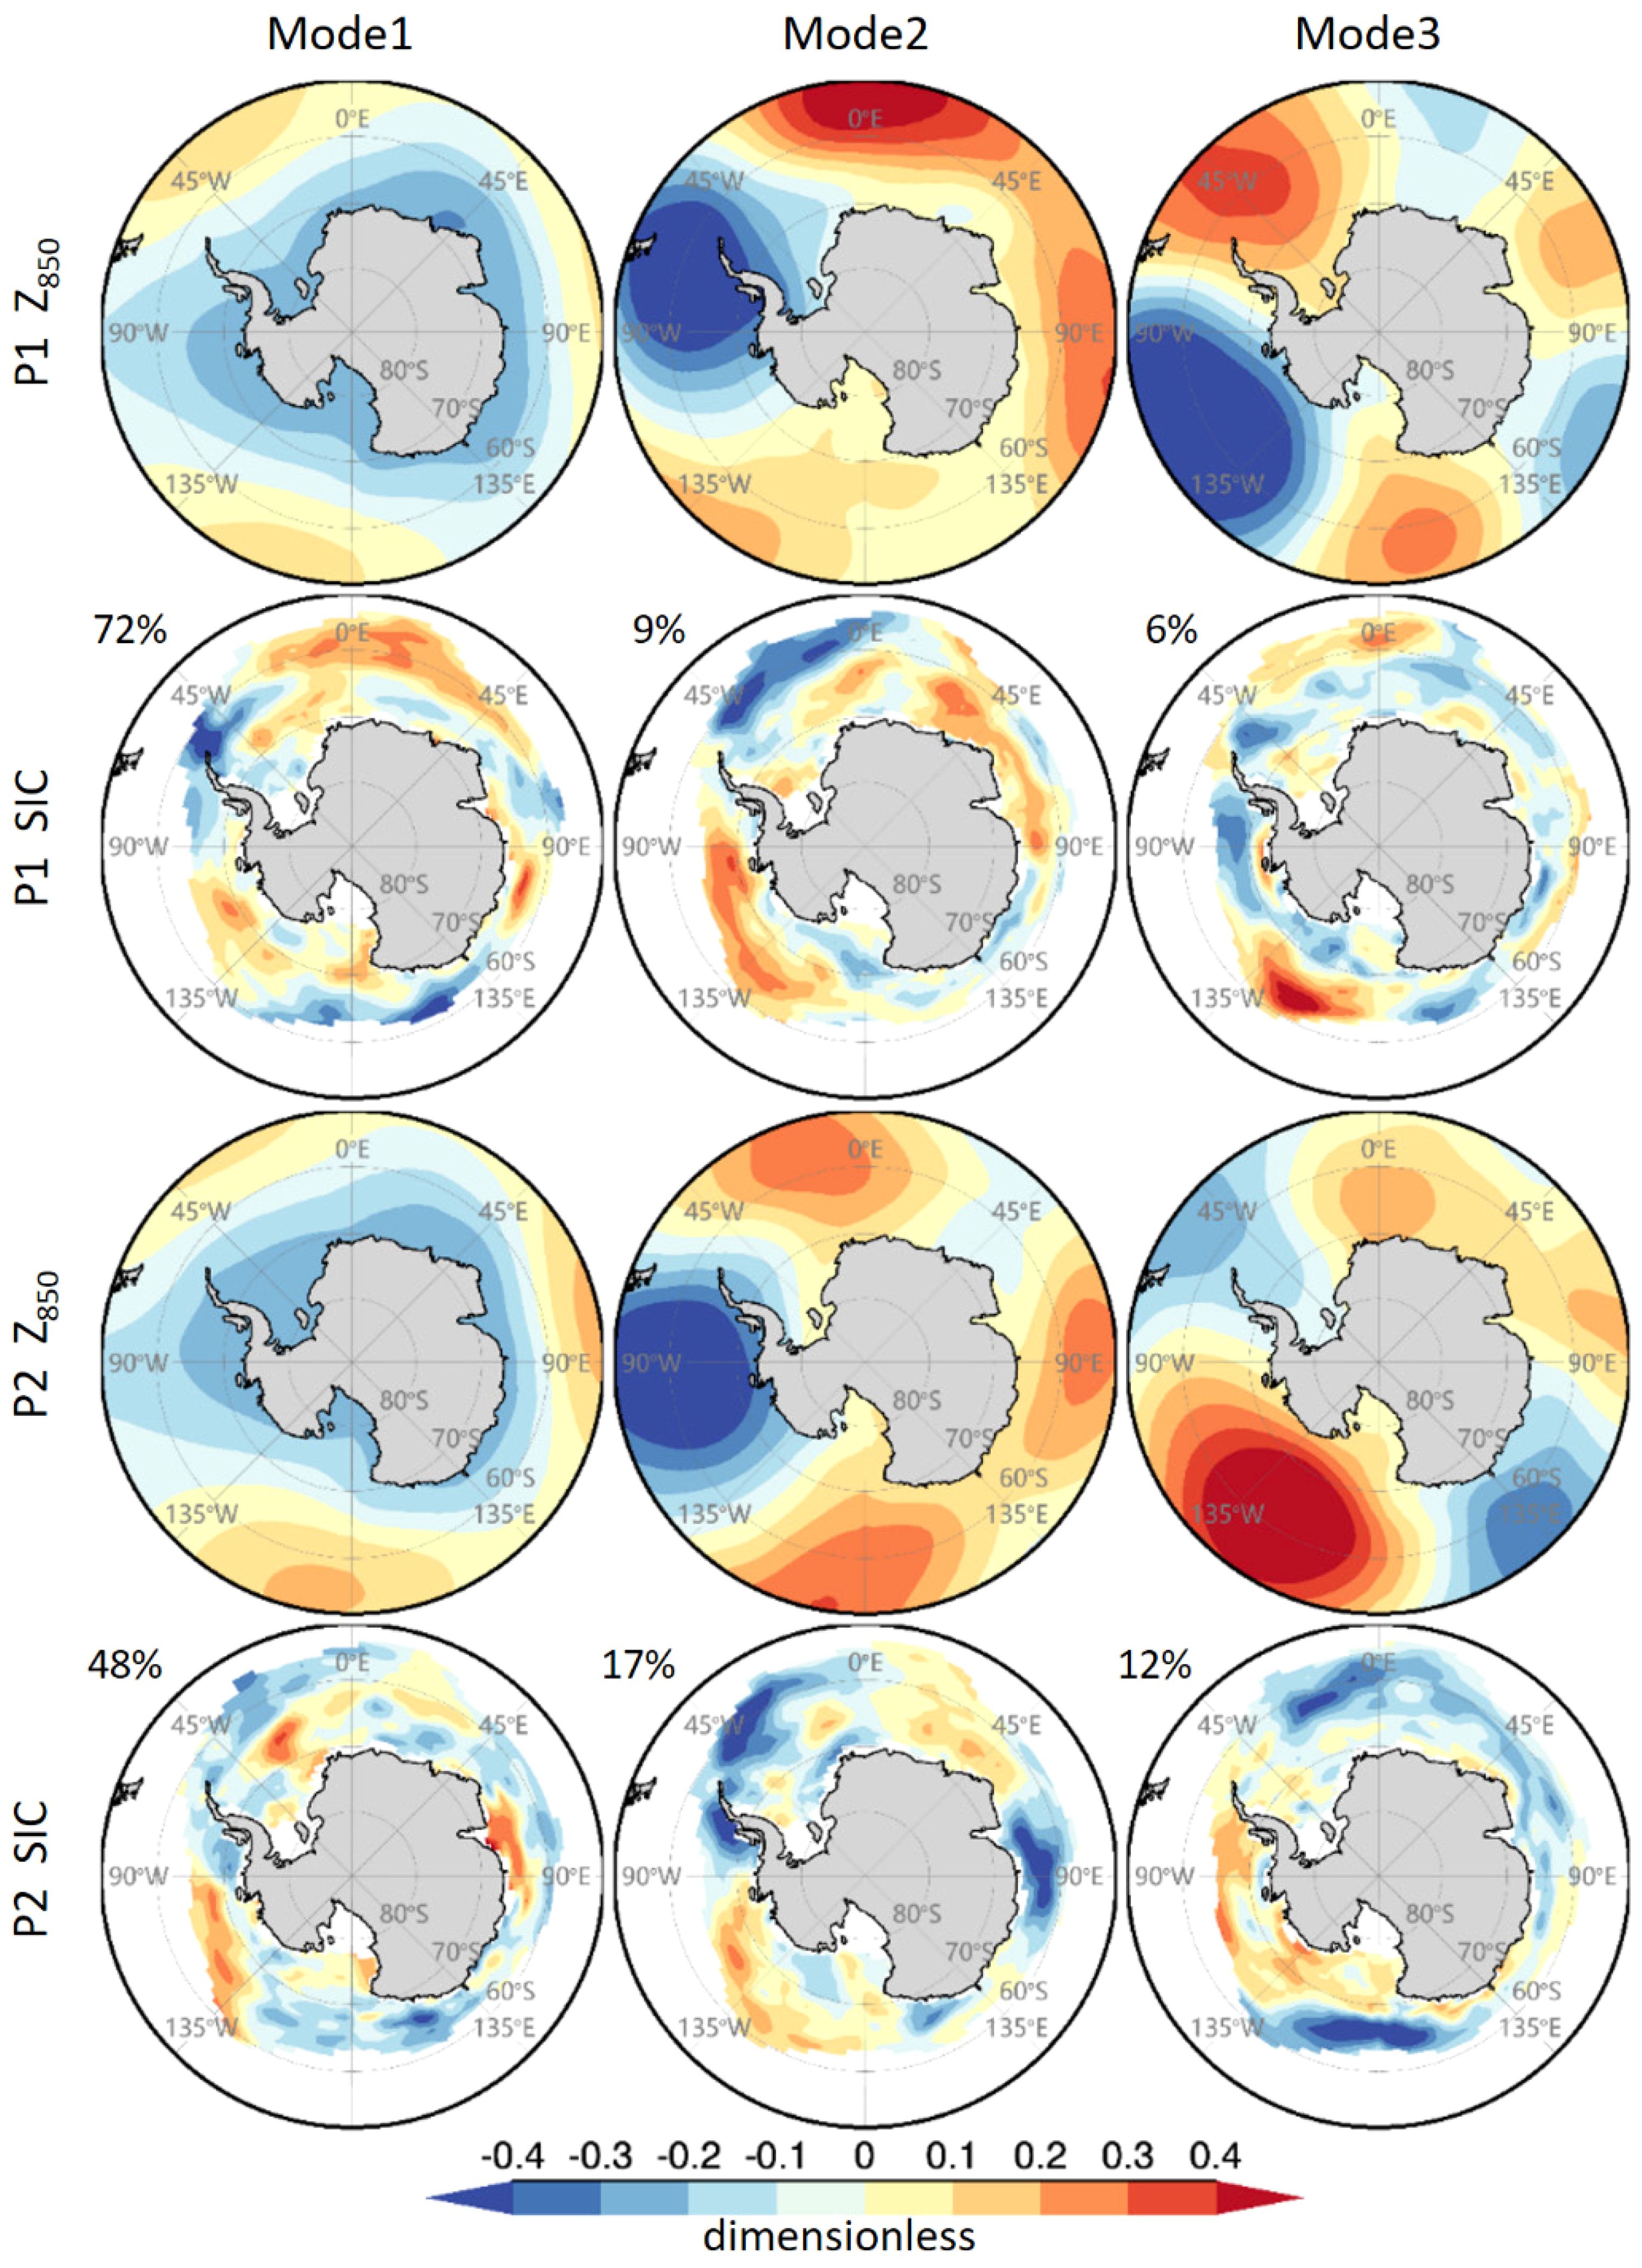
Figure 6. Spatial components of the leading SVD mode for Antarctic sea ice and geopotential height at 850 hPa. The percentage in the upper left indicates the explained variance of the corresponding SVD mode.
The SAT modes closely linked to SIC undergo significant shifts between P1 and P2 (Figure 7). During P1, the first SAT SVD mode features a temperature dipole over the Weddell and Amundsen Seas, with the corresponding SIC mode showing a similar dipole pattern, matching the first mode of sea ice itself. The SIC SVD modes associated with the second and third SAT modes are consistent with the third and fourth EOF modes of SIC itself, indicating that SAT was one of the main drivers of the SIC leading mode during the P1. In P2, the first SAT SVD mode shows widespread warming, except over the Amundsen Sea, with the associated SIC mode reflecting ice melt, consistent with the leading SIC EOF mode. The SIC mode associated with the second and third SVD mode of SAT is consistent with the third and second EOF mode of sea ice itself, indicating that SAT is also one of the driving factors of the leading sea ice mode during the P2, significantly contributing to the Antarctic sea ice decline during this time.
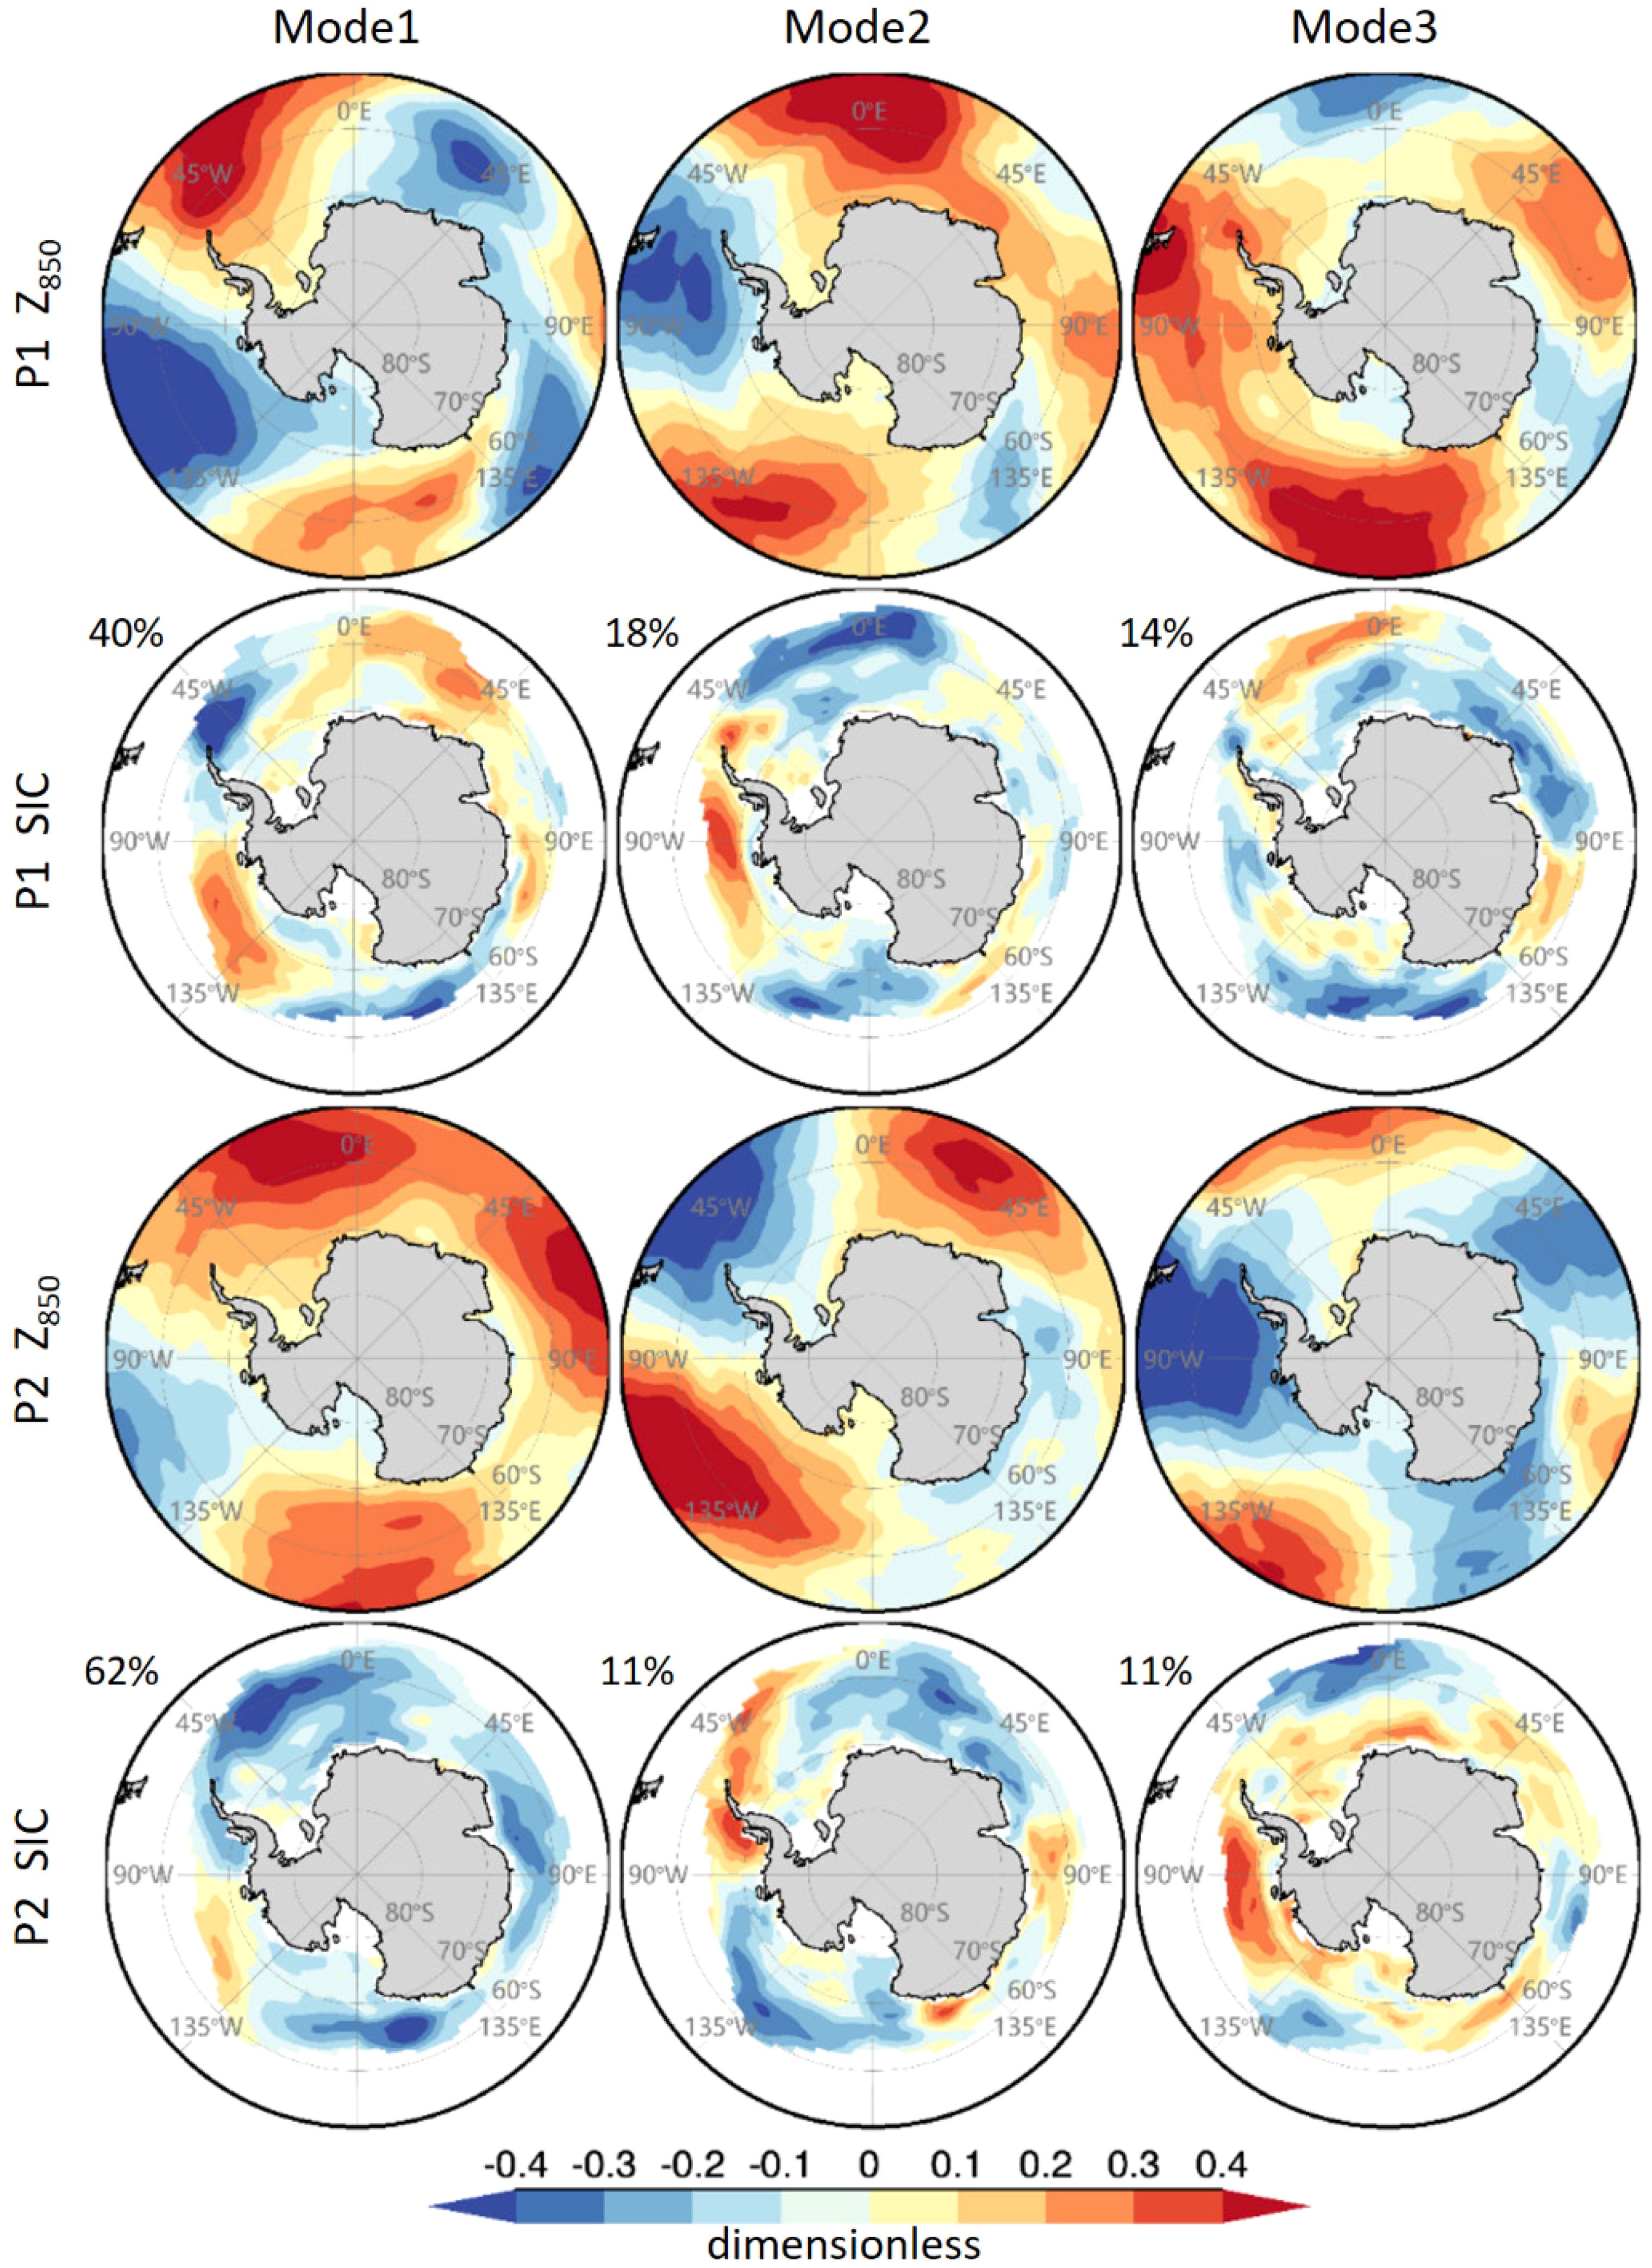
Figure 7. Spatial components of the leading SVD mode for Antarctic sea ice and SAT. The percentage in the upper left indicates the explained variance of the corresponding SVD mode.
SST influences the energy exchange at the air-sea interface, the density of the surface layer of sea ice, and ocean circulation, directly controlling the formation and melting of sea ice (Lian and Chen, 2012; Ciasto et al., 2015; Blanchard-Wrigglesworth et al., 2021), which has a significant potential impact on the leading modes of sea ice. Additionally, anomalies in sea surface temperatures in the tropical Pacific, including but not limited to ENSO, can affect the Antarctic through various pathways. For example, during ENSO events, particularly El Niño, warmer SST in the tropical Pacific enhances convection and increases the equator-to-pole temperature gradient, transmitting anomalies to polar regions through an atmospheric bridge. This warming strengthens the Hadley Cell, intensifying the subtropical jet and shifting storm tracks southward in the South Pacific (Li et al., 2014; Li et al., 2021). Tropical warming also triggers stationary Rossby waves that result in the PSA (Pacific South America) pattern, producing a high-pressure center in the Bellingshausen Sea (Yu et al., 2015). This center brings warm air from lower latitudes to the polar region while pushing cold Antarctic air into the Weddell Sea, leading to significant temperature anomalies. Additionally, the changes in atmospheric circulation enhance heat transport into the South Pacific and decrease it in the South Atlantic, creating out-of-phase temperature anomalies between these regions, ultimately impacting Antarctic sea ice distribution.
We conducted an SVD analysis using SST south of 15°N in conjunction with Antarctic SIC. The results indicate that during the P1 period, the first SVD mode of SST corresponds to El Niño in the Pacific (Figure 8) and exhibits a north-south dipole distribution in the Indian Ocean and South Atlantic, with the corresponding sea ice mode representing an SIC dipole, featuring positive sea ice anomalies in the Weddell Sea and negative anomalies in the Amundsen-Ross Sea. This mode accounts for 34% of the total variance, reflecting that the leading dipole mode of sea ice during P1 is mainly associated with ENSO. ENSO influences Antarctic atmospheric circulation and sea ice variability through multiple pathways, resulting in the observed dipole distribution of sea ice. The second SVD mode of Southern Hemisphere SST is primarily associated with the ZW3 pattern, while the third SVD mode is driven by the Indian Ocean SST dipole, leading to significant negative sea ice anomalies in the Antarctic Indian Ocean sector.
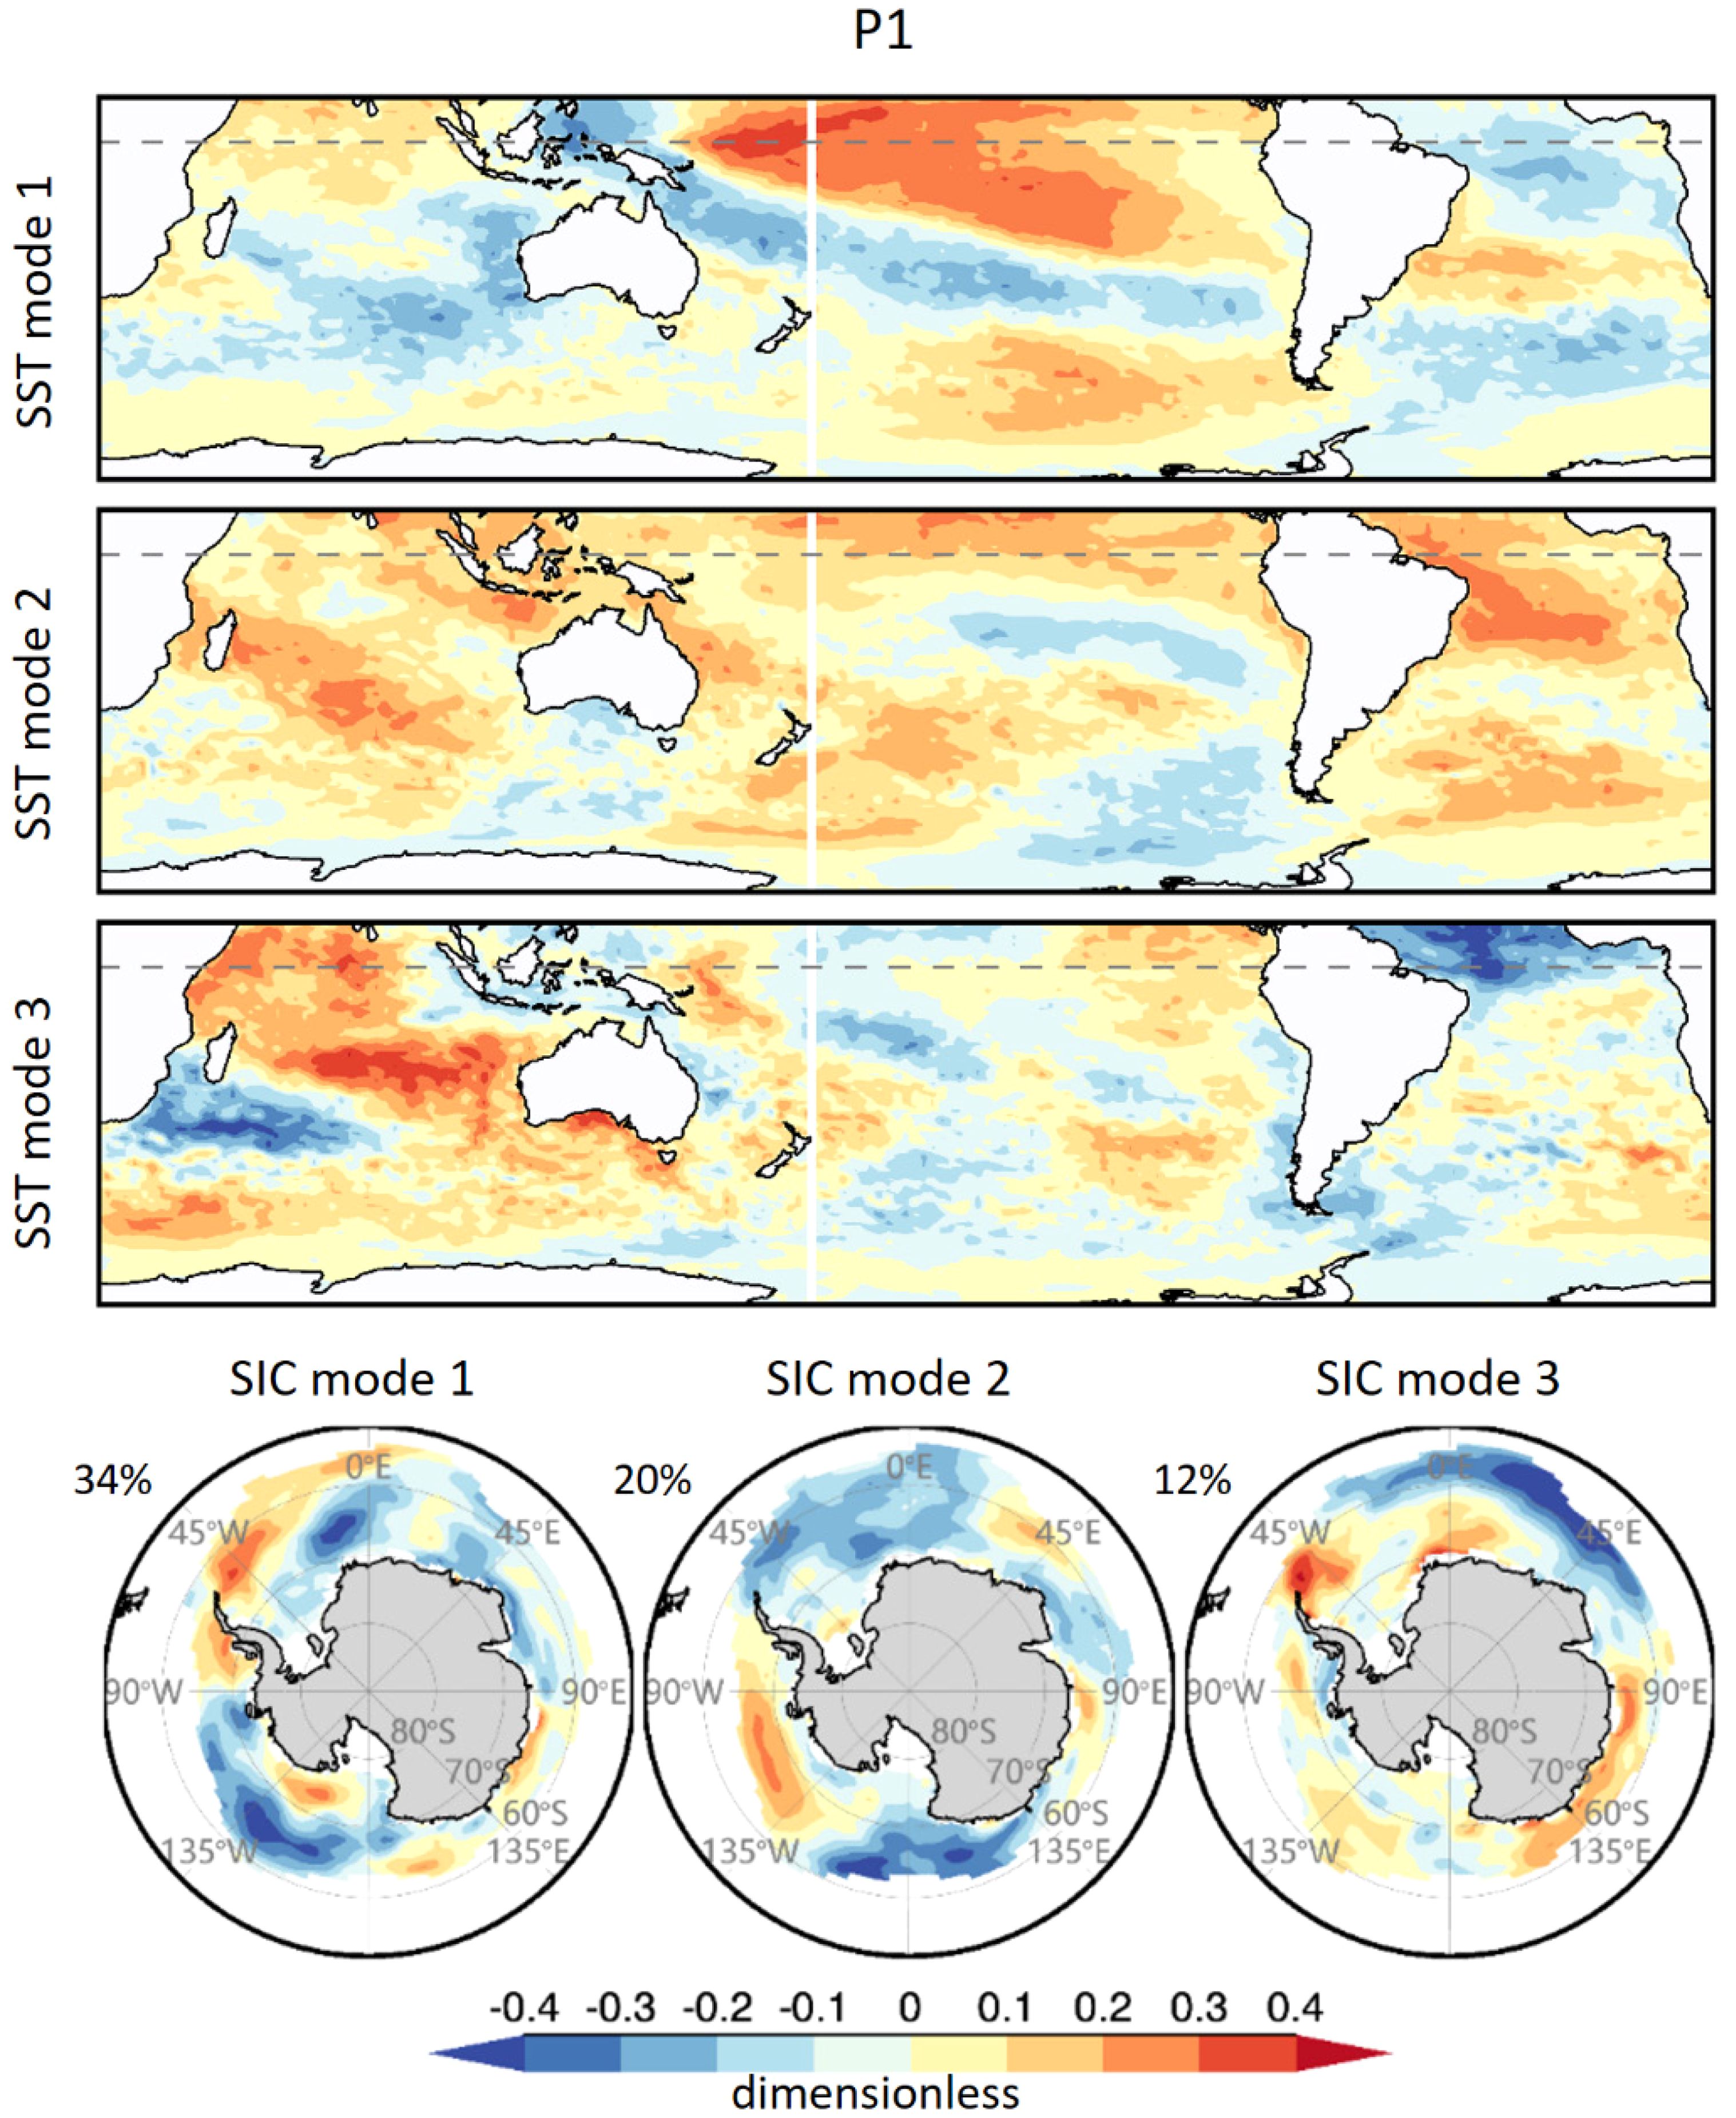
Figure 8. Spatial components of the leading SVD mode between Antarctic sea ice and SST during P1. The percentage in the upper left indicates the explained variance of the corresponding SVD mode.
In P2, the ENSO signal, Atlantic Niño, and Indian Ocean dipole are not significant in the first SVD mode of Southern Hemisphere SST (Figure 9). Instead, this period is characterized by widespread warming in the Southern Ocean and a weakening of the cold anomalies in the Amundsen Sea, which shifts northward compared to P1. The corresponding first SVD mode of sea ice indicates rapid melting, manifested as significant negative anomalies in most of the Antarctic sea ice, except in the Amundsen Sea. This mode aligns with the first EOF mode of SIC itself, and its temporal component shows a high correlation of -0.84 with Antarctic SIE during P2, exceeding the 99% significance level. The second SVD mode corresponds to the ENSO-related teleconnections to the Antarctic dipole, while the third SVD mode is associated with the ZW3 pattern of Southern Ocean SST driving the Antarctic sea ice. These results reflect that the melting of Antarctic sea ice is closely related to the comprehensive warming of Southern Ocean SST and SAT.
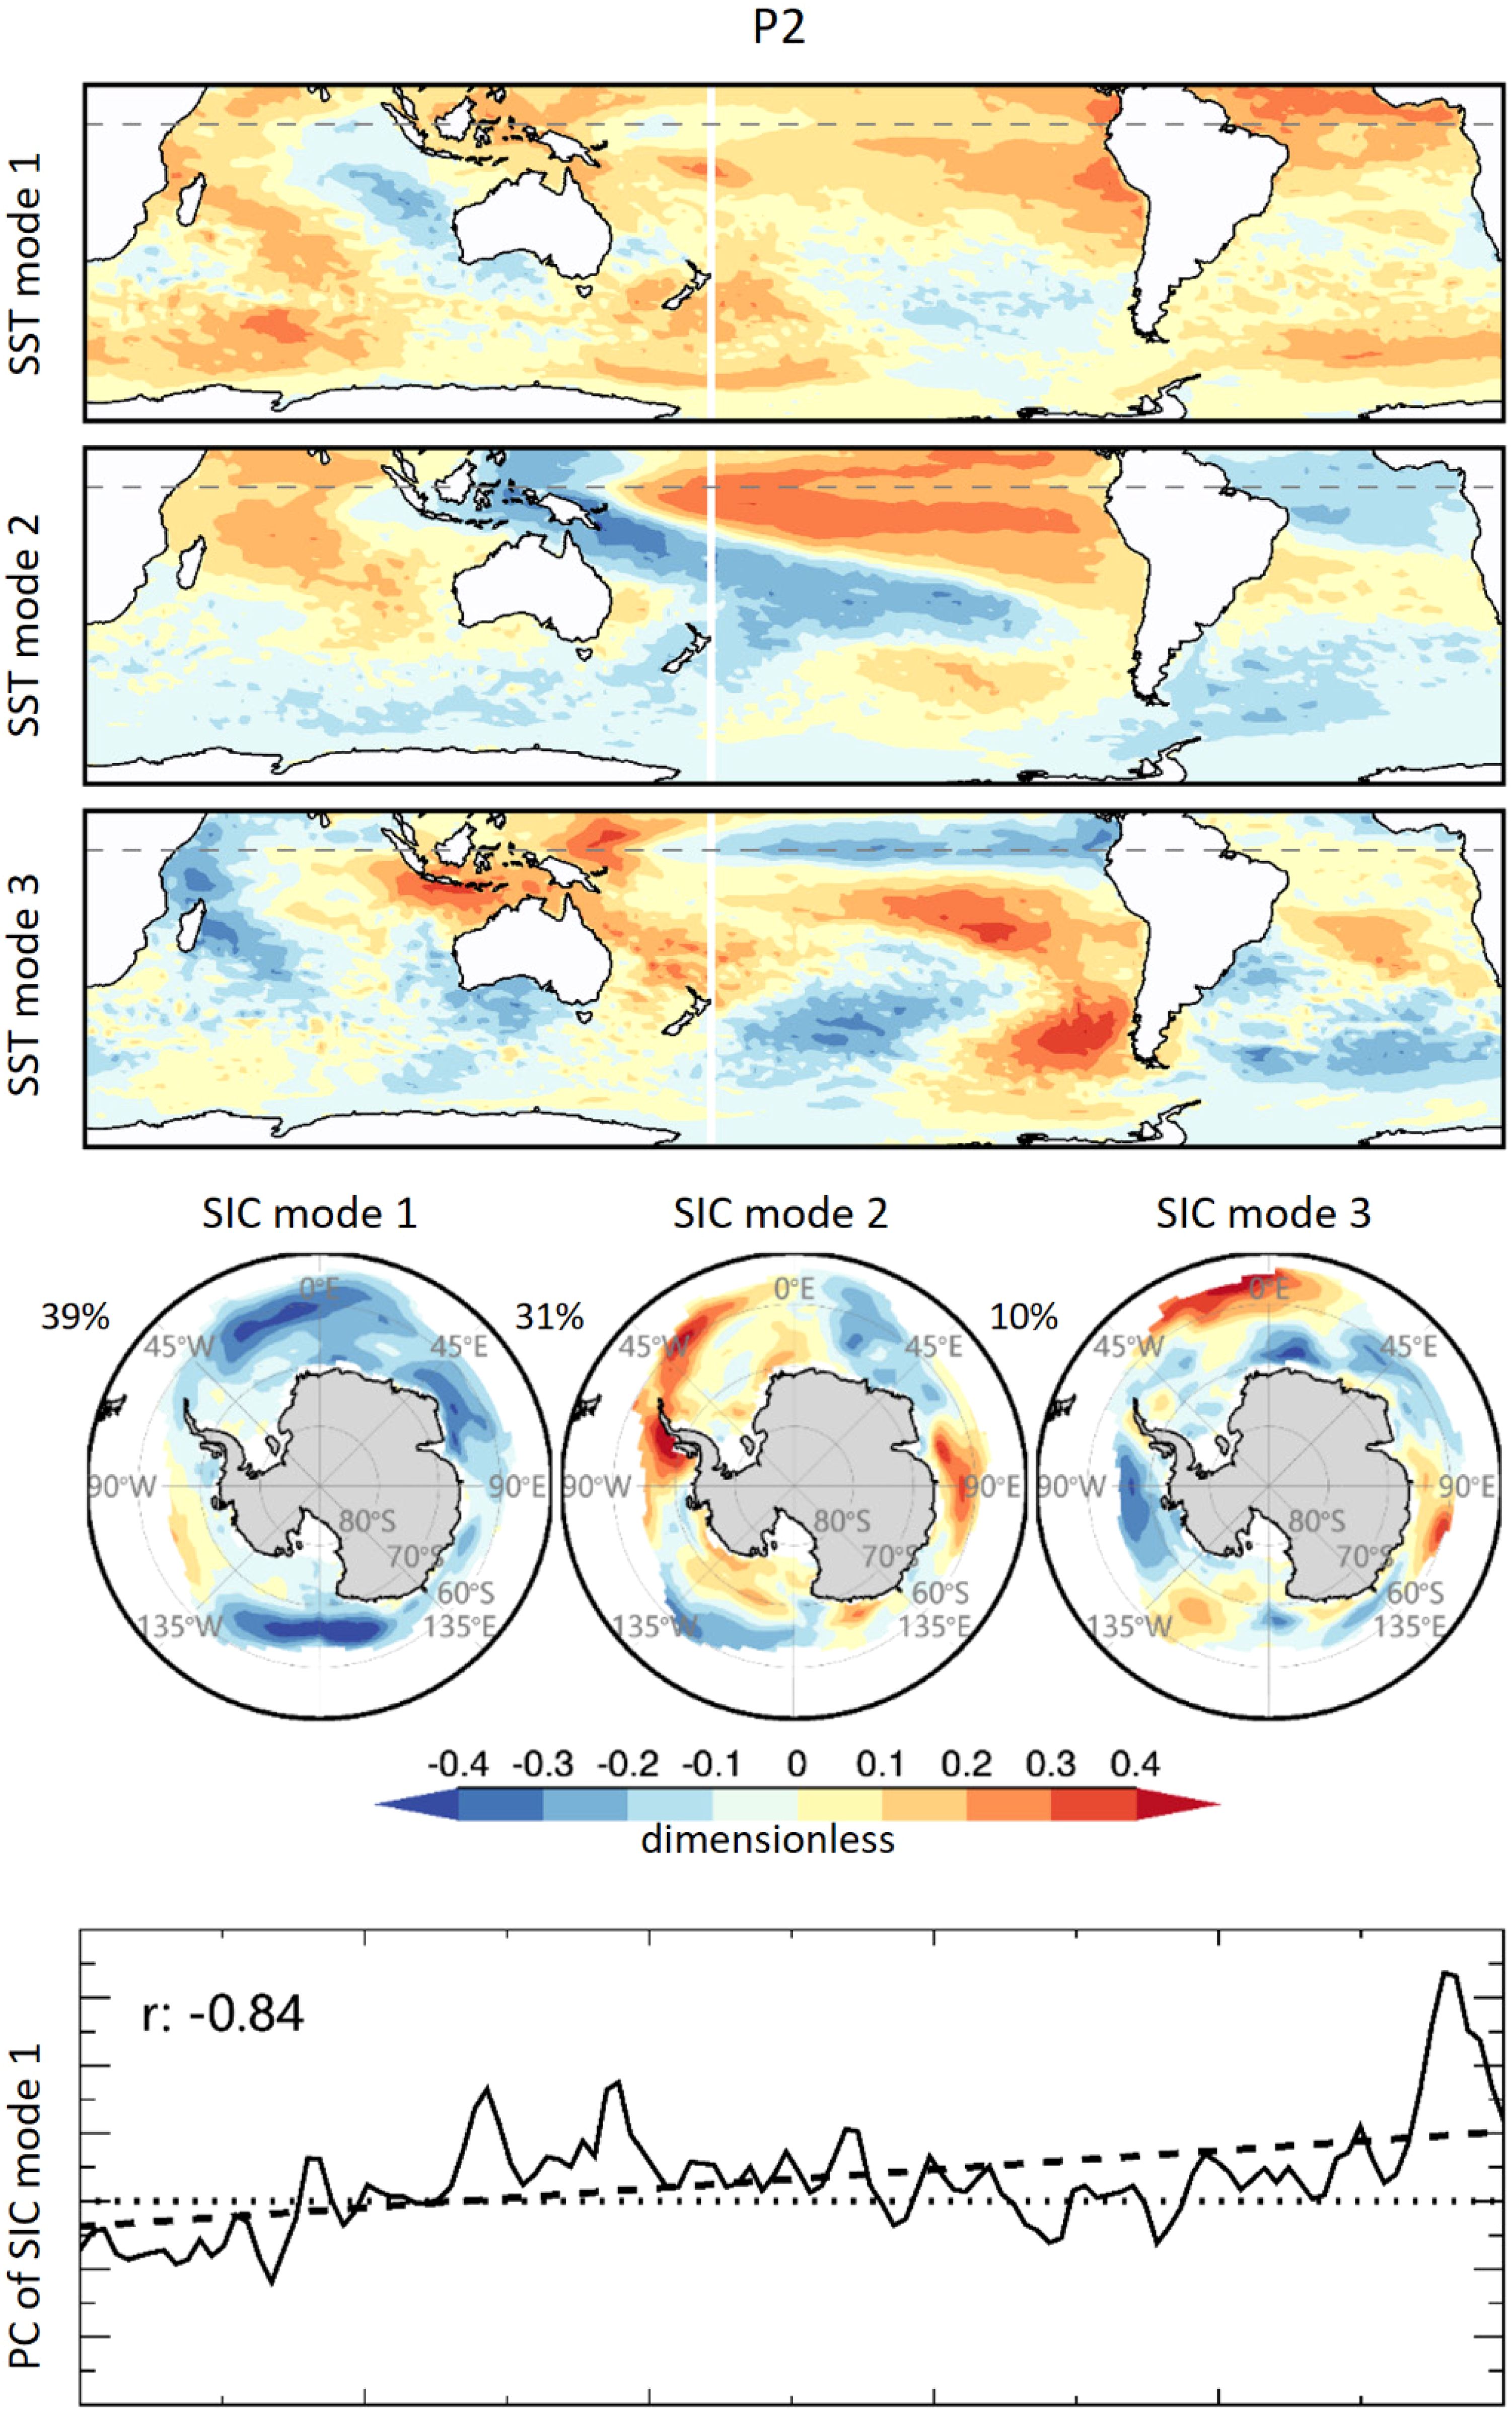
Figure 9. Spatial components of the leading SVD mode between Antarctic sea ice and SST during P2. The percentage in the upper left indicates the explained variance of the corresponding SVD mode. The bottom panel shows the PC of the first SVD mode of SIC, where ‘r’ represents the correlation coefficient between the PC and Antarctic SIE during P2, reaching the 99% significance level.
4 Conclusion
In the context of global warming and the rapid melting of Antarctic sea ice, this study investigates the changes in the primary modes of Antarctic sea ice over the past decade. By examining the spatiotemporal characteristics of sea ice variability and trends in the most recent two decades, we employed EOF and SVD analyses to explore the shifts in the leading modes of Antarctic sea ice and the associated physical processes. The main conclusions are as follows:
First, Antarctic sea ice has exhibited a significant reversal from the previous decade’s growth trend of 1.7% per year, with almost all regions now showing a melting trend, except for the Amundsen Sea. The rate of decline is particularly pronounced during the autumn and winter months (the freezing season), with rates of -7.1% per year and -6.5% per year, respectively. The Weddell Sea and West Pacific regions experience the most rapid declines, at -6.1% per year and -5.8% per year, respectively, leading to an overall average melting trend of -4.6% per year across Antarctica. Secondly, while the primary mode of Antarctic sea ice in the previous decade was characterized by the ADP pattern, the primary mode over the last decade reflects a consistent melting trend. This shift indicates a significant change in the underlying dynamics governing Antarctic sea ice. Thirdly, the transition of the leading mode of Antarctic sea ice is closely linked to the increases in surface air temperature and sea surface temperature in the Southern Ocean. With SAT and SST rising in nearly all regions of the Southern Ocean—except for the Amundsen Sea—this has led to the accelerated melting of Antarctic sea ice over the past decade.
This study elucidates the latest changes in the leading modes of Antarctic sea ice and the mechanisms driving these changes, thereby enhancing our understanding of the variability in Antarctic sea ice. The findings provide critical insights for ongoing research into sea ice variability and predictive studies of Antarctic sea ice.
Data availability statement
The original contributions presented in the study are included in the article/supplementary material. Further inquiries can be directed to the corresponding authors.
Author contributions
BG: Writing – original draft. PY: Writing – review & editing. JY: Writing – review & editing. HX: Writing – review & editing. WY: Writing – review & editing. YM: Writing – review & editing.
Funding
The author(s) declare financial support was received for the research, authorship, and/or publication of this article. This study was co-supported by the Key Laboratory of Gold Mineralization Processes and Resource Utilization, MNR and Shandong Provincial Key Laboratory of Metallo-genic Geological Process and Resource Utilization (KFKT202103), National Natural Science Foundation of China (No. 41902230) and government Foundation of Rizhao city (Geological project granted number SDGP371100202102000475).
Conflict of interest
The authors declare that the research was conducted in the absence of any commercial or financial relationships that could be constructed as a potential conflict of interest.
Generative AI statement
The author(s) declare that no Generative AI was used in the creation of this manuscript.
Publisher’s note
All claims expressed in this article are solely those of the authors and do not necessarily represent those of their affiliated organizations, or those of the publisher, the editors and the reviewers. Any product that may be evaluated in this article, or claim that may be made by its manufacturer, is not guaranteed or endorsed by the publisher.
References
Bintanja R., van Oldenborgh G. J., Drijfhout S. S., Wouters B., Katsman C. A. (2013). Important role for ocean warming and increased ice-shelf melt in Antarctic sea-ice expansion. Nat. Geosci. 6, 376–379. doi: 10.1038/ngeo1767
Blanchard-Wrigglesworth E., Roach L. A., Donohoe A., Ding Q. (2021). Impact of winds and southern ocean SSTs on antarctic sea ice trends and variability. J. Climate 34, 1–47. doi: 10.1175/JCLI-D-20-0386.1
Bonan D. B., Dörr J., Wills R. C. J., Thompson A. F., Årthun M. (2024). Sources of low-frequency variability in observed Antarctic sea ice. Cryosphere 18, 2141–2159. doi: 10.5194/tc-18-2141-2024
Bretherton C. S., Smith C., Wallace J. M. (1992). An intercomparison of methods for finding coupled patterns in climate data. J. Climate 5, 541–560. doi: 10.1175/1520-0442(1992)005<0541:AIOMFF>2.0.CO;2
Ciasto L. M., Simpkins G. R., England M. H. (2015). Teleconnections between tropical pacific SST anomalies and extratropical southern hemisphere climate. J. Climate 28, 56–65. doi: 10.1175/JCLI-D-14-00438.1
Comiso J. C. (2017). Bootstrap Sea Ice Concentrations from Nimbus-7 SMMR and DMSP SSM/I-SSMIS, Version 3 (Boulder, Colorado USA: NASA National Snow and Ice Data Center Distributed Active Archive Center).
DuVivier A. K., Holland M. M., Landrum L., Singh H. A., Bailey D. A., Maroon E. A. (2021). Impacts of sea ice mushy thermodynamics in the antarctic on the coupled earth system. Geophysical Res. Lett. 48, e2021GL094287. doi: 10.1029/2021GL094287
Eayrs C., Li X., Raphael M. N., Holland D. M. (2021). Rapid decline in Antarctic sea ice in recent years hints at future change. Nat. Geosci. 14, 460–464. doi: 10.1038/s41561-021-00768-3
Fan T., Deser C., Schneider D. P. (2014). Recent Antarctic sea ice trends in the context of Southern Ocean surface climate variations since 1950. Geophysical Res. Lett. 41, 2419–2426. doi: 10.1002/2014GL059239
Fogt R. L., Sleinkofer A. M., Raphael M. N., Handcock M. S. (2022). A regime shift in seasonal total Antarctic sea ice extent in the twentieth century. Nat. Climate Change 12, 54–62. doi: 10.1038/s41558-021-01254-9
Fogwill C. J., Turney C. S. M., Menviel L., Baker A., Weber M. E., Ellis B., et al. (2020). Southern Ocean carbon sink enhanced by sea-ice feedbacks at the Antarctic Cold Reversal. Nat. Geosci. 13, 489–497. doi: 10.1038/s41561-020-0587-0
Holland P. R., Kwok R. (2012). Wind-driven trends in Antarctic sea-ice drift. Nat. Geosci. 5, 872–875. doi: 10.1038/ngeo1627
Kutzbach J. E. (1967). Empirical eigenvectors of sea-level pressure, surface temperature and precipitation complexes over north america. J. Appl. Meteorology Climatology 6, 791–802. doi: 10.1175/1520-0450(1967)006<0791:EEOSLP>2.0.CO;2
Li X., Cai W., Meehl G. A., Chen D., Yuan X., Raphael M., et al. (2021). Tropical teleconnection impacts on Antarctic climate changes. Nat. Rev. Earth Environ. 2, 680–698. doi: 10.1038/s43017-021-00204-5
Li X., Holland D. M., Gerber E. P., Yoo C. (2014). Impacts of the north and tropical Atlantic Ocean on the Antarctic Peninsula and sea ice. Nature 505, 538–542. doi: 10.1038/nature12945
Lian T., Chen D. (2012). An evaluation of rotated EOF analysis and its application to tropical Pacific SST variability. J. Climate 25, 5361–5373. doi: 10.1175/JCLI-D-11-00663.1
Liu J., Curry J. A. (2010). Accelerated warming of the Southern Ocean and its impacts on the hydrological cycle and sea ice. Proc. Natl. Acad. Sci. United States America 107, 14987–14992. doi: 10.1073/pnas.1003336107
Liu J., Zhu Z., Chen D. (2023). Lowest antarctic sea ice record broken for the second year in a row. Ocean-Land-Atmosphere Res. 2, 0007. doi: 10.34133/olar.0007
Lorenz E. N. (1956). Empirical orthogonal functions and statistical weather prediction (Cambridge, MA, USA: Masachusetts Institute of Technology). Scientific Report No. 1.
Meehl G. A., Arblaster J. M., Bitz C. M., Chung C. T. Y., Teng H. (2016). Antarctic sea-ice expansion between 2000 and 2014 driven by tropical Pacific decadal climate variability. Nat. Geosci. 9, 590–595. doi: 10.1038/ngeo2751
Meehl G. A., Arblaster J. M., Chung C. T., Holland M. M., DuVivier A., Thompson L., et al. (2019). Sustained ocean changes contributed to sudden Antarctic sea ice retreat in late 2016. Nat. Commun. 10, 14. doi: 10.1038/s41467-018-07865-9
Parkinson C. L. (2019). A 40-y record reveals gradual Antarctic sea ice increases followed by decreases at rates far exceeding the rates seen in the Arctic. Proc. Natl. Acad. Sci. United States America 116, 14414–14423. doi: 10.1073/pnas.1906556116
Pauling A. G., Bitz C. M., Smith I. J., Langhorne P. J. (2016). The response of the southern ocean and antarctic sea ice to freshwater from ice shelves in an earth system model. J. Climate 29, 1655–1672. doi: 10.1175/JCLI-D-15-0501.1
Peterson A. K., Fer I., McPhee M. G., Randelhoff A. (2017). Turbulent heat and momentum fluxes in the upper ocean under Arctic sea ice. J. Geophysical Research: Oceans 122, 1439–1456. doi: 10.1002/2016JC012283
Pezza A. B., Rashid H. A., Simmonds I. (2012). Climate links and recent extremes in antarctic sea ice, high-latitude cyclones, Southern Annular Mode and ENSO. Climate Dynamics 38, 57–73. doi: 10.1007/s00382-011-1044-y
Porter D. F., Cassano J. J., Serreze M. C. (2011). Analysis of the Arctic atmospheric energy budget in WRF: A comparison with reanalyses and satellite observations. J. Geophysical Res. Atmospheres 116, 2011. doi: 10.1029/2011JD016622
Preisendorfer R. W., Mobley C. D. (1988). Principal Component Analysis in Meteorology and Oceanography (Amsterdam: Elsevier).
Purich A., Doddridge E. W. (2023). Record low Antarctic sea ice coverage indicates a new sea ice state. Commun. Earth Environ. 4, 314. doi: 10.1038/s43247-023-00961-9
Purich A., England M. H. (2019). Tropical teleconnections to antarctic sea ice during austral spring 2016 in coupled pacemaker experiments. Geophysical Res. Lett. 46, 6848–6858. doi: 10.1029/2019GL082671
Sadai S., Condron A., DeConto R., Pollard D. (2020). Future climate response to Antarctic Ice Sheet melt caused by anthropogenic warming. Sci. Adv. 6, eaaz1169. doi: 10.1126/sciadv.aaz1169
Schlosser E., Haumann F. A., Raphael M. N. (2018). Atmospheric influences on the anomalous 2016 Antarctic sea ice decay. Cryosphere 12, 1103–1119. doi: 10.5194/tc-12-1103-2018
Scott R. C., Nicolas J. P., Bromwich D. H., Norris J. R., Lubin D. (2019). Meteorological drivers and large-scale climate forcing of west antarctic surface melt. J. Climate 32, 665–684. doi: 10.1175/JCLI-D-18-0233.1
Simpkins G. R., Ciasto L. M., Thompson D. W. J., England M. H. (2012). Seasonal relationships between large-scale climate variability and antarctic sea ice concentration. J. Climate 25, 5451–5469. doi: 10.1175/JCLI-D-11-00367.1
Smith W. O. Jr., Comiso J. C. (2008). Influence of sea ice on primary production in the Southern Ocean: A satellite perspective. J. Geophysical Research: Oceans 113, 2008. doi: 10.1029/2007JC004251
Smith D. M., Dunstone N. J., Scaife A. A., Fiedler E. K., Copsey D., Hardiman S. C. (2017). Atmospheric response to Arctic and Antarctic sea ice: The importance of ocean–atmosphere coupling and the background state. J. Climate 30, 4547–4565. doi: 10.1175/JCLI-D-16-0564.1
Stuecker M. F., Bitz C. M., Armour K. C. (2017). Conditions leading to the unprecedented low Antarctic sea ice extent during the 2016 austral spring season. Geophysical Res. Lett. 44, 9008–9019. doi: 10.1002/2017GL074691
Thompson D. W., Solomon S. (2002). Interpretation of recent Southern Hemisphere climate change. Science 296, 895–899. doi: 10.1126/science.1069270
Turner J., Comiso J. C., Marshall G. J., Lachlan-Cope T. A., Bracegirdle T., Maksym T., et al. (2009). Non-annular atmospheric circulation change induced by stratospheric ozone depletion and its role in the recent increase of Antarctic sea ice extent. Geophysical Res. Lett. 36, 2009. doi: 10.1029/2009GL037524
Turner J., Hosking J. S., Marshall G. J., Phillips T., Bracegirdle T. J. (2016). Antarctic sea ice increase consistent with intrinsic variability of the Amundsen Sea Low. Climate Dynamics 46, 2391–2402. doi: 10.1007/s00382-015-2708-9
Turner J., Phillips T., Marshall G. J., Hosking J. S., Pope J. O., Bracegirdle T. J., et al. (2017). Unprecedented springtime retreat of Antarctic sea ice in 2016. Geophysical Res. Lett. 44, 6868–6875. doi: 10.1002/2017GL073656
Wang Y., Bi H., Huang H., Liu Y., Liu Y., Liang X., et al. (2019a). Satellite-observed trends in the Arctic sea ice concentration for the period 1979–2016. J. Oceanology Limnology 37, 18–37. doi: 10.1007/s00343-019-7284-0
Wang Y., Bi H., Liang Y. (2022a). A Satellite-Observed Substantial Decrease in Multiyear Ice Area Export through the Fram Strait over the Last Decade. Remote Sens. 14, 2562. doi: 10.3390/rs14112562
Wang G., Hendon H. H., Arblaster J. M., Lim E.-P., Abhik S., van Rensch P. (2019). Compounding tropical and stratospheric forcing of the record low Antarctic sea-ice in 2016. Nat. Commun. 10, 13. doi: 10.1038/s41467-018-07689-7
Wang Y., Yuan X., Bi H., Bushuk M., Liang Y., Li C., et al. (2022b). Reassessing seasonal sea ice predictability of the Pacific-Arctic sector using a Markov model. Cryosphere 16, 1141–1156. doi: 10.5194/tc-16-1141-2022
Wang Y., Yuan X., Bi H., Liang Y., Huang H., Zhang Z., et al. (2019b). The contributions of winter cloud anomalies in 2011 to the summer sea-ice rebound in 2012 in the antarctic. J. Geophysical Research: Atmospheres 124, 3435–3447. doi: 10.1029/2018JD029435
Wang Y., Yuan X., Bi H., Ren Y., Liang Y., Li C., et al. (2023a). Understanding arctic sea ice thickness predictability by a markov model. J. Climate 36, 4879–4897. doi: 10.1175/JCLI-D-22-0525.1
Wang Y., Yuan X., Cane M. A. (2022c). Coupled mode of cloud, atmospheric circulation, and sea ice controlled by wave-3 pattern in Antarctic winter. Environ. Res. Lett. 17, 044053. doi: 10.1088/1748-9326/ac5272
Wang Y., Yuan X., Ren Y., Bushuk M., Shu Q., Li C., et al. (2023b). Subseasonal prediction of regional antarctic sea ice by a deep learning model. Geophysical Res. Lett. 50, e2023GL104347. doi: 10.1029/2023GL104347
Yu J.-Y., Paek H., Saltzman E. S., Lee T. (2015). The early 1990s change in ENSO–PSA–SAM relationships and its impact on southern hemisphere climate. J. Climate 28, 9393–9408. doi: 10.1175/JCLI-D-15-0335.1
Yuan X., Li C. (2008). Climate modes in southern high latitudes and their impacts on Antarctic sea ice. J. Geophysical Res. Oceans 113, C06S91. doi: 10.1029/2006JC004067
Yuan X., Martinson D. G. (2001). The antarctic dipole and its predictability. Geophysical Res. Lett. 28, 3609–3612. doi: 10.1029/2001GL012969
Keywords: Antarctic, sea ice trend, sea ice mode, sea ice variability, EOF
Citation: Guo B, Yang P, Yuan J, Xing H, Yuan W and Meng Y (2025) Decadal transformations of antarctic sea ice modes. Front. Mar. Sci. 11:1506715. doi: 10.3389/fmars.2024.1506715
Received: 06 October 2024; Accepted: 18 December 2024;
Published: 16 January 2025.
Edited by:
Francisco Machín, University of Las Palmas de Gran Canaria, SpainReviewed by:
YoungHyun Koo, University of Colorado Boulder, United StatesYafei Luo, Guangdong Ocean University, China
Copyright © 2025 Guo, Yang, Yuan, Xing, Yuan and Meng. This is an open-access article distributed under the terms of the Creative Commons Attribution License (CC BY). The use, distribution or reproduction in other forums is permitted, provided the original author(s) and the copyright owner(s) are credited and that the original publication in this journal is cited, in accordance with accepted academic practice. No use, distribution or reproduction is permitted which does not comply with these terms.
*Correspondence: Peng Yang, Mjg2NDg2NzM2QHFxLmNvbQ==; Yuanku Meng, eWttZW5nQGZveG1haWwuY29t
 Benli Guo1,2,3
 Peng Yang