Abstract
Introduction:
Pufferfish are valuable ingredients and important fishery resources in Asia. Among them, approximately 25 Takifugu species have undergone explosive speciation in the marine environments of East Asia. Specifically, T. rubripes, T. pseudommus, and T. chinensis are remarkably similar in appearance and genetics, and their classification remains controversial. Here, we provide comprehensive genetic and genomic evidence regarding their speciation and classification.
Methods:
Whole genome sequencing was performed on T. pseudommus, leading to the identification and development of 15 novel tandem simple sequence repeats (SSRs) from its genomic data. Genetic diversity, differentiation, and population structure among T. rubripes, T. pseudommus, T. chinensis, and T. xanthopterus were subsequently analyzed using a combination of these 15 SSR loci and mitochondrial cytochrome oxidase subunit I (CoI) and cytochrome b (CytB) gene sequences. Furthermore, genomic variations, including single nucleotide polymorphisms, insertions, and deletions, were identified by comparing the genome of T. pseudommus with the reference T. rubripes genome retrieved from the National Center for Biotechnology Information. These variations were screened using ENSEMBL annotation and gene ontology analysis, and their potential association with morphological differences, such as dorsal spot patterns, was evaluated using reference Takifugu specimens.
Results and discussion:
Population genetic analysis of T. rubripes, T. pseudommus, and T. chinensis using the CoI and CytB genes, combined with the 15 SSR loci, revealed clustering into a single genetic group characterized by remarkably low genetic diversity (four haplotypes, with diversity values ranging from 0.0000 to 0.00065) and minimal pairwise differentiation (microsatellite-based FST values ranging from -0.0021 to 0.0075). Additionally, comparative genomic analysis between T. pseudommus and the reference T. rubripes genome did not identify genetic variations that could directly explain the observed morphological differences among the species. These findings strongly suggest that T. rubripes, T. pseudommus, and T. chinensis represent a single species sharing a common genetic pool.
1 Introduction
Despite the toxicity of tetrodotoxin (TTX) in humans, several Takifugu species are important ingredients and fishery resources in East Asia because of their high-quality taste and nutrition. For example, T. rubripes is considered more highly priced than other pufferfish in South Korean market (Kim and Kang, 2023). Due to TTX poisoning, the trade of pufferfish has been restricted to 21 species according to the Food Code of South Korea (Article 2) (MFDS, 2021). Traditionally, Takifugu species are classified on the basis of different morphological or meristic traits, including the presence and location of skin spine, number of dorsal fin rays, patterns of spots or strips, and other factors (Han et al., 2017). For example, T. xanthopterus is one of the Takifugu species characterized by stripe patterns on the dorsal side, unlike most Takifugu species, which have spot patterns. However, T. rubripes, T. chinensis and T. pseudommus are remarkably similar in appearance, with a comparable body shape and a large black spot encircled by a white line on the dorsal side (Figure 1). Despite these similar morphological characteristics, in the Food Code (Article 2) (MFDS, 2021), while T. rubripes and T. chinensis are listed as edible species, T. pseudommus are not listed. Thus, accurate classification of these three Takifugu species during trading is important for determining their price and whether they are considered edible or non-edible species, while the ambiguity in identification often leads to misclassification. A recent monitoring study by Lee et al. (2023) also highlighted the extent of mislabeling in pufferfish products sold in South Korea, with an alarming rate of 70% mislabeling. This mislabeling frequently happened between T. rubripes, T. pseudommus, and T. chinensis.
Figure 1

The phylogenetic tree and illustrations for the four Takifugu species. The genetic relationships were analyzed using whole mitochondrial DNA sequences obtained from NCBI. (A)T. chinensis (accession no. NC_011633.1): Black dorsal side color, one large black spot, and black or white anal fin color. (B)T. pseudommus (accession no. NC_063510.1): Black dorsal side color, one large black spot accompanied by small white spots, and white anal fin color. (C)T. rubripes (accession no. NC_004299.1): White dorsal side color, one large black spot accompanied by black spots, and white anal fin color. (D)T. xanthopterus (accession no. NC_011632.1, outgroup): Deep blue dorsal side color, white stripes, and yellow anal fin color.
The Takifugu genus, commonly known as pufferfish, is one of the examples of explosive speciation. Previous studies have reported that Takifugu species have undergone rapid speciation in the last 1.8 to 5.3 million years, resulting in the limited distribution of approximately 25 closely related species in the East Asia region, including the Yellow Sea, East China Sea, East Sea and the Pacific coast of Japan (Yamanoue et al., 2009; Han et al., 2017). The speciation timeframe of Takifugu species parallels that of cichlids in Lake Malawi (2.4 to 4.6 million years ago) and in Lake Tanganyika (3.0 to 6.8 million years ago). Although the speciation periods are similar, the cichlids in Lake Malawi and Lake Tanganyika have led to a broader diversification, with approximately 700 and 250 species, respectively (Turner et al., 2001). The rapid speciation, coupled with limited species numbers, has resulted in a high degree of genetic similarity within the Takifugu species. This genetic similarity significantly complicates species identification, as the genetic markers typically used to distinguish species are similar across all Takifugu species.
In an effort to improve traditional classification, we previously developed a systematic approach for identifying pufferfish at the species level using a combination of genetic markers, including cytochrome oxidase subunit I (CoI), cytochrome b (Cytb), and tandem simple sequence repeats (SSR or microsatellites) (Kim and Kang, 2023). With this approach, 11 pufferfish species listed in the Food Code (Article 2) (MFDS, 2021) were successfully identified; however, distinguishing among T. rubripes, T. pseudommus, and T. chinensis remains challenging due to their morphological and genetic similarities (Figure 1). Additionally, our independent study strongly suggested that these three species cannot be differentiated at whole mitochondrial DNA (mtDNA) level, showing an overall mean distance of 0.02 (Kang, 2022). For these reasons, T. rubripes, T. pseudommus, and T. chinensis have been classified officially based on slight morphological variations such as dorsal color, spot patterns, and anal fin color (Figure 1). However, these morphotypes appear more ambiguously in actual specimens and sometimes exhibit intermediate forms.
Despite these phenotypic features, the morphological method of identifying T. rubripes, T. pseudommus, and T. chinensis has been controversial due to recent findings from several genetic studies. A study using nine SSR loci designed based on the genome sequences of T. rubripes reported that genetic distance and differentiation between wild T. rubripes and wild T. pseudommus was smaller than those of between cultured T. rubripes and wild T. rubripes (Cui et al., 2005). Additionally, the genetic distances between wild T. rubripes and wild T. chinensis were compared using four SSR loci and the control region sequences of mtDNA, and no genetic difference was found between them (Reza et al., 2011). Recently (Park et al., 2020), estimated the genetic variations among 18 polymorphic single-nucleotide polymorphisms (SNP) obtained from T. rubripes, T. chinensis, and T. pseudommus. Similar to the previous findings, they were considered to share the same genetic pool.
The main objective is to verify that T. rubripes, T. chinensis, and T. pseudommus constitute a single species within the same genetic pool, despite exhibiting different morphological characteristics. To prove our hypothesis, first, whole genome sequencing (WGS) was conducted on T. pseudommus, and 15 novel SSR loci were developed based on its genome sequences. Subsequently, genetic diversity, differentiation, and structure among T. rubripes, T. pseudommus, T. chinensis, and T. xanthopterus populations were analyzed using a combination of the 15 SSR loci and two mtDNA markers (CoI and Cytb). Next, genomic variations (SNPs, insertions, and deletions) that showed differences between the two species were identified via comparing the genomes of T. pseudommus and reference T. rubripes retrieved from the National Center for Biotechnology Information (NCBI). These variations were screened based on ENSEMBL annotation and gene ontology (GO), and then their association with morphological differences (e.g., dorsal spot patterns) was evaluated using reference Takifugu specimens.
2 Materials and methods
2.1 Samples collection
2.1.1 Reference samples
Muscle tissue of wild T. pseudommus (voucher number: NFRDI-FI-TS-0049454) was provided by the National Institute of Fisheries Science for WGS. Muscle tissues of cultured T. rubripes (rcTR, n=20) from Shimonoseki of Japan, wild T. rubripes (rwTR, n=15) from Sinan-gun and Incheon of South Korea, wild T. pseudommus (rwTP, n=16) from Sinan-gun, Mokpo, and Yeosu of South Korea, and wild T. chinensis (rwTC, n=12) from Sinan-gun and Mokpo of South Korea were obtained from the Marine Biodiversity Institute of Korea (Chungcheongnam-do, South Korea) (Supplementary Table 1). It’s worth noting that cultured T. rubripes generally exhibit larger body sizes and clearer morphological features compared to their wild counterparts, attributed to selective breeding and environmental conditions. Thus, wild and cultured T. rubripes groups were used to evaluate the morphological differences observed among the closely related Takifugu species (Figure 1).
2.1.2 Commercial samples
Additionally, commercial samples of T. rubripes (csTR, n=1) T. chinensis (csTC, n=16), T. pseudommus (csTP, n=6), and T. xanthopterus (csTX, n=15) were purchased from local pufferfish restaurants and online markets from June 2020 to January 2023 (Supplementary Table 1). It’s noteworthy that although the Food Code of South Korea designates T. pseudommus as a non-edible pufferfish, T. rubripes, T. chinensis, and T. pseudommus are sold as Chambok in Korean online and local markets without distinction. The identities of these commercial pufferfish products were confirmed in our previous studies (Kim and Kang, 2023; Lee et al., 2023) by using both DNA barcoding and morphological features. The status of wild or cultured products was confirmed through product labeling information. Takifugu xanthopterus was also included in this study as an out group because T. xanthopterus can be clearly identified both morphologically and genetically. The animal experimentation plan was approved by the Animal Experimentation Ethics Committee of Seoul Women’s University (SWU IACUC 2024A-15). All samples in this study were collected from pufferfish that were already deceased, eliminating the need for anesthesia or euthanasia guidelines.
2.2 DNA extraction and quantification
Commercial products were thoroughly cleaned with distilled water to eliminate impurities and then preserved in 99% ethanol (Samchun Chemical, Seoul, South Korea), as previously described (Kang, 2021). DNA extraction from muscle tissues was performed using the Phenol-Chloroform-Isoamyl Alcohol (25:24:1, PCI) method, as described by Sambrook and Russell (2006) (Sambrook and Russell, 2006). DNA extracts were quantified using a Nanodrop (Thermo Fisher Scientific, Waltham, MA, USA). DNA concentration was determined by measuring the absorbance of ultraviolet light at 260 nm (1 absorbance unit corresponds to 50 μg/mL dsDNA), and DNA purity was assessed by the ratio of absorbance at 260 nm to that at 280 nm.
2.3 Whole genome sequencing of wild T. pseudommus genome
Genomic DNA of wild T. pseudommus (NFRDI-FI-TS-0049454) was used for next-generation sequencing. Library preparation followed the guidelines provided by the MGIEasy DNA Library Prep Kit (MGI, Shenzhen, China). In brief genomic DNA (1 μg) was fragmented into 300-500 bp using the S220 ultrasonicator (Covaris, Woburn, MA, USA). The fragmented genomic DNA underwent size-selection using AMPure XP magnetic beads (Beckman Coulter, Miami, FL, USA). Subsequently, the fragments were end-repaired and A-tailed at 37°C for 30 min, followed by incubation at 65°C for 15 min. Indexing adapters were then ligated to the ends of the DNA fragments at 23°C for 60 min. After cleaning up the adapter-ligated DNA, PCR was performed to enrich the DNA fragments with adapter molecules. The PCR conditions were as follows: 95°C for 3 min, followed by 7 cycles of 98°C for 20 s, 60°C for 15 s, and 72°C for 30 s, with a final extension at 72°C for 10 min. Library quality control (QC) was performed using the Agilent DNA 1000 Reagents with 2100 Bioanalyzer Desktop system to ensure the quality and proper preparation of the library. The double-stranded library was quantified using the QuantiFluor ONE dsDNA System (Promega, Madison, WI, USA). The library was then circularized at 37°C for 30 min, followed by digestion at 37°C for 30 min, and cleanup of circularization products. DNA nanoballs (DNBs) were created by incubating the library at 30°C for 25 min using DNB enzymes. Finally, the library was quantified using the QuantiFluor ssDNA System (Promega, Madison, WI, USA). Sequencing of the prepared DNBs was carried out using the MGIseq-2000 system (MGI) with 300 bp paired-end reads.
2.4 Screening of SSR loci
After WGS of T. pseudommus, sequencing errors were discarded using error correction module of SOAPec (ver. 2.02), and then contigs were assembled using SOAPdenovo2 (ver. 2.04-r240), resulting in 1,965,225 scaffolds with average length 340 bp. SSR loci composed of di-, tri-, tetra-, penta-, hexa-, hepta-, and octa-nucleotides were selected using the MISA tool (Beier et al., 2017). The statistical parameters, such as number of alleles (NA), observed heterozygosity (HO), expected heterozygosity (HE), pairwise linkage equilibrium, and polymorphic information content (PIC) of the selected 15 SSR loci were evaluated using PowerMarker software v3.25 (Liu and Muse, 2005).
2.5 Searching for SNPs on genome of T. pseudommus
SnpEff program ver. 5.0e (Cingolani et al., 2012) was used to classify SNPs such as synonymous or non-synonymous SNPs, start codon gains or losses, stop codon gains or losses, and frame shift deletions or insertions between the genome sequences of T. pseudommus and the reference T. rubripes. Genes relative to the differences in dorsal color and spot patterns of these species were searched using the GO terms such as pigmentation (GO:0043476), pigment biosynthetic process (GO:0046148), and regulation of melanin biosynthetic process (GO:0048021).
2.6 Bioinformatics for T. pseudommus genome assembly
To conduct reference-associated chromosome assembly, the T. rubripes genome (fTakRub1.2, BioProject: PRJEB31988, RefSeq Assembly Accession: GCF_901000725.2) was obtained from NCBI. The NGS output FASTAQ files were processed through the following bioinformatics steps based on Linux platform (Li, 2012): (1) Quality control was initially performed by trimming low-quality reads with Phred quality scores (Q) below Q 22 and remaining adapter sequences using Trimmomatic. Subsequently the processed reads were assessed using MultiQC and FASTQC (Andrews, 2010). (2) Reference genome (fTakRub1.2_genomic.fa) was downloaded and used as a reference to align wild T. pseudommus sequences using the Burrows–Wheeler Aligner (BWA). (3) Sequence alignment/map files were then converted to binary alignment/map (BAM) file format using samtools. (4) The resulting BAM files were sorted based on genomic positions using samtools. (5) Duplicate sequences were identified and marked by picardtools, and removed from the BAM file. (6) The genomic sequences were further organized into individual chromosome files (Chs 1-22) using samtools. (7) The reference and sample BAM file were merged together using samtools. (8) Lastly, a BAM index file (BAI) was generated. The merged chromosome was visualized by loading the both merged BAM and BAI file to the Integrated Genomics Viewer (IGV) (Thorvaldsdottir et al., 2013). In-silico deletions were identified based on zero coverage regions, lacking aligned reads compared to the reference sequence (Alkan et al., 2011). Specifically, large deletions that exceeds 1 kilobase pair (kb) in T. pseudommus genome compared to the reference T. rubripes genome were manually identified through IGV.
2.7 Primer design
For the validation of the selected SSR loci and the large deletions on the genome of T. pseudommus, primer sets were designed using Primer3 (Untergasser et al., 2012). The conditions of PCR product size were set at 400-500 bp for the large deletions or 100-400 bp for the SSR loci, with an optimal annealing temperature of 60°C for the large deletions or 52°C the SSR loci, and primer length ranging from 18 to 24 bp. All primer sets were synthesized by SFC Probes (Cheongju, South Korea).
2.8 Validation of the selected large deletions
Conventional PCR analysis was conducted to validate the large deletions identified in Section 2.6 Bioinformatics for T. pseudommus genome assembly. Initially, screening PCR for in-silico deletions was conducted with DNA extracts from 14 commercial products including T. rubripes (n=1, csTR1), T. pseudommus (n=6, csTP1-6), and T. chinensis (n=7, csTC1-7) (Supplementary Table 1). Subsequently, primer sets exhibiting sporadic amplification patterns were subjected to further experiments with additional 40 reference Takifugu species including rcTR (n=19, rcTR1-6 and rcTR8-20), rwTR (n=11, rwTR1-9, rwTR11, and rwTR14), rwTP (n=12, rwTP1-8 and rwTP10-13) and rwTC (n=8, rwTC2-3 and rwTC6-10). PCR was conducted under the same reaction condition as described in Section 2.9 mtDNA sequencing. PCR cycling conditions consisted of an initial denaturation at 98°C 30 s, followed by 30 cycles of denaturation at 98°C for 10 s, annealing at 60°C for 20 s, extension at 72°C for 1 min, and a final extension at 72°C for 3 min.
2.9 Amplification of CoI and Cytb
Two mitochondrial CoI and Cytb genes were amplified in a total volume of 20 μL, containing 10 ng of template DNA, 0.5 μM of each primer, 10 μL of PCR Premix (EmeraldAmp PCR Master Mix, Takara, Japan), and sterile distilled water. PCR reactions were carried out in a MiniAmp plus Thermal Cycler (Applied Biosystems) under the following conditions: 94°C for 5 min, followed by 35 cycles at 94°C for 30 s, 52–53°C for 20–40 s, and 72°C for 1 min, and a final extension step at 72°C for 10 min, as described in our previous study (Kim and Kang, 2023). After PCR, the amplicons were electrophoresed in a 1.5% agarose gel (Thermo Fisher Scientific) containing 0.5× TAE buffer (Elpis Biotech, Daejeon, Korea), using the Mupid-2plus electrophoresis system (Optima, Tokyo, Japan) at 100 V for 30 min. Agarose gel, stained with RedSafe (iNtRON, Gyeonggi-do, Korea), was visualized under a digital gel documentation system (GDS 200, Korea LabTech, Seongnam-si, Korea) and their sizes were compared against a 100 bp DNA ladder (Bioneer). The PCR products were purified using the AccuPrep PCR Purification kit (Bioneer), and the samples were sent to Gencube Plus (Seoul, South Korea) for nucleotide sequence determination. Nucleotide sequences were manually edited using CHROMAS v2.6.6 software and aligned using the ClustalW (Larkin et al., 2007) algorithm implemented in MEGA 11 software (Tamura et al., 2021).
2.10 SSR genotyiping
The selected 15 SSR loci were amplified with each corresponding primer set containing forward primers labeled with fluorescent dye (FAM). PCR was performed under the same reaction condition as described in Section 2.8 mtDNA sequencing. PCR cycling conditions comprised an initial denaturation step at 94°C for 5 min, followed by 35 cycles of 94°C for 30 s, 52°C for 40 s, and 72°C for 30 s, with a final extension step at 72°C for 5 min. After confirming each amplicon on 2% agarose gels, the PCR products were electrophoresed on an ABI 3730xl automated DNA sequencer (Applied Biosystems). The amplicon sizes were determined with the ROX 500 bp size standard (Applied Biosystems) using GENEMAPPER software v5.0 (Applied Biosystems). The SSR markers were deposited at Genbank (Table 1).
Table 1
| Loci* | Primer sequence (5’-3’) | Motif | N | NA | Ho | HE | PIC | |
|---|---|---|---|---|---|---|---|---|
| TP2 -1 (PP949272) | F | ACAATACATCTCACCTGATC | (AC)20 | 43 | 11 | 0.81 | 0.77 | 0.75 |
| R | GTGTCATATGCAACAATGG | |||||||
| TP2 -2 (PP949273) | F | CCTCTCATCCTTGTTCAC | (CA)20 | 43 | 10 | 0.70 | 0.81 | 0.79 |
| R | GAAGTAGTCATCAGTCATCA | |||||||
| TP2 -3 (PP949274) | F | TGGATAGGTCATAAGTTCAC | (AC)20 | 43 | 12 | 0.98 | 0.80 | 0.78 |
| R | GAACTAGAATCAGTAGAGGC | |||||||
| TP2 -4 (PP949276) | F | AAGATAGGAGTTCTGCAAC | (GT)19 | 43 | 16 | 0.86 | 0.87 | 0.86 |
| R | ATCTGGTATTCATCACTACG | |||||||
| TP2 -5 (PP949277) | F | GGTGTCCAGCCATAAGAG | (TG)19 | 43 | 17 | 0.63 | 0.92 | 0.91 |
| R | GCAGATACACAACAGATATC | |||||||
| TP2 -6 (PP949278) | F | TTCACCAAGAATATAGACGG | (AC)18 | 43 | 12 | 0.77 | 0.89 | 0.88 |
| R | ATGAATGAGTCCTTGGTATG | |||||||
| TP 3-1 (PP949275) | F | GCTTATTAGAGTAACGCTTG | (TCA)13 | 43 | 8 | 0.65 | 0.66 | 0.63 |
| R | GTAACGGACAATCATCAAC | |||||||
| TP 3-2 (PP949281) | F | TTGCTATTCTTGTGATCTCG | (CAG)37 | 43 | 24 | 0.98 | 0.93 | 0.93 |
| R | GTATGTTCATGAGTAACCTG | |||||||
| TP3-3 (PP949282) | F | AATTATCAGGTCAGAAGCTC | (CTT)27 | 43 | 23 | 0.88 | 0.92 | 0.92 |
| R | CATAATCTGCACCGAGAA | |||||||
| TP3-4 (PP949286) | F | CTCACGGAGCGATTCTAT | (GAT)26 | 43 | 18 | 0.93 | 0.90 | 0.89 |
| R | CAAGAACACCAGGACACT | |||||||
| TP4-1 (PP949279) | F | AGACTTGACGACTCTCTT | (ATCT)20 | 43 | 19 | 0.91 | 0.91 | 0.90 |
| R | CATCGCTCCAGGATTAATTA | |||||||
| TP4-2 (PP949283) | F | TTATGAACATACAGCGACTC | (CCAT)28 | 43 | 14 | 0.84 | 0.90 | 0.89 |
| R | CAGTAGACAGAGATACATGT | |||||||
| TP7-1 (PP949280) | F | CGCATCATGTTAGTGGAA | (GGACCCA)11 | 43 | 14 | 0.74 | 0.88 | 0.87 |
| R | GAACTGCTCATCATCGCT | |||||||
| TP7-2 (PP949284) | F | ATCATACATCCTTCAGTCAG | (CACAGAA)9 | 43 | 9 | 0.79 | 0.84 | 0.82 |
| R | CTGTGTGTTCTCTGTTCTC | |||||||
| TP8-1 (PP949285) | F | CCATTAGACTGTACTGGTC | (GTGTGTTT)7 | 43 | 4 | 0.65 | 0.66 | 0.59 |
| R | CGACTGTAACACGTGTAA | |||||||
Characteristics of fifteen simple sequence repeat loci and their primer sets.
*: Each accession number for the SSR loci deposited in GenBank is shown in parentheses. N, sample size; NA, number of alleles; HO, observed heterozygosity; HE, expected heterozygosity; PIC, polymorphic information content.
2.11 Genetic diversity and differentiation analysis
Haplotypes comprising CoI-Cytb sequences for rcTR (n=20), rwTR (n=15), rwTP (n=16), rwTC (n=12), csTX (n=15), and csTC (n=16) populations were constructed with the MEGA 11 software. The haplotype diversity (h), nucleotide diversity (π), and pairwise FST estimates (molecular diversity) were estimated using ARLEQUIN v3.5 (Excoffier and Lischer, 2010). Haplotype richness, corrected for unequal sample sizes across the populations, was calculated using CONTRIB v1.02 (Petit et al., 1998). A haplotype network was constructed using HAPSTAR v0.7 (Teacher and Griffiths, 2011). To assess SSR diversity in the six Takifugu populations, NA, HO, and HE were calculated using PowerMarker software. Additionally, inbreeding coefficient (FIS) and allelic richness (AR), corrected for unequal sample sizes, were calculated using FSTAT v2.9.3.2 (Goudet, 2001). Multilocus tests for Hardy-Weinberg equilibrium (HWE) and pairwise FST estimates (genetic differentiation) for genotypes among pairs of the 15 loci were also performed in GENEPOP v4.0 (Rousset, 2008). The significance levels for pairwise population comparisons were adjusted to a 95% confidence level using a Bonferroni correction.
2.12 Population structure analysis
The genetic structure of the six Takifugu species was evaluated using the 15 SSR loci through an individual-based Bayesian population assignment test in STRUCTURE v2.3.4 (Pritchard et al., 2000), under a model of admixed ancestry among populations and correlated allele frequencies. Likelihood scores were then calculated to determine the genetically homogeneous groups to which each individual belonged, with the data partitioned into a specified number of genetic clusters (K) ranging from one to ten. Ten iterations were performed at each K value, with 100,000 burn-in steps followed by 1,000,000 Markov Chain Monte Carlo generations. The most likely number of genetic clusters was determined by using the delta-K method implemented in the web-based STRUCTURE HARVESTER (http://taylor0.biology.ucla.edu/structureHarvester/), based on the rate of change in the log probability of data between successive K values (Evanno et al., 2005). Furthermore, factorial correspondence analysis (FCA) was performed on the genetic relationships between individuals with multi-locus genotypes using GENETIX v4.05.2 (Belkhir et al., 2004), based on the genotypes of 15 SSR loci from the six Takifugu populations.
2.13 Phylogenetic analysis
Whole mtDNA sequences of T. rubripes (NC_004299.1), T. pseudommus (NC_063510.1), T. chinensis (NC_011633.1), and T. xanthopterus (NC_011632.1), as well as the CoI-Cytb sequences (934 bp) of 94 reference and commercial specimens were used for phylogenetic analysis (Figures 1, 2B). The phylogenetic trees were constructed using a neighbor-joining (NJ) method based on the Kimura 2-parameter model of nucleotide substitution implemented in MEGA 11 software. The 15 SSR allelic variations were further analyzed for the phylogenetic relationships among the 94 Takifugu species. A NJ phylogenetic tree based on FST distances was constructed using POPTREE2 (Takezaki et al., 2010). Statistical support was estimated by 1000 bootstrap replicates.
Figure 2
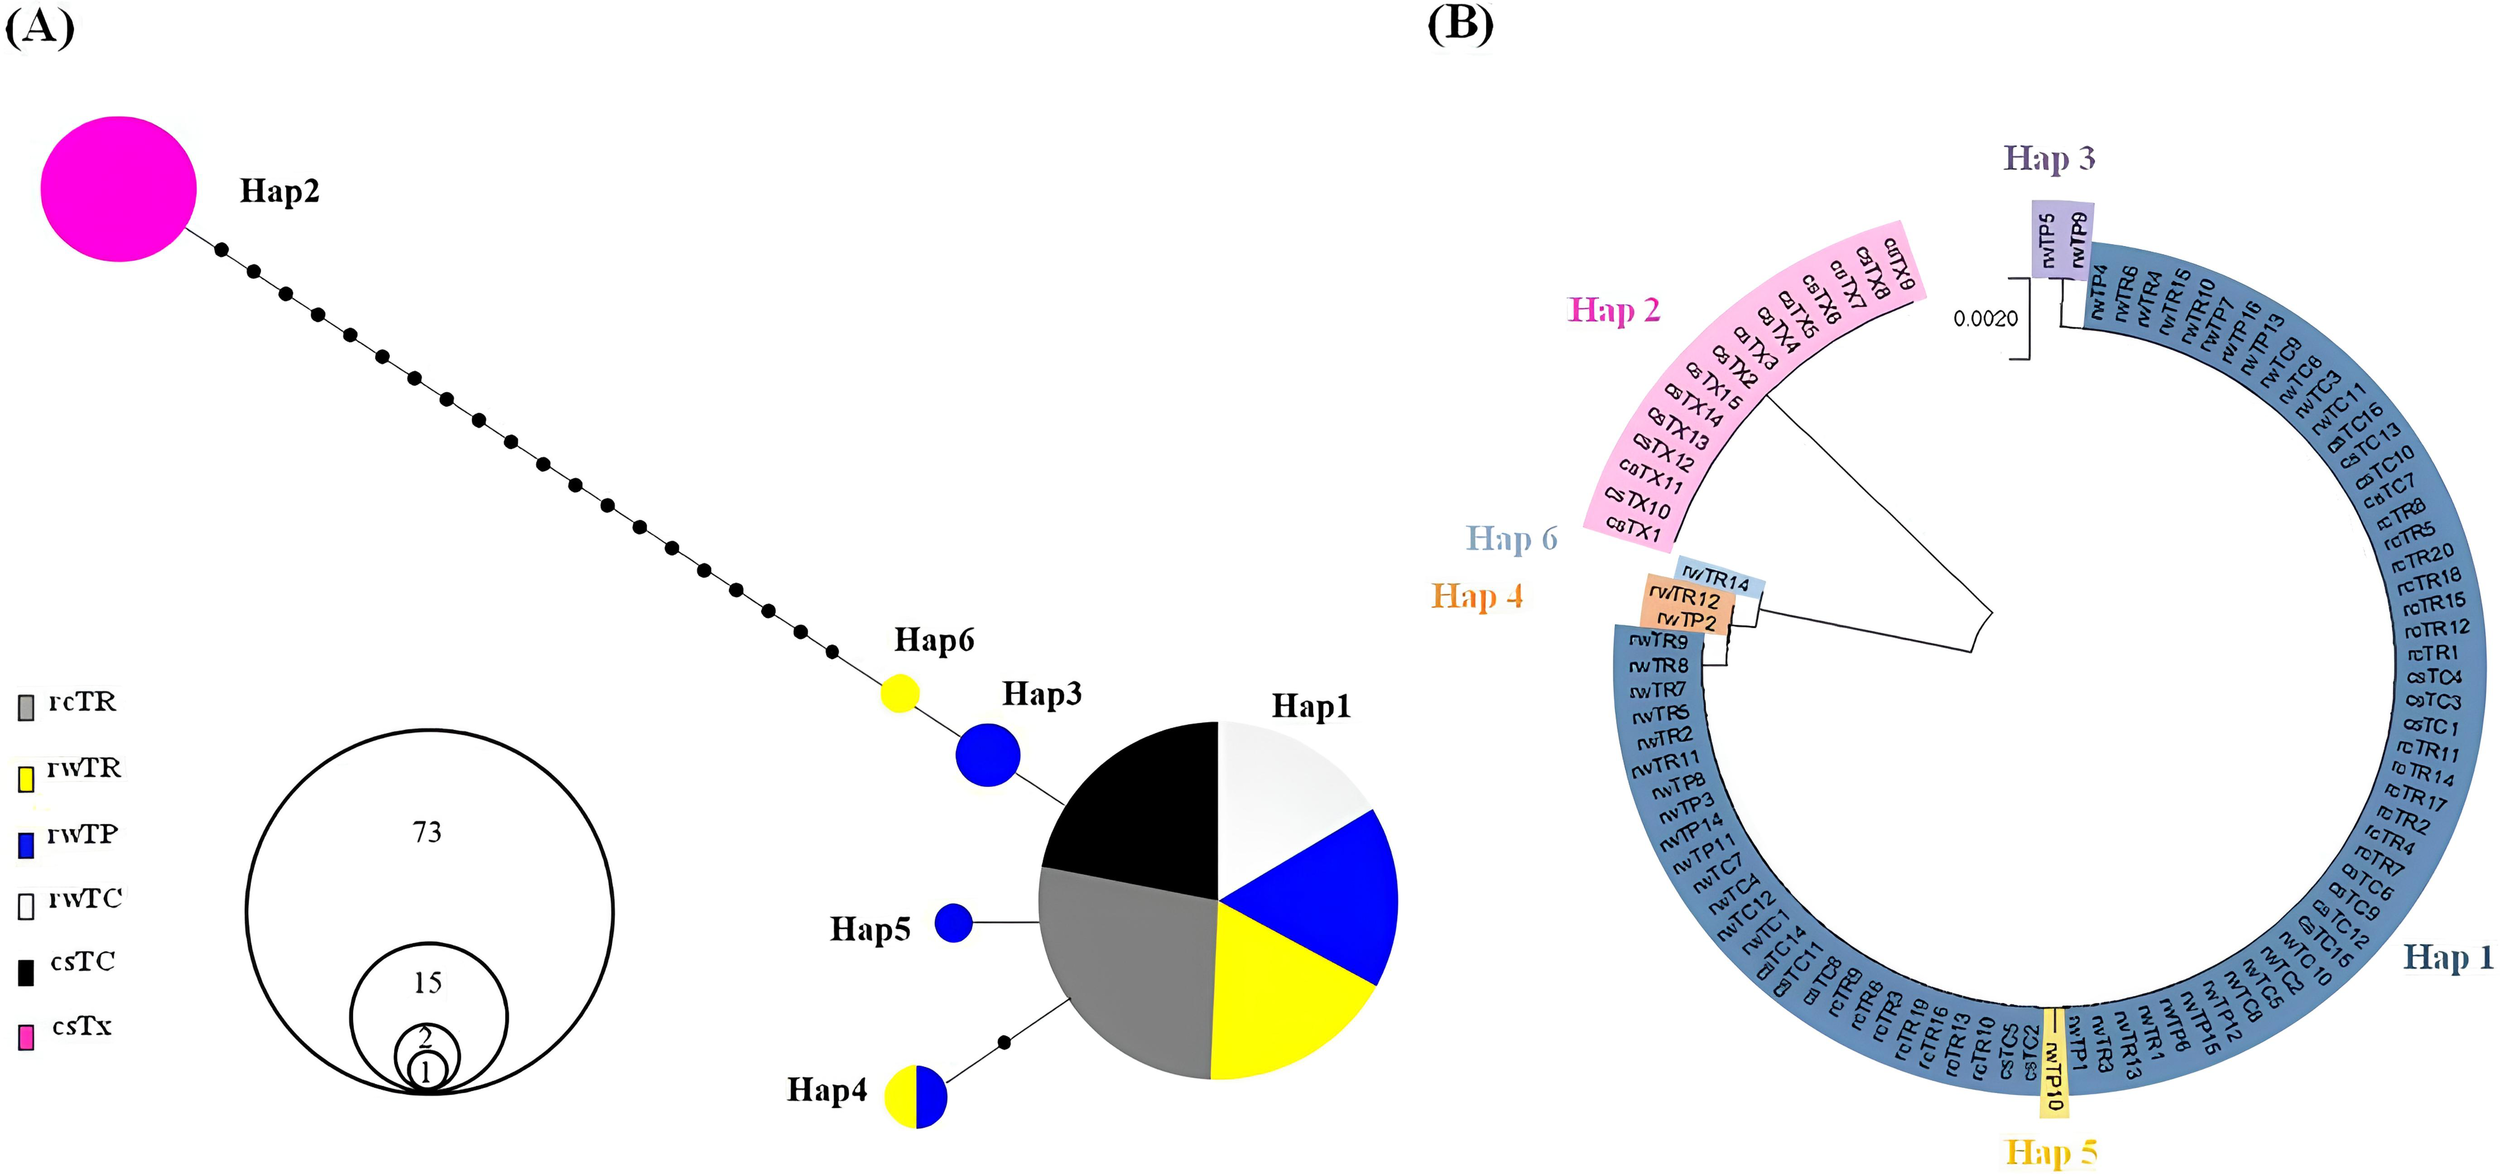
(A) Haplotype network and (B) genetic relationships, constructed using sequences of CoI-Cytb fragments from the six Takifugu groups (n=94). Each line in the network represents one mutational step between haplotypes. Circle size is proportional to the number of samples belonging to each respective haplotype. Small black circles indicate an intermediate haplotype necessary to construct the network. rcTR (n=20): cultured T. rubripes, rwTR (n=15): wild T. rubripes, rwTP (n=16): wild T. pseudommus, rwTC (n=12): wild T. chinensis, csTC (n=16): commercial T. chinensis, and csTX (outgroup, n=15): commercial T. xanthopterus.
3 Results
3.1 Identification of SSR loci for population genetics
In order to evaluate genetic relationships among T. rubripes, T. pseudommus, and T. chinensis, 15 SSR loci based on the genome of T. pseudommus were newly developed in this study. A total of 194,673 SSR loci were identified, consisting of di- (142,198, 73.0%), tri- (22,823, 11.7%), tetra- (18,307, 9.4%), penta- (7,562, 3.9%), hexa- (3,427, 1.8%), hepta- (192, 0.1%), and octa- (164, 0.1%) nucleotides sequence motifs. Among these SSR loci, candidates ranging from 150 to 300 bp were screened and validated using csTC (n=16) and csTX (n=15) specimens through conventional PCR, to ascertain the presence of null alleles or large allele dropout. In the initial screening, seven SSR loci composed of di- (n=6) and tri- (n=1) nucleotide sequence motifs were selected (Table 1), amplifying their expected PCR products in the Takifugu species. However, these seven loci failed to differentiate the rwTR (n=15), rwTP (n=16), and rwTC (n=12) groups. Conversely, the csTX (n=15), employed as an outgroup, formed a distinct clade from these closely related three Takifugu species (Supplementary Figure 1). In general, SSRs with di- and tri-nucleotide sequence motifs exhibit numerous variations within a population, which can be advantageous for distinguishing differences between individuals. Subsequently, to improve the resolution of SSR loci for distinguishing differences between populations, eight additional SSR loci with longer motifs were developed. These eight SSR loci comprised tri- (n=3), tetra- (n=2), hepta- (n=2), and octa- (n=1) motifs (Table 1) and amplified their expected PCR products without null alleles in our PCR analysis.
The statistics of these 15 SSR loci were evaluated using three groups of wild Takifugu species, including rwTR (n=15), rwTP (n=16), and rwTC (n=12) (Table 1). The TP8-1 locus, with an octa-nucleotide sequence motif, revealed moderate values of NA (4), HO (0.65), HE (0.66), and polymorphic information content (PIC, 0.59), whereas the other seven loci showed highly informative values of NA (8–24), HO (0.63–098), HE (0.66–0.93), and PIC (0.63–0.93). Additionally, pairwise linkage disequilibrium analysis revealed no significant allelic associations among the 15 loci (P>0.05). Consequently, these 15 SSR loci were thought to be highly informative genetic markers and were subsequently utilized to investigate further genetic relationships among six Takifugu groups, including rcTR (n=20), rwTR (n=15), rwTP (n=16), rwTC (n=12), csTC (n=16), and csTX (n=15).
3.2 Genetic diversity among the six populations
Initially, genetic diversity at the mtDNA level was analyzed using CoI-Cytb sequences of the six groups. A total of six haplotypes were observed among 94 individuals (Figure 2A). As expected, all csTX individuals, used as an outgroup, belonged only to haplotype 2 and clustered in one clade distinct from the remaining five Takifugu populations. All individuals in the rcTR, rwTC, and csTC groups belonged to haplotype 1, which also included the majority of individuals from the rwTR (n=13) and rwTP (n=12) groups. Only four individuals from the rwTP group belonged to haplotypes 3–5, and two individuals from the rwTR group belonged to haplotypes 4 and 6. Additionally, haplotypes 1, 3, and 5 formed a clade separated from haplotypes 4 and 6, as suggested in the phylogenetic tree of Figure 2B. As suggested in Table 2, estimated values of h and π were found to be 0.4417 and 0.000651 in the rwTP group and 0.2571 and 0.000428 in the rwTR group, respectively. A low level of genetic diversity was observed in the closely related Takifugu species, including the five groups, with h and π values of 0.3743 and 0.006849, respectively, indicative of a shallow evolutionary history.
Table 2
| Groups | CoI-Cytb fragments (934 bp) | 15 SSR loci | ||||||||||
|---|---|---|---|---|---|---|---|---|---|---|---|---|
| N | NH | HR | h | π | N | NA | AR | HE | HO | FIS | HWE | |
| rcTR | 20 | 1 | 0.00 | 0.0000 ± 0.0000 | 0.000000 ± 0.000000 | 20 | 3.27 | 3.24* | 0.60 | 0.72 | -0.181 | * |
| rwTR | 15 | 3 | 1.60 | 0.2571 ± 0.1416 | 0.000428 ± 0.000471 | 15 | 9.87 | 9.20 | 0.83 | 0.84 | 0.020 | * |
| rwTP | 16 | 4 | 2.45 | 0.4417 ± 0.1446 | 0.000651 ± 0.000609 | 16 | 10.47 | 9.31 | 0.83 | 0.77 | 0.105 | * |
| rwTC | 12 | 1 | 0.00 | 0.0000 ± 0.0000 | 0.000000 ± 0.000000 | 12 | 9.93 | 9.93 | 0.81 | 0.82 | 0.027 | 0.8258 |
| csTC | 16 | 1 | 0.95 | 0.0000 ± 0.0000 | 0.000000 ± 0.000000 | 16 | 12.07 | 10.79 | 0.86 | 0.73 | 0.182 | * |
| csTX | 15 | 1 | 0.00 | 0.0000 ± 0.0000 | 0.000000 ± 0.000000 | 15 | 8.27 | 7.67 | 0.69 | 0.63 | 0.094 | * |
| Entire groups | 94 | 7 | 0.83 | 0.3743 ± 0.0570 | 0.006849 ± 0.003626 | 94 | 21.27 | 11.10 | 0.88 | 0.75 | 0.154 | * |
Genetic diversity statistics for the six Takifugu groups from both the mitochondrial DNA and fifteen simple sequence repeat loci.
N, sample size; NH, number of haplotypes; HR, haplotype richness; h, haplotype diversity; π, nucleotide diversity; NA, observed mean number of alleles across fifteen loci; AR, allelic richness; HE, expected heterozygosity; HO, observed heterozygosity; FIS, inbreeding coefficient; HWE, P values for multi-locus tests for Hardy–Weinberg equilibrium; rcTR, reference cultured T. rubripes; rwTR, reference wild T. rubripes; rwTP, reference wild T. pseudommus; rwTC, reference wild T. chinensis; csTC, commercial T. chinensis; csTX, commercial T. xanthopterus; *: P<0.01.
Subsequently, genetic diversity at the microsatellite level was analyzed using the 15 SSR loci of the six groups (Table 2). The values of NA, HE, HO, and FIS were 21.27, 0.88, 0.75, and 0.15, respectively, with significant HWE deviations (P<0.01) in the entire populations. The lowest values (3.27, 0.60, 0.72, -0.18) were observed in the rcTC group, which showed a significantly lower level of AR compared to the other four groups, excluding rwTX, (Kruskal-Wallis test, P<0.01). In contrast to mtDNA diversity, the level of genetic diversity analyzed by the 15 SSR loci was higher overall, with the rcTR group showing the lowest diversity in the entire populations.
3.3 Genetic differentiation and population structure
Pairwise FST values were estimated using CoI-Cytb sequences and the 15 SSR loci for the six groups (Table 3). The FST estimates obtained for the mtDNA dataset were not significant among the closely related Takifugu populations, including rcTR, rwTR, rwTP, rwTC, and csTC; however, a significantly high differentiation was observed between the csTX group and these five groups (FST ranging from 0.9836 to 1.0000, P<0.01), as previously suggested in Figure 2. For the FST estimates obtained from the 15 SSR loci, significant divergence was observed between the csTX group and the other five groups (FST ranging from 0.1653 to 0.3034, P<0.01), and no significant FST estimates were observed among rwTR, rwTP, and rwTC groups, similar to the mtDNA data. However, interestingly, rcTR group showed highly significant differentiation from its counterpart group (rwTR, FST=0.1884) as well as closely related populations (rwTP, FST=0.1773 and rwTC, FST=0.2006), with the highest FST estimates (0.3034) observed between rcTR and csTX groups. Additionally, the csTC group also exhibited significant genetic differentiation from its counterpart group (rwTC) and closely related populations (rwTR and rwTP), with low FST values ranging from 0.0259-0.0 291 (P<0.01).
Table 3
| Groups | rcTR | rwTR | rwTP | rwTC | csTC | csTX |
|---|---|---|---|---|---|---|
| rcTR | 0.1884* | 0.1773* | 0.2006* | 0.1866* | 0.3034* | |
| rwTR | 0.01984 | -0.0021 | 0.0075 | 0.0266* | 0.1722* | |
| rwTP | 0.04364 | -0.03488 | -0.0018 | 0.0259* | 0.1848* | |
| rwTC | 0.00000 | -0.01572 | 0.00497 | 0.0291* | 0.1879* | |
| csTC | 0.00000 | 0.00444 | 0.02667 | 0.00000 | 0.1653* | |
| csTX | 1.00000* | 0.99138* | 0.98636* | 1.00000* | 1.00000* |
Pairwise genetic differentiation (FST) for the six Takifugu groups.
Pairwise genetic differentiation based on mtDNA CoI-Cytb sequences (below diagonal) and fifteen simple sequence repeat loci genotypes (above diagonal) for the six Takifugu groups; rcTR, reference cultured T. rubripes; rwTR, reference wild T. rubripes; rwTP, reference wild T. pseudommus; rwTC, reference wild T. chinensis; csTC, commercial T. chinensis; csTX, commercial T. xanthopterus; *P<0.01.
To estimate population structure within the six groups (rcTR, rwTR, rwTP, rwTC, csTC, and csTX), STRUCTURE analysis was performed using the dataset of 15 SSR loci. Subsequently, Bayesian clustering analysis suggested the largest delta K value (224) at 3 for this dataset, indicating that the six populations are most likely to form three distinct genetic clusters. At K=3, rwTR, rwTP, rwTC and csTC were clustered together, indicating genetic similarity among them, while csTX and rcTR formed two distinct clusters (Figure 3A). This estimated structure was further validated by FCA where different populations were separated along the x-axis, and individuals within populations were differentiated by their genotypes at the 15 SSR loci along the y-axis. This correspondence analysis yielded the same clustering result as the STRUCTURE analysis (Figure 3B). Additionally, phylogenetic analysis using the same genotypic dataset indicated three distinct clades, consistent with the results of STRUCTURE and FCA (Figure 3C). These genetic data strongly suggest that T. rubripes, T. pseudommus, and T. chinensis belong to the same genetic population. Therefore, our next strategy was focused on finding genetic variations that cause morphological differences.
Figure 3
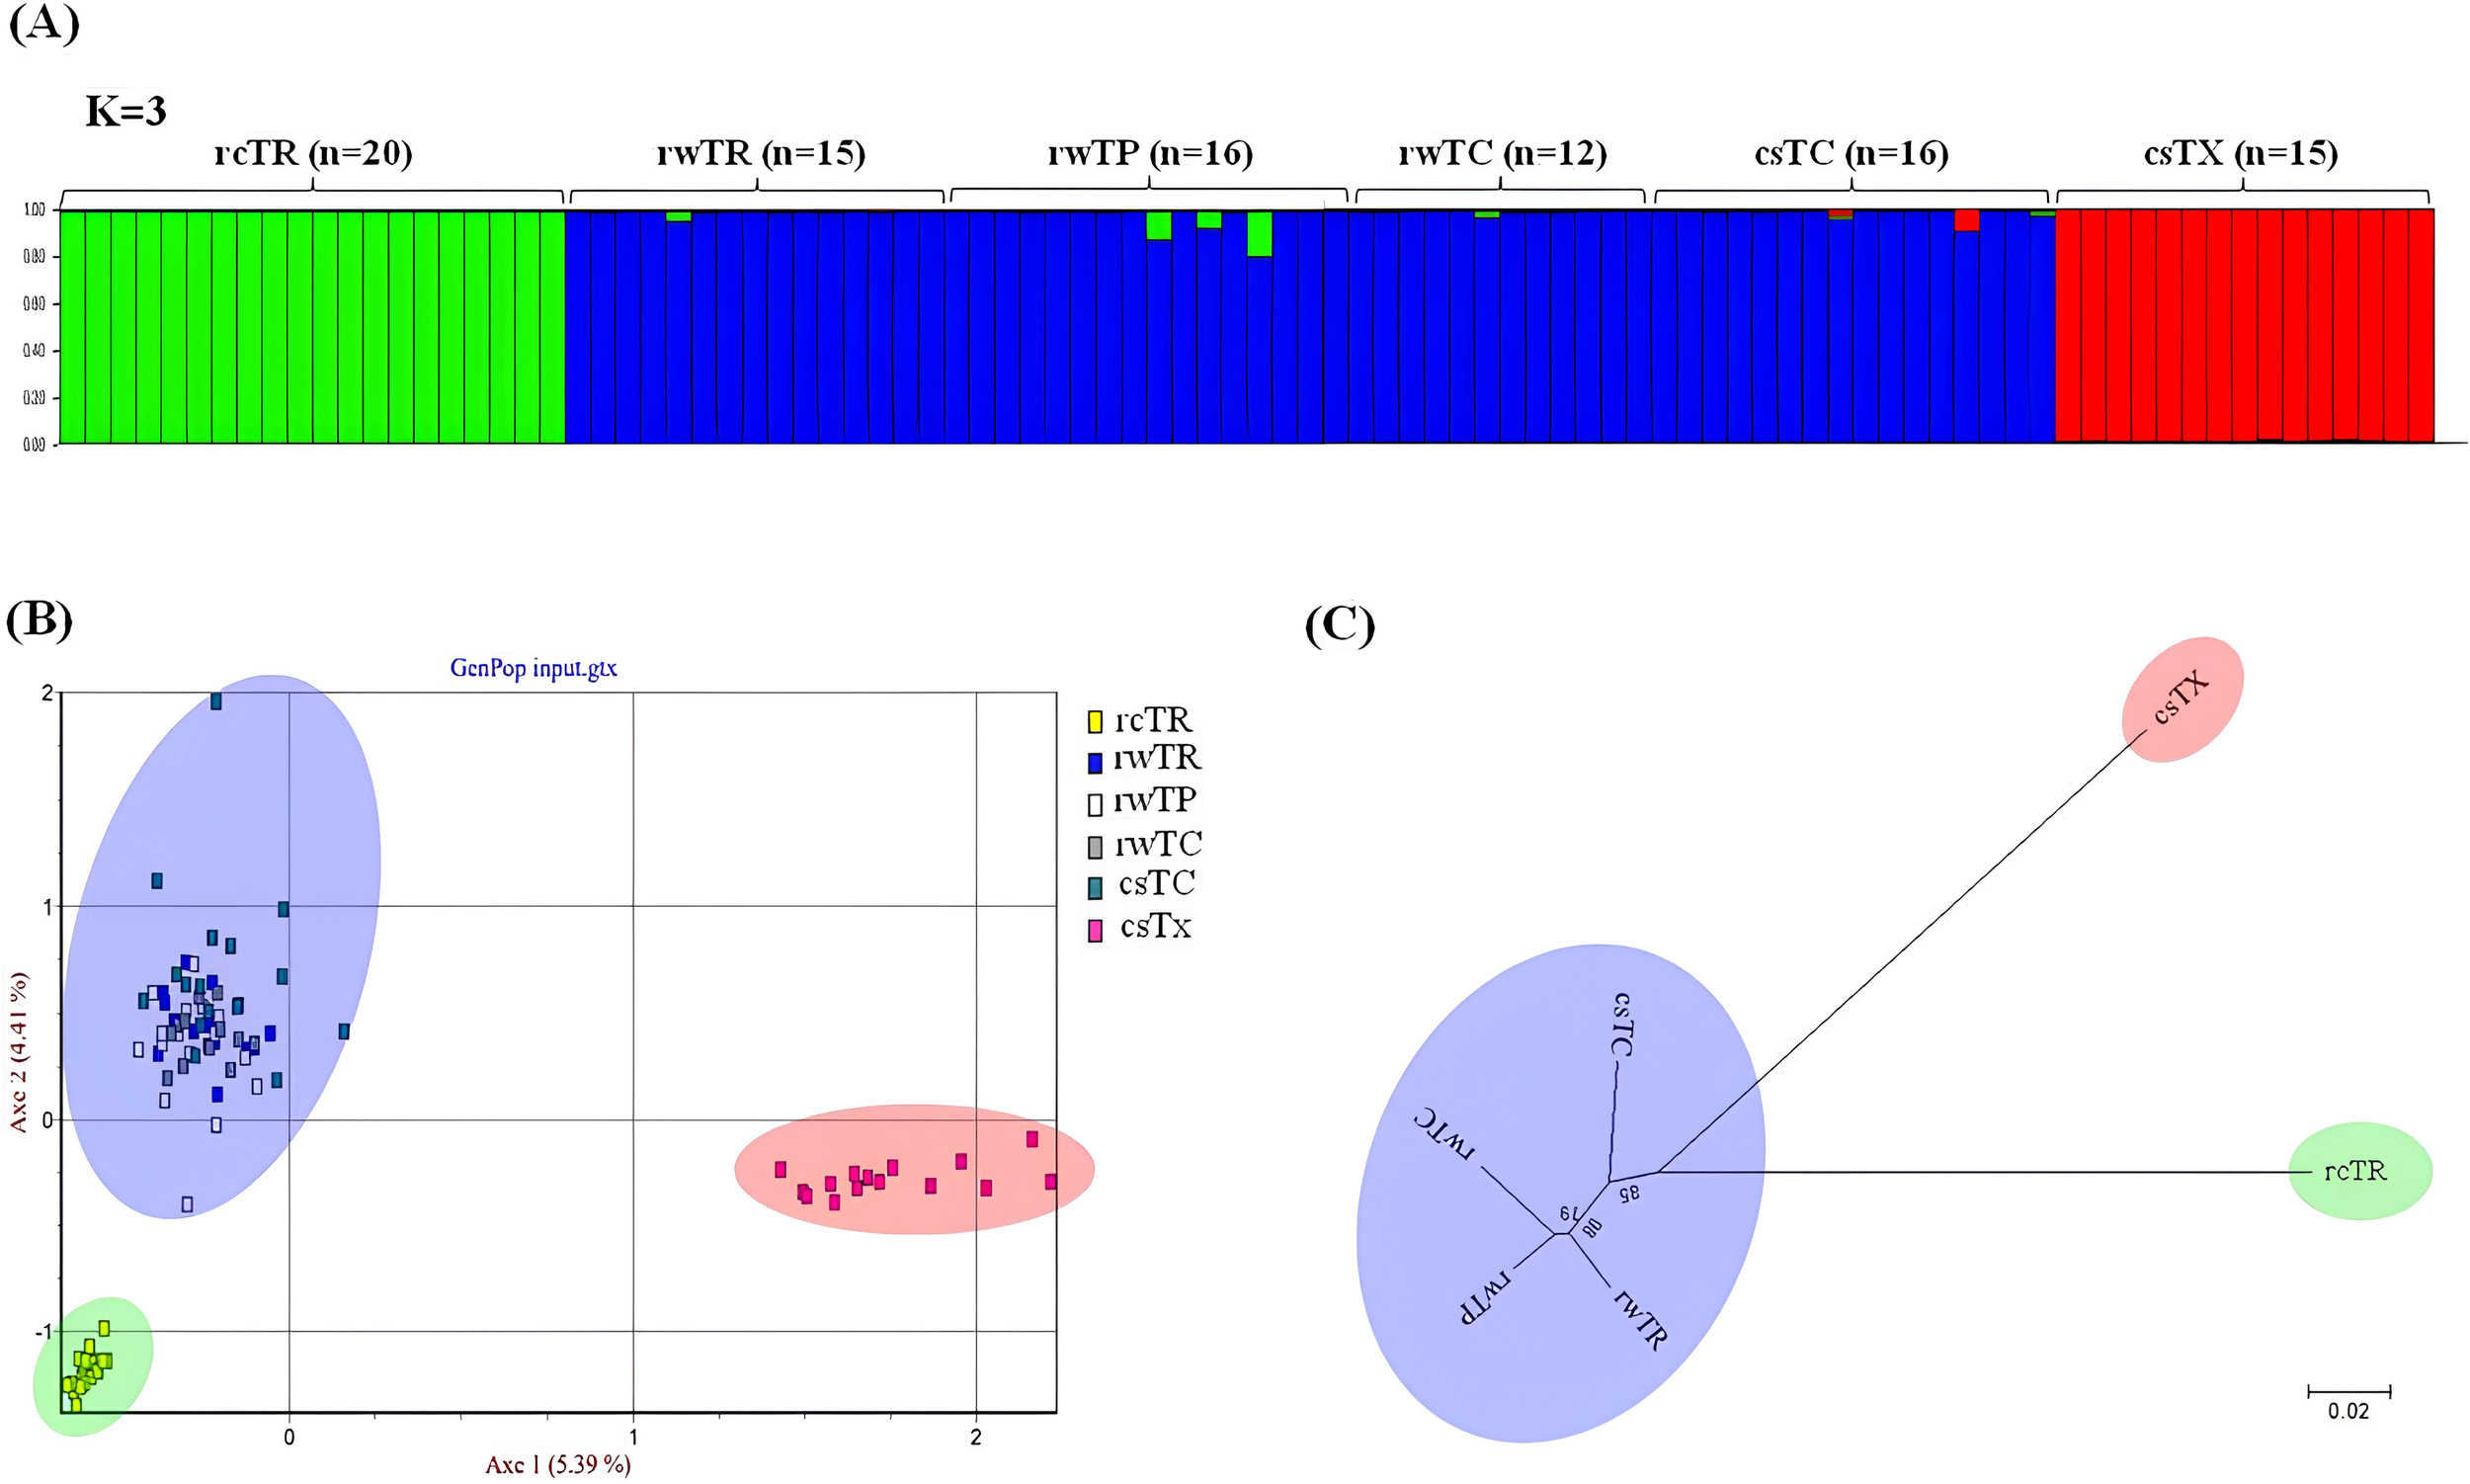
(A) Population structure analyzed using a Bayesian model, (B) factorial correspondence analysis, and (C) a neighbor-joining tree based on SSR allelic variations of the six Takifugu groups (n=94). rcTR (n=20): cultured T. rubripes, rwTR (n=15): wild T. rubripes, rwTP (n=16): wild T. pseudommus, rwTC (n=12): wild T. chinensis, csTC (n=16): commercial T. chinensis, and csTX (outgroup, n=15): commercial T. xanthopterus.
3.4 SNP variants effect
In order to ensure the quality and integrity of data generated from WGS of T. pseudommus, a quality control process was performed, resulting in a total of 133,827,553 read pairs and 40,148,265,900 bases, which yielded 104.5 × coverage. Subsequently, these sequencing data were compared with the reference genome of T. rubripes that is only available in the NCBI database among closely related three Takifugu species (T. rubripes, T. pseudommus, and T. chinensis). The analysis of genetic variations at SNP level between T. rubripes and T. pseudommus revealed a total of 1,438,490 SNPs, 377,741 deletions, and 356,158 insertions, which were distributed in the following proportions: non-coding transcript (27.5%), intron (24.9%), downstream (19.5%), upstream (19.2%), and exon (1.7%). Variations in coding regions were categorized as silent mutations (130,932, 58.8%), missense mutations (91,077, 40.9%), and nonsense mutations (502, 0.2%). The missense to silent mutation ratio was calculated as 0.6956. Genes containing significant variations, such as gains (2,916 genes) or losses (93 genes) of start codons, gains (293 genes) or losses (98 genes) of stop codons, as well as deletions (900 genes) or insertions (688 genes) causing frame shifts, were screened (Supplementary Tables 2–7). These candidates were compared with the genes annotated by GO terms to evaluate the association between genetic and morphological differences, as described in Figure 1. Four candidates, exhibiting a gain of start codon at the 5′ untranslated region (5′ UTR), were found to correspond to four transcripts: GIPC PDZ domain-containing family member 1 (Gipc1; XM_003964708.3), oculocutaneous albinism II melanosomal transmembrane protein (Oca2; XM_003973827.2), premelanosome protein (Pmel; XM_029827414.1), and solute carrier family 7 member 11 (Slc7a11; XM_003977036.3). These transcripts are associated with regulation of melanin biosynthetic process (GO: 0048021). The presence of these start codons was further validated using Takifugu specimens (n=7, csTR1 and csTP1–6). Although an additional start codon was detected in the 5’ UTR of Gipc1 in two specimens, indicated by the yellow box in Supplementary Figure 2A, these SNPs were determined to be false positives, with no variations observed in the 5’ UTRs of Oca2, Pmel, and Slc7a11 within these species (Supplementary Figures 2B, D). Therefore, these SNP variations predicted by the SnpEff program are likely caused by sequencing errors in the NGS method used. Recently, a study reported that amelanism in Malawi golden cichlid fish (Melanochromis auratus) can be caused by a large deletion (5.4 kb) including exon 2 of Oca2 (Kratochwil et al., 2019). In this context, large deletions were searched for in the genome of T. pseudommus as a next step.
3.5 Screening and validation of large deletions on T. pseudommus
Through the comparison between genomes of T. rubripes and T. pseudommus, in-silico deletions over 1 kb were searched on the genome of T. pseudommus, revealing a total of 294 deletions with an average deletion size of 1,702 bp (Supplementary Figure 3). On average, there were 13.4 in-silico deletions per chromosome. Chromosome 11 had the most in-silico deletions (n=36), while chromosome 10 had none. Out of 294 in-silico deletions, 23.13% (n=68) were simple-repeat sequences, which could not generate primer sets due to their highly repetitive nature. Consequently, 226 primer sets were designed and initially tested with 14 Takifugu samples, revealing three distinct amplification patterns: (1) complete amplification (n=194, 65.99%, Supplementary Figure 4A), (2) non-amplification (n=20, 6.80%, Supplementary Figure 4B) and (3) sporadic amplification (n=12, 4.08%, Supplementary Figure 4C) in the 14 Takifugu samples. The twelve deletions (Ch1-5, Ch3-15, Ch5-11, Ch6-6, Ch7-19, Ch9-1, Ch13-11, Ch18-9, Ch20-1, Ch20-4, Ch20-13, Ch22-4) showing the sporadic amplification pattern were further validated with DNA extracts from 50 reference Takifugu specimens including rcTR (n=19), rwTR (n=11), rwTC (n=8), and rwTP (n=12). The amplification patterns observed in the 50 Takifugu specimens was not in agreement with their morphological characteristics, as suggested in Figure 1, wherein cultured T. rubripes showed complete amplification, while wild T. rubripes, T. pseudommus, and T. chinensis exhibited sporadic amplification. Thus, these genomic variations could not explain their morphological differences observed among the three closely related Takifugu species.
4 Discussion
The basal divergence of the main Takifugu lineage was estimated to have occurred approximately 2.4–4.7 million years ago. Subsequently, this ancestral lineage underwent rapid speciation within the marine environments of East Asia (Yamanoue et al., 2009). As described in the Introduction, T. rubripes, T. pseudommus, and T. chinensis are remarkably similar in appearance and genetics. Moreover, these three closely related species share habitats with limited distribution, such as the Yellow Sea and the East China Sea around the Korean Peninsula, facilitating opportunities for hybridization (Reza et al., 2011). A recent study documented the presence of natural hybrids exhibiting intermediate morphological features between T. rubripes and T. chinensis. Genetic analysis based on the sequences of CoI and Cytb genes revealed no differences among T. rubripes, T. chinensis, and their hybrid species (Baek et al., 2018). Multiple genetic studies indicate a lack of genetic differentiation among these three Takifugu species, implying a shared genetic background (Cui et al., 2005; Reza et al., 2011; Park et al., 2020). Therefore, this study primarily aims to assess whether these species exhibit genetic differentiation and, if not, to elucidate the genetic variations underlying their morphotypes diversity.
4.1 Analysis of population genetics
In our previous study (Kim and Kang, 2023), a combination of CoI and Cytb genes proved to be the most effective method for identifying pufferfish at the species level. Initially, genetic diversity was assessed among six groups, which included cultured T. rubripes (rcTR), wild T. rubripes (rwTR), wild T. pseudommus (rwTP), wild T. chinensis (rwTC), commercial T. chinensis (csTC), and commercial T. xanthopterus (csTX), using this combination. As indicated in Figure 2B and Table 3, only the csTX group, used as an outgroup, exhibited differentiation from the other five groups. These five groups displayed very limited number of haplotypes and low genetic diversity, making it insufficient to distinguish these closely related species (Figure 2A; Table 2). This result was well in accordance with those of previous studies using T. rubripes, T. chinensis, and T. pseudommus, where genetic distance ranged from 0.00 to 0.0083 across CoI, Cytb, and control regions (Baek et al., 2018).
Microsatellite markers generally exhibit high levels of polymorphism and follow a codominant inheritance pattern, coupled with a high mutation rate that leads to rapid evolution. These characteristics render SSR markers valuable tools in population genetics, allowing for the assessment of genetic diversity, population structure, and evolutionary events in closely related populations (Wright and Bentzen, 1995). Two previous studies, which investigated the genetic relationships between T. rubripes and T. chinensis, and between T. rubripes and T. pseudommus, utilized four and nine SSR markers, respectively (Cui et al., 2005; Reza et al., 2011). These markers were isolated through in-silico screening of the T. rubripes genome. Therefore, to achieve a more accurate assessment of the genetic relationships among the three Takifugu species, we developed 15 novel SSR loci based on the genome of T. pseudommus (Table 1). These 15 SSR loci were subsequently employed for further population genetic analysis among the six groups.
As expected, more genetic diversity was observed among the six groups with the 15 SSR loci dataset compared to the mtDNA dataset (Table 2). The lowest diversity values were observed in the rcTR group, which had a significantly low level of allelic richness (3.24). Interestingly, among the 15 SSR loci, the TP7-1 locus was found to be monomorphic only in the rcTR group, while genotypes ranging from 8 to 12 were observed in the other five groups. The TP7-1 locus was cloned from both the rcTR and rwTC groups, and the sequence and length of each clone were further evaluated. As shown in Supplementary Figure 5, the length of the TP7-1 locus was found to be 332 bp in all clones from the rcTR group, whereas clones from the rwTC group exhibited lengths of 275 bp, 318 bp, 325 bp, and 345 bp. Thus, this result further suggests that the genetic diversity of cultured T. rubripes is very limited compared to wild Takifugu species.
The population structure among the six groups exhibited three distinct clusters, with the rcTR and csTX groups being differentiated from the other four groups (Figure 3). This result was further supported by the FST estimates, which showed that the rcTR and csTX groups had significant divergence from the other four groups. The genetic distance (0.534–0.593) and differentiation (0.1773–0.2006) observed between the rcTR group and the three wild Takifugu groups (rwTR, rwTP, and rwTC) were comparable to those (0.653–0.671 and 0.1722–0.1879, respectively) observed between the csTX group and these three wild groups. In contrast, the smallest distance (0.032–0.046) and differentiation (-0.0021–0.0075) were observed among the three wild groups (Table 3; Figure 3C). These observations align well with the findings of a previous study (Cui et al., 2005), which highlighted that the low genetic diversity observed in cultured aquatic stocks resulted in significant genetic divergence among wild T. rubripes, wild T. pseudommus, and cultured T. rubripes populations, as previously described in the Introduction. In general, gene flow and admixture are more pronounced in natural environments than in farming environments, where fish in isolated rearing units do not interbreed, leading to increased genetic divergence.
It is generally reported that cultured aquatic stocks are genetically distinct from their counterparts due to physically divided habitats, variations in feed, artificial reproduction, and a strong founder effect (Yoon, 2020). Cultured T. rubripes is a selectively bred pufferfish species, and this artificial selection often involves outbreeding prior to the fixation of current traits (Figure 1), resulting in an excess of heterozygotes. This process can explain the negative FIS value (-0.181) observed in the rcTR group, while FIS values ranging from 0.02 to 0.105 were observed in the rwTR, rwTP, and rwTC groups (Table 2). Although the csTC group was clustered with the rwTR, rwTP, and rwTC groups (Figure 3), its FST analysis revealed significant genetic differentiation from these three populations, with FST values seven times lower compared to those of the rcTR group (Table 3). As shown in Supplementary Table 1, information regarding the status of wild or cultured pufferfish was obtained from the labels of commercial products. These data support the possibility that within the csTC group, some products did not declare information regarding the status of wild or cultured pufferfish, indicating the inclusion of cultured T. chinensis.
4.2 Evaluation of genomic variations
Although morphotypes plasticity can often lead to morphological differences in fish with the same genome (Meyer, 1987), we searched for genetic variations responsible for these morphological differences by comparing the genomes of T. rubripes and T. pseudommus, under our hypothesis that T. rubripes, T. chinensis, and T. pseudommus are genetically the same species despite exhibiting different morphological characteristics. Four candidate transcripts were identified for the Gipc1, Oca2, Pmel and Slc7a11 genes, which are previously reported to be responsible for the synthesis of melanin pigments and melanosomes. Although the SnpEff program predicted that these four transcripts gained an additional start codon in their 5′ UTR, our empirical experimental data suggest that these are false positives (Supplementary Figure 2). In a previous study, the sequences of melanocortin 1 and 4 receptors and their precursor pro-opiomelanocortin revealed 99-100% inter- and intra-specific identity, showed no variations in T. rubripes and T. chinensis populations, suggesting that these color-related genes are not related to their color pattern differences (Reza et al., 2008). Moreover, Oca2 is a gene known for its highly conserved function in various melanin synthesis pathways across vertebrates; however, our genomic analysis did not reveal any SNPs or large deletions in this gene among the three closely related Takifugu species unlike the results of a previous study using the Malawi golden cichlid (Kratochwil et al., 2019).
Instead, the 12 large deletions, which show sporadic patterns among wild T. rubripes, T. chinensis, and T. pseudommus, were identified through the genome of T. pseudommus (Supplementary Table 8). These deletions were mostly located in non-coding regions. Among them, six deletions were found in genomic regions that are not be transcribed, while the other six were located within the intron regions of transcribed genes. Only two deletions were annotated via ENSEMBL and were found within introns of transcripts as follows: 5-hydroxytryptamine 3A receptor (5-HT3 receptor; Ch1-5) and sterile alpha motif domain and histidine-aspartate domain-containing protein 1 (SAMHD1; Ch3-15). The 5-HT3 receptor, a cation-selective ion channel, facilitates neuronal depolarization and excitation in both the central and peripheral nervous systems (Barnes et al., 2009). SAMHD1, characterized as a dNTP triphosphohydrolase, plays key roles in repairing double-stranded breaks, maintaining genome stability, and preventing chronic inflammation (Coggins et al., 2020). Thus, these candidate variations would not directly contribute to the different color and/or spot patterns observed among the three closely related Takifugu species. However, the possibility cannot be ruled out that posttranscriptional variations caused by genomic differences, such as different splicing patterns or expression levels, may contribute to their morphological differences. For example, different expression levels of Kit ligand alleles have been shown to contribute to pigmentation differences between heavily melanized marine and sparsely melanized freshwater threespine sticklebacks (Gasterosteus aculeatus) (Miller et al., 2007). These different expression levels were caused by noncoding variations in the freshwater Kit ligand alleles. Additionally, approximately 80% of the changes in regulatory elements played a predominant role in the adaptive evolution of freshwater sticklebacks, while the remaining 20% affect coding DNA (Jones et al., 2012). Our independent research has focused on explaining how posttranscriptional variations in the candidate transcripts contribute to the morphological variations within species or among individuals.
4.3 Conclusion: speciation at genetic level
The majority of natural populations across various taxonomic groups display significant levels of genetic and morphotypes variation, and the majority of populations are in evolutionary stage 1, where there is no evidence of reproductive isolation or divergence into distinct groups (Hendry et al., 2009). Wild T. rubripes, T. pseudommus, and T. chinensis share the limited habitats and exhibit similar coloration patterns, resulting in the production of fertile hybrid crosses (Han et al., 2017). However, other Takifugu species exhibit morphotypes variations, including diverse coloration patterns, which may have contributed to their rapid speciation through sensory drive (Yamanoue et al., 2009). The rapid speciation of cichlids in Lakes Victoria was well investigated in the context of sexual selection, with a particular focus on female preference for male coloration (Seehausen and van Alphen, 1998). As depicted in Figure 1, T. xanthopterus displays distinctive striped patterns on its dorsal side and possesses yellow fins, distinguishing it from the majority of other Takifugu species. The levels of genetic differentiation (FST ranging from 0.1722 to 0.1879) between T. xanthopterus and the three wild Takifugu species (T. rubripes, T. pseudommus, and T. chinensis) were comparable to those observed between benthic and limnetic sticklebacks at stage 3 (FST values ranging from 0.209 to 0.336; characterized by strongly discontinuous variation and strong but reversible reproductive isolation) (Hendry et al., 2009). Consequently, T. xanthopterus may become reproductively isolated through this sensory drive, leading to genetic divergence and the eventual formation of distinct species. Conversely, genetic diversity and differentiation among the three closely related Takifugu species were notably low, with all species belonging to a single genetic cluster (Figures 2, 3; Tables 2, 3), consistent with findings from previous studies (Cui et al., 2005; Reza et al., 2011; Park et al., 2020). The reuse of globally shared genetic variations, including chromosomal inversions, plays a crucial role in the repeated evolution of distinct marine and freshwater threespine sticklebacks and in maintaining divergent ecotypes during the early stages of reproductive isolation (Jones et al., 2012). However, our genomic analysis did not detect direct genetic evidence capable of influencing the characteristic morphotypes differences of each species. Collectively, our findings strongly suggest that wild T. rubripes, T. chinensis, and T. pseudommus constitute an admixed population capable of interbreeding. This implies that they are a single species within the same genetic pool. Therefore, their morphological differences can be considered individual and continuous variations within the context of sympatry, corresponding to evolutionary stage 1.
Statements
Data availability statement
The datasets presented in this study can be found in online repositories. The names of the repository/repositories and accession number(s) can be found in the article/Supplementary Material.
Ethics statement
The animal study was approved by Animal Experimentation Ethics Committee of Seoul Women’s University (SWU IACUC 2024A-15). The study was conducted in accordance with the local legislation and institutional requirements.
Author contributions
JYL: Formal analysis, Investigation, Validation, Writing – original draft. KHK: Formal analysis, Validation, Writing – original draft. HJL: Data curation, Methodology, Writing – review & editing. S-GH: Data curation, Methodology, Writing – review & editing. TSK: Conceptualization, Funding acquisition, Supervision, Writing – original draft, Writing – review & editing, Methodology.
Funding
The author(s) declare financial support was received for the research, authorship, and/or publication of this article. This work was supported by the National Research Foundation of Korea under Grant (NRF-2022R1F1A1066395) and Seoul Women’s University under Grant (2024-0088).
Acknowledgments
Muscle tissues of reference Takifugu species were kindly provided by the National Institute of Fisheries Science and the National Marine Biodiversity Institute of Korea. The authors thank Kwanho Kim for assistance with bioinformatics analysis and Tanggle J. Park for her inspirational contributions. The illustrations of Takifugu species were reproduced courtesy of Yoorim Kim.
Conflict of interest
The authors declare that the research was conducted in the absence of any commercial or financial relationships that could be construed as a potential conflict of interest.
Generative AI statement
The author(s) declare that no Generative AI was used in the creation of this manuscript.
Publisher’s note
All claims expressed in this article are solely those of the authors and do not necessarily represent those of their affiliated organizations, or those of the publisher, the editors and the reviewers. Any product that may be evaluated in this article, or claim that may be made by its manufacturer, is not guaranteed or endorsed by the publisher.
Supplementary material
The Supplementary Material for this article can be found online at: https://www.frontiersin.org/articles/10.3389/fmars.2024.1506390/full#supplementary-material
References
1
Alkan C. Coe B. P. Eichler E. E. (2011). Genome structural variation discovery and genotyping. Nat. Rev. Genet.12, 363–376. doi: 10.1038/nrg2958
2
Andrews S. (2010). FastQC: a quality control tool for high throughput sequence data. Available online at: https://www.bioinformatics.babraham.ac.uk/projects/fastqc/ (Accessed June 24, 2024).
3
Baek J. I. Han K. H. Lee S. H. Kim J. K. (2018). Morphological and molecular comparison among three species and one unidentified Takifugu species. Korean J. Fish. Aquat. Sci.51, 404–410. doi: 10.5657/KFAS.2018.0404
4
Barnes N. M. Hales T. G. Lummis S. C. Peters J. A. (2009). The 5-HT3 receptor–the relationship between structure and function. Neuropharmacology56, 273–284. doi: 10.1016/j.neuropharm.2008.08.003
5
Beier S. Thiel T. Munch T. Scholz U. Mascher M. (2017). MISA-web: a web server for microsatellite prediction. Bioinform.33, 2583–2585. doi: 10.1093/bioinformatics/btx198
6
Belkhir K. Borsa P. Chikhi L. Raufaste N. Bonhomme F. (2004). GENETIX 4.05, Population genetics software forWindowsTM. Available online at: http://www.genetix.univ-montp2.fr/genetix/genetix.html (Accessed July 10, 2024).
7
Cingolani P. Platts A. Wang le L. Coon M. Nguyen T. Wang L. et al . (2012). A program for annotating and predicting the effects of single nucleotide polymorphisms, SnpEff: SNPs in the genome of Drosophila melanogaster strain w1118; iso-2; iso-3. Fly6, 80–92. doi: 10.4161/fly.19695
8
Coggins S. A. Mahboubi B. SChinazi R. F. Kim B. (2020). SAMHD1 functions and human diseases. Viruses12, 382. doi: 10.3390/v12040382
9
Cui J.-Z. Shen X.-Y. Yang G.-P. Gong Q.-L. Gu Q.-Q. (2005). Characterization of microsatellite DNAs in Takifugu rubripes genome and their utilization in the genetic diversity analysis of T. rubripes and T. pseudommus. Aquac.250, 129–137. doi: 10.1016/j.aquaculture.2005.04.041
10
Evanno G. Regnaut S. Goudet J. (2005). Detecting the number of clusters of individuals using the software STRUCTURE: a simulation study. Mol. Ecol.14, 2611–2620. doi: 10.1111/j.1365-294X.2005.02553.x
11
Excoffier L. Lischer H. E. (2010). Arlequin suite ver 3.5: a new series of programs to perform population genetics analyses under Linux and Windows. Mol. Ecol. Resour.10, 564–567. doi: 10.1111/j.1755-0998.2010.02847.x
12
Goudet J. (2001). FSTAT, a program to estimate and test gene diversities and fixation indices (version 2.9.3). Available online at: https://www.unil.ch/popgen/softwares/fstat.htm (Accessed July 10, 2024).
13
Han K. H. Baek J. I. Lee S. H. Hwang J. H. Shin L. S. Kim H. J. et al . (2017). An illustrated guide book to the detailed pufferfishes. 1st (Cheongju, Republic of Korea: Ministry of Food and Drug Safety (MFDS).
14
Hendry A. P. Bolnick D. I. Berner D. Peichel C. L. (2009). Along the speciation continuum in sticklebacks. J. Fish Biol.75, 2000–2036. doi: 10.1111/j.1095-8649.2009.02419.x
15
Jones F. C. Grabherr M. G. Chan Y. F. Russell P. Mauceli E. Johnson J. et al . (2012). The genomic basis of adaptive evolution in threespine sticklebacks. Nature484, 55–61. doi: 10.1038/nature10944
16
Kang T. S. (2021). Identification and authentication of commercial mi-iuy croaker (Miichthys miiuy) products by two PCR-based methods. J. Food Prot.84, 463–471. doi: 10.4315/JFP-20-143
17
Kang T. S. (2022). Characterization of the complete mitochondrial genome of Takifugu pseudommus (Actinopterygii, Tetraodontidae). Mitochondrial DNA. B. Resour.7, 556–557. doi: 10.1080/23802359.2022.2054739
18
Kim K. H. Kang T. S. (2023). A systematic approach for pufferfish identification at the species level using DNA-based methods. Food Control147, 109574. doi: 10.1016/j.foodcont.2022.109574
19
Kratochwil C. F. Urban S. Meyer A. (2019). Genome of the Malawi golden cichlid fish (Melanochromis auratus) reveals exon loss of oca2 in an amelanistic morph. Pigment Cell Melanoma Res.32, 719–723. doi: 10.1111/pcmr.12799
20
Larkin M. A. Blackshields G. Brown N. P. Chenna R. McGettigan P. A. McWilliam H. et al . (2007). Clustal W and clustal X version 2.0. Bioinform.23, 2947–2948. doi: 10.1093/bioinformatics/btm404
21
Lee J. Y. Kim K. H. Kang T. S. (2023). Species identification and monitoring of labeling compliance for commercial pufferfish products sold in korean on-line markets. J. Food Hyg. Saf.38, 464~475. doi: 10.13103/JFHS.2023.38.6.464
22
Li H. (2012). Exploring single-sample SNP and INDEL calling with whole-genome de novo assembly. Bioinform.28, 1838–1844. doi: 10.1093/bioinformatics/bts280
23
Liu K. Muse S. V. (2005). PowerMarker: an integrated analysis environment for genetic marker analysis. Bioinform.21, 2128–2129. doi: 10.1093/bioinformatics/bti282
24
Meyer A. (1987). Phenotypic plasticity and heterochrony in cichlasoma managuense (Pisces, cichlidae) and their implications for speciation in cichlid fishes. Evol.41, 1357–1369. doi: 10.1111/j.1558-5646.1987.tb02473.x
25
MFDS (2021).Specifications for fishery products, common standards and specifications for general. In: Food code. Available online at: https://www.mfds.go.kr/eng/brd/m_15/view.do?seq=72437&srchFr=&srchTo=&srchWord=&srchTp=&itm_seq_1=0&itm_seq_2=0&multi_itm_seq=0&company_cd=&company_nm=&page=1 (Accessed July 11, 2024).
26
Miller C. T. Beleza S. Pollen A. A. Schluter D. Kittles R. A. Shriver M. D. et al . (2007). cis-Regulatory changes in Kit ligand expression and parallel evolution of pigmentation in sticklebacks and humans. Cell131, 1179–1189. doi: 10.1016/j.cell.2007.10.055
27
Park Y. J. Lee M. N. Noh J. K. Noh E. S. Kang J. H. Park J. Y. et al . (2020). Classification of Takifugu rubripes, T. chinensis and T. pseudommus by genotyping-by-sequencing. PloS One15, e0236483. doi: 10.1371/journal.pone.0236483
28
Petit R. J. El Mousadik A. Pons O. (1998). Identifying populations for conservation on the basis of genetic markers. Conserv. Biol.12, 844–855. doi: 10.1111/j.1523-1739.1998.96489.x
29
Pritchard J. K. Stephens M. Donnelly P. (2000). Inference of population structure using multilocus genotype data. Genetics155, 945–959. doi: 10.1093/genetics/155.2.945
30
Reza S. Furukawa S. Mochizuki T. Matsumura H. Watabe S. (2008). Genetic comparison between torafugu Takifugu rubripes and its closely related species karasu Takifugu chinensis. Fisheries Sci.74, 743–754. doi: 10.1111/j.1444-2906.2008.01585.x
31
Reza M. S. Kinoshita S. Furukawa S. Mochizuki T. Watabe S. (2011). Microsatellite and mitochondrial DNA analyses reveal no genetic difference between two pufferfish species torafugu Takifugu rubripes and karasu T. chinensis. Fisheries Sci.77, 59–67. doi: 10.1007/s12562-010-0310-y
32
Rousset F. (2008). genepop'007: a complete re-implementation of the genepop software for Windows and Linux. Mol. Ecol. Resour.8, 103–106. doi: 10.1111/j.1471-8286.2007.01931.x
33
Sambrook J. Russell D. W. (2006). The condensed protocols from molecular cloning: A laboratory manual (New York, USA: Cold Spring Harbor Laboratory Press).
34
Seehausen O. van Alphen J. J. (1998). The effect of male coloration on female mate choice in closely related Lake Victoria cichlids (Haplochromis nyererei complex). Behav. Eco. Sociobiol42, 1–8. doi: 10.1007/s002650050405
35
Takezaki N. Nei M. Tamura K. (2010). POPTREE2: Software for constructing population trees from allele frequency data and computing other population statistics with Windows interface. Mol. Biol. Evol.27, 747–752. doi: 10.1093/molbev/msp312
36
Tamura K. Stecher G. Kumar S. (2021). MEGA11: molecular evolutionary genetics analysis version 11. Mol. Biol. Evol.38, 3022–3027. doi: 10.1093/molbev/msab120
37
Teacher A. G. Griffiths D. J. (2011). HapStar: automated haplotype network layout and visualization. Mol. Ecol. Resour.11, 151–153. doi: 10.1111/j.1755-0998.2010.02890.x
38
Thorvaldsdottir H. Robinson J. T. Mesirov J. P. (2013). Integrative Genomics Viewer (IGV): high-performance genomics data visualization and exploration. Brief. Bioinform.14, 178–192. doi: 10.1093/bib/bbs017
39
Turner G. F. Seehausen O. Knight M. E. Allender C. J. Robinson R. L. (2001). How many species of cichlid fishes are there in African lakes? Mol. Ecol.10, 793–806. doi: 10.1046/j.1365-294x.2001.01200.x
40
Untergasser A. Cutcutache I. Koressaar T. Ye J. Faircloth B. C. Remm M. et al . (2012). Primer3–new capabilities and interfaces. Nucleic. Acids Res.40, e115. doi: 10.1093/nar/gks596
41
Wright J. M. Bentzen P. (1995). Microsatellites: genetic markers for the future (Dordrecht, Netherlands: Springer), 117–121.
42
Yamanoue Y. Miya M. Matsuura K. Miyazawa S. Tsukamoto N. Doi H. et al . (2009). Explosive speciation of Takifugu: another use of fugu as a model system for evolutionary biology. Mol. Biol. Evol.26, 623–629. doi: 10.1093/molbev/msn283
43
Yoon J. M. (2020). Genetic differences in natural and cultured river pufferfish populations by PCR analysis. Dev. Reprod.24, 327–336. doi: 10.12717/DR.2020.24.4.327
Summary
Keywords
genus Takifugu, microsatellite, population genetics, speciation, next generation sequencing
Citation
Lee JY, Kim KH, Lee HJ, Hwang S-G and Kang TS (2025) Genetic variations suggests that Takifugu rubripes, T. chinensis, and T. pseudommus are the same species with a shared gene pool. Front. Mar. Sci. 11:1506390. doi: 10.3389/fmars.2024.1506390
Received
05 October 2024
Accepted
19 December 2024
Published
14 January 2025
Volume
11 - 2024
Edited by
Ivana Veneza, Federal University of Western Pará, Brazil
Reviewed by
Mbaye Tine, Gaston Berger University, Senegal
Ioannis A. Giantsis, Aristotle University of Thessaloniki, Greece
Updates
Copyright
© 2025 Lee, Kim, Lee, Hwang and Kang.
This is an open-access article distributed under the terms of the Creative Commons Attribution License (CC BY). The use, distribution or reproduction in other forums is permitted, provided the original author(s) and the copyright owner(s) are credited and that the original publication in this journal is cited, in accordance with accepted academic practice. No use, distribution or reproduction is permitted which does not comply with these terms.
*Correspondence: Tae Sun Kang, missa1976@swu.ac.kr
Disclaimer
All claims expressed in this article are solely those of the authors and do not necessarily represent those of their affiliated organizations, or those of the publisher, the editors and the reviewers. Any product that may be evaluated in this article or claim that may be made by its manufacturer is not guaranteed or endorsed by the publisher.