- 1College of Ocean Engineering and Energy, Guangdong Ocean University, Zhanjiang, China
- 2Guangdong Provincial Key Laboratory of Intelligent Equipment for South China Sea Marine Ranching, Guangdong Ocean University, Zhanjiang, China
- 3State Key Laboratory of Coastal and Offshore Engineering, Dalian University of Technology, Dalian, China
The submergence depth directly affects the safety of semi-submersible marine structures due to that the submergence depth significantly impacts on the hydrodynamic characteristics and wave loads of structures excited by extreme wave. This paper studies the influence of submergence depth on the hydrodynamic and wave load characteristics of semi-submersible structures by establishing a numerical model of the interaction between solitary waves and semi-submersible structures based on the SPH model and Rayleigh theory. Furthermore, equations for transmission coefficient, reflection coefficient, and wave load are fitted. The calculated wave heights of solitary wave propagation test case are in good agreement with the theoretical values. The maximum relative error of the wave peak is 8.4%. The calculated wave loads of submerged horizontal plates test case has a consistent trend with the experimental data. The maximum relative error of wave load peak and valley is 54% (absolute error 0.37 N). Furthermore, the interaction between solitary waves and structures with different submergence depths is investigated by using the meshless numerical model. It is found that the reflection coefficient first increases and then decreases with increasing submergence depth, and reaching a maximum value of 0.39 at the submergence depth equal to 0.0 m. On the contrary, the transmission coefficient decreases first and then increases with the increase of submergence depth. The minimum value of transmission coefficient is 0.36 with the submergence depth of 0.3 m. As the submergence depth increased, the horizontal wave load peak of the structure gradually increases, and the maximum value of 0.13 is obtained at the submergence depth of 0.7 m. The peak of vertical wave load rapidly increases with the increase of submergence depth and then gradually decreases while the trough gradually decreases with increasing submergence depth.
1 Introduction
Semi-submersible platforms have been widely used in the deep-sea marine engineering due to its widely applicable water depth and strong resistance to harsh environments. However, the frequent occurrence of extreme waves, induced by the complex and harsh marine environment, poses a serious threat to the safety of semi-submersible structures. For the structure safety, the submergence depth has a significantly effect. With high submergence, the green water and wave attacks are prone to occur, leading to huge damage to the structure, equipment, and even human life. Although to reduce the submergence depth by increasing the deck height can diminish the green water and wave loads on the structure, the overtopping cannot be complete avoided. On the other hand, the submergence cannot be too low considering the platform stability and economy. Therefore, it is of great significance to determine the appropriate submergence depth of semi-submersible platforms by studying the influence of submergence depth on the hydrodynamic and wave load characteristics induced by extreme wave in order to ensure the safety of the semi-submersible structure.
At present, the wave-structure interaction has been extensively studied by researchers (Ding et al., 2020; Gao et al., 2020b; Gao et al., 2024a; Gao et al., 2024b; Gong et al., 2024; He et al., 2019, 2023). The interaction between extreme waves and structures has also been investigated. Sun et al. (2015) investigated the nonlinear characteristic of the interaction between solitary waves and rectangular cylinders. Tai et al. (2024) studied the interaction between vertical cylinder and extreme waves based on a finite-water-extent slamming theory. Moreover, the interaction between extreme waves and semi-submersible structures has also been conducted to a certain extent. Hu et al. (2016) introduced a new wave boundary condition in OpenFOAM and conducted numerical simulations on the interaction between solitary waves and fixed/floating truncated cylinders as well as simplified floating oil production platforms. Geng et al. (2021) simulated the interaction between solitary waves and a three-dimensional submerged horizontal plate based on a parallel three-dimensional boundary element method under the potential flow assumption. They analyzed the wave height, horizontal and vertical forces of the plate, and pitching moment. Wang et al. (2020) studied the interaction between solitary waves and a horizontal plate submerged in 1/4 of water depth based on physical experiments using a multi lens stereo reconstruction system and underwater load cells. The characteristics of horizontal force, vertical force, and pitching moment of the horizontal plate were discussed. In the aforementioned studies, solitary waves were used to replace extreme waves due to its strong nonlinearity for high wave heights. This substitution has also been widely applied in other studies of wave structure interactions (Ai and Jin, 2012; Ai et al., 2022; Wang et al., 2018; Tripepi et al., 2020; Gao et al., 2019; Gao et al., 2020a).
Although the extreme wave hydrodynamic characteristics of semi-submersible structures have been studied, the relevant research is not sufficient. The influence of submergence depth on the hydrodynamic characteristics and wave loads of semi-submersible structures needs further analysis. Therefore, this paper investigates the effects of submerged depth on the hydrodynamic and wave load characteristics of the semi-submersible structures by establishing a meshless numerical model based on the SPH model and Rayleigh theory. The SPH model has unique advantages in dealing with complex problems such as wave fragmentation and large deformation due to its meshless nature. In recent years, it has received widespread attention (Luo et al., 2021; Zhan et al., 2025). For example, He et al. (2018) established a numerical wave current water tank and studied the wave current interactions exploited the SPH model. Pan et al. (2015) investigated the interaction between solitary waves and floating marine structures by using the SPH model, and analyzed the drift motion of tension leg platforms. Wen et al. (2016) analyzed the changes of the free surface near the vertical breakwater, and the horizontal forces and overturning moments acting on the vertical cylinder based on the parallel SPH-LES model.
This paper establishes a meshless numerical model that can simulate the wave breaking and large deformation of strong nonlinear solitary waves interacting with semi-submersible structures based on the meshless SPH method combined with Rayleigh theory. The effects of submergence depth on the wave surface, vorticity, velocity, transmission coefficient, reflection coefficient, and wave load of the semi-submersible structure are analyzed. The influence of submergence depth on the hydrodynamic and wave load characteristics of the interaction between solitary waves and semi-submersible rectangular structures is summarized. Furthermore, the empirical equations for transmission coefficient, reflection coefficient, and wave load are obtained by the polynomial fitting method to provide a theoretical basis and technical reference for the design of semi-submersible structures. The accuracy of numerical model is verified by comparing the calculated wave height and wave load with theoretical solutions and experimental data of the solitary wave propagation and submerged horizontal plates test cases.
2 Methodology
2.1 Governing equations
The governing equations for viscous flow of the SPH model are made up with the Lagrangian continuity and momentum equation (Dalrymple and Rogers, 2006; Crespo et al., 2015; Antuono et al., 2010).
where, ρ is the density, m is the particle mass, u is the velocity, uij = ui - uj, rab = ra – rb is the particle distance between particle a and b. The subscripts i and j are the interpolation point and its neighboring particles. P is the pressure, represents the viscosity, g = (0, 0, -9.81) m/s2 is the gravitational acceleration. Wij = W (rij, hs) is kernel function, rij = ri - rj is the particle distance. /2, η2 = 0.01hs2, δ = 0.1is delta-SPH coefficient. hs is the smoothing length. ca and cb are the numerical sound speed of a and b particle.
The kernel function in the model adopts a quintic kernel function (Altomare et al., 2014), which can maintain moderate computational complexity while providing high-order interpolation characteristics. Due to the simple form and ability to prevent nonphysical penetration between approaching particles, the artificial viscosity (Altomare et al., 2014) is selected for the viscosity term. To avoid solving the pressure Poisson equation and improve the computational efficiency of the model, the Tait state equation (Altomare et al., 2014) is adopted to calculate the pressure. The Tait equation of state is , where , ρ0 = 1000 kg/m3 is the reference density, γ = 7. represents the sound speed at reference density. c0 is usually set to more than ten times of the maximum velocity in the flow field. Here, the Mach number M = umax/c0 ≤ 0.01. Accordingly, the change in density does not exceed 1% (Barreiro et al., 2016). The Symplectic method (Crespo et al., 2015; Omidvar et al., 2012), which is time reversible and has explicit second-order accuracy in the absence of viscosity or friction, is adopted for the time advancement. The time step is automatically calculated using a variable time step scheme (Crespo et al., 2015) and updated at each time step.
2.2 Boundary treatment
Due to the meshless nature of the SPH method, free surfaces can be naturally captured without special treatment. The wall boundary is treated using the dynamic boundary method (Crespo et al., 2007). Dynamic boundaries consist of a set of wall boundary particles that satisfy the same continuity and state equations as the fluid, but not the momentum equations. As a result, the density and pressure of boundary particles also undergo evolution, leading to a repulsive mechanism when a fluid particle approaches a boundary particle. However, the position of boundary particles is not determined by integrating velocity over time. The static wall boundary will exhibit zero velocity. In contrast to explicit boundary treatment, the dynamic boundary method seamlessly integrates boundary treatment into the governing equations’ solution process, rendering it ideally suited for simulations with complex boundaries. This is due to its straightforward implementation and low computational complexity. Nevertheless, a fluctuating pressure field may be generated near the wall boundaries, attributed to the anomalously high-density gradients between the boundary and fluid particles.
2.3 Wave generation
Assuming that the average horizontal velocity of water particles at the wave peak is the same as the velocity of the wave paddle, coupled with Rayleigh theory (Domínguez et al., 2019), solitary waves are generated by using the wave paddle. The solitary waves generated by Rayleigh theory have minimal amplitude loss during propagation. The displacement equation of the wave paddle (Domínguez et al., 2019) is as follow:
where xs is the displacement of wave paddle, c is the speed sound, k is the edge coefficient that describes the way in which the elevation of the free surface tends toward the average water surface at infinity, d is the water depth, H is the wave height. The distribution of solitary waves can be expressed as
Equation 4 is an implicit equation that can be solved in several ways. Based on Rayleigh theory, the theoretical free-surface elevation can be rewritten as
where corresponds to the half stroke of the wave paddle. The origin of the wave paddle is x = 0. Tf represents the generation time of solitary waves. The equation for each parameter in the above equation (Domínguez et al., 2019) is as follows:
3 Model validation
To validate the SPH model of the interaction between solitary waves and semi-submersible structures, test cases of solitary wave propagation and submerged horizontal plates were simulated. The calculated wave surface and wave load are compared with the exact values and experimental data. The exact values of the wave surface for the solitary wave propagation test case are calculated using Equation 5. The experimental data of wave loads for the submerged horizontal plate test case stem from Seiffert et al. (2014).
3.1 Solitary wave propagation
To verify the accuracy of the solitary wave generation and propagation, a test case of solitary wave propagation with an initial water depth d0 = 1.0 m and a relative wave height H0/d0 = 0.3 was simulated. The calculated wave heights at four measurement points are compared with the exact values. The length of the numerical wave tank is L0/d0 = 65. A wave paddle is installed on the left side of the tank. The particle distance is set to Δx = 0.06 m, 0.03 m, and 0.015 m. The output time interval is 0.15 s. The total physical time is 20 s.
The history of the calculated and exact wave heights at four measuring point x/H0 = 2, 10, 20, and 50 are shown in Figure 1. The calculated results of Δx = 0.06 m are underestimating the wave peak while the calculated results of Δx = 0.03 m and 0.015 m are basically consistent with the experimental data. Therefore, the particle spacing Δx ≤ 0.03 m is enough. The calculated wave heights for the first three measurement point are good agreement with the exact solution. The phase and amplitude are basically consistent with the exact values. The phase of the numerical results at x/H0 = 50 is consistent with the exact solution while the amplitude is slightly lower than the exact solution. The reason is the solitary wave peak slightly decreases with the solitary waves propagate forward due to the viscosity. The maximum absolute error of the wave peak is 0.025 m with the relative error of 8.4%.
To quantitatively analyze the accuracy of the calculated wave heights, Table 1 presents the L2 error of solitary wave height at different measurement points. The L2 error at x/H0 = 2 is the smallest, with a minimum value of 0.107. As solitary waves propagate forward, the L2 error gradually increases. The maximum L2 error is 0.137 obtained at x/H0 = 50.
where, and represent numerical results and exact solution, respectively. N represents sample number.
In summary, except for a slight decrease in the wave peak with increasing distance, the numerical results are in good agreement with the exact solutions. The maximum absolute error of the wave peak is 0.025 m with the relative error of 8.4%. The maximum L2 error of the wave heights is 0.137.
3.2 Submerged horizontal plate
To verify the accuracy of the calculated wave load, a test case of interaction between solitary waves and submerged horizontal plate is simulated (Figure 2). The numerical wave load results are compared with the experimental data (Seiffert et al., 2014). The initial water depth d0 = 0.144 m. The relative wave height H0/d0 = 0.301. z=0. To reduce computation time, the length of the wave tank is reduced to 11 m with the height of 0.3 m. The length of the horizontal plate is 0.305 m and the thickness is 0.0127 m. The particle spacing is Δx/H0 = 0.04 m. The physical time is 15 s with an output time interval of 0.15 s.
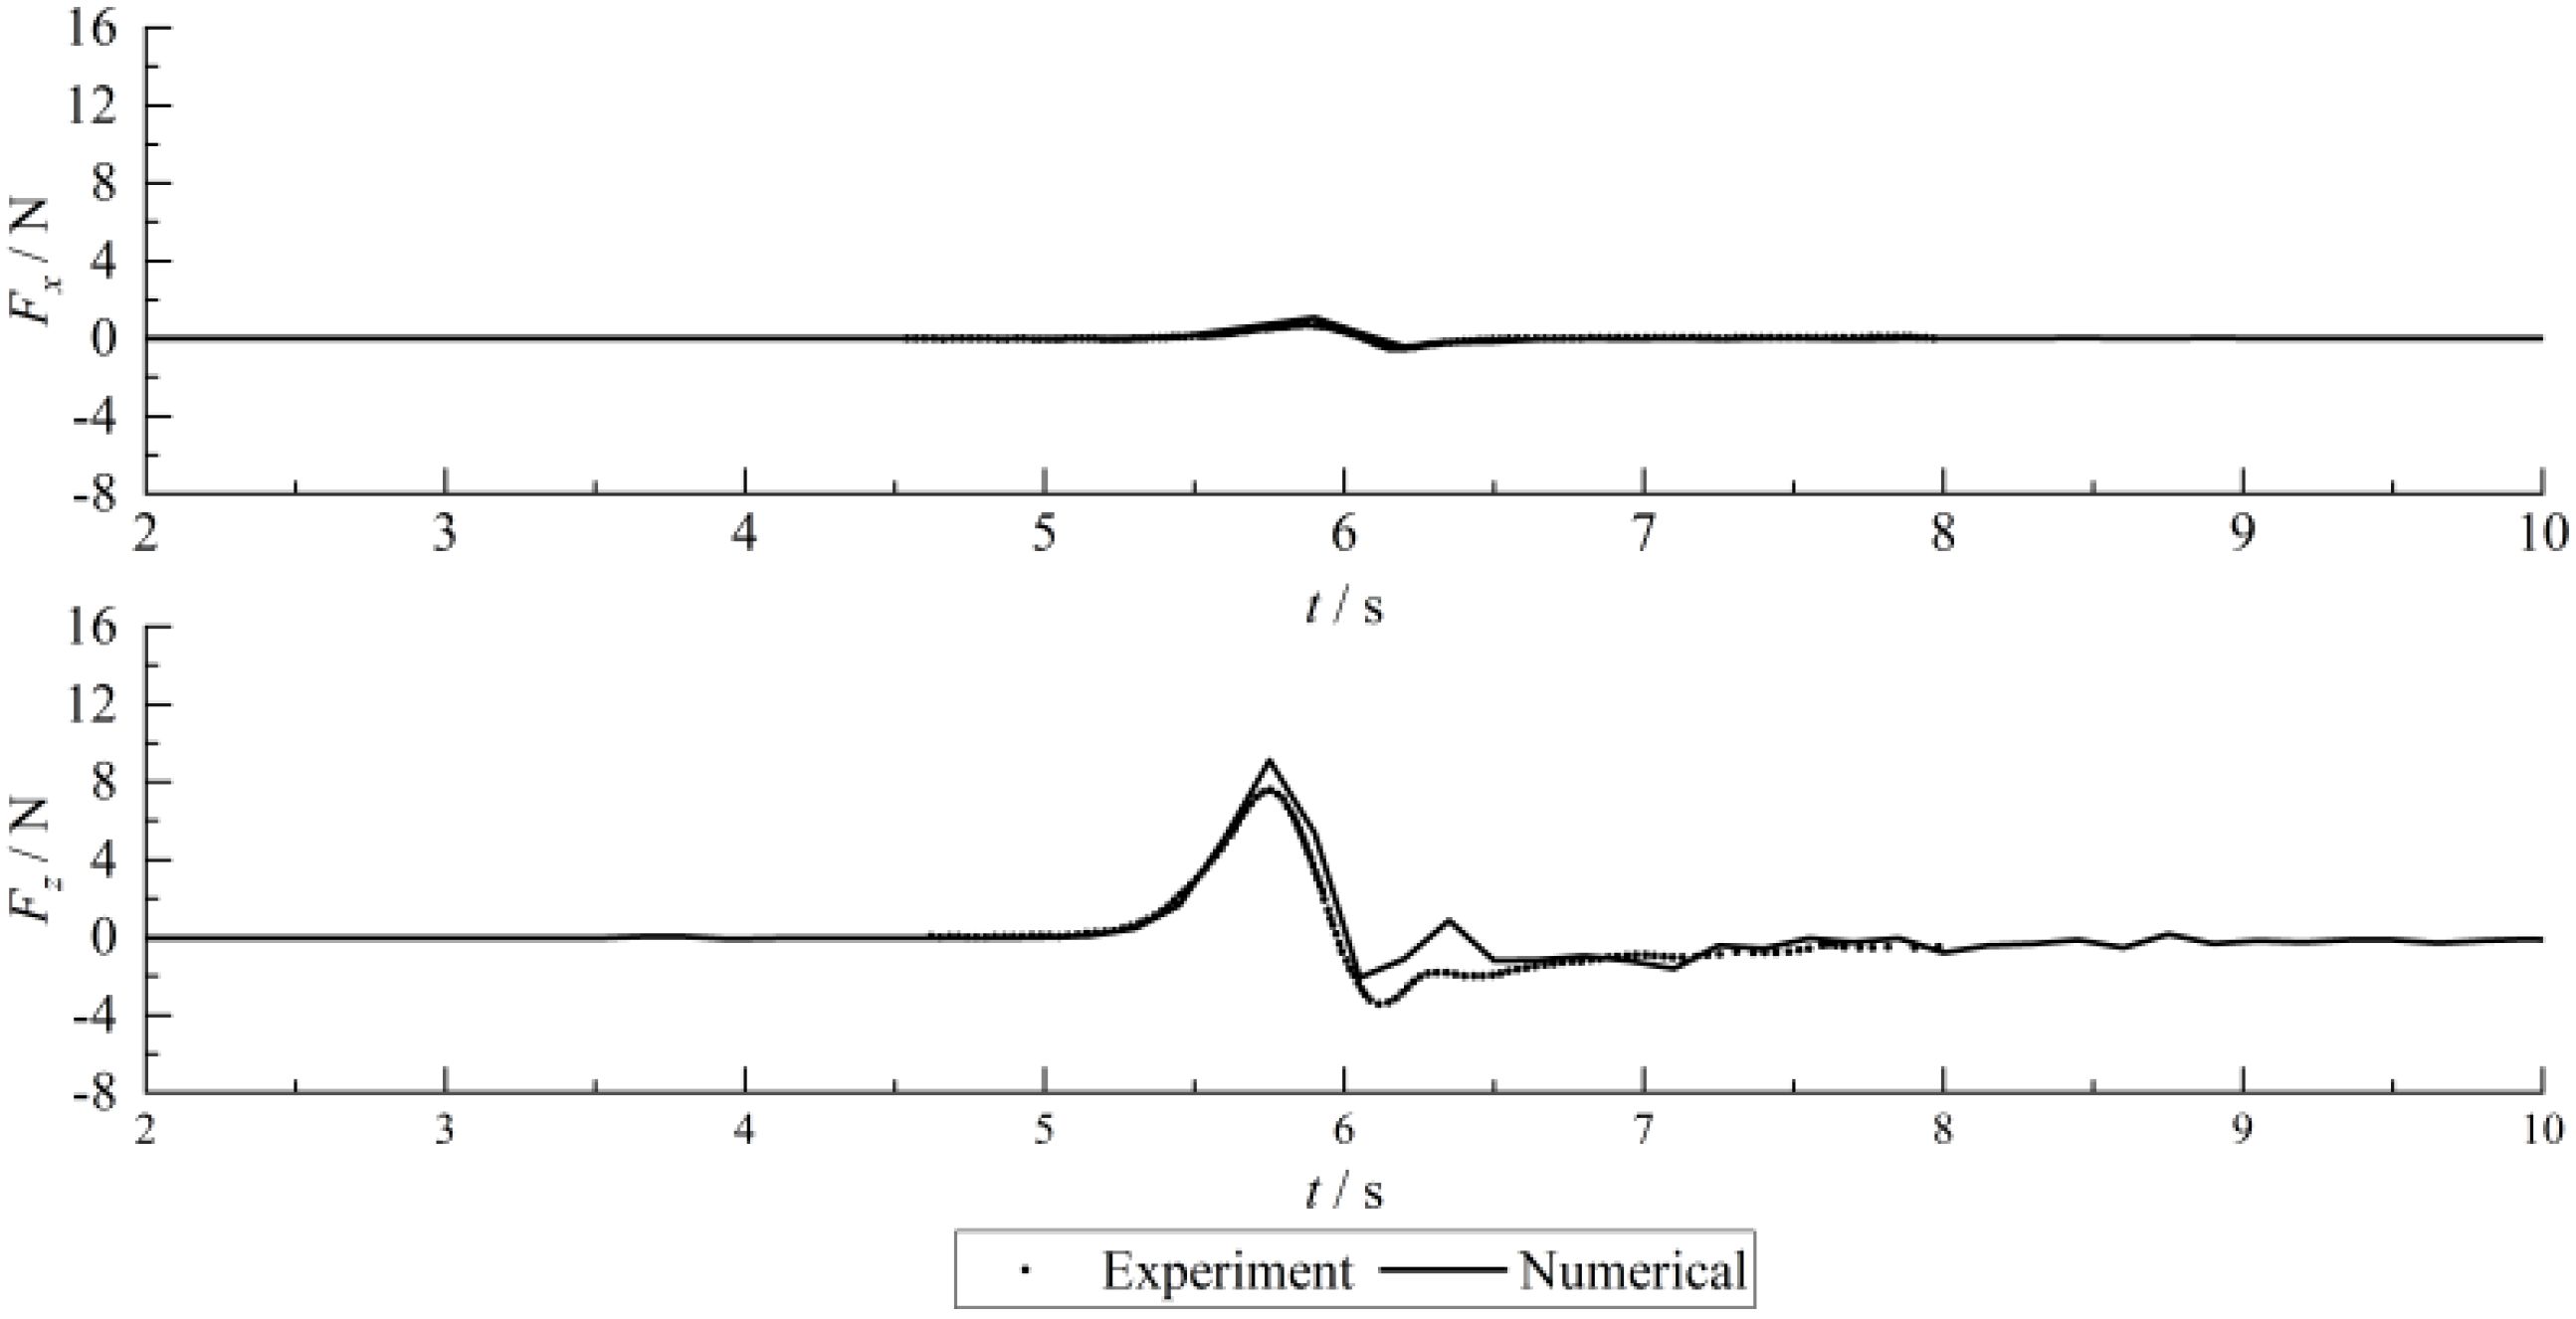
A comparison of time series of the calculated wave loads with the laboratory measurements is shown in Figure 3. We note here that t = 0 does not indicate the time when calculation start. The arrival time of solitary waves at the structure is different resulting from the different geometric dimensions between the numerical and experimental wave tank. In order to compare the calculated results with experimental data, the numerical results are corrected based on the peak time of the x-direction force. The numerical wave loads in the horizontal direction are in good agreement with the experimental data while the accuracy in the vertical direction is slightly lower. The calculation results overestimate the magnitude of the vertical force acting on the horizontal plate. The peaks of the numerical and experimental wave load in the horizontal direction are 1.06 N and 0.69 N, respectively, with an absolute error of 0.37 N and a relative error of 54% while the troughs are -0.41 N and -0.51 N, respectively, with an absolute error of 0.1 N and a relative error of 20%. The numerical and experimental peak in the vertical direction are 9.11 N and 7.59 N, respectively, with an absolute error of 1.52 N and a relative error of 20% while the valleys are -3.44 N and -2.07 N with an absolute error of 1.37 N and a relative error of 40%.
4 Study on the effects of submergence depth on the hydrodynamic and wave load characteristics of semi-submersible structures
4.1 Model layout
To analyze the effects of submergence depth on the wave surface, velocity, vorticity, and wave load of the semi-submersible structure, the interaction between solitary waves and semi-submersible rectangular structures at different submergence depths is simulated. The length and height of the numerical wave tank are 100 m × 2 m. The water depth is d0 = 1.0 m. The size of the structure, fixed near the still water surface, is 5.0 m × 0.6 m. The distance between the structure bottom and the wave tank bottom is dr. Accordingly, the initial submergence depth ds = d0 - dr, as shown in Figure 4. The wave height H0 sets to 0.5 m. dr adopts 0 m, 0.2 m, 0.4 m… 1.6 m, for a total of 9 conditions (Table 2). Model 1 – Model 5 are submerged cases where the structure is semi-submerged or submerged while Model 6 – Model 10 are overwater cases where the structure is above the water surface. The relative particle spacing H0/Δx is set to 40 (Lin et al., 2023). The physical time is 40 s with an output time interval of 0.25 s.
4.2 Wave heights
Figure 5 gives the wave height history of the interaction between solitary waves and structures with different submergence depths at the upstream measurement point (x = 35 m). Figure 5A is the results of submerged cases while Figure 5B is the results of overwater cases. All of the Figures 5-8(A) depict the wave height history of the Model 6 (ds = 0.0 m) in order to facilitate the comparison of wave height and wave load between submerged cases and overwater cases. The solitary waves arrive the measurement point at t = 9 s and reaches maximum value at t = 11 s. Then, the solitary waves continually propagate downstream and interacted with the structure to form a leftward reflected wave. At t = 20 s, the leftward reflected wave reaches the measurement point, again, resulting in a second wave peak and a valley accompanied by a series of complete waves with gradually decreasing wave height. For the submerged cases, the reflected wave height increases with the decreasing submergence depth. On the contrary, for the overwater cases, the reflected wave height decreases with the submergence depth decreases. The maximum reflected wave height 0.20 m is obtained at Model 6.
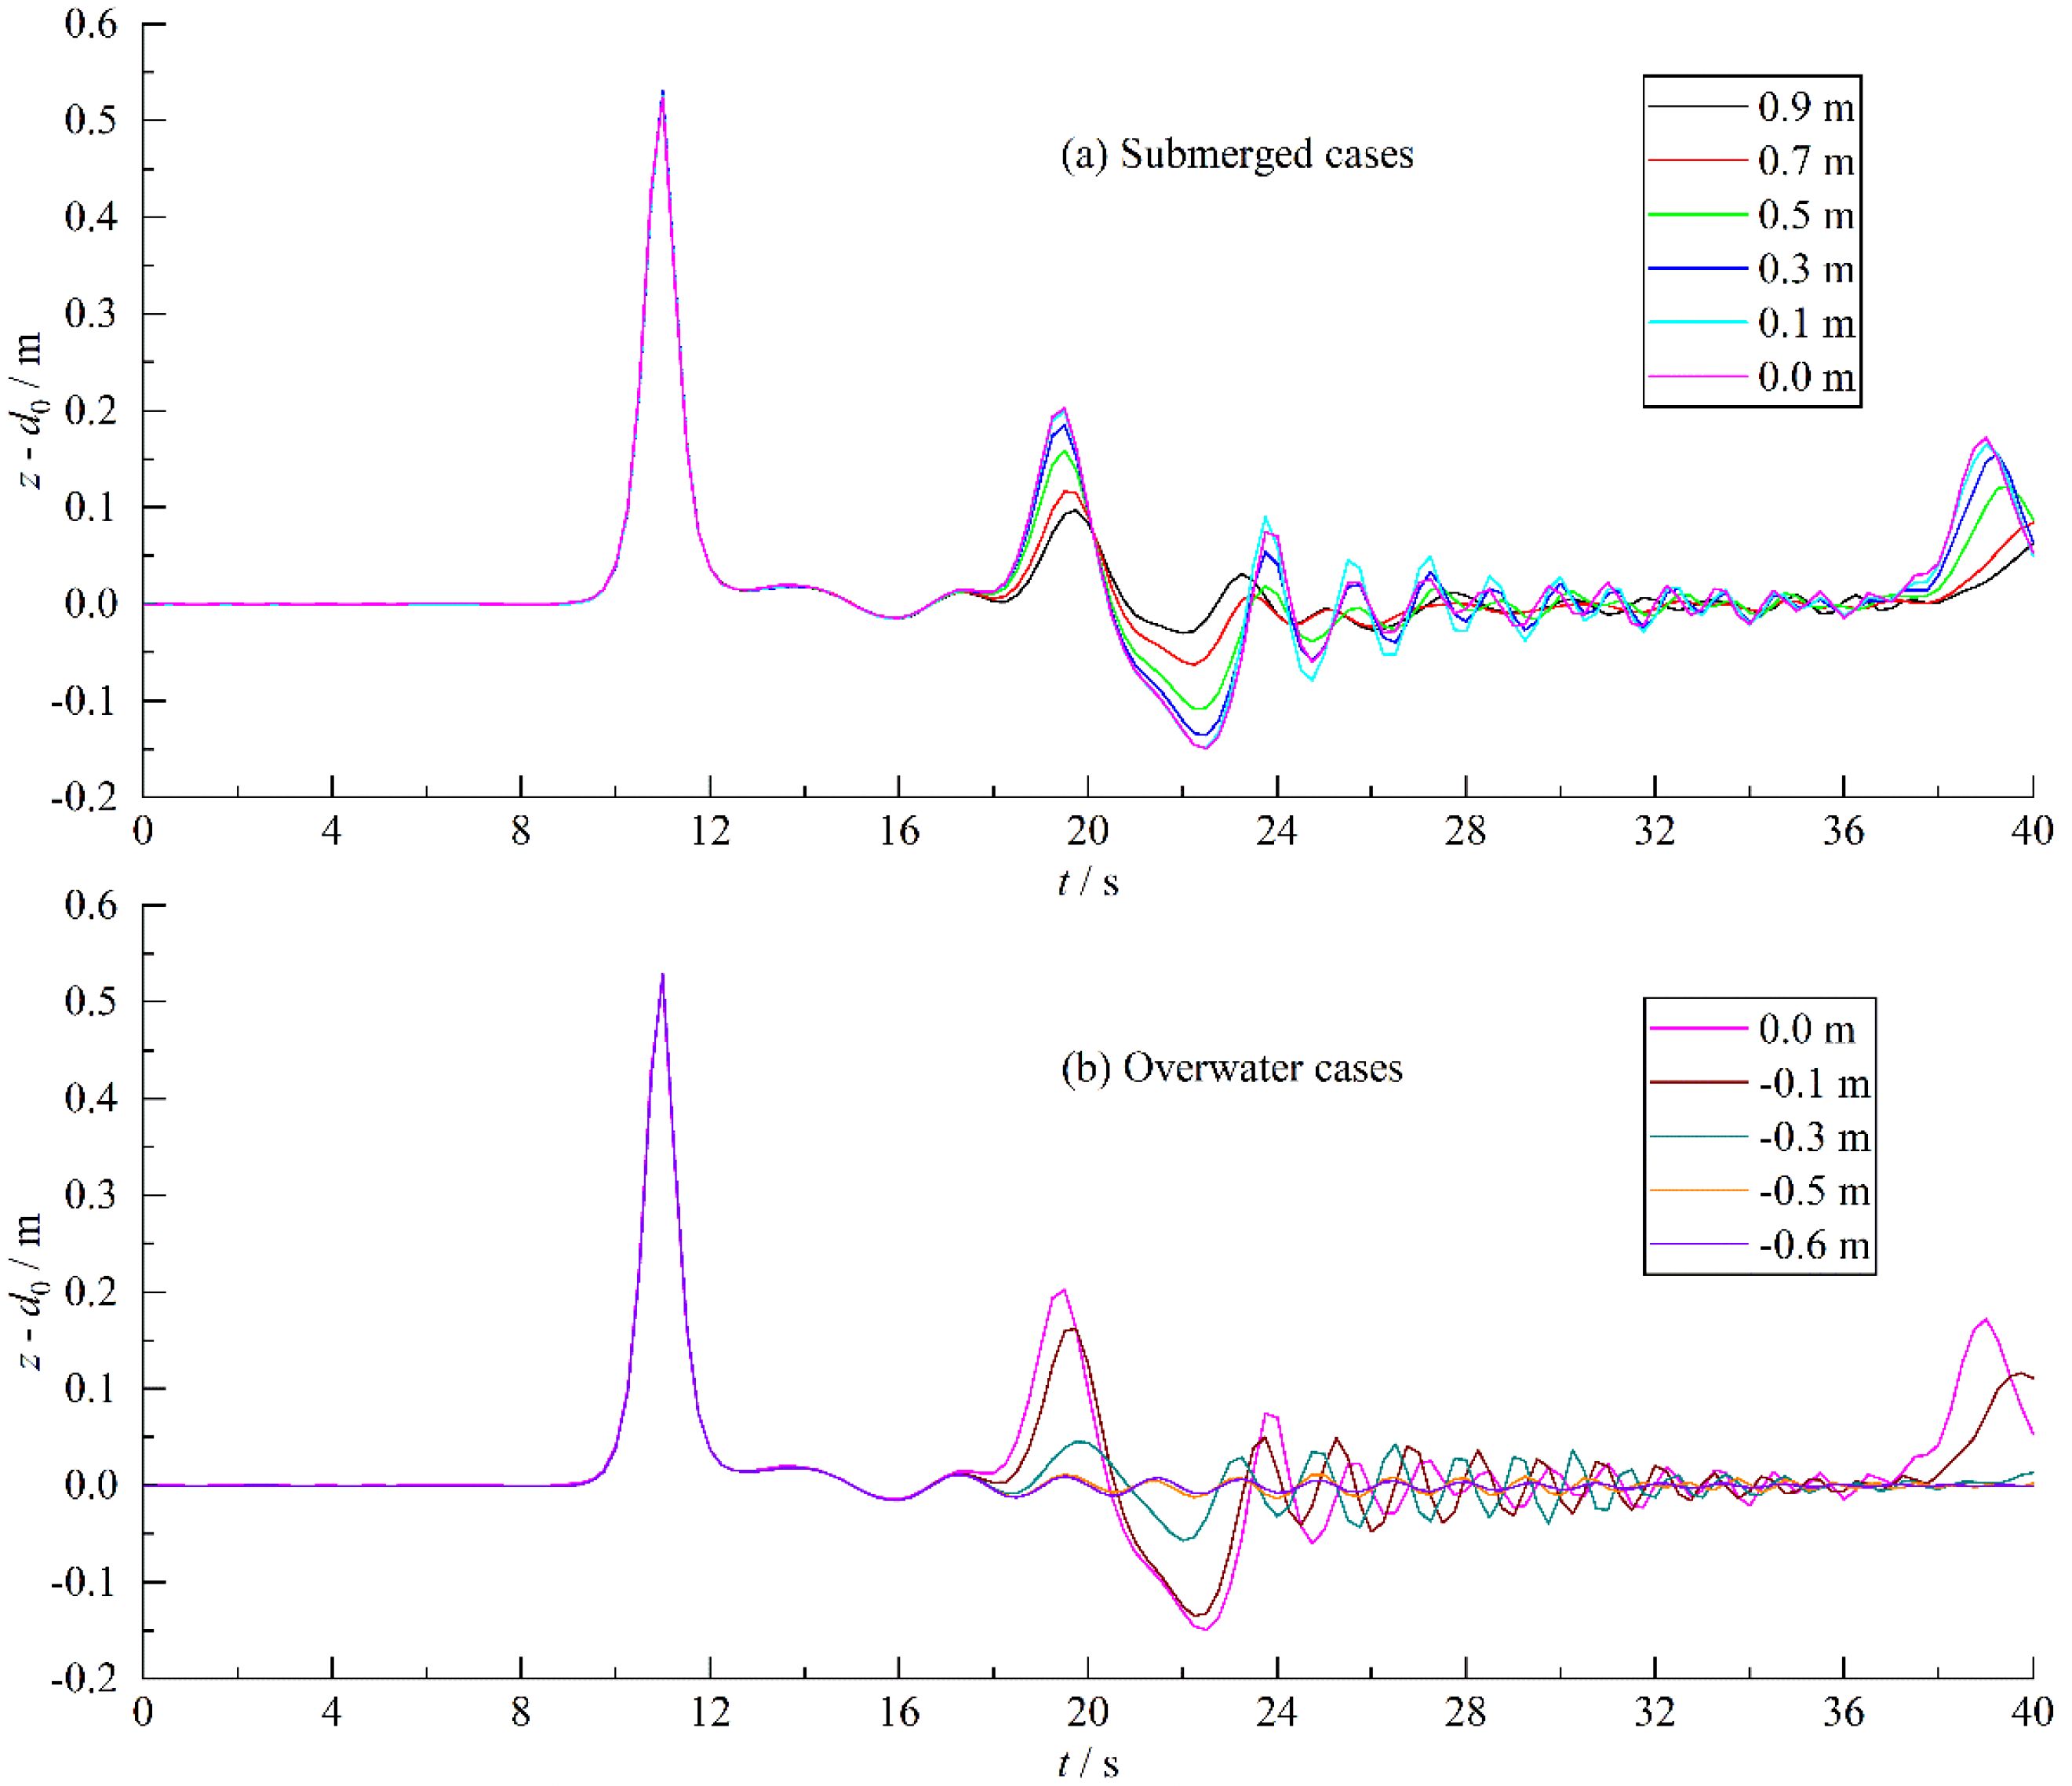
Figure 5. History of the wave height at x = 35 m. (A) Wave height of submerged cases. (B) Wave height of overwater cases.
Figure 6 shows the wave height history of the interaction between solitary waves and structures with different submergence depths at the downstream measurement point (x = 60 m). For Model 1 – Model 3, the interaction between the wave and the structure is strong due to the structure is basically submerged under the water surface, resulting in the arrival time slightly later around t = 18 s. For Model 4 – Model 5, the interaction is weak due to the semi-submerged structure. Therefore, the arrival time of the solitary wave is slightly earlier. It is around t = 17 s. The structure is above the water surface for Model 6 - Model 10, the interaction between the solitary wave peak and the structure is relatively strong. The arrival time of the wave peak gradually shifts backwards. The arrival time is t = 17 s for Model 6 while it is t = 17.5 s for Model 10. The wave peak of downstream measurement points gradually decreases for Model 1 - 4 while it is increases for Model 4 - 10. The minimum wave peak obtained at Model 4 is 0.19 m.
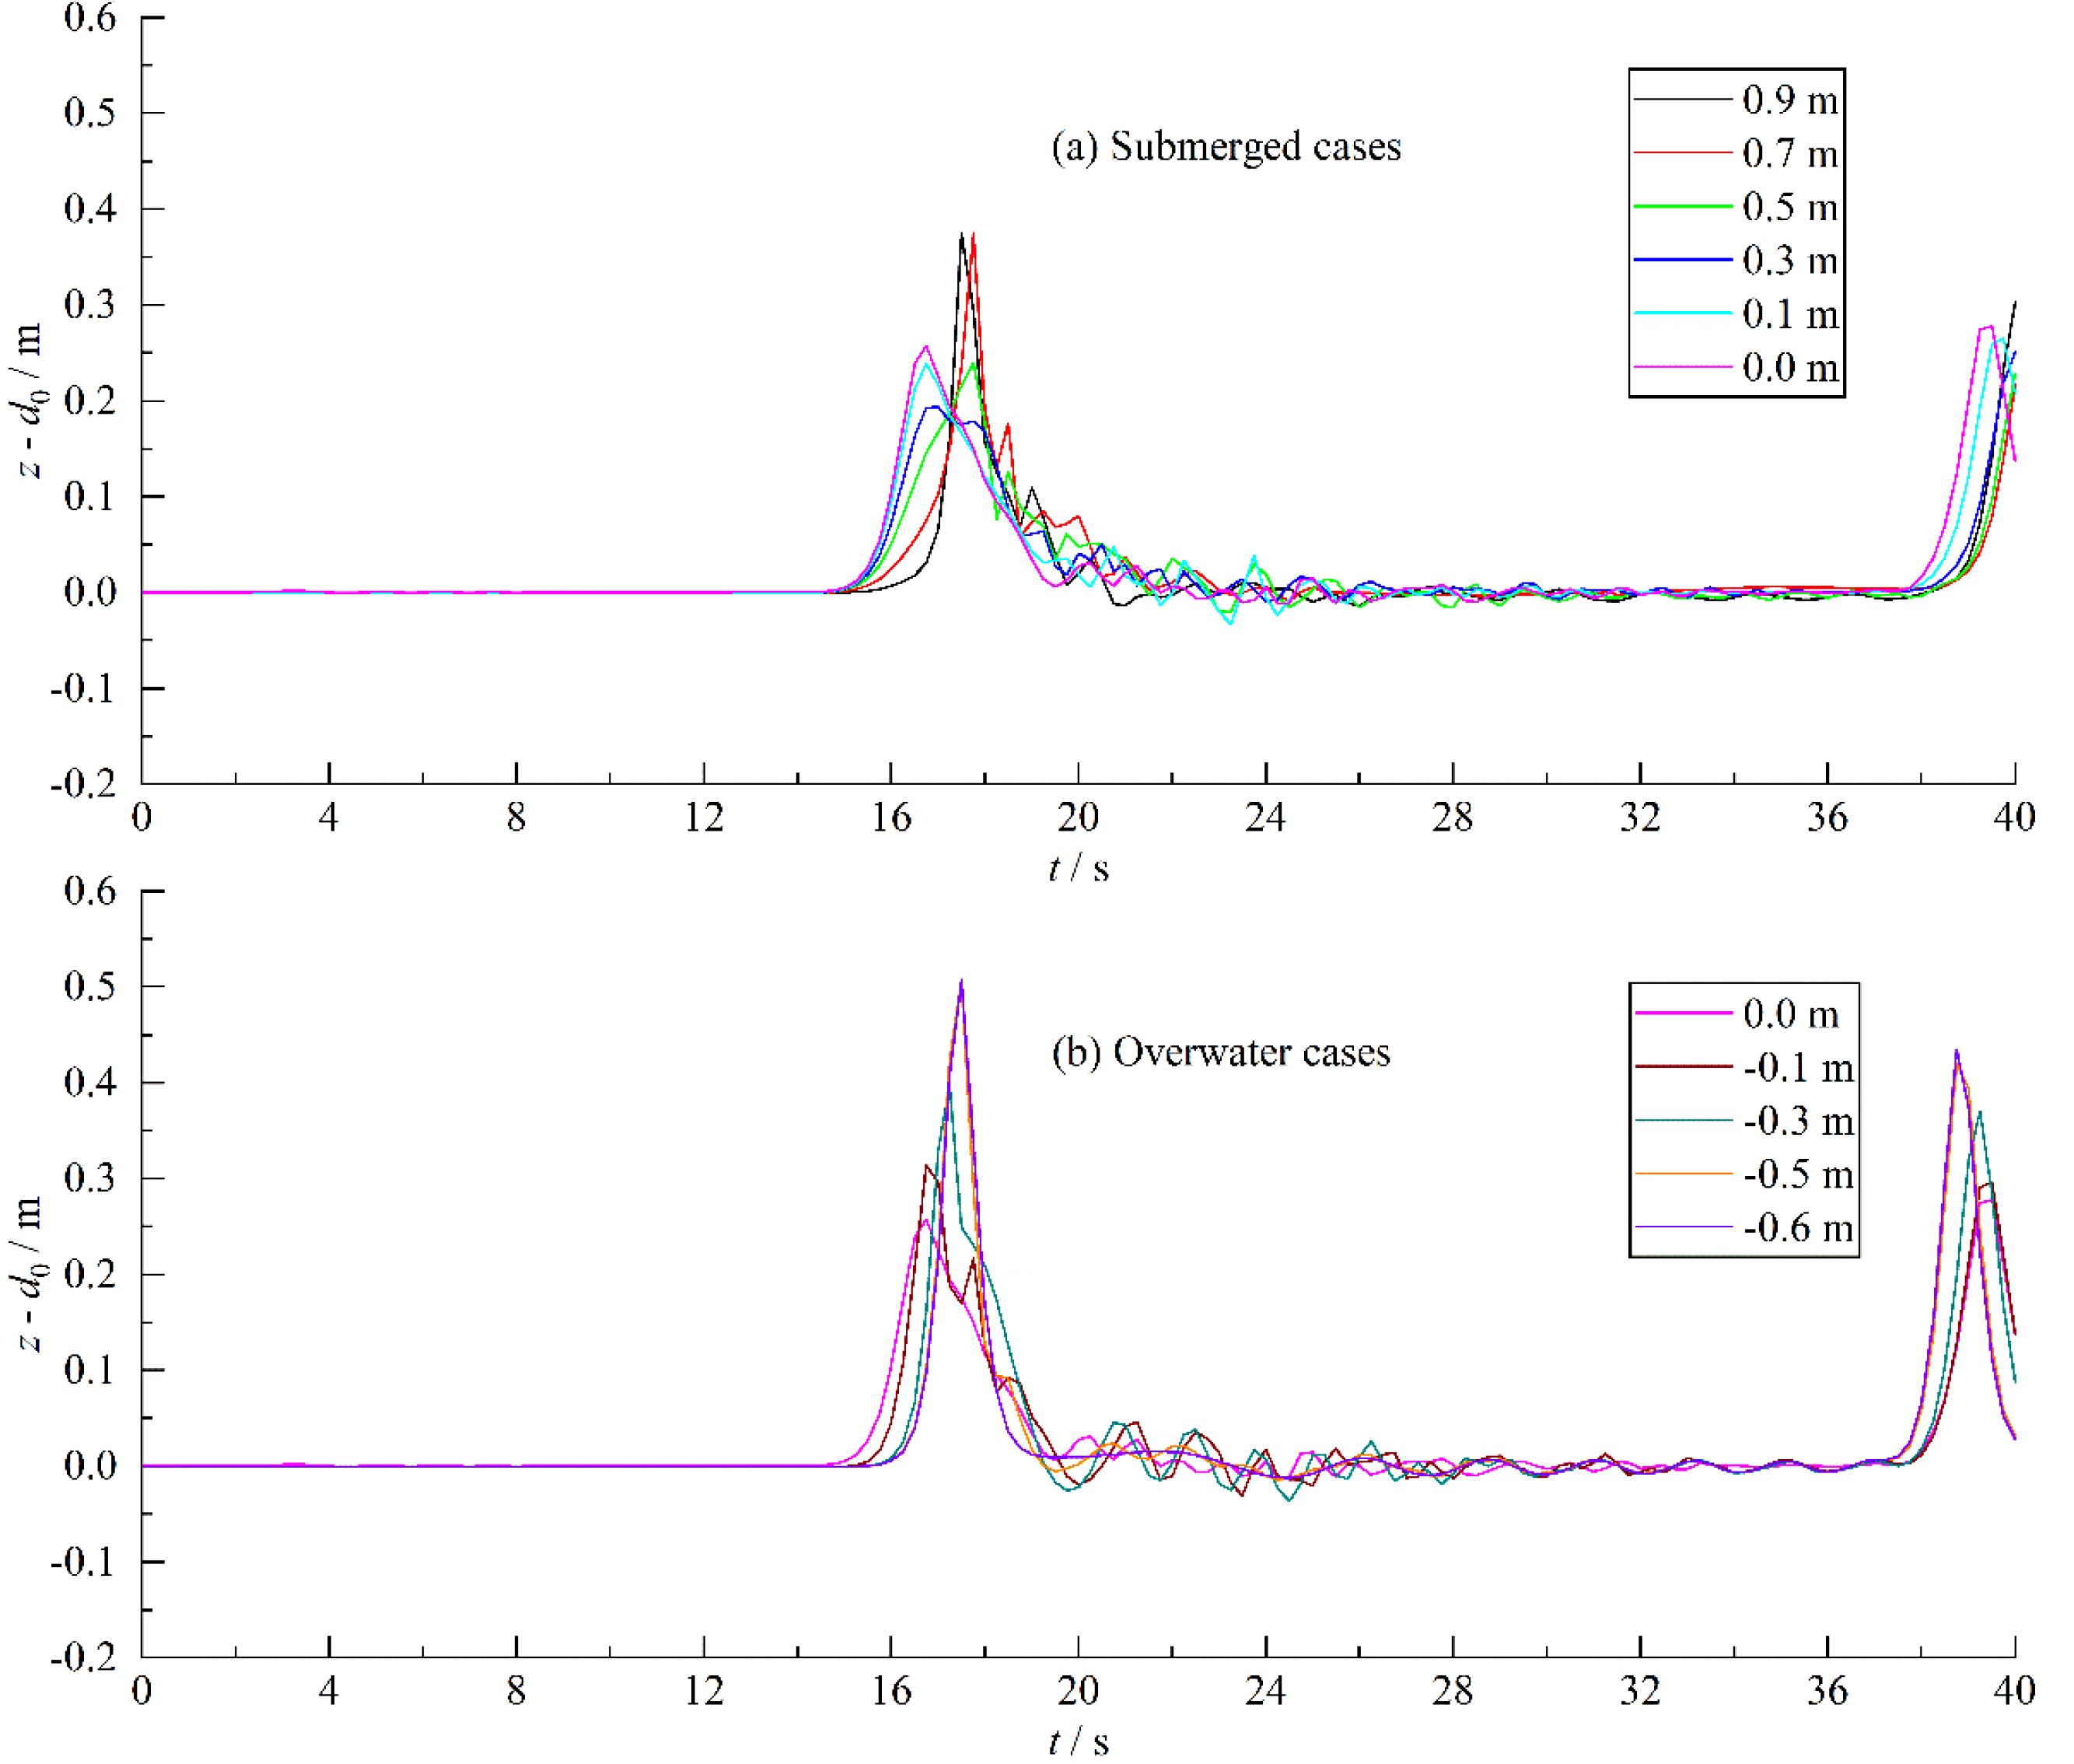
Figure 6. History of the wave height at x = 60 m. (A) Wave height of submerged cases. (B) Wave height of overwater cases.
4.3 Transmission coefficient and reflection coefficient
The transmission coefficient and reflection coefficient of the structure, calculated according to the following equations, are shown in Figure 9.
where, Hi is the incident wave height, Kt is the transmission coefficient, Ht is the transmission ware height, Krf is the reflection coefficient, Hrf is the reflection wave height.
The transmission coefficient of the structure decreases first and then increases with the increase of submergence depth. The minimum transmission coefficient is 0.36 obtained at ds = 0.3 m. For the ds ≥ 0.7 m, the transmission coefficient basically reaches a stable value of 0.71. The reflection coefficient first increases and then decreases with increasing submergence depth. The maximum reflection coefficient is 0.39 obtained at submergence depth ds = 0.0 m. Empirical equations for the transmission and reflection coefficient with submergence depth can be obtained by using polynomial fitting method to fit the calculated results of transmission coefficient and reflection coefficient, respectively.
where A0-A4 are coefficients which have been listed in Table 3. The comparison between the fitted curve and the numerical results is shown in Figure 9. The determination coefficients of the equation for transmission coefficient and reflection coefficient are R2 = 0.975 and 0.966, respectively, indicating well-fitting results. The transmission, reflection coefficient can basically be expressed as a quartic function of submerged depth.

Table 3. Empirical coefficients in Equation 13.
4.4 Wave loads
Figures 7, 8 depict the time history of the horizontal and vertical wave loads coefficient Cx and Cz. The Cx and Cz are calculated by the follow equations.
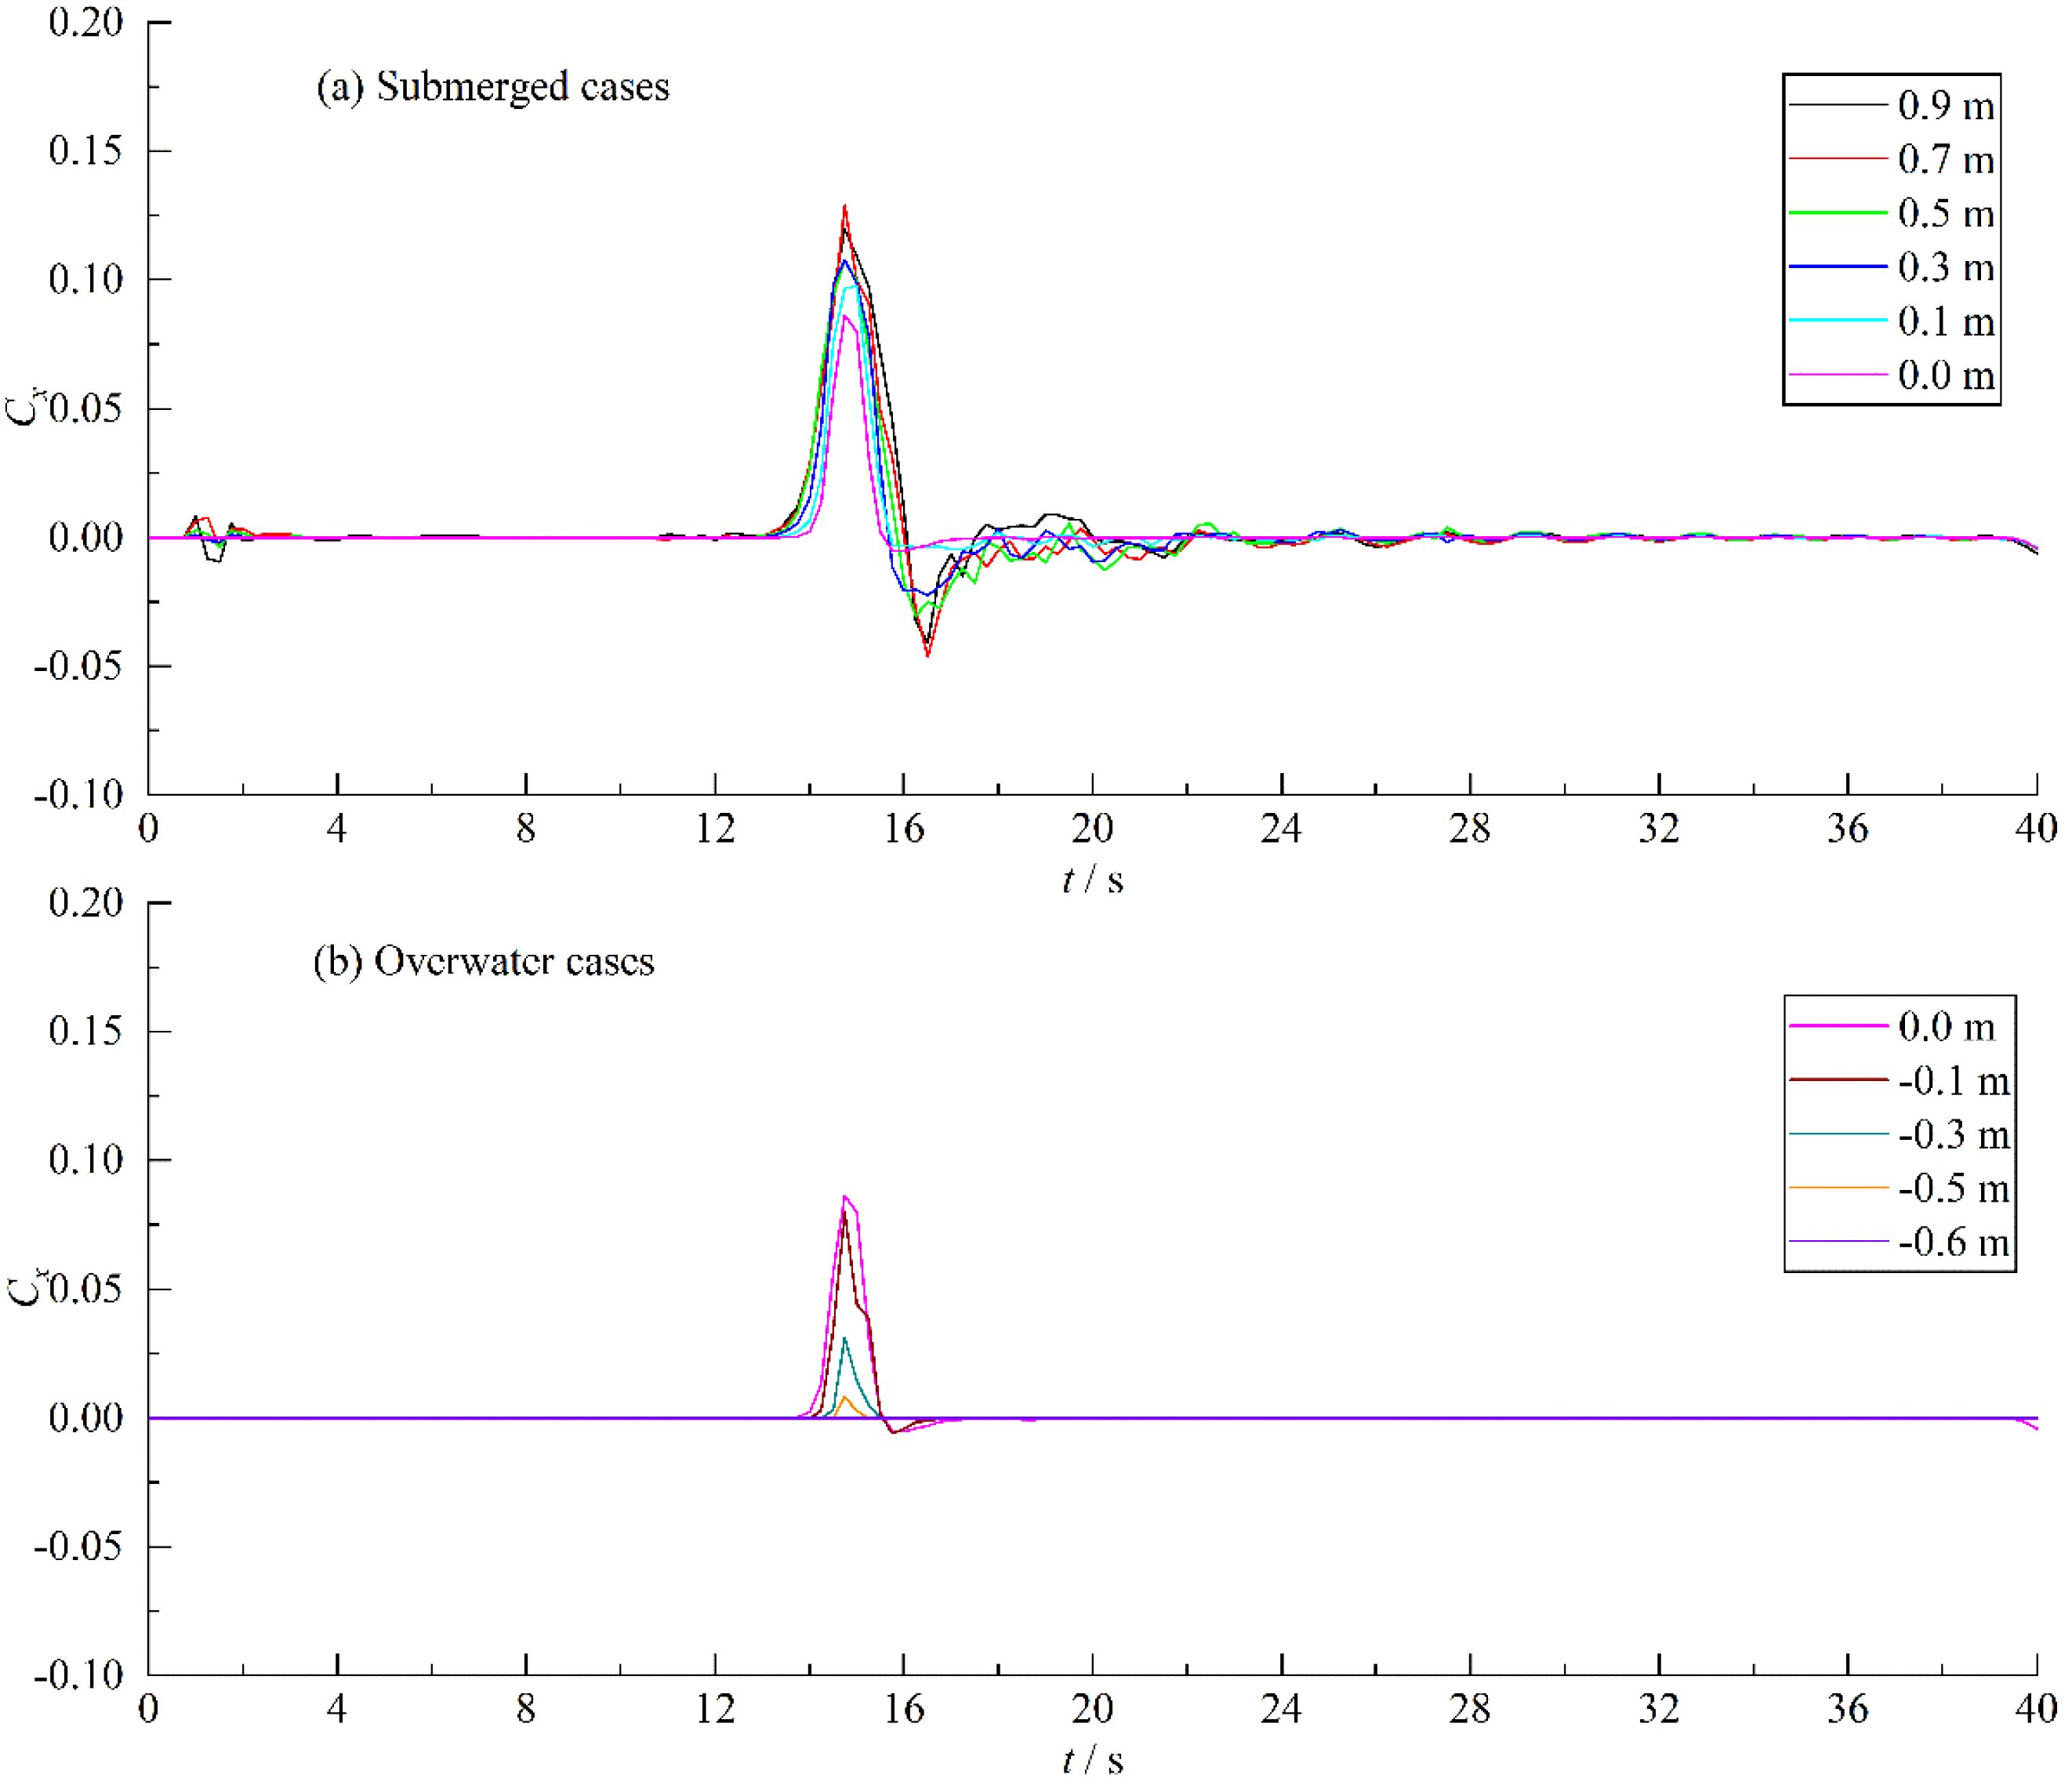
Figure 7. History of the wave load coefficient in x-direction. (A) Cx of submerged cases. (B) Cx of overwater cases.
where, Fx and Fz are the horizontal and vertical wave loads. A = 0.6 m 5 m is the area of the structure. Fx and Fz are obtained by summing up the force of all the structure particles.
where, Fa is the force acting on particle a that constitutes the structure. F (Fx、Fz) is the total force of the structure.
In Figure 7, there is a slight fluctuation at the initial stage (before t = 4 s). The large initial oscillations in time series of the wave loads are induced by the dynamic boundary method. The wall particles of the obstacle verify the same equations of continuity and of state as the fluid particles, but their position remains unchanged. This method intertwines the boundary treatment into the solution process of the control equations, making it suitable for simulations involving complex boundaries due to its straightforward implementation and low computational complexity. However, the initial density and pressure of obstacle particles are zero which did not match the actual state. Therefore, it takes some time to stabilize the parameters of obstacle particles. The arrival time of horizontal wave load peak is basically the same around t = 15 s. The peak gradually increases with the submergence depth increases. The trough also increases with the increase of submergence depth. There is overtopping for the Model 2 - 5, resulting in wave oscillations and fluctuations in horizontal wave loads.
Similarly, there is a significant fluctuation induced by the dynamic boundary method at the initial stage in Figure 8. The fluctuation basically reaches stability after t =12 s. For Model 1 - Model 3, the structure contact with more fluid particles resulting in large instability due to the large submergence depth. On the contrary, the instability is small and quickly reaches stability due to the smaller submergence depth for Model 4 - Model 10. Therefore, for the dynamic boundary method, the greater the submergence of the structure, the longer the initial stability time. The arrival time of the wave load peak in the vertical direction is basically the same as that in the horizontal direction, which is around t = 15 s. In Figure 8A, for the submerged cases, the vertical wave loads peak decreases with increasing submergence depth, but the amplitude of the change is relatively small. For the overwater cases (Figure 8B), the vertical wave load peak first increases rapidly and then decreases rapidly with increasing submergence depth with a large amplitude of the change. For Model 2 – Model 6, the overtopping collides with downstream water accompanied by wave break resulting in significant wavefront oscillations and wave load fluctuations. The amplitude of the oscillations first increases and then decreases.
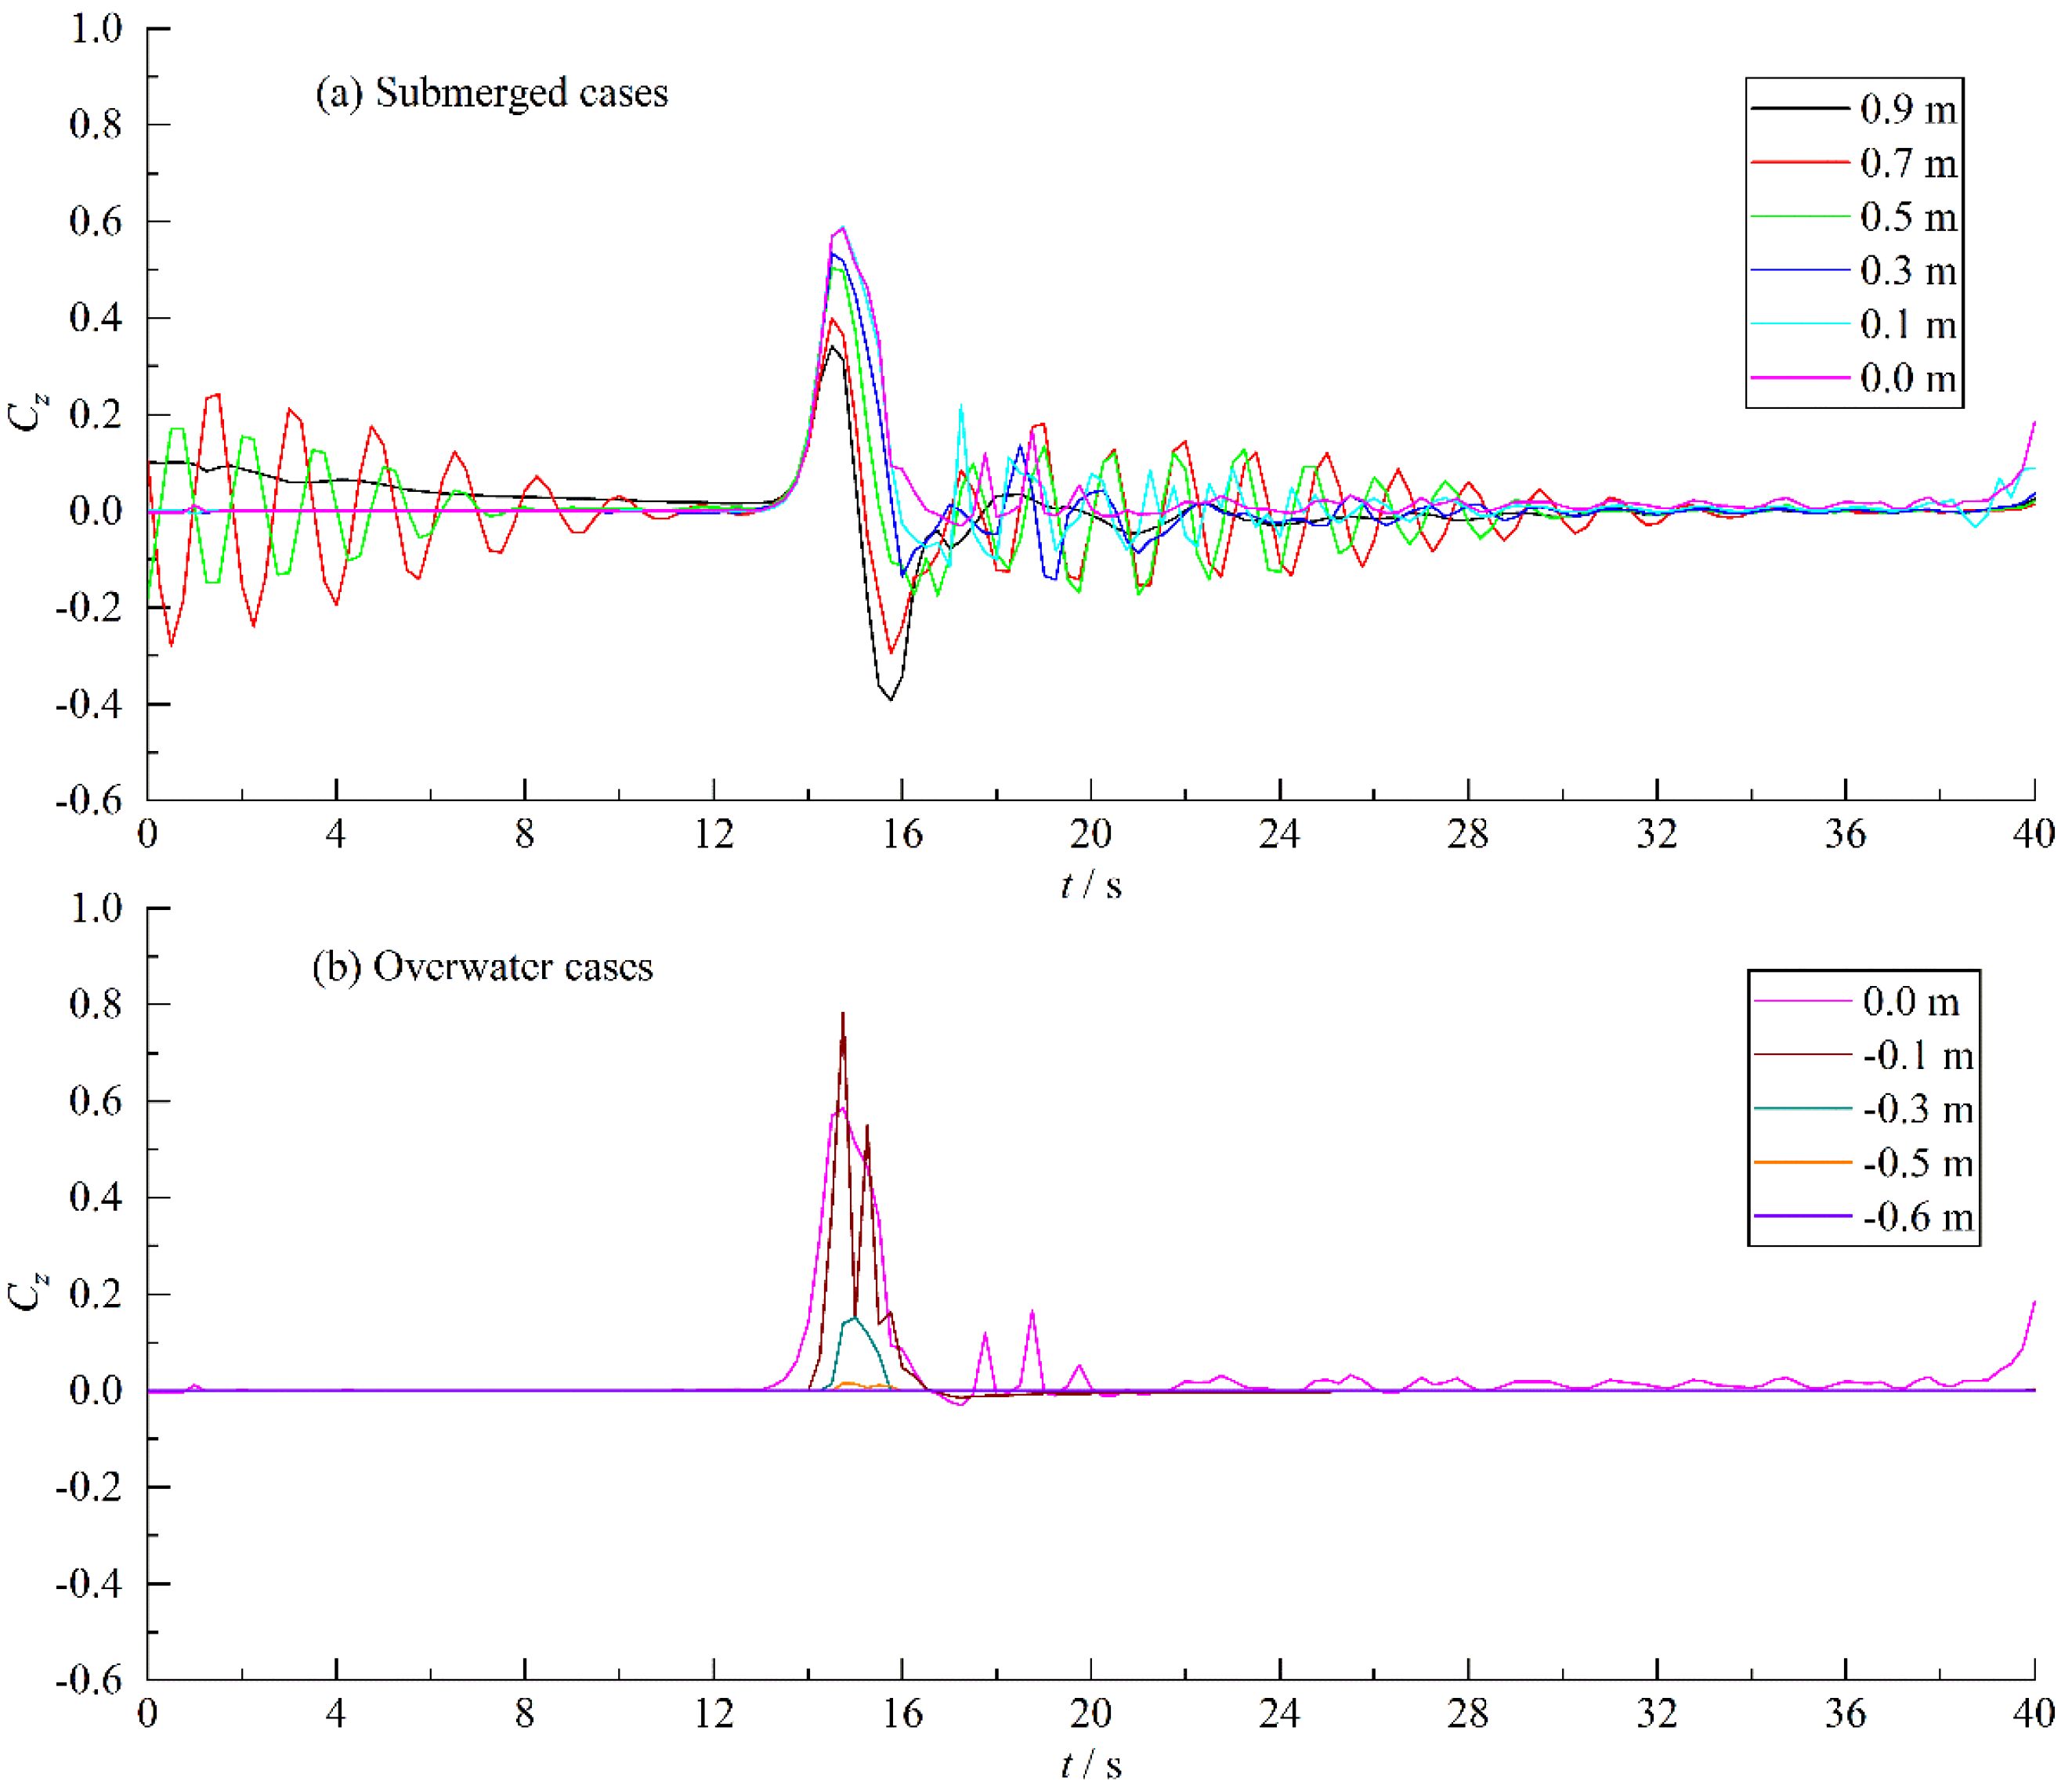
Figure 8. History of the wave load coefficient in z-direction. (A) Cz of submerged cases. (B) Cz of overwater cases.
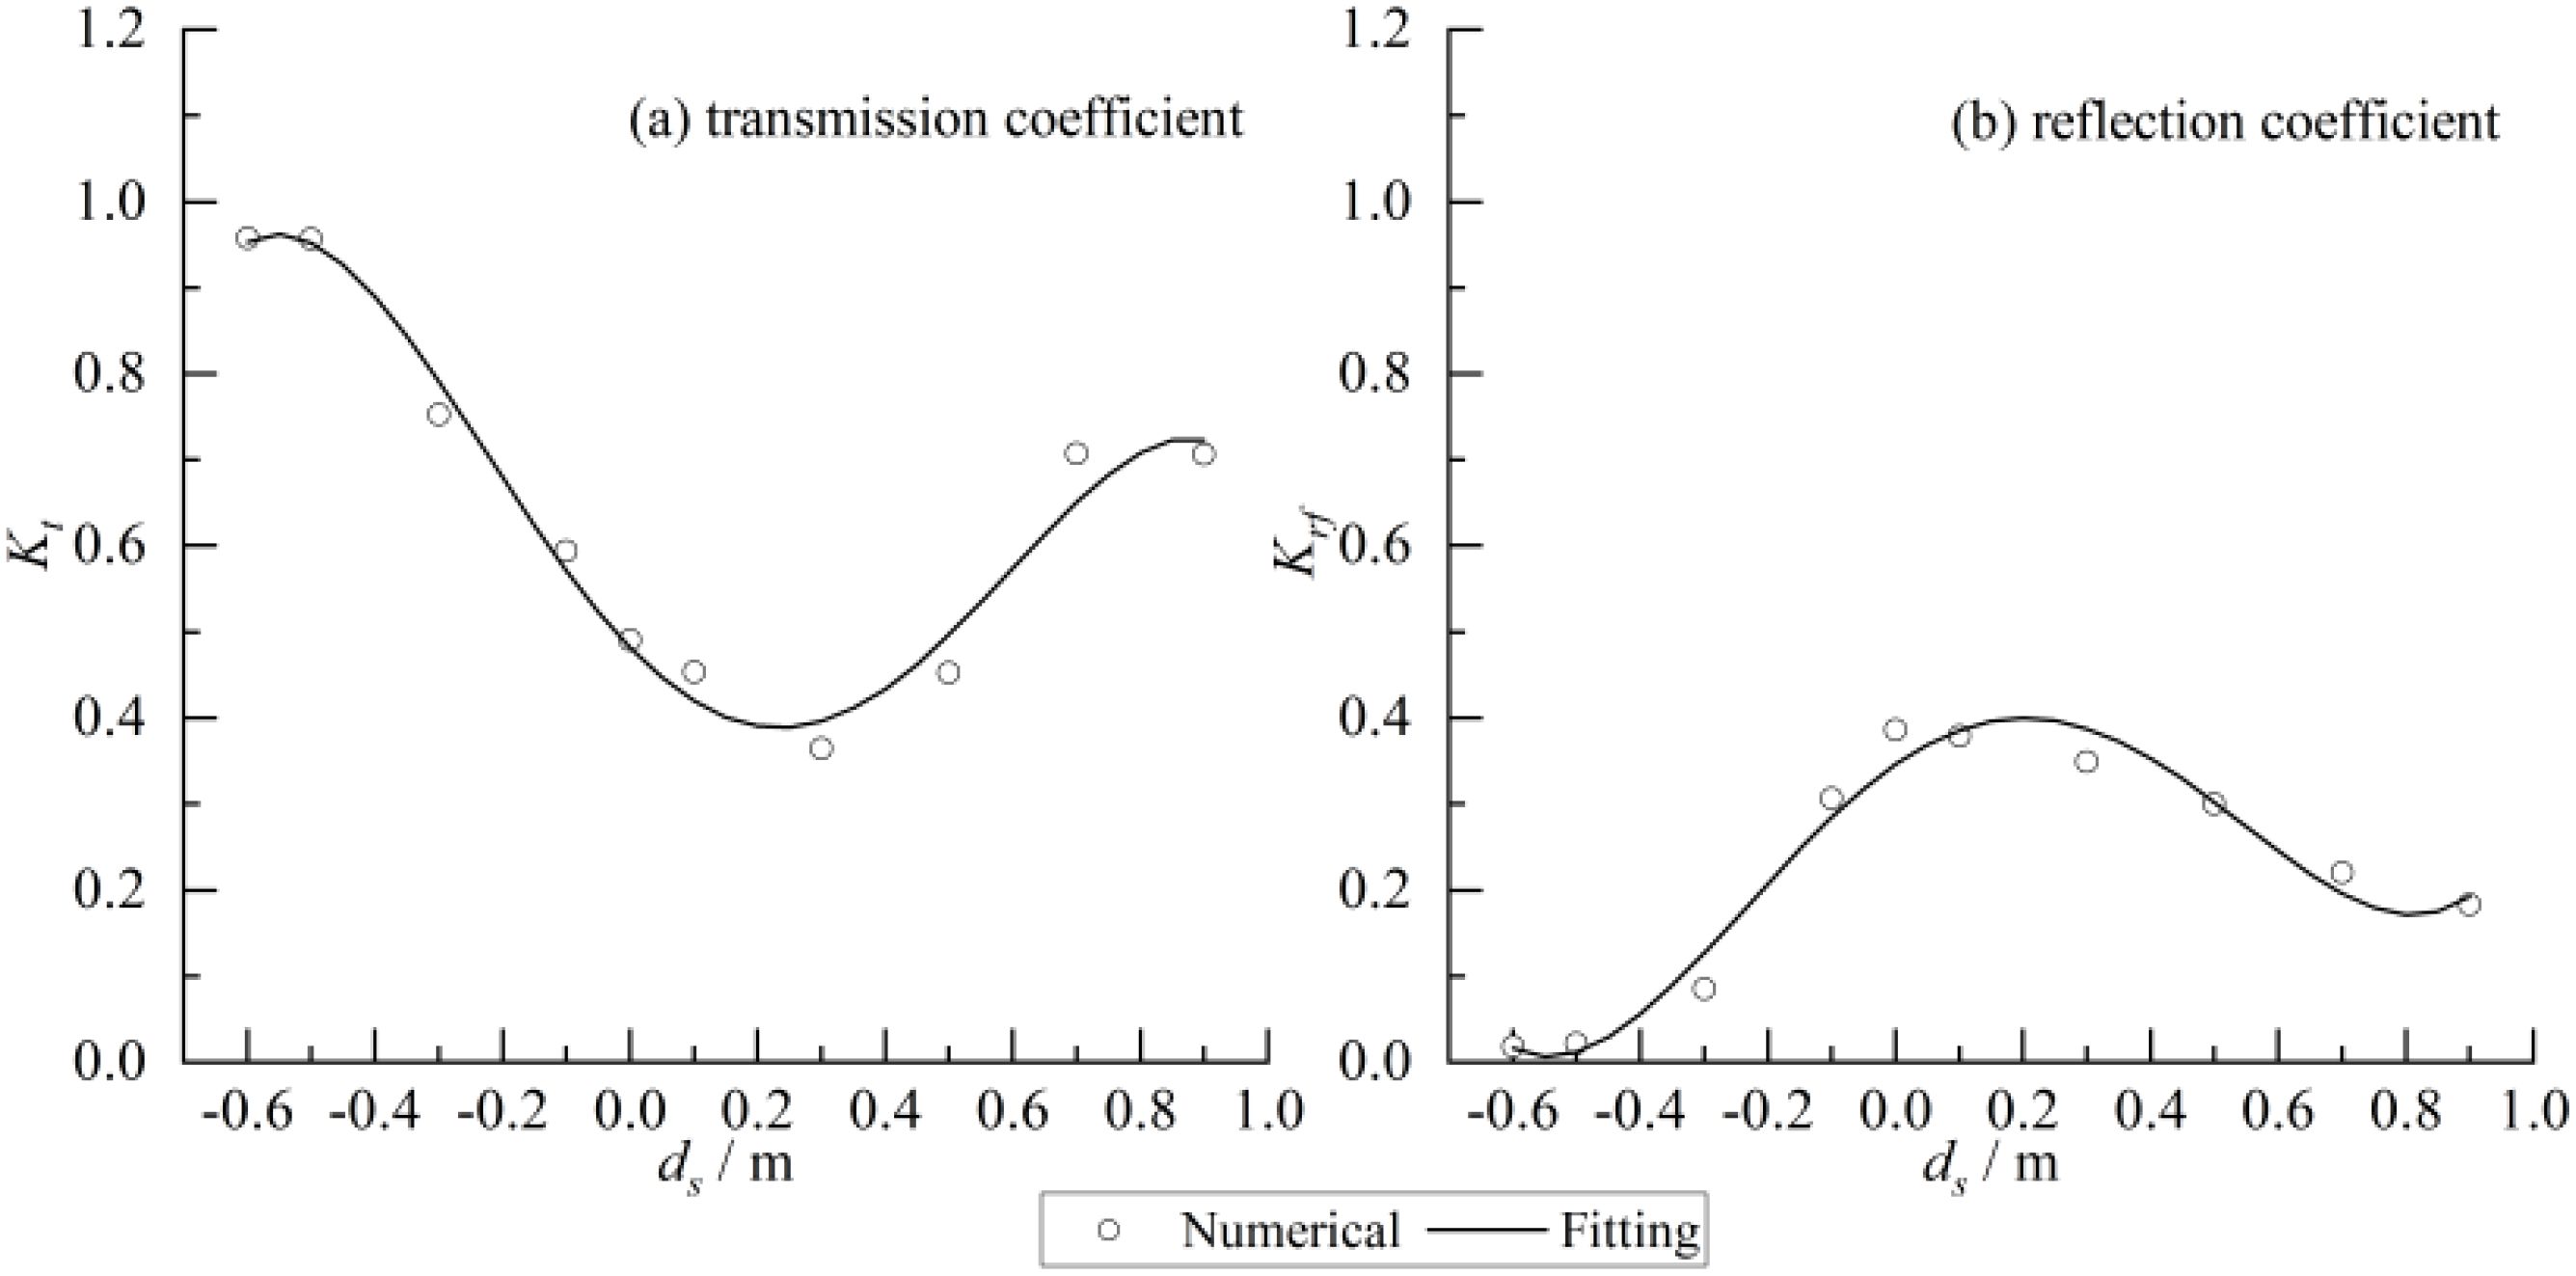
Figure 9. Transmission and reflection coefficient for different submergence depth. (A) Transmission coefficient. (B) reflection coefficient.
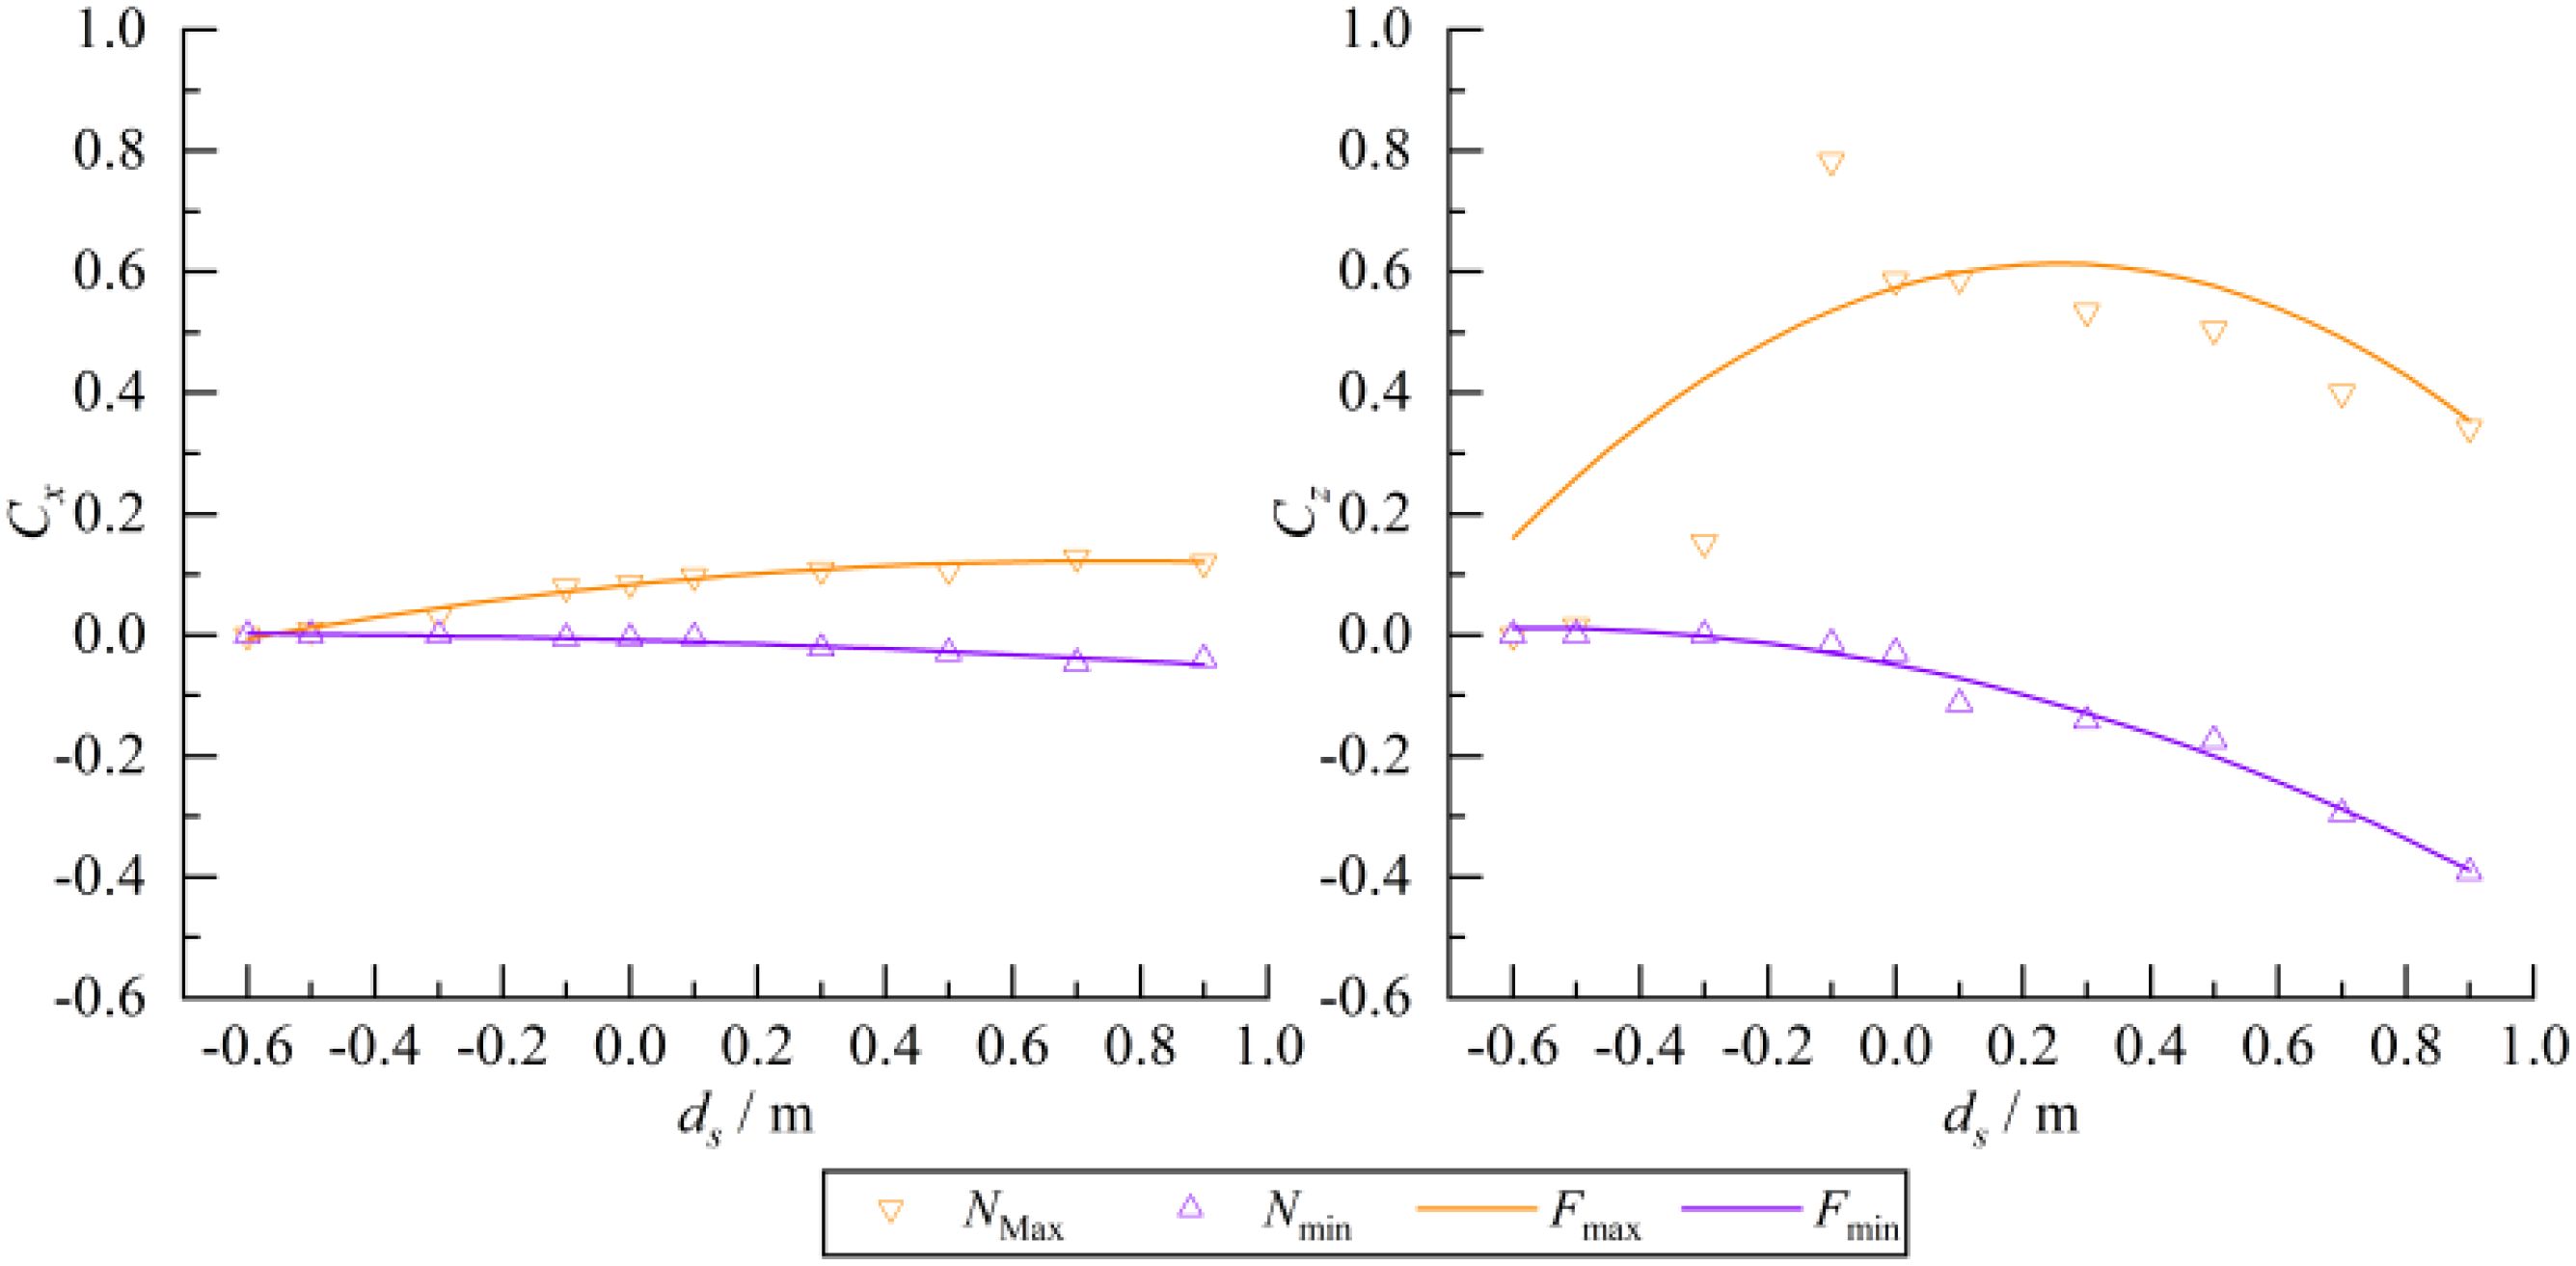
To analyze the quantitative relationship between the submergence depth and the wave load peak of the structure. The relation of maximum (Cxmax, Czmax) and minimum (Cxmin, Czmin) horizontal and vertical wave loads on the structure with the submergence depth are given in Figure 10. The point represents the numerical results while the curve represents the fitting results. Cxmax gradually increases and then slightly decreases with the submergence depth increases. The maximum value 0.13 is obtained at ds = 0.7 m. Cxmin decreases and reaches a minimum value of -0.05 at ds = 0.7 m with increasing submergence depth. Czmax rapidly increases and then gradually decreases with increasing submergence depth, reaching a maximum value of 0.78 at ds = -0.1 m. Czmin gradually decreases with increasing submergence depth. The minimum value is -0.39 obtained at ds = 0.9 m.
The empirical equations for the maximum and minimum wave loads in the horizontal (Equation 17) and vertical (Equation 18) directions as a function of submergence depth by polynomial fitting of the calculation results are as follows.
where B0 - B2 and C0 - C3 are coefficients which have been listed in Tables 4, 5. Figure 10 shows the comparison between the fitted curve and the numerical results. The fitting results of Czmax have slightly larger errors for ds < 0.0 m. Except for the R2 = 0.788 for the Czmax fitting results, the R2 of Cxmax, Cxmin, and Czmin fitting results are all exceed 0.9 indicating good fitting results.

Table 4. Empirical coefficients in Equation 17.

Table 5. Empirical coefficients in Equation 18.
4.5 Velocity and vorticity field
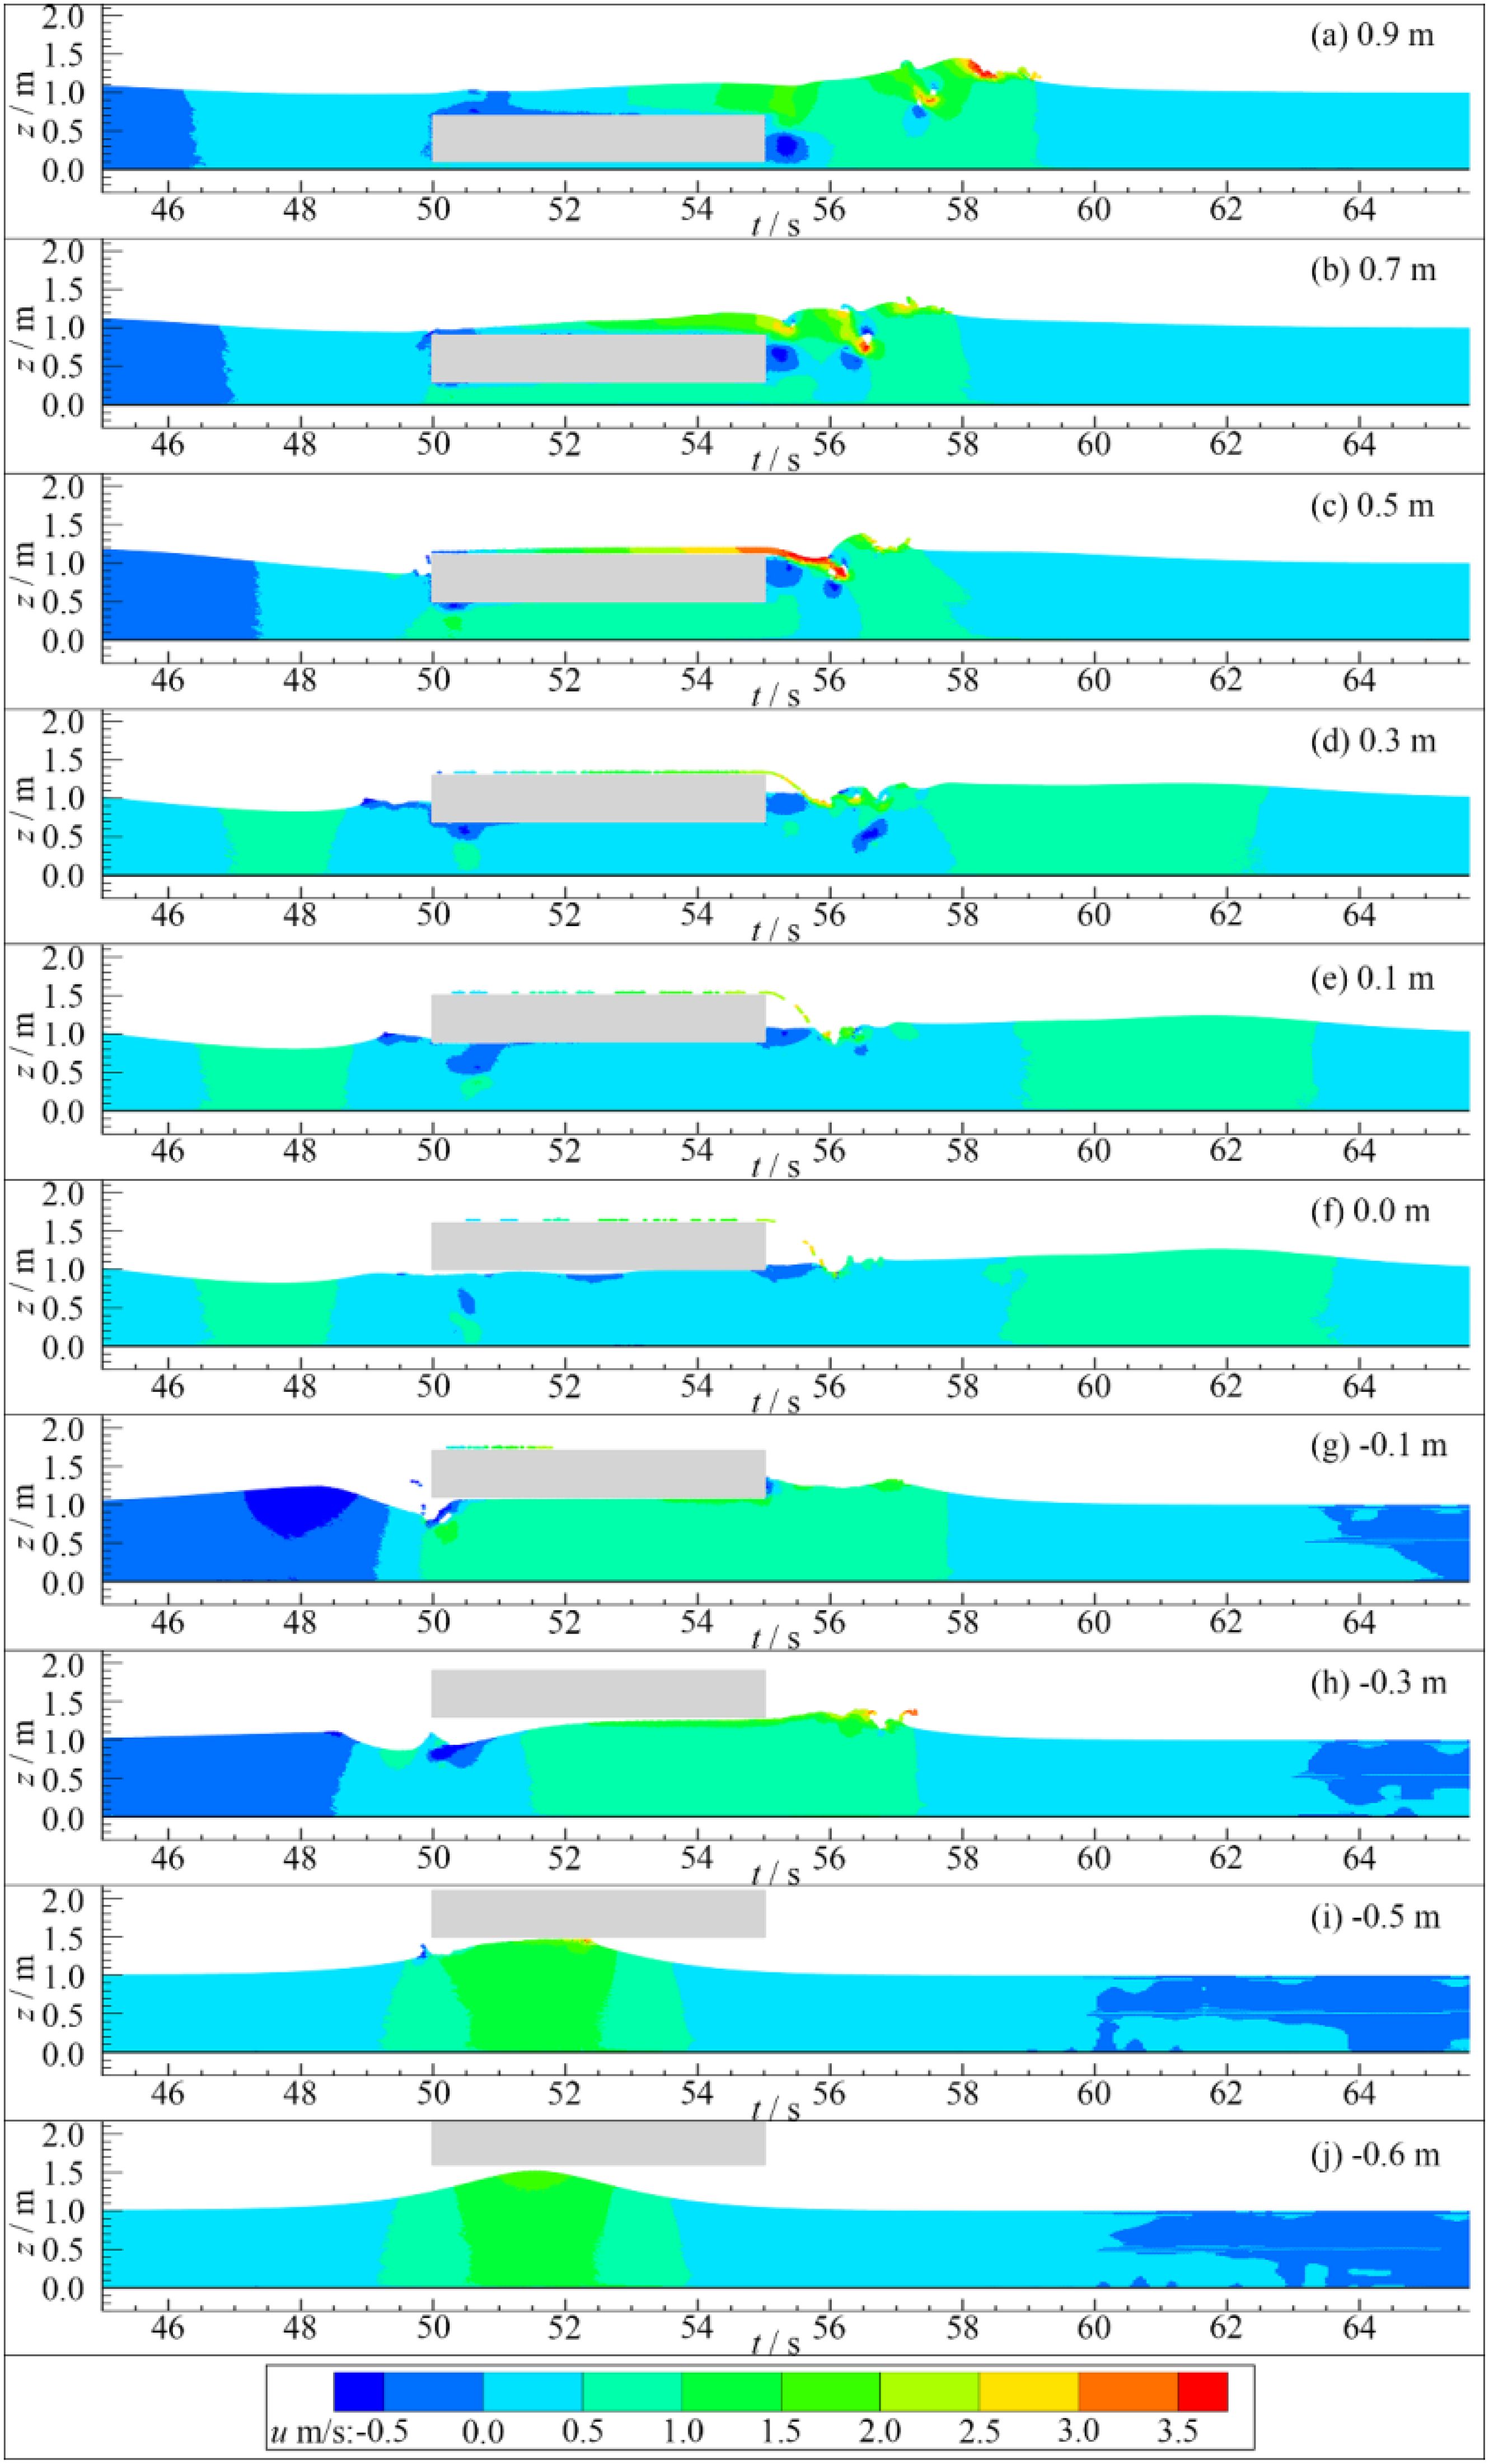
Figure 11 shows the velocity field of the interaction between solitary waves and structures at different submergence depths. The velocity field gradually stabilizes with the submergence depth decreases. There are overtopping and wave breaking at the top of the structures for Model 1 - 6. Solitary waves propagate downstream from both the top and bottom of the structure. The collision between the overtopping and the downstream water results in a complex flow field with a maximum velocity of over 3.5 m/s. For Model 7- 9 overtopping basically disappears. Solitary waves propagate downstream from the bottom of the structure. There is also some wave breaking due to the interaction between solitary waves and structures. As for Model 10, solitary waves completely pass the structure from the bottom without interaction with structures, resulting in a stable velocity field.
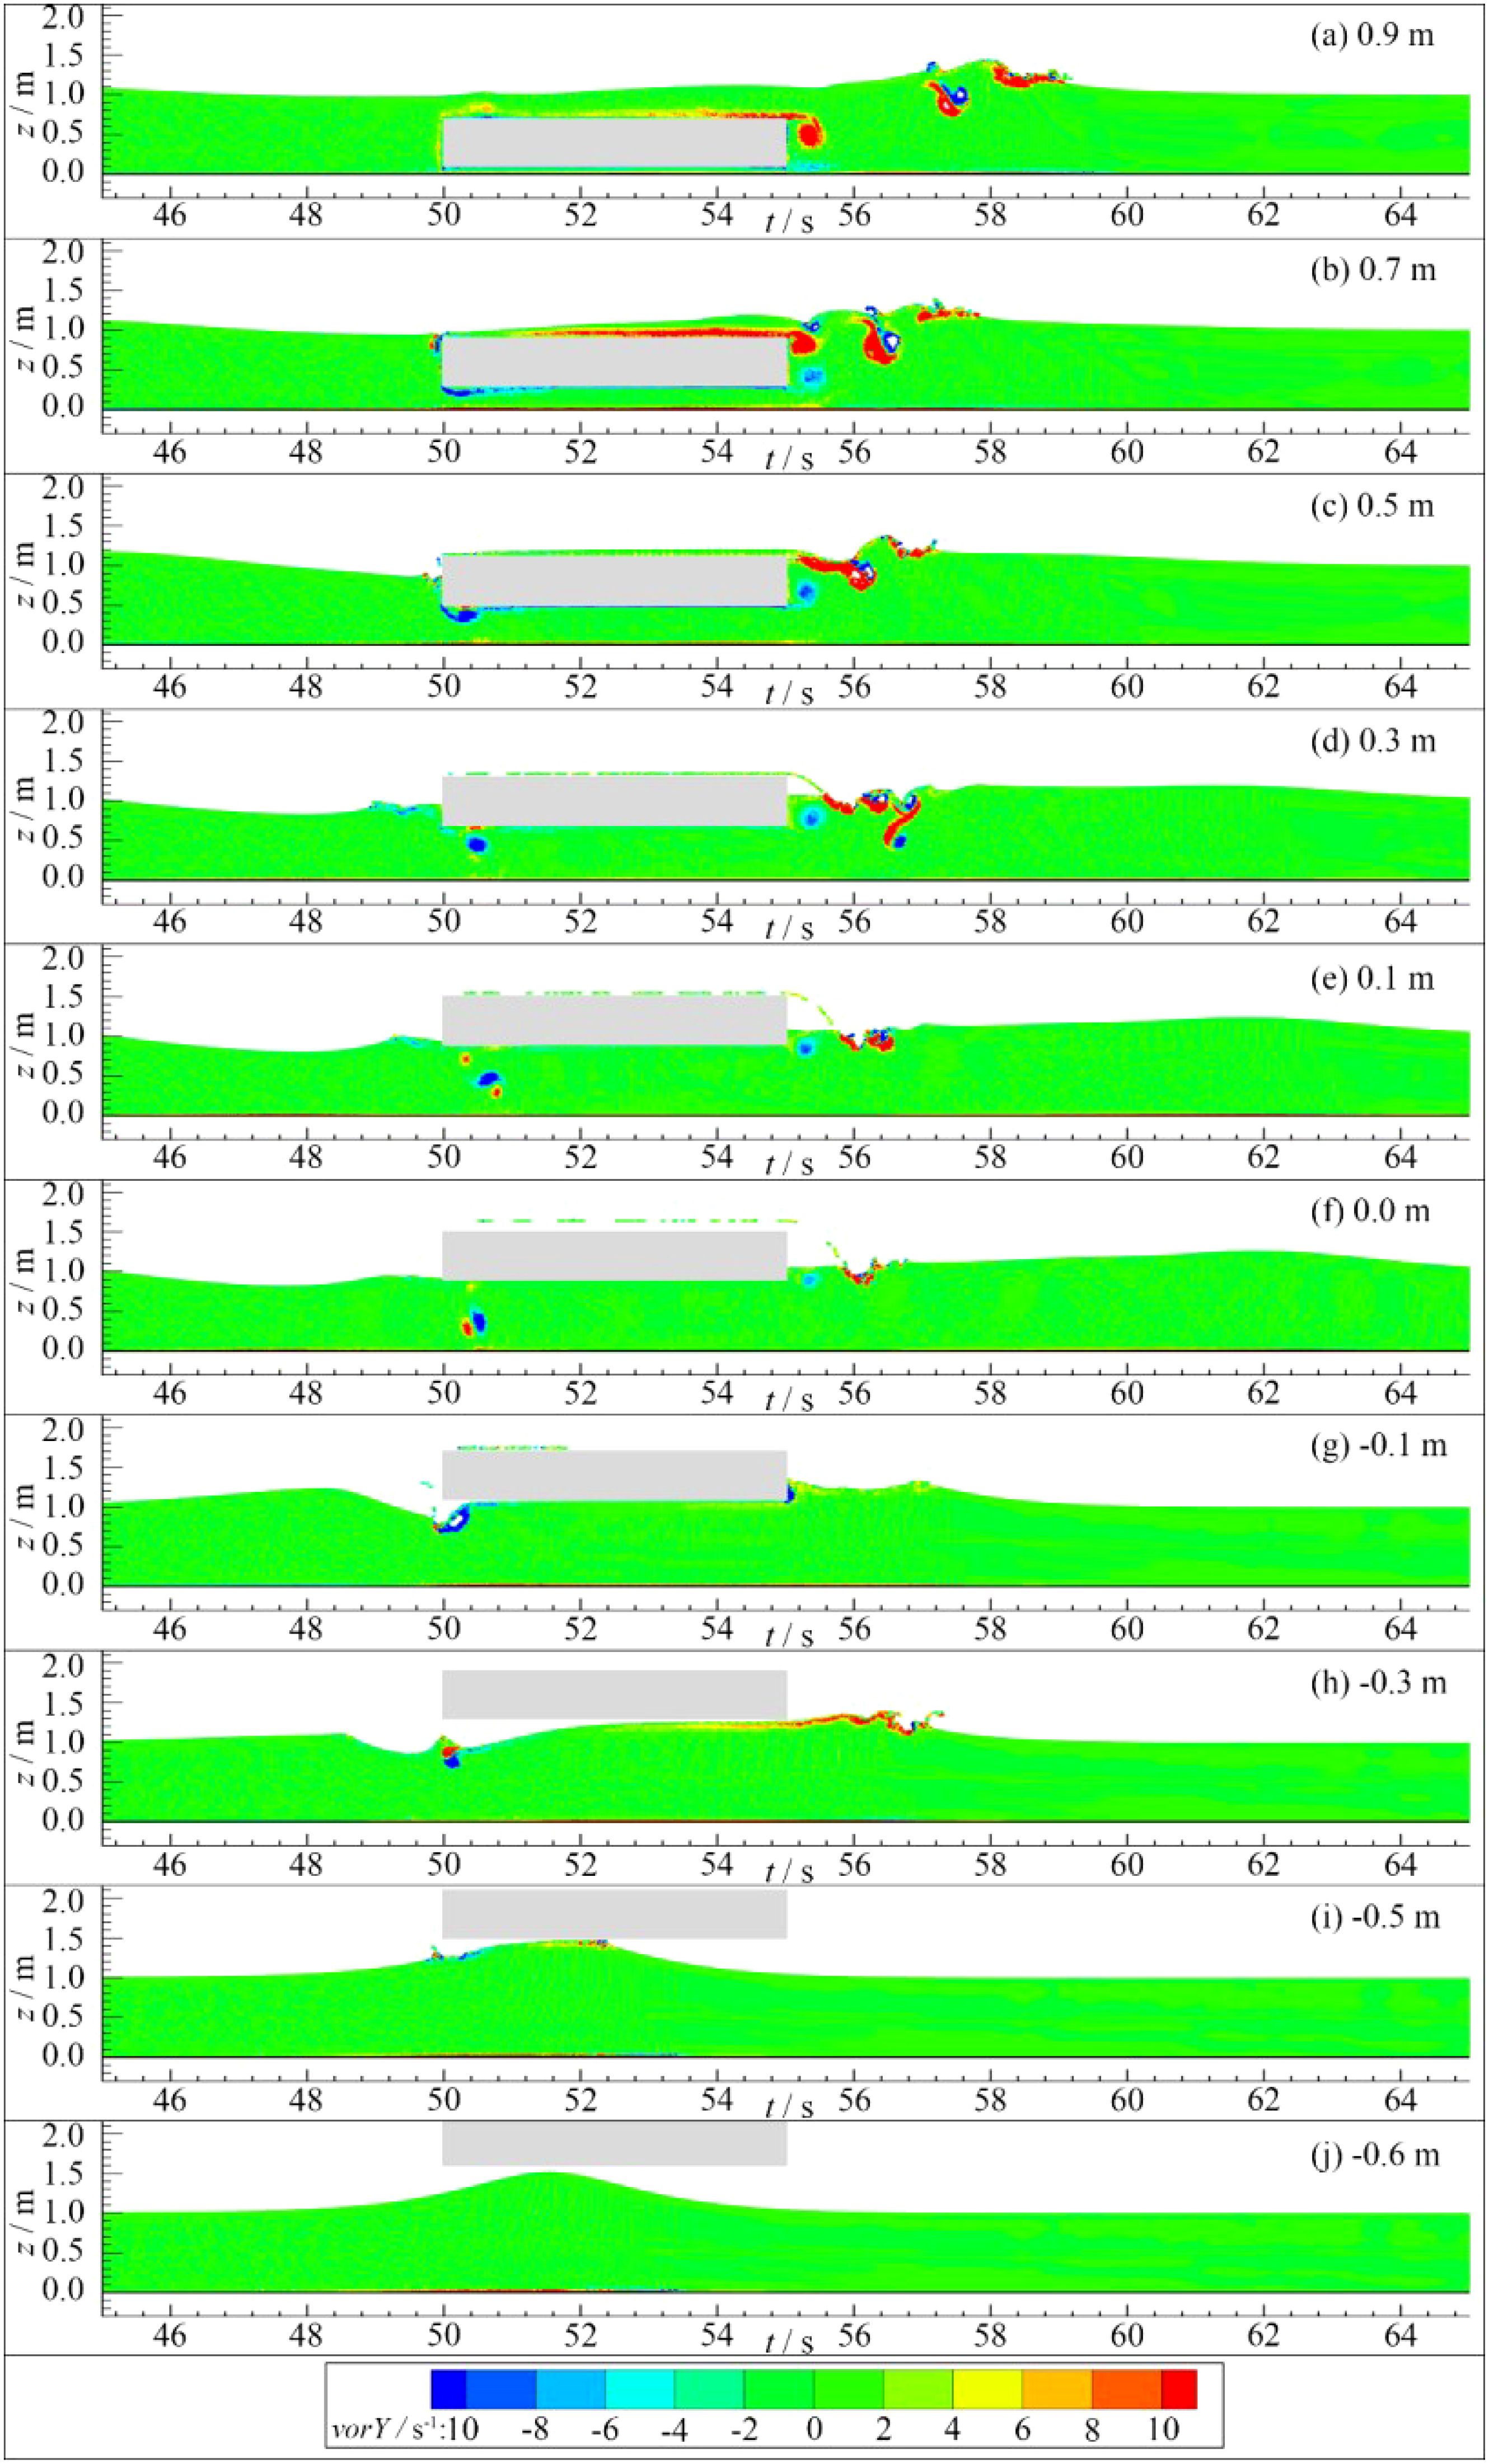
The vorticity field of the interaction between solitary waves and structures at different submergence depths is given in Figure 12. Consistent with Figure 11, the vorticity field also gradually stabilizes with the submergence depth decreases. For Model 1 - 6, the collision between the overtopping and downstream water induces a drastic variation in vorticity. The wave breaking leads to the complex vorticity field due to the aeration. Both clockwise and counterclockwise vortices appear simultaneously with maximum and minimum vorticity exceeding ± 10 s-1. The overtopping basically disappears for Model 7 - 9. The vorticity has a small size and mainly concentrates at the bottom of the structure. For Model 1, the distance between the structure bottom and the bottom board of the wave tank is small resulting in an underdeveloped vorticity field and low vorticity. For Model 2 - 9, the vorticity field at the lower left foot of the structure is relatively developed. The counterclockwise vortex has a larger size accompanied by small clockwise vortex. Model 10 has basically no vorticity.
5 Conclusions
A meshless numerical model of the interaction between solitary waves and semi-submersible structures is established based on the SPH model and Rayleigh theory. This model can simulate large deformation and wave breaking in the interaction between strongly nonlinear waves and semi-submersible structures. The effects of submergence depth on the wave surface, velocity, vorticity, and wave load of the semi-submersible structure are analyzed. The main conclusions are as follows.
1. The calculated results of solitary wave propagation test case are in good agreement with exact solution with a maximum absolute error of 0.025 m and a relative error of 8.4% for the solitary wave peak. The maximum L2 error of the wave height is 0.137. The calculated wave loads of the submerged horizontal plate test case are basically consistent with the trend of the experimental data. The maximum relative error of the wave load peak and valley is 54% (absolute error 0.37 N).
2. The reflection coefficient first increases and then decreases with the increase of submergence depth with a maximum value of 0.39 at ds = 0.0 m. The transmission coefficient basically decreases first and then increases with the increase of submergence depth with a minimum value of 0.36 at ds = 0.3 m. In addition, the transmission coefficient basically reaches a stable value of 0.71 for ds ≥ 0.7 m.
3. The horizontal wave load peak gradually increases with the submergence depth increases with a maximum value of 0.13 at ds = 0.7 m while the vertical wave load peak rapidly increases and then gradually decreases with the increase of submergence depth with a maximum value of 0.78 at ds = -0.1 m.
4. As the submergence depth increases, the complexity of the velocity and vorticity field increases. There is overtopping at ds ≥ 0.0 m. The collision between the overtopping and downstream water induces the wave surface to break and oscillate resulting in a complex velocity and vorticity field. The maximum velocity is above 3.5 m/s while the maximum and minimum vorticity are above ± 10 s-1.
This conclusion only applies to the interaction between solitary waves and rectangular semi-submersible structures of constant size.
Data availability statement
The raw data supporting the conclusions of this article will be made available by the authors, without undue reservation.
Author contributions
JL: Formal analysis, Methodology, Writing – original draft. RW: Formal analysis, Writing – original draft. YH: Resources, Visualization, Writing – review & editing. YM: Investigation, Visualization, Writing – review & editing. ZZ: Methodology, Validation, Writing – review & editing. YL: Investigation, Visualization, Writing – original draft. HM: Methodology, Writing – review & editing. GW: Supervision, Writing – review & editing.
Funding
The author(s) declare financial support was received for the research, authorship, and/or publication of this article. This work was financially supported by the National Natural Science Foundation of China (Grant No. 52001071); the Guangdong Basic and Applied Basic Research Foundation (Grant No. 2024A1515012321, 2023A1515010890, 2022A1515240039); the Special Fund Competition Allocation Project of Guangdong Science and Technology Innovation Strategy (Grant No. 2023A01022); the Open Fund of State Key Laboratory of Coastal and Offshore Engineering, Dalian University of Technology (LP2403); the Doctoral Initiating Project of Guangdong Ocean University (R20068, 120602-R20069, 120601-060302072404); Student Innovation Team Project of Guangdong Ocean University (CXTD2023012).
Conflict of interest
The authors declare that the research was conducted in the absence of any commercial or financial relationships that could be construed as a potential conflict of interest.
Generative AI statement
The author(s) declare that no Generative AI was used in the creation of this manuscript.
Publisher’s note
All claims expressed in this article are solely those of the authors and do not necessarily represent those of their affiliated organizations, or those of the publisher, the editors and the reviewers. Any product that may be evaluated in this article, or claim that may be made by its manufacturer, is not guaranteed or endorsed by the publisher.
References
Ai C., Jin S. (2012). A multi-layer non-hydrostatic model for wave breaking and run-up. Coast. Eng. 62, 1–8. doi: 10.1016/j.coastaleng.2011.12.012
Ai C., Ma Y., Yuan C., Xie Z., Dong G., Stoesser T. (2022). Vortex shedding and evolution induced by the interactions between a solitary wave and a submerged horizontal plate. J. Hydraul. Res. 60, 2001594. doi: 10.1080/00221686.2021.2001594
Altomare C., Crespo A. J. C., Rogers B. D., Dominguez J. M., Gironella X., Gómez-Gesteira M., et al. (2014). Numerical modelling of armour block sea breakwater with smoothed particle hydrodynamics. Comput. Struct. 130, 34–45. doi: 10.1016/j.compstruc.2013.10.011
Antuono M., Colagrossi A., Marrone S., Molteni D. (2010). Free-surface flows solved by means of SPH schemes with numerical diffusive terms. Comput. Phys. Commun. 181, 532–549. doi: 10.1016/j.cpc.2009.11.002
Barreiro A., Crespo A. J. C., Dominguez J. M., Garcia-Feal O., Zabala I., Gomez-Gesteira M., et al. (2016). Quasi-static mooring solver implemented in SPH. J. Ocean Eng. Mar. Energy. 2, 381–396. doi: 10.1007/s40722-016-0061-7
Crespo A. J. C., Domínguez J. M., Rogers B. D., Gómez-Gesteira M., Longshaw S., Canelas R., et al. (2015). DualSPHysics: Open-source parallel CFD solver based on Smoothed Particle Hydrodynamics (SPH). Comput. Phys. Commun. 187, 204–216. doi: 10.1016/j.cpc.2014.10.004
Crespo A. J. C., Gómez-Gesteira M., Dalrymple R. A. (2007). Boundary conditions generated by dynamic particles in SPH methods. Comput. Mater. Con. 5, 173–184.
Dalrymple R. A., Rogers B. D. (2006). Numerical modeling of water waves with the SPH method. Coast. Eng. 53, 141–147. doi: 10.1016/j.coastaleng.2005.10.004
Ding W., Ai C., Jin S., Lin J. (2020). Numerical investigation of an internal solitary wave interaction with horizontal cylinders. Ocean Eng. 208, 107430. doi: 10.1016/j.oceaneng.2020.107430
Domínguez J. M., Altomare C., Gonzalez-Cao J., Lomonaco P. (2019). Towards a more complete tool for coastal engineering: solitary wave generation, propagation and breaking in an SPH-based model. Coast. Eng. J. 61, 15–40. doi: 10.1080/21664250.2018.1560682
Gao J., Hou L., Liu Y., Shi H. (2024a). Influences of Bragg reflection on harbor resonance triggered by irregular wave groups. Ocean Eng. 305, 117941. doi: 10.1016/j.oceaneng.2024.117941
Gao J., Ma X., Chen H., Zang J., Dong G. (2020a). On hydrodynamic characteristics of transient harbor resonance excited by double solitary waves. Ocean Eng 219, 108345.
Gao J., Ma X., Dong G., Zang J., Ma Y., Zhou L. (2019). Effects of offshore fringing reefs on the transient harbor resonance excited by solitary waves. Ocean Eng 190, 106422.
Gao J., Ma X., Zang J., Dong G., Ma X., Zhu Y., et al. (2020b). Numerical investigation of harbor oscillations induced by focused transient wave groups. Coast. Eng. 158, 103670. doi: 10.1016/j.coastaleng.2020.103670
Gao J., Mi C., Song Z., Liu Y. (2024b). Transient gap resonance between two closely-spaced boxes triggered by nonlinear focused wave groups. Ocean Eng. 305, 117938. doi: 10.1016/j.oceaneng.2024.117938
Geng T., Liu H., Dias F. (2021). Solitary-wave loads on a three-dimensional submerged horizontal plate: Numerical computations and comparison with experiments. Phys. Fluids. 33, 037129. doi: 10.1063/5.0043912
Gong S., Gao J., Song Z., Shi H., Liu Y. (2024). Hydrodynamics of fluid resonance in a narrow gap between two boxes with different breadths. Ocean Eng. 311, 118986. doi: 10.1016/j.oceaneng.2024.118986
He M., Gao X. F., Xu W. H. (2018). Numerical simulation of wave-current interaction using the SPH method. J. Hydrodyn. 30, 535–538. doi: 10.1007/s42241-018-0042-5
He M., Gao X., Xu W., Ren B., Wang H. (2019). Potential application of submerged horizontal plate as a wave energy breakwater: A 2D study using the WCSPH method. Ocean Eng. 185, 27–46. doi: 10.1016/j.oceaneng.2019.05.034
He M., Liang D. F., Ren B., Li J., Shao S. (2023). Wave interactions with multi-float structures: SPH model, experimental validation, and parametric study. Coast. Eng. 184, 104333. doi: 10.1016/j.coastaleng.2023.104333
Hu Z., Greaves D., Raby A. (2016). Numerical wave tank study of extreme waves and wave-structure interaction using OpenFoam. Ocean Eng. 126, 329–342. doi: 10.1016/j.oceaneng.2016.09.017
Lin J., Hu L., He Y., Mao H., Wu G., Tian Z and Zhang D. (2023). Verification of solitary wave numerical simulation and case study on interaction between solitary wave and semi-submerged structures based on SPH model. Front. Mar. Sci. 10, 1324273. doi: 10.3389/fmars.2023.1324273
Luo M., Khayyer A., Lin P. (2021). Particle methods in ocean and coastal engineering. Appl. Ocean Res. 114, 102734. doi: 10.1016/j.apor.2021.102734
Omidvar P., Stansby P. K., Rogers B. D. (2012). Wave body interaction in 2D using smoothed particle hydrodynamics (SPH) with variable particle mass. Int. J. Numer. Meth. Fluids. 68, 686–705. doi: 10.1002/fld.v68.6
Pan K., IJzermans R. H. A., Jones B. D., Thyagarajan A., Van Beest B. W.H., Williams J. R. (2015). Application of the SPH method to solitary wave impact on an offshore platform. Comp. Part. Mech. 3, 155–166. doi: 10.1007/s40571-015-0069-0
Seiffert B., Hayatdavoodi M., Ertekin R. C. (2014). Experiments and computations of solitary-wave forces on a coastal-bridge deck. Part I: Flat Plate. Coast. Eng. 02836, 1–16. doi: 10.1016/j.coastaleng.2014.01.005
Sun J. L., Wang C. Z., Wu G. X., Khoo B. C. (2015). Fully nonlinear simulations of interactions between solitary waves and structures based on the finite element method. Ocean Eng. 108, 202–215. doi: 10.1016/j.oceaneng.2015.08.007
Tai B., Ma Y., Dong G., Koh C. G., Tang T., Perlin M. (2024). An enhanced model for an extreme wave impacting a vertical cylinder. Coast. Eng. 194, 104630. doi: 10.1016/j.coastaleng.2024.104630
Tripepi G., Aristodemo F., Meringolo D. D., Gumari L., Filianoti P. (2020). Hydrodynamic forces induced by a solitary wave interacting with a submerged square barrier: Physical tests and delta-LES-SPH simulations. Coast. Eng. 158, 103690. doi: 10.1016/j.coastaleng.2020.103690
Wang J., He G., You R., Liu P. (2018). Numerical study on interaction of a solitary wave with the submerged obstacle. Ocean Eng. 158, 1–14. doi: 10.1016/j.oceaneng.2018.03.064
Wang Q., Liu H., Fang Y., Dias F. (2020). Experimental study on free-surface deformation and forces on a finite submerged plate induced by a solitary wave. Phys. Fluids. 32, 086601. doi: 10.1063/5.0015903
Wen H., Ren B., Dong P., Wang Y. (2016). A SPH numerical wave basin for modeling wave-structure interactions. Appl. Ocean Res. 59, 366–377. doi: 10.1016/j.apor.2016.06.012
Keywords: wave structure interaction, solitary waves, submergence depth, semisubmersible structure, SPH
Citation: Lin J, Wu R, He Y, Ma Y, Zhou Z, Liu Y, Mao H and Wu G (2024) Study on the influence of submergence depth on the hydrodynamic and wave load characteristics of semi-submersible structures induced by a solitary wave. Front. Mar. Sci. 11:1503617. doi: 10.3389/fmars.2024.1503617
Received: 29 September 2024; Accepted: 06 November 2024;
Published: 26 November 2024.
Edited by:
Riccardo Briganti, University of Nottingham, United KingdomReviewed by:
Junliang Gao, Jiangsu University of Science and Technology, ChinaMin Luo, Zhejiang University, China
Copyright © 2024 Lin, Wu, He, Ma, Zhou, Liu, Mao and Wu. This is an open-access article distributed under the terms of the Creative Commons Attribution License (CC BY). The use, distribution or reproduction in other forums is permitted, provided the original author(s) and the copyright owner(s) are credited and that the original publication in this journal is cited, in accordance with accepted academic practice. No use, distribution or reproduction is permitted which does not comply with these terms.
*Correspondence: Yanli He, aGV5YW5saTA2MjNAMTI2LmNvbQ==
 Jinbo Lin
 Runzhen Wu1
 Yanli He


