- 1Second Institute of Oceanography, Ministry of Natural Resources (MNR), Hangzhou, China
- 2Haikou Marine Geological Survey Center, China Geological Survey, Haikou, China
- 3Key Laboratory of Ocean Space Resource Management Technology, Ministry of Natural Resources (MNR), Hangzhou, China
- 4Institute of Coastal System-Analysis and Modeling, Helmholtz-Zentrum Hereon, Geesthacht, Germany
- 5College of Civil Engineering, Tongji University, Shanghai, China
The response of beach sedimentary geomorphology to consecutive storms is a complex process, especially for beaches surrounding an island. Variations in coastal sedimentary landforms, dynamic environments and levels of development and utilization lead to non-uniformity in storm response, which may become more pronounced when influenced by continuous storms. This study focuses on the beaches around Weizhou Island to investigate this non-uniformity. Based on the topographic, surface sediment and hydrodynamic data collected on site before and after the consecutive typhoons (Typhoons Lionrock and Kompasu), the study examines the characteristics of beach geomorphology and surface sediment. The results show significant differences in the geomorphological responses between the four zones along the island. On the plane, the deposition degree of Zone I beach gradually weakened from west to east, and most areas of Zone III beach appeared in an alternating state of erosion and deposition. The beaches of Zone II and Zone IV showed the characteristics of dramatic changes in the northern and central beaches and relatively stable in the southern beaches. On the profile, the beach deformation area mainly occurs in the middle and upper parts of foreshore and berm. The response intensity of beaches in zone I is the weakest, the response intensity of beaches in zone III is the most intense, and the response intensity of beaches in zone II and zone IV is relatively close. However, the performance of beach sediments in different regions before and after continuous typhoons is less different. Except that the beach sediments in Zone I were mainly refined, the beach sediments in other zones of Weizhou Island were relatively coarse, and the sediments in the middle and upper parts of the foreshore were the coarsest, with the sorting being the worst. The different combinations of incident waves and storm surges during the typhoons are the primary factors that lead to various geomorphological responses in different zones. The antecedent beach status, distributions of rock and coral reefs, and anthropogenic activities further exacerbate these differences. This work can provide reference for island beach protection and management.
1 Introduction
Erosion is one of the most common and harmful coastal geological hazards (Cai et al., 2019). Sandy coast accounts for approximately one-third of the global non-frozen coastline, with approximately 24% of sandy beaches eroded at a rate of > 0.5 m/a in recent years (Luijendijk et al., 2018). It is estimated that by 2100, approximately 35.7−49.5% of beaches globally will be threatened by erosion by 2100 (Vousdoukas et al., 2020). In recent decades, beach erosion has become an increasingly serious problem due to the combined effects of sea level rise, intensified anthropogenic activities, and frequent storm events.
Storm events are the main factor causing drastic short-term changes in beach morphology (Dai et al., 2001; Vousdoukas et al., 2020). Rapid increases in the water level and wave height caused by storm events can lead to dramatic changes in the beach topography and sediment distribution (Coco et al., 2014; Ma et al., 2019; Zeng et al., 2020; Huang et al., 2021a). Consequently, the response characteristics of beaches to storms has garnered great interest among coastal researchers. In recent years, with the improvement of monitoring technology, research has gradually shifted from focusing on the impacts of individual storms (Masselink et al., 2015; Guo et al., 2018) to those of consecutive storms (Guo et al., 2019, 2020). Studies have shown that storm clusters can cause more extensive beach erosion than individual events (Dissanayake et al., 2015; Senechal et al., 2015). Changes in the beach areas are influenced by the intensity and frequency of storms, the time interval between consecutive storms, and the recovery of the beach after storms (Karunarathna et al., 2014; Guo et al., 2020).
The response of beach sedimentary geomorphology to storms is complex, Waves are the most active dynamic factors in shaping the sandy coastline, controlling the transportation and accretion of sediments near the shore (Komar, 1976). Tides also play a significant role in shaping the coast by changing the zone of wave action (Masselink and Short, 1993). Storm events are also important factors that can cause rapid changes in nearshore hydrodynamics, including storm waves and surges, which have significant impact on beach morphodynamics (Dai et al., 2001; Guo et al., 2020). The beaches are influenced not only by storm characteristics but also the initial topographic features of the beach (Cooper et al., 2004). Previous studies have shown that different geomorphic types of beaches have distinct response characteristics to storms (Qi et al., 2010; Thuan et al., 2016). Furthermore, differences in beach plane morphology will also lead to various sedimentary responses to storms (Yu et al., 2013). Moreover, the distributions of rock and coral reefs near the shore (Vetter et al., 2010; Jeanson et al., 2013; Gong et al., 2017) and the development of vegetation and dunes in the backshore area (Silva et al., 2016) can significantly affect the beach response to storms. In addition, storm wave periods may match the natural periods of the harbor, resulting in the harbor resonance phenomenon, which can amplify the wave action within the harbor, leading to the erosion or accumulation of sediment in the harbor, especially in harbors on islands (Wang et al., 2017, 2020). Therefore, harbor resonance may also influence beach storm response in semi-enclosed harbors.
Research on island beaches has predominantly focused on barrier islands (Anderson et al., 2016; Harter and Figlus, 2017; Schmelz and Psuty, 2022; Molinaroli et al.,2023) or individual beaches on specific islands (Guo et al., 2018, 2019; Abreu et al., 2020; Komi et al., 2022; Liu et al., 2024). However, there is comparatively little research that examines all the beaches on the island, resulting in a limited understanding of the differences in storm response of beach sedimentary geomorphology in different regions of an island. This gap highlights the necessity for further study in this area. To address this, we selected the beaches around Weizhou Island as the focus of our research.
Previous studies revealed the different erosion/accretion state of Weizhou island, but the mechanism of the difference remains unclear. Beach profile data collected over the years between 2006 and 2013 showed severe erosion in the eastern and southwestern sections of the island (Yao et al., 2013). However, between December 2012 and December 2013, the low tide parts of beaches in the southeast, southwest, and northwest of the island were eroded, while the high and middle tide parts of beaches in the north and northwest were mainly accreted (Zhang et al., 2016). The periods from May to July and from October to December are the high astronomical tide periods of Weizhou Island with frequent typhoon and gale influence, making those periods high-risk for beach erosion on the island (Li et al., 2015). During the third typhoon in 2013, the northeastern and western coastal sections of Weizhou Island were severely eroded, while the coast of the South Bay exhibited minimal change (Yao et al., 2013). Generally, the sediments on high tide beaches are coarser than that on low tide beaches (Zhang et al., 2016). These findings illustrate the scarcity of research on the beaches around Weizhou Island, especially on the response of typhoons.
By focusing on the response characteristics of the sandy beaches around Weizhou Island to consecutive storms, this study addresses the research gap utilizing field-measured profile topographic data and surface sediment grain size data before and after two storm events. The findings will contribute to a deeper understanding of the evolution dynamics of the island beach and provide technical support for ecological protection, restoration, and the sustainable utilization of local beach resources.
2 Study area and typhoon conditions
2.1 Study area
Weizhou Island is in the northern part of Beibu Gulf, approximately 48 km away from the urban area of Beihai, Guangxi Province (Figure 1A). The island extends in a NE-SW direction and has an elliptical shape. It is approximately 6 km long from north to south, 5 km wide from east to west, and has an area of approximately 25 km2, making it the largest and youngest volcanic island in China (Li and Wang, 2004). The island’s topography is low in the north and high in the south; the northern coast is dominated by marine accumulative forms and coral reef forms, while the southern coast is dominated by abrasion forms. The South Bay is a crescent shape in the southern region of the island (Qi et al., 2003), as shown in Figure 1.
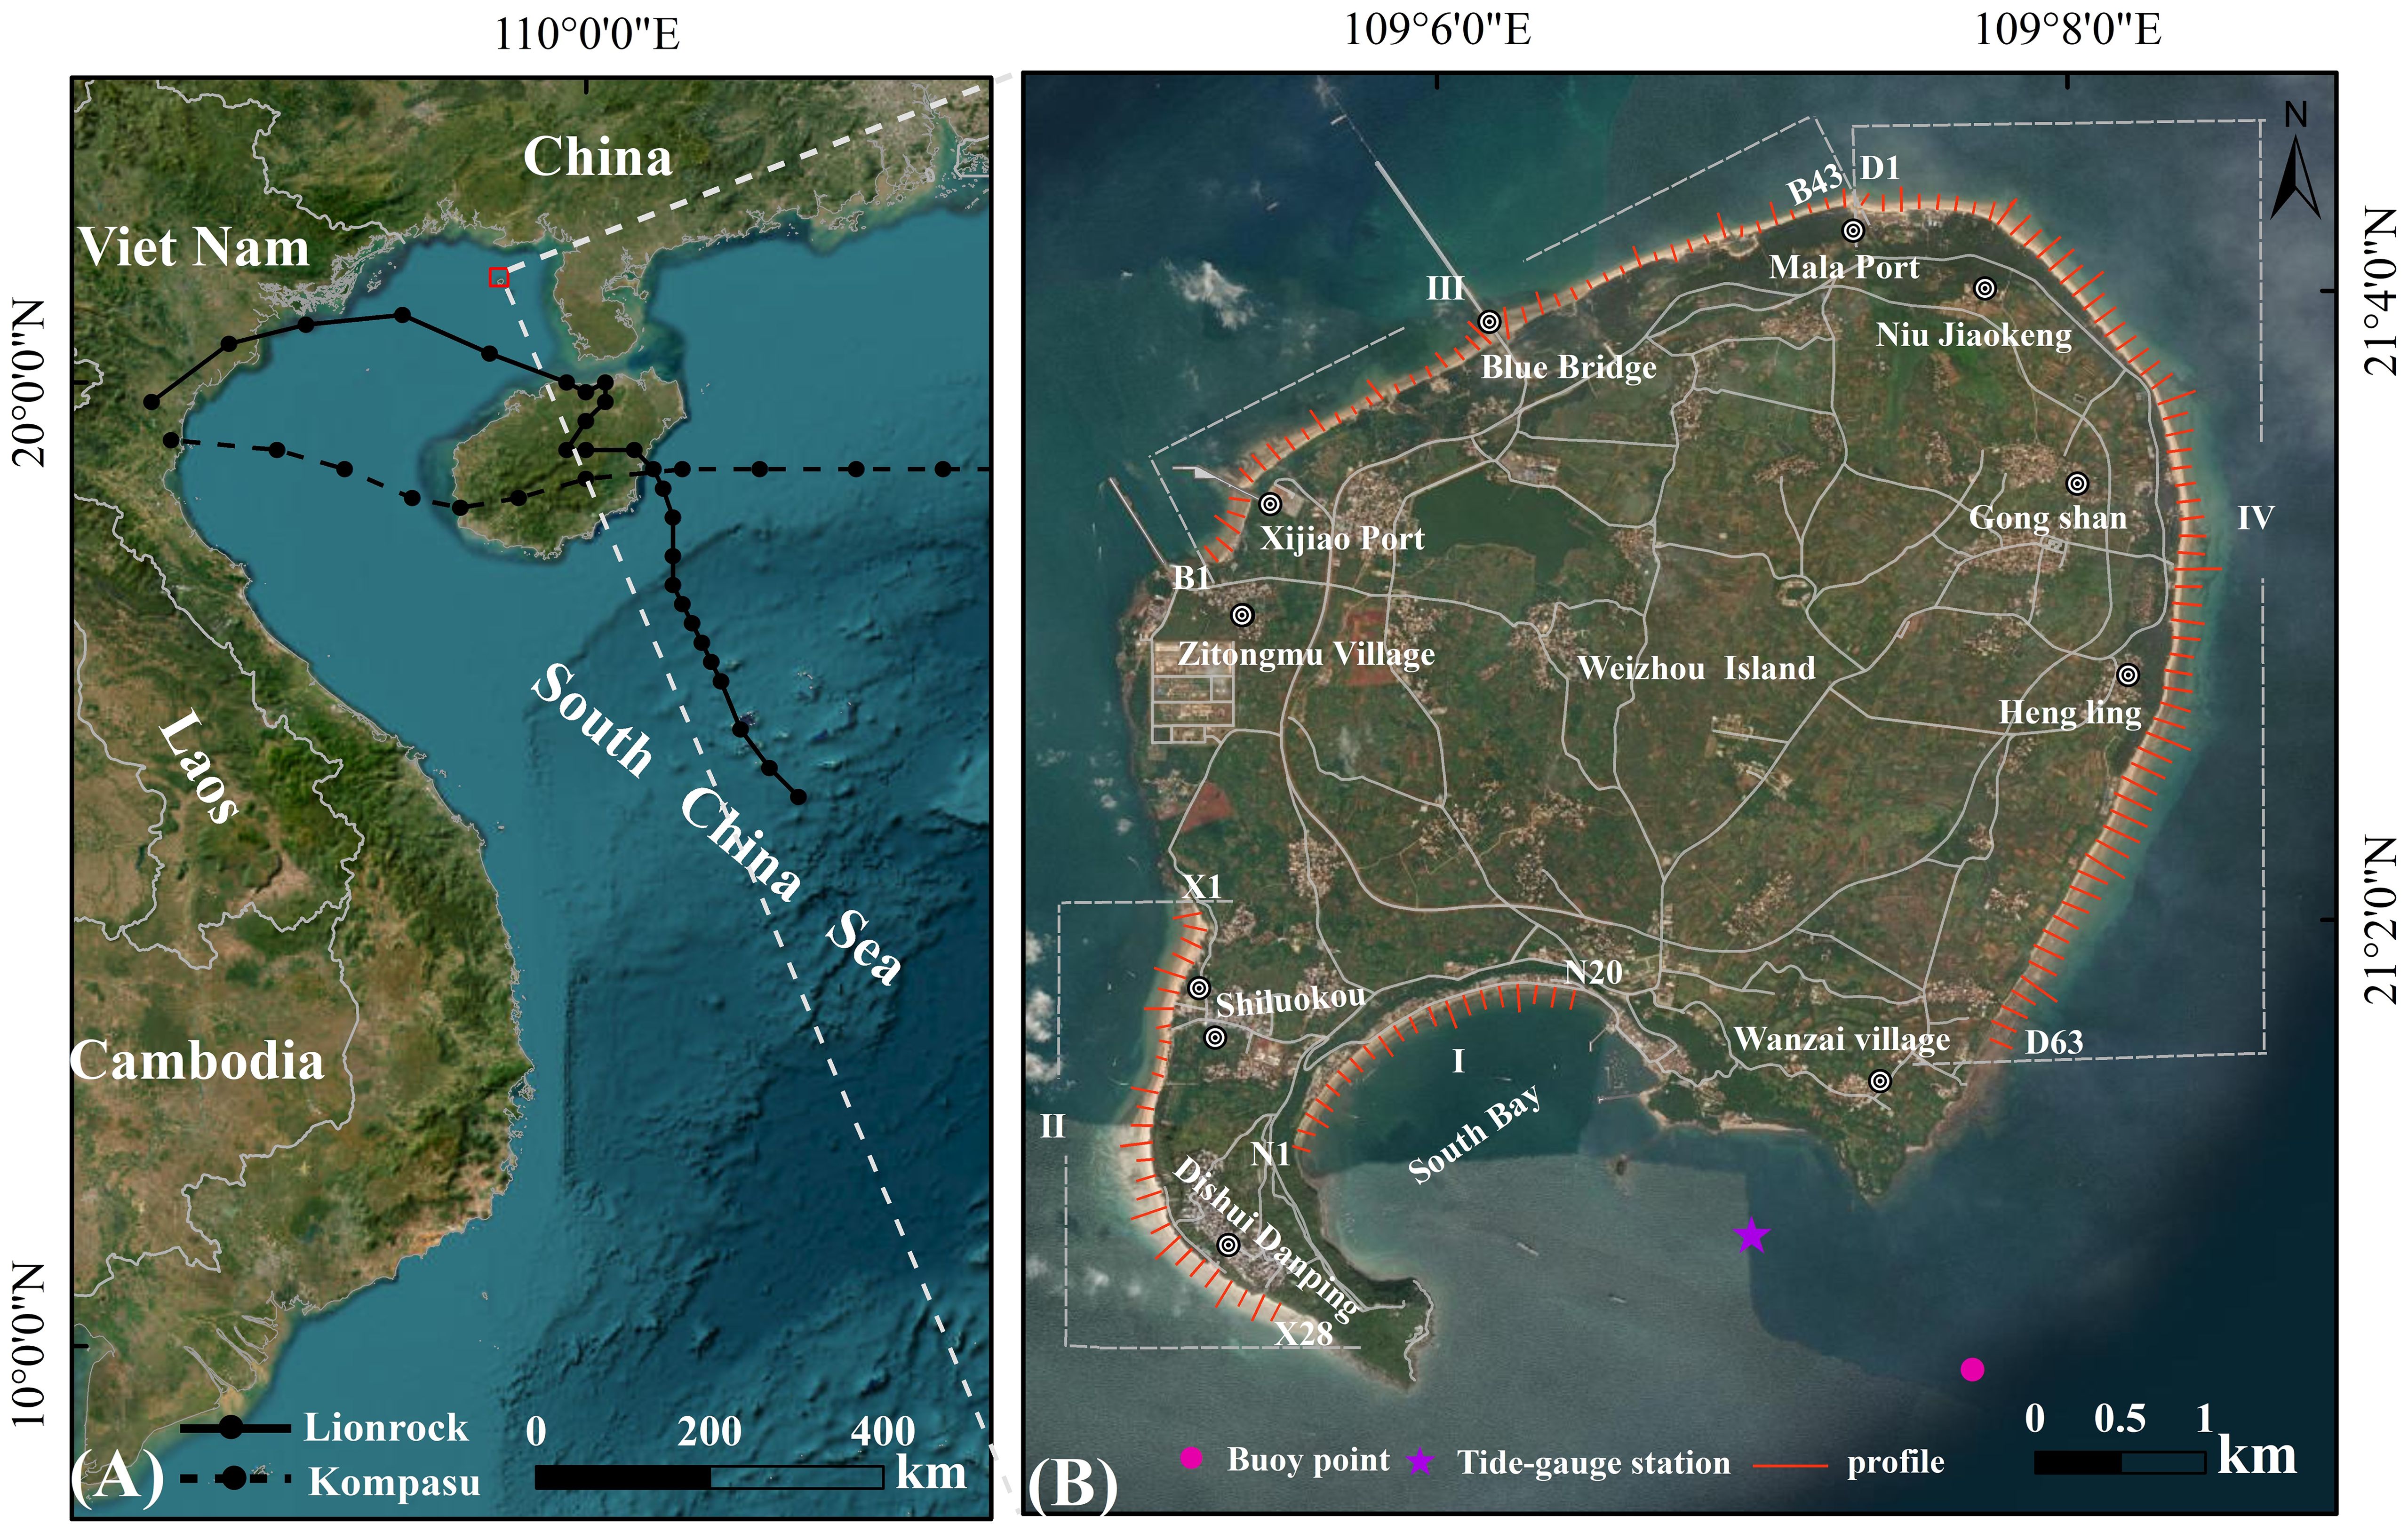
Figure 1. Gographical location of Weizhou Island with typhoon path (A) and the main information of the field data and the different zones (B).
Weizhou Island is impacted by the south subtropical monsoon climate. The strong wind directions are N and NNE, while the typical wind directions are NNE and ENE. In the study area, the strong wave direction is SSW, with a mean wave height of 0.8 m; the typical wave directions are NNE, SSW, NE, and ENE, with a multiyear mean wave height of 0.6 m (Huang et al., 2021b). The tide in the sea area is characterized as a regular diurnal tide, with an average annual tidal range of 2.33m (Yao, 2014). Weizhou Island is strongly affected by typhoons. Between 1956 and 2014, there were 83 typhoon-induced surge events with surges exceeding 50 cm (Li et al., 2015).
The coastline of Weizhou Island spans approximately 26 kilometers, and mainly includes three types of shorelines: sandy shoreline, bedrock shoreline and artificial shoreline. The sandy coastline is the longest, about 16.2 km, accounting for 62% of the total coastline, and is distributed around the island. Rocky coastline covers about 7.2 km, mainly distributed in the western, southern and southeastern regions of the island. Artificial coastline is about 2.6 km, which is primarily concentrated in South Bay. In addition, Weizhou Island is the northernmost island for coral reef development in the Beibu Gulf. These coral reefs are mainly distributed in shallow waters along the southwest, northwest, and northeast coasts, with width ranging from 0.86 to 2.56 km, on the widest being the northwest coast. Scattered coral reefs also distribute on the west coast of South Bay (He and Huang, 2019). The interaction between sandy beaches and coral reefs ultimately shapes the formation of a unique beach-coral reef geomorphic system.
The beaches of Weizhou Island are mainly divided into four main sections: South Bay beach (Zone I), Dishui Danping to Shiluokou beach (Zone II), Zitongmu to Mala Port beach (Zone III), and Mala port to Wanzai village beach (Zone IV). Zone I, located on the southern coast, is a typical headland bay beach. A coastal seawall has been constructed in the backshore area of the beach on the eastern side. Zone II is located on the west coast and has a relatively straight coastline. Zone III is located on the northwest coast, and also has a relatively straight coastline. However, the construction of artificial structures (dock, the Mala Port and Xijiao Port, the Blue Bridge, etc., Figure 1B) along the shore has divided the beach into several shorter sections in Zone III. Zone IV is located on the east coast with a relatively straight coastline.
2.2 Typhoons
Typhoon Lionrock, the 17th typhoon of 2021, was generated over the South China Sea at 08:00 on October 6, 2021. It moved northward and strengthened to a tropical storm by 05:00 on October 8. The typhoon landed in the coastal area of Tanmen Town, Qionghai City, Hainan Province, at 22:50 on October 8. After landing, the typhoon turned to the northwest and moved into the Beibu Gulf. Weizhou Island entered the gale-force wind radius at 16:00 on October 9, when the maximum wind force at the typhoon center reached level 8 (20 m/s) and the central pressure was 990 hPa. The typhoon then continued moving westward and made a second landfall on the northern coast of Vietnam at 16:20 on October 10. The study area was no longer within the gale-force wind radii at 14:00 on October 10.
Typhoon Kompasu, the 18th typhoon of 2021, formed over the ocean east of the Philippines on the afternoon of October 8, 2021, and made landfall on Fuga Island, Cagayan Province, the Philippines, at 20:10 on October 11. By October 13, 2021, Typhoon Kompasu had intensified to hurricane level, and the study area entered the gale-force wind radii at 10:00. At this time, the maximum wind force at the typhoon center reached level 12 (33 m/s), and the central pressure was 970 hPa. The typhoon then continued moving westward, making landfall in the coastal area of Qionghai City, Hainan Province, at approximately 15:40. After landfall, Typhoon Kompasu gradually weakened to a strong tropical storm, and the study area exited the gale-force wind radius at 17:00 on October 13.
3 Data source and methods
3.1 Hydrodynamic data
To analyze the influence of the storms on hydrodynamic changes in the study area, data on significant wave height (Hs), wave period (Ts) and wave direction were collected during the periods of two storms. These data were obtained from a wave buoy (21°0.57′N, 109°7.7′E) located approximately 1 km from Weizhou Island (Figure 1). Tide data were obtained at a fixed tide station at Weizhou Island (21°01′N, 109°07′E), and astronomical tide data were sourced from the China Maritime Service Network (https://www.cnss.com.cn/html/tide.html). All tidal level data were subsequently adjusted to the mean sea level. According to the method proposed by Boccotti (2000), a storm event is defined when the significant wave height is > 1.5 times the annual mean wave height (this study selected a strong wave direction with an annual mean wave height of 0.8 m) and the duration exceeds 12 h.
Variations in topography and wave energy can lead to uneven alongshore sediment transport across different shoreline unit, causing significant differences in beach erosion and accretion. While direct measurement of sediment transport along the coast under wave action is challenging, indirect methods are commonly used. In this study, the Coastal Engineering Research Center (CERC) formula, as included in the United States “Coastal Engineering Manual,” was used to calculate the alongshore sediment transport rate (U.S. Army Corps of Engineers, 1984). The specific calculation formula is as follows:
In Equation 1, Q represents the alongshore sediment transport rate in m3/s; (ECg)b denotes the breaking wave energy flux; K is an empirical coefficient with a value of 0.77; represents the angle between the tangent line of the shoreline and the wave crest line during wave breaking; and are the densities of the sediment and the seawater, respectively, with values of 2650 kg/m3 and 1025 kg/m3; ξ represents the natural beach porosity, assumed to be 0.4; and g is the gravitational acceleration.
3.2 Topographic data
To assess the topographic change of the beaches surrounding Weizhou Island before and after storms, a field topographic survey was carried out during September 8−13 and October 21−24, 2021. The survey profiles (Figure 1B) were perpendicular to the shoreline and arranged at 100-m intervals. A total of 154 profiles were measured, including 20 in Zone I (N1−N20 from west to east), 28 in Zone II (X1−X28 from north to south), 43 in Zone III (B1−B43 from west to east), and 63 in Zone IV (D1−D63 from north to south).
The beach topographic data was obtained using RTK GPS linked to the network of Continuously Operating References (CORS, with plane and vertical precisions of ± 8 mm and ±15 mm, respectively). Measurements were taken for the fixed profile position and elevation at low tide, starting from the coastal vegetation line or the bottom of coastal structures to the low tide waterline. All obtained data were corrected to the Yellow Sea Datum 1985 for comparative analysis.
The variation in beach profile slopes is an important indicator of the beach response to storms. In this study, the beach slope was defined according to Qi et al. (2010) as the tangent value of the foreshore slope, measured between the beach berm or bottom of the dune and the low tide zone. The intensity of the beach response to storms was evaluated by drawing the characteristic changes in typical profiles before and after storms and by calculating the mean profile change (MPC) (Qi et al., 2010).
In addition, this study presented the beach erosion and accretion status based on the total beach sand volume per unit meter width (UED) (Gong et al., 2017):
In Equations 2, 3, x is the horizontal coordinate and Z is the elevation.
3.3 Surficial sediment data
During the topographic survey of the beach profile in four sections of Weizhou Island (Zones I−IV), the beach surface sediments were sampled along the odd-numbered profiles synchronously. The sampling sites were set at the backshore, berm, and foreshore (upper, middle, and lower) of the beach profile. The sediment samples were processed according to standard laboratory procedures (Carver, 1971). Sediment grain-size analyses were carried out by SFY-D sonic vibration type automatic sieving grain size analyzer, after desalination and separation. The graphical method (Folk and Ward, 1957) was then used to calculate the grain size parameters of the surficial sediment including mean grain size (Mz), sorting coefficient (σ), skewness (Sk), and kurtosis (Kg).
4 Results
4.1 Nearshore hydrodynamics before and after the storms
The passage of two typhoons, Lionrock and Kompasu, through the Beibu Gulf caused a rapid change in the nearshore hydrodynamic conditions near Weizhou Island (Figures 2, 3). Under the influence of Typhoon Lionrock, a notable increase in wave height was observed at 2:00 a.m. on Oct. 8, 2021. By 6:00 p.m. on October 10th, the wave height had decreased to below 1.2 m. This period was defined as the first storm event period. Following a short period of calm conditions, the wave height in the study area significantly increased at 3:00 p.m. on Oct. 11, 2021, as Typhoon Kompasu approached Weizhou Island. After the typhoon’s landfall in Vietnam, waves in the study area stabilized around 1:00 a.m. on Oct. 15, marking the second storm event period.
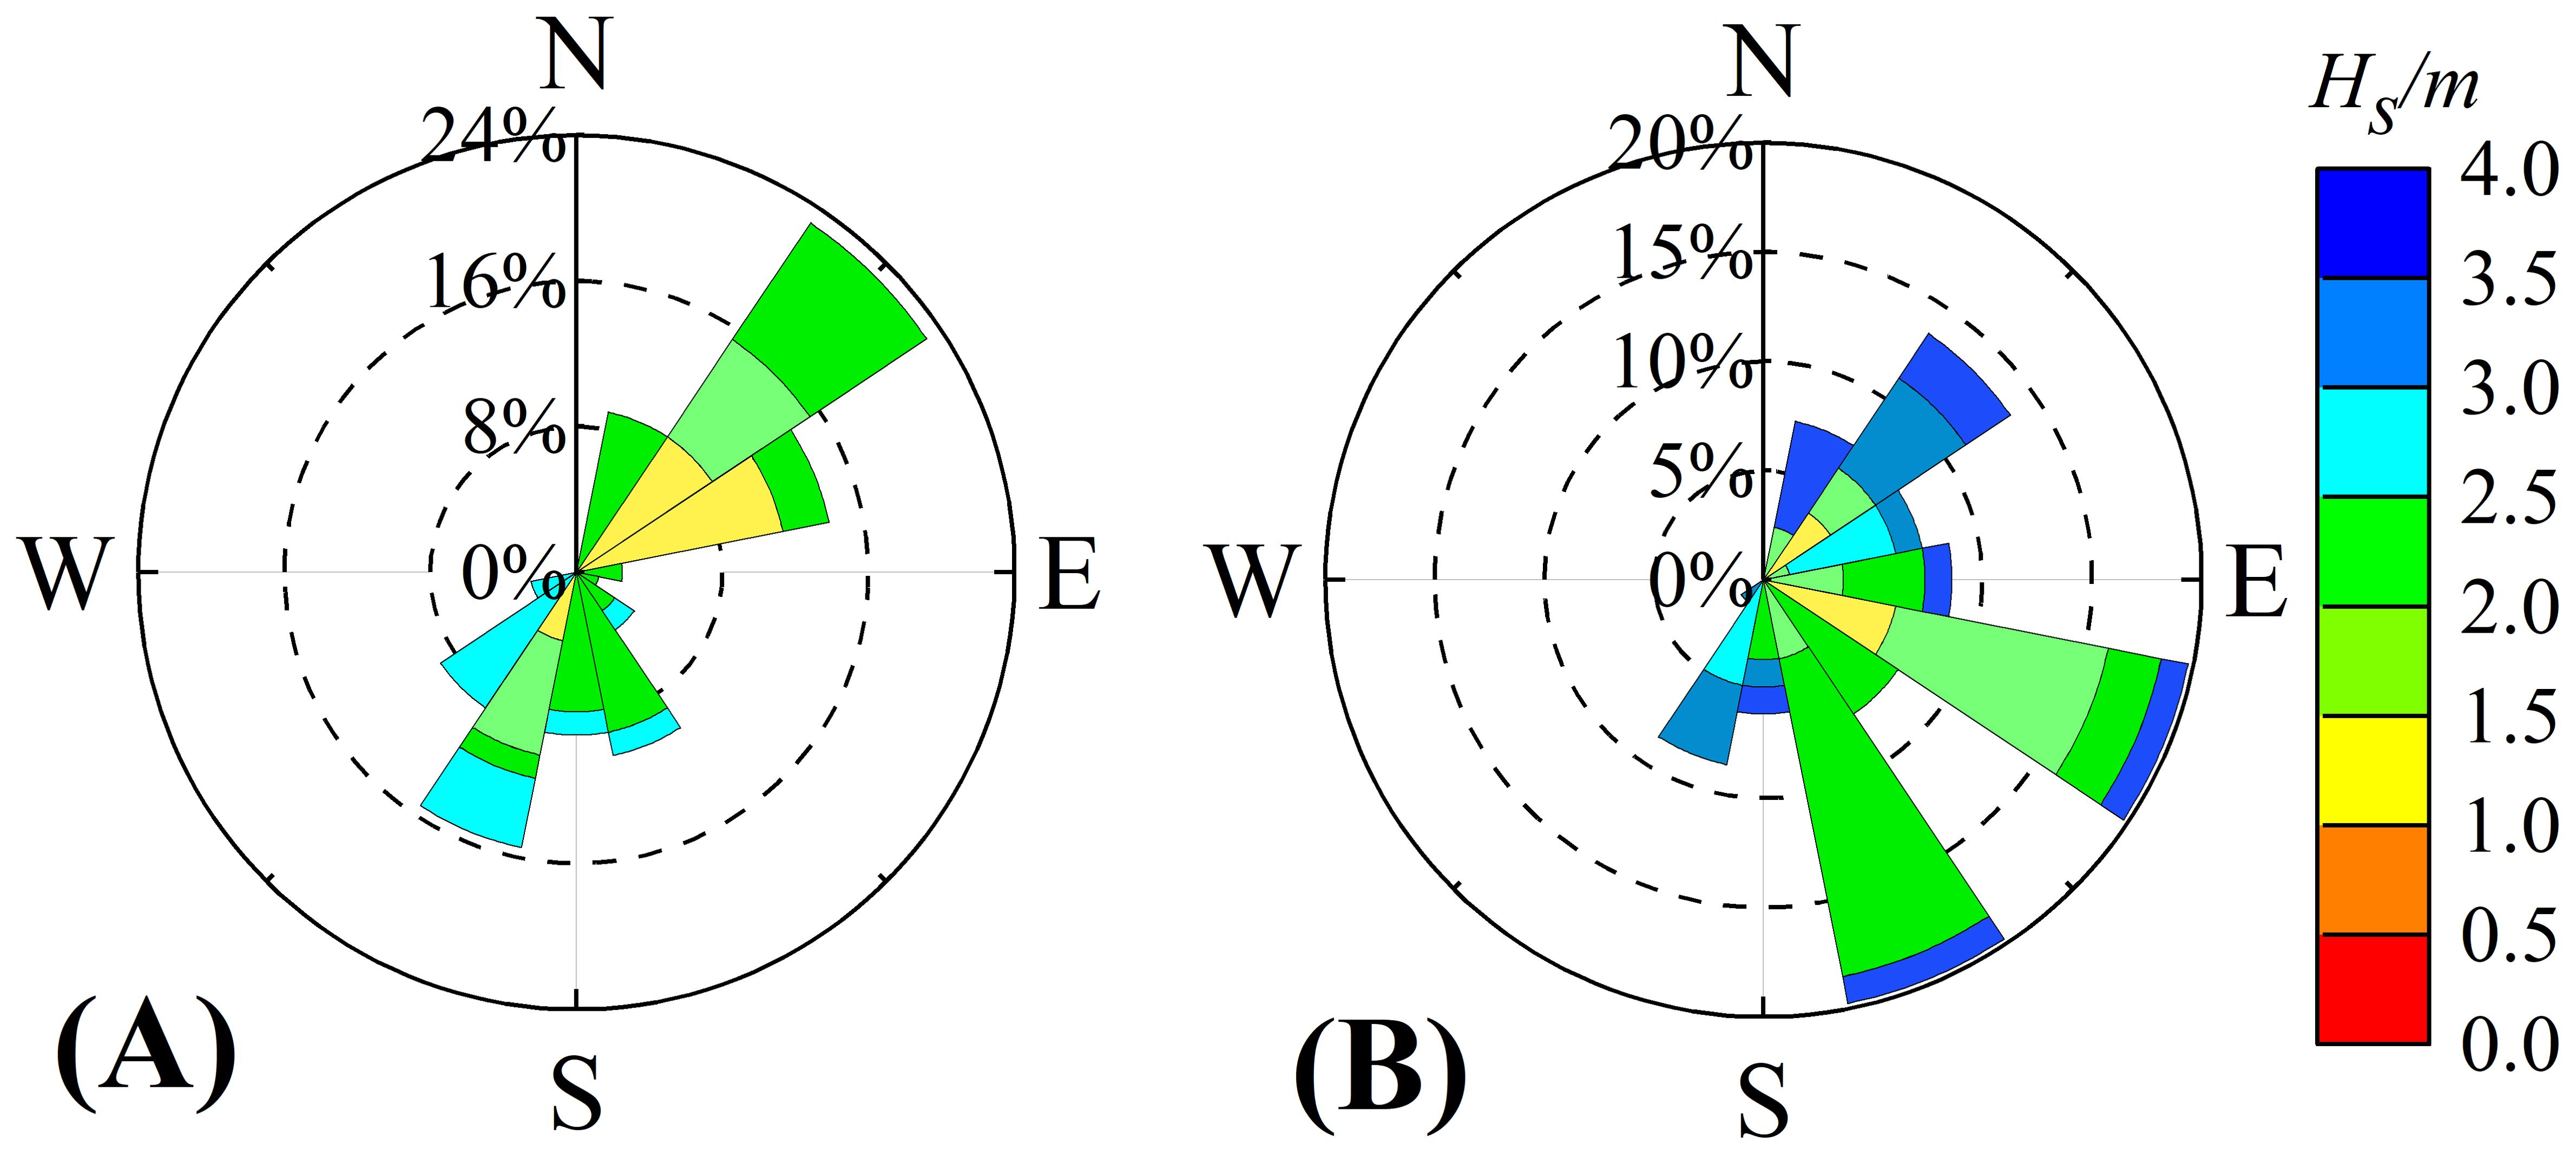
Figure 2. Wave conditions in the sea area around Weizhou Island during two storm events: Typhoon Lionrock (A) and Typhoon Kompasu (B).
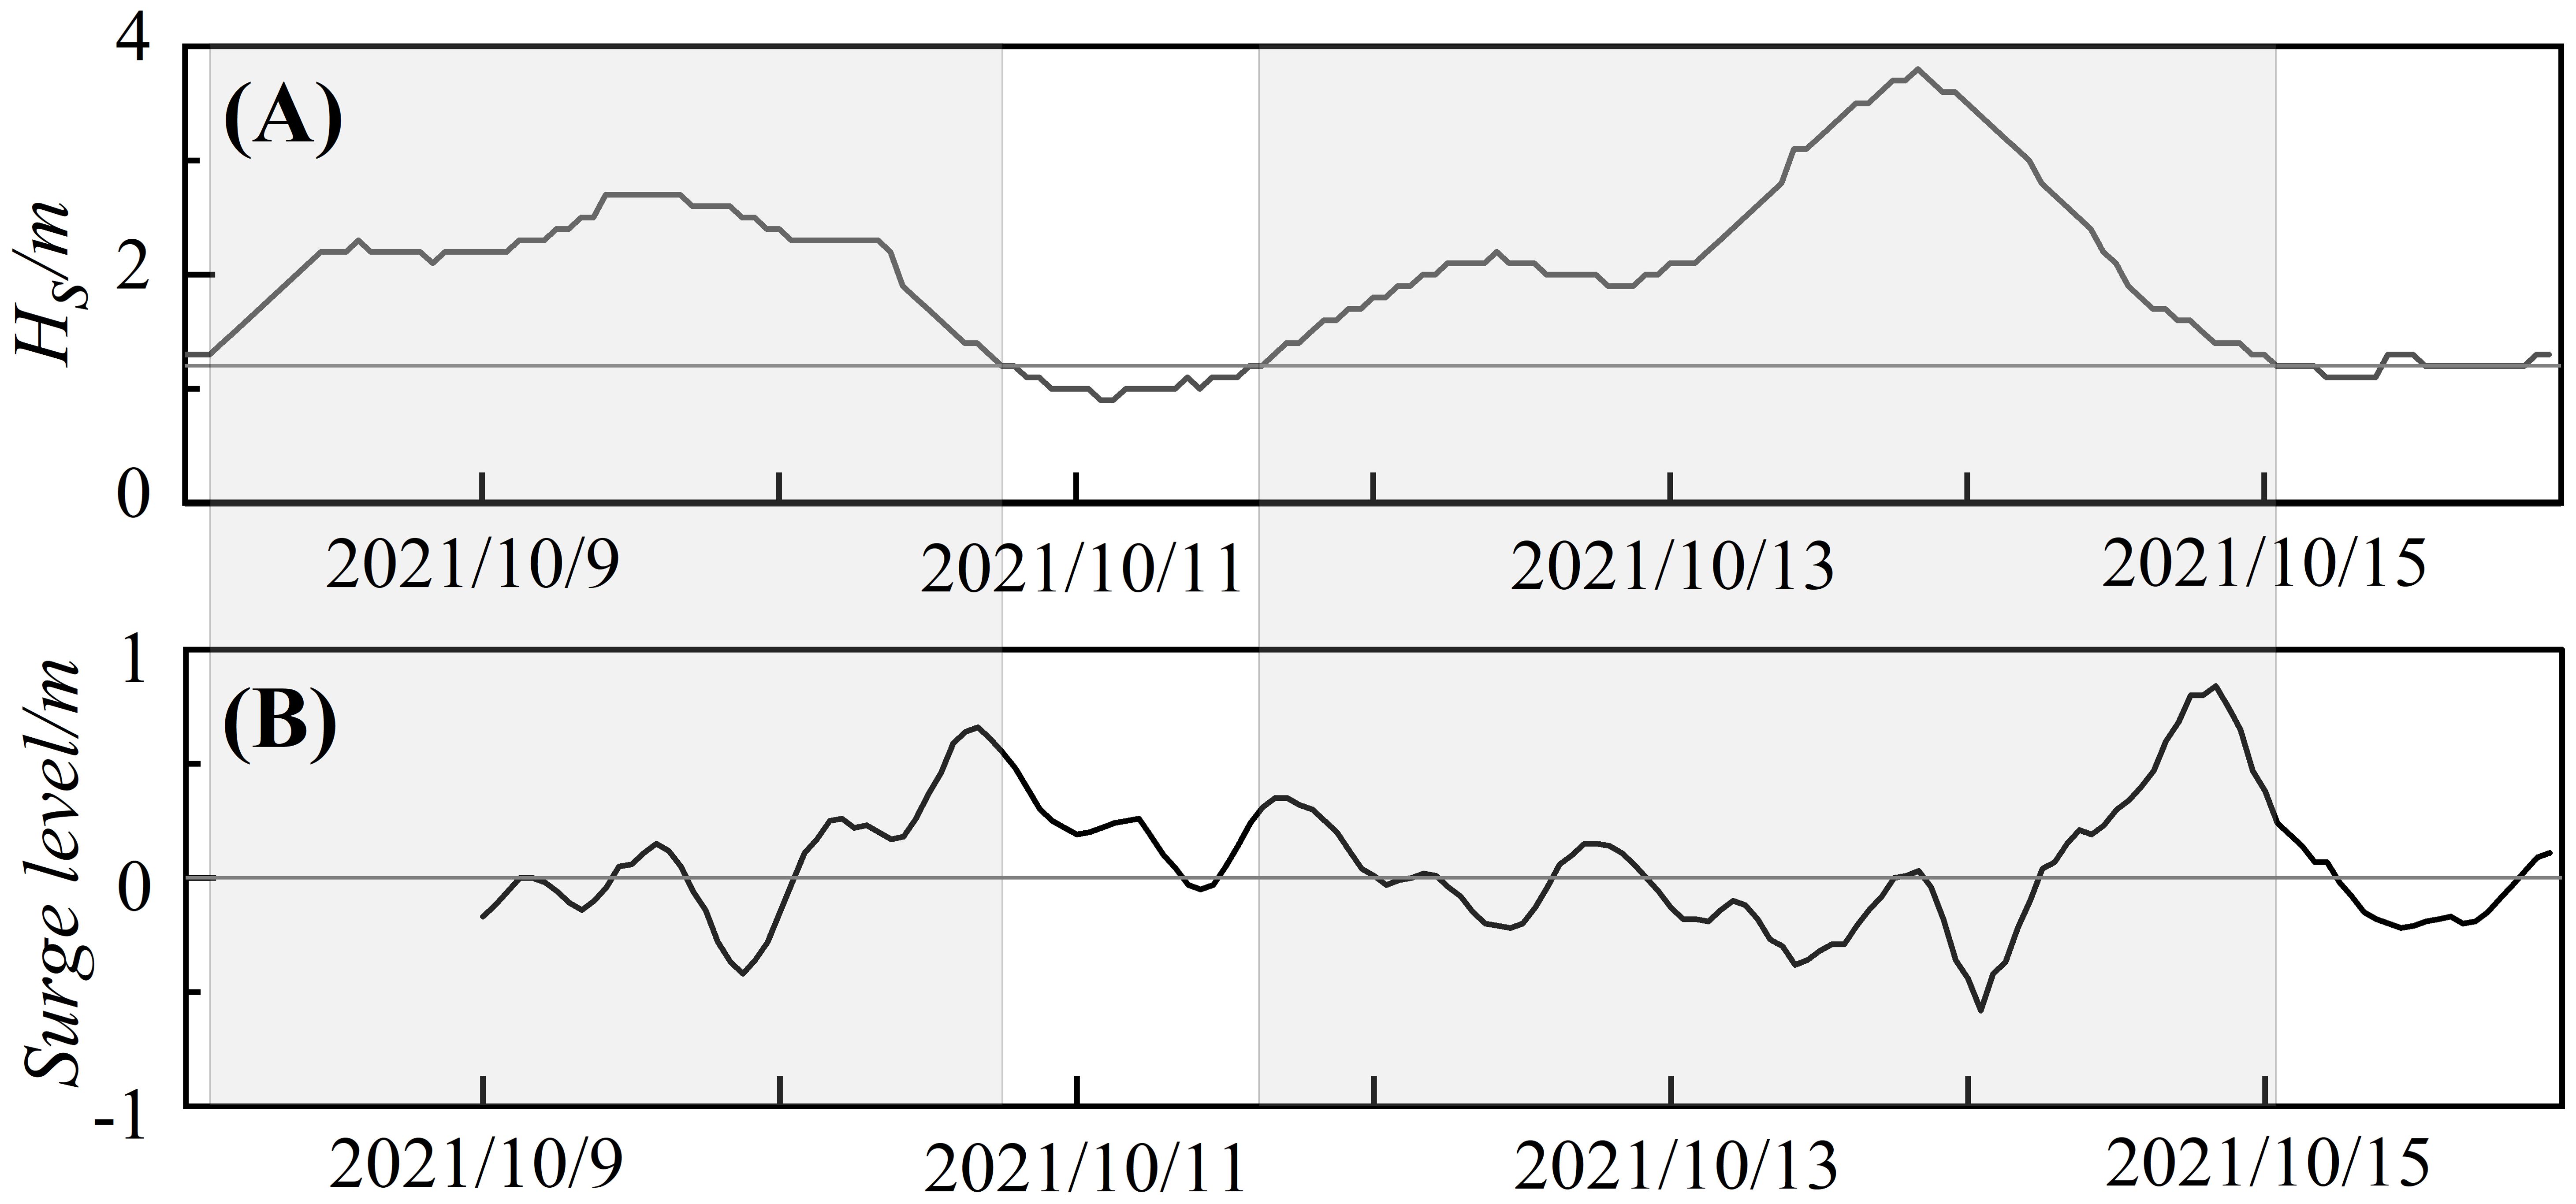
Figure 3. Hydrodynamic changes in the sea area around the Weizhou Island during two storms: significant wave height (A) and the storm surge level (B). The gray solid line in (A) is Hs = 1.2 m, while the grey shadow areas show the storm influence duration.
The predominant wave directions in the study area were SSW and NE. During typhoon Lionrock, strong waves with significant wave heights greater than 2.5 m were mainly oriented toward the SSW direction (Figure 2A). In contrast, during Kompasu, the wave direction turned to NE, SEE and SSE, and the wave direction with significant wave height > 2.5 m was mainly from NE Kompasu (Figure 2B).
The significant wave height in the study area was generally< 0.9 m before the storms and was significantly enhanced during the periods of two storms (Figure 3A). The maximum significant wave height was 2.7 m during Typhoon Lionrock and 3.8 m during Typhoon Kompasu. For the storm surge on Weizhou Island between Oct. 9 and Oct.15, 2021 (Figure 3B), the variation was consistent with the regularity that the water level first decreases and then increases under the influence of storms in the Guangxi coastal area (Chen et al., 2017). The maximum storm surges during Typhoons Lionrock and Kompasu reached 0.66 m and 0.84 m, respectively.
4.2 Beach morphological variations
4.2.1 The beach in Zone I
Before and after the storm events, the total volume change of the beach is 290 m3, with the maximum erosion depth of 0.92 m located at profile N3 and the maximum accretion thickness of 0.53m located at profile N4, indicating a relatively stable state. Longitudinally, the degree of erosion and silting gradually decreases from west to east between pre-storm and post-storm. Laterally, the beach exhibited a pattern of erosion in the upper part and deposition in the lower part (Figure 4). Notably, an erosion trough, approximately parallel to the shoreline, was observed in the middle and lower part of the beach at profiles N12−N17, likely related to the existence of offshore breakwater in this area.
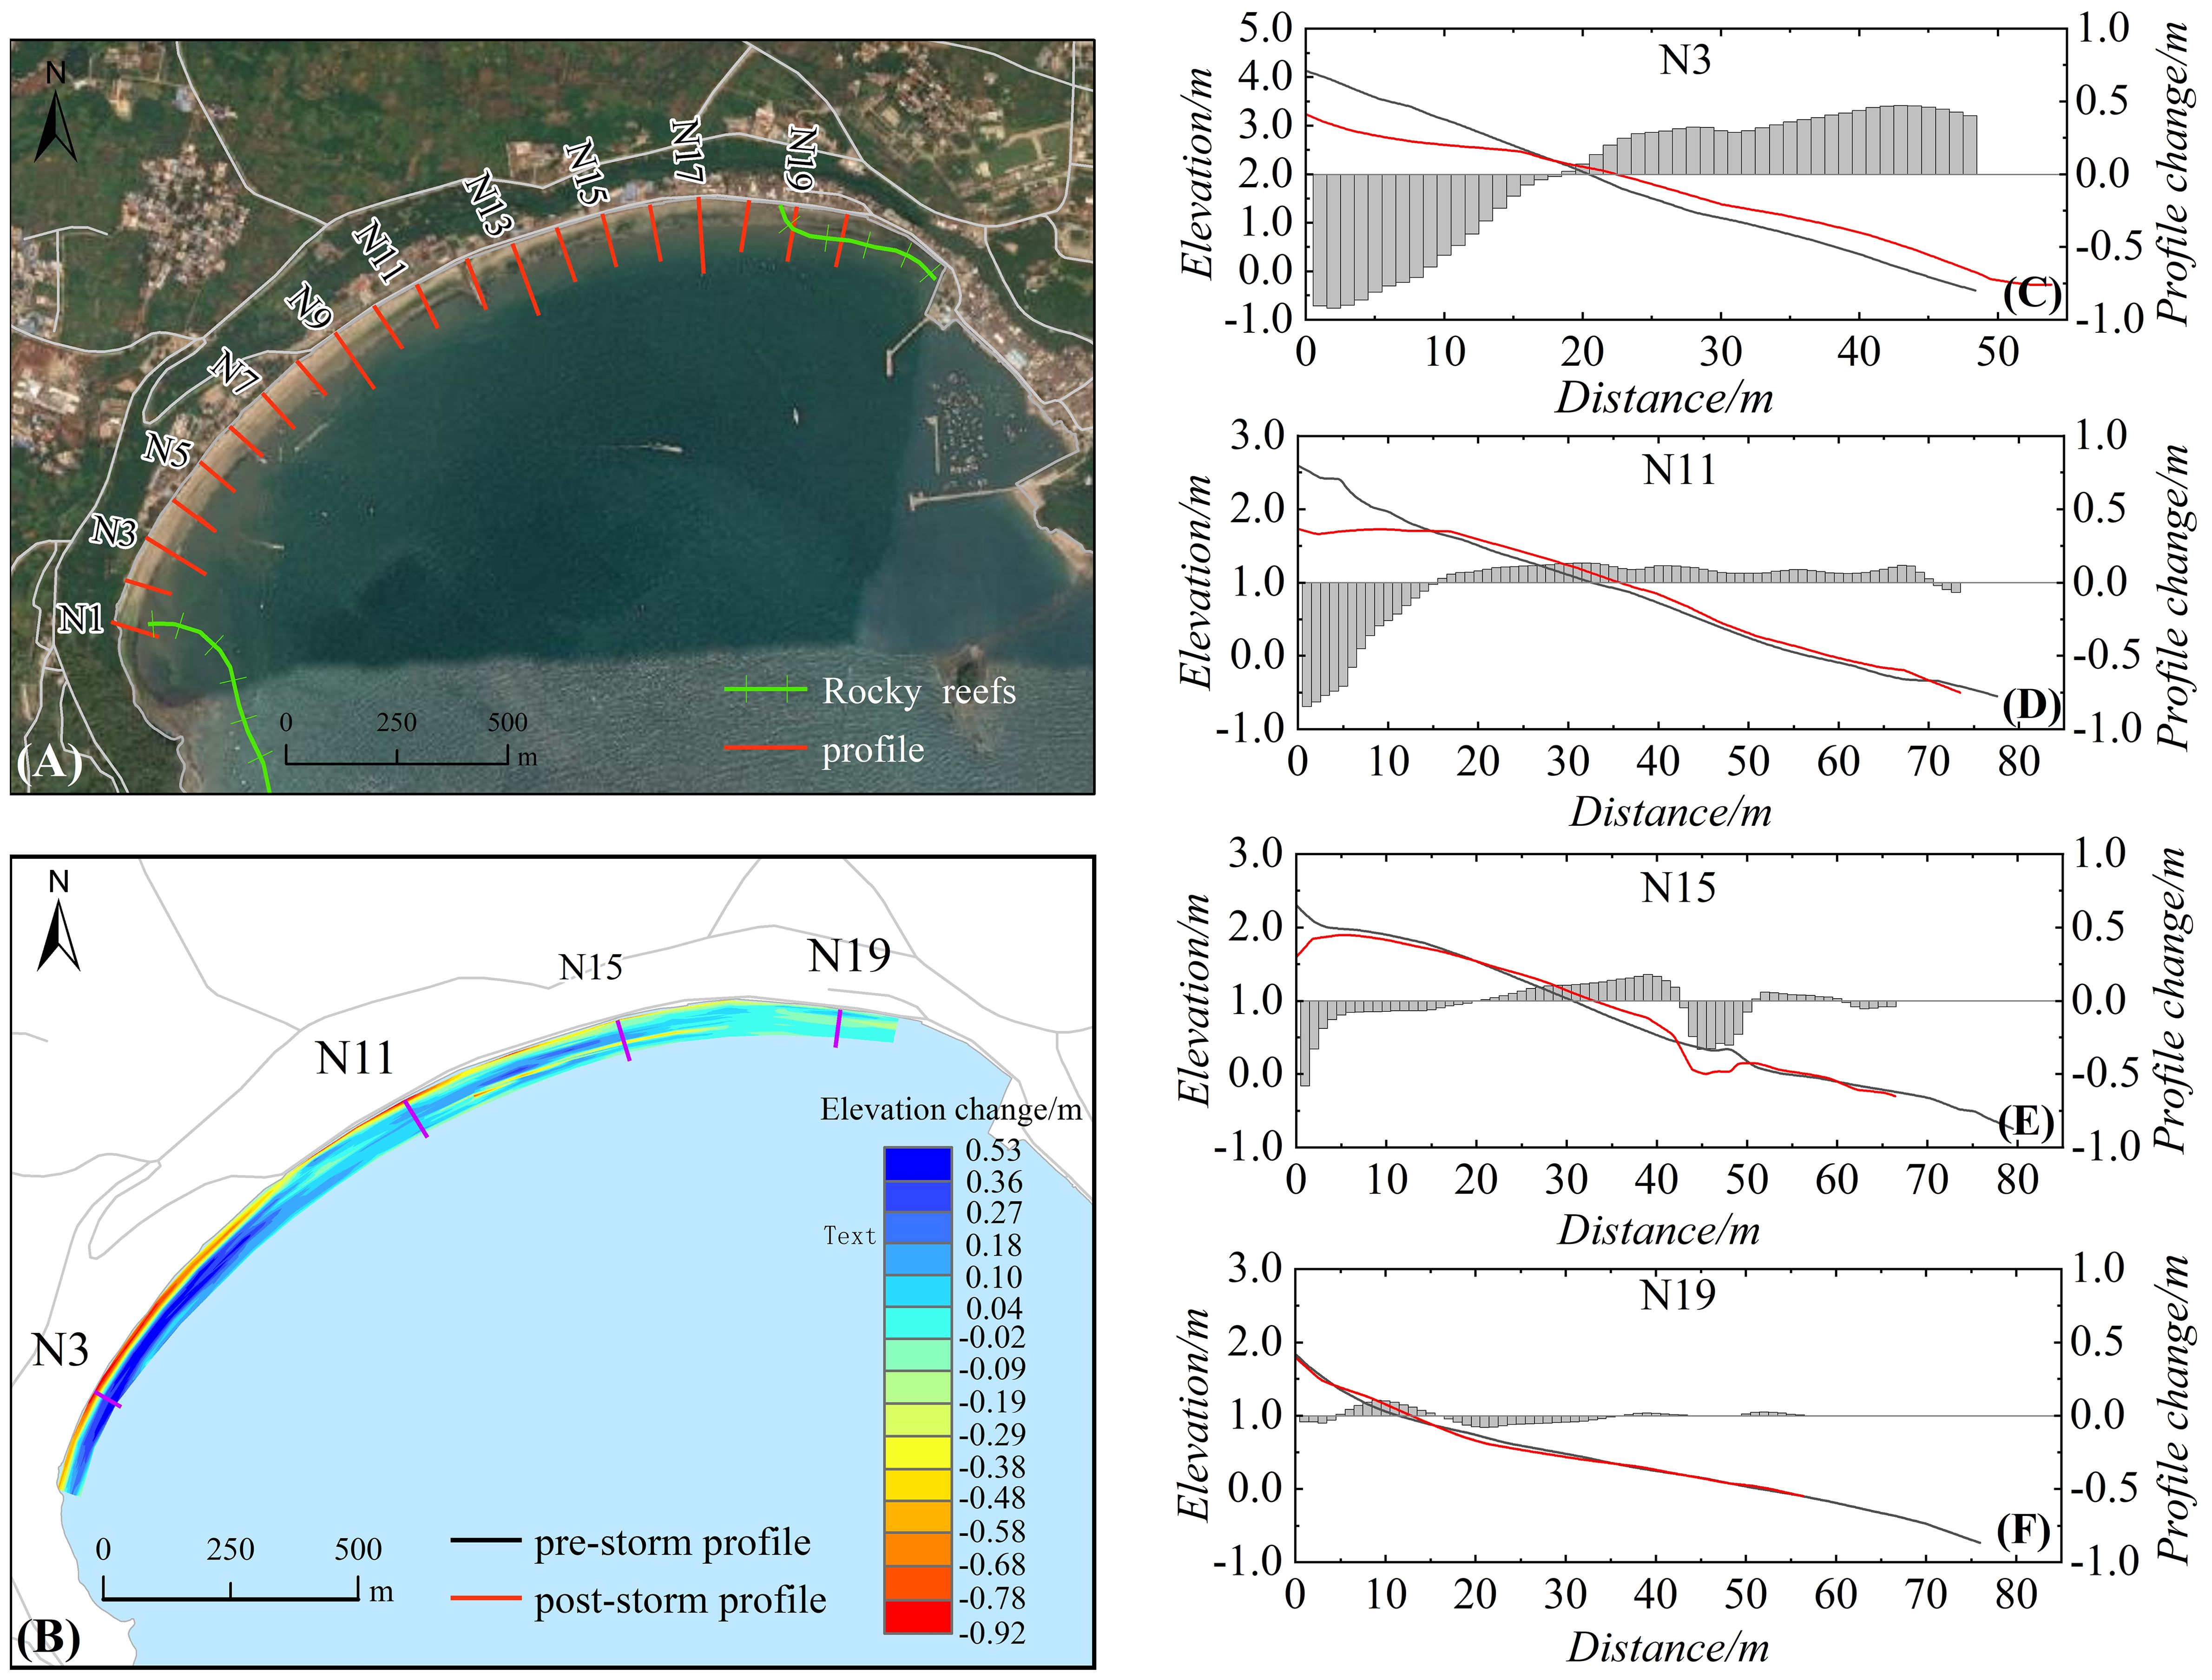
Figure 4. Changes in the geomorphology and profile morphology of the beach in Zone I. Remote sensing image (A), Elevation change (B), Profile N3 (C), Profile N11 (D), Profile N15 (E), Profile N19 (F).
Before and after the storms, the beach profile primarily exhibited an oblique shape, with a narrow width. The mean slope of the beach profile changes from 0.053(with a slope range of 0.027−0.093) to 0.041(with a slope range of 0.033−0.065), showing a flattening trend. The UED of the beach profiles is -4.04−5.70 m3/m, with the largest single-width erosion volume occurring at profile N12 and the largest single-width deposition volume at profile N6. The MPC ranges between 0.04m and 0.41 m, revealing a significant difference in the response intensity to typhoons between the eastern and western regions. Specifically, the MPC of profiles N1−N11 in the western region ranged from -3.38 to 5.70m, while that of profiles N12−N20 in the eastern region is -4.04−0.52m.
4.2.2 The beach in Zone II
Zone II is on the southwest coast of Weizhou Island, characterized by a protruding coastline. The amplitude of beach erosion and siltation in Zone II is between -1.27 and 1.31m, before and after the storm events, t indicating strong topographic change. The total beach volume change is -18360 m3, which is mainly caused by erosion. In the longitudinal direction, the erosion and accretion hotspots appear alternately on the beach, with a notable erosion trench parallel to the shore in the mid tide zone between profile X2 and X6. In the lateral direction, the central and southern part of the beach in Zone II are generally in a pattern of upward erosion and downward siltation, whereas the northern part showed the opposite trend, with an upward siltation and downward erosion. (Figure 5).
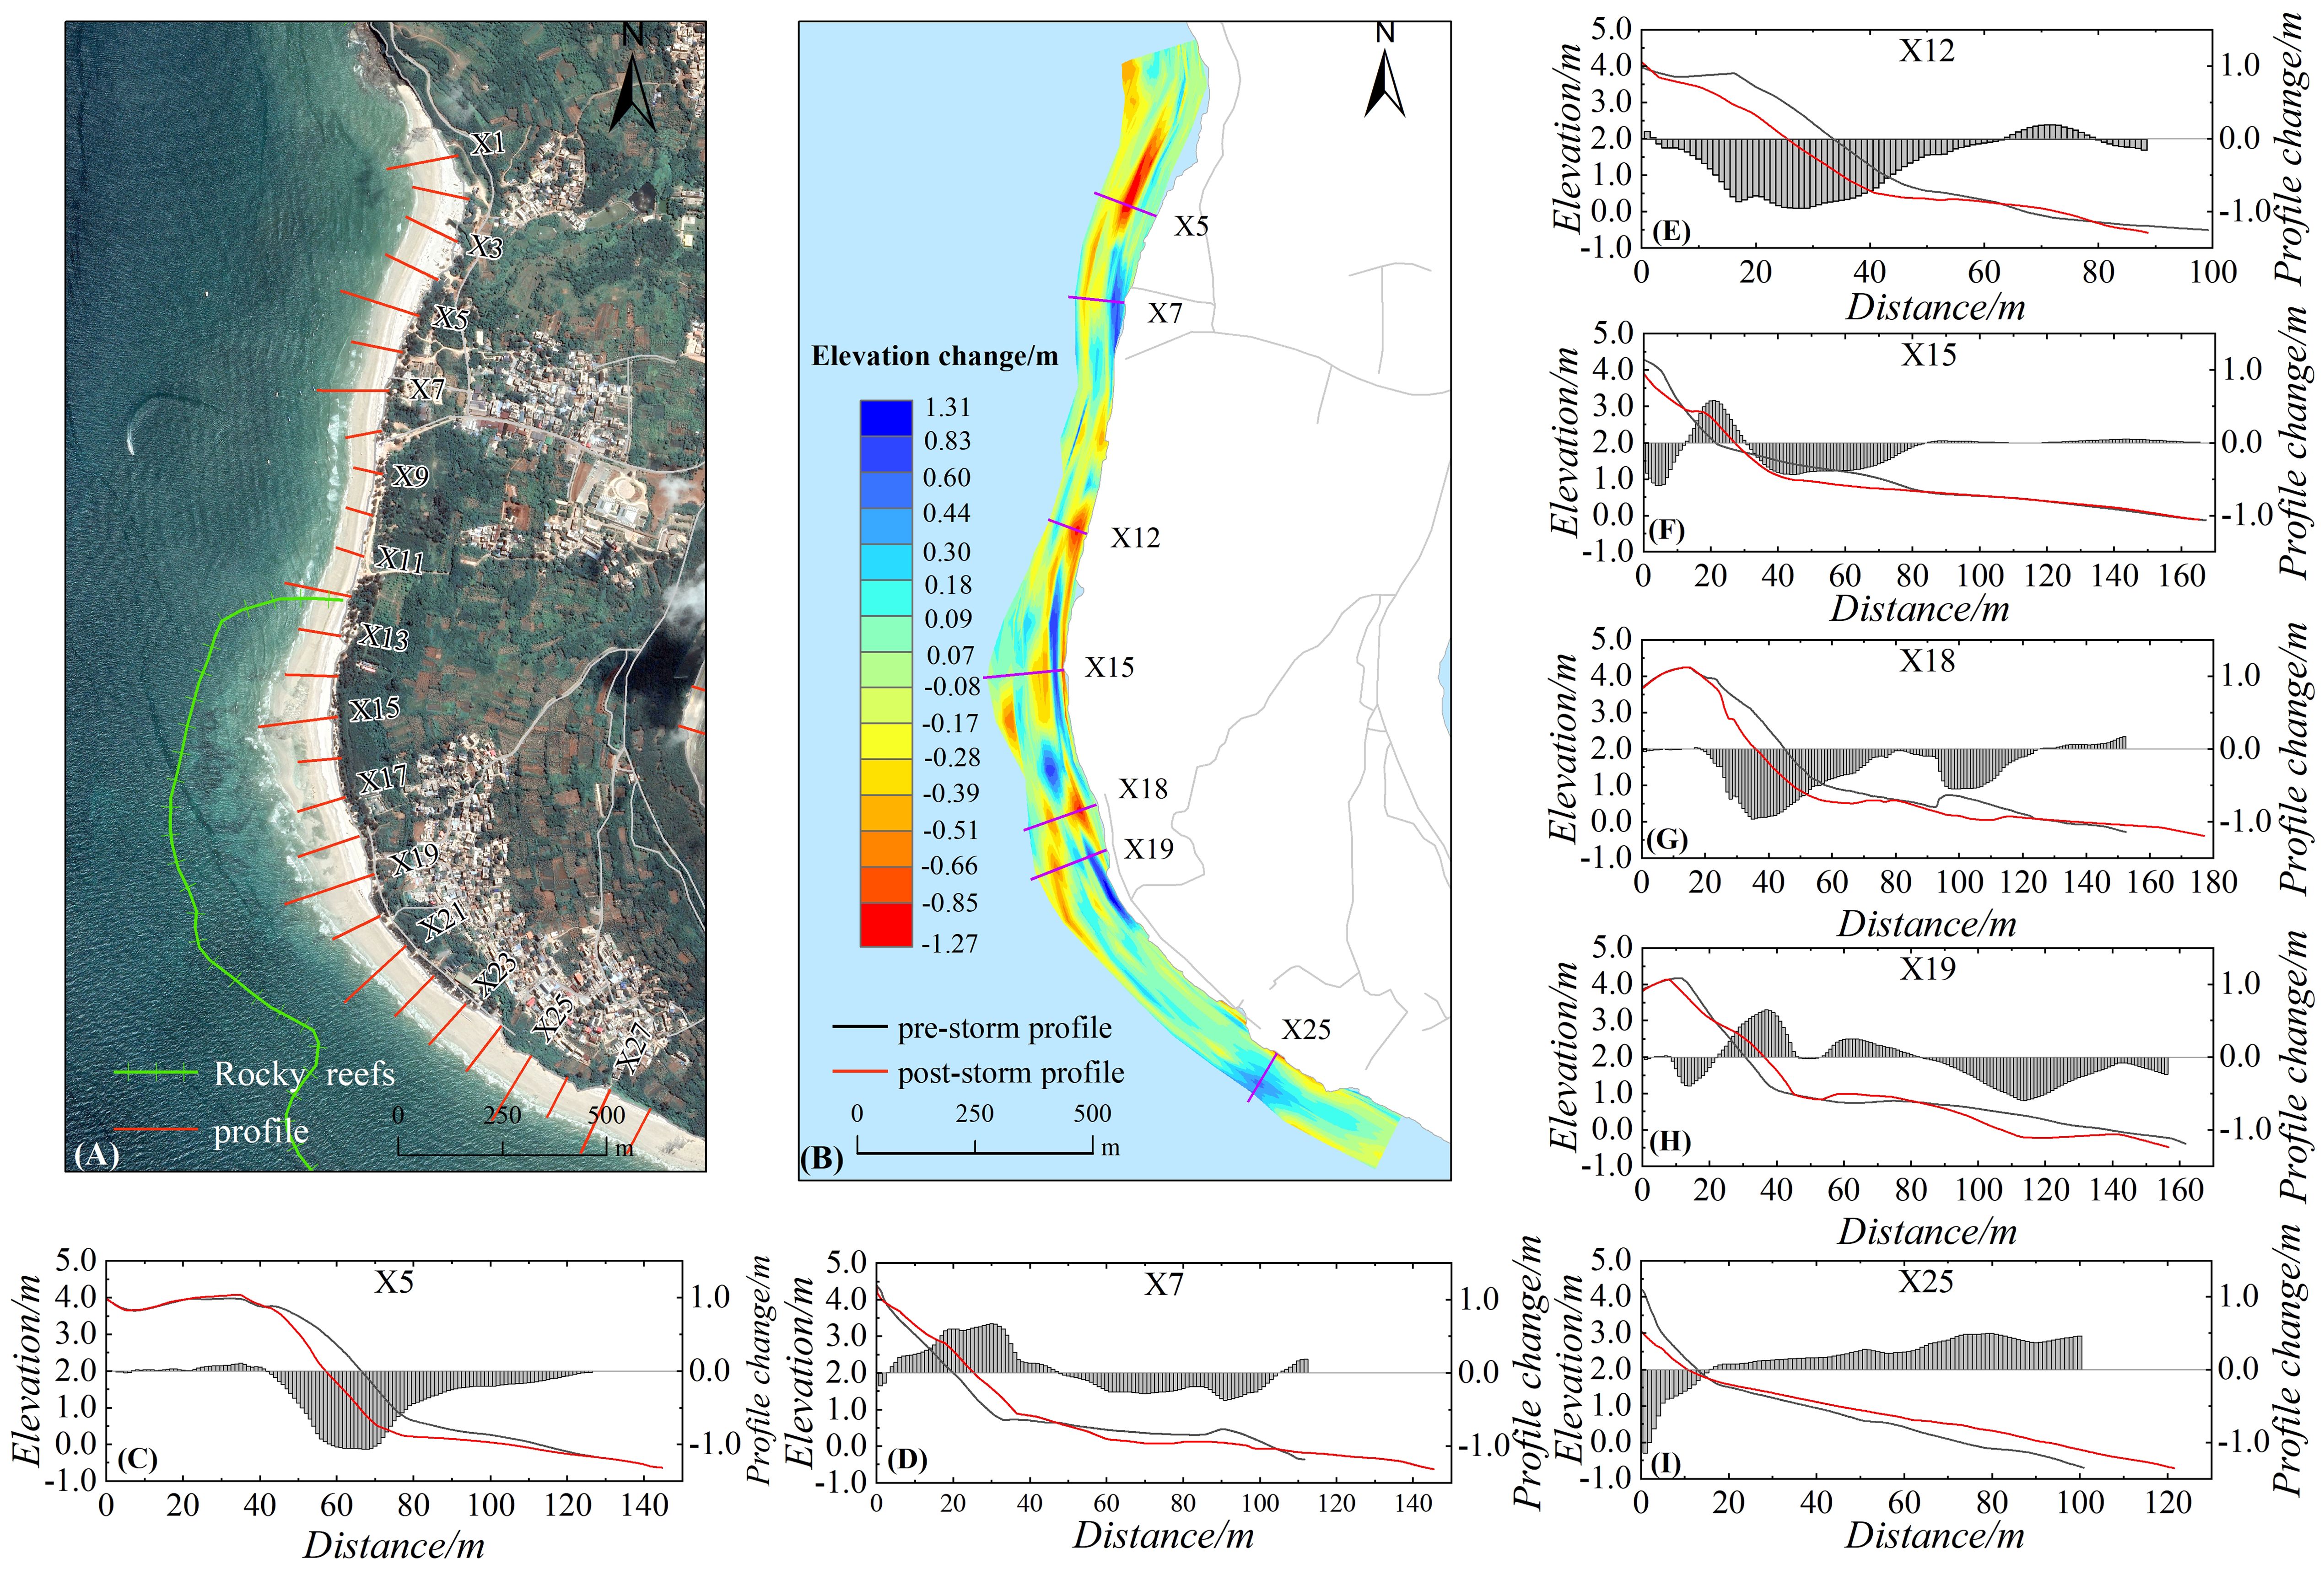
Figure 5. Changes in the geomorphology and profile morphology of the beach in Zone II. Remote sensing image (A), Elevation change (B), Profile X5 (C), Profile X7 (D), Profile X12 (E), Profile X15 (F), Profile X18 (G), Profile X19 (H), Profile X25 (I).
The typical cross-sectional shape of the beach in Zone II is mainly characterized by the presence of beach berms, with steep beach face in the upper part of foreshore area and relatively flat surfaces in the middle and lower parts. After the storm event, the average slope of the profiles changes from 0.076 (with a slope range of 0.038−0.144) to 0.070 (with a slope range of 0.031−0.091), indicating a general flattening of the beach slope and the disappearance of some original intertidal bars. The UED of the beach profiles in Zone II is between -40.72 m3/m and 17.28 m3/m, with the largest erosion volume per unit width observed at profile X18, and the largest deposition volume per unit width at profile X25. Overall, the beach profiles are dominated by erosion, with only a few profiles showing a state of accretion. The MPC is between 0.06 and 0.38m. The central and northern profiles are mostly between 0.17 and 0.38m, indicating relatively close and strong response to storms. In contrast, the southern profiles are between 0.06 and 0.15m, except the profile X25, indicating weaker response to storms.
4.2.3 The beach in Zone III
Before and after the occurrence of the storm events, the beach in Zone III exhibited a significant topographic change, with erosion and deposition ranging from -2.13m to 0.94m. The total volume change of the beach was -21 239 m3, showing strong erosion. Longitudinally, the main body of the beaches showed a trend of alternating erosion and deposition, with relatively less erosion and deposition in the southwestern beaches. Laterally, the beach profile manifested an overall pattern of upward erosion and downward siltation (Figure 6).
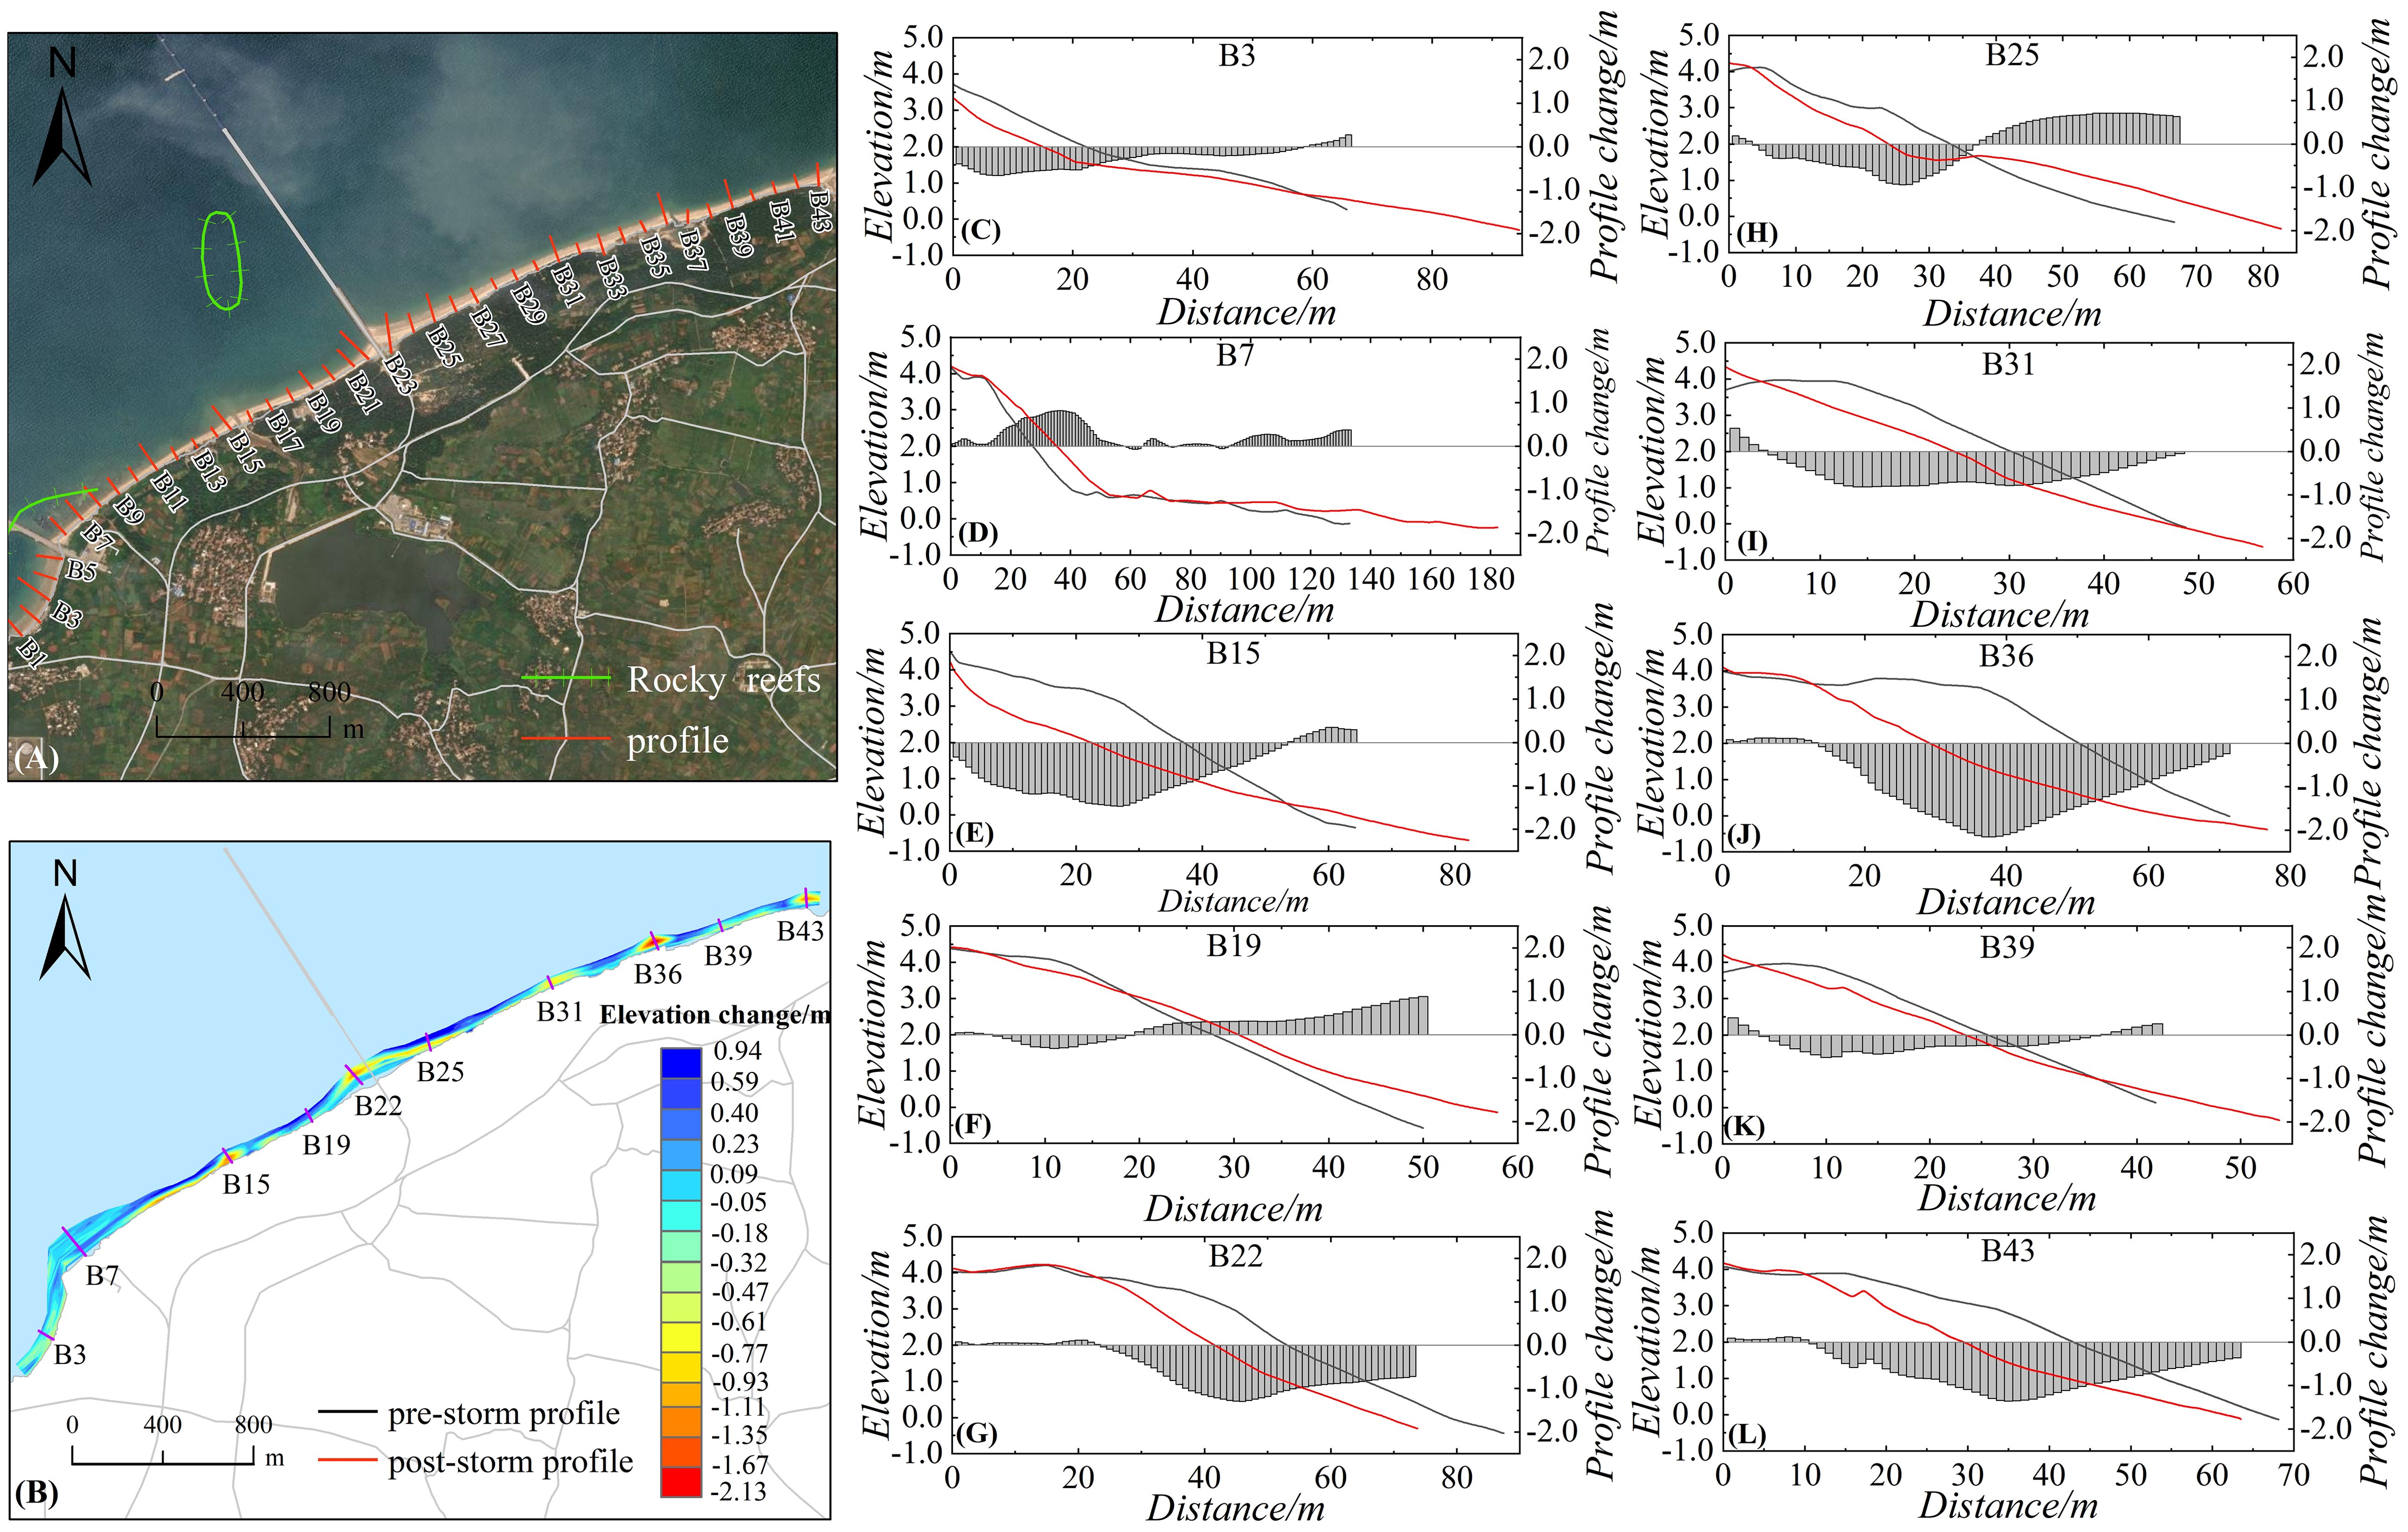
Figure 6. Changes in the geomorphology and profile morphology of the beach in Zone III. Remote sensing image (A), Elevation change (B), Profile B3 (C), Profile B7 (D), Profile B15 (E), Profile B19 (F), Profile B22 (G), Profile B25 (H), Profile B31 (I), Profile B36 (J), Profile B39 (K), Profile B43 (L).
Before the storms, the typical profile of the beach in Zone III was mainly berm shape. After the storms, the profile exhibited a notable increase in oblique, and the beach slope became gentle, with the average slope changing from 0.091 (with a range of 0.052−0.119) to 0.068 (with a range of 0.038−0.088). The UED of the beach profiles ranged between -69.99 m3/m and 31.82 m3/m. The largest erosion volume per unit width is observed at profile B36, while the largest deposition volume per unit width at profile B7. There are significant differences in the changes of beach erosion and deposition across different sections of the coastline. The UED near the port and dock is -69.99 − -41.13 m3/m, indicating very serious beach erosion. However, the UED between the port and dock is -24.33 − 31.82 m3/m, indicating weakened erosion or deposition. The MPC of the beach is 0.06 −1.02 m, and those of the structures and nearby areas is 0.25 − 1.02m. The response degree of the beach to the storm events is strong, and the rules of each shore section are consistent with their characteristics of erosion and deposition.
4.2.4 The beach in Zone IV
A significant variation in the topographic changes of the beach is observed in Zone IV before and after the storm events. The amplitude of erosion and deposition of the beach is between -0.97m and 1.15m, and the total volume variation of the beach is 18444 m3, indicating relative siltation of the beaches. Longitudinally, the variation degree of beach erosion and deposition is more pronounced in the northern and central section than that in the southern section. Additionally, a wider erosion trench was presented in the mid-tide zone between section D9 and D43. Laterally, the beach profile shows an overall pattern of upward erosion and downward siltation (Figure 7).
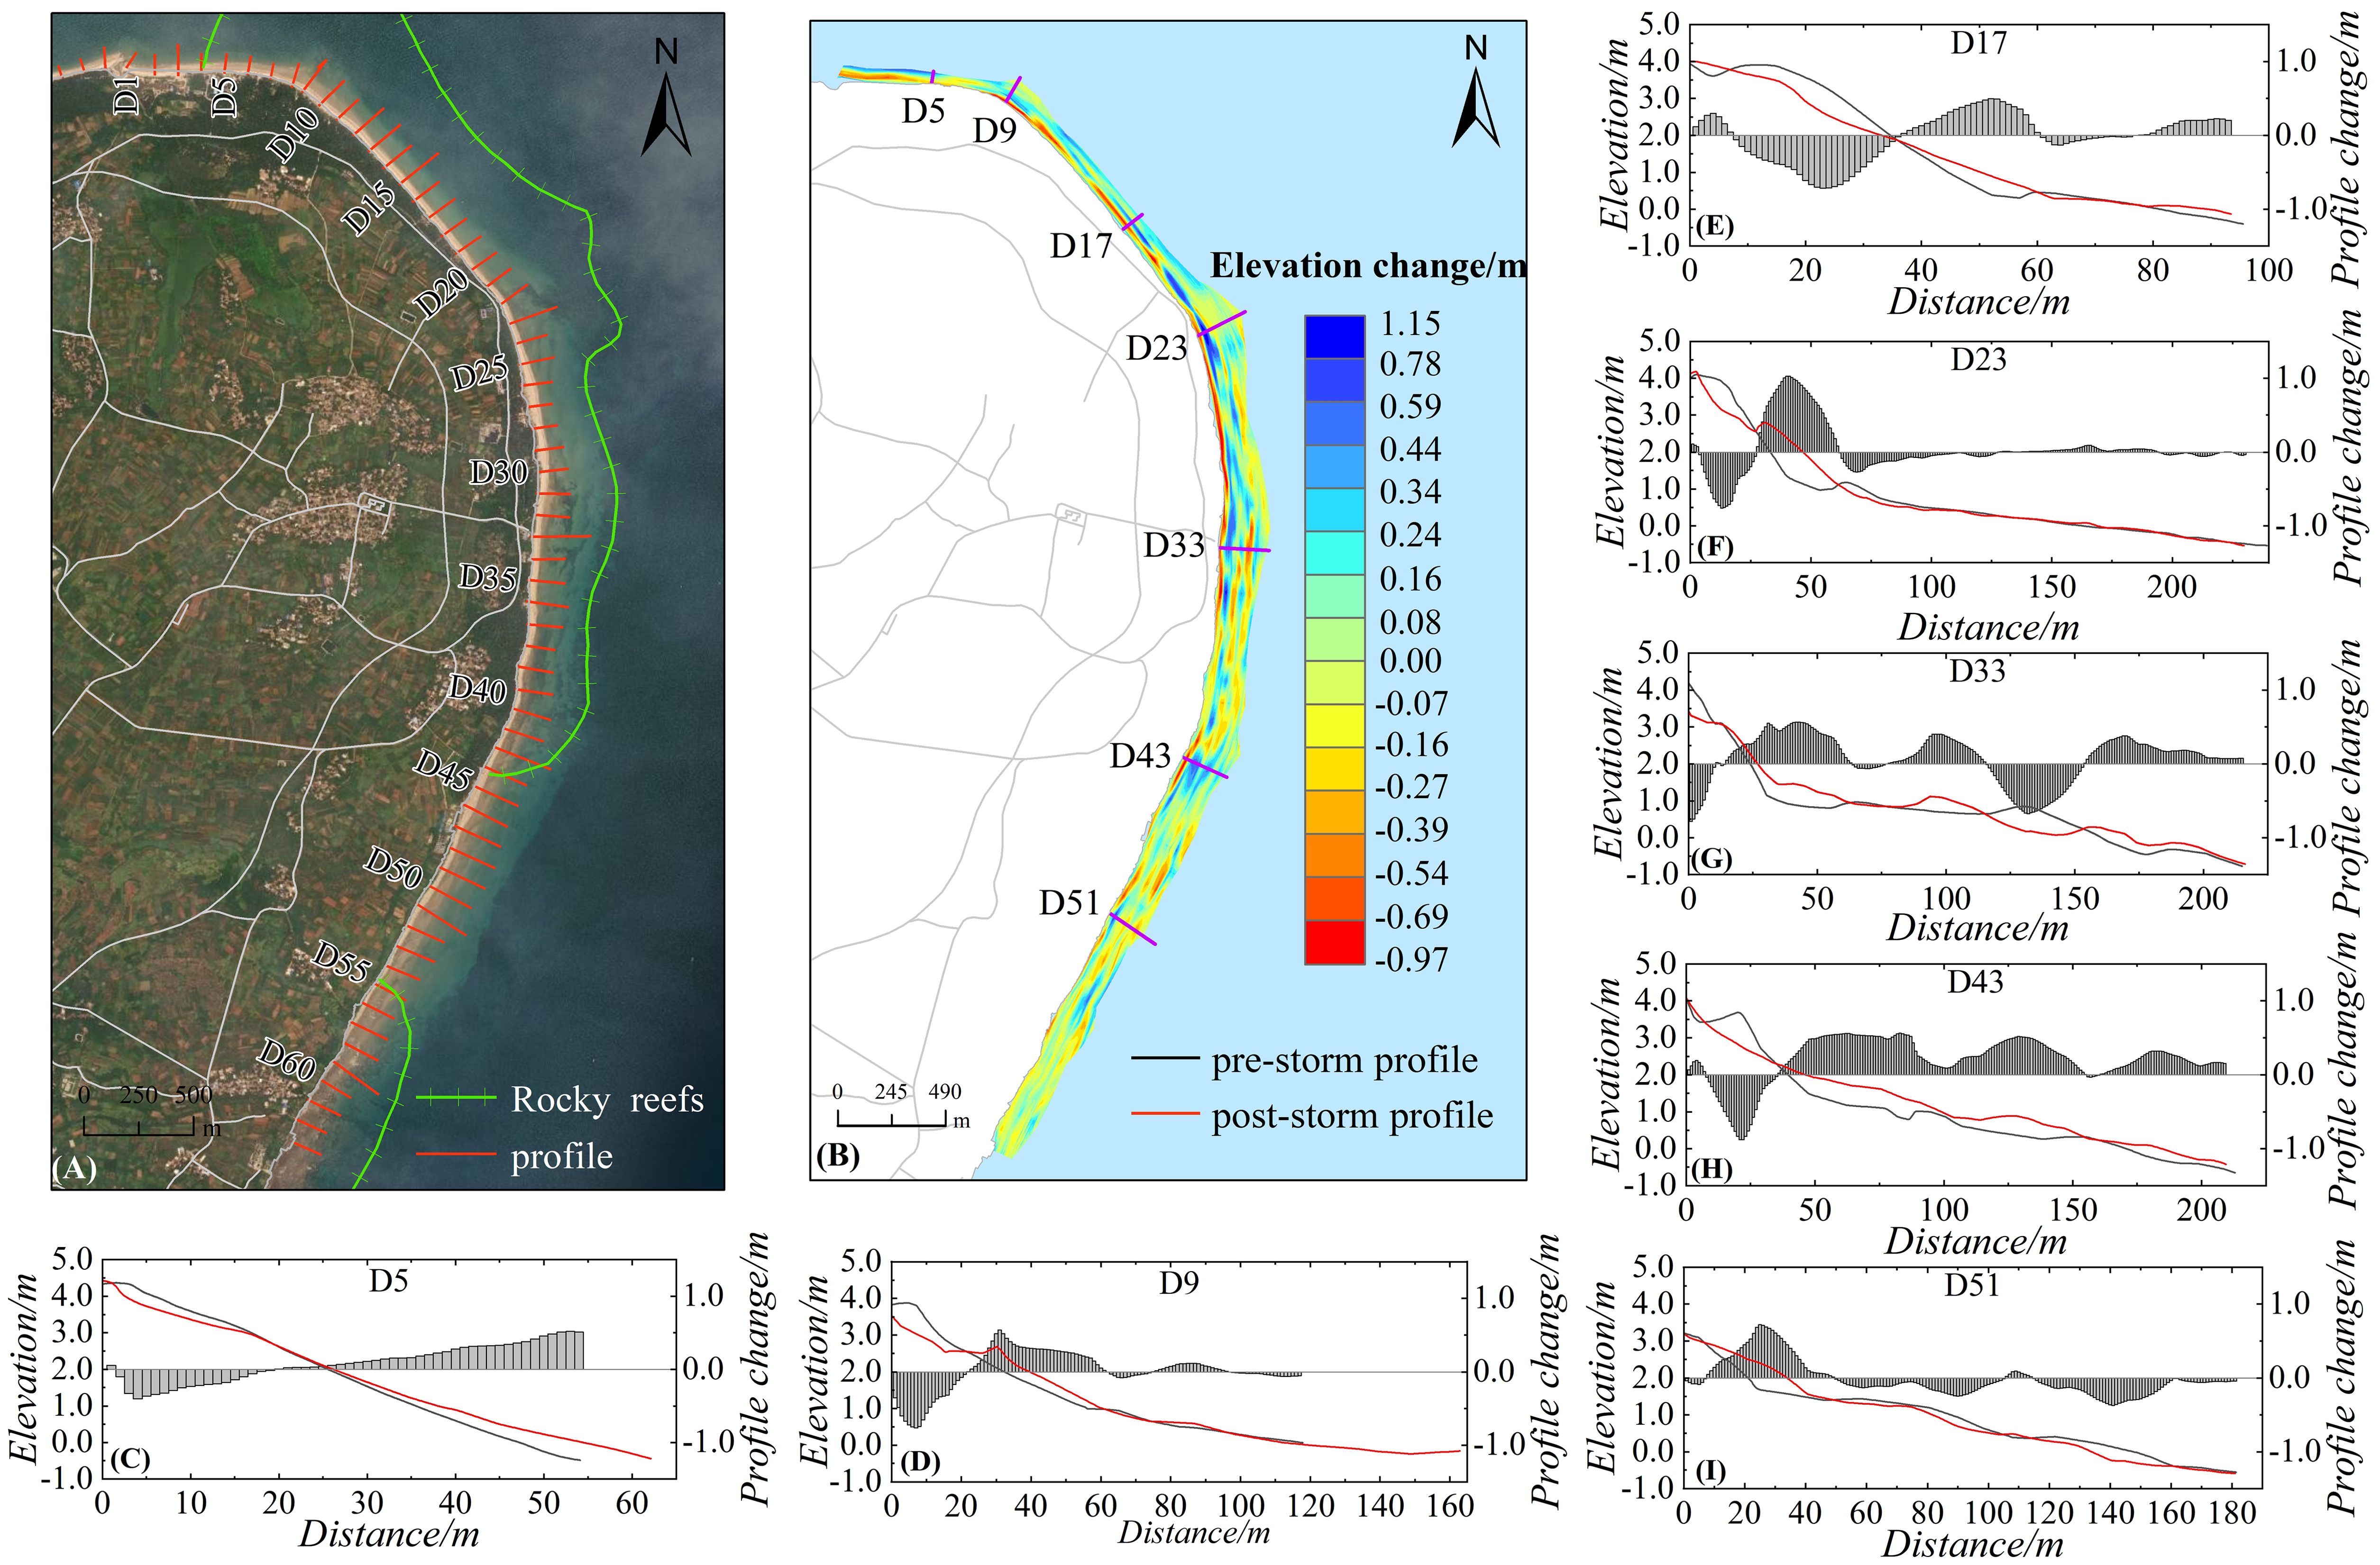
Figure 7. Changes in the geomorphology and profile morphology of the beach in Zone IV. Remote sensing image (A), Elevation change (B), Profile D5 (C), Profile D9 (D), Profile D17 (E), Profile D23 (F), Profile D33 (G), Profile D43 (H), Profile D51 (I).
After the storms, the northern section of Zone IV experienced the disappearance of the narrow berm, and the beach profile shape changed from a berm type to an oblique line type. In the middle section of the coast, the beach face in the upper part of the foreshore became steeper, while that in the middle and lower part were significantly flattened. Additionally, some sandbars that had developed in the lower part of the beach have disappeared. The southern beach profile is mainly oblique, with a wide and gentle shape. After the storms, the average slope of the beach profile decreased from 0.056 (with a range of 0.021−0.097) to 0.041 (with a range of 0.021−0.078), showing beach flattening. The UED of the beach profiles is between -2.94 m3/m and 16.41 m3/m. The largest erosion volume per unit width occurred at profile D49, and the largest deposition volume per unit width was at profile D43. The UED was mostly between -2.94 m3/m and 16.41 m3/m, and the beaches mainly experienced accretion, with relatively minor changes in erosion and accretion. The MPC of the beach was between 0.06m and 0.31 m. Among them, the MPC in the central and northern regions were mostly between 0.18m and 0.31m, indicating a relatively stronger response to the storms. In contrast, the average variation of beach profiles in the southern region was mostly between 0.06m and 0.18m, reflecting a relatively weaker response to storms.
4.3 Variations in beach sediment characteristics
4.3.1 The beach in Zone I
As illustrated in Figure 8, the surface sediments of South Bay beach (Zone I) were finer after the storms, and the mean grain size of the beach sediment changed from 2.10 Φ (ranging from 0.55−2.78 Φ) to 2.14 Φ (ranging from 1.07−2.07 Φ). The beach surface sediments generally underwent a process of coarser−refiner−coarser from the upper to the lower part in the foreshore. After the storms, the overall sorting coefficient of the beach sediments changed from 1.00 to 0.97 in Zone I, and the overall beach sorting improved. The sediment skewness was between -0.8 and 0, with extremely negative skewness. In addition, the negative skewness degree of sediments in the upper part of the foreshore decreased, while other areas indicated no obvious change. The kurtosis shifted from narrow to very narrow in the middle−upper part of the foreshore.
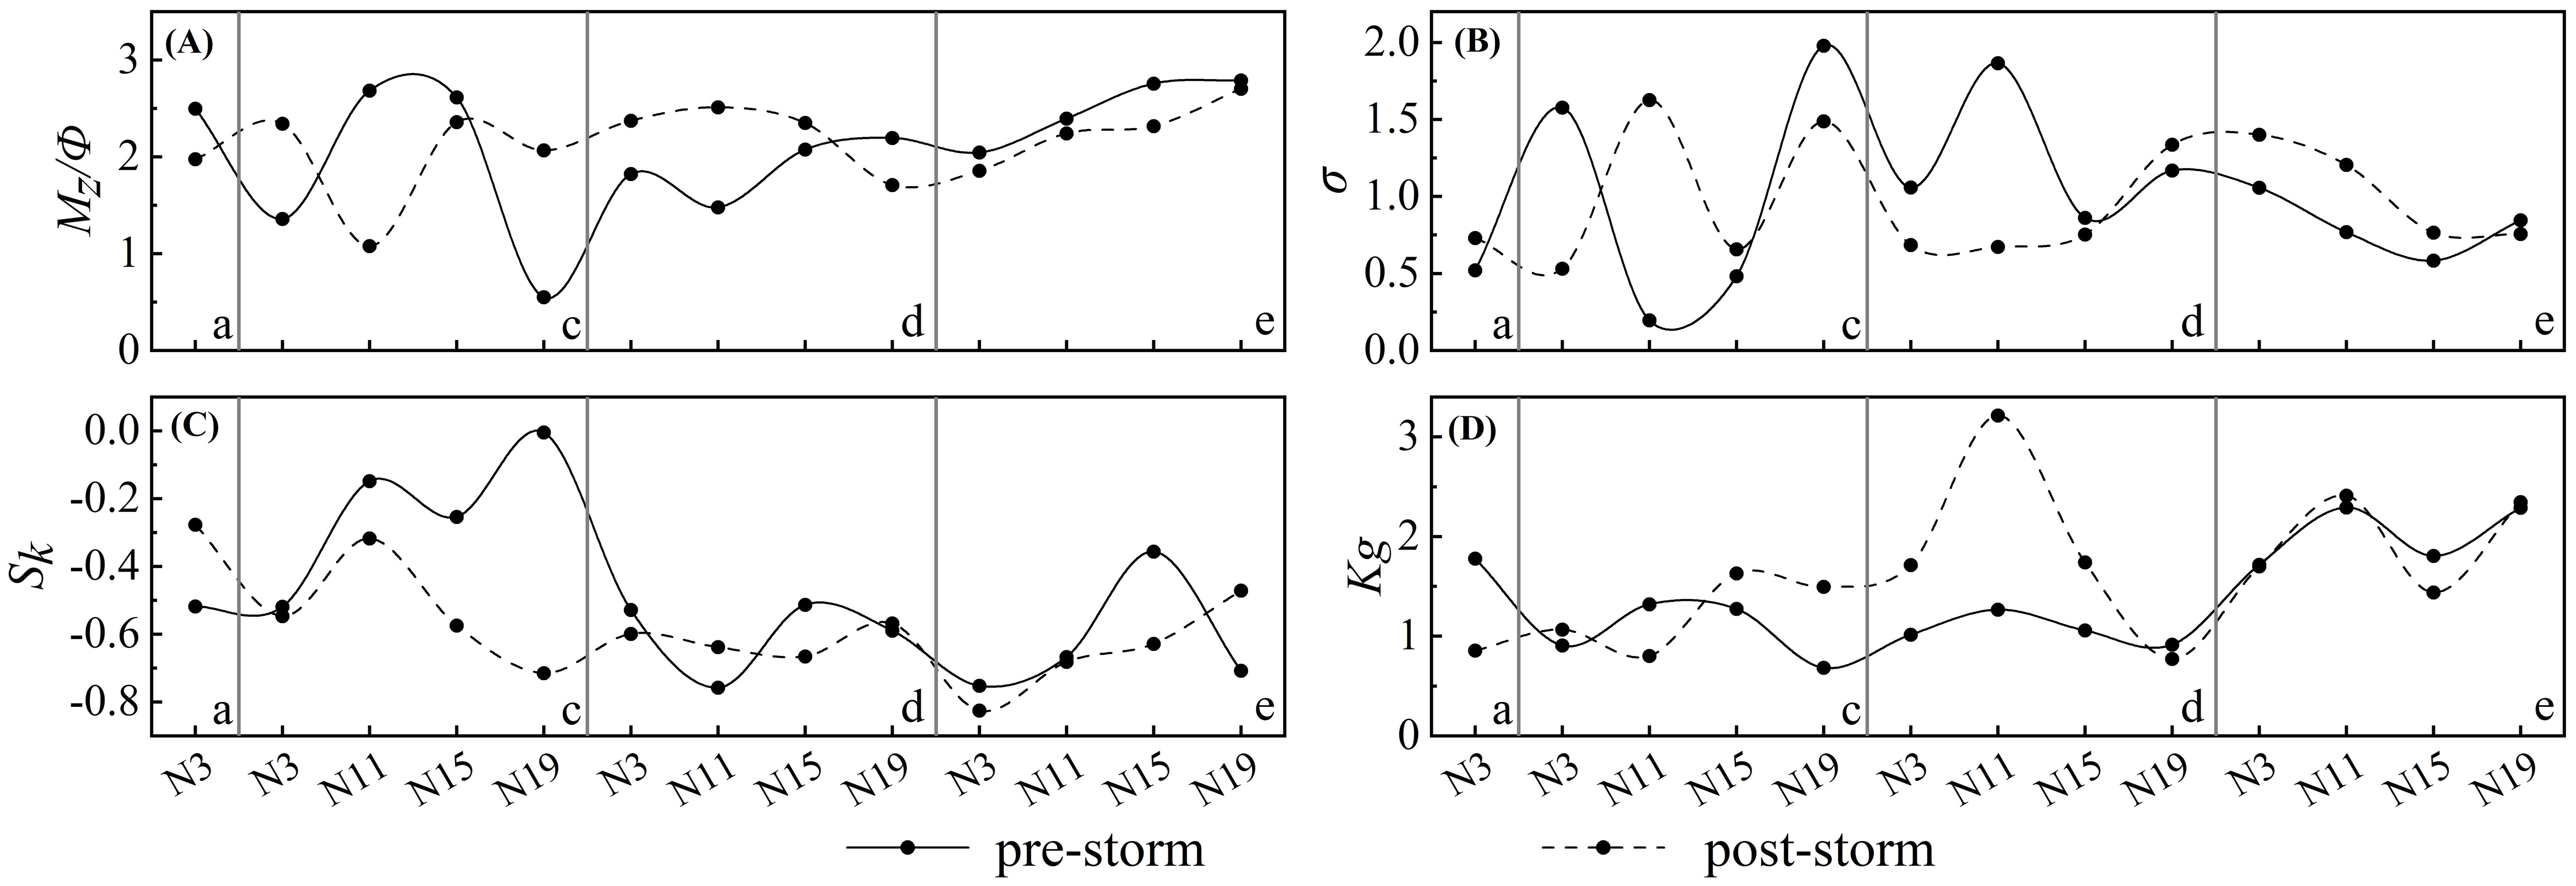
Figure 8. Grain size characteristics of surface sediments on the South Bay beach before and after storms. mean grain size (A), sorting coefficient (B), skewness (C), kurtosis (D), (a: backshore; c: upper foreshore; d: middle foreshore; e: lower foreshore).
4.3.2 The beach in Zone II
As shown in Figure 9, the surface sediments of the beach from Dishui Danping to Shiluokou (Zone II) were obviously coarser after the storms. The mean grain size of beach sediments changed from 1.96 Φ (ranging from -0.70−2.95 Φ) to 1.71 Φ (ranging from -0.86−2.86 Φ). Before and after the storms, the grain size of the surface sediments at the berm in the middle-upper part of the foreshore exhibited the strongest variability. After the storms, the sorting coefficient of the beach sediments changed from 1.03 to 1.05 in Zone II indicating a deterioration in beach sorting. However, the sorting of surface sediments in the middle−lower part of the beach foreshore was obviously improved compared to other parts. Sediment skewness, which was between –0.8 and 0.8, was dominated by extremely negative skewness and negative skewness before and after the storms. Furthermore, the positive skewness of the beach sediment increased. The degree of change in kurtosis was larger in the middle−lower part of the foreshore, whereas kurtosis remained relatively stable from the backshore to the berm.
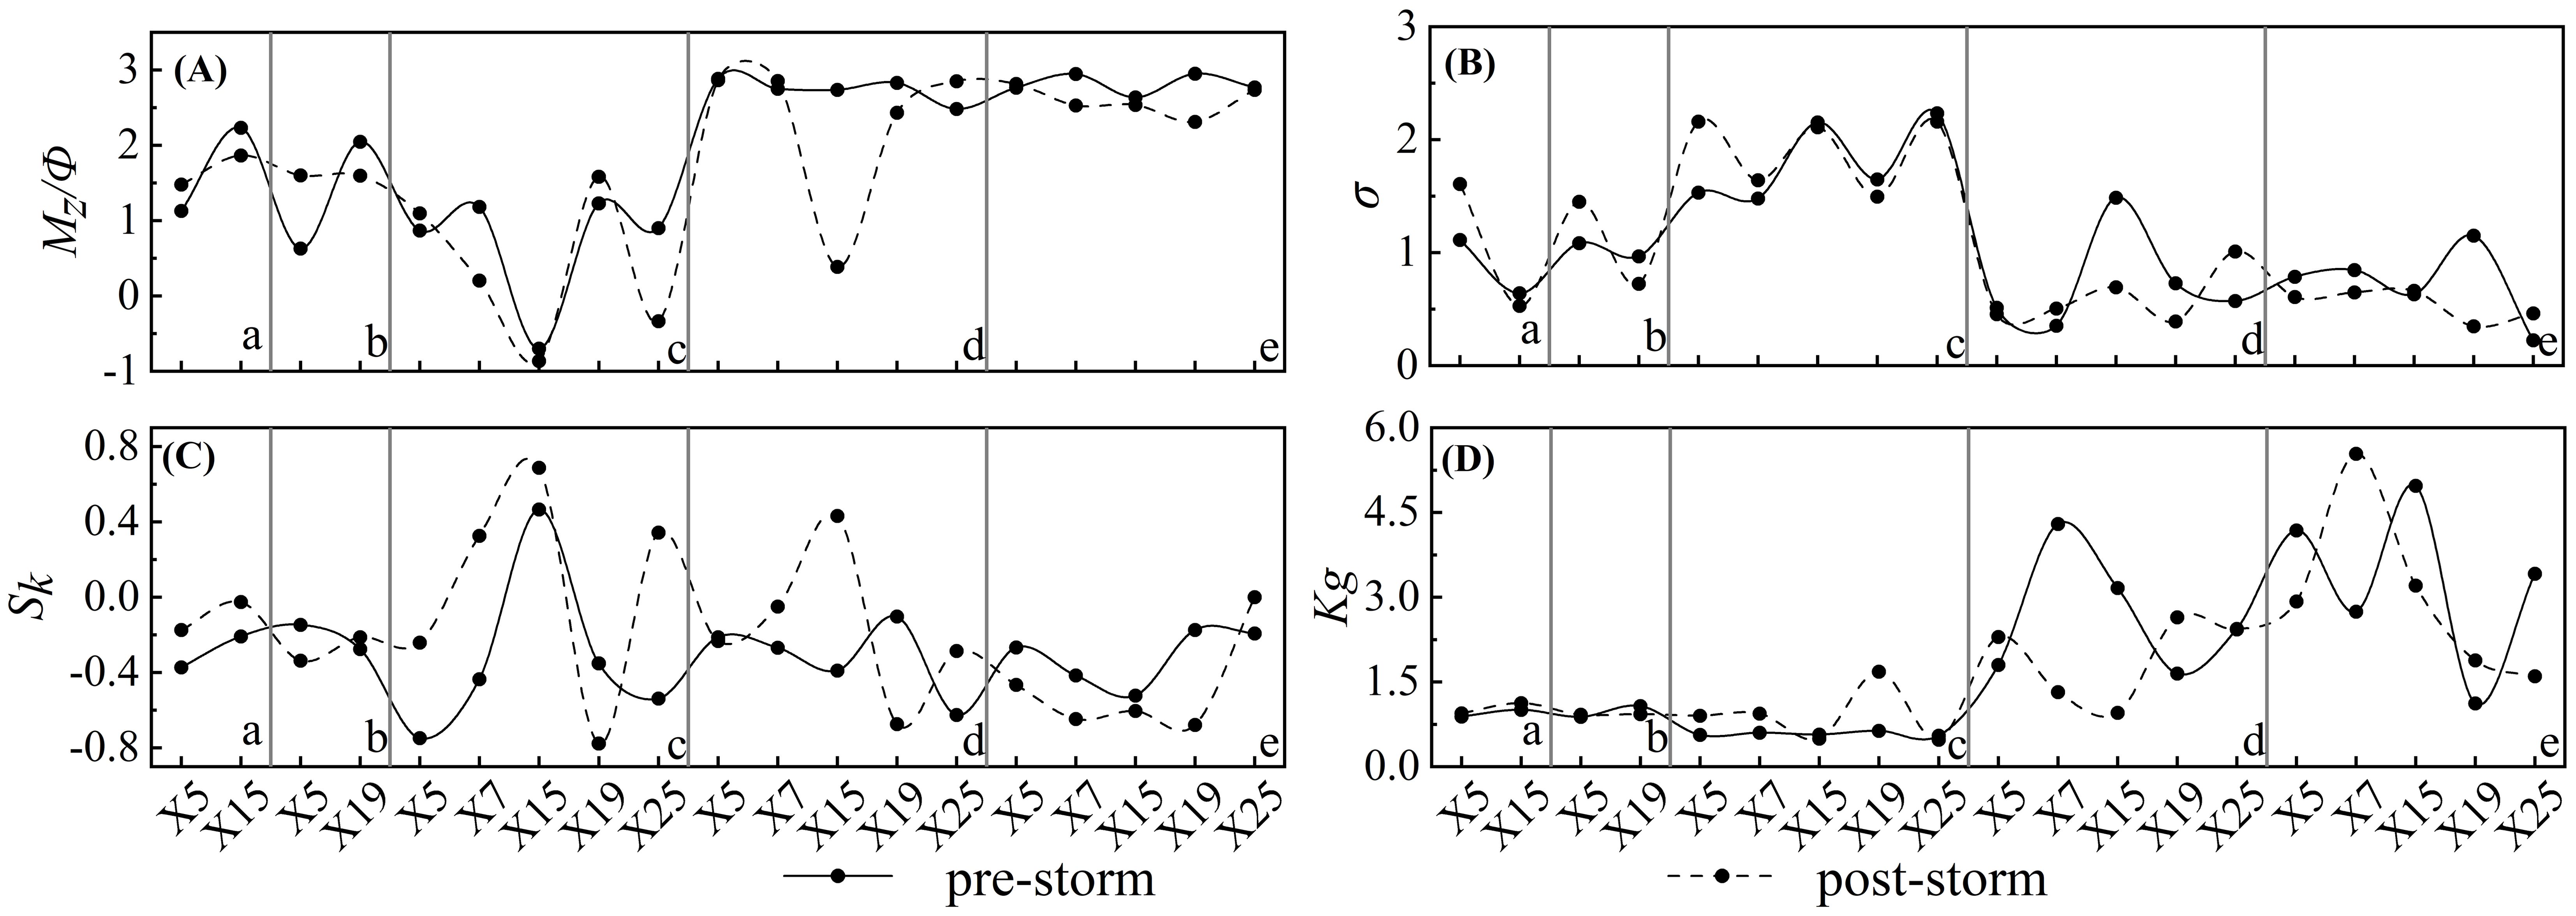
Figure 9. Grain size characteristics of surface sediments on beach from Dishui Danping to Shiluokou before and after storms. mean grain size (A), sorting coefficient (B), skewness (C), kurtosis (D), (a: backshore; b: berm; c: upper foreshore; d: middle foreshore; e: lower foreshore).
4.3.3 The beach in Zone III
The surface sediments of the beach from Zitongmu to Mala Port beach (Zone III) were coarser after the storms (Figure 10). The mean grain size of beach sediments changed from 1.64 Φ (ranging from 0.09−2.77 Φ) to 1.62 Φ (ranging from-0.04−2.88 Φ). The coarsened sediments were mainly located on the backshore and berm, while the lower part of the foreshore experienced sediment refinement. There was also a noticeable difference in sediment grain size between the middle-upper part of the foreshore, with coarser sediments found on the west side of the Blue Bridge and relatively finer sediments on the east side. After the storms, the sorting coefficient of the beach sediment decreased from 1.20 to 1.15 in Zone III, indicating an overall improvement in beach sorting. The area with improved sorting was mainly located in the middle−upper area of the foreshore on the east side of the Blue Bridge, while the west side experienced a deterioration in sediment sorting. Sediment skewness was between –0.8 and 0.4, with extremely negative. After the storms, positive skewness increased in the area from the backshore to the upper part of the foreshore. There was minimal variation in kurtosis before and after the storms.
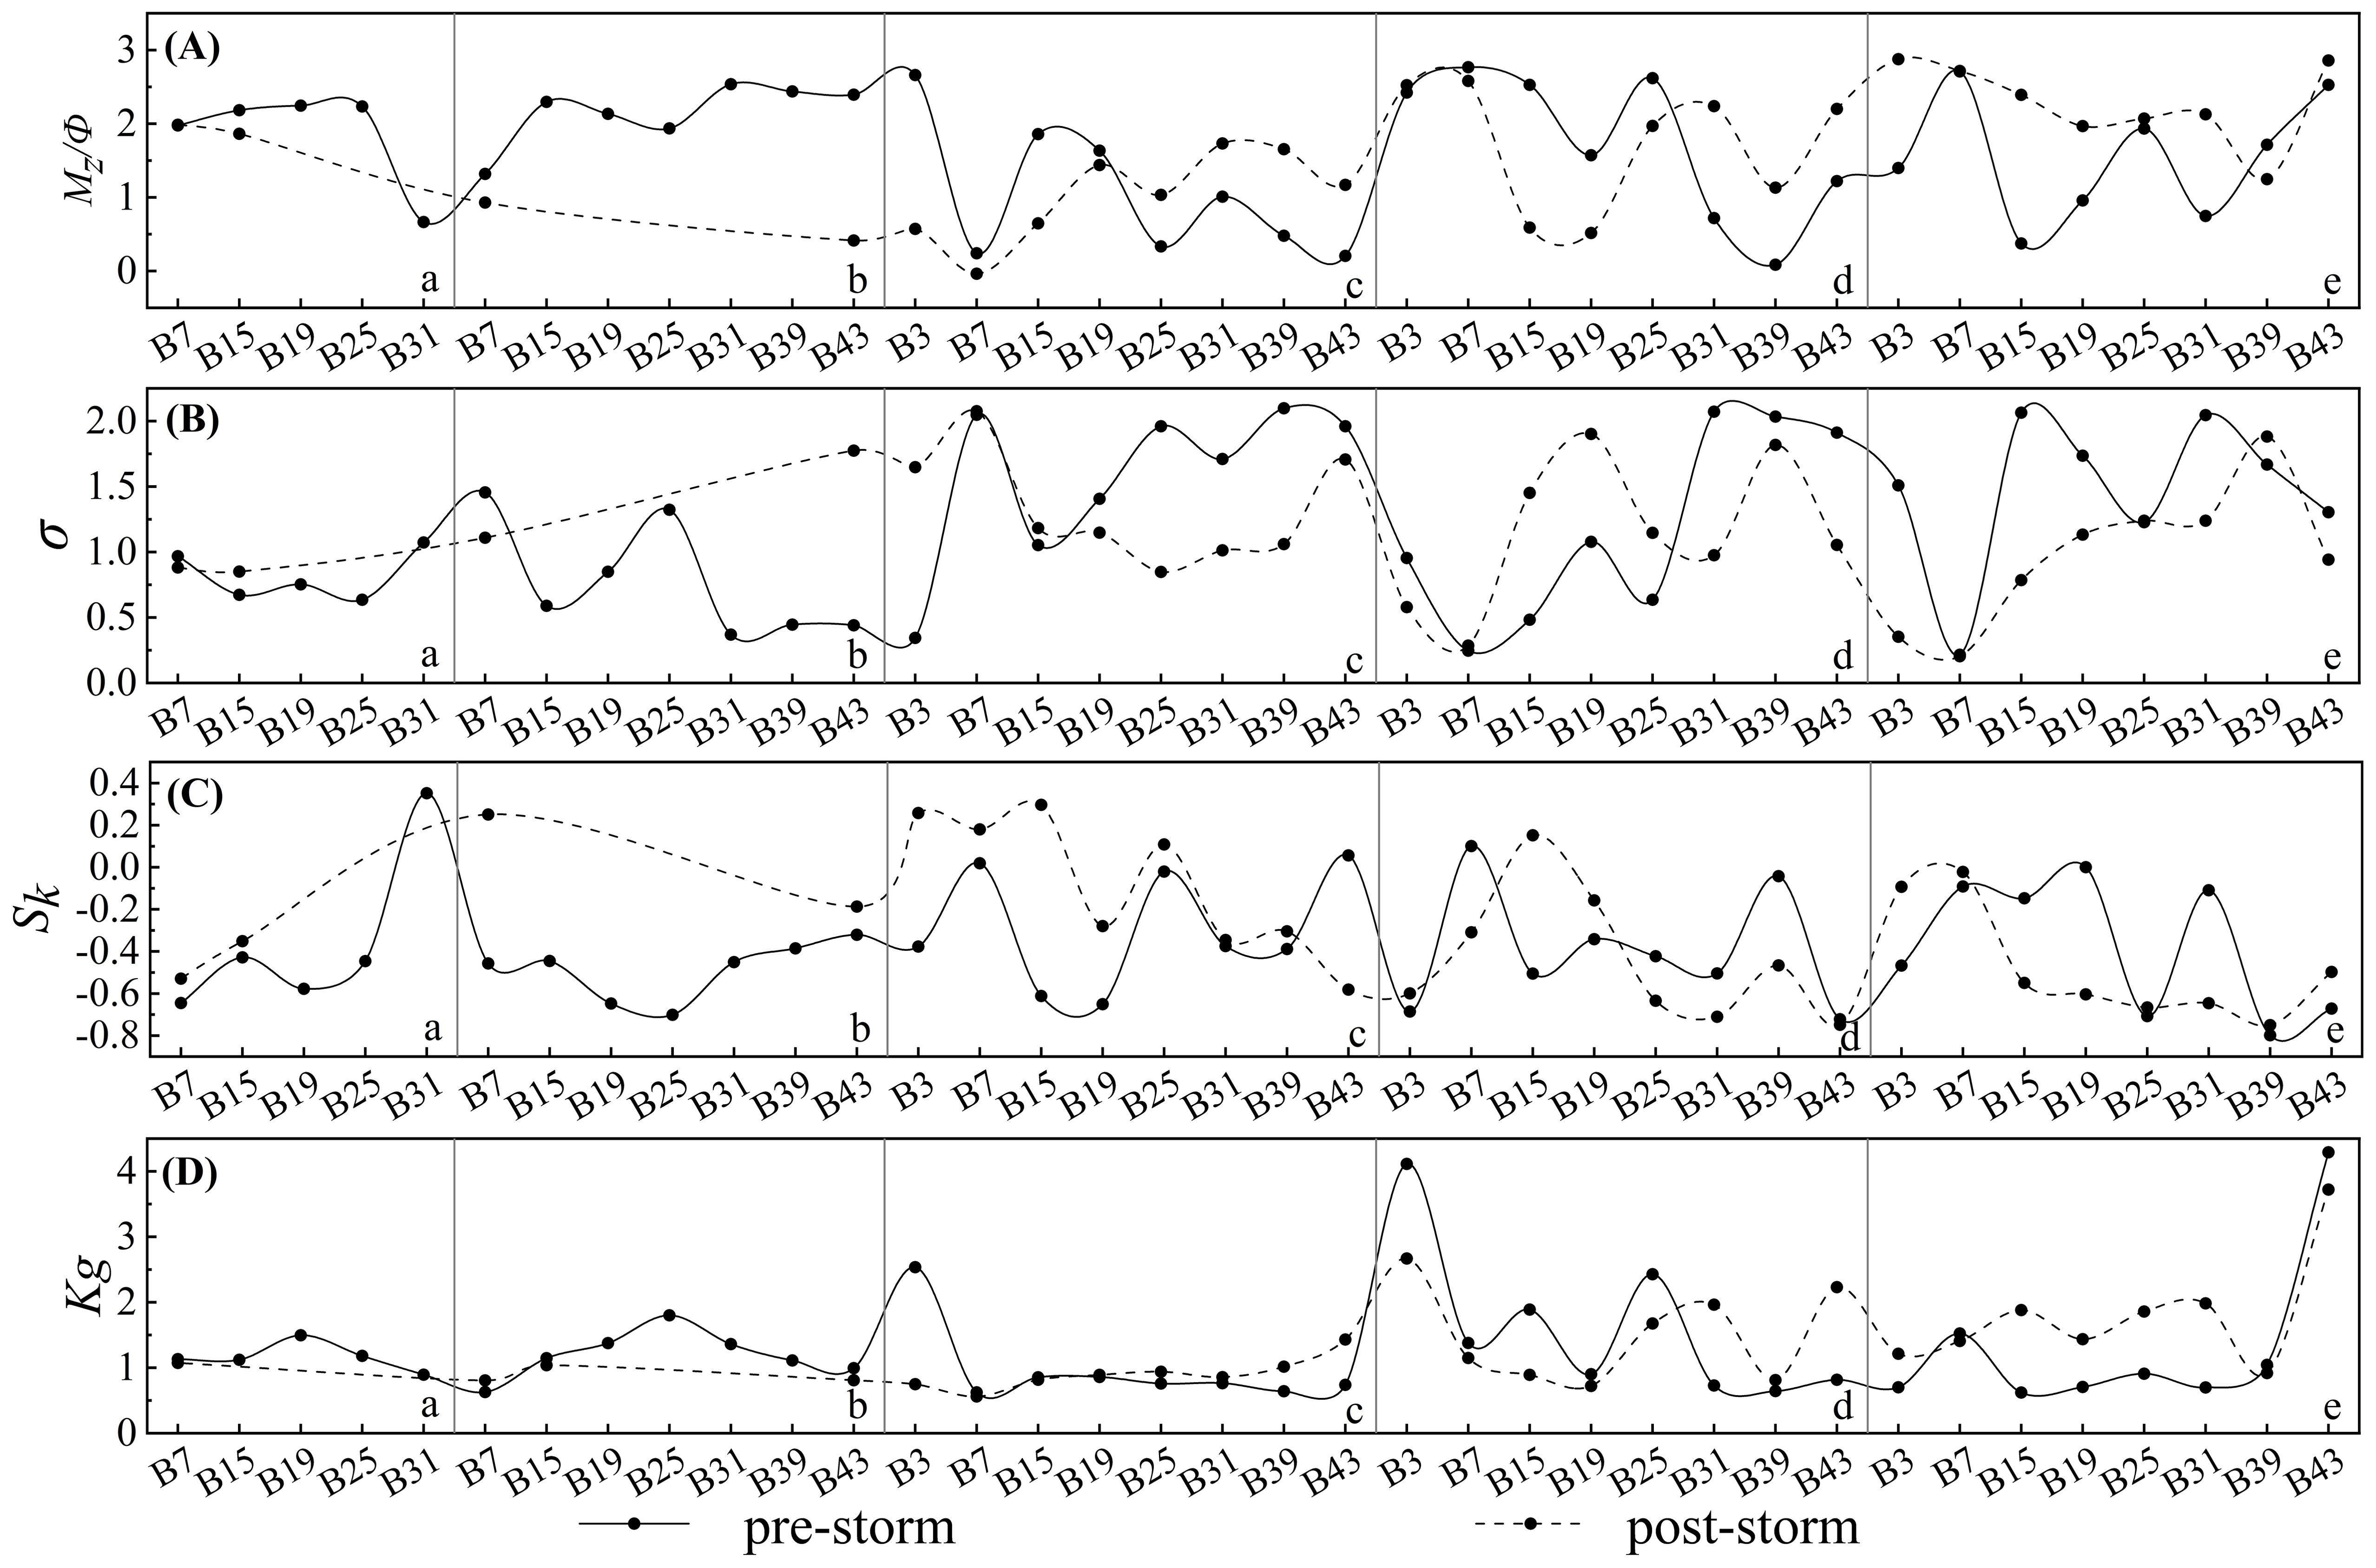
Figure 10. Grain size characteristics of surface sediments on the beach from Zitongmu village to Mala port before and after storms. mean grain size (A), sorting coefficient (B), skewness (C), kurtosis (D), (a: backshore; b: berm; c: upper foreshore; d: middle foreshore; e: lower foreshore; part of the surficial sediments on backshore and berm were absent due to characteristics of the beaches in this zone).
4.3.4 The beach in Zone IV
In Zone IV, after the storms, the surface sediments of the beach from Mala Port to Wanzai Village became coarser, with the mean grain size shifting from 2.02 Φ (ranging from -1.02−3.21 Φ) to 1.69 Φ (ranging from 0.92−3.00 Φ). The coarsening of sediments was primarily observed on the berm and the upper part of the foreshore in the northern region of Zone IV, while the change of the grain size of surface sediments was little in the backshore and middle−lower part of the foreshore. After the storms, the beach sediment sorting coefficient changed from 0.95 to 0.92, but the sorting worsened significantly on the berm and upper part of the foreshore in the northern region. The skewness of beach surface sediments was between -0.8 and 0.8, generally shifted from extremely negative and negative skewness before the storms to a more symmetrical distribution after the storms. As with other zones, there was minimal variation in kurtosis before and after the storms, indicating consistent kurtosis in the sediment distribution (Figure 11).
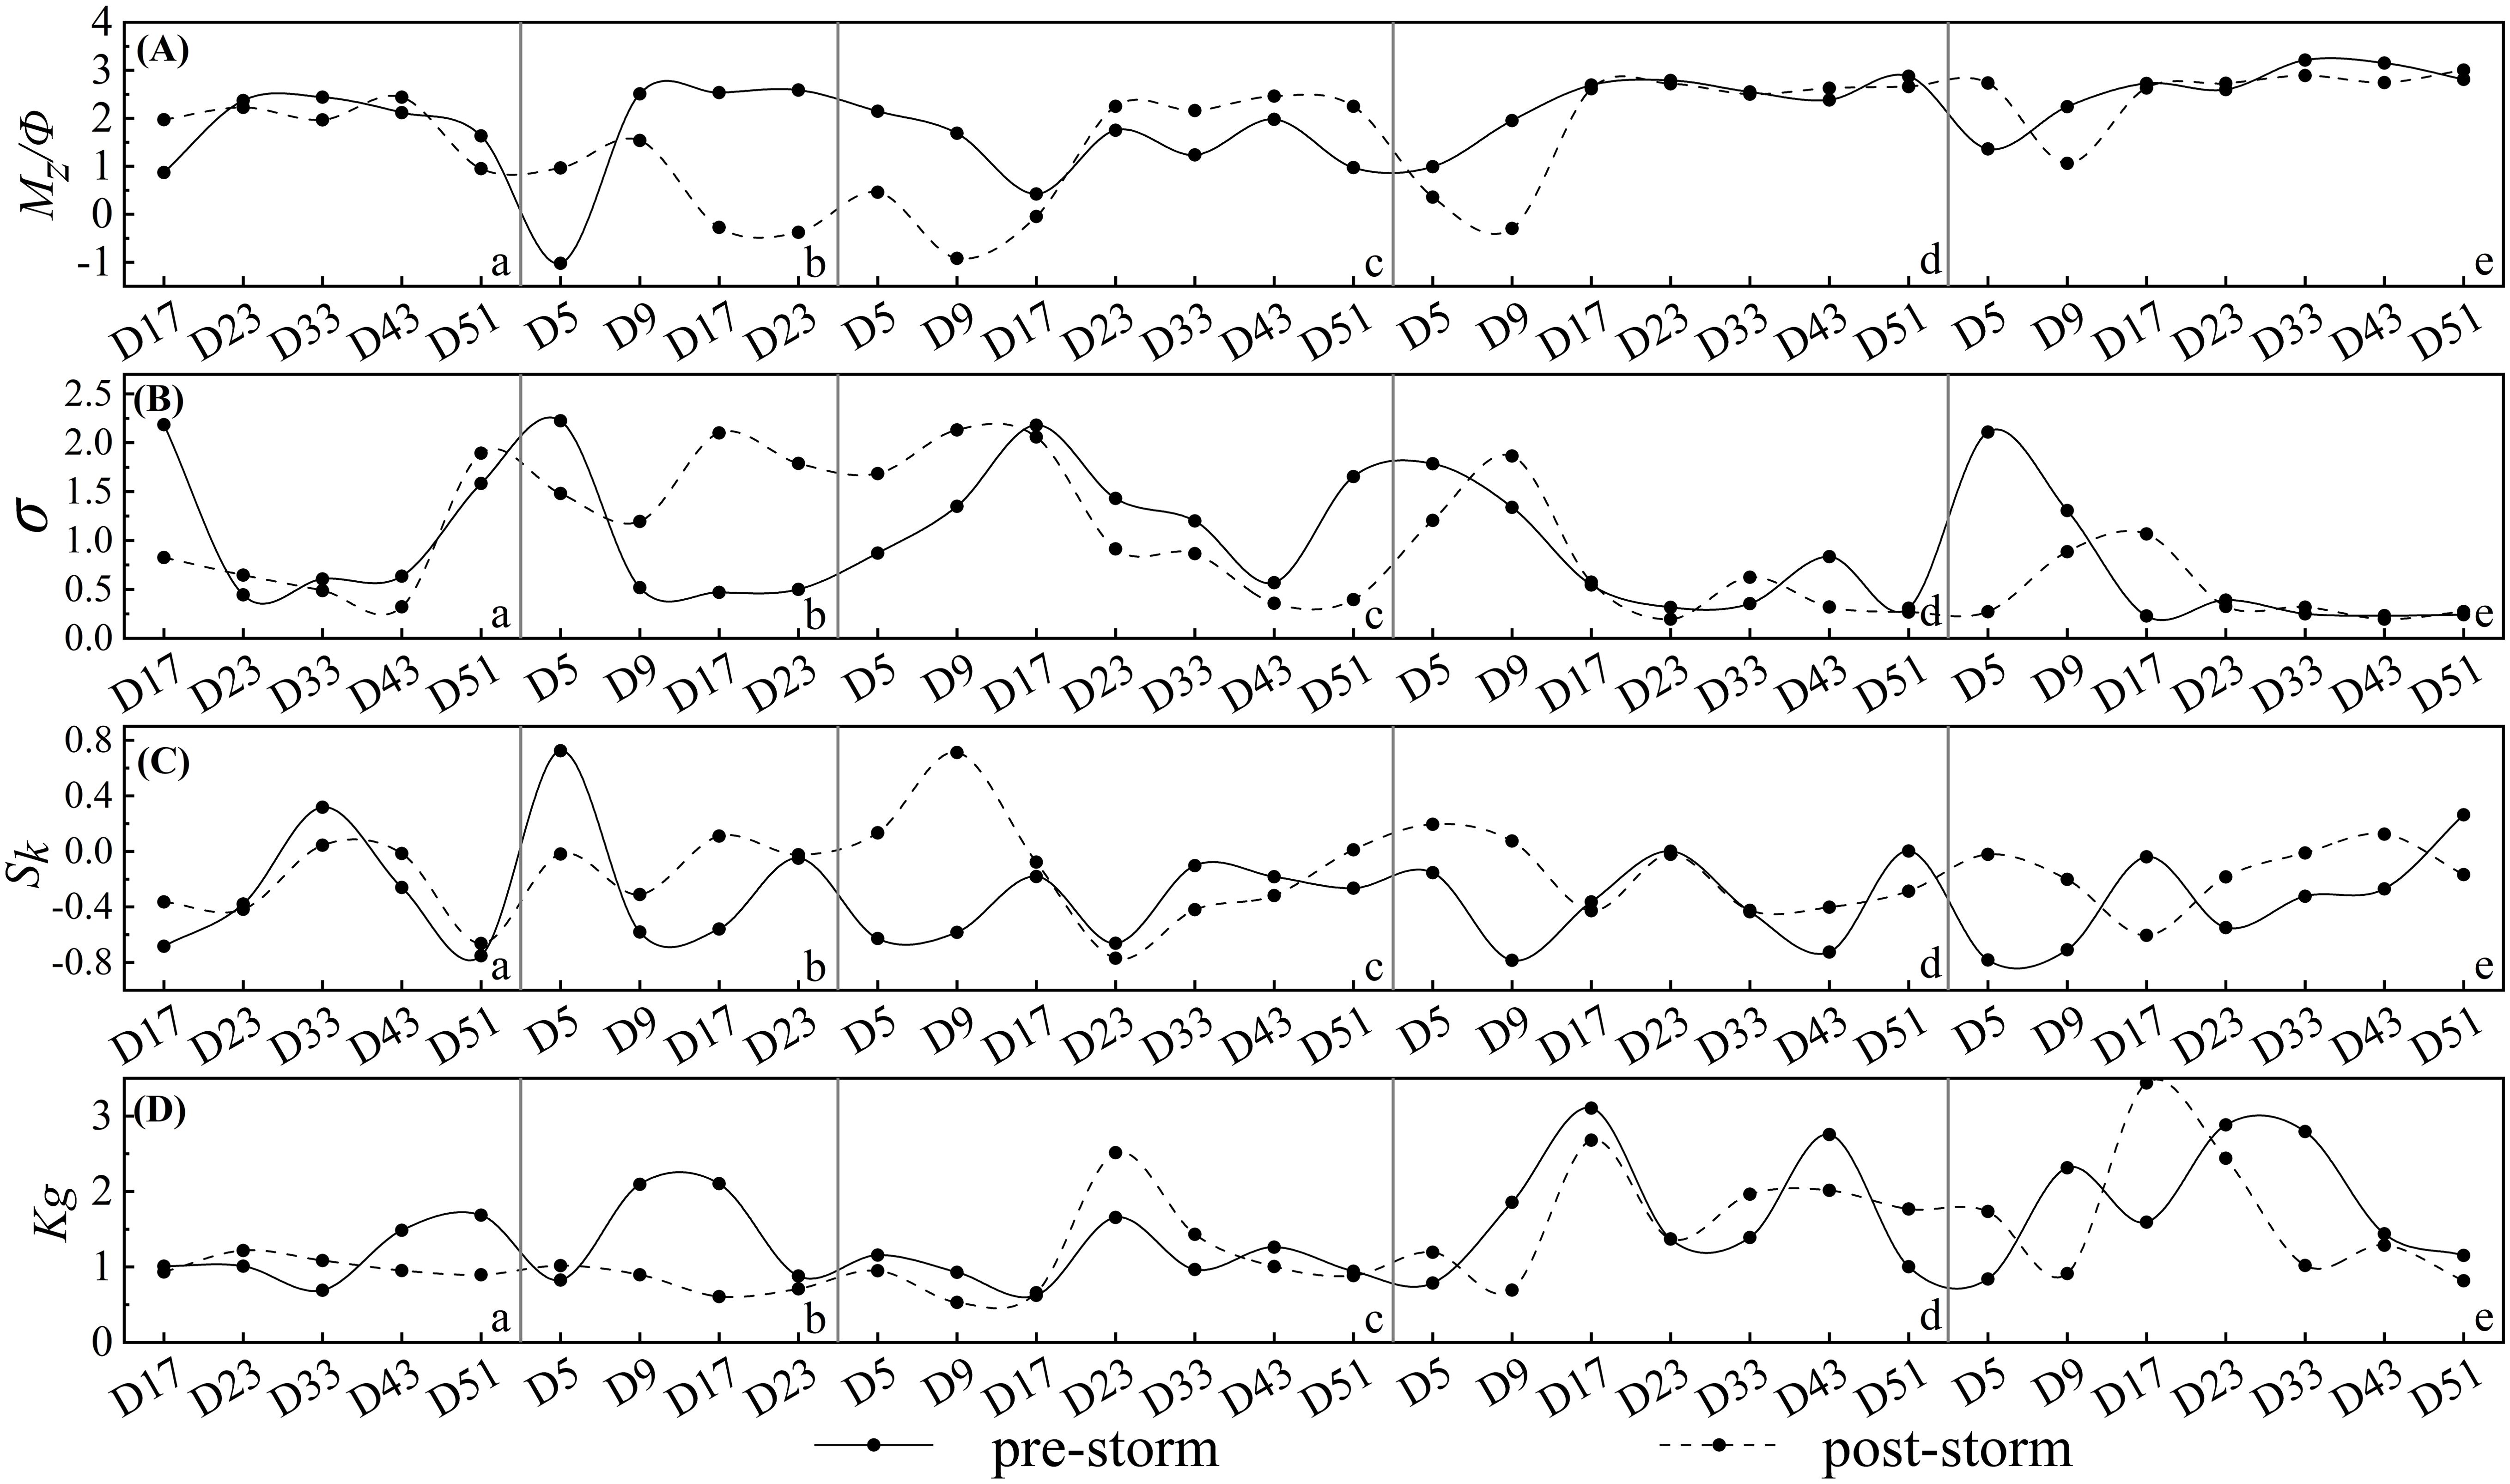
Figure 11. Grain size characteristics of surface sediments on the beach from Mala port to Wanzai village before and after storms. mean grain size (A), sorting coefficient (B), skewness (C), kurtosis (D), (a: backshore; b: berm; c: upper foreshore; d: middle foreshore; e: lower foreshore).
5 Discussion
The topography and sediment changes of the beaches are influenced by both natural factors and anthropogenic activities. On the one hand, numerous rock and coral reefs are widely distributed around the beaches. On the other hand, Weizhou Island, as a well-known tourist area in China, has strong anthropogenic activity. Seawall, dock, and port are intensively constructed in Zone I and III, which contribute significantly to the sedimentary geomorphology of the beaches. The following section discusses the mechanism that caused the varied response of beaches to storms in different regions around Weizhou Island. This analysis considers beach topography and geomorphology characteristics, hydrodynamic changes, distributions of rock and coral reefs, and anthropogenic activities.
5.1 Hydrodynamic variation
Waves and tides play important roles in beach formation and evolution (Short, 1987; Masselink and Short, 1993), and storm waves and surges caused by storms destroy beach stability, altering the beach topography and sediment distribution characteristics (Coco et al., 2014; Choi et al., 2016; Guo et al., 2021).
The passage of Typhoons Lionrock and Kompasu through the southern waters of Weizhou Island in the Beibu Gulf, caused a rapid increase in wave height and storm surge in the study area’s waters in a short period of time. The island aggregation effect during the storm surges was evident, with the water level rising almost simultaneously along the surrounding island coasts. The elevation of the water level caused waves to impact higher areas of the beaches, exacerbating erosion and accretion changes in the backshore, berm, and upper foreshore regions. Due to strong hydrodynamic scouring, fine-grained sediments in the upper regions can be transported to the lower regions, leading to coarsening of sediments in the upper regions. For waves with short wavelengths, the wave energy density was high in the wave-facing direction and low in the wave-back direction, with nearshore coastal currents developing in the direction of wave propagation. During the Lionrock period, the predominant wave direction was NE, while the strong wave direction was SSW, leading to the relative development of wave currents along the coasts of Zones I, II, and III, while Zone IV was directly exposed to the wave direction. In Zone I, sediment migrates relatively towards the middle of the coast due to the influence of NE and SSW waves; In Zone III, when the prevailing waves are NE direction, the coastal currents were well developed, leading to southwest transport sediment. Conversely, when the waves were in the backward direction, the wave energy was relatively weak, reducing sediment movement. In Zone IV, direct wave impact resulted in significant beach erosion. During the Kompasu period, the predominant wave direction was SSE and SEE, while the strong wave direction was NE. This caused the development of wave currents along the coasts of Zones II and III, with Zone I and IV facing the incoming wave. Direct impact of wave induced beach erosion in Zones I and IV. When the prevailing wave direction is SSE and SEE, Zone II experiences strong coastal currents, with sediment mainly moving northward. Meanwhile, Zone III is in a wave-back zone where wave erosion energy was relatively weak. When the wave direction changes to northeast, Zone III became a wave-following area, with strong wave-current interaction, resulting in sediment transport toward the southwest; Zone II was in the wave-back area, where wave-current energy was relatively weaker (Figure 12).
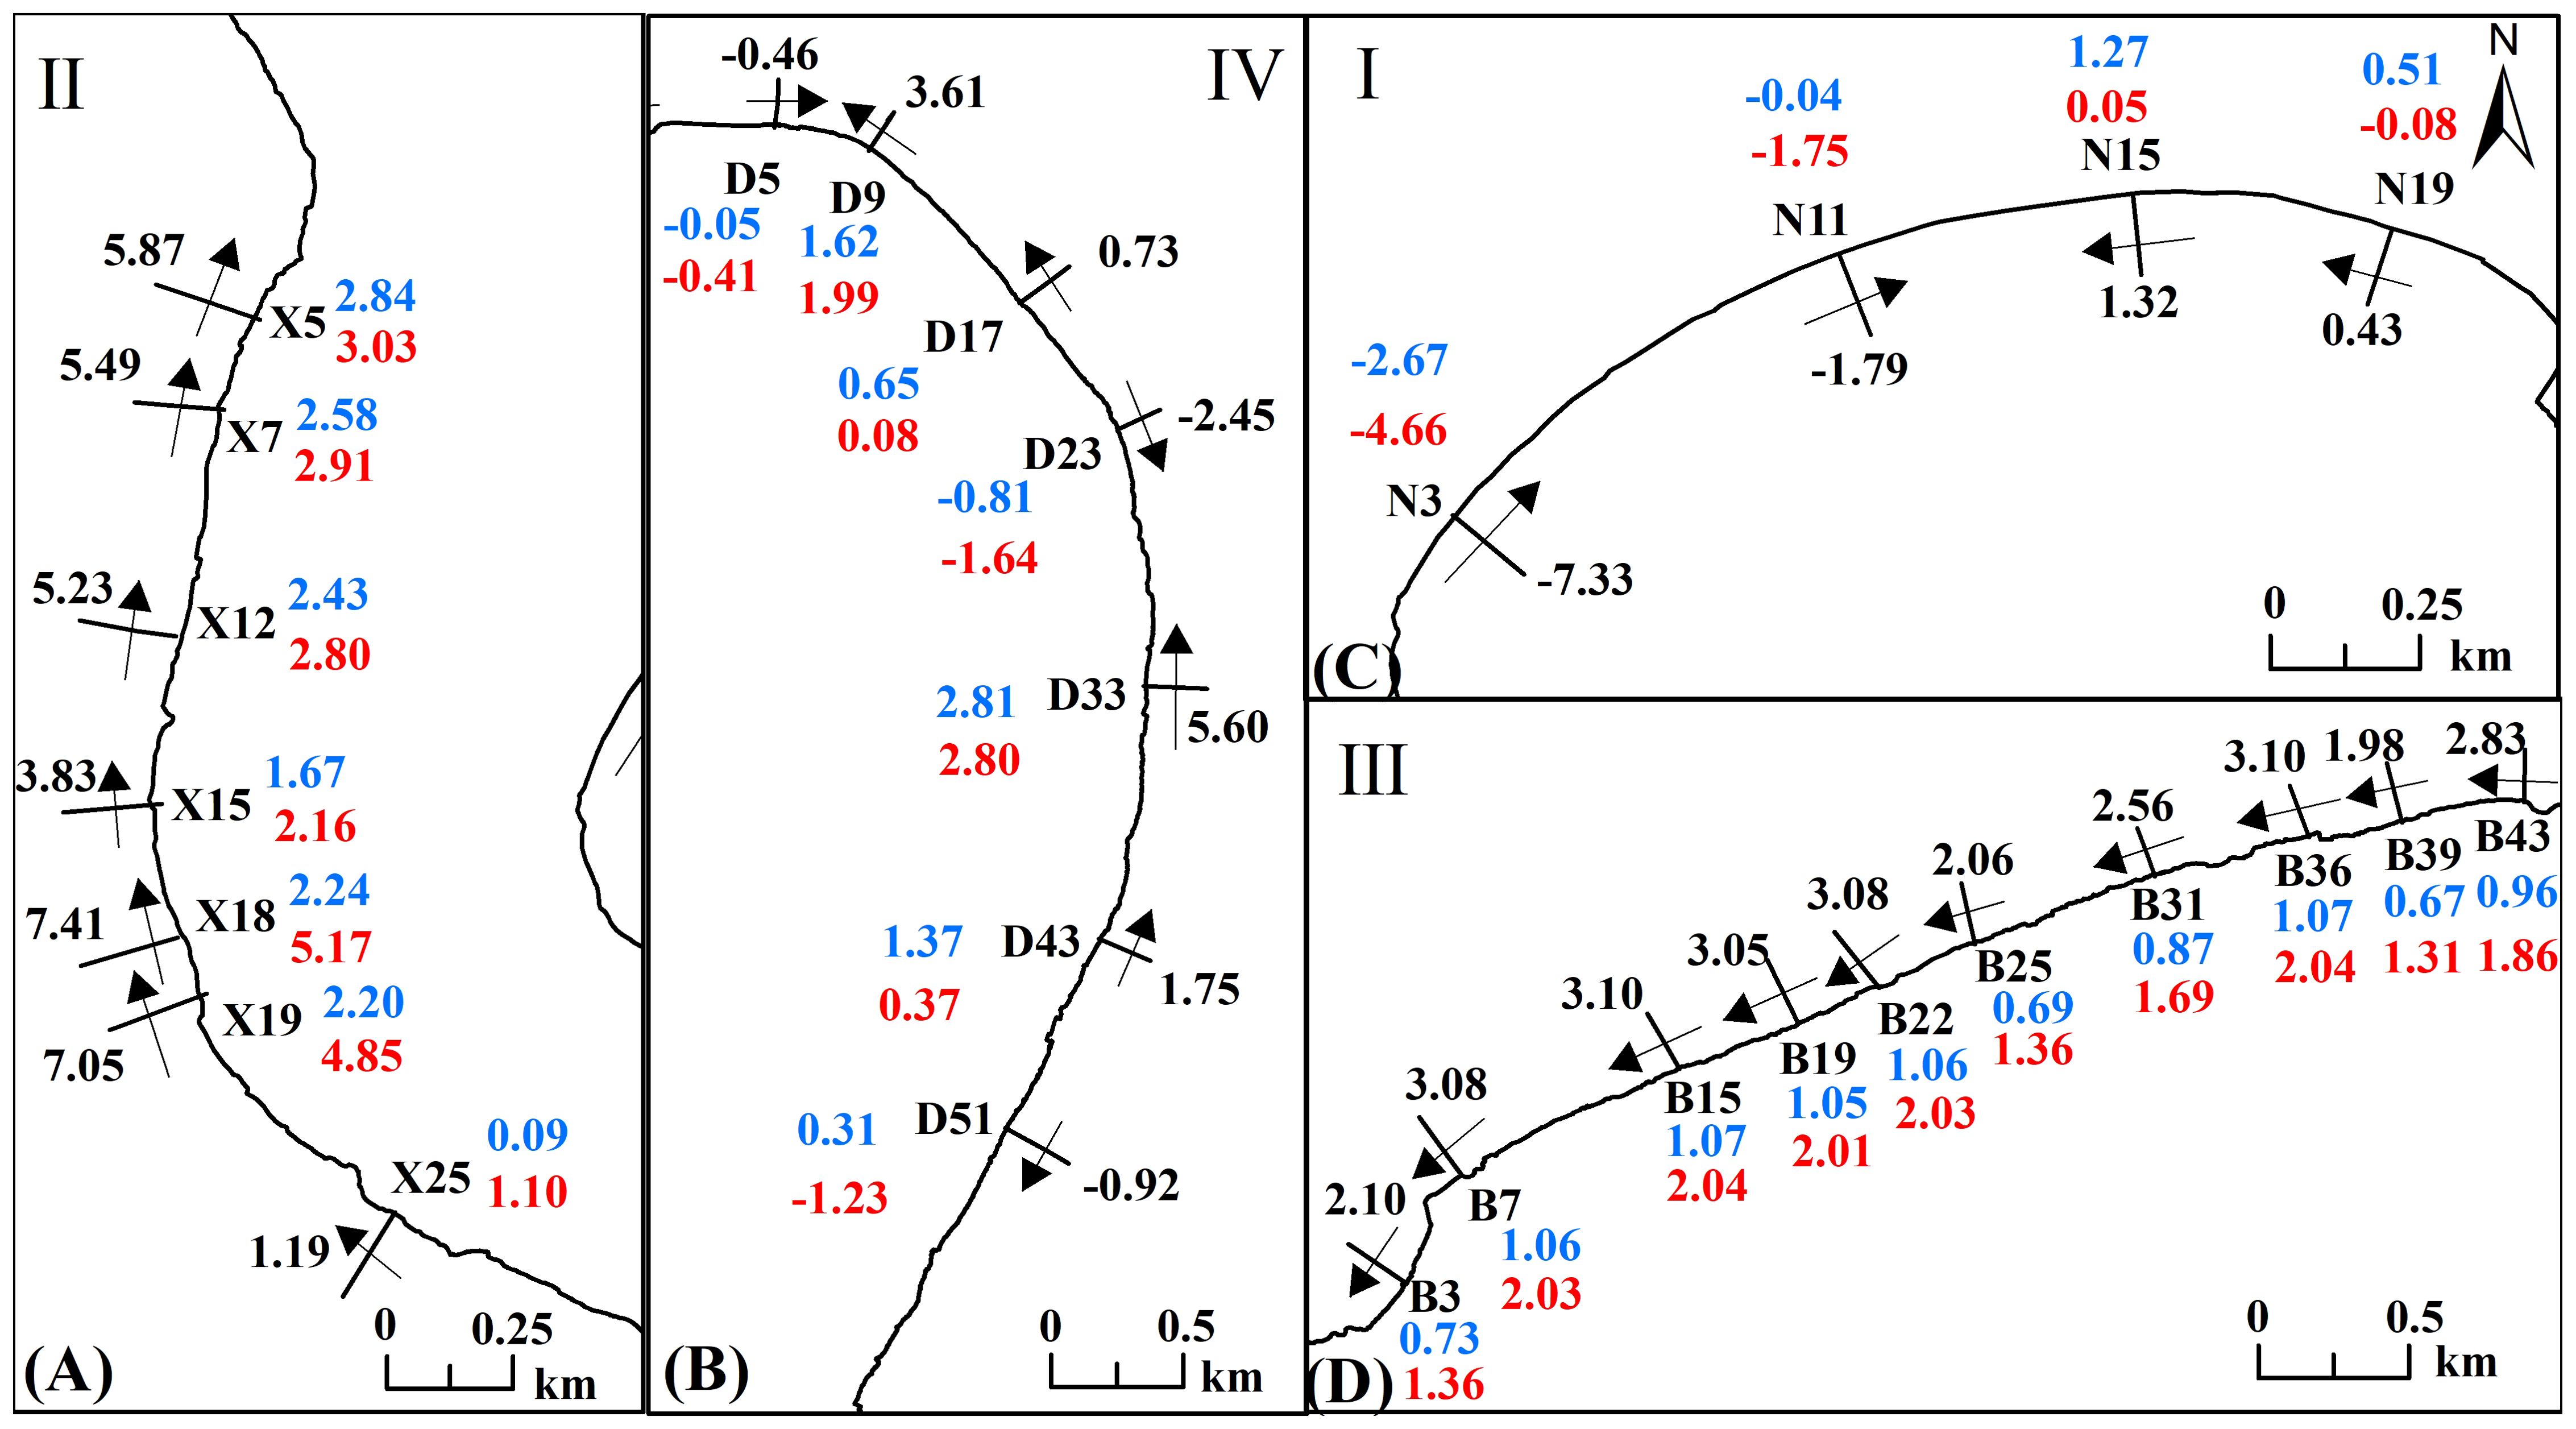
Figure 12. Variation in sediment transport rate along the coast of Weizhou Island (blue text represents sediment transport rate during Typhoon Lionrock, red text represents sediment transport rate during Typhoon Kompasu, black text represents the total sediment transport rate; positive and negative signs indicate transport direction, with north and west as positive and south and east as negative, Zones I (C), Zones II (A), Zones III (D), Zones IV (B).
The combined effects of increased wave height and storm surge during the two typhoon events led to significant changes in beach morphology within the study area. During the Kompasu period, both peak wave heights and storm surge were significantly stronger than during the Lionrock period. Furthermore, the asynchronous peak times of wave and storm surge led to a reduced response of beaches in zones I, II, and IV. Zone III, however, was significantly influenced by the combined wave and currents generated by the two storms, resulting in noticeable beach erosion and accretion changes. Additionally, Zone IV experienced complex changes in beach sedimentary geomorphology due to the influence of varying wave directions during the two storm events.
5.2 Coastal geology and geomorphology
The development and distribution of geomorphic features significantly influence the response of beaches to storm events. Beaches with different plane shapes exhibit varying responses to storms. For instance, headland bay beaches, characterized by the presence of upper and lower headlands, experience a weakening in incident wave energy, which reduces beach erosion on both sides of the beach (Guo et al., 2019). In contrast, straight beaches, which are more exposed to the open sea, are more vulnerable to the direct impact of the incident waves, leading to significant changes in beach erosion and accretion (Cai et al., 2006). Zone I features a typical headland-bay beach, with the beach inside the bay being protected by the two headlands on either side. This protection mitigates the erosive effects of storm waves from the SW and NE directions, thereby maintaining the stability of the beach. It is worth noting that typhoons may cause harbor resonance phenomena in semi-enclosed harbors, and harbors on islands far from the mainland are more likely to exacerbate the resonance phenomenon in harbors (Wang et al., 2020). Weizhou Island has experienced harbor resonance in the past (Wang et al., 2017). The occurrence of harbor resonance may lead to the loss and accumulation of sediment in the bay, causing topographical changes. Conversely, Zones II, III and IV feature straight coasts, with open sea areas. The beaches in these zones are more susceptible to the impact of storm waves, which enhances the change in beach erosion and accretion. The type of beach profile also affects the response of the beach to wave and tide interactions. Masselink and Short (1993) classified beaches into three types, i.e., reflective, intermediate, and dissipative beaches, based on the dimensionless fall velocity (Ω) and the relative tidal range (RTR). More reflective beaches have stronger response to storm-induced erosion and accretion (Qi et al., 2010; Thuan et al., 2016). The beach profile in Zone III exhibits the steepest slope, with a highly reflective beach face. This beach indicates the strongest response to storm events. In addition, the wide and flat middle−lower part of the foreshore and bar in Zones II and IV could cause wave dissipation, effectively reducing the energy of the storm waves and minimizing the beach morphological change. Particularly in the southern region of the two zones, the beach exhibits an overall flat and wide morphology, with significant wave dissipation on the foreshore and minimal beach topography changes. Notably, the beach slope transitions rapidly from steep to flat in the middle sections of zones II and IV, with sediment moving downward from higher tide zones, and accumulating at the slope breaks of the profile.
As a common coastal combination type, beach-coral reef systems, formed by the interaction of coral reef coasts and adjacent beaches, play a critical role in shaping coastal dynamics (Shao et al., 2016). The extent of coral reef development is also an important factor affecting the evolution of the beach topography (Sheppard et al., 2005). Nearshore waves shoal on the fore-reef slope and then break on the slope or reef flats, where the wave energy behind the reefs is weakened by the frictional effect of the rough reef bottom (Vetter et al., 2010) and obstruction of the topography of the prominent reef (Shi et al., 2018). This effectively reduces the erosive impact of the waves on adjacent beaches. At the same time, coral reefs, interacting with surrounding rocky reefs, could also enhance the protection of the beach during storm events (Gong et al., 2017). The distribution of coral reefs and rocky reefs around Weizhou Island is uneven (Figure 13). In Zone I, coral reefs and rocky reefs are underdeveloped, rendering their impact on storm waves. The central and southern coasts of Zone II are the main areas of coral reefs and rocky reef development, including zones of massive coral growth and gorgonian coral growth. These extensive coral growth zones, which exist at depths of 1.8 m to 4.0 m and 4.0 m to 12.5 m, with widths of approximately 270 m to 290 m and 130 m to 230 m respectively, offer protective effects on the beaches, resulting in minimal topographical changes on the southern beach (He and Huang, 2019). In addition, on the north beach of Zone II, the beach from X1−X5 shifted from stable to erosion, as the large amount of coral reef debris gradually decreased from north to south in the backshore, leading to increased erosion. The coral and rocky reefs in Zone III are mainly distributed along the coast near the Xijiao dock, where they effectively mitigate the impact of storm waves and maintain the stability of the beach. The coastal coral reefs and rocky reefs in Zone IV are relatively well-developed. In the southeastern and northeastern parts of Weizhou Island, where include growth zones of massive corals, mixed zones of massive and stolonifera corals, and growth zones of gorgonians coral at waters depth of 0.8 m-6.3 m. The widths of these zones range from approximately 160 m to 200 m, 90 m to 200 m, and 110 m to 150 m, respectively (He and Huang, 2019). The well-developed coral and rocky reefs significantly reduce erosion caused by storm waves, providing substantial protection to the adjacent beaches.
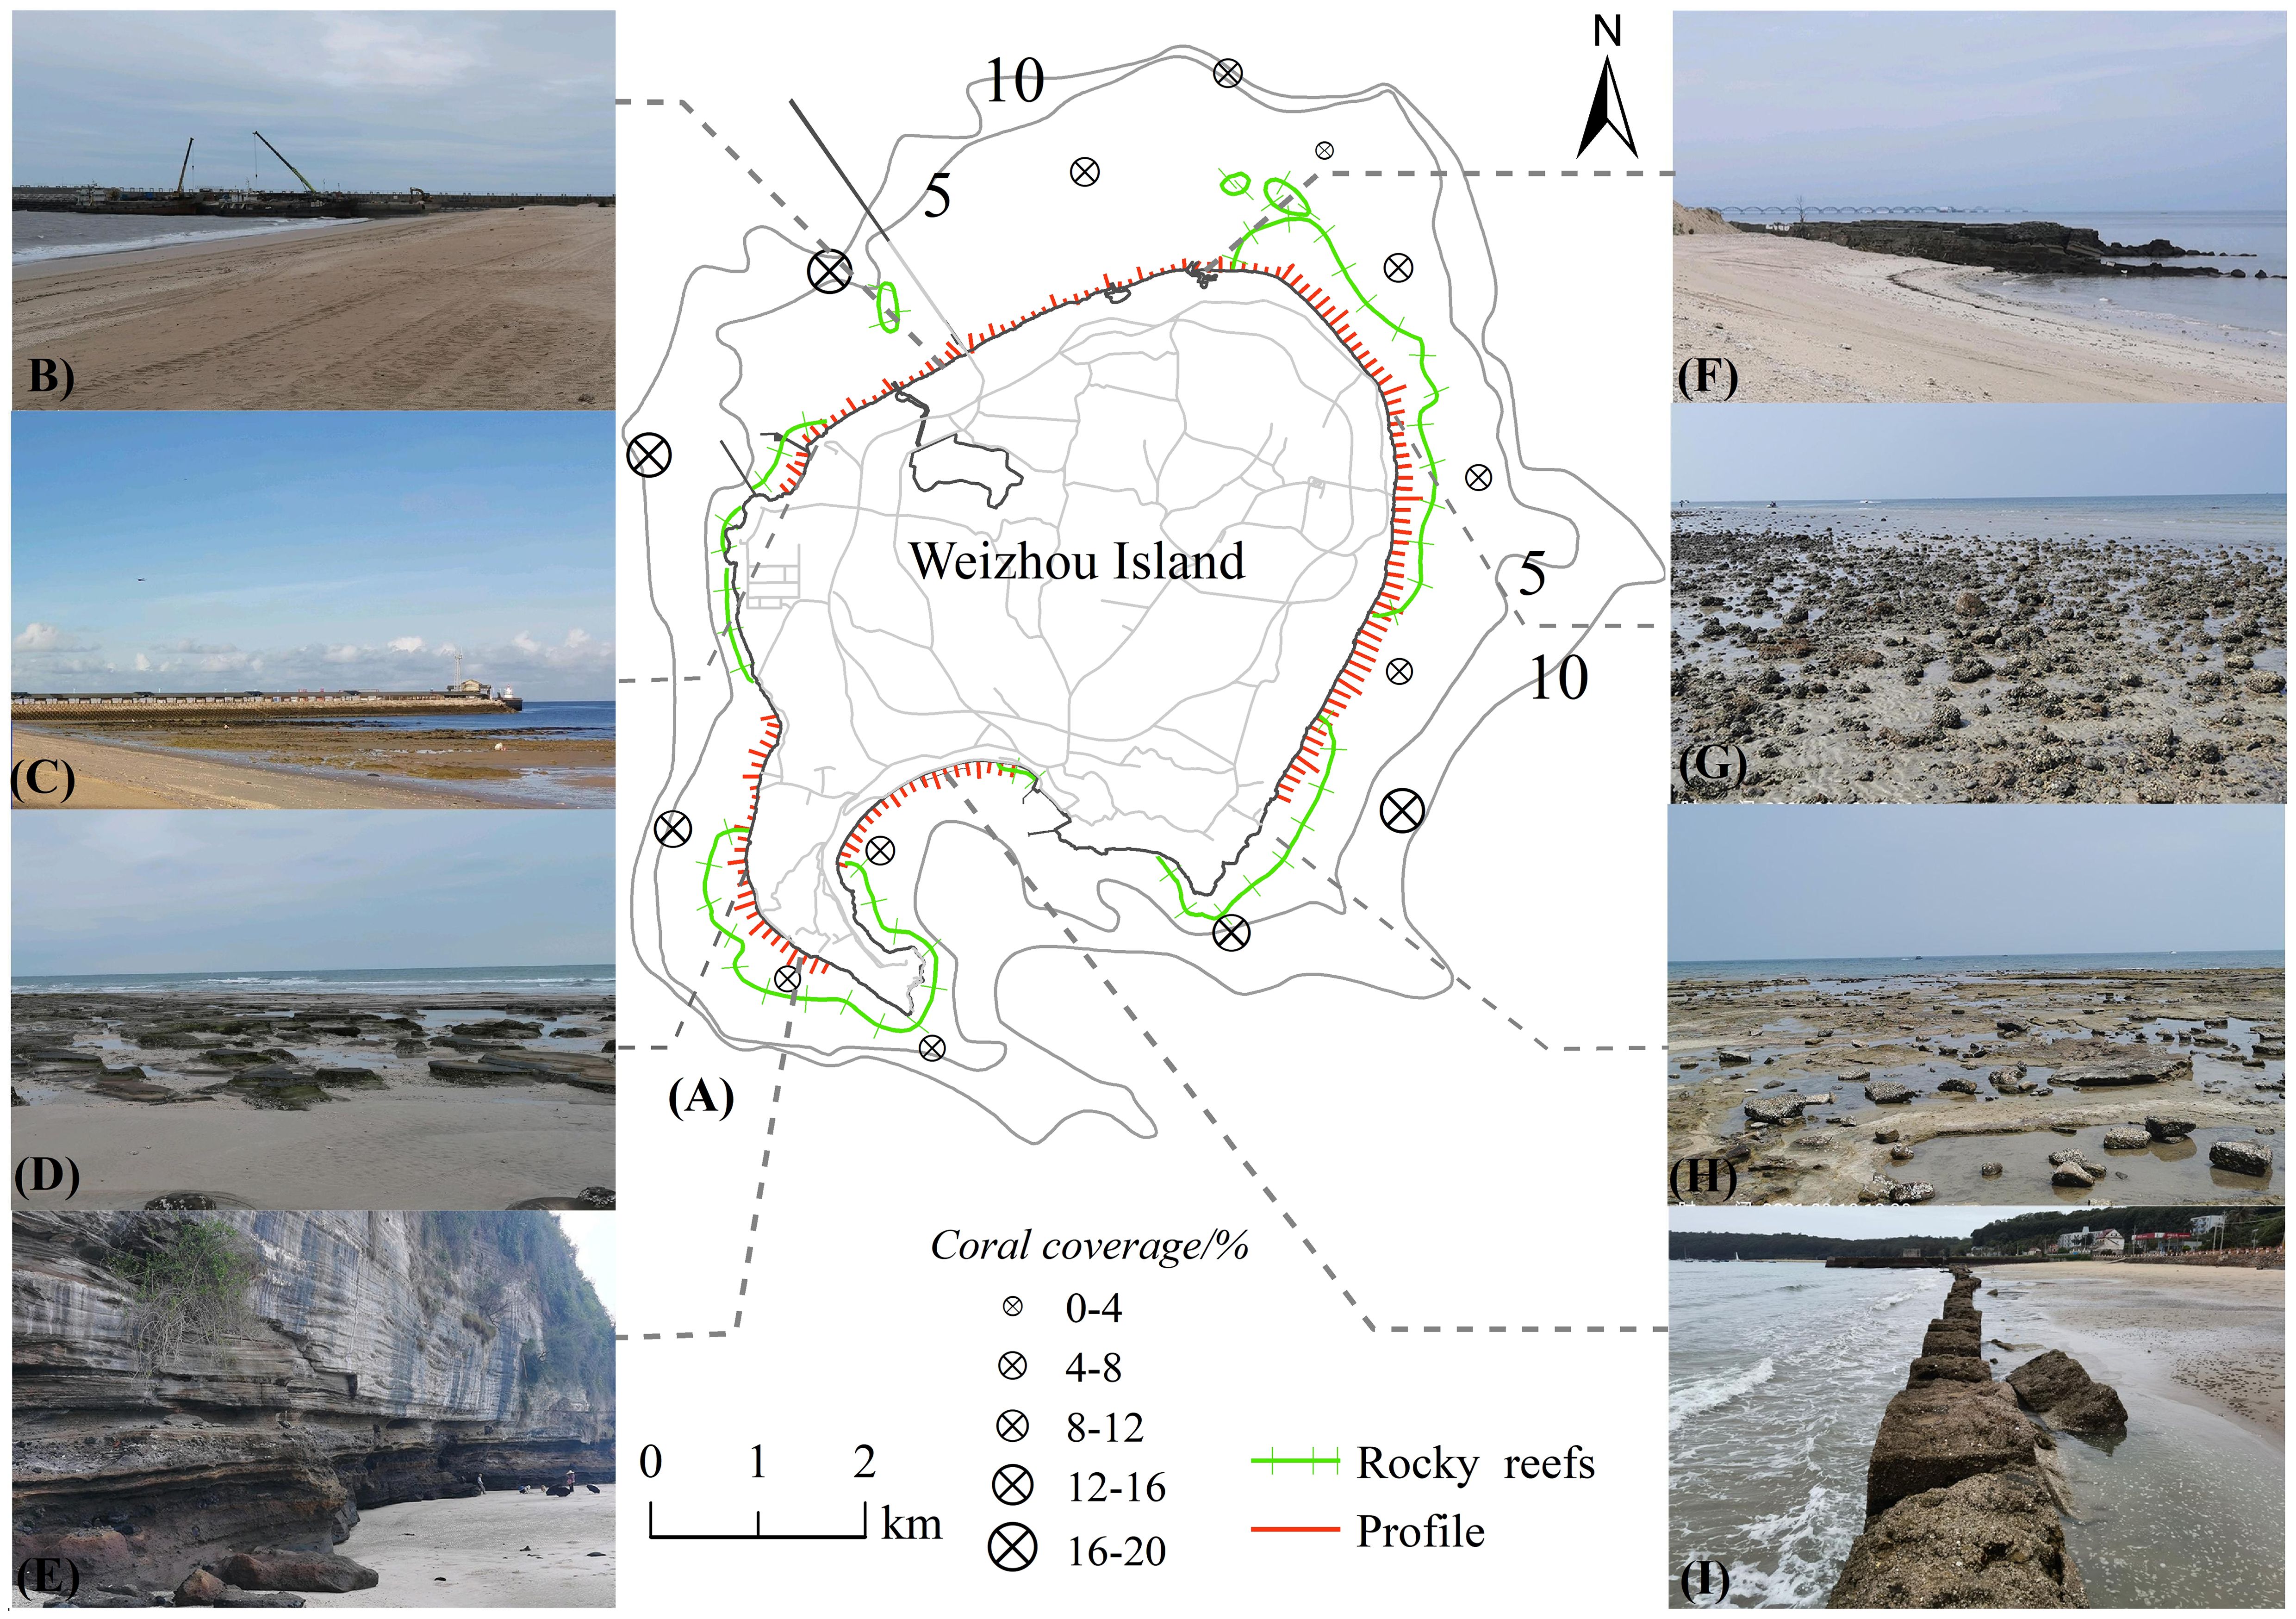
Figure 13. Distributions of coastal engineering, coastal cliff, and coral reefs on Weizhou Island (A), Blue Bridge (B), port (C, F), rocky reefs (D, G, H), cliff (E), seawall (I), (Draw based on admiralty chart and Yang et al., 2021).
The distribution of vegetation and dunes on the beach backshore plays a crucial role in stabilizing the beach (Silva et al., 2016). For example, profile X25 in this study was vulnerable to storm-induced erosion and lacked the capacity for subsequent recovery due to the existence of a rock cliff and the absence of protection from vegetation and sand dunes on the backshore.
Storms not only rapidly alter beach topography but also significantly impact sediment distribution through erosion and deposition processes. After the two storm events, the correlation between changes the average grain size change (ΔMz), sorting coefficient change (Δσ), skewness change (ΔSk), and kurtosis change (Δkg) of the beach in zones I to IV were relatively consistent, indicating a certain degree of interconnection in the changes of sediment parameters on Weizhou Island beaches. Meanwhile, differences were observed in the relationship UED and the average grain size change of the beach in zones I-IV. In Zone I, a positive correlation was found between UED and ΔMz of sediment, indicating that the magnitude of beach erosion and accretion influences the variation in sediment coarseness. However, in zones II-IV, no significant correlation was identified between UED and ΔMz, suggesting that the intensity of beach topography changes in these zones is not significantly related to sediment changes (Figure 14). This phenomenon may be related to the distribution of coral reef debris on the beach.
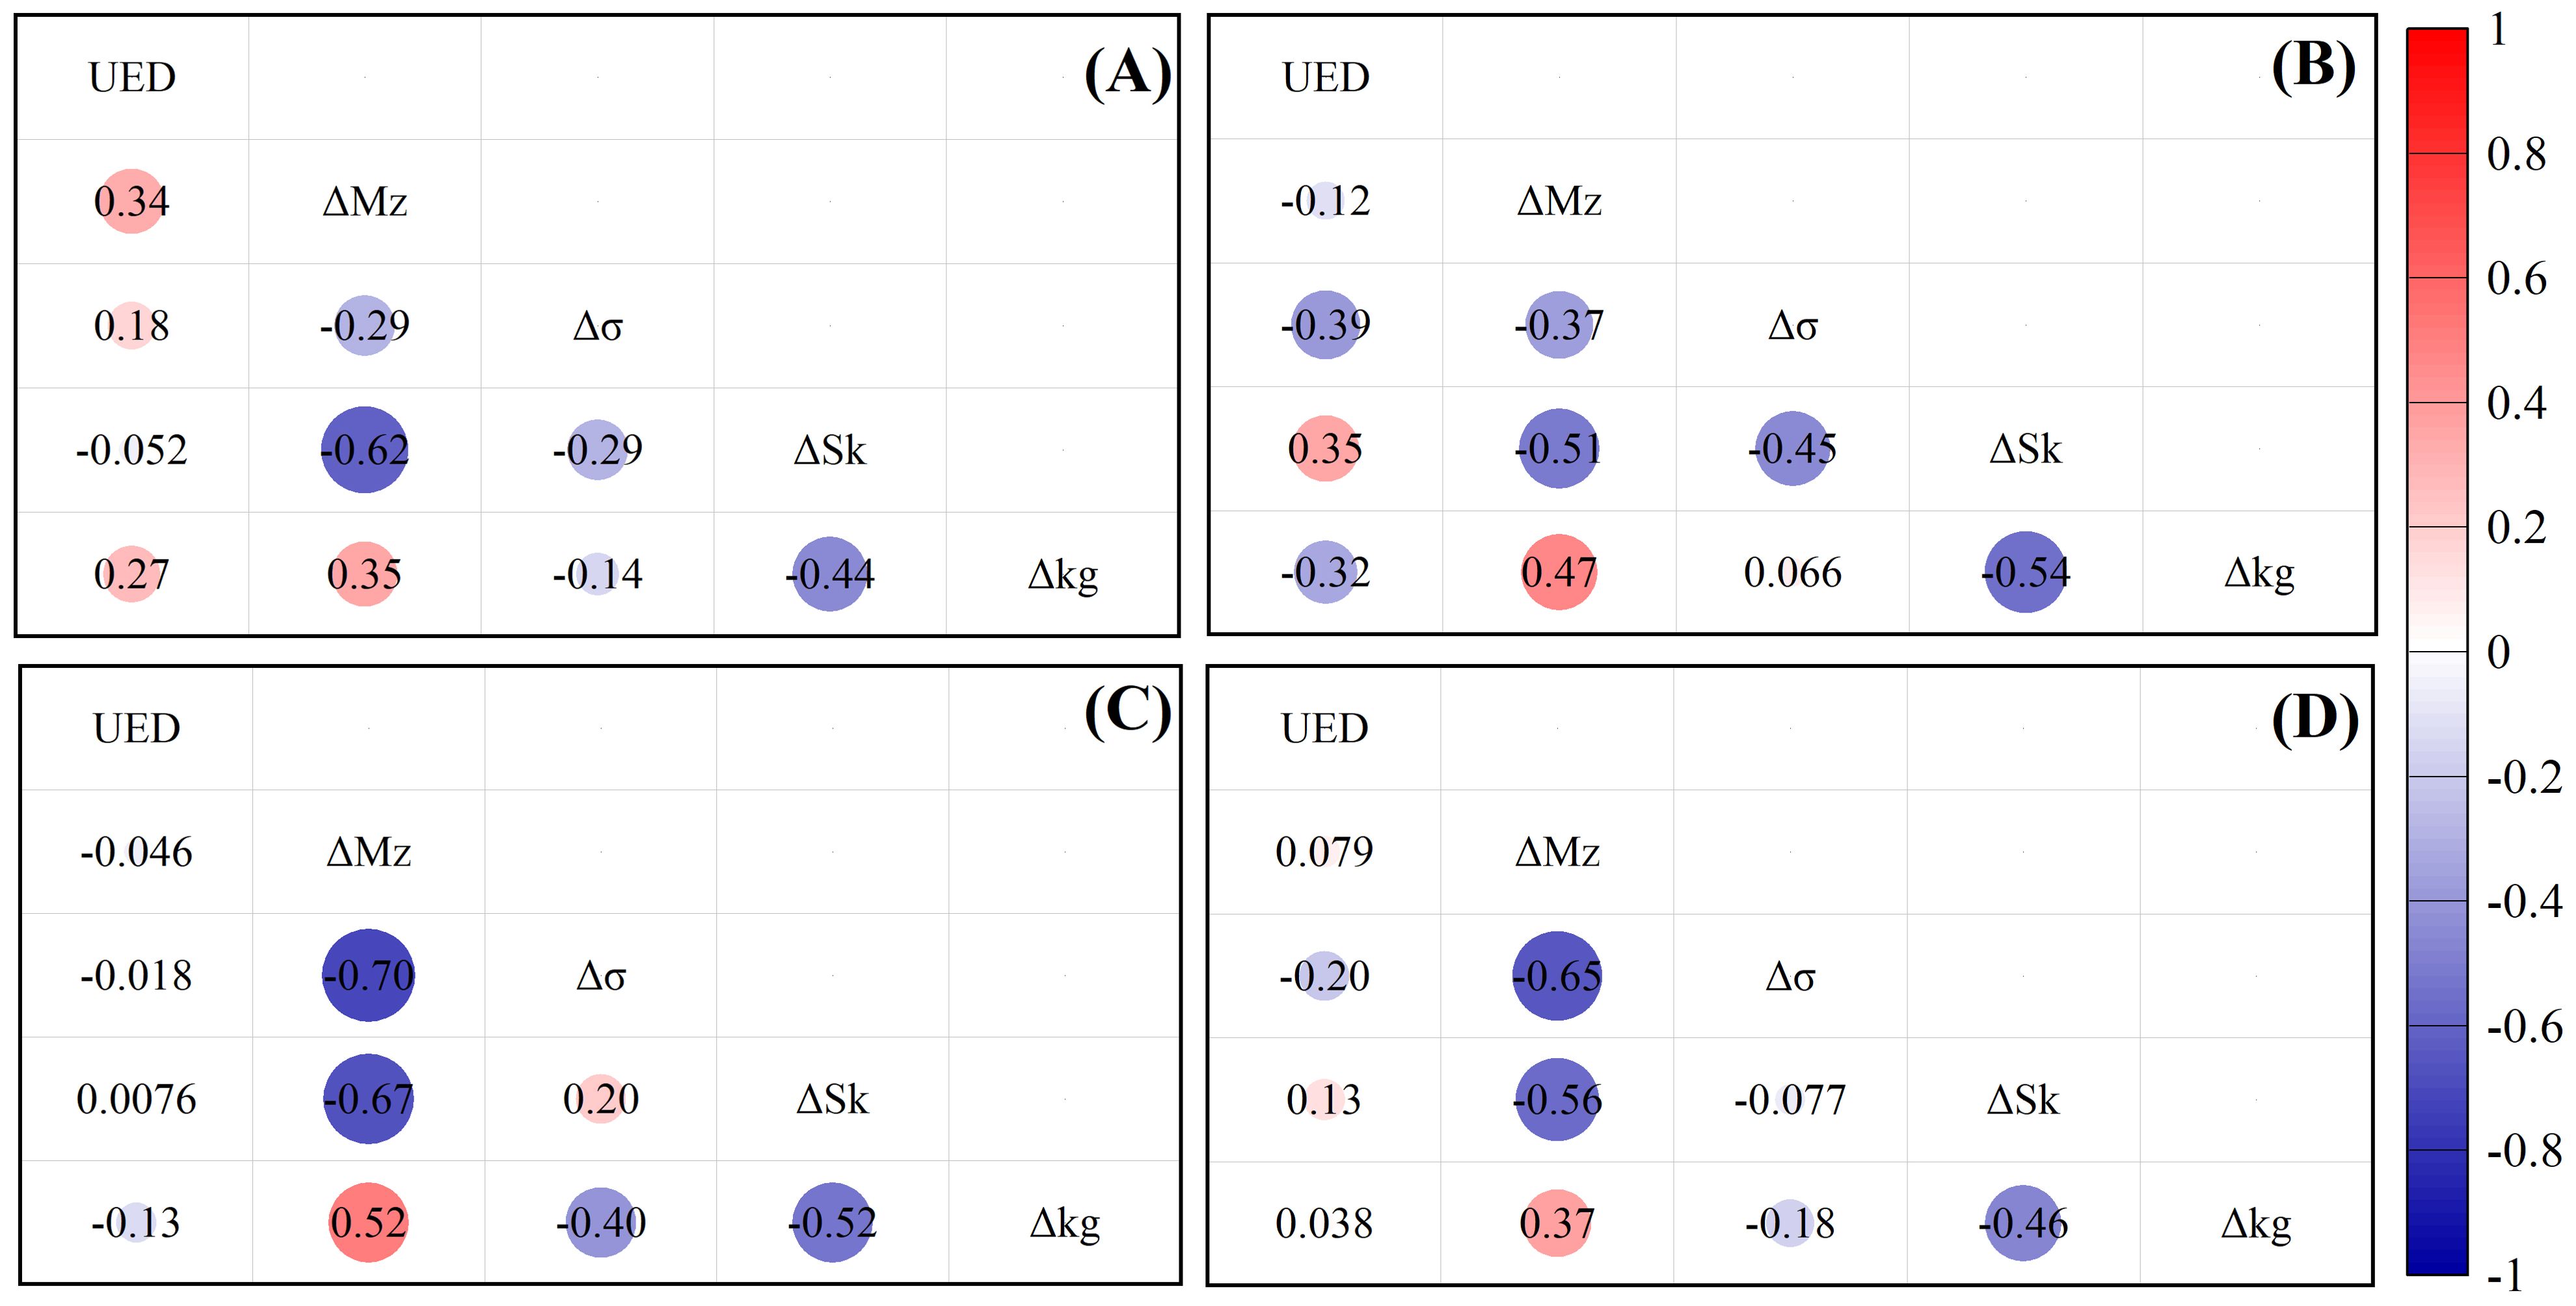
Figure 14. Correlation analysis of changes in topography and sediment parameters. Zone I (A); Zone II (B); Zone III (C); Zone IV (D).
Coral reef debris is a crucial source of beach sediments, significantly influencing the transport and distribution characteristics of these sediments depending on the development and distribution of coral reefs (Sheppard et al., 2005). After the storm event, a large number of coral debris appeared on the beaches in Zones II, III, and IV, whereas coral reef debris was lower present in Zone I (Figure 13). The coral reef debris in Zones II and IV gradually accumulates in the upper and middle parts of the beach foreshore. This accumulation exacerbated the erosion and accretion changes on the beach face and causing significant coarsening and poor sorting of the sediments in the upper and middle parts of the foreshore after the storm. In Zone III, the coverage of coral reefs along the southwestern coast is significantly higher than that along the northeastern coast, which may explain the difference in the sediment grain size in the middle−upper part of the foreshore on the east and west sides of the Blue Bridge.
5.3 Anthropogenic activities
Anthropogenic activity is an important factor influencing beach sedimentary geomorphology changes. Hard structures (such as seawalls, revetments, offshore breakwaters, etc.) have long been employed to prevent coastal erosion. While these structures may protect the coast in specific areas, they may also cause erosion in other parts of the coast (Nam et al., 2011; Qi et al., 2021). Different scales of human intervention on the coast of Weizhou Island contributed to the various accretion/erosion pattern across the beaches. In Zone I, the construction of a seawall (Figure 13I) narrowed the backshore of the beach and blocked sediment replenishment, making the beach more susceptible to erosion during storms. Additionally, the presence of a jetty and offshore breakwater on the east side of Zone I has altered the dynamics of wave interaction, reducing the degree of erosion and accretion by blocking incident waves. The offshore breakwater may also have submerged, forming a submerged bar that could generate eddy currents, leading to localized erosion, as observed in the N15 profile. In Zone III, docks and ports (Figures 13B, E, F) strongly influenced beach erosion and accretion before and after the storms. The formation of a small headland bay beach between two docks in the southwestern area of Zone III has provided effective protection against storm-induced erosion. Elsewhere in Zone III, the beaches were separated by several port revetments and bridges. These structures have a similar effect as a cluster of groins (Chang, 1997). Due to the relatively strong NNE waves, the beaches near the area downstream of the port were subjected to relatively strong erosion, which gradually diminishes to the southwest, resulting in the silting up of the beach in that direction.
6 Conclusion
This study investigated the response characteristics of the sedimentary geomorphology of Weizhou Island’s beaches to the consecutive typhoons Lionrock and Kompasu. Based on geographical location, structure distribution, beach topographic and geomorphic characteristics, and the distributions of rock and coral reefs, the beaches were divided into four sections: the South Bay section (Zone I), the section from Dishui Danping to Shiluokou (Zone II), the section from Zitongmu village to Mala Port (Zone III), and the section from Mala Port to Wanzai village (Zone IV). The main findings are as follows:
From a plane-view perspective, the degree of beach accretion in Zone I gradually decreased from west to east, while most areas in Zone III showed alternating patterns of erosion and accretion. Zones II and IV showed dramatic changes in the northern and middle coastal sections, whereas those in the southern coastal section were relatively stable. Regarding beach profile changes, the deformation areas of the Weizhou Island beach were mainly located in the beach berm and the middle and upper parts of the foreshore, with relatively minor variations observed in the backshore parts of the beach and lower part of the foreshore.
After the storms, the topographic deformation in Zone I was relatively small, rendering a stable beach. In Zones II and III, beaches were mainly eroded, whereas the beach in Zone IV was relatively silted. The intensity of beaches response to the storms was weakest in Zone I and strongest in Zone III, with Zones II and IV displaying similar response intensities. Except for the beach sediments in Zone I, which were mainly refined, sediments in other sections were mainly coarsened, especially those in the middle and upper parts of the foreshore.
Erosion and accretion of the Weizhou Island beaches were affected by both natural factors and anthropogenic activities. The beaches’ topographic and geomorphic characteristics, hydrodynamic changes, and the distribution of rock and coral reefs contributed to the varied responses to the storms. Additionally, human-made structures such as docks, seawalls, and ports altered hydrodynamic conditions and sediment transport, impacting beach erosion and accretion.
However, due to the short interval between the impacts of Typhoons Lionrock and Kompasu, coupled with adverse sea conditions and inconvenient transportation, on-site topographic and sediment data between the two storms were not available in this survey. The lack of data during the typhoons hindered the analysis of the individual impacts of each typhoon on the beaches, and their recovery processes. Consequently, this study could not fully elucidate the differences in beach evolution and the interaction between the two storm events.
This study highlights that coral reefs surrounding the islands can mitigate the effects of storms, providing the function of coastal protection and maintaining beach stability. Improper coastal engineering, however, may exacerbate coastal erosion. Therefore, attention should be paid to the protection of local coral reef ecosystems and the construction of reasonable coastal engineering to ensure the sustainable development and utilization of islands. It should be noted that harbors on islands may also affect coastal stability due to their location and coastal morphology, resulting from the harbor resonance phenomenon. Typhoon disaster early warning and forecasting often overlooked the amplification effect caused by harbor resonance, greatly underestimating the hazards of such waves.
Data availability statement
The original contributions presented in the study are included in the article/supplementary material. Further inquiries can be directed to the corresponding author.
Author contributions
DZ: Conceptualization, Data curation, Formal analysis, Investigation, Methodology, Visualization, Writing – original draft, Writing – review & editing. JG: Conceptualization, Methodology, Writing – review & editing. LS: Conceptualization, Data curation, Methodology, Project administration, Resources, Supervision, Writing – review & editing. WC: Conceptualization, Methodology, Writing – review & editing. CK: Investigation, Writing – review & editing. XX: Supervision, Writing – review & editing.
Funding
The author(s) declare financial support was received for the research, authorship, and/or publication of this article. The author(s) declare financial support was received for the research, authorship, and/or publication of this article. This research is supported by the National Key R&D Program of China, (No. 2022YFC3106200), the Scientific Research Foundation of the Forth Institute of Oceanography, Ministry of Natural Resources (202109), and the Zhejiang Provincial Natural Science Foundation of China (LHZ22D060001).
Acknowledgments
The authors would like to thank Zhaohui Gong, Zhen Zhang, Haoyuan Tan, Dezhi Chen and Lintao Zhao for their hard work in field surveys and sample handling.
Conflict of interest
The authors declare that the research was conducted in the absence of any commercial or financial relationships that could be construed as a potential conflict of interest.
Publisher’s note
All claims expressed in this article are solely those of the authors and do not necessarily represent those of their affiliated organizations, or those of the publisher, the editors and the reviewers. Any product that may be evaluated in this article, or claim that may be made by its manufacturer, is not guaranteed or endorsed by the publisher.
References
Abreu T., Parreño-Mas B., Pinto-Faria J. (2020). Coastal management risk analysis of an embayed beach in Majorca island. SN Appl. Sci. 2, 1–14. doi: 10.1007/s42452-020-03325-6
Anderson C. P., Carter G. A., Funderburk W. R. (2016). The use of aerial RGB imagery and LIDAR in comparing ecological habitats and geomorphic features on a natural versus man-made barrier island. Remote Sens. 8, 602. doi: 10.3390/rs8070602
Boccotti P. (2000). “Chapter 6 the wave climate,” in Wave mechanics for ocean engineering (Amsterdam: Elsevier), 183–206. doi: 10.1016/S0422-9894(00)80032-X
Cai F., Lei G., Su X., Peng J. (2006). Study on process response of Fujian beach geomorphology to typhoon Aere. Ocean Eng. 24, 98–109. doi: 10.16483/j.issn.1005-9865.2006.01.016
Cai F., Su X., Cao C., Lei G., Liu J., Qi H., et al. (2019). Coastal erosion vulnerability assessment and demonstration in China. (Beijing: China Ocean Press), 11–17.
Chang R. (1997). Coastal engineering environment (Qingdao: Ocean University of Qingdao Press), 220–224.
Chen B., Dong D., Chen X., Ding Y., Zheng B., Qiu S. (2017). A research on fluctuations of water level in Guangxi coast caused by typhoons in the Northern South China Sea. Trans. Oceanol. Limnol. 2, 1–11. doi: 10.13984/j.cnki.cn37-1141.2017.02.001
Choi J., Roh M., Kim Y. T. (2016). A Laboratory Experiment on beach profile evolution induced by two wave conditions dominated in the Haeundae Coast of Korea. J. Coast. Res. 75, 1327–1331. doi: 10.2112/SI75-266.1
Coco G., Senechal N., Rejas A., Bryan K. R., Capo S., Parisot J. P., et al. (2014). Beach response to a sequence of extreme storms. Geomorphology 204, 493–501. doi: 10.1016/j.geomorph.2013.08.028
Cooper J. A. G., Jackson D. W. T., Navas F., McKenna J., Malvarez G. (2004). Identifying storm impacts on an embayed, high-energy coastline: examples from western Ireland. Mar. Geol. 210, 261–280. doi: 10.1016/j.margeo.2004.05.012
Dai Z., Chen Z., Zhang Q. (2001). An analysis on temporal variation process of a wave-dominated beach profile between headlands. Trop. Geogr. 21, 266–269. doi: 10.3969/j.issn.1001-5221.2001.03.016
Dissanayake P., Brown J., Wisse P., Karunarathna H. (2015). Comparison of storm cluster vs isolated event impacts on beach/dune morphodynamics. Estuarine Coast. Shelf Sci. 164, 301–312. doi: 10.1016/j.ecss.2015.07.040
Folk R. L., Ward W. C. (1957). Brazos river bar [Texas]: A study in the significance of grain size parameters. J. Sediment. Res. 27, 3–26. doi: 10.1306/74D70646-2B21-11D7-8648000102C1865D
Gong H., Chen S., Zhong X., Chen Q., Hu J., Cheng W. (2017). Complicated responses of beach erosion and restoration to consecutive typhoons along northeastern Hainan Island, China. Haiyang Xuebao 39, 68–77. doi: 10.3969/j.issn.0253-4193.2017.05.007
Guo J., Shi L., Chen S., Castelle B., Chang Y., Cheng W. (2021). Sand-mud transition dynamics at embayed beaches during a typhoon season in eastern China. Mar. Geol. 441, 106633. doi: 10.1016/j.margeo.2021.106633
Guo J., Shi L., Chen S., Ye Q. (2019). Response of Dongsha beach in Zhoushan to continuous storms based on Argus images. Oceanol. Limnol. Sin. 50, 728–739. doi: 10.11693/hyhz20181200285
Guo J., Shi L., Pan S., Ye Q., Cheng W., Chang Y., et al. (2020). Monitoring and evaluation of sand nourishments on an embayed beach exposed to frequent storms in eastern China. Ocean Coast. Manage. 195, 105284. doi: 10.1016/j.ocecoaman.2020.105284
Guo J., Shi L., Tong X., Zheng Y., Xu D. (2018). The response to tropical storm Nakri and the restoration of Dongsha Beach in Zhujiajian Island, Zhejiang Province. Haiyang Xuebao 40, 137–147. doi: 10.3969/j.issn.0253-4193.2018.09.012
Harter C., Figlus J. (2017). Numerical modeling of the morphodynamic response of a low-lying barrier island beach and foredune system inundated during Hurricane Ike using XBeach and CSHORE. Coast. Eng. 120, 64–74. doi: 10.1016/j.coastaleng.2016.11.005
He J., Huang Z. (2019). The distribution of corals in weizhou island, guangxi. Ocean Dev. Manage. 1, 57–62. doi: 10.20016/j.cnki.hykfygl.2019.01.011
Huang Z., Dai Z., Li S., Huang H., Feng B. (2021a). Erosion and accretion of a meso-macro-tidal beach profile— A case from the Yintan beach of Beihai. Mar. Geol. Quat. Geol. 41, 36–47. doi: 10.16562/j.cnki.0256-1492.2020081702
Huang Z., Zhang C., Shen Y., Shaocai J. (2021b). Analysis of the climatic characteristics of wind and wave in Weizhou Island sea area. Mar. Forecasts 38, 62–68. doi: 10.11737/j.issn.1003-0239.2021.02.007
Jeanson M., Anthony E. J., Dolique F., Aubry A. (2013). Wave characteristics and morphological variations of pocket beaches in a coral reef–lagoon setting, Mayotte Island, Indian Ocean. Geomorphology 182, 190–209. doi: 10.1016/j.geomorph.2012.11.013
Karunarathna H., Pender D., Ranasinghe R., Short A. D., Reeve D. E. (2014). The effects of storm clustering on beach profile variability. Mar. Geol. 348, 103–112. doi: 10.1016/j.margeo.2013.12.007
Komar P. D. (1976). Beach processes and sedimentation. Prentice Hall Inc. New Jersey pp, 36–1592. doi: 10.5860/choice
Komi A., Petropoulos A., Evelpidou N., Poulos S., Kapsimalis V. (2022). Coastal vulnerability assessment for future sea level rise and a comparative study of two pocket beaches in seasonal scale, Ios Island, Cyclades, Greece. J. Mar. Sci. Eng. 10, 1673. doi: 10.3390/jmse10111673
Li C., Wang F. (2004). Holocene volcanic effusion in Weizhou Island and its geological significance. Miner. Petrol 4, 28–34. doi: 10.3969/j.issn.1001-6872.2004.04.005
Li M., Wu S., Liu Q., Dong J. (2015). Impacts of storm surge and spring tide on the beach erosion of the southwestern Weizhou Island,Guangxi Province. Haiyang Xuebao 37, 126–137. doi: 10.3969/j.issn.0253-4193.2015.09.013
Liu G., Cai F., Qi H. S., Liu J. H., Cao C., Zhao S. H., et al. (2024). Decadal evolution of a sandy beach adjacent to a river mouth under natural drivers and human impacts. Front. Mar. Sci. 11. doi: 10.3389/fmars.2024.1384780
Luijendijk A., Hagenaars G., Ranasinghe R., Baart F., Donchyts G., Aarninkhof S. (2018). The state of the world's beaches. Sci. Rep. 8, 1–11. doi: 10.1038/s41598-018-24630-6
Ma B., Dai Z., Pang W., Ge Z., Li S., Mei X., et al. (2019). Dramatic typhoon-induced variability in the grain size characteristics of sediments at a meso-macrotidal beach. Cont. Shelf Res. 191, 104006. doi: 10.1016/j.csr.2019.104006
Masselink G., Scott T., Poate T., Russell P., Conley D. (2015). The extreme 2013/2014 winter storms: hydrodynamic forcing and coastal response along the southwest coast of England. Earth Surf. Process. Landf. 41, 378–391. doi: 10.1002/esp.3836
Masselink G., Short A. D. (1993). The effect of tide range on beach morphodynamics and morphology: a conceptual beach model. J. Coast. Res. 9, 785–800. doi: 10.2307/4298129
Molinaroli E., Peschiutta M., Rizzetto F. (2023). Long-term evolution of an urban barrier island: the case of venice lido (Northern adriatic sea, Italy). Water 15, 1927. doi: 10.3390/w15101927
Nam P. T., Larson M., Hanson H., Hoan L. X. (2011). A numerical model of beach morphological evolution due to waves and currents in the vicinity of coastal structures. Coast. Eng. 58, 863–876. doi: 10.1016/j.coastaleng.2011.05.006
Qi F., Li G., Sun Y., Liang W., Du J. (2003). Basic geomorphologic features of the weizhou island of the beibu bay. Adv. Mar. Sci. 21, 41–50. doi: 10.3969/j.issn.1671-6647.2003.01.005
Qi H., Cai F., Lei G., Cao H., Shi F. (2010). The response of three main beach types to tropical storms in South China. Mar. Geol. 275, 244–254. doi: 10.1016/j.margeo.2010.06.005
Qi H., Liu G., Cai F., Zhu J., Liu J., Lei G., et al. (2021). Development trend and prospect of beach nourishment technology. J. Appl. Oceanogr. 40, 111–125. doi: 10.3969/J.ISSN.2095-4972.2021.01.012
Schmelz W. J., Psuty N. P. (2022). Application of geomorphological maps and LiDAR to volumetrically measure coastal geomorphological change from Hurricane Sandy at Fire Island National Seashore. Geomorphology 408, 108262. doi: 10.1016/j.geomorph.2022.108262
Senechal N., Coco G., Castelle B., Marieu V. (2015). Storm impact on the seasonal shoreline dynamics of a meso- to macrotidal open sandy beach (Biscarrosse, France). Geomorphology 228, 448–461. doi: 10.1016/j.geomorph.2014.09.025
Shao C., Qi H., Cai F., Chen S. (2016). Study on storm-effects on beach-coral reef system ——Taking the response of Qinglangang Coast on No.1409. Haiyang Xuebao 38, 121–130. doi: 10.3939/j.issn.0253-4193.2016.02.012
Sheppard C., Dixon D. J., Gourlay M., Sheppard A., Payet R. (2005). Coral mortality increases wave energy reaching shores protected by reef flats: Examples from the Seychelles. Estuarine Coast. Shelf Sci. 64, 223–234. doi: 10.1016/j.ecss.2005.02.016
Shi J., Zhang C., Zheng J., Tong C., Wang P., Chen S. (2018). Modelling wave breaking across coral reefs using a non-hydrostatic model. J. Coast. Res. 85, 501–505. doi: 10.2112/SI85-101.1
Short A. D. (1987). A note on the controls of beach type and change, with S.E. Australian examples. J. Coast. Res. 3, 387–395. Available at: http://www.jstor.org/stable/4297313.
Silva R., Martínez M. L., Odériz I., Mendoza E., Feagin R. A. (2016). Response of vegetated dune–beach systems to storm conditions. Coast. Eng. 109, 53–62. doi: 10.1016/j.coastaleng.2015.12.007
Thuan D. H., Binh L. T., Viet N. T., Hanh D. K., Almar R., Marchesiello P. (2016). Typhoon impact and recovery from continuous video monitoring: a case study from nha trang beach, Vietnam. J. Coast. Res. 75, 263–267. doi: 10.2112/SI75-053
U. S. Army Corps of Engineers (1984). Shore protection manual. (Vicksburg: Coastal Engineering Research Center).
Vetter O., Becker J. M., Merrifield M. A., Pequignet A. C., Aucan J., Boc S. J., et al. (2010). Wave setup over a Pacific Island fringing reef. J. Geophys. Res. C: Oceans 115, C12066. doi: 10.1029/2010JC006455
Vousdoukas M. I., Ranasinghe R., Mentaschi L., Plomaritis T. A., Athanasiou P., Luijendijk A. (2020). Sandy coastlines under threat of erosional. Nat. Clim. Change 10, 260–263. doi: 10.1038/s41558-020-0697-0
Wang G., Gao J., Wang P., Zhenj J., Dong G. (2017). Review on harbor resonance. Haiyang Xuebao. 39, 1–13. doi: 10.3969/i.issn.0253-4193.2017.11.001
Wang G., Stanis Z. E. G., Fu D., Zhang J., Gao J. (2020). An analytical investigation of oscillations within a circular harbor over a Conical Island. Ocean Eng. 195, 106711. doi: 10.1016/j.oceaneng.2019.106711
Yang Z., Zhang J., Lu X., Zheng Y., Jiang G., Shi X., et al. (2021). The ecological succession of scleratinian coral communities and their environmental factors in Weizhou Island. Acta Ecol. Sin. 41, 7168–7179. doi: 10.5864/stxb2020061015
Yao Z. (2014). Coastal erosion research of weizhou island in beihai, guangxi province (Qindao, China: The First Institute of Oceanography, Ministry of Natural Resources of China).
Yao Z., Gao W., Gao S., Liu L., Li P., Li P. (2013). Coastal erosion of the weizhou island in beihai, guangxi province. Coast. Eng. 32, 31–40. doi: 10.3969/j.issn.1002-3682.2013.04.005
Yu F., Switzer A. D., An Y., Yeung H., Pile P. J. (2013). A comparison of the post-storm recovery of two sandy beaches on Hong Kong Island, southern China. Quat. Int. 304, 163–175. doi: 10.1016/j.quaint.2013.04.002
Zeng C., Zhu S., Li Z., Chen D., Zhang H. (2020). High-frequency in situ measurements of beach responses to Tropical Storm Bebinca at Qing'an Bay, Guangdong Province, China. Reg. Stud. Mar. Sci. 36, 101285. doi: 10.1016/j.rsma.2020.101285
Keywords: meso-macro tidal beach, consecutive storms, beach profile, sediment transport, coral reef, weizhou island
Citation: Zhang D, Guo J, Shi L, Chen W, Kuang C and Xia X (2024) Non-uniform cumulative responses of beach sedimentary geomorphology to consecutive storms around a meso-macro tidal island. Front. Mar. Sci. 11:1495918. doi: 10.3389/fmars.2024.1495918
Received: 13 September 2024; Accepted: 04 November 2024;
Published: 22 November 2024.
Edited by:
Li Li, Zhejiang University, ChinaReviewed by:
Junliang Gao, Jiangsu University of Science and Technology, ChinaYi Pan, Hohai University, China
Copyright © 2024 Zhang, Guo, Shi, Chen, Kuang and Xia. This is an open-access article distributed under the terms of the Creative Commons Attribution License (CC BY). The use, distribution or reproduction in other forums is permitted, provided the original author(s) and the copyright owner(s) are credited and that the original publication in this journal is cited, in accordance with accepted academic practice. No use, distribution or reproduction is permitted which does not comply with these terms.
*Correspondence: Lianqiang Shi, bHFzaGlAc2lvLm9yZy5jbg==; Wei Chen, d2VpLmNoZW5AaGVyZW9uLmRl
 Daheng Zhang
 Junli Guo
 Lianqiang Shi
 Wei Chen
 Cuiping Kuang
 Xiaoming Xia1,3