- Institute of Coastal Research, Ludong University, Yantai, China
The Modern Yellow River Delta has a rich history of geomorphological transformations shaped by frequent avulsions and rapid progradation. However, the delta entered a phase of altered morphodynamics following the construction of the Xiaolangdi Reservoir, which fundamentally restructured sediment transport regimes and seasonal hydrological patterns. These changes have amplified challenges in predicting long-term deltaic evolution under evolving boundary conditions. The Qingshuigou Subaqueous Delta, as a major depositional zone, provides a compelling lens to examine these morphodynamic processes. However, seasonal variations in riverine sand transport fluxes driven by the water-sand regulation scheme that accompanied the construction of the Xiaolangdi Reservoir and its impact on the evolution of the delta front are particularly understudied. This study developed a simplified long-term morphodynamic model of the Qingshuigou Subaqueous Delta to investigate its response to riverine water and sediment discharges from 1997 to 2007. The findings are as follows: (1) The morphological evolution of the Qingshuigou Subaqueous delta has gradually changed from the pattern of “leading edge deposition and localized near-shore erosion” before the construction of the Xiaolangdi Reservoir to the pattern of “enhanced leading edge deposition and increased near-shore erosion” after the construction. (2) The construction of Xiaolangdi Reservoir has weakened the spatial distribution of the erosion process to a certain extent, changing the spatial distribution dominated by the erosion process (63.8% of area) before the construction to the spatial distribution dominated by the accretion process (More than 50% of area) after the construction. (3) The spatial and temporal variability of the incoming sediments leads to a significant coarsening of the grain size of the tidal flats in the southern part of the abandoned delta, which in turn maintains a relatively steady state of the shoreline variability. In contrast, the abandoned sand spit experiences severe erosion and depositional fluctuations due to intensified wave action. (4) The study emphasizes the importance of considering seasonal variations in unsteady discharge in modeling the long-term evolution of the delta. It provides new insights into the spatial and temporal differentiation of the geomorphic equilibrium of the Yellow River Delta and contributes to a broader understanding of delta evolution.
1 Introduction
The morphological changes in the Yellow River Delta at different spatial and temporal scales are jointly influenced by factors such as rivers, ocean dynamics, sudden climate changes and human activities. Among them, the change in the flow of water-sediment to the sea caused by the construction of dams in the watershed is an important reason affecting the evolution of the morphology of the delta (Nienhuis et al., 2020). In July 2002, the Yellow River Conservancy Commission conducted the first water-sediment regulation scheme, with Xiaolangdi Reservoir as the main reservoir, combined with Sanmenxia and Wanjiazhai Reservoirs to create artificial flood peaks, scouring the downstream river channel, transporting a large amount of water-sediment into the sea within a short period of time, and altering the Yellow River into the sea water-sediment flux, the process of sedimentation with the power of estuaries and their neighboring sea areas (Wang et al., 2017a). At the same time, its geomorphologic dynamics are significantly influenced by the complex ocean hydrodynamics (Gao et al., 2020, Gao et al., 2021; Shi et al., 2023; Gao et al., 2024).
At present, different scholars have carried out a large number of observation and modeling experimental studies on different spatial and temporal evolution processes in the Yellow River Delta. The generalized physical model established through the circulation flume found that the planar morphology of the river channel in the coccyx will go through a process of “stability - micro-variation - strong change” (Bai et al., 2024), and the analysis of remote sensing images and measured data found that the geomorphological evolution of the underwater delta has changed from net accretion to net erosion since 2000. erosion from 2000 (Fu et al., 2021). In order to reproduce the geomorphological evolution and sediment transport in the Yellow River Delta, numerical modeling based on physical processes has become one of the main research tools (Geleynse et al., 2011). By quantifying the source-sink fluxes of sediment transport below Lijin in the Yellow River under the new inflow of seawater and sand (2002-2016), and calculating the proportion of the residual fluxes of sediment in each typical cross section under the normal flow of 500 m3/s for the whole year, it is found that: 28.40% of the total sediment flux into the sea is transported to the direction of Laizhou Bay, 5.88% of the sediment is transported to the east to the outer sea, and 5.22% of the sediment is transported to the north; through the establishment of Delft3D numerical modeling, it is found that the erosion and accretion changes in the coastal area of the Yellow River estuary are mainly controlled by the asymmetry of spatial distribution of the flow rate of the high tide and the low tide after 2002 (Ji, 2021). In addition, by studying the short-term morphological response of the Yellow River Delta to 10 water-sediment regulation events, it was found that 51.3%, 19.7% and 17.8% of the riverine sediments were deposited in the delta frontal margins, the onshore delta and the former delta, respectively (Wu et al., 2023). The above study concluded that the evolution of geomorphic morphology is correlated with the amount of incoming seawater sand or the asymmetry of high and low tides, which is instructive for the main body of research in this paper. However, limited by the comprehensiveness of the data used, the findings of the former were concluded by simplifying to constant flow without considering the impact of unsteady discharge changes on sediment transport and geomorphic evolution, while the findings of the latter were limited to the impact of short-term water and sand transfer events on geomorphology, and sparsely analyzed the sedimentary characteristics of tidal flats. At the same time, the above studies did not analyze the geomorphological evolution in the ten-year time scale in depth. Therefore, it is necessary to conduct a systematic study on the spatial and temporal evolution of the geomorphology of the Yellow River Qingshuigou sub-delta at a decadal time scale under the changes of the inlet sand flood season (May-October) and the dry season (November-April) from the perspective of numerical simulation.
In recent years, the topography and ecosystem of the abandoned Qingshuigou sub-delta have undergone changes to varying degrees. The shoreline exhibits an overall landward erosion retreat state, with a decreasing erosion rate (Liu et al., 2022). And the current estuary sand spit shoreline changes in accretion and erosion coexist, the overall presentation of the seaward silt into (Zhan et al., 2020). The Yellow River delta has been eroded since 1997, and after the 1997 flood to the 2007 flood, most of the years, the river channel silt forward, the river oscillation is small, the river is relatively stable, the current estuary mouth in 2007 from the northeast to the north (Zheng et al., 2017), the stage for the understanding of geomorphological changes in the delta to provide the natural conditions, so this paper selects the entire 1997-2007 period of the Qingshuigou sub-delta as the research object, the study area includes the Gudong seawall to Song Chunrong ditch.
The primary research objectives of this paper are as follows:
1. To examine the changes of erosion and accretion in the Yellow River Qingshuigou Subaqueous Delta from 1997 to 2007 in the context of water and sand regulation scheme.
2. To investigate the alterations in sediment distribution characteristics from 1997 to 2007 in the context of water and sand regulation scheme. In order to achieve the above research objectives, this study analyzed the adjustment and evolution of morphological patterns, the erosion process of abandoned sand spits, and the distribution characteristics of sediments in the sea under a unsteady scenario by developing a morphodynamic model. This was achieved by combining remotely sensed image data with measured data adjusted to appropriate numerical parameters and by combining them with the above model. The findings of this study are beneficial for the reconstruction of paleoclimatic conditions and the formulation of effective local policies, resource management strategies, and ecological protection strategies.
2 Study area
The Yellow River enters the sea from Dongying City, Shandong Province, China, forming the vast Yellow River Delta Plain (Figure 1), which is situated within the temperate monsoon climate zone. The most recent natural diversion of the Yellow River occurred in 1976, from Diaokou to Qingshuigou. Prior to the artificial diversion of the Yellow River in 1996, the general direction of accretion at the sand spit was south-eastward. However, the construction of the diversion project led to the abandonment of the original estuary. The hydrodynamic environment in this area is complex, comprising tides, waves, and currents, with an average current speed of 0.5–0.9 m/s. The average tidal range is 1-1.2 m, influenced by the semi-diurnal tides of Laizhou Bay. However, the tidal range can reach over 4 m during a storm surge (Fan et al., 2018; Fu et al., 2021; Wang et al., 2022). Surface sediments on the seabed of the Yellow River Delta are mainly composed of chalk and clay, with obvious spatial variability. The average content of clay in the surface sediments of the tidal flats of the Qingshuigou sub-delta is 7.25%, the average content of chalk is 81.18%, and the average content of the sand component is 11.56%.
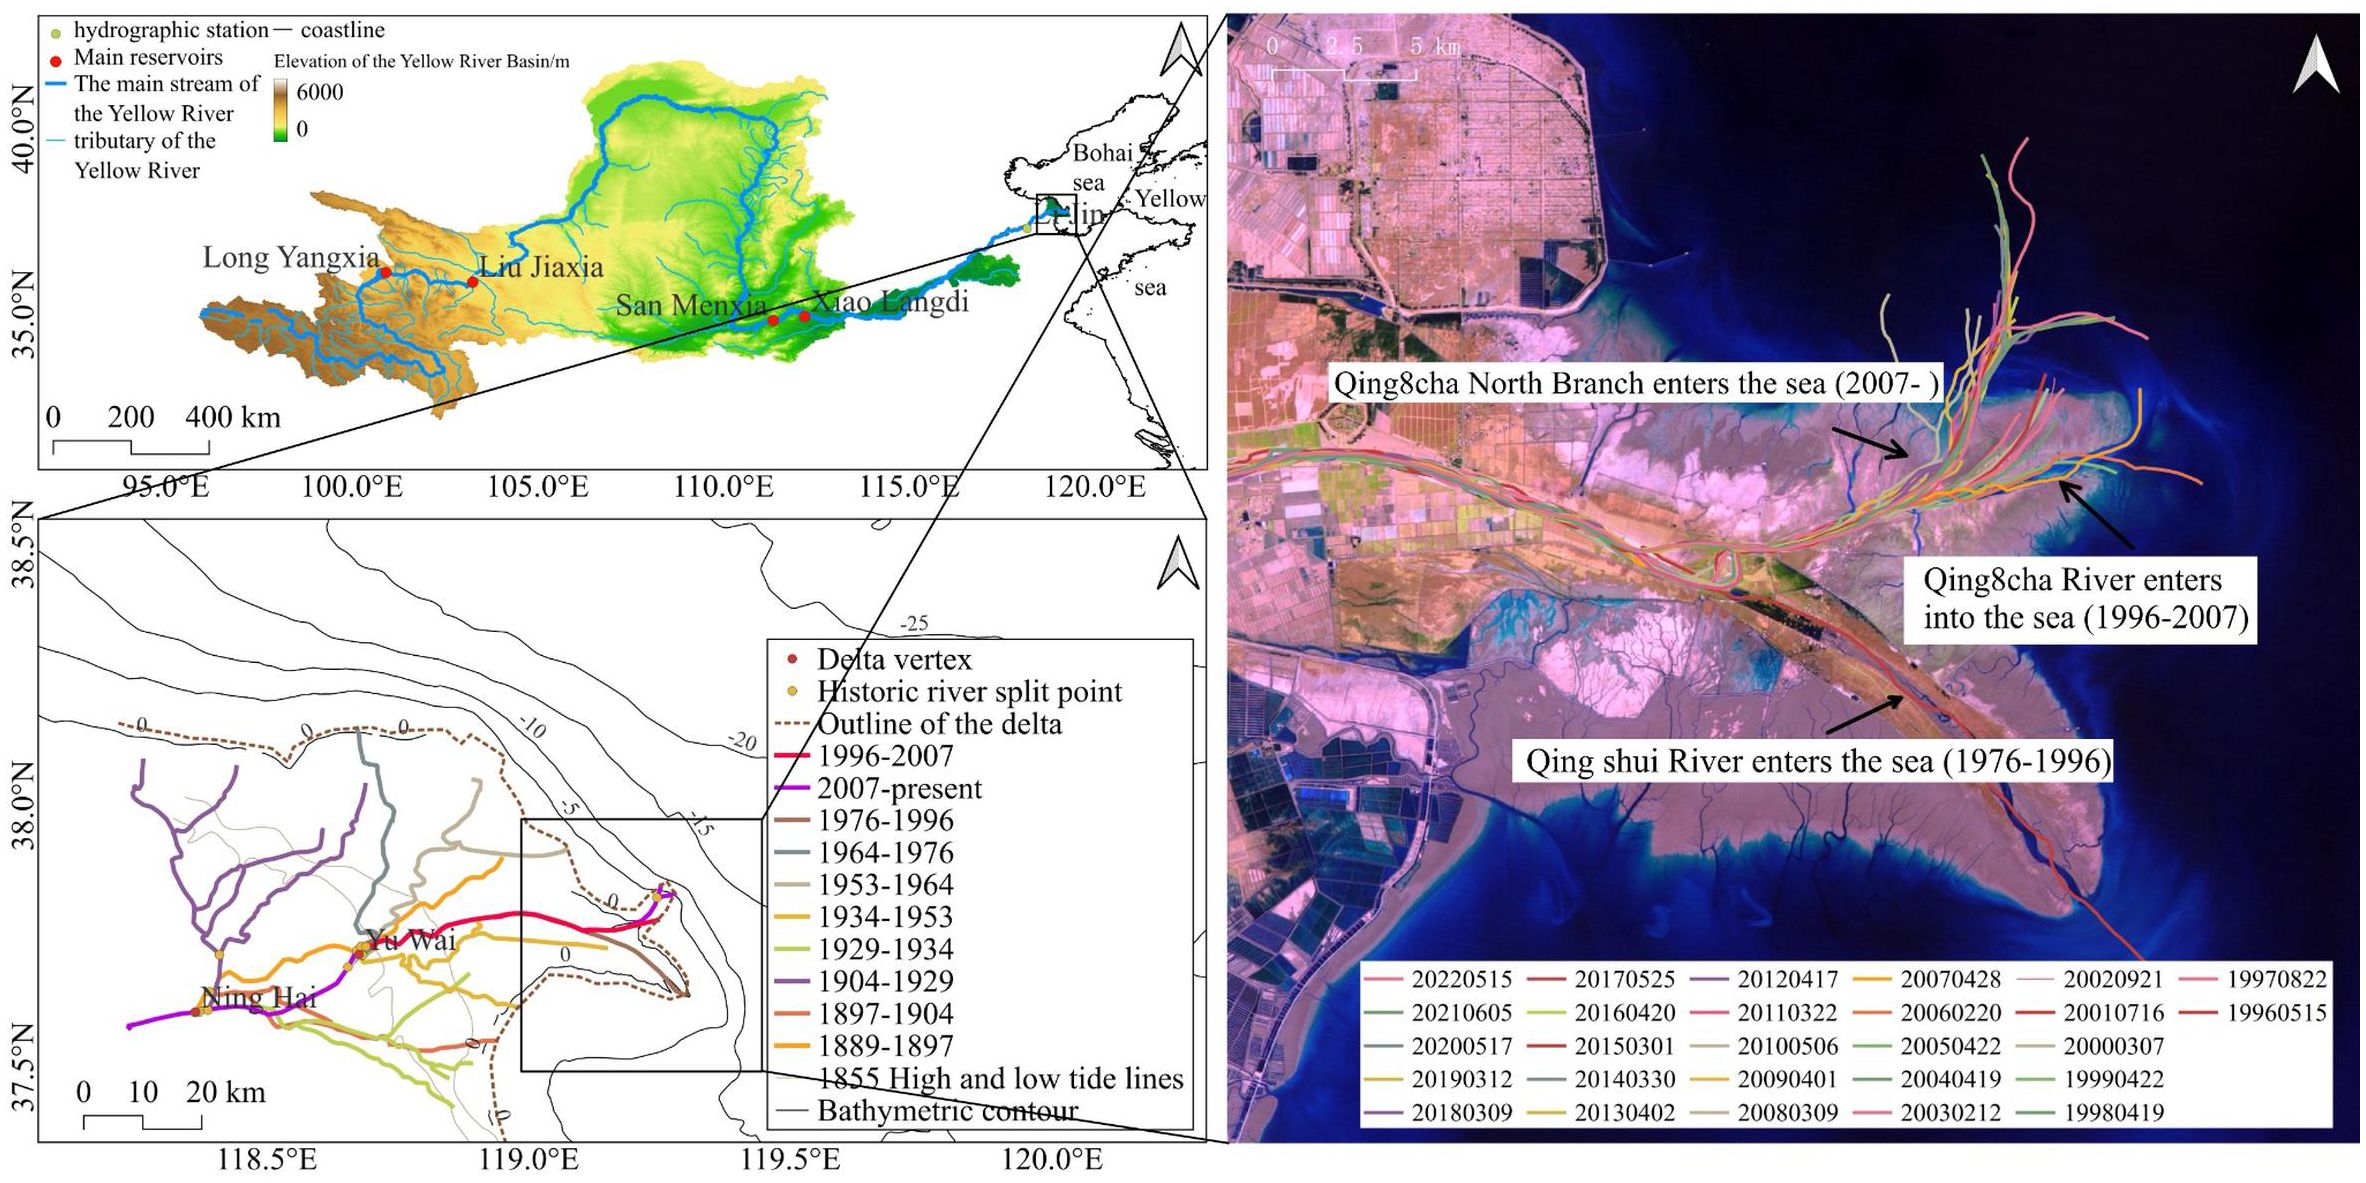
Figure 1. The main stream of the Yellow River Basin, major reservoirs, hydrographic stations, and the development of leaf flaps and diversion of flow paths in the Yellow River Delta in modern times (1855-).
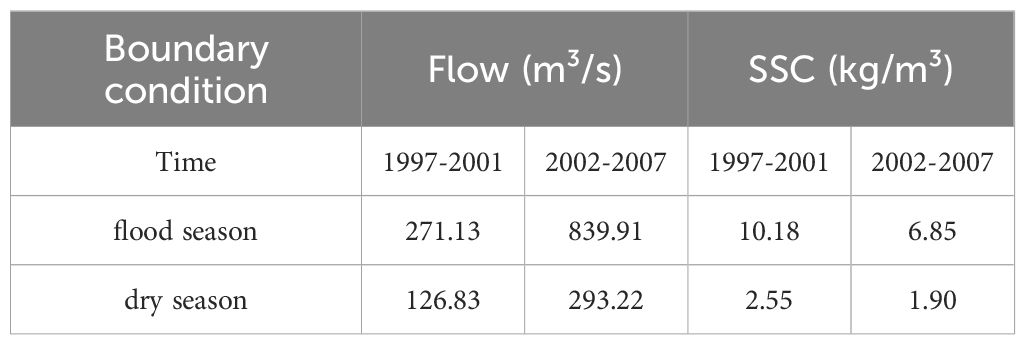
In recent years, the flux of water-sediment from the Yellow River into the sea has been generally decreasing (Figure 2), especially after the large reservoirs in the basin sequentially stored and operated and the implementation of water-sediment regulation scheme, the Yellow River has gradually evolved into a large river subject to a high degree of anthropogenic regulation, and the water-sediment situation of the Yellow River into the sea has been significantly altered, and the water-sediment situation of the Yellow River into the sea has been significantly altered. An analysis of multi-year water-sediment data from the downstream Lijin station reveals that the monthly average flow rate during the flood season, from 1997 to 2001, was 271m³/s. In comparison, the monthly average flow rate from 2002 to 2007 exhibited a significant increase of over 200% relative to the former period. From 2002 to 2007, the average monthly flow rate increased by over 200% compared to the previous period. During the dry season, the average monthly flow rate was 126 m³/s from 1997 to 2001, while in 2002-2007 it reached 293 m³/s, approaching the levels observed during the flood season. In contrast, the average monthly sand content in the flood season was 10.18 kg/m³ in 1997-2001. In comparison, the average monthly flow in 2002-2007 decreased by approximately 40% compared to the former. In general, the flow observed during the period 2002-2007 exhibited a notable increase in comparison to the flow observed during the period 1997-2001. Conversely, the sand content demonstrated a significant decline. The implementation of water-sediment regulation scheme, primarily the Xiaolangdi Reservoir, resulted in a notable reduction in the discrepancy between the water and sand levels observed during the flood season and those observed during the non-flood season. Additionally, the intra-annual distribution of water and sand exhibited a greater degree of uniformity.
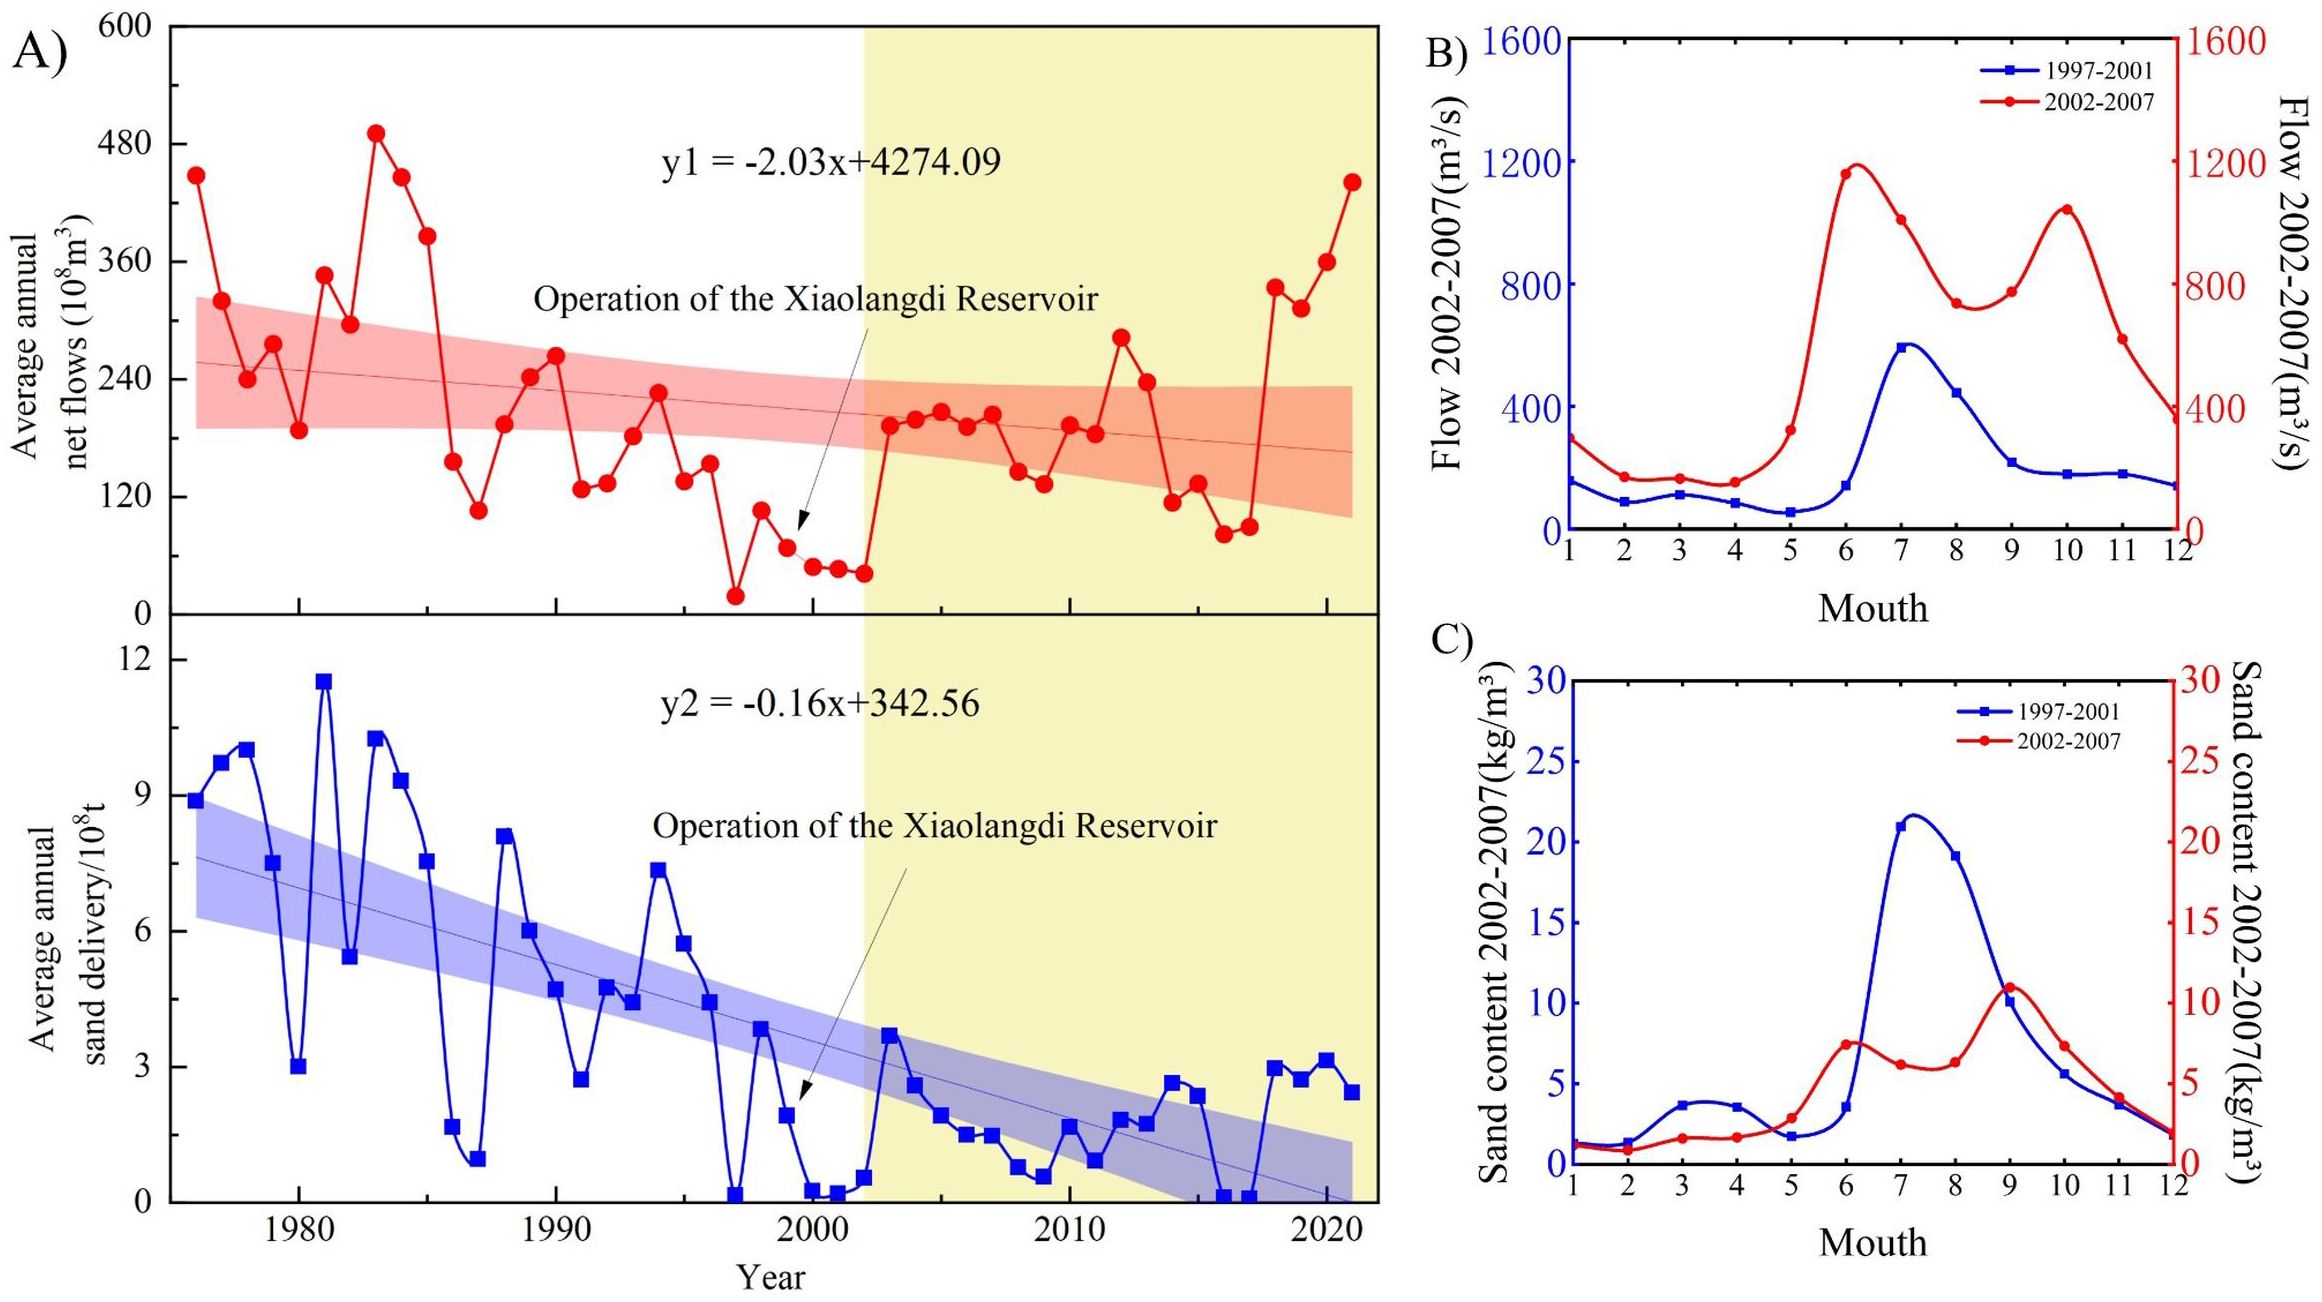
Figure 2. Changes in water-sand entering the ocean (A) Changes in mean annual total water-sediment transport, 1975-2022 (B) Changes in mean monthly flow, 1997-2007 (C) Changes in mean monthly sand content, 1997-2007.
3 Data sources and methods
3.1 Data sources
The data utilized in this study encompass a range of geographical data sets, including bathymetric data, tide level, current and wave fixed point observation data, remote sensing image data, and water-sediment monitoring data from Lijin station. The bathymetric data were obtained by digitizing the 2010 offshore data and merging it with the measured depth data near the Yellow River Delta in 1997 (Figure 3). The longitudinal bed slope of the river before and after the diversion was set to be approximately 1×10⁻⁴ (Du et al., 2022), and the changes in the cross-section were ignored. A bathymetric dataset was then constructed jointly with the mean sea level as the datum. The observations utilized for model validation were obtained from measured tide level data collected between 00:00 on November 2, 1999, and 00:00 on November 30, 1999, at Mackerel and Dongying harbors. Additionally, current flow direction data were gathered between 01:00 on November 24, 1999, and 12:00 on November 25, 1999, at point BZ28. Furthermore, wave data were recorded between 00:00 on November 4, 1999, and 12:00 on November 25, 1999, at point #1. A similar set of data was collected at point #1 between 00:00 on November 4, 1999, and 12:00 on November 25, 1999. The wave data were obtained from measurements taken between 00:00 on November 4th, 1999 and 00:00 on November 30th, 1999. The remote sensing image data were derived from the Landsat 5 series image captured at 10:00 on September 7th, 1997. The data pertaining to the water-sediment levels at Lijin station were obtained from the water information database of the Yellow River Conservancy Commission, Ministry of Water Resources (http://www.yrcc.gov.cn/).
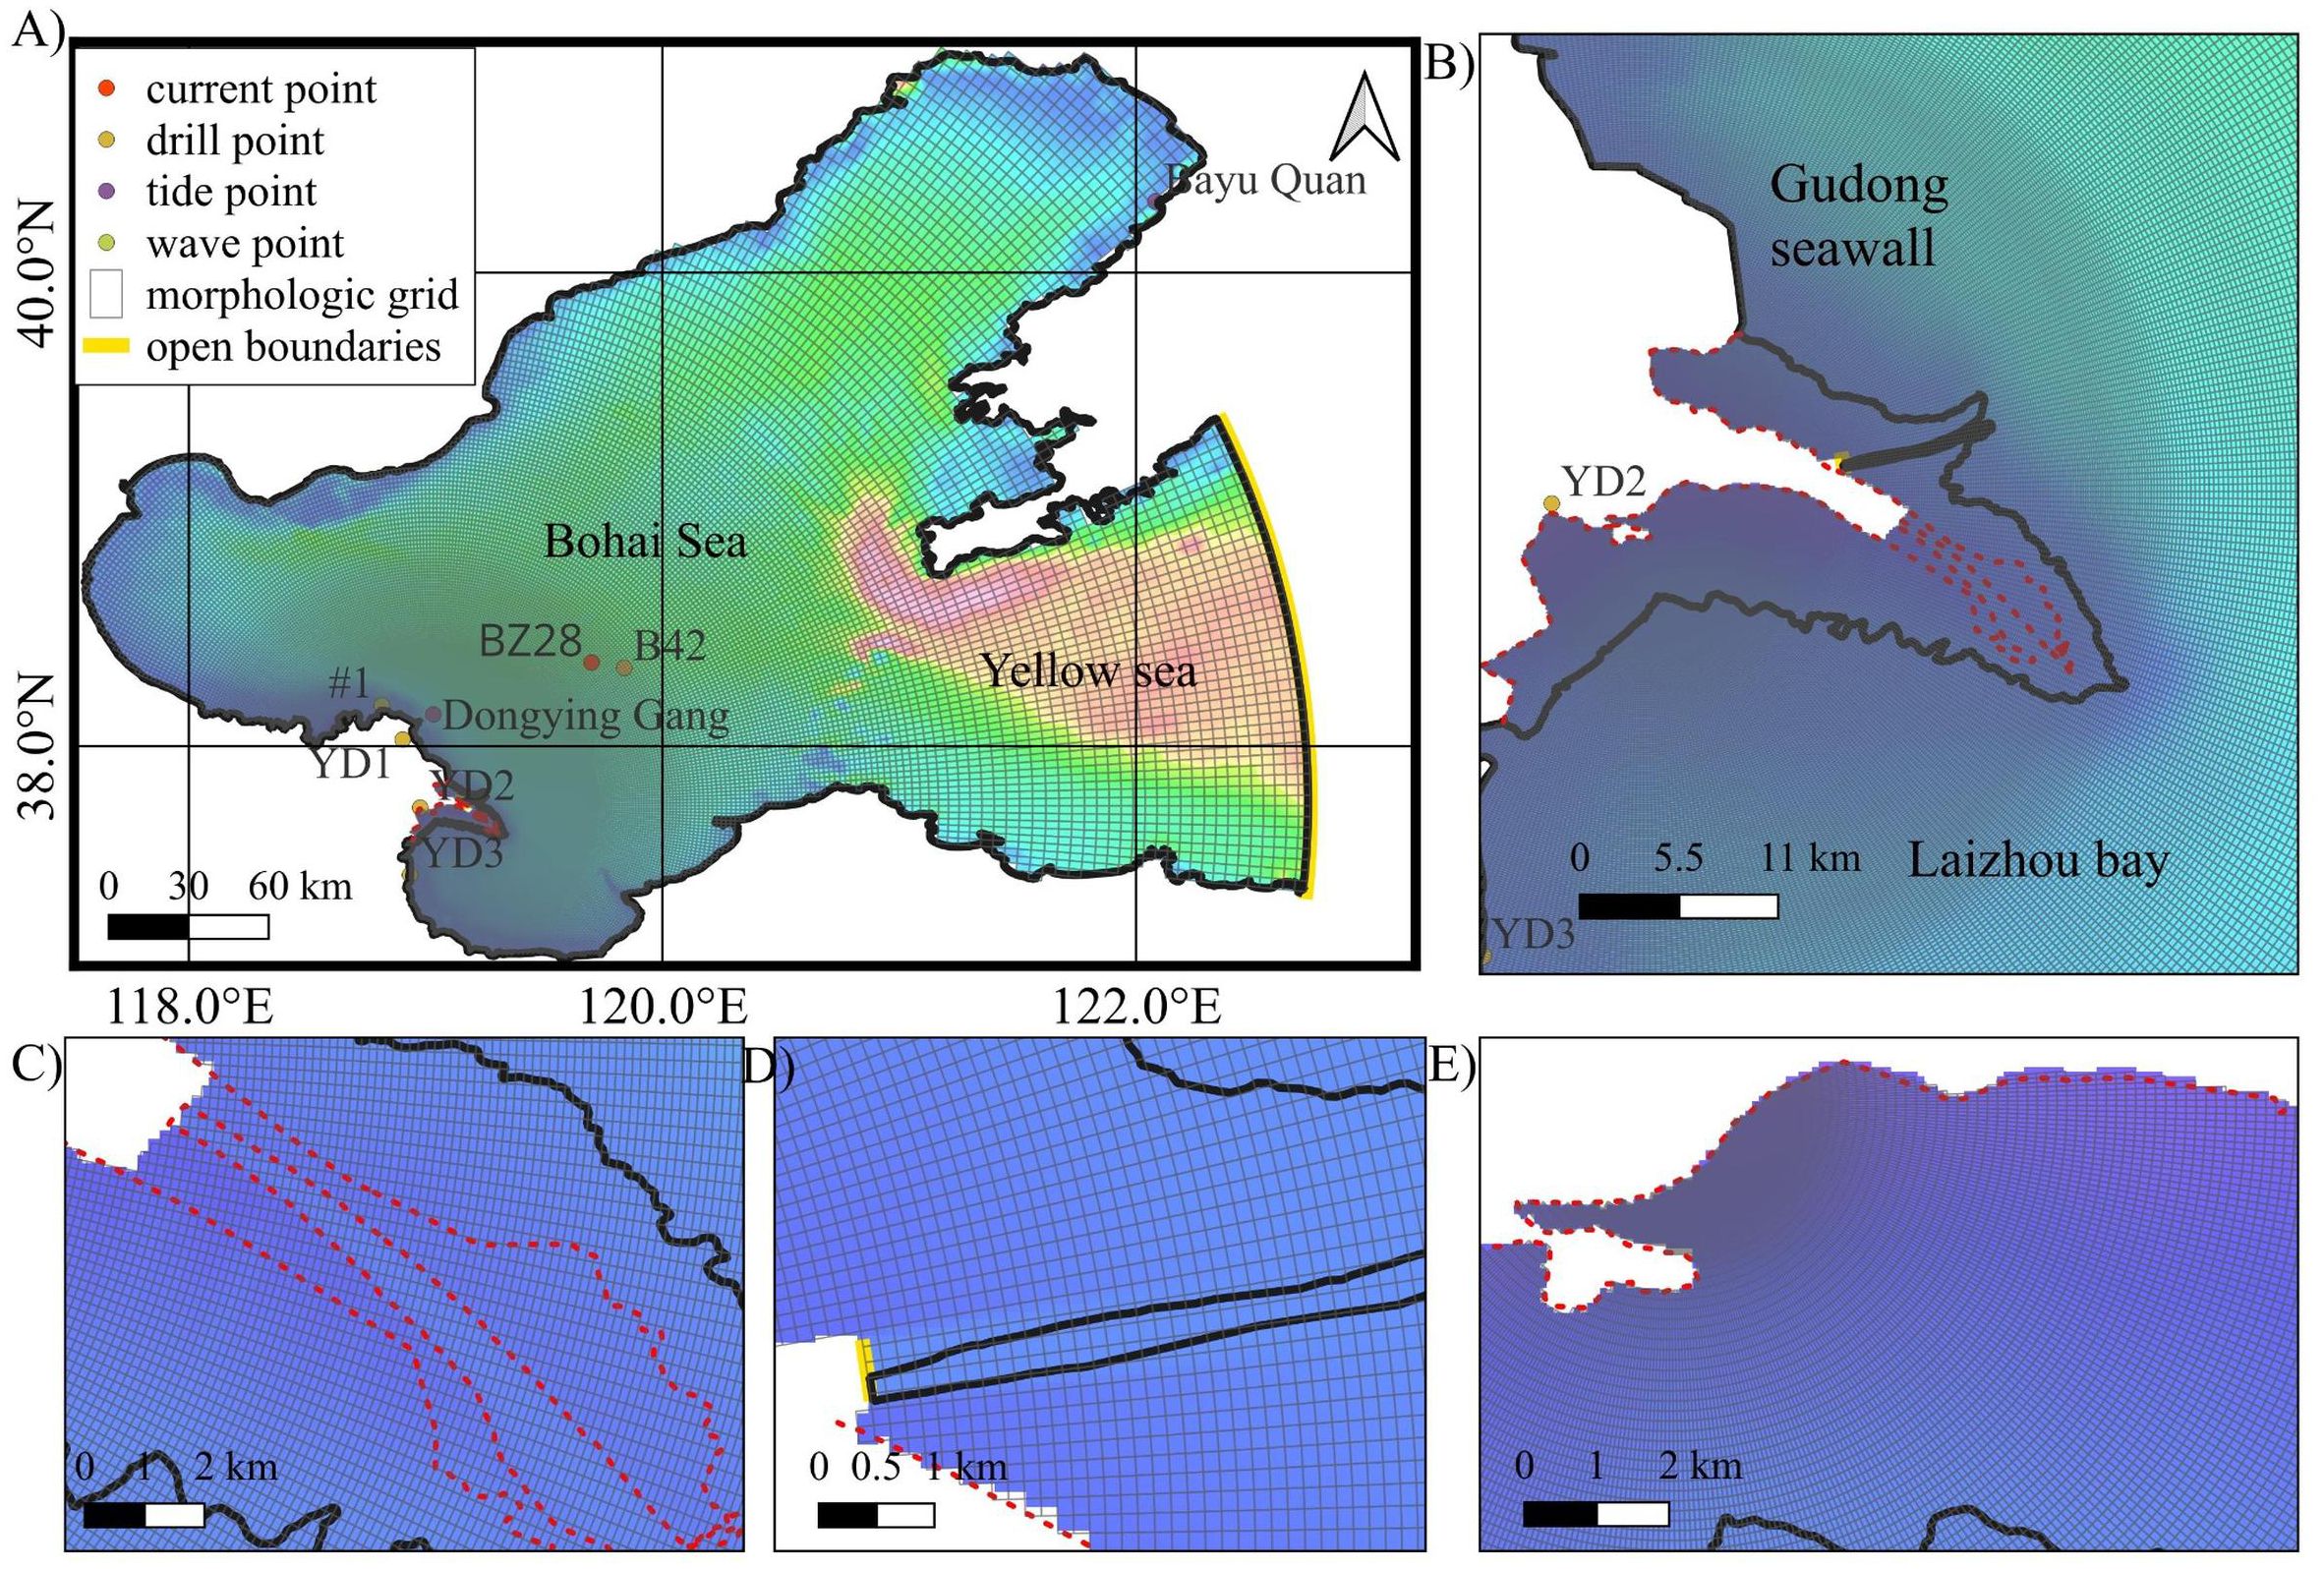
Figure 3. Grid setup and interpolated topography (A) Model computational domain and coordinates of point locations (B) 1997 nearshore topography of the Yellow River delta (C) sand spit in the abandoned Qingshuigou sub-delta (D) 1997 river topography (E) tidal flats in the southern part of the Qingshuigou sub-delta.
3.2 Methods
The Delft3D model was selected for this study to simulate the relevant physical processes, namely hydrodynamics, sediment transport, and topographic evolution. The spatial resolution of the model ranges from 2000 m at the far seaward boundary to approximately 150 m in the estuarine region. The simulation was extended to encompass the high waterline and seawall, thereby incorporating the dynamic processes of the estuarine sandbar and intertidal zone. The equations governing fluid-sediment interactions in Delft3D are provided in the manual (Hydraulics, 2003). The Manning’s coefficients exhibit a range of 0.01 to 0.015 m-1/3/s, contingent on the specific region under consideration. In accordance with the Courant-Friedrichs-Lewy criterion, the time step for all scenarios was set to one minute to ensure numerical stability and accuracy. The water level conditions from the MIKE Global Tidal Service platform, which considers four major tidal components, are employed for the ocean boundary, and the flow and sediment content data from the Lijin station are utilized to establish the river boundary conditions.
The online coupling process of wave and current enables an explicit analysis of the erosion process of waves on the sand spit. The wind field data are reanalysis resources of the European Centre for Medium-Range Weather Forecasts (ECMWF), whose resolution ensures the land-sea wind field changes in the Bohai Sea area.
The suspended sediments of the Yellow River, which ultimately reach the sea, are primarily composed of silt and clay. In different scenarios, four main sediment fractions are present at the river boundary: 62.5 μm, 37.5 μm, 18 μm, and 3.9 μm. These fractions represent the silt (4-64 μm) and clay (<4 μm),and the corresponding settling velocities were 0.26 mm/s, 0.22 mm/s, 0.16 mm/s, and 0.06 mm/s, respectively. Their proportions are determined based on the study of grouped sand transport and flow rate change processes at the Lijin station over time. The allocation of the different fractions is described in detail in Section 3.4.
The seabed sediment has three fractions: 62.5 μm, 3.9 μm, and 125 μm, and the thickness of the surface sediment is set at 0.2 m (Wang et al., 2020). The substrate below the surface takes into account the sudden change of sediment source and depositional environment after the Yellow River was diverted from the Bohai Sea to the sea in 1855, and the two reflect the difference of sediment grain size and geochemical composition, therefore, the thickness is set at 4 m (each layer 0.1 m). The proportion of silt is 64%, the proportion of clay is the next 22.3%, and the proportion of sand content is 13.7%, and the model takes into account the 62.5 μm sediment to reflect the characteristics of the seabed sediment silt in order to trace the direction of the river-carrying sediment and changes in the composition of the bed sediments. Sediment parameters were obtained by combining empirical or analytical formulas, including: dry bed density, erosional shear stress, and sedimentation velocity, and the van Rijn formula, which can effectively differentiate between pushed and suspended material, was chosen for the transport formula (Van Rijn, 1993).
The dry unit in proximity to the wet unit was designated as erodible, and microgeomorphic alterations, including erosion and accretion of tidal flats, sand ripples, and tidal gully sidewall collapse, in addition to deltaic geomorphic development and evolution, were simulated by defining the percentage of erosion as 100%. The potential effects of sea level change, ground subsidence, uplift, and vegetation development on fluid resistance, wave attenuation, and sediment trapping have been excluded from the analysis. In order to prevent irrational alterations to the riverbed and to guarantee the unimpeded transportation of sediments to the sea, the morphological update of the riverbed is closed.
3.3 Model validation
Validation using skill metrics commonly used to quantify the effects of numerical models (Willmott, 1981):
In this model, skill is the performance index, S is the simulated data, D is the observed data, and n is the number of observed data points. A skill value of 1.0 indicates a perfect model, while a value between 0.65 and 1.0 is indicative of excellent performance, a value between 0.5 and 0.65 represents very good performance, a value between 0.2 and 0.5 signifies good performance, and a value below 0.2 is indicative of poor performance. The skill values for tide level, flow rate, and direction are all above 0.8, exhibiting good agreement in magnitude and phase (Figure 4).
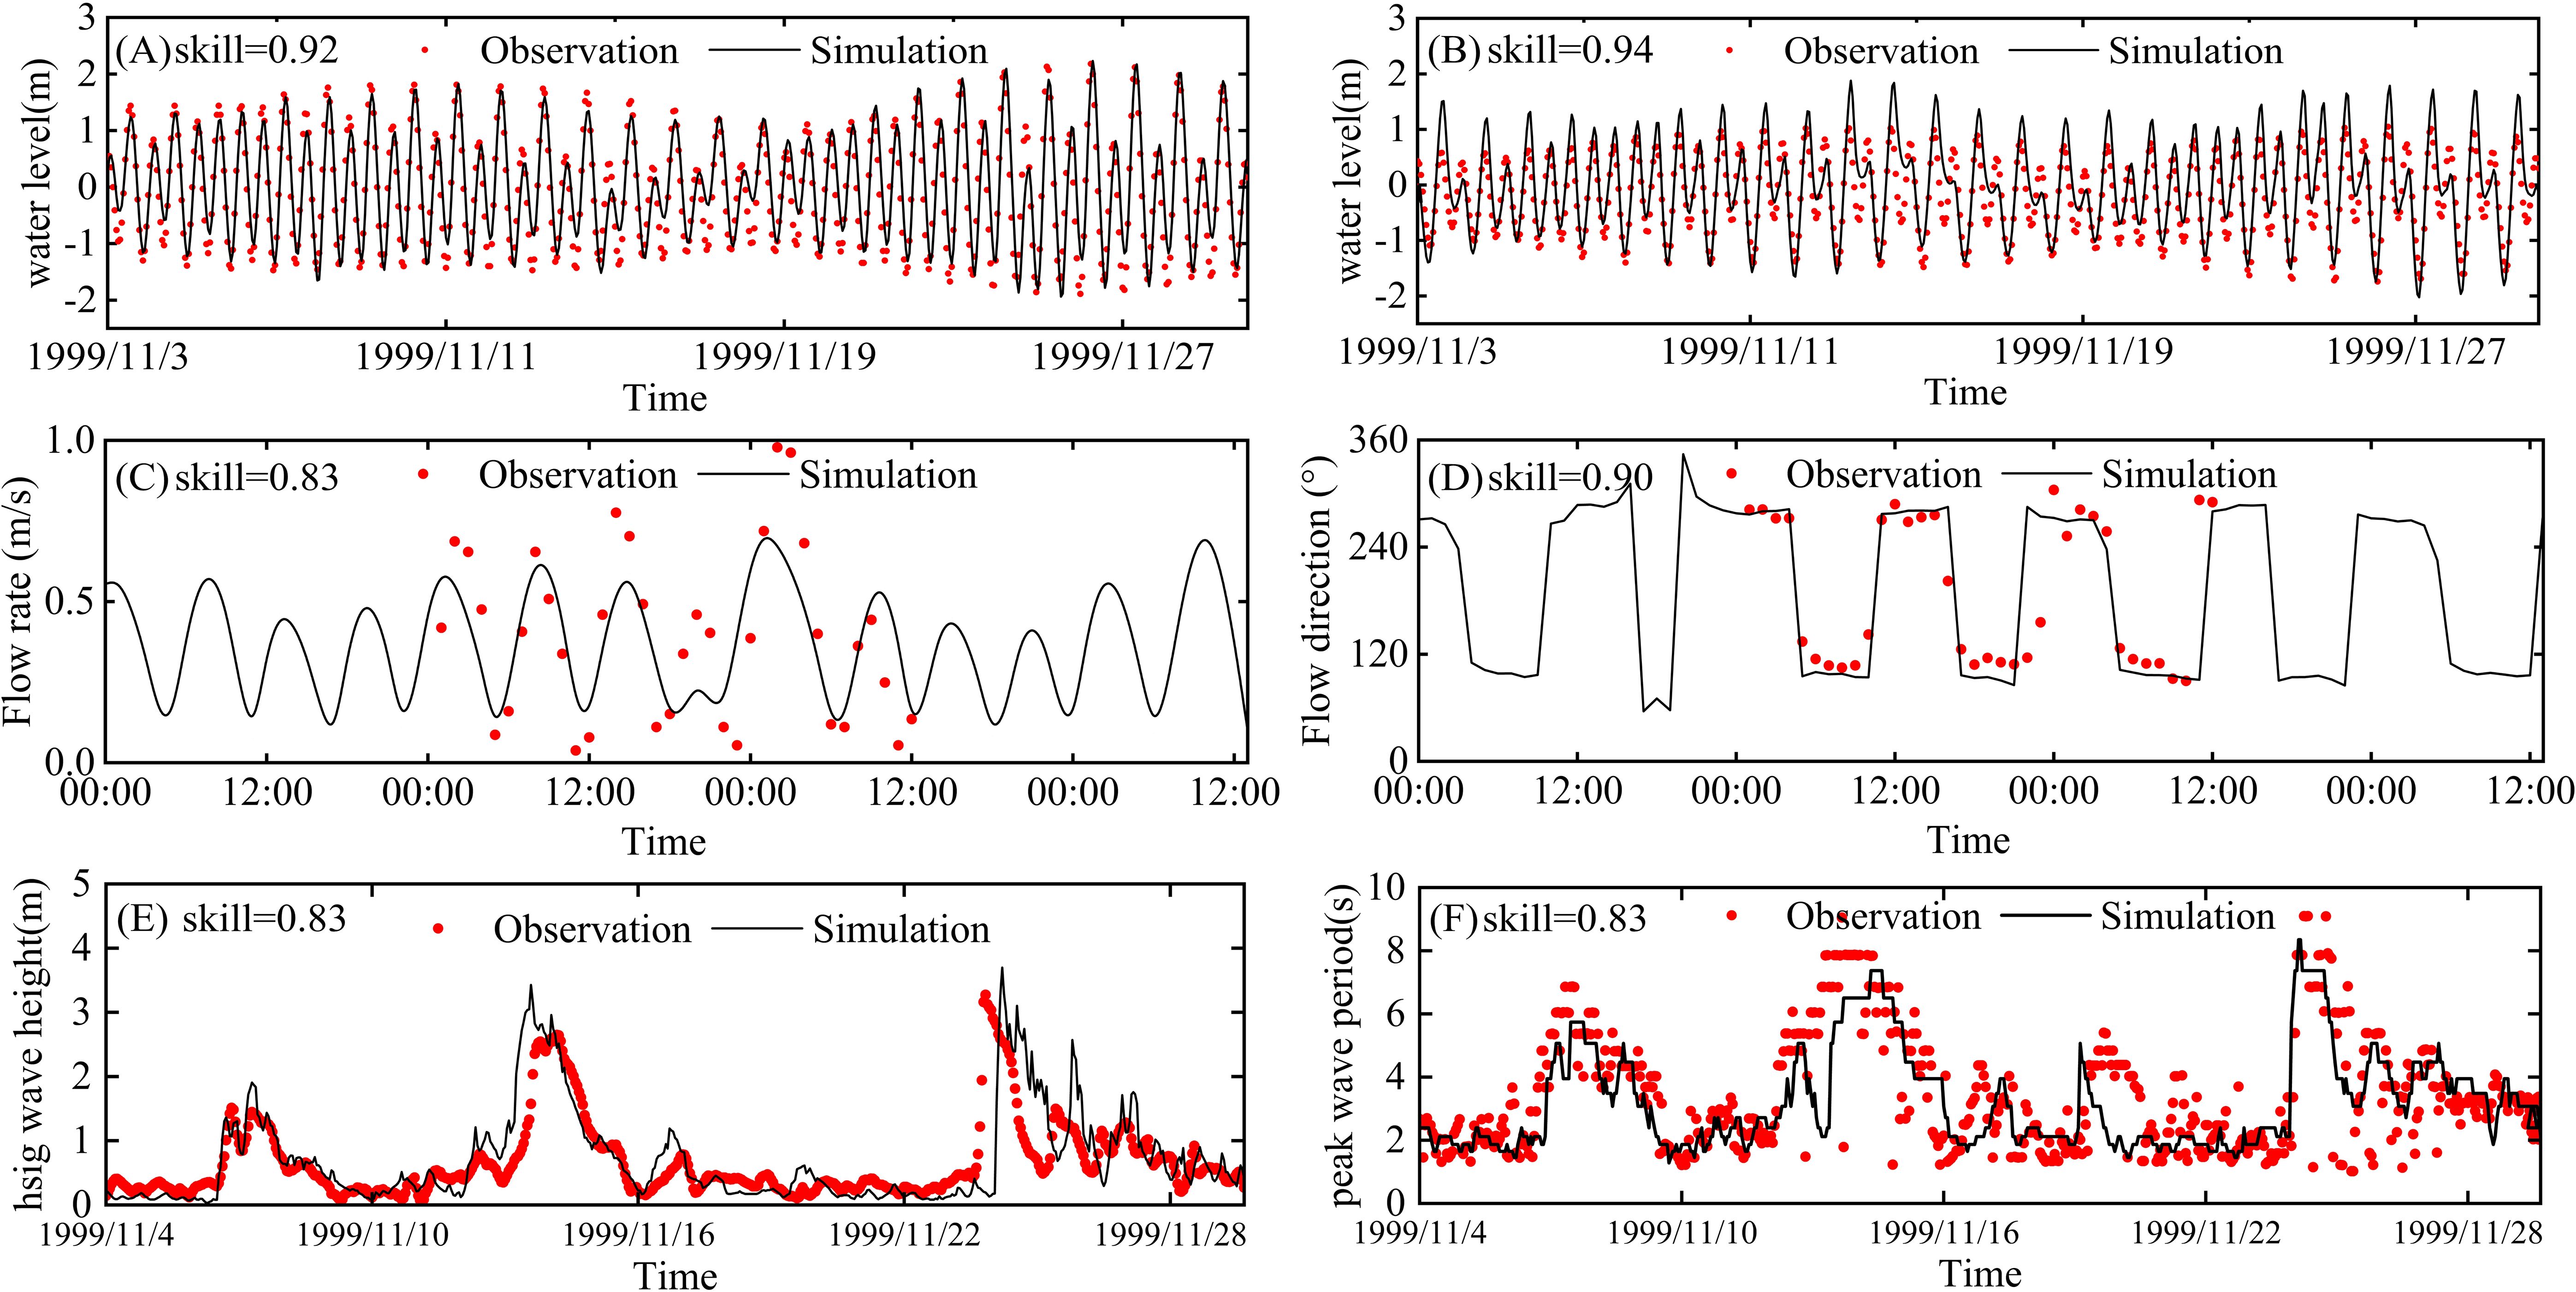
Figure 4. Comparison of hydrodynamic validation model results (black line) with observations (red dots). (A, B) Tide level validation results at Bayu Quan and Dongying Gang, (C, D) Depth-averaged flow velocity and flow direction validation results at point BZ28, (E, F) Wave height and spectral peak period validation results at point #1.
The effective wave height and spectral peak period are highly accurate, although some discrepancies may be attributable to the precision of the topographic bathymetry, the variability of the water level, and the accuracy of the wind field data.
The SSC(Suspended Sediment Concentration) remote sensing inversion model developed by the previous authors demonstrated the robustness of the algorithm and its applicability in the Yellow River estuary waters (Fan et al., 2007). Consequently, the study was employed to validate the spatial pattern of the sediments by comparing the model results with the remote sensing inversion results. The spatial pattern of sediments simulated by the model, including spatial extent and deflection, is largely consistent with the previous inversion results (Figure 5). However, some discrepancies were observed near the large mudflats in the southern part of the delta, which can be attributed to the lack of precise characterisation of the properties of different sediments, such as sortability and erosivity, and the spatial distribution of initial sediment fractions.
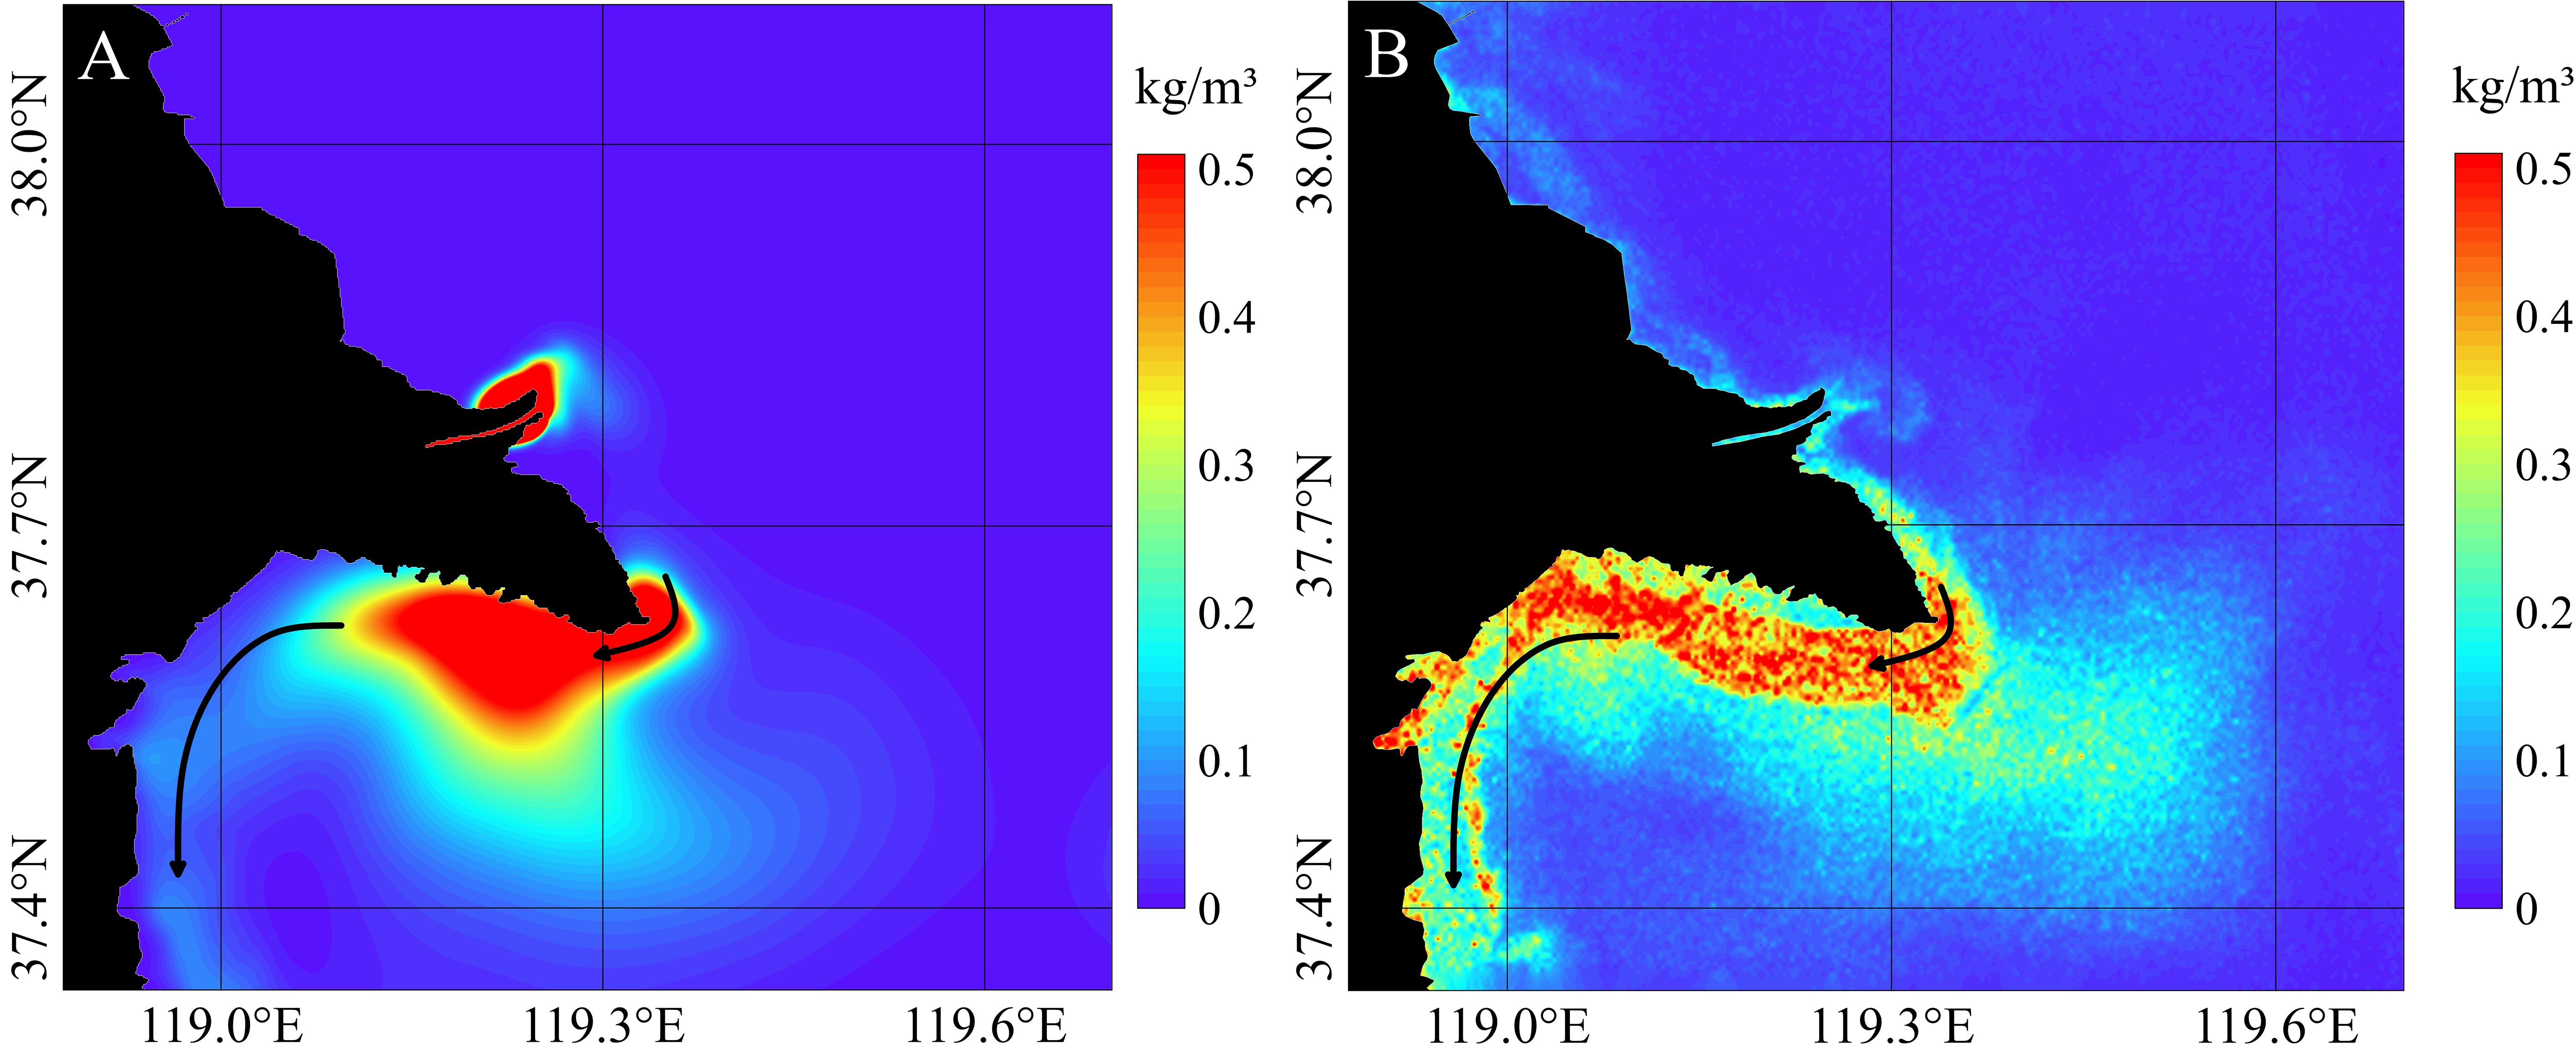
Figure 5. Validation of suspended sand concentration patterns. (A) Modeled suspended sand results (B) Remote sensing image suspended sand inversion results.
The formation of morphological units is influenced by specific oceanic dynamic processes. The veracity of the model in reproducing natural geomorphic patterns and accretion processes can be evaluated through a visual comparison of the simulated geomorphic units with the observed geomorphic units (Xie et al., 2010). The validation of the consistency of the geomorphic units (sandbars) serves to demonstrate the reliability of the simulation results(Figure 6).
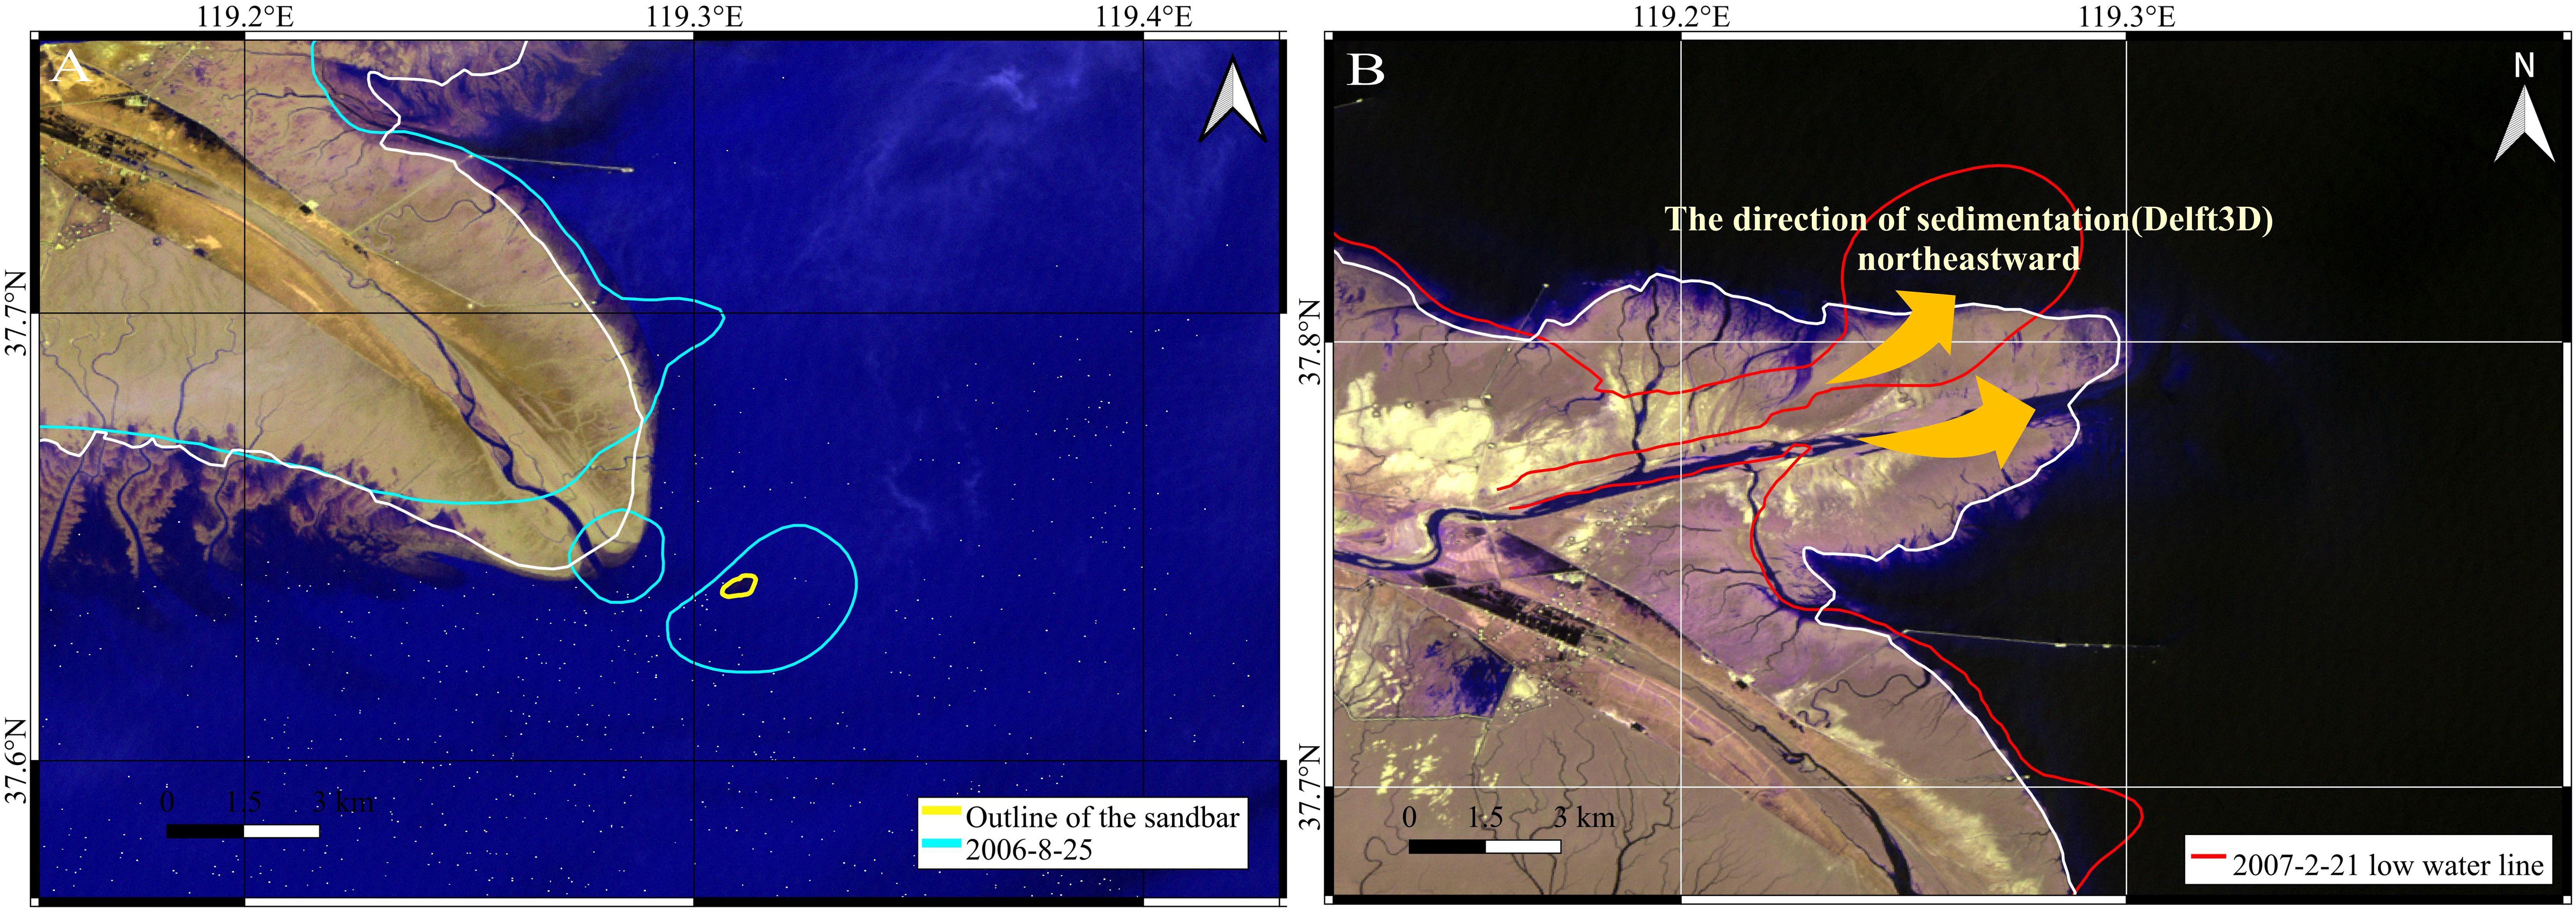
Figure 6. Geomorphic unit and erosion and accretion trend validation results (A) Geomorphic unit validation (B) Estuarine accretion forward direction trend validation.
The changes of contours reflect the determining effect of dynamics on geomorphology and the feedback effect of geomorphology on dynamics. By comparing the simulation results (white line) with the low-tide line of the Qingshuigou sub-delta (Figure 6), we found that the direction of estuarine accretion after the diversion showed a northeastward trend, and the abandoned estuary showed a trend of landward erosion and retreat, which was consistent with the results of the previous studies using measured data and remote sensing means (Cao et al., 2023). Therefore, the validation of the trend proves the reliability of the model in the time scale of this study.
3.4 Modelling scenarios
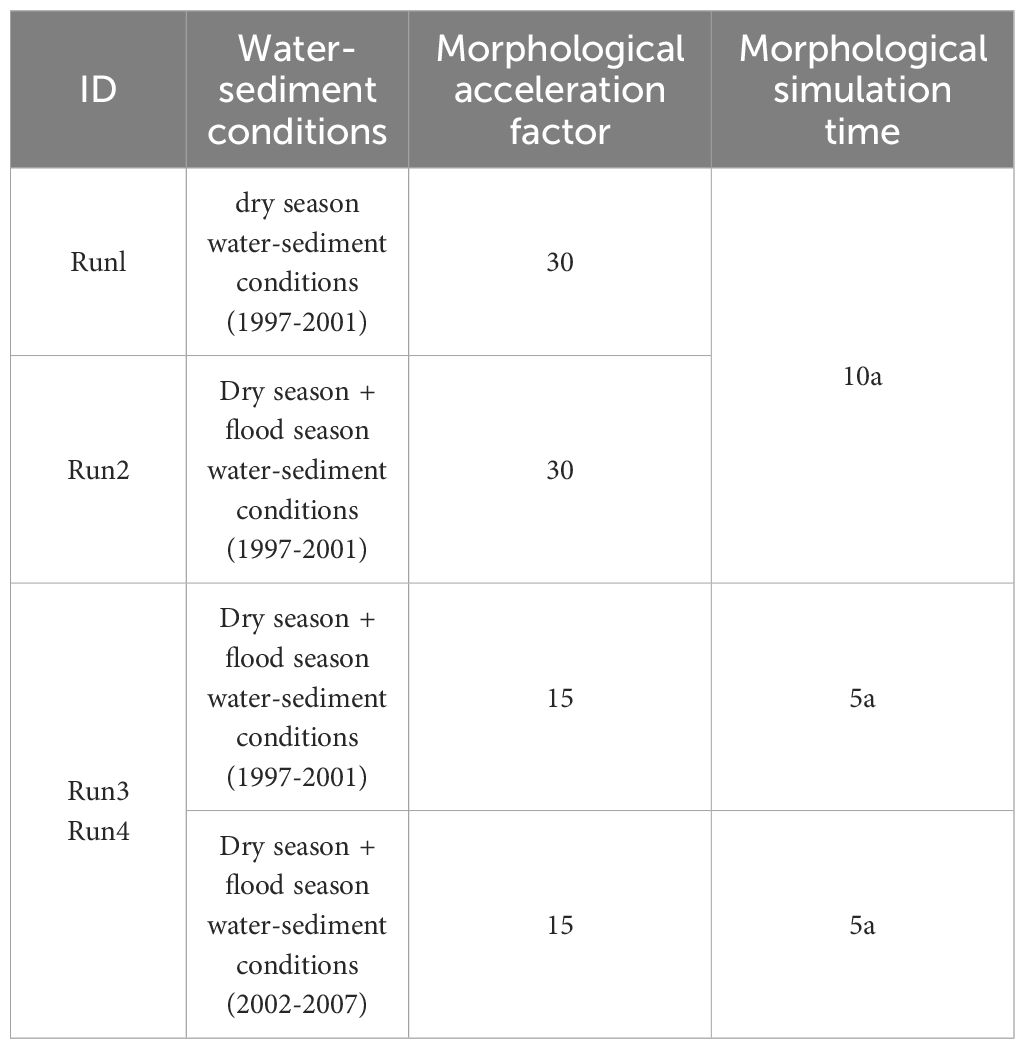
This paper differentiates the simulation scenarios into two categories: unsteady scenarios, in which the flow changes dynamically with time, and constant flow scenarios, in which the flow is constant in time. (Tables 1, 2) There are four sets of simulation scenarios in total, which account for physical processes such as waves, tides, sediment, and morphology. The hydrodynamic simulation was conducted between 1 March 1997 and 1 July 1997.
In Run1, the water-sediment data entering the ocean were taken as constant values, using the monthly water-sediment data from the dry season of 1997-2001 as the river boundary conditions for simulation. In Run2, the monthly water-sediment data from the dry season and flood season of 1997-2001 were used as the river boundary conditions for simulation.
In Run 3, the morphological changes from 1997 to 2001 were first simulated, and Run 4 was based on the model results of Run 3. Subsequently, the runoff boundary was changed to the water-sediment conditions from 2002 to 2007, after which the morphological changes for a five-year period were simulated. The objective of the numerical experiments was to elucidate the impact of “representative” river boundary conditions resulting from reservoir regulation or precipitation on delta morphology when there is a considerable alteration in flow and sand content between the dry and flood seasons (He et al., 2022).
The study adopted a phased morphological acceleration factor strategy. in Run3, the dry season (low water-sand conditions) was accelerated first and then the flood season (high water-sand conditions). However, due to the acceleration amplification effect, there was a mismatch between the water-sand conditions and the monsoon timing, which affected the spatial and temporal distribution of sedimentation and erosion. To optimise the results, the Run4 simulation adjusted the sequence, accelerating the flood season before the dry season, focusing on matching the timing of seasonal wind occurrence. This improvement ensured that the water-sediment conditions were in harmony with the seasonal dynamics.
The fractions of sediments entering the sea also underwent a change during the two different phases preceding and following 2002. Specifically, the fractions of 3.9 μm and 18 μm sediment decreased from 34% prior to the implementation of water-sediment regulation scheme in 2002 to 29% subsequent to their implementation. Conversely, the fraction of 37.5 μm sediment increased from 16% to 19%, while the fraction of 62.5 μm sediment increased from 15% to 23%. The conservation of total sediment mass entering the sea at different stages was controlled by this method, reflecting the trend of coarsening the grain size of sediments entering the sea caused by the construction of Xiaolangdi Reservoir (Yang et al., 2022).
4 Results
4.1 Spatial patterns and differences in morphologic evolution of underwater deltas
The morphological pattern of the underwater delta is distinguished by the varying interactions between flood and dry season runoff, tides and waves. The simulation results for the various scenarios demonstrate that the spatial distribution of accretion and erosion, which is influenced by the fluctuating river flow, leads to the formation of deposition around the current estuary (Figure 7). This deposition occurs along a line that roughly coincides with the 6 m isobath. The latitudinal width of the depositional zone is considerably shorter than its meridional length, which may be attributed to the blocking effect of the littoral flow. The offshore limit of the sedimentary zone is the 14 m isobath, with the majority of sediments confined to the delta front area between the 2 and 10 m isobaths. In the case of Run1, the upper and lower limits of the sedimentary zone extend to the nearshore area of the Gudong embankment and the abandoned channel section of the Qingshuigou sub-delta, respectively. Additionally, a sedimentary zone is observed along the southwestern coastline of Laizhou Bay, spanning approximately 1000 m in width and oriented in a northeast-southwest direction. Significant accretion is observed in the vicinity of the 4 m isobath at the head of the abandoned sand spit and in the abandoned channel in Qingshuigou, the maximum thickness of accretion at the head of the abandoned sand spit was approximately 0.85m, and the maximum thickness of accretion in the abandoned channel of Qingshuigou was approximately 0.67m.
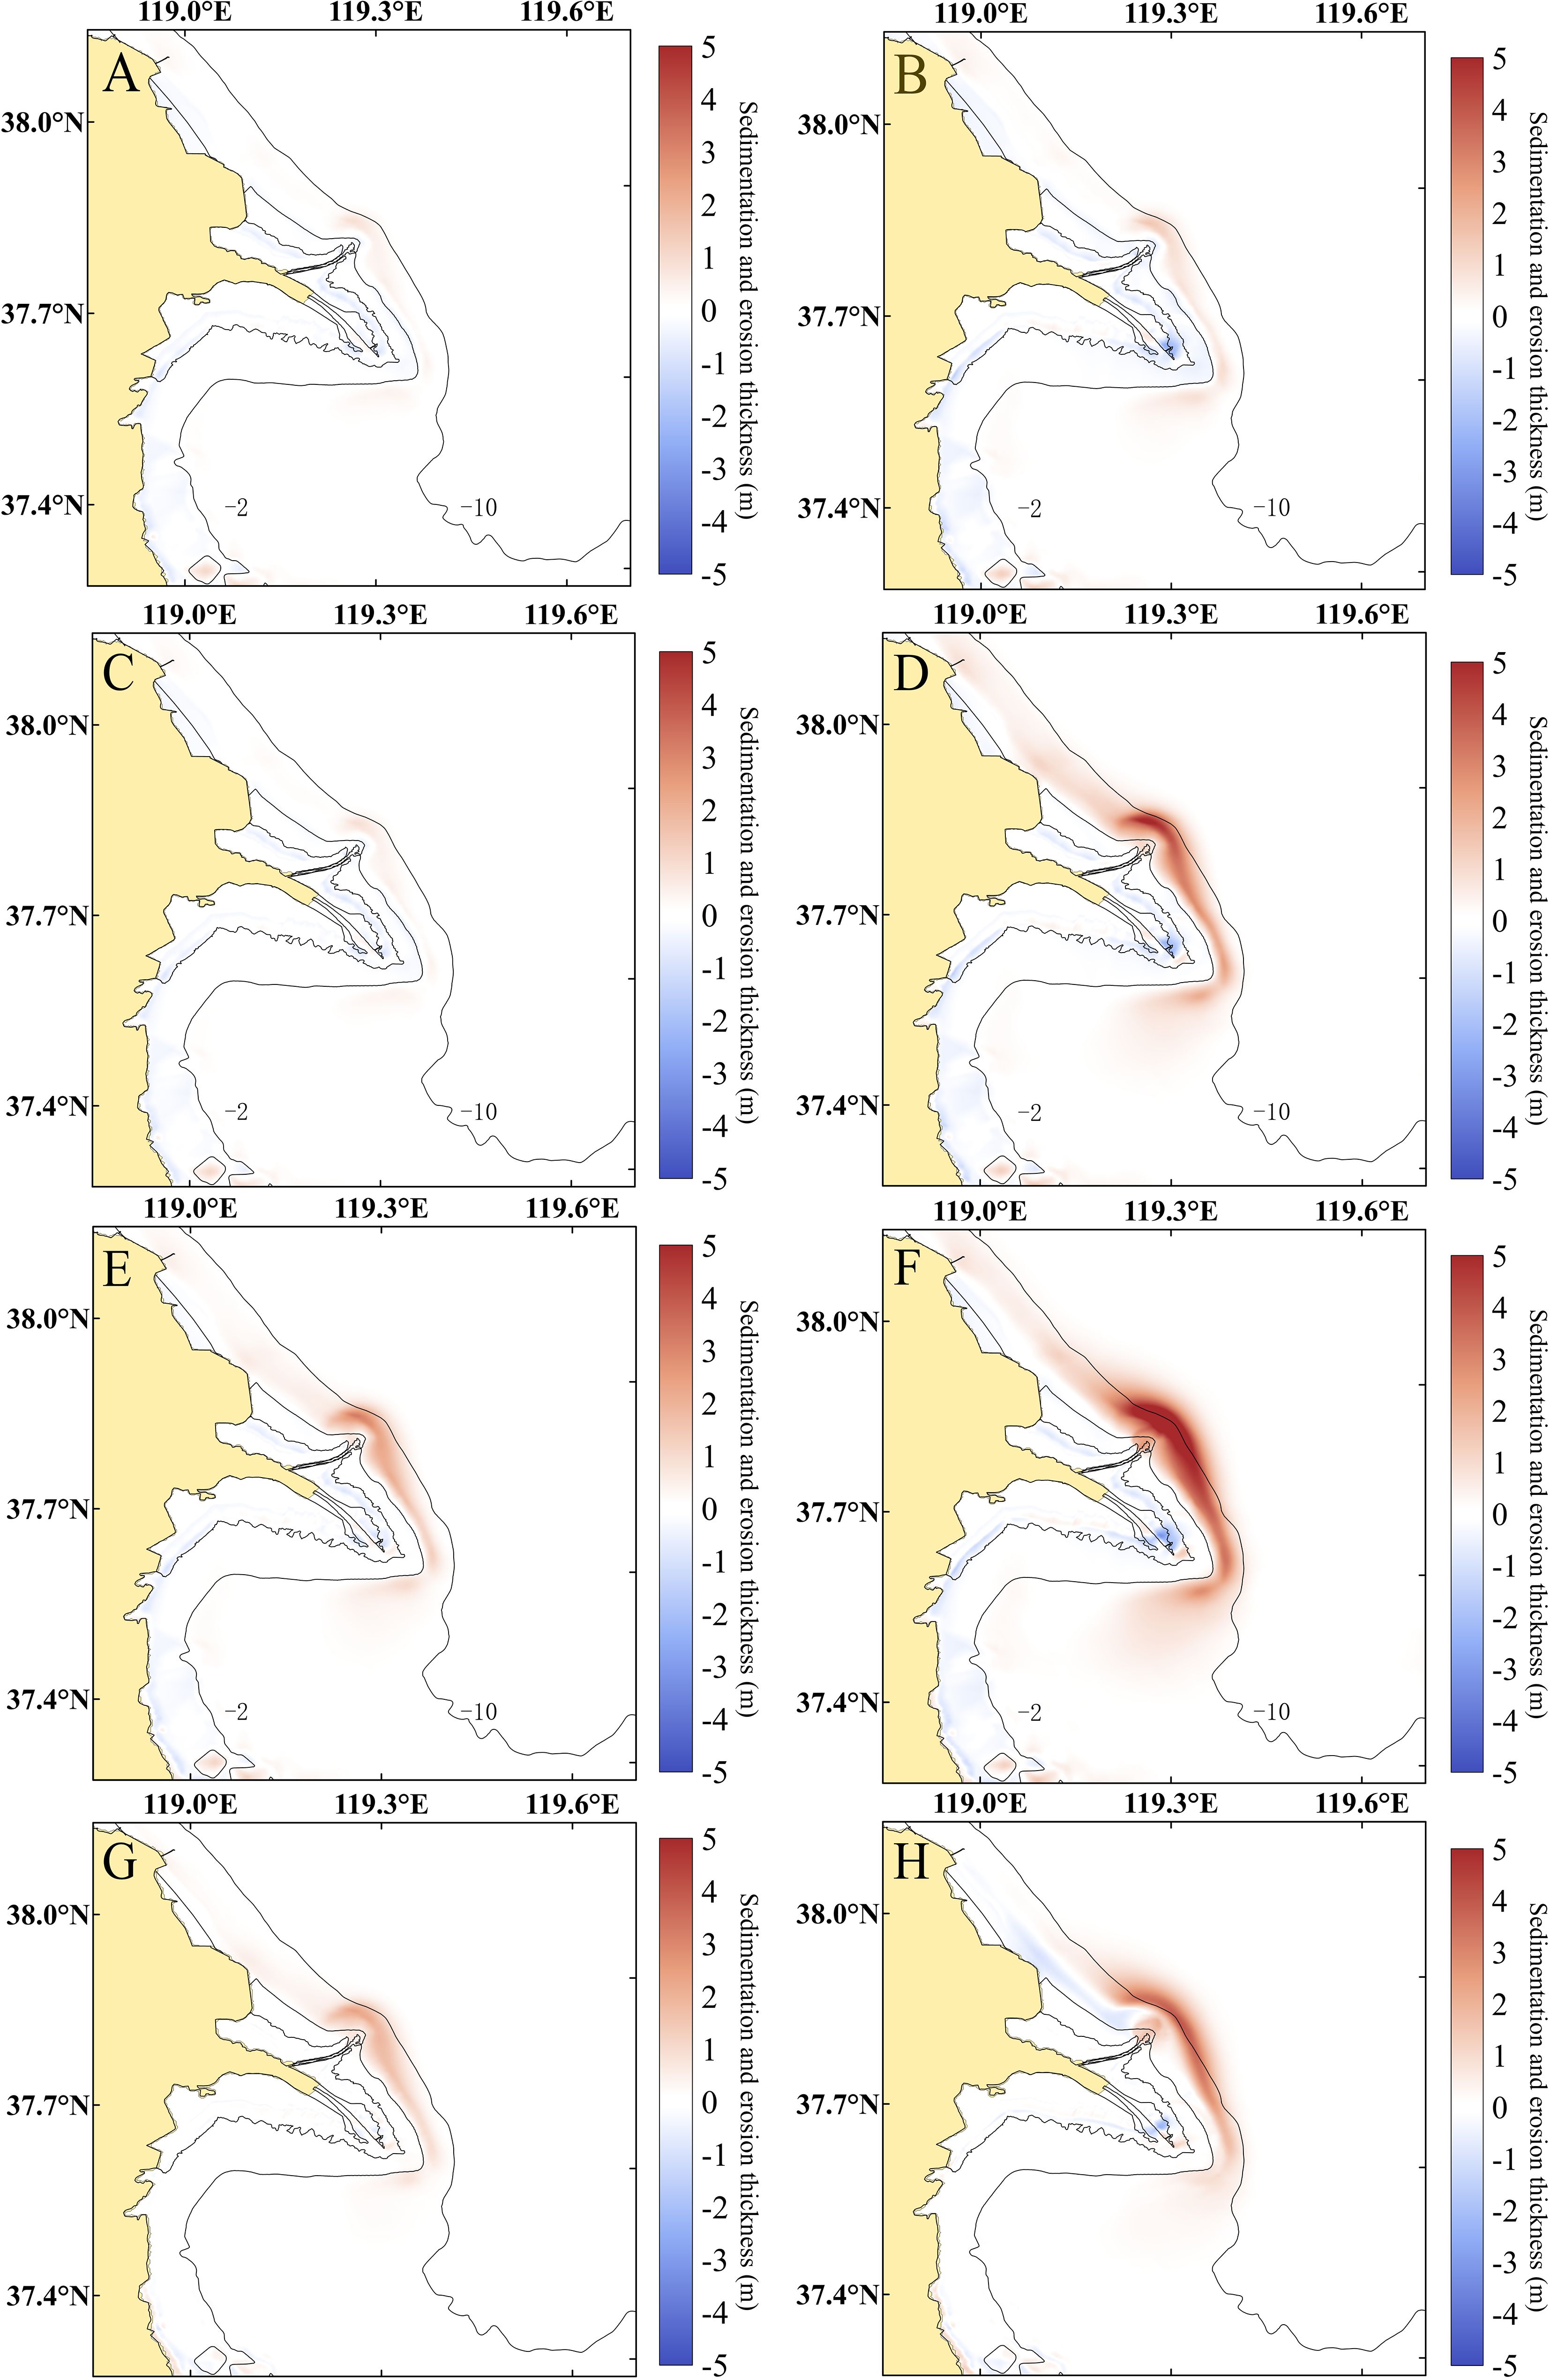
Figure 7. Spatial distribution of erosion/accretion in the Qingshuigou Subaqueous delta relative to 1997, bottom panel shows initial topography for model calculations (A) (Run1) 5-year change in erosion and accretion 1997-20021 (B) (Run1) 5-year change in erosion and accretion 2002-2007 (C) (Run2) 5-year change in erosion and accretion 1997-2001 (D) (Run2) 5-year change in erosion and accretion change 2002-2007 (E) (Run3) 5-year change in erosion and accretion 1997-2001 (F) (Run4) 5-year change in erosion and accretion 2002-2007 (G) (Run3-Run2) 5-year change in erosion and accretion 1997-2001 (H) (Run4-Run2) 5-year change in erosion and accretion 2002-2007.
The upper and lower extensions of the sedimentary belt display an asymmetry with respect to the estuary, primarily due to the prevalence of stronger high tides (from NW to SE) relative to low tides (from SE to NW), coupled with the influence of the Coriolis force. This results in longer spreading distances on the right side of the estuary. With the passage of time, this asymmetry gradually intensifies. Furthermore, Run2 and Run3, which incorporate the impacts of water-sediment regulation scheme, exhibit a heightened asymmetry in comparison to Run1.
In comparison to the current extensive deposition around the estuary, the tidal flats in the northern part of the Yellow River Delta exhibit a slight erosion state, with a maximum erosion depth of 5.52m over a 10-year period. From the Gudong seawall to 6,000m south of the abandoned sand spit along the 0m isobath, a strip erosion state is observed, with a width of the strip ranging from 4,000m to 6,000m. The overall arc of erosion around the abandoned sand spit may be attributed to the shape of the estuary protruding and the strength of the tidal currents along the shoreline. The maximum erosion depth is 2.21m and is located near the fore edge of the abandoned channel at 6600m. In the area of the delta front edge, the difference between the unsteady scenarios Run2 and Run4 is considerable. The minimum, mean and maximum values reach -3.01m, 1.76m and 4.03m, respectively. As we move seaward, the difference gradually decreases and almost disappears at the isohaline depth of 16m (<0.1m).
4.2 Erosion process of abandoned sand spit
The change of isobath reflects the determining effect of dynamics on geomorphology and the feedback effect of geomorphology on dynamics, and the spatial distribution difference of the dynamical geomorphological state is evaluated by studying the stability of 0m isobath in the sub-delta area of Qingshui Gou. The study investigated the spatial and temporal change process of the shoreline of the abandoned sand spit, and divided the abandoned sand spit into three sections, namely, the northern part of the abandoned sub-delta (section I), the abandoned estuary section (section II), and the southern part of the abandoned sub-delta (section III), and generated 777 cross-section lines and 550 cross-sections with DSAS (Figure 8), and the formulae of the EPR indexes and SCE indexes for the period from 2002 to 2007 are as follows:
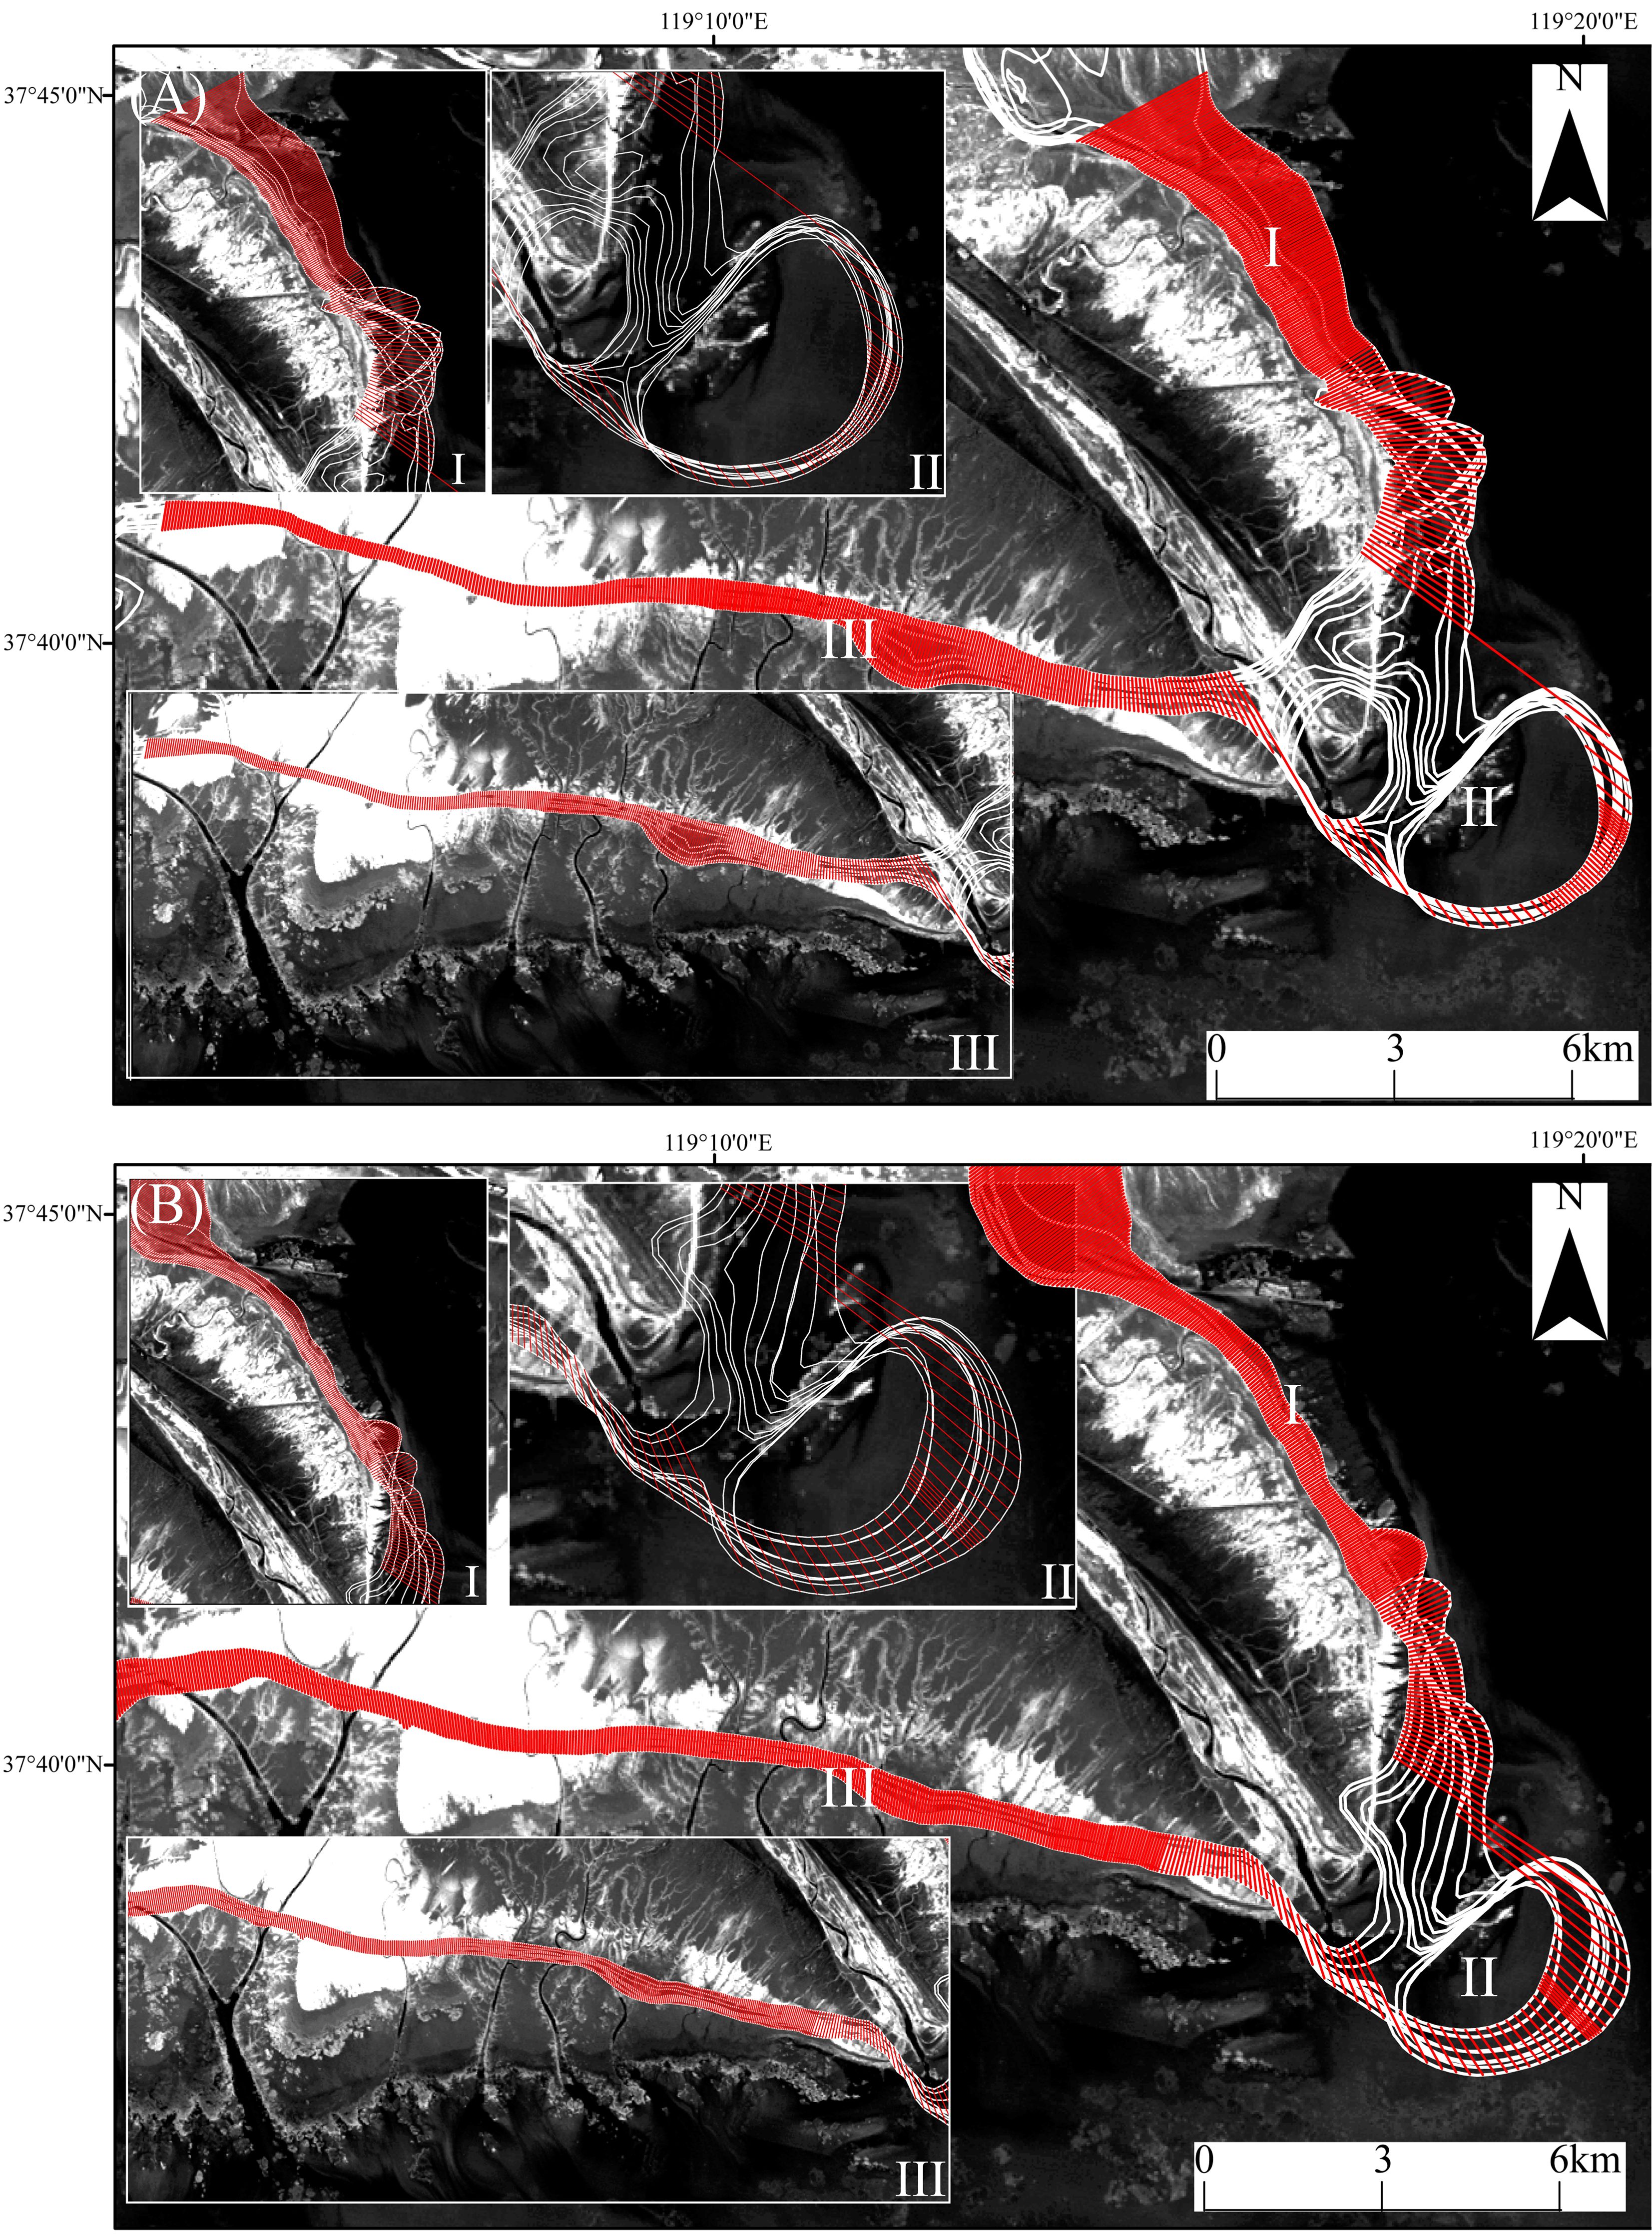
Figure 8. Changes in 0 m isobaths in the abandoned Qingshuigou sub-delta, 2002-2007 (A) Scenario Run2 (B) Scenario Run4.
In this context, D1 represents the distance between the earlier period and the baseline of the two isobaths, while D2 denotes the distance between the later period and the baseline of the two isobaths. The average annual rate of change of the isobaths, designated as EPR, is calculated according to the following formula:
In this context, t1-t2 denotes the isobath change time interval.
As a whole, the shoreline near the abandoned sand spit shows a landward erosion retreat (Figure 9), and the maximum accretion and erosion rates occur around the abandoned sand spit, but the evolution of its isobaths has obvious spatial and temporal variability, and the maximum erosion rate occurs at slightly different locations. The results of Run2 show that the isobaths changed at an annual average rate of -45.61 m/a during the period of 2002-2007. The annual average rate of change of the isobaths in region I is -19.96 m/a, and that of region III is -45.61 m/a. The average annual change rate of isobath in area I is -19.96m/a, the average annual change rate of isobath in area III is -45.61m/a, the maximum accretion rate of isobath reaches 213.25m/a, and the maximum erosion rate is -443.51m/a, which all occur in area II. This area is affected by the tidal field, and the seabed sediment is washed by the erosion, and the average rate of erosion after the erosion backing up of the isobaths occurs is -35.12m/a. The results of Run4 show that during the period of 2002-2007, the average annual change rate of isobath is -21.48 m/a. The average annual change rate of isobath in area I is 8.87 m/a, and the average annual change rate of isobath in area III is -72.62 m/a. The maximum accretion rate of isobath reaches 492.99 m/a, and the maximum erosion rate is -368.02 m/a, which all happen in area II. The shoreline erosion recession occurs in area II, and the shoreline erosion recession rate is -35.12 m/a. In the region, the average erosion rate of the shoreline is -0.66m/a. The overall performance of the power geomorphic state is stable in the north and south, and active in the sand spit.
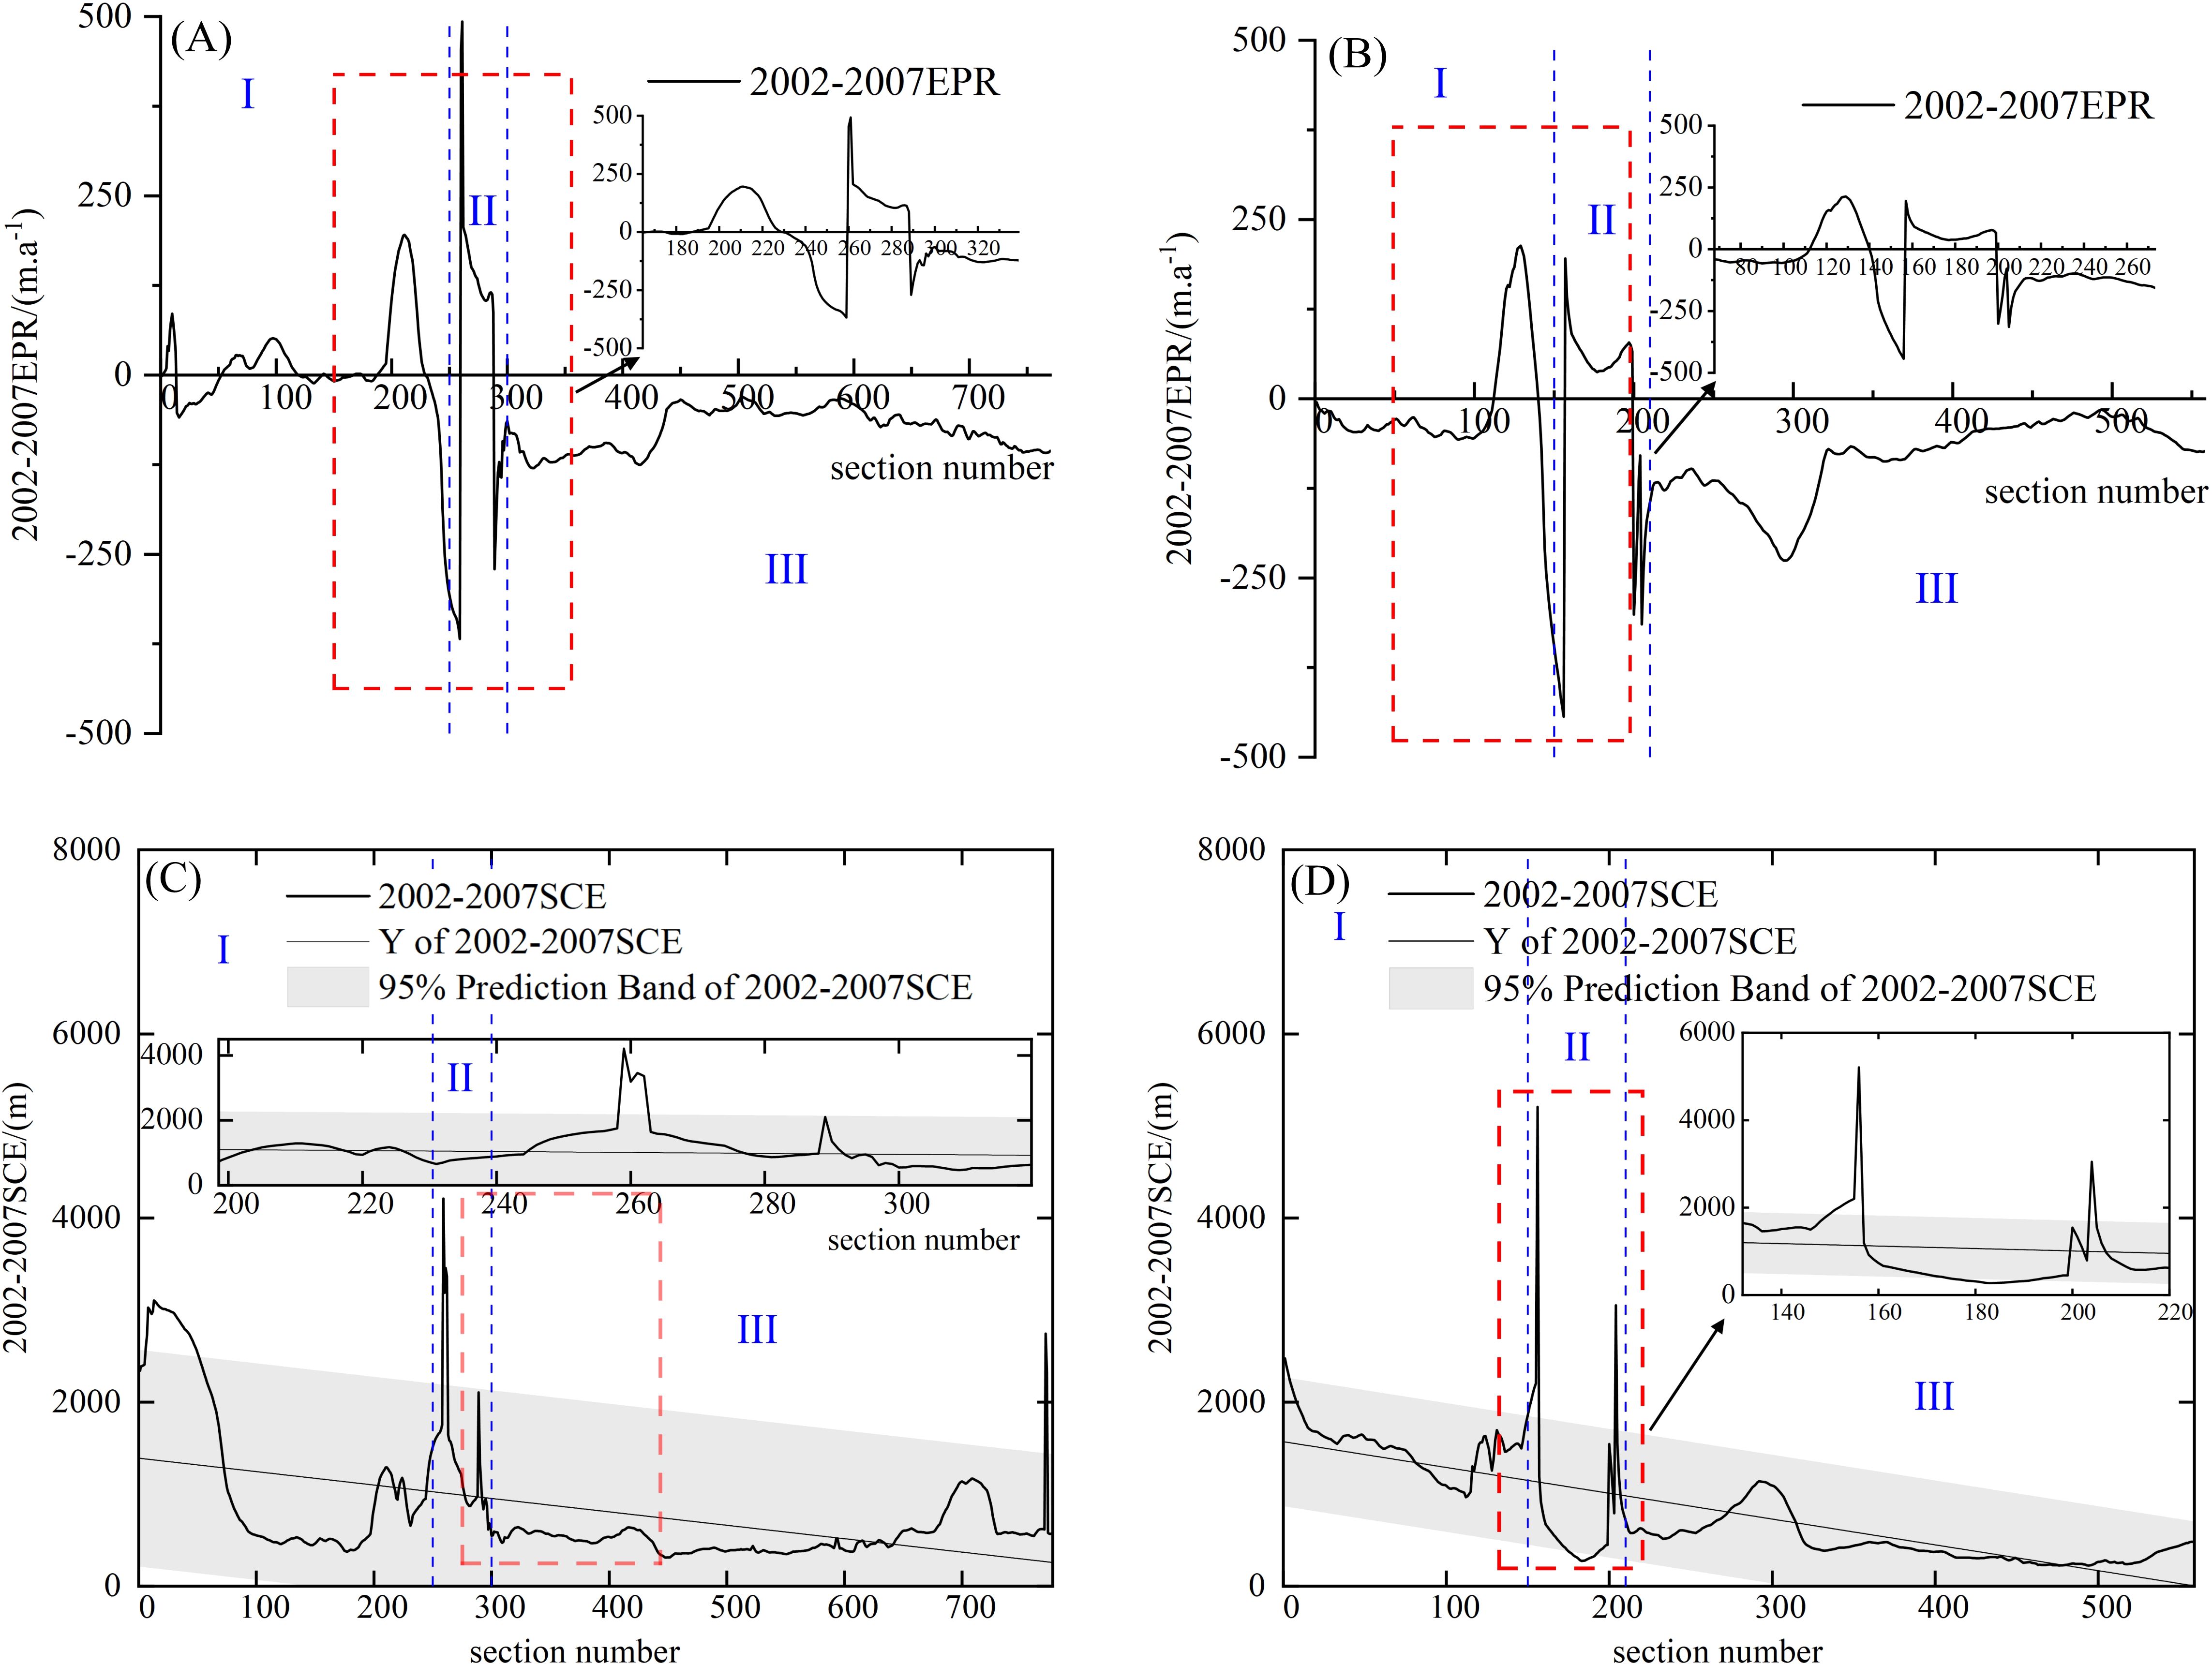
Figure 9. 2002-2007 Qingshuigou sub-delta (A) EPR change curves for Scenario Run2 (B) SCE change curves for Scenario Run4 (C) EPR change curves for Scenario Run2 (D) SCE change curves for Scenario Run4.
4.3 The characteristics of the distribution of sediments entering the sea
In order to track the distribution of the Yellow River sediment into the sea, the distribution characteristics of the Yellow River sediment into the sea were obtained by setting the Yellow River sediment fraction separately. The total mass distribution was categorized into three groups based on the contours: low sediment deposition area (0.1 kg/m²-1 kg/m²) (e.g., deep sea or strong current area); medium sediment deposition area (1 kg/m²-3 kg/m²); and very rich sediment deposition area (>3 kg/m²) (e.g., near-shore deposition area or estuarine area). This study compares the distribution of the total mass of sediment in the 3.9 μm inlet under Run1, Run2 and Run4 scenarios (Figure 10). The inlet sediment under the three scenarios is centered on the 16 m isobath in the southern part of Bohai Bay, with an overall northwest-southeast oriented strip distribution and a droplet-shaped distribution in the southeast direction.
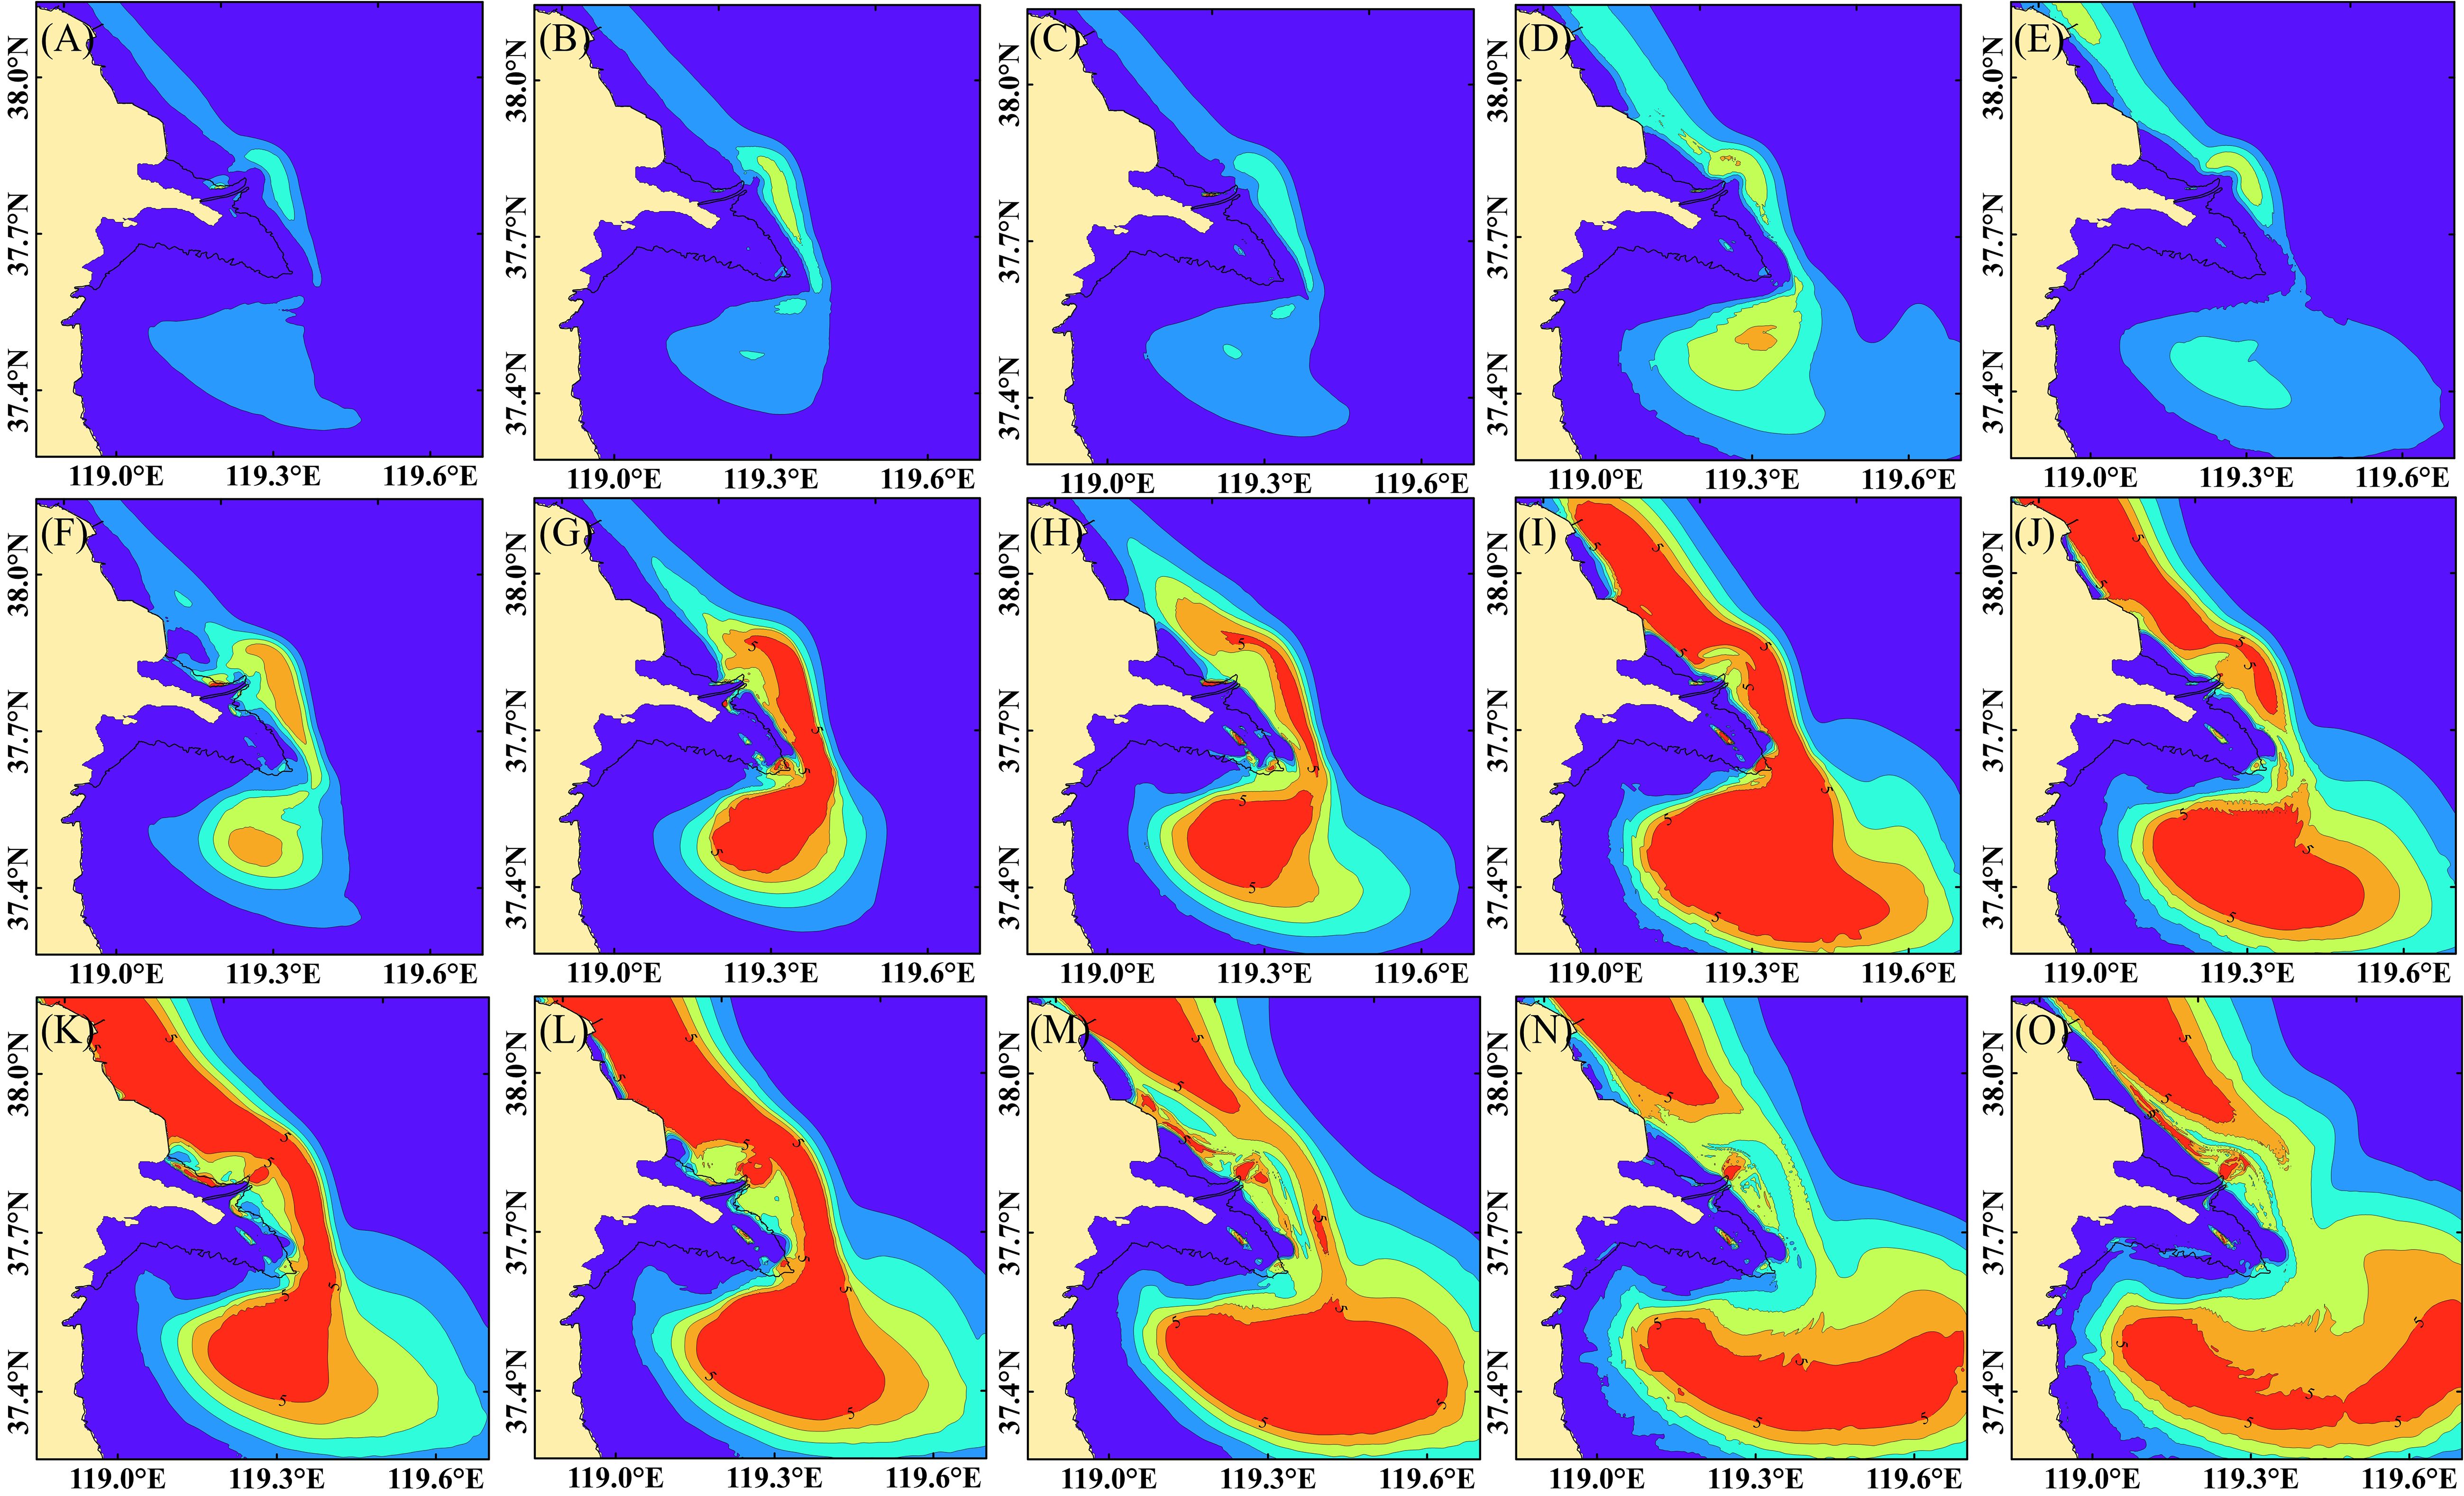
Figure 10. Distribution of total mass of 3.9 μm sediment entering the ocean (A–E) Spatial distribution of total sediment mass for 2002-2007 under the constant scenario (Run1), (F–J) Spatial distribution of total sediment mass for 2002-2007 under the constant scenario (Run2); (K–O) Spatial distribution of total sediment mass for 2002-2007 under the unsteady scenario (Run4).
In the Run2 scenario, the distribution range of the 0.1 kg/m² contour is not significantly different from that in the constant current scenario. However, in Laizhou Bay, the distribution ranges of the 1kg/m² contour and the 3kg/m² contour were significantly enlarged due to the fact that the water-sediment inflow during the flood season was three times of that during the dry season. In addition, sporadic areas of point-like high quality distribution were observed in the abandoned Shazui River channel.
Compared to the Run 4 scenario, the 0.1kg/m² and 1kg/m² contours extended into the upper intertidal zone in the southern part of the abandoned delta. In addition, the 1kg/m² and 3kg/m² contours show a significant amplification of radioactivity in Laizhou Bay.
Overall, the seasonal variation of water-sediment from the Yellow River into the ocean has a relatively small impact on the 0.1 kg/m2 distribution of seabed sediments. In contrast, the 1kg/m2 and 3kg/m2 contours show significant water-sediment variations, with increased diffusion rate and diffusion range. This results in a more rapid and wider spatial and temporal distribution of differences.
5 Discussion
5.1 The impact of alterations in water-sediment fluxes on morphological evolution
Xiaolangdi Reservoir intercepts sediment and regulates water flow, significantly reducing the spatial and temporal distribution of altered water-sand fluxes and differentially affecting morphological evolution of the Qingshuigou Subaqueous Delta (Figure 2). Sediment thickness in the delta front area is concentrated in the outer edge of the estuary within 2-5 meters after reservoir operation compared to before (Figure 7E). The peak of sediment thickness is located 10-20 km from the estuary and reaches 4-5 meters. At the same time, the nearshore and inner delta areas (especially the inner estuary) show significant erosion, with thicknesses concentrating between -2 and -5 m, with particularly severe erosion close to the shoreline. This suggests that increased water velocities in a context of inadequate sediment supply have had a severe erosion effect within the estuary. Figures 11. further reveal the pattern of geomorphic adjustment in the Yellow River Delta after the operation of the Xiaolangdi Reservoir: deposition is further concentrated at the front edge of the estuary, and erosion extends to the nearshore and inland. This indicates that the delta has gradually changed from the mode of “deposition at the leading edge and localized erosion near the shore” to the mode of “enhanced deposition at the leading edge and intensified erosion near the shore”.
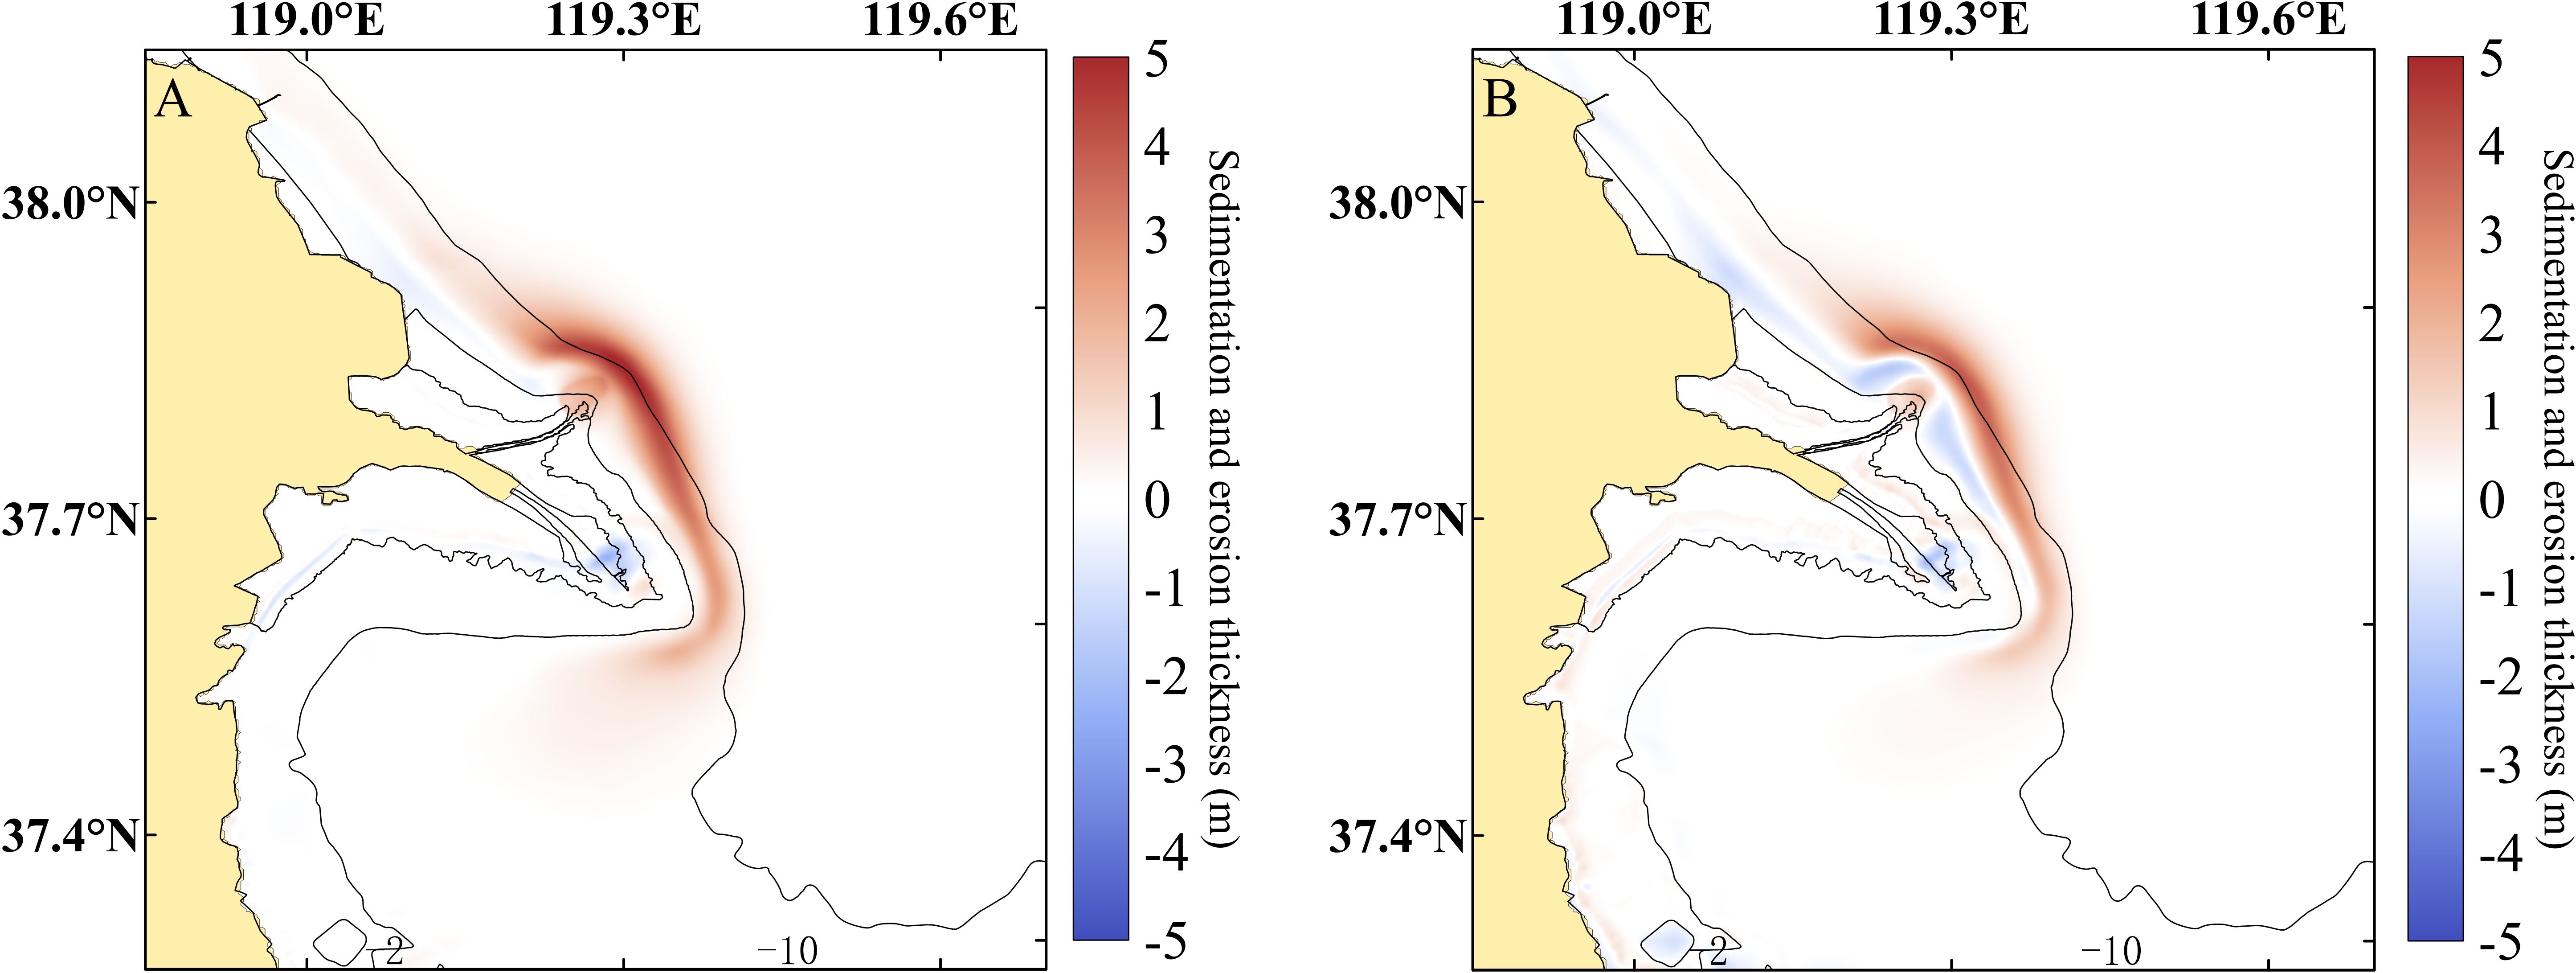
Figure 11. Spatial distribution of underwater erosion and accretion in the Qingshuigou Subaqueous delta, bottom panel shows initial topography for model calculations (A) 5-year erosion and accretion changes from 2002-1997, relative to initial 2002 topography (B) (Run4-Run3) Differences in erosion and accretion due to the construction of the Xiaolangdi Reservoir.
Scale maps of erosion and depositional areas in the study area differ significantly before and after the construction of the project, revealing the profound impact of human activities on the evolution of the regional geomorphology. Before construction, the area proportion of erosion (thickness -1-0m) reached 63.8%, indicating that the study area is dominated by erosional processes. While the total area of accretion (sediment thickness 0-1m) is 35.5%, the proportion of other thickness ranges is negligible. After construction, the proportion of sedimentary area increased to 50.8%, indicating an enhancement of sedimentary processes; meanwhile, the proportion of erosive area decreased to 38.5%. This reflects that construction activities intensified the erosion process and inhibited the expansion of accretion. In the pre- and post-construction comparisons (Figure 12), the area of deposition (0-1 m thickness) increased by 68.8%, while the area of -1 to 0 m erosion increased by 23%. This difference suggests that construction activities weakened the spatial distribution of erosional processes to some extent and is associated with altered dynamical conditions and sediment redistribution (Figure 10).
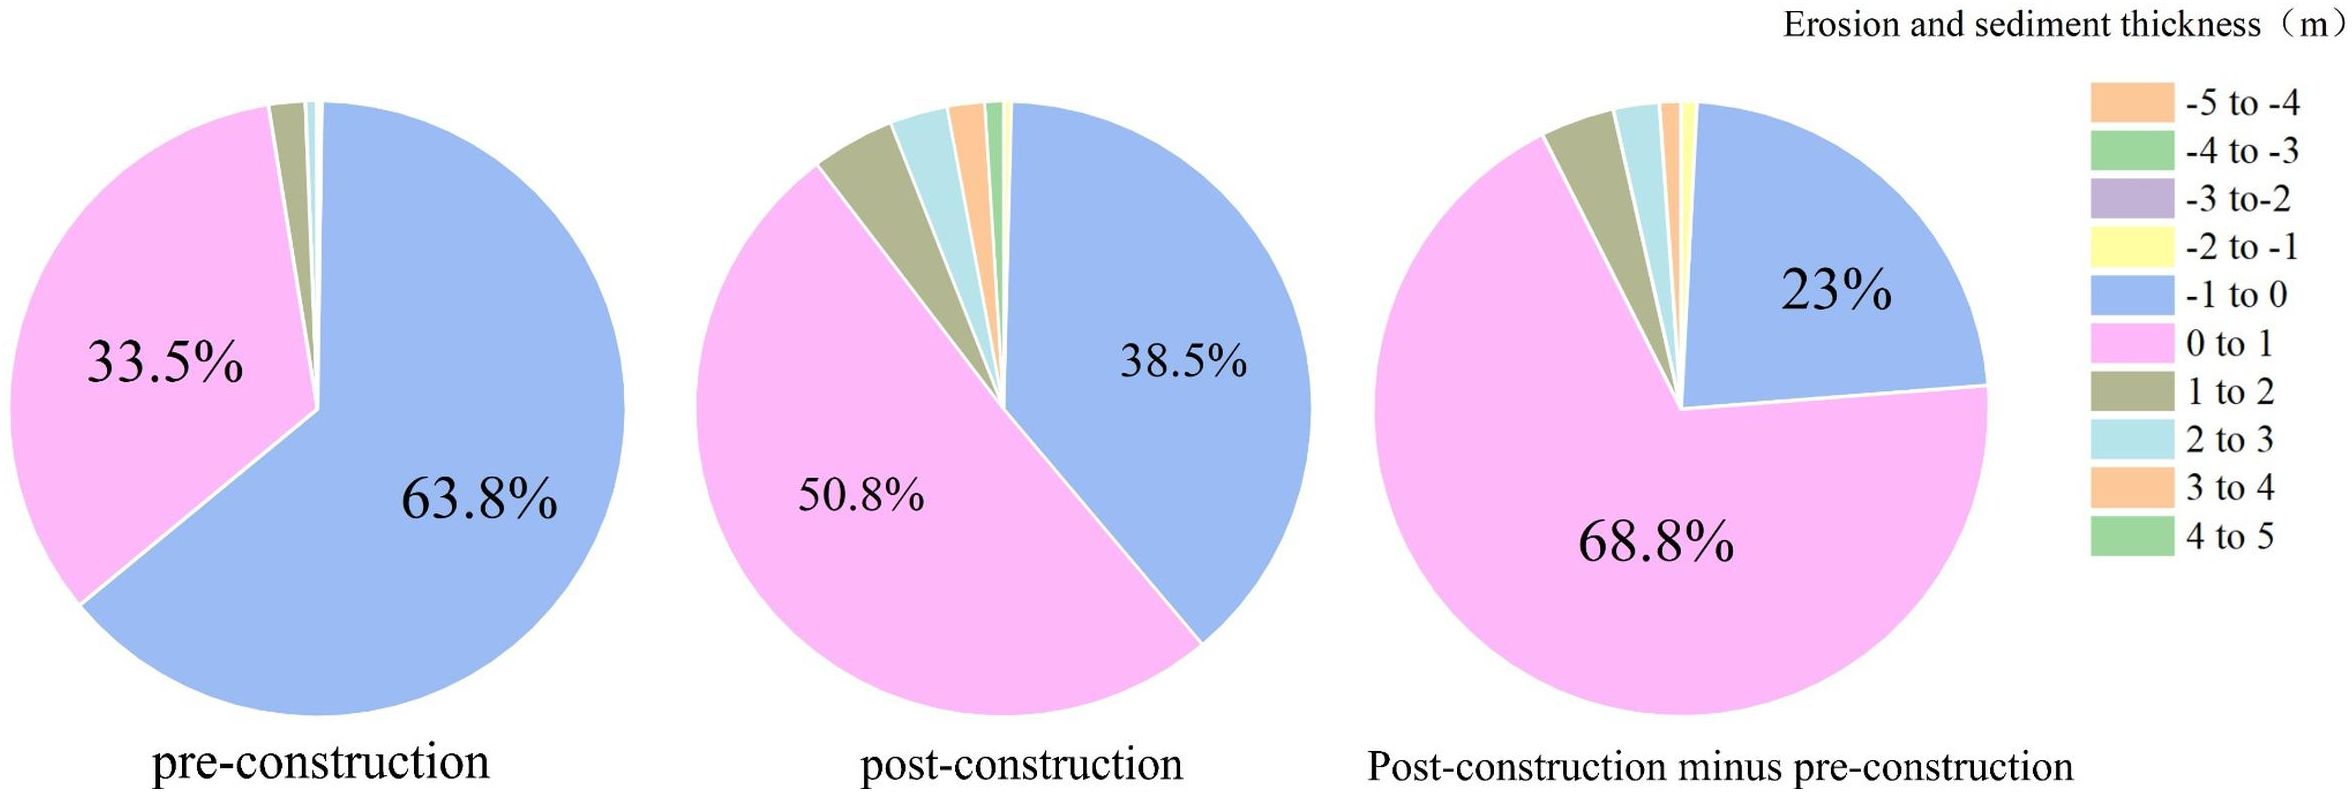
Figure 12. Proportional allocation of area corresponding to erosion and sediment thickness in the study area.
Unlike previous studies, the study reveals the evolution of underwater delta landforms in Qingshui Gou from 1997 to 2007 on a spatial planar scale, rather than analyzing them from the perspective of erosion and sediment quality of deposition (Fu et al., 2021), so it is possible to make the inference that after the construction of the Xiaolangdi Reservoir, the intensity of erosion in the underwater delta became higher compared to the previous period.
For Section A (Figure 13B), which crosses the delta front (Figure 13A), significant accretion occurred between 1997 and 2001, particularly in the range of 10,000 to 20,000 meters from the river mouth, reflecting strong progradational processes under high sediment supply conditions. Sediment thickness along Profile A is greater during 2001–2005 compared to 2005–2007, underscores the interplay between modeling strategies and hydrological alterations induced by the Xiaolangdi Reservoir. During 2001–2005, the preferential acceleration of the flood season emphasized high sediment transport capacity and delivery, resulting in enhanced sediment deposition along the delta front. Conversely, during 2005–2007, the dry season’s accelerated simulation magnified conditions of reduced sediment supply, thereby suppressing deposition and intensifying nearshore erosion. This shift highlights the critical role of seasonal dynamics in sediment transport and deposition processes, especially when subjected to artificial acceleration factors in morphodynamic modeling.
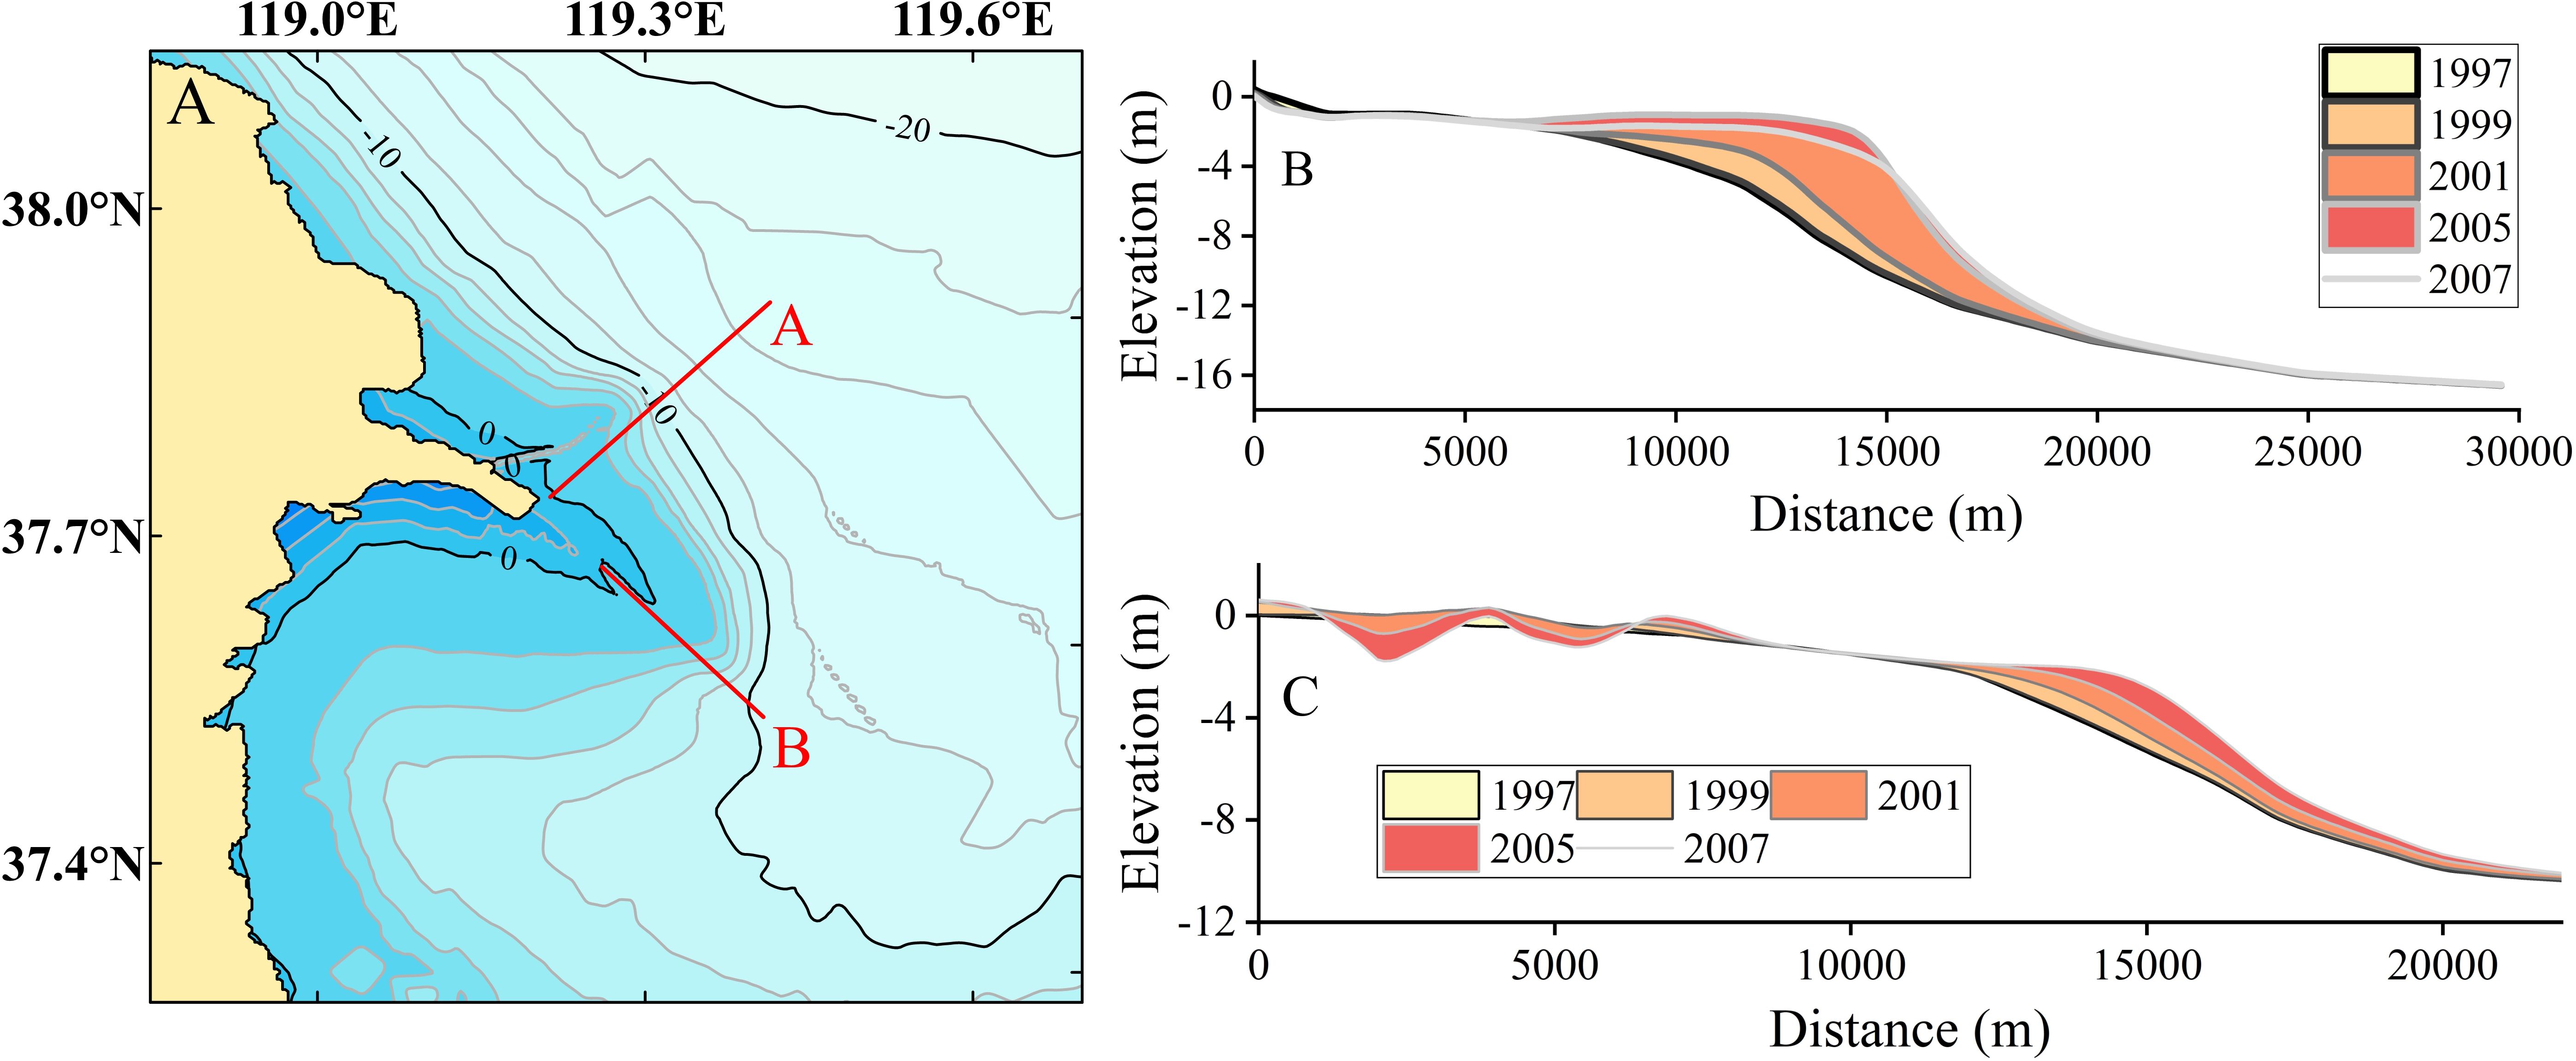
Figure 13. cross-sectional position and cross-sectional morphological adjustments (A) cross-sectional position (B) Section A bed change process (C) Section B bed change process.
Additionally, this pattern reflects the compounded impact of long-term sediment trapping by the Xiaolangdi Reservoir. By 2005–2007, sediment delivery to the delta had been significantly reduced, particularly during the dry season, further inhibiting sedimentation and exacerbating erosion in nearshore areas (Figure 11B). These findings demonstrate the need to consider both natural sediment supply reductions and the methodological implications of accelerated simulations when interpreting model outputs.
For Section B (Figure 13C), which spans the inner delta and nearshore areas (Figure 13A), the 1997-2001 period showed localized accretion and overall stability in elevation. However, after 2002, significant erosion occurred in nearshore areas (2,000 to 8,000 meters from the river mouth), with elevation dropping markedly. The thickness of sedimentation in the outer delta remained more or less the same in 2001-2005 and 2005-2007, indicating that the sedimentation process was relatively stable during these two periods. This phenomenon may have been influenced by a combination of the persistence of residual sediment transport and the modelled acceleration factor, so that the sedimentation process in the outer delta region did not weaken significantly, as expected, but remained at a certain level of intensity.
In summary, planar and cross-sectional analyses indicate that the operation of the Xiaolangdi Reservoir has led to enhanced deposition of the delta’s leading edge and enhanced nearshore erosion, with far-reaching effects on deltaic geomorphic dynamics, although also influenced by estuarine shear fronts, and differences in the tidal phases of deeper and shallower waters (Guo et al., 2022; Wang et al., 2024b). Changes in water and sediment inflow to the ocean will largely influence the evolution of the current estuarine zone and the abandoned lobe flap of the Qingshuigou, and the spatial and temporal distributions of sedimentary adjustments and associated geomorphic units will vary.
5.2 Alterations in deltaic depositional environments
Sediment grain size characteristics of the Yellow River delta have been significantly affected by river channel change and human activities (Renxizi et al., 2012; Wu et al., 2017). Since the diversion of the Yellow River in 1976, sediment grain size has changed to different degrees, especially in the abandoned sub-delta region. These changes reflect the direct impacts of river management and land-use adjustments on the sedimentary environment, which provide an important background for numerical modeling studies. The study analyzes changes in sediment volume fractions to infer sediment sources, transport processes, and so on.
Since 1996, when the river channel was artificially changed, the proportion of non-cohesive sediment in the surface layer of the tidal flats of the abandoned sub-delta has increased significantly, and the proportion of cohesive sediment has decreased accordingly (Figures 14, 15). The simulated coarsening trend of the surface sediment is consistent with the results of previous observations before and after the water-sediment regulation events (Wang et al., 2017b), with the loss of fine-grained sediment from the tidal flats, and the average proportion of the 125 μm sediment in the upper part of the tidal flats reaching more than 90%. Due to the weakening of river dynamics and the strengthening of ocean dynamics, the abandoned sand spit undergoes rapid morphological changes, including the retreat of the shoreline or the formation of new sedimentary features. The proportion of non-cohesive sediment near the abandoned sand spit decreased despite the influence of flood season water-sediment, reflecting the trend of coarsening sediment grain size.
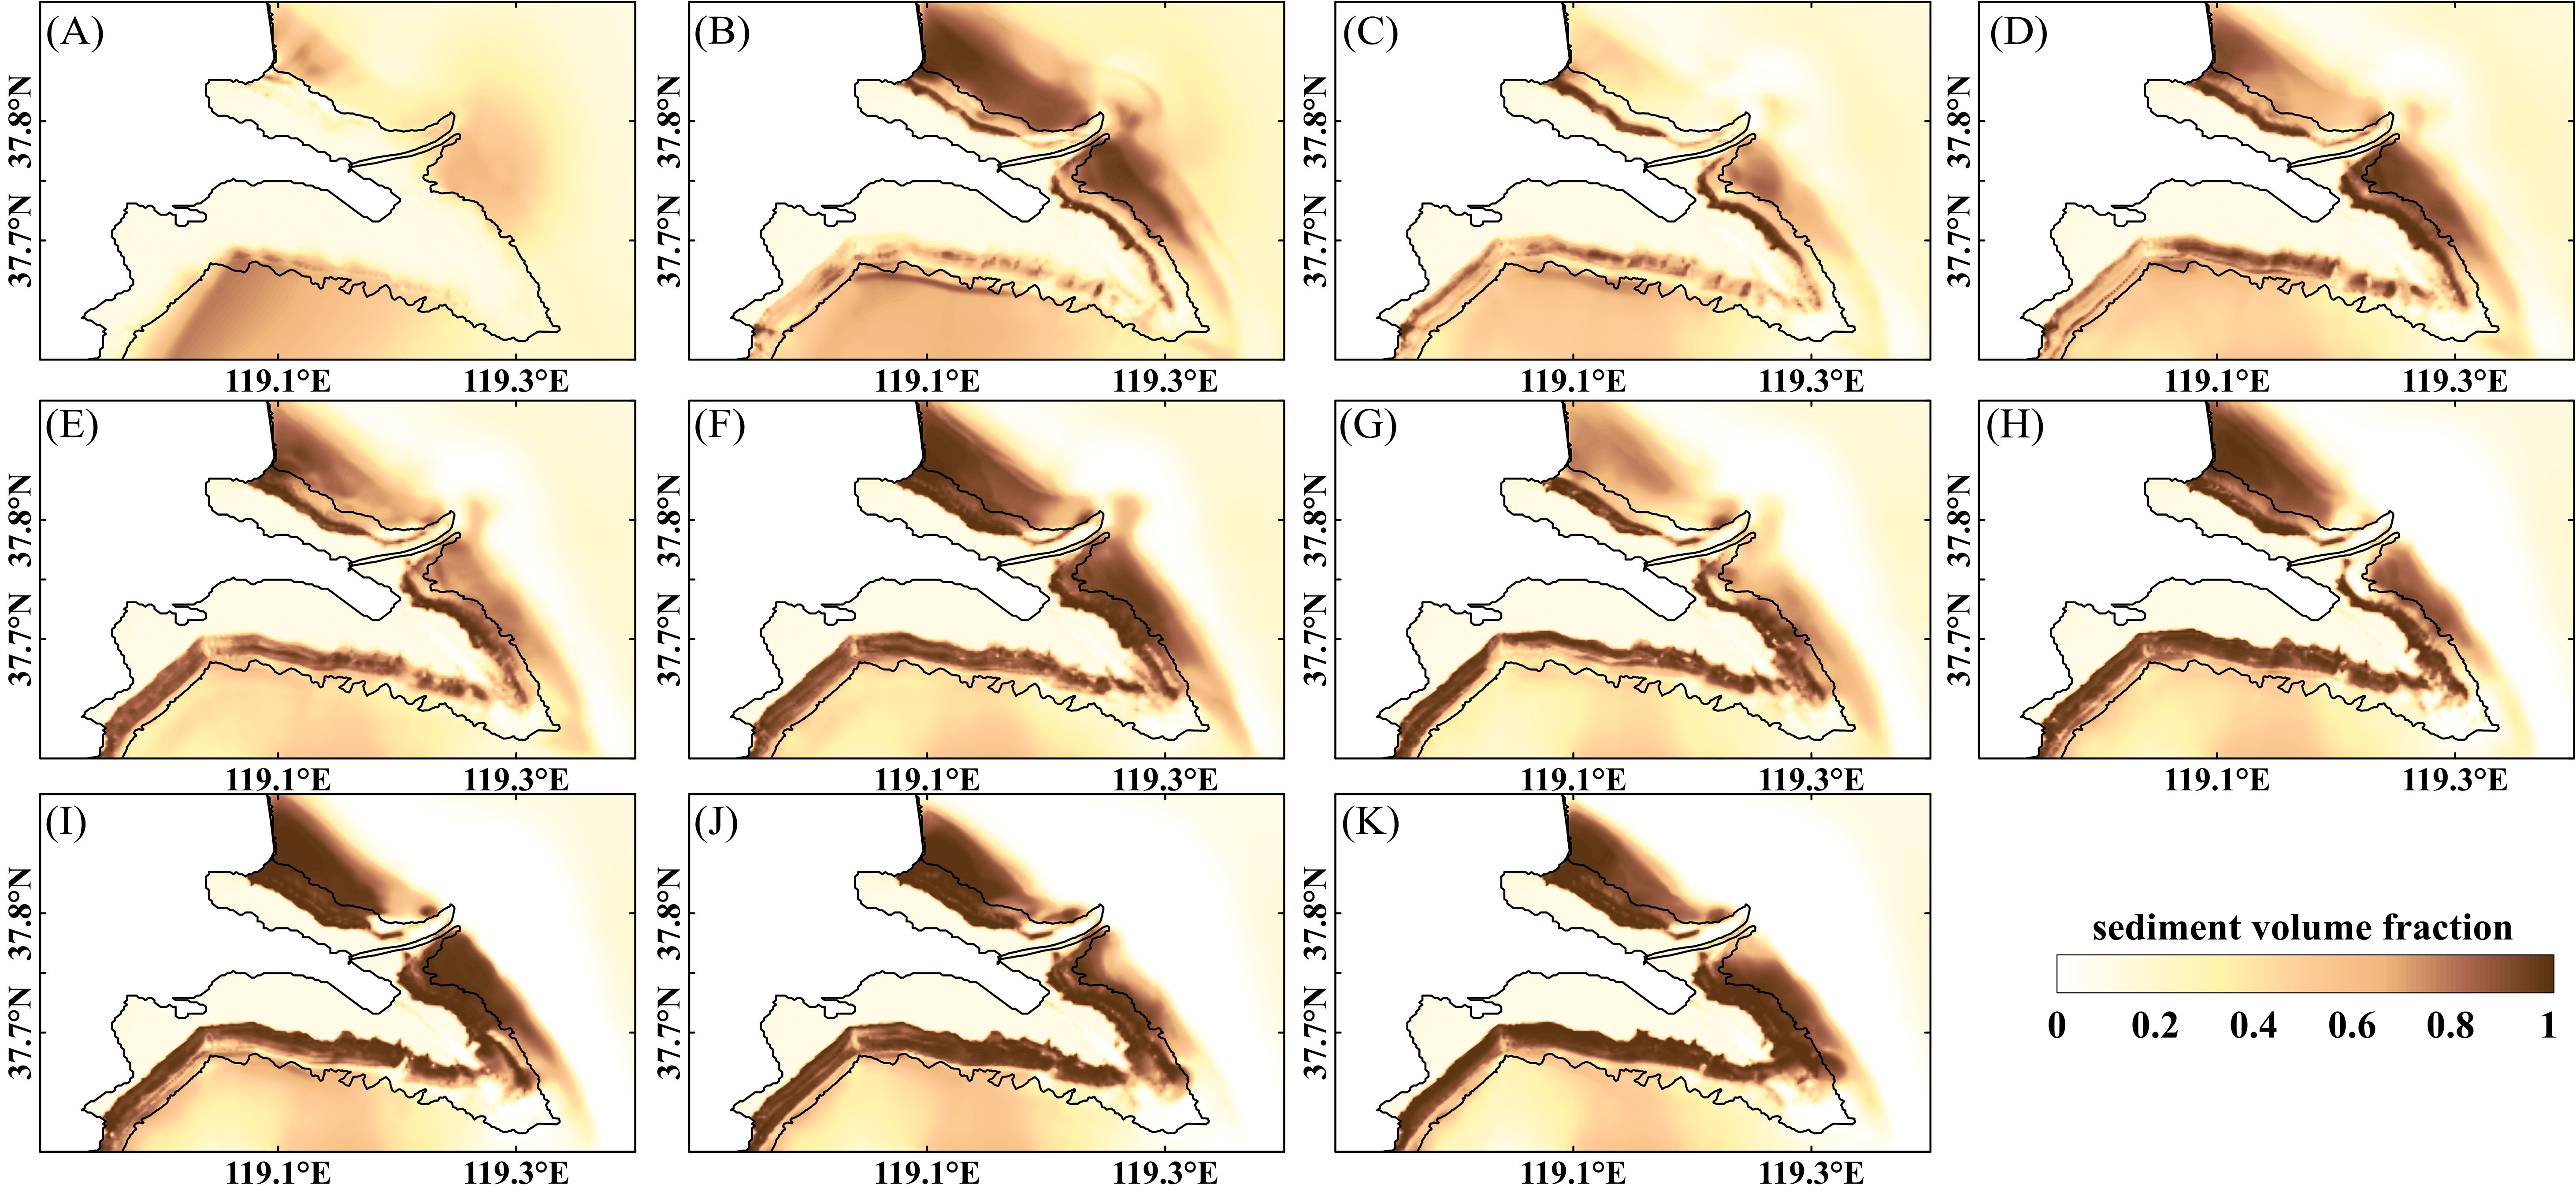
Figure 14. Spatial and temporal distribution of sediment volume fraction ratios for the unsteady scenario (Run3) 125 μm (A–K) represents the period 1997/3-2002/2 with an interval of 6 months.
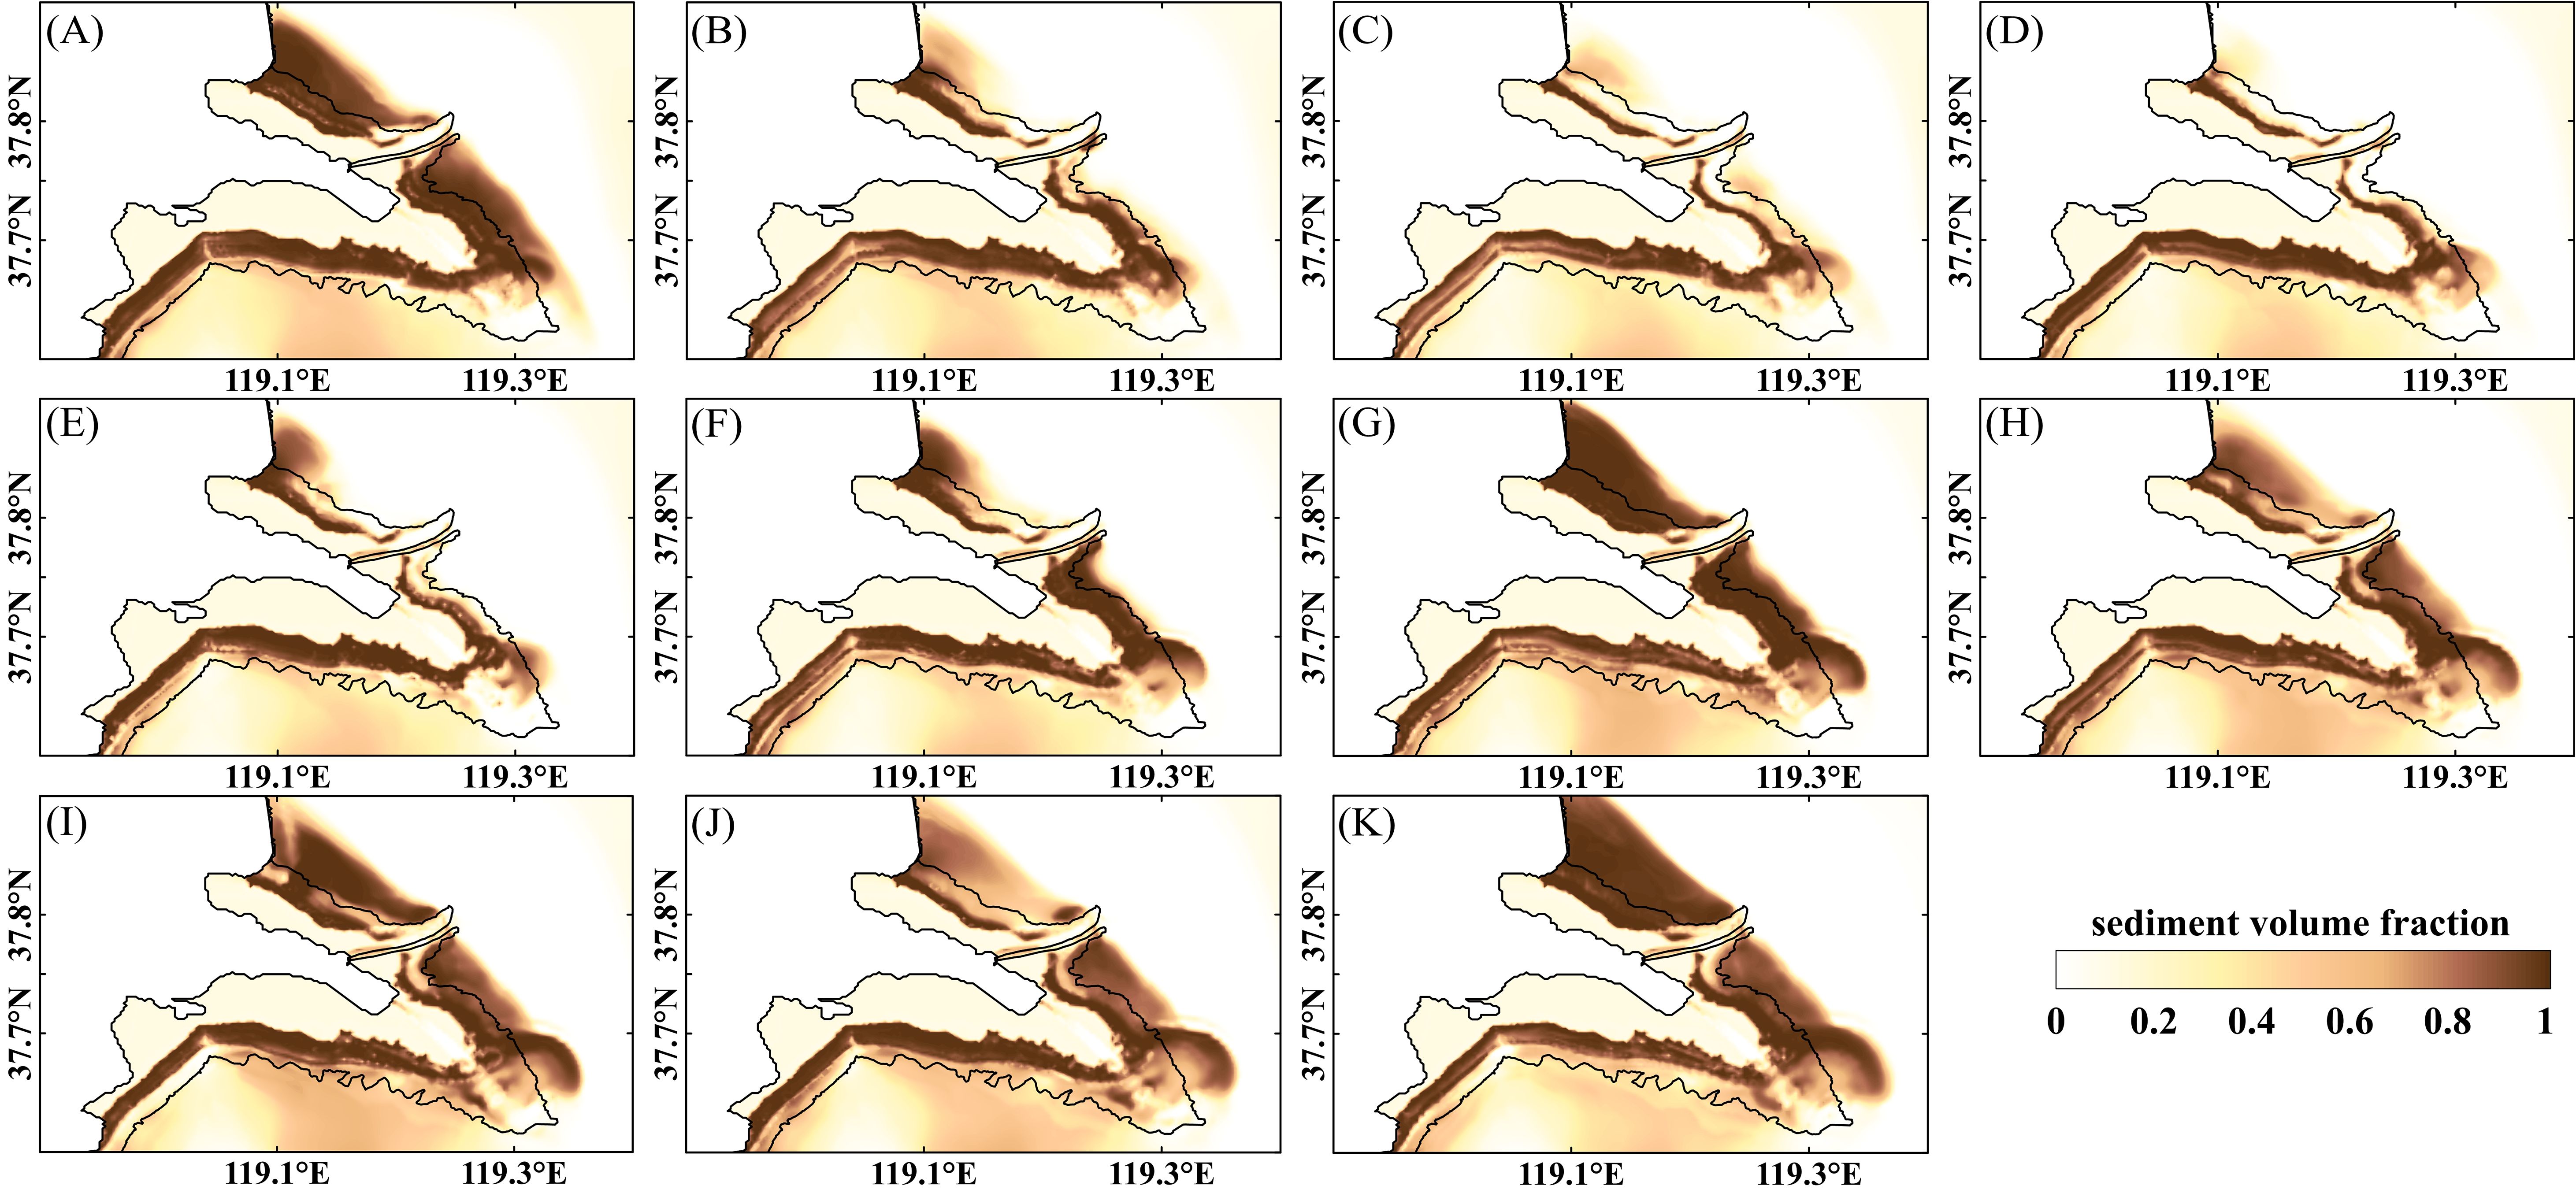
Figure 15. Spatial and temporal distribution of sediment volume fraction ratios for the unsteady scenario (Run4) 125 μm (A–K) represents the period 2002/3-2007/2 with an interval of 6 months.
Reservoir “water storage sand” role regulates the allocation of water-sediment, the impact of the depositional environment is mainly concentrated in the current estuarine region, by the flood season high flow impact, the bed near the mouth of the sea appeared “transient” sediment refinement phenomenon (The proportion of cohesive sand has increased substantially over the past few months), which is the same as the previous short time scales under the This is conceptually consistent with previous numerical studies on short time scales (Wu et al., 2023), and the degree of refinement is higher than that before the implementation of water-sediment regulation scheme. More importantly, the implementation of water-sediment regulation scheme did not significantly change the trend of coarsening of grain size in the abandoned Qingshuigou sub-delta, mainly due to the temporal and spatial lag in the supply of sediments from the Yellow River to the abandoned sub-delta, and the overall decrease in the total amount of sand and water entering the ocean since 1969 (Peng and Chen, 2010), and rooted in artificial diversion of the river, where the reduction of flow velocity in the diverted estuary may lead to the accumulation of sediment in the river channel and its entry into the ocean. accumulate in the channel, and sediment entering the ocean is controlled by the distance and angle between the abandoned and diverted estuaries, making transport to the old estuary and nearby tidal flats more difficult (Lin et al., 2024).
During the dry season, the sediment distribution near the estuary shows a trend of decreasing fine-grained sediment and a relative increase in coarse-grained sediment, not from localised accretion of upstream sediment, but due to changes in the boundary conditions of the model. The decrease in total seawater input sand during the dry season directly leads to a significant reduction in fine-grained sediments (e.g., 62.5 µm and smaller particles). The reduction of these fine-grained sediments implies that the only remaining coarse-grained sediments (with relatively large volume fractions) dominate the spatial distribution in the estuary and neighbouring seas. Due to the higher accretion rate of the coarser-grained sediments, these coarse-grained sediments were able to be relatively retained or accumulated by the lower fluvial dynamics conditions during the dry season, showing an increase in volume fraction.
This dynamic change in sediment grain size distribution highlights the significant influence of changing water and sand conditions on sediment transport and accumulation during the dry season. It further suggests that despite the reduction in total sediment volume, coarser particles may eventually form significant localised accumulations near the estuary due to the interaction between their properties and the estuarine dynamical conditions. This phenomenon reflects the process of selective retention and deposition of sediments in the estuary under varying seasonal water-sediment conditions.
5.3 Modelling constraints and future work
The final results of the model may be influenced by a number of factors, including processes such as temperature, salinity, and biological interactions. The presence of vegetation has been observed to have a dual impact on sediment deposition and morphological stability (Xie et al., 2023; Wang et al., 2024a), both of which are crucial for the protection of coastal areas and the maintenance of ecosystem services (Marchetti et al., 2020). Furthermore, the utilisation of the 2DH morphodynamic model in the context of deltaic systems will yield disparate outcomes with regard to the reproduction of vertical flow or plume structure (Huisman et al., 2018). The exclusion of certain near-bed dynamical processes due to variations in sediment characteristics and the occurrence of intermittent turbulent outbursts in a cohesive fine-grained depositional environment may result in the generation of error in the results (Ji et al., 2024). The movement of sediment in natural environments is frequently characterised by high levels of nonlinearity and complexity. Consequently, the Partheniades-Krone formulation may not fully account for these nonlinear effects in certain instances. Furthermore, the reconstruction of a long-term, high-resolution erosion rate record in the Yellow River Delta region through the utilisation of a mountain long-term numerical simulation method can facilitate the presentation of a novel perspective, thereby enabling the elucidation of the multi-facies coupling effect and the millennial-scale morphological evolution process in the region (Geng et al., 2022).
6 Conclusions
The objective of this study was to investigate the effects of seasonal variations in water-and entering the ocean on the morphological modeling of river deltas. A long-term morphodynamic model of the Yellow River Delta was developed and validated. The long-term morphological response of the delta to water-sediment regulation scheme was simulated under unsteady and constant conditions, respectively. In addition, the fate of sediments released by the water-sediment regulation program was monitored and their contributions and impacts on accretion in the abandoned delta of the Qingshuigou Delta were assessed. The main conclusions are as follows:
1. The operation of the Xiaolangdi Reservoir has had a double effect on the sediment distribution in the Subaqueous delta of Qingshui Gou: on the one hand, it has enhanced the deposition of the leading-edge area, and on the other hand, it has intensified the erosion of the inland near-shore area. The delta has gradually changed from the pattern of “leading edge deposition and localized near-shore erosion” to the pattern of “enhanced leading edge deposition and intensified near-shore erosion”.
2. Influenced by the dynamic conditions and sediment redistribution, the construction of Xiaolangdi Reservoir has weakened the spatial distribution of the erosion process to a certain extent, changing the spatial distribution dominated by the erosion process before the construction to the spatial distribution dominated by the sedimentation process after the construction.
3. The proportion of 125 μm sediment in the supratidal zone of the southern tidal flats of the abandoned delta has increased from 22% to over 90% as a result of the river diversion and the spatial and temporal distribution of sediment into the sea. The grain size of the abandoned sub-delta has also coarsened, leading to highly stable changes in the shoreline near the abandoned tidal flats of the southern part of the delta in recent years, with an average EPR of -72.m/a. The abandoned sand spit has undergone significant changes due to the complex sedimentary environment and continuous erosion by wave action, with a rate of change of 62 m/a. Conversely, the abandoned sand spit, subject to continuous erosion by wave action, exhibits a complex depositional environment, with a pronounced shift in erosion and accretion. This has resulted in a notable change in the EPR, exceeding 500 m/a.
4. The numerical simulation of the dynamic morphological evolution of the Yellow River Delta over an extended period of time yielded results that were comparable to those observed in the remotely sensed images. This approach provides a viable method for validating the long-term morphodynamic model. It is essential to validate the morphological units in order to guarantee the accuracy and reliability of the model. Furthermore, this approach allows for the effective assessment of the model’s ability to capture the primary dynamic mechanisms driving landscape evolution, while also providing a robust foundation for subsequent studies. Nevertheless, it is essential to exercise caution with regard to the quality of the input data and the reasonableness of the model parameters, in order to guarantee the reliability of the results. This is because they may give rise to different morphological changes, as demonstrated in the present study.
Data availability statement
The raw data supporting the conclusions of this article will be made available by the authors, without undue reservation.
Author contributions
JRZ: Conceptualization, Data curation, Formal analysis, Investigation, Methodology, Software, Validation, Visualization, Writing – original draft, Writing – review & editing. QW: Funding acquisition, Project administration, Supervision, Writing – review & editing. CZ: Funding acquisition, Project administration, Supervision, Writing – review & editing. ZL: Formal analysis, Investigation, Writing – original draft. YC: Conceptualization, Methodology, Writing – original draft. HW: Validation, Visualization, Writing – original draft. ZYL: Investigation, Validation, Writing – original draft. LY: Software, Visualization, Writing – original draft. QS: Software, Visualization, Writing – original draft. YL: Formal analysis, Methodology, Writing – review & editing. TS: Conceptualization, Investigation, Writing – review & editing. JZ: Methodology, Software, Writing – review & editing. HS: Methodology, Software, Writing – review & editing.
Funding
The author(s) declare financial support was received for the research, authorship, and/or publication of this article. We are grateful for financial support from the National Natural Science Foundation of China (Grant No. 42330406) (Grant No. 42476163).
Conflict of interest
The authors declare that the research was conducted in the absence of any commercial or financial relationships that could be construed as a potential conflict of interest.
Publisher’s note
All claims expressed in this article are solely those of the authors and do not necessarily represent those of their affiliated organizations, or those of the publisher, the editors and the reviewers. Any product that may be evaluated in this article, or claim that may be made by its manufacturer, is not guaranteed or endorsed by the publisher.
References
Bai Y., Sun Y., Xu H., Wu J., Tian Y. (2024). Simulation experiment on morphological evolution characteristics of tail river channel. Adv. in Water Sci. 35 (3), 508–520. doi: 10.14042/j.cnki.32.1309.2024.03.014
Cao Y., Wang Q., Zhan C., Li R., Qian Z., Wang L., et al. (2023). Evolution of tidal flats in the Yellow River Qingshuigou sub-delta: spatiotemporal analysis and mechanistic changes, (1996-2021). Front. Mar. Sci 10. doi: 10.3389/fmars.2023.1286188
Du X., Wang K., Dou S., Xie W., Fan Y. (2022). Response of the longitudinal profile adjustment of the tail channel in the Yellow River Estuary to the inflow of water and sediment. People's Yellow River 44 (1), 37–41, 51. doi: 10.3969/j.issn.1000-1379.2022.01.008
Fan H., Huang H., Tang J. (2007). Spectral signature of waters in huanghe estuary and estimation of suspended sediment concentration from remote sensing data. Geomatics Inf. Sci. Wuhan University. 32 (7), 601–604. Available online at: http://ch.whu.edu.cn/cn/article/id/1948.
Fan Y., Chen S., Zhao B., Yu S., Ji H., Jiang C. (2018). Monitoring tidal flat dynamics affected by human activities along an eroded coast in the Yellow River Delta, China. Environ. Monit Assess 190, 396. doi: 10.1007/s10661-018-6747-7
Fu Y., Chen S., Ji H., Fan Y., Li P. (2021). The modern Yellow River Delta in transition: Causes and implications. Mar. Geology 436, 106476. doi: 10.1016/j.margeo.2021.106476
Gao J., Hui H., Liu Y., Shi H. (2024). Influences of Bragg reflection on harbor resonance triggered by irregular wave groups. Ocean Eng 305, 117941. doi: 10.1016/j.oceaneng.2024.117941
Gao J., Ma X., Dong G., Chen H., Liu Q., Zang J. (2021). Investigation on the effects of Bragg reflection on harbor oscillations. Coast. Eng 170, 103977. doi: 10.1016/j.coastaleng.2021.103977
Gao J., Ma X., Zang J., Dong G., Ma X., Zhu Y., et al. (2020). Numerical investigation of harbor oscillations induced by focused transient wave groups. Coast. Eng 158, 103670. doi: 10.1016/j.coastaleng.2020.103670
Geleynse N., Storms J. E. A., Walstra D.-J. R., Jagers H. R. A., Wang Z. B., Stive M. J. F. (2011). Controls on river delta formation; insights from numerical modelling. Earth Planetary Sci. Lett 302, 217–226. doi: 10.1016/j.epsl.2010.12.013
Geng H., Hong Y., Milledge D. G., Pan B., Guo Y. (2022). Frost cracking dictated landslide distribution in response to temperature change since Last Glacial Maximum across the Eastern Qilian Mountains. Earth Surface Processes Landforms 47, 3163–3179. doi: 10.1002/esp.5450
Guo L., Zhu C., Xu F., Xie W., van der Wegen M., Townend I., et al. (2022). Reclamation of tidal flats within tidal basins alters centennial morphodynamic adaptation to sea-level rise. J. Geophysical Research: Earth Surface 127, e2021JF006556. doi: 10.1029/2021JF006556
He Y., Wang Q., Xu Y., Li Z., Yuan J., Lu M., et al. (2022). Climate change increased the compound extreme precipitation-flood events in a representative watershed of the Yangtze River Delta, China. Stochastic Environ. Res. Risk Assess 36, 3803–3818. doi: 10.1007/s00477-022-02229-8
Huisman B. J. A., Ruessink B. G., de Schipper M. A., Luijendijk A. P., Stive M. J. F. (2018). Modelling of bed sediment composition changes at the lower shoreface of the Sand Motor. Coast. Eng 132, 33–49. doi: 10.1016/j.coastaleng.2017.11.007
Hydraulics W. D. (2003). Delft3D-FLOW: Simulation of Multi-Dimensional Hydrodynamic Flows and Transport Phenomena, Including Sediments—User Manual. Delft, Netherlands: Deltares.
Ji H. (2021). Geomorphodynamic changes and evolution mechanisms of the Yellow River Delta under the new water-sediment regime. (Doctoral Dissertation). East China Normal University, Shanghai, China. doi: 10.27149/d.cnki.ghdsu.2021.00041
Ji H., Chen S., Li P., Pan S., Gong X., Jiang C. (2024). Spatiotemporal variability of suspended sediment concentration in the coastal waters of Yellow River Delta: Driving mechanism and geomorphic implications. Mar. Geology 470, 107266. doi: 10.1016/j.margeo.2024.107266
Lin C., Bao R., Zhu L., Hu R., Ji J., Yu S. (2024). Surface sediment erosion characteristics and influencing factors in the subaqueous delta of the abandoned Yellow River Estuary. Mar. Geology 468, 107219. doi: 10.1016/j.margeo.2024.107219
Liu X., Chen S., Li P., Fu Y., Zhang C. (2022). Dynamic evolution and influencing factors of the shoreline of the Huanghe River Estuary from 1996 to 2020. Mar Bull. 2022 (4). doi: 10.11840/j.issn.1001-6392.2022.04.009
Marchetti Z. Y., Villalba A. B., Ramonell C., Brumnich F., Pereira M. S. (2020). Biogeomorphic succession in a fluvial-lacustrine delta of the Middle Paraná River (Argentina): Feedbacks between vegetation and morphodynamics. Sci. Total Environ 739, 139799. doi: 10.1016/j.scitotenv.2020.139799
Nienhuis J., Ashton A., Edmonds D., Hoitink A. J. F., Kettner A., Rowland J., et al. (2020). Global-scale human impact on delta morphology has led to net land area gain. Nature 577, 514–518. doi: 10.1038/s41586-019-1905-9
Peng J., Chen S. (2010). Response of delta sedimentary system to variation of water and sediment in the Yellow River over past six decades. J. Geographical Sci 20, 613–627. doi: 10.1007/s11442-010-0613-z
Renxizi R., Shenliang C., Ping D., Feng L. (2012). Spatial and temporal variations in grain size of surface sediments in the littoral area of yellow river delta. J. Coast. Res 28, 44–53. doi: 10.2112/JCOASTRES-D-11-00084.1
Shi H., Zang J., Liu Y. (2023). Mechanism analysis on the mitigation of harbor resonance by periodic undulating topography. Ocean Eng 281, 114923. doi: 10.1016/j.oceaneng.2023.114923
Van Rijn L. C. (1993). Principles of sediment transport in rivers, estuaries and coastal seas. (Amsterdam, The Netherlands: Aqua Publications). Available online at: https://api.semanticscholar.org/CorpusID:128990781
Wang H., Wu X., Bi N., Li S., Yuan P., Wang A., et al. (2017a). Impacts of the dam-orientated water-sediment regulation scheme on the lower reaches and delta of the Yellow River (Huanghe): A review. Global Planetary Change 157, 93–113. doi: 10.1016/j.gloplacha.2017.08.005
Wang K., Wu G., Liang B., Shi B., Li H. (2024a). Linking marsh sustainability to event-based sedimentary processes: Impulsive river floods initiated lateral erosion of deltaic marshes. Coast. Eng 190, 104515. doi: 10.1016/j.coastaleng.2024.104515
Wang N., Li K., Song D., Bi N., Bao X., Liang S., et al. (2024b). Impact of tidal shear fronts on terrigenous sediment transport in the Yellow River Mouth: Observations and a synthesis. Mar. Geology 469, 107222. doi: 10.1016/j.margeo.2024.107222
Wang Q., Wang X., Li X., Wang X., Zhan C. (2017b). Grain size characteristics and coarsening phenomenon of inter-tidal flat surficial sediment along the abandoned southern Yellow River sub-delta. Quaternary Sciences 37 (2), 353–367. doi: 10.11928/j.issn.1001-7410.2017.02.13
Wang Q., Zeng L., Zhan C., Liu X., Wang L., Cheng S., et al. (2022). Geomorphologic evolution of the shallow-buried abandoned Yellow River delta during the last 2000 years. Front. Mar. Sci. 9, 1073961. doi: 10.3389/fmars.2022.1073961
Wang Z., Lu K., Wen Z., Zhang Z., Li R., Mei X., Lan X, et al (2020). Grain size compositions and their influencing factors of the surface sediments in Eastern China Seas. Earth Sci. 45 (7), 2709–2721. doi: 10.3799/dqkx.2020.028
Willmott C. J. (1981). On the validation of models. Phys. Geogr 2, 184–194. doi: 10.1080/02723646.1981.10642213
Wu G., Wang K., Liang B., Wu X., Wang H., Li H., et al. (2023). Modeling the morphological responses of the yellow river delta to the water-sediment regulation scheme: the role of impulsive river floods and density-driven flows. Water Resour. Res 59, e2022WR033003. doi: 10.1029/2022WR033003
Wu X., Bi N., Xu J., Nittrouer J. A., Yang Z., Saito Y., et al. (2017). Stepwise morphological evolution of the active Yellow River (Huanghe) delta lobe, (1976–2013): Dominant roles of riverine discharge and sediment grain size. Geomorphology 292, 115–127. doi: 10.1016/j.geomorph.2017.04.042
Xie D., Gao S., Cunhong P. (2010). Advances in long-term morphodynamics of coastal environment. Ocean Engineering 28, 134–140.
Xie W., Sun J., Guo L., Xu F., Wang X., Ji H., et al. (2023). Distinctive sedimentary processes on two contrasting tidal flats of the Yellow River Delta. Front. Mar. Sci 10. doi: 10.3389/fmars.2023.1259081
Yang Z., Xia J., Zhou M., Deng S. (2022). Incoming sand composition and its relationship with morphological adjustment of the riverbed in the tailrace section of the Yellow River estuary. Journal of Wuhan University (Engineering Science). 55 (10), 985–992. doi: 10.14188/j.1671-8844.2022-10-002
Zhan C., Wang Q., Cui B., Zeng L., Dong C., Li X., et al. (2020). The morphodynamic difference in the western and southern coasts of Laizhou Bay: Responses to the Yellow River Estuary evolution in the recent 60 years. Global Planetary Change 187, 103138. doi: 10.1016/j.gloplacha.2020.103138
Keywords: The Yellow River Qingshuigou subaqueous delta, morphological evolution, numerical modeling, water-sediment regulation, depositional environments
Citation: Zhang J, Wang Q, Zhan C, Li Z, Cao Y, Wang H, Liu Z, Yu L, Song Q, Li Y, Su T, Zhu J and Shi H (2024) Morphological evolution of the Qingshuigou subaqueous delta of the Yellow River before and after the operation of the Xiaolangdi Reservoir (1997-2007). Front. Mar. Sci. 11:1495403. doi: 10.3389/fmars.2024.1495403
Received: 12 September 2024; Accepted: 30 November 2024;
Published: 18 December 2024.
Edited by:
Yifei Zhao, Nanjing Normal University, ChinaReviewed by:
Guoxiang Wu, Ocean University of China, ChinaJunliang Gao, Jiangsu University of Science and Technology, China
Copyright © 2024 Zhang, Wang, Zhan, Li, Cao, Wang, Liu, Yu, Song, Li, Su, Zhu and Shi. This is an open-access article distributed under the terms of the Creative Commons Attribution License (CC BY). The use, distribution or reproduction in other forums is permitted, provided the original author(s) and the copyright owner(s) are credited and that the original publication in this journal is cited, in accordance with accepted academic practice. No use, distribution or reproduction is permitted which does not comply with these terms.
*Correspondence: Qing Wang, c2NoaW5nd2FuZ0AxMjYuY29t; Chao Zhan, emhhbmNoYW8wMjI2QDE2My5jb20=
 Jiarui Zhang
 Qing Wang
 Chao Zhan
 Zilu Li
 Yin Cao
 Haojian Wang
 Jun Zhu
 Hongyuan Shi