 Xiaowen Zhu
 Weinan Huang
- 1College of Oceanic and Atmospheric Sciences, Ocean University of China, Qingdao, China
- 2College of Engineering, Ocean University of China, Qingdao, China
Accurately estimating the return values of significant wave height is essential for marine and coastal infrastructure, particularly as climate change intensifies the frequency and intensity of extreme wave events. Traditional models, which assume stationarity in wave data, often underestimate future risks by neglecting the impacts of climate change on wave dynamics. Combining time series decomposition and recurrence analysis, the research develops a nonstationary framework to predict significant wave height. The stochastic component is modelled using a stationary probability distribution, while the deterministic component is predicted based on sea surface temperature projections from CMIP6 climate scenarios. The model evaluation demonstrates strong predictive capability for both stochastic and deterministic components. Application of the model to China’s coastal waters reveals significant discrepancies between stationary and nonstationary return value estimates. Compared to conventional distribution models, the nonstationary model predicts substantial increases in extreme wave heights. These findings underscore the importance of adopting nonstationary models to more accurately assess future risks posed by extreme wave events in a changing climate.
1 Introduction
Reliable estimates of the return values for sea state parameters, particularly significant wave height (SWH), are crucial for ocean and coastal engineering. Traditionally, predictions of SWH for such applications have been based on probability distribution models that presuppose the stationarity of oceanographic data over time. However, with the continuous acceleration of global warming, there is growing recognition that the frequency and intensity of extreme wave events are nonstationary, exhibiting temporal variability (Mal et al., 2018; Lee et al., 2023). Numerous studies, whether based on empirical observations, satellite data, or wave numerical simulations, consistently demonstrated the nonstationary behavior of oceanic variables (Woo and Park, 2017; Shi et al., 2019; Reguero et al., 2019; Young and Ribal, 2019; Patra et al., 2020; Wang et al., 2021, 2022; Miao et al., 2024). Neglecting the nonstationary characteristics in wave systems can lead to an underestimation of extreme events in frequency and severity (Carter and Challenor, 1981; Koutsoyiannis and Montanari, 2007; Milly et al., 2008; Šraj et al., 2016). Therefore, it is crucial to develop distributional models that take into account the non-stationarity of meteorological and oceanographic variables to refine probabilistic descriptions of oceanic systems, particularly for accurately estimating return values of extreme events under climate change (Katz et al., 2002; Rootzén and Katz, 2013).
To address the limitations of traditional stationary models, various nonstationary probability distributions, including the generalized linear models and generalized additive models, have been developed for describing the probabilistic characteristics of oceanic variables under a changing climate (Rigby and Stasinopoulos, 2005). These models effectively incorporate time trends, seasonality, and other time-dependent covariates, offering a more accurate representation of the wave climate (Strupczewski et al., 2001; Galiatsatou and Prinos, 2011; Cheng et al., 2014). It is important to note that it is always insufficient to use linear functions to characterize nonstationary distribution parameters. Recent studies have explored the application of nonlinear functions in nonstationary modeling, demonstrating their potential to enhance the predictive capabilities (Um et al., 2017). This approach often involves integrating time covariates (Cannon, 2010; Semenov and Stratonovitch, 2010; Vasiliades et al., 2015; Galiatsatou et al., 2016), physical covariates (Tramblay et al., 2013; Mondal and Mujumdar, 2015; Ouarda et al., 2020), or a combination of both (Westra and Sisson, 2011; Agilan and Umamahesh, 2017) into extreme value models. While nonstationary probability models are effective in fitting current data, they often prove insufficient in predicting future trends accurately due to possible changes in existing patterns driven by climate evolution. Consequently, predictions from these models can differ significantly from those derived by physical-causal simulations (Ammar et al., 2020). Additionally, the subjective selection of covariates and the functions used to relate them to model parameters introduce significant uncertainty and variability into the predictions (Serinaldi and Kilsby, 2015; Agilan and Umamahesh, 2018). These challenges collectively complicate the generation of reliable risk forecasts using such models (Villarini et al., 2009; Jayaweera et al., 2023).
Another approach to nonstationary probability analysis is the transformed stationary method, which converts nonstationary data into stationary signals, thereby allowing the use of stationary probability distribution models (Mentaschi et al., 2016). This transformation is generally achieved through statistical techniques (Parey et al., 2010). The method’s strengths, including its ability to effectively convert nonstationary data into stationary form, avoid reliance on parametric assumptions, and enable the use of stationary extreme value analysis, make it a robust tool for processing nonstationary time series (Vanem, 2018; Takbash and Young, 2020; Li et al., 2023b). However, as with other nonstationary distribution models, this method encounter difficulties in predicting future ocean patterns accurately, largely due to the limited understanding of future climate dynamics.
A process is often described as a mixture of a time-dependent deterministic signal, such as long-term trends or periodic patterns, and a stochastic signal with unchanging statistical properties over time (Kottegoda, 1980). This allows for the application of stationary frequency analysis techniques to the stochastic component. However, accurately separating the deterministic and stochastic signals within nonstationary data remains a considerable challenge (Vidrio-Sahagún and He, 2022). The goal of this work is to improve the separation of these components in nonstationary time series by integrating time series decomposition methods with recurrence analysis. Based on this approach, a nonstationary analysis framework for SWH is developed. The stochastic component is modelled using a stationary probability distribution, while the deterministic component is predicted by establishing its relationship with sea surface temperature (SST). The deterministic signal of future SWH is then forecast using future SST projections under climate scenarios from CMIP6. This nonstationary prediction framework for the return values of SWH is applied to the China’s coastal waters.
The rest of this paper is organized as follows. Section 2 introduces the nonstationary model framework and the data used in this study. Section 3 presents the application of the nonstationary model to SWH in China’s coastal waters, while Section 4 discuss the future scenarios of the SWH return values. Section 5 summarizes the main conclusions.
2 Materials and methods
2.1 Nonstationary modelling approach
This research utilizes a nonstationary probability analysis approach, which involves two key steps: decomposing and predicting. Singular spectrum analysis (SSA) was selected for decomposition due to its proven effectiveness in separating nonstationary time series into deterministic and stochastic signals, as demonstrated in a comparative analysis by Yang and Dong (2023). Their findings showed that SSA exhibited strong flexibility in handling diverse datasets and successfully captured complex nonstationary patterns. Thus, SSA was employed to decompose the SWH (Hs) data for a more precise signal separation.
The Hs signal was decomposed into r time series components, Y = [Y1, Y2, …, Yr], using SSA method, followed by assessing the deterministic level of each Yi components using recurrence quantification analysis. Recurrence is an essential feature of natural processes, reflecting the behavior of dynamic systems, and is visualized using a recurrence plot (Eckmann et al., 1995). The recurrence plot is defined by the Heaviside step function:
where ϵ denotes a threshold distance, determined according to the algorithm suggested by Prado et al. (2018), and zp represents the points in the phase space:
where Δt refers to the time interval between successive samples, τ represents the time delay estimated using mutual information function, m denotes embedding dimension calculated by false nearest neighbours algorithm (Kantz and Schreiber, 2004). Recurrence plot offers a visual depiction of recurrences, allowing for an examination of phase space trajectories. To quantify the determinism of each time series component, the determinism rate (DET), which indicates the distribution of diagonal line lengths within the recurrence plot, was used:
in which P(l) represents the frequency of diagonal line lengths, and is defined as:
Generally, higher DET values correspond to longer diagonal lines, indicating deterministic processes, while lower DET values are associated with stochastic processes, which yield shorter diagonal lines. Following the recommendation of Yang and Dong (2023, 2024) and Huang et al. (2024), time series components with a DET value greater than 0.98 were classified as deterministic, while components with lower DET as stochastic.
After the decomposition process, the next step involves predicting the deterministic part. A key challenge in nonstationary modeling of real sea states is accurately characterizing the deterministic time series and making dependable predictions beyond the observed data. Research suggests that the nonstationary behavior of ocean waves is often influenced by natural climatic variability (Davies et al., 2017; Lin-Ye et al., 2017). By linking the deterministic process to climatic factors that can be forecasted through physical models, nonstationary risks under changing climate conditions can be better assessed (Serinaldi and Kilsby, 2015). Given that SST is a critical driver of global climate patterns and is highly predictability (Ham et al., 2019), this variable was chosen to forecast the temporal evolution of deterministic component of Hs. To model the relationship between SST and SWH, a Long Short-Term Memory (LSTM) method was utilized, as LSTM networks are particularly effective at characterizing the long-term dependencies of time series data, and thus adequate for meteorological and oceanographic predictions (Schmidhuber and Hochreiter, 1997).
The stochastic component of the Hs time series was modelled using stationary frequency analysis. Given that real sea states often consist of multiple wave patterns, traditional probability models may not be insufficient for accurately describing their probabilistic characteristics. To address this, mixture models have been proposed as a solution for capturing the complexities of wave systems (Huang and Dong, 2019, 2020, 2021b). This work utilized the mixture Weibull model to fit the stochastic component of Hs (Huang and Dong, 2021a). This distribution is defined by a weighted combination of multiple Weibull components, given by
d is the number of distribution components, represents the j-th Weibull component, and ωj is the corresponding weight. A clustering approach suggested by Huang et al. (2023) was used to estimate the unknown parameters of the distribution model.
The return values for SWH under various climate scenarios can be estimated by integrating both the predicted deterministic component based on future SST projections and the probabilistic distribution of the stochastic component.
2.2 Data description
This study examined the nonstationary characteristics of SWH in the coastal waters of China, focusing on the region between 14°N−41°N, 105°E−131°E, as depicted in Figure 1. Reanalysis datasets, particularly ERA5, have proven effective in accurately estimating extreme SWH by assimilating altimeter data (Hersbach et al., 2020; Li et al., 2023a). Accordingly, hourly SWH and SST data for this region were sourced from the ERA5 reanalysis, covering the years 1980 through 2022. The SWH data were preprocessed by extracting extreme values at 48-hours intervals. This step was implemented to minimize the short-time dependencies of dataset, thereby enhancing the reliability of model results.

Figure 1. Spatial distribution of slope estimates for SWH trends in coastal waters of China.
To assess future climate trends, SST data were sourced from the Coupled Model Intercomparison Project Phase 6 (CMIP6). CMIP6 provides high-resolution SST projections, critical for analyzing future climate patterns, with extensively validation against observational data to ensure reliability (Eyring et al., 2016; Zelinka et al., 2020). For this analysis, datasets from ssp585 scenario, a high-emission pathway characterized by substantial increases in greenhouse gas concentrations, were used. The dataset spans 2015 to 2100 and includes outputs from 42 climate models, such as ACCESS-CM2, BCC-CSM2-MR, CanESM5, and CESM2, as listed in Table 1. The ensemble mean of these 42 model outputs was computed to predict the nonstationary process of SWH. The ensemble approach helps account for a variety of potential future climatic scenario and to reduces uncertainties related to individual models, resulting in a more robust prediction of future wave climates in the coastal waters of China.
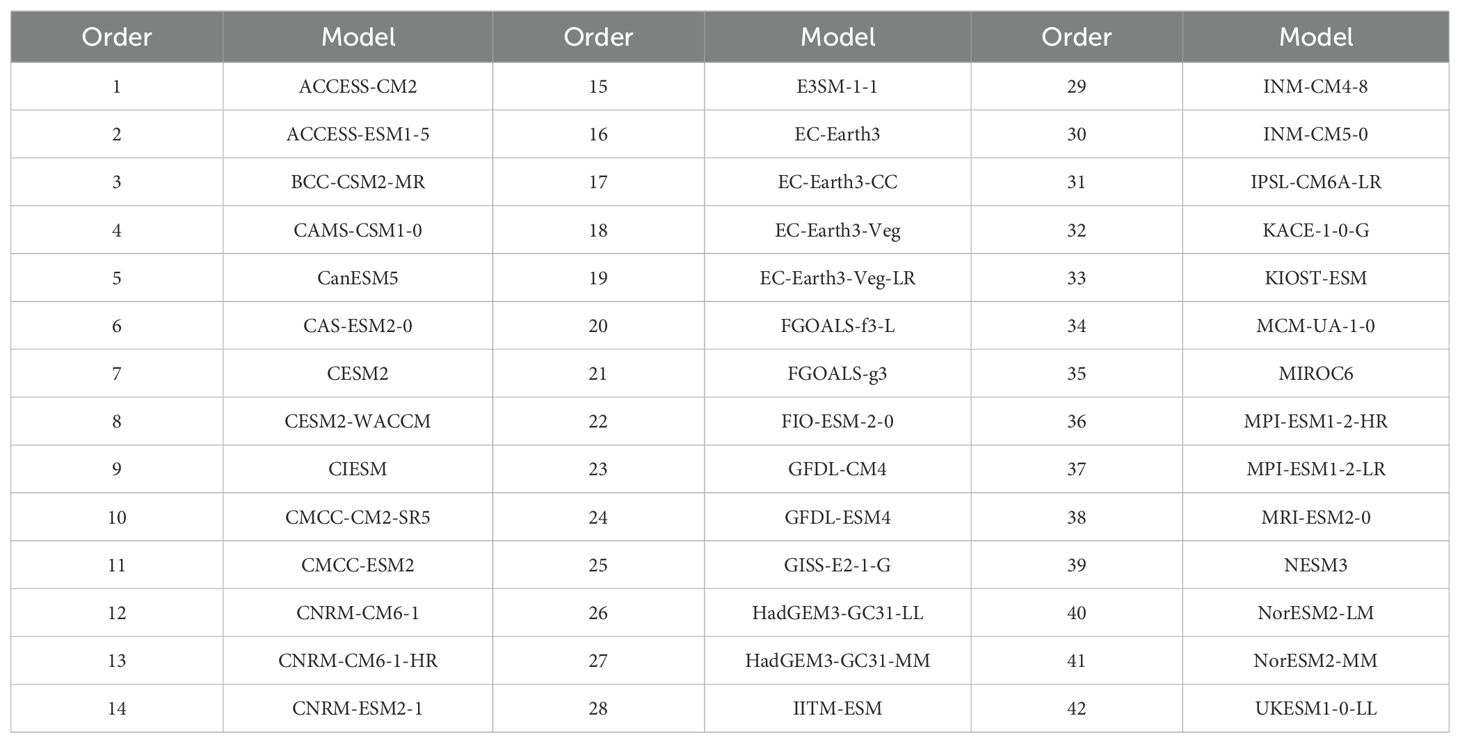
Table 1. Climate models used for SST projections in the ssp585 scenario.
To investigate the non-stationarity of SWH in the study region, the spatiotemporal variability was evaluated using ERA5 wave reanalysis data from 1980 to 2022. A sliding 10-year window was applied to compute the 0.99 quantile of Hs based on the empirical cumulative probability distribution. The Theil-Sen estimator was adopted to estimate the trend slope, while the Mann-Kendall test was utilized to evaluate the statistical significance of these trends at each location. The spatial distribution of slope estimates, presented in Figure 1, reveals distinct patterns across different regions of China’s coastal waters. Notably, the East China Sea exhibits a positive trend in SWH, while the southeastern and southwestern areas of the study region show negative trends.
This analysis indicates significant spatial variability in the trends of SWH, which might be influenced by regional climatic conditions and oceanographic processes. Rising sea surface temperatures and changing wind patterns, driven by global climate change, are potential contributors to these observed trends (Hemer et al., 2013; Reguero et al., 2019). The increasing trend in SWH, particularly in the East China Sea, suggests the potential for more severe future wave conditions, which could have critical implications for marine structure design and coastal risk assessments. Relying on stationary models in this context may underestimate the frequency and intensity of extreme wave events, leading to inaccurate return value estimates and increased risk. Thus, a nonstationary approach is essential to accurately estimate return values of SWH in this region and improve risk assessment strategies.
3 Results
This section presents the results of the return value estimations of SWH in China’s coastal waters using the developed nonstationary model. To evaluate performance of this nonstationary model, the time series were split into a training dataset (1980−2017) and a testing dataset (2018−2022). The evaluation was performed using the following method: first, both datasets were separated into their deterministic and stochastic components. The stochastic component was accessed by comparing the statistical properties of the two datasets. If the stochastic components exhibited similar statistical characteristics, it demonstrated that the stochastic components meet the stationarity requirement. For the deterministic component, an LSTM framework was employed to capture the correlation between SST and the deterministic component of Hs. The model’s predictive accuracy was tested by evaluating whether the LSTM model trained on the first 38 years of data could reliably predict the evolution of Hs in the testing period. If the stochastic component demonstrated stationary and the LSTM model successfully forecast the deterministic component, this would indicate that the nonstationary model has strong predictive capability.
To assess the stochastic component, the cumulative distribution functions of the stochastic components from training and testing datasets were compared. The correlation coefficient R was calculated to quantify the similarity between the statistical properties of these two datasets. As shown in Figure 2A, the correlation analysis revealed a high degree of stationarity, with most regions exhibiting an R value greater than 0.99. This strong correlation suggests that the stochastic components of both datasets share consistent probabilistic characteristics, supporting the assumption of stationarity. This stability of these random variations enhances the accuracy and reliability of the nonstationary model, affirming its robustness for time series forecasting.
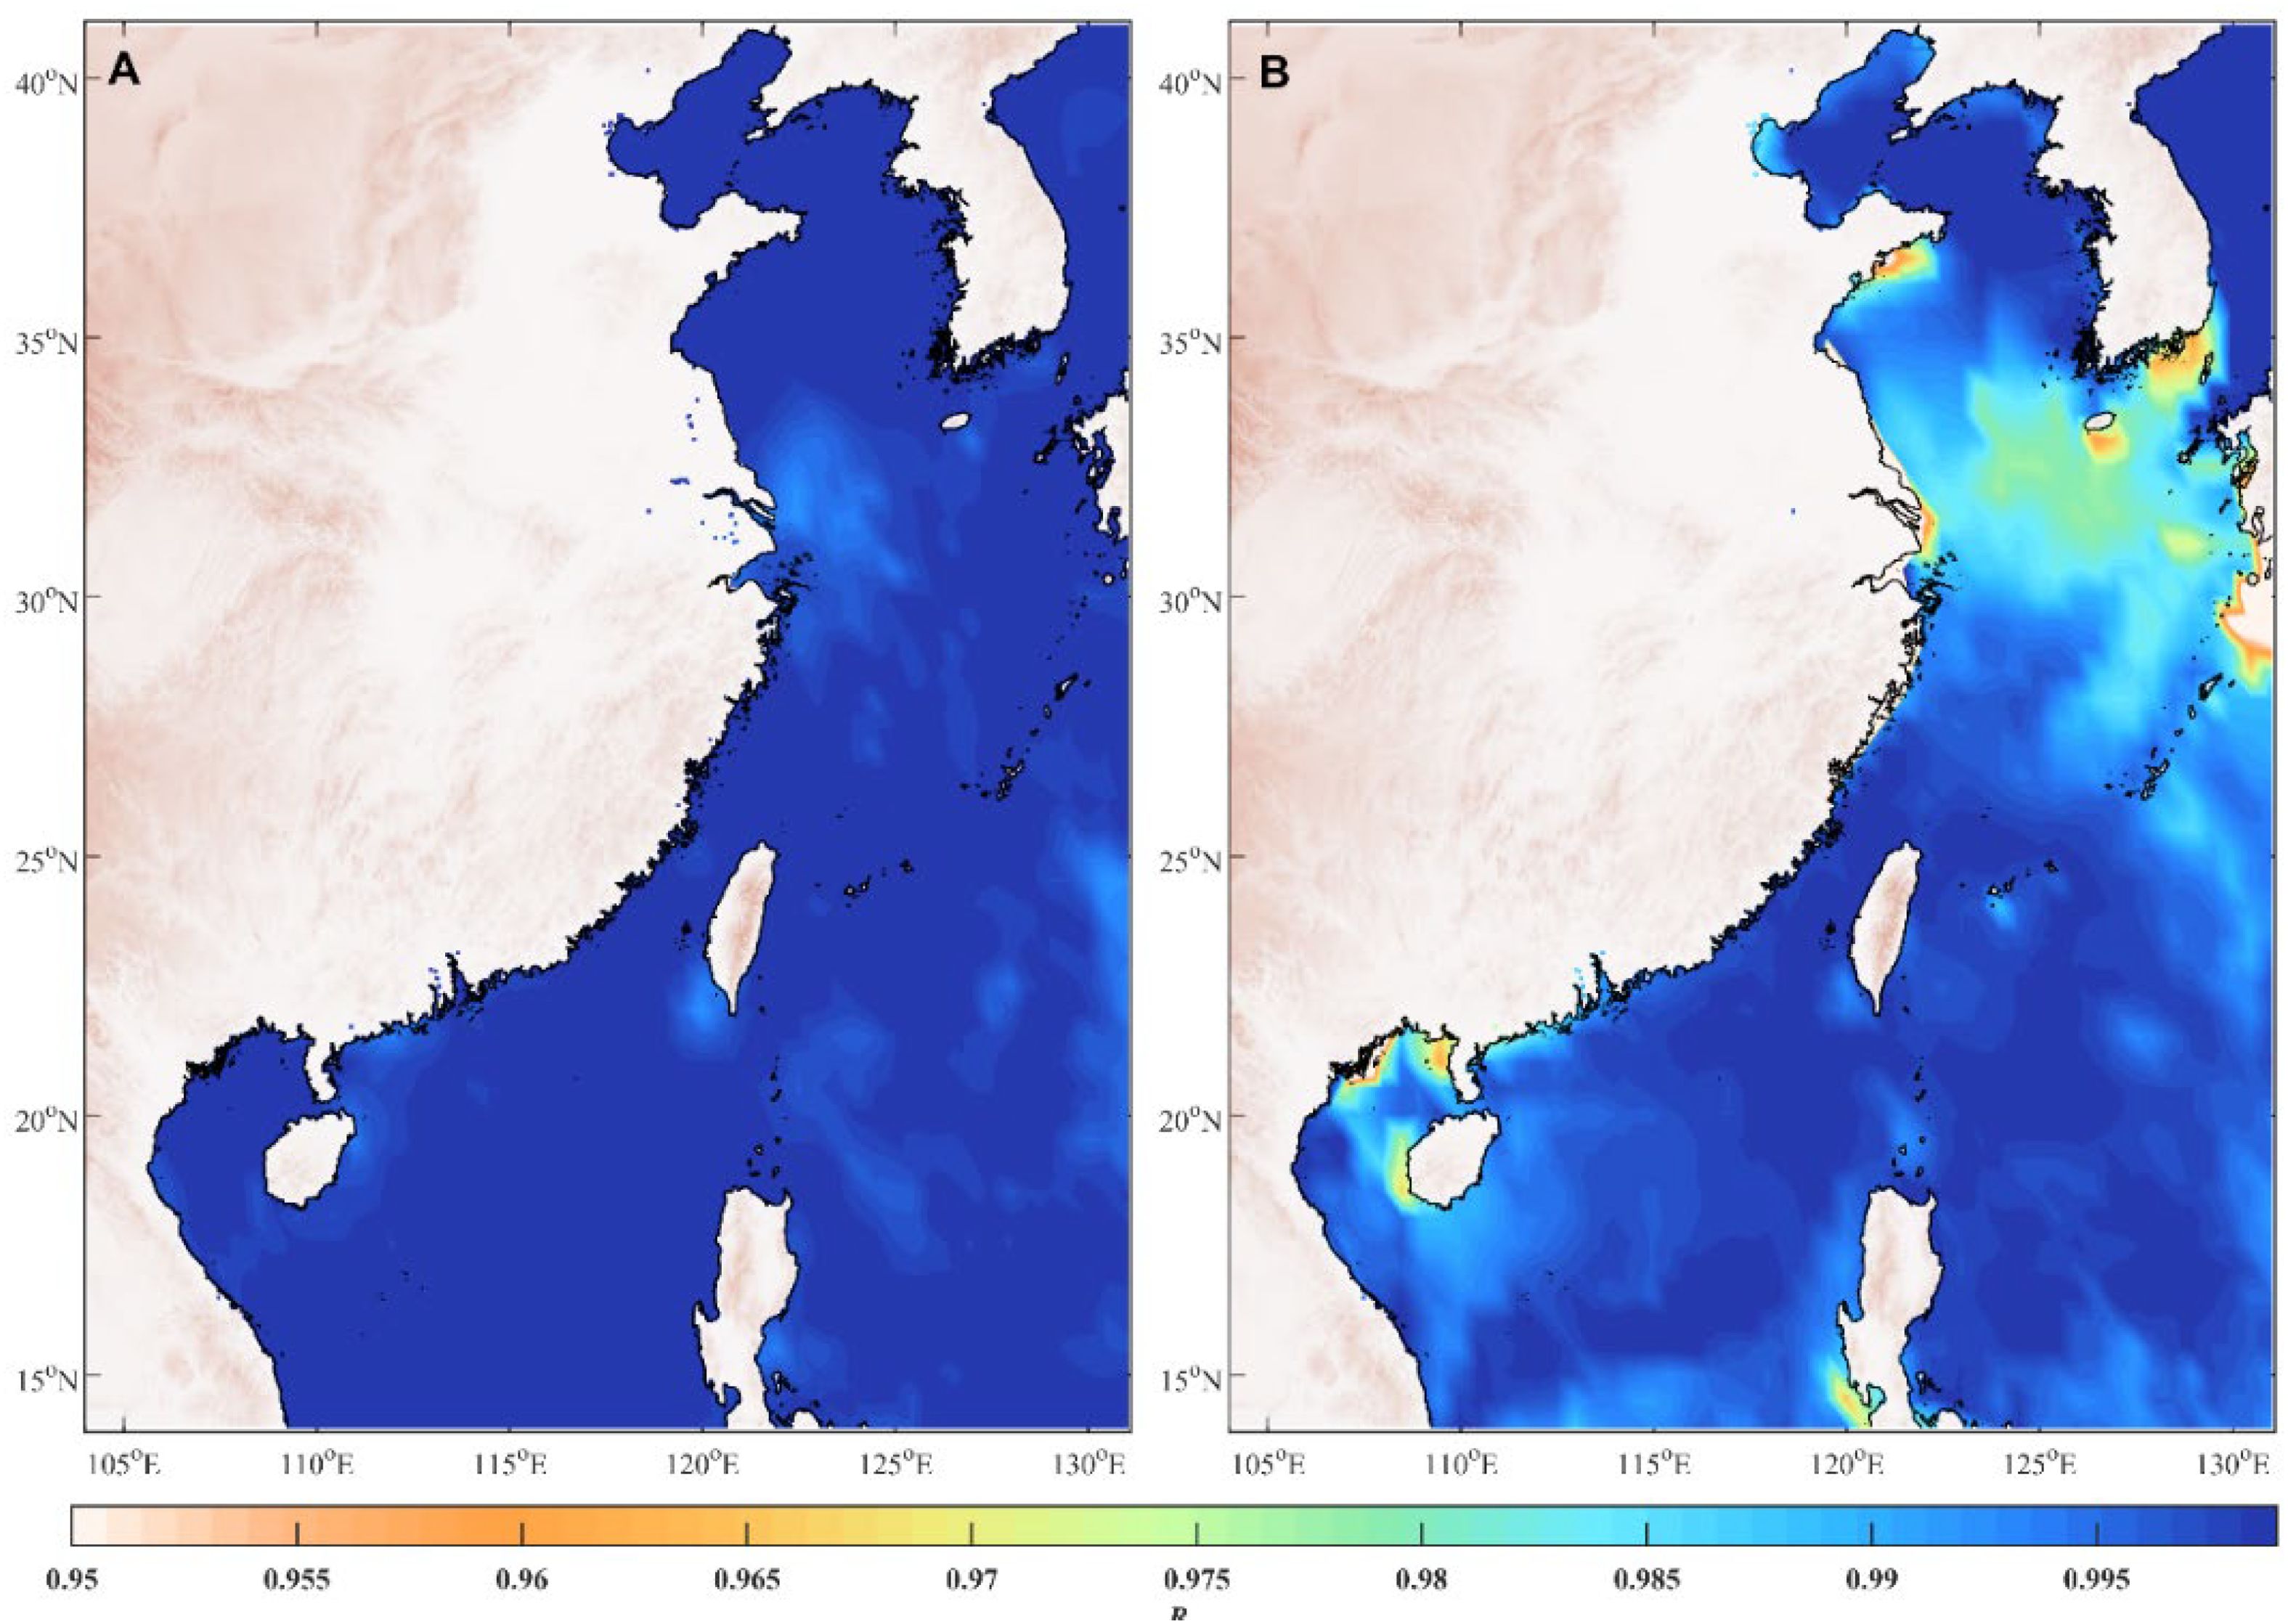
Figure 2. Correlation analysis of the stochastic (A) and deterministic (B) components of SWH in coastal waters of China.
For each location in the China’s coastal waters, the LSTM network trained on data from 1980 to 2017 was used to predict the deterministic components of Hs based on SST data from 2018 to 2022. These predictions were then compared with the deterministic components extracted from the testing set, and the correlation coefficients R was calculated to assess their consistency. As depicted in Figure 2B, the correlation coefficient consistently exceeds 0.95 across the region, with most areas showing values above 0.985. These results indicate a strong agreement between the predicted and reanalysis-based deterministic components, indicating that the LSTM model effectively captures the relationship between SST and the deterministic components of Hs. This analysis confirms that SST is a reliable predictor of the deterministic component of SWH.
The evaluation of the nonstationary framework demonstrates robust predictive performance, implying that the model can successfully forecast both the stochastic and deterministic components of future SWH based on historical information, thereby ensuring reliable return value predictions.
4 Discussion
The return values of SWH in coastal waters of China were analyzed by decomposing the time series from 1980 to 2022 into stochastic and deterministic components. The stochastic component was modelled using a mixture Weibull distribution, while the deterministic component was predicted using SST projections from CMIP6 under future climate scenarios.
Figure 3 presents the spatial distribution of stationary and nonstationary return values of SWH associated with return periods of 10, 25, 50, and 100 years. Figure 3A1−D1 shows the stationary return values derived from the mixture Weibull distribution model, while Figure 3A2−D2 (2050) and Figure 3A3−D3 (2100) present the nonstationary return values predicted under future climate scenarios.
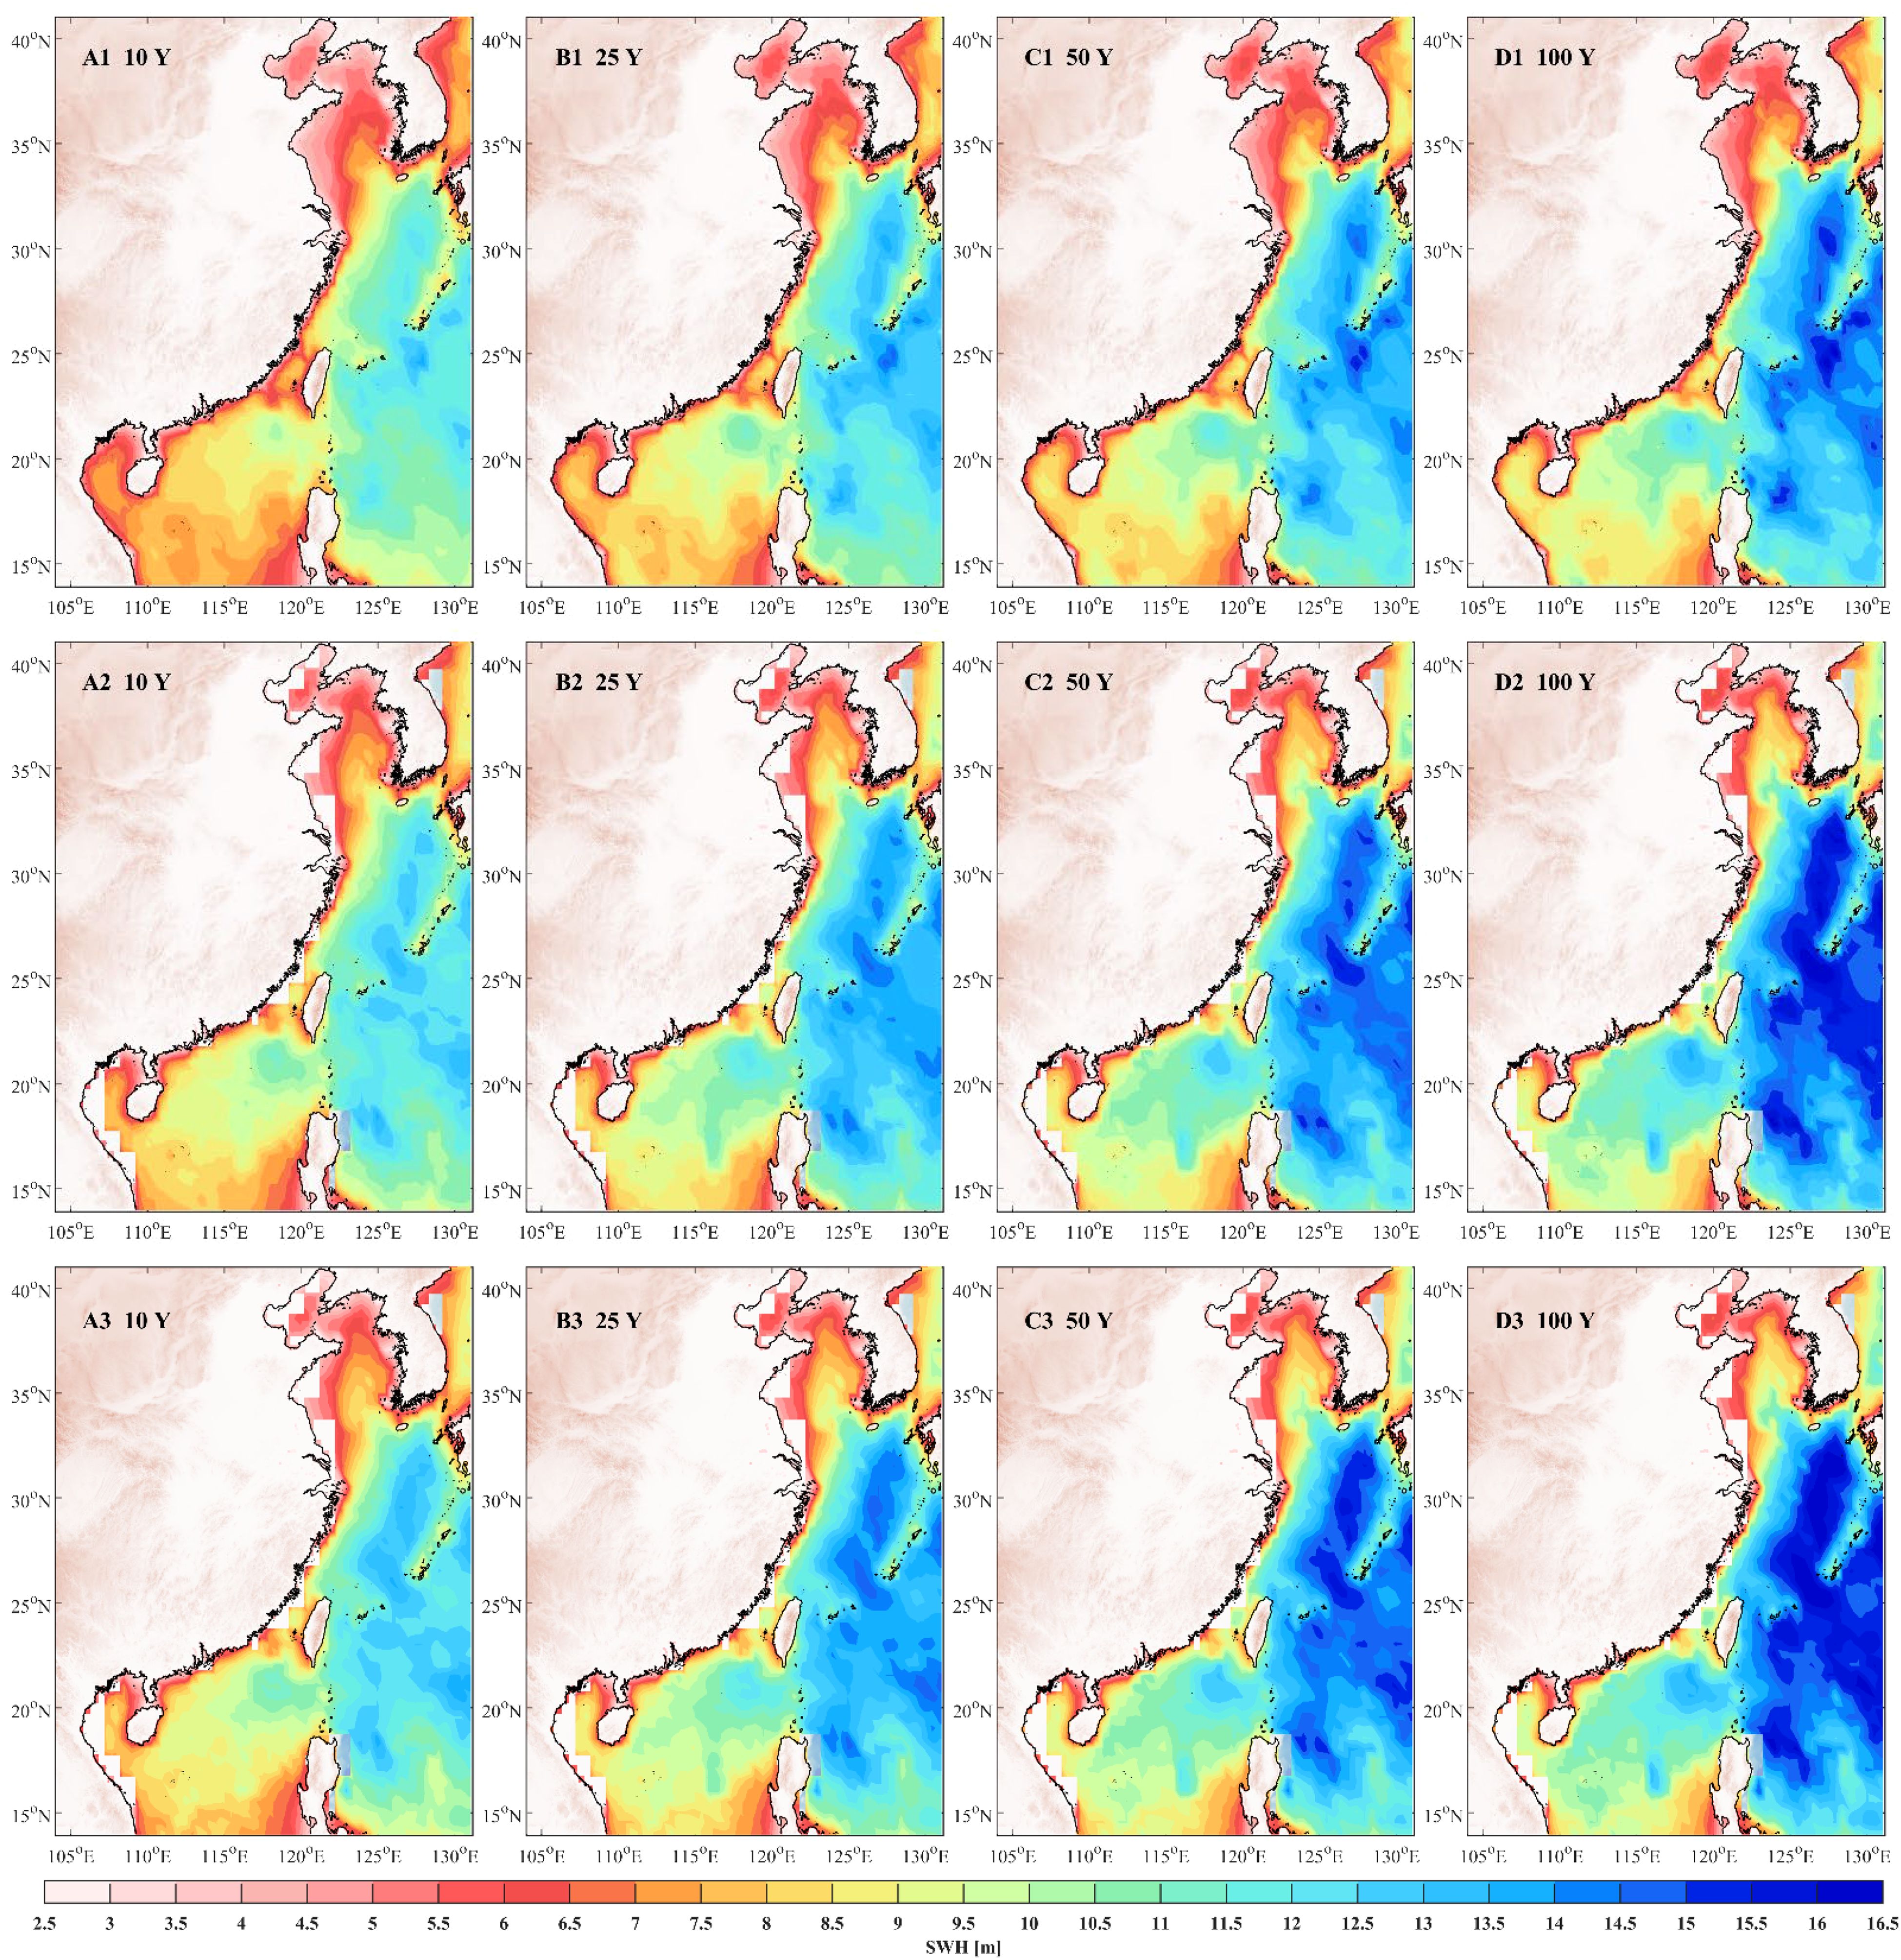
Figure 3. Spatial distribution of SWH return values. (A1−D1) represent results from the stationary model, while (A2−D2) (2050) and (A3−D3) (2100) show results from the nonstationary model.
The comparison between stationary results (Figure 3A1−D1) and nonstationary predictions for 2050 (Figures 3A2−D2) and 2100 (Figures 3A3−D3) reveals a clear increasing trend in the return values of SWH over time. Transitioning from the stationary frequency analysis, which assumes no change in wave climate, to the nonstationary model, which accounts for climate change, indicates a notable intensification of extreme wave events. This contrast is particularly evident in regions such as the East China Sea, where wave activity is already significant, making the differences between stationary and nonstationary models more pronounced.
The nonstationary model results indicate that extreme wave events may be significantly underestimated if the evolving influence of climate changing are not taken into account. The stationary model, which relies solely on historical data, neglects the increasing severity of future wave events driven by rising sea surface temperatures and shifting atmospheric conditions. Such underestimations present considerable risks for coastal infrastructure and marine operations, as design parameters based on stationary models may be inadequate to withstand the more extreme wave conditions expected later in the century (Reguero et al., 2019).
To provide a detailed assessment of how nonstationary modelling affects return values of SWH, Figures 4 and 5 present the percentage differences between nonstationary and stationary return values for 2050 and 2100, respectively, offering insights into the spatial distribution of these discrepancies across different return periods.
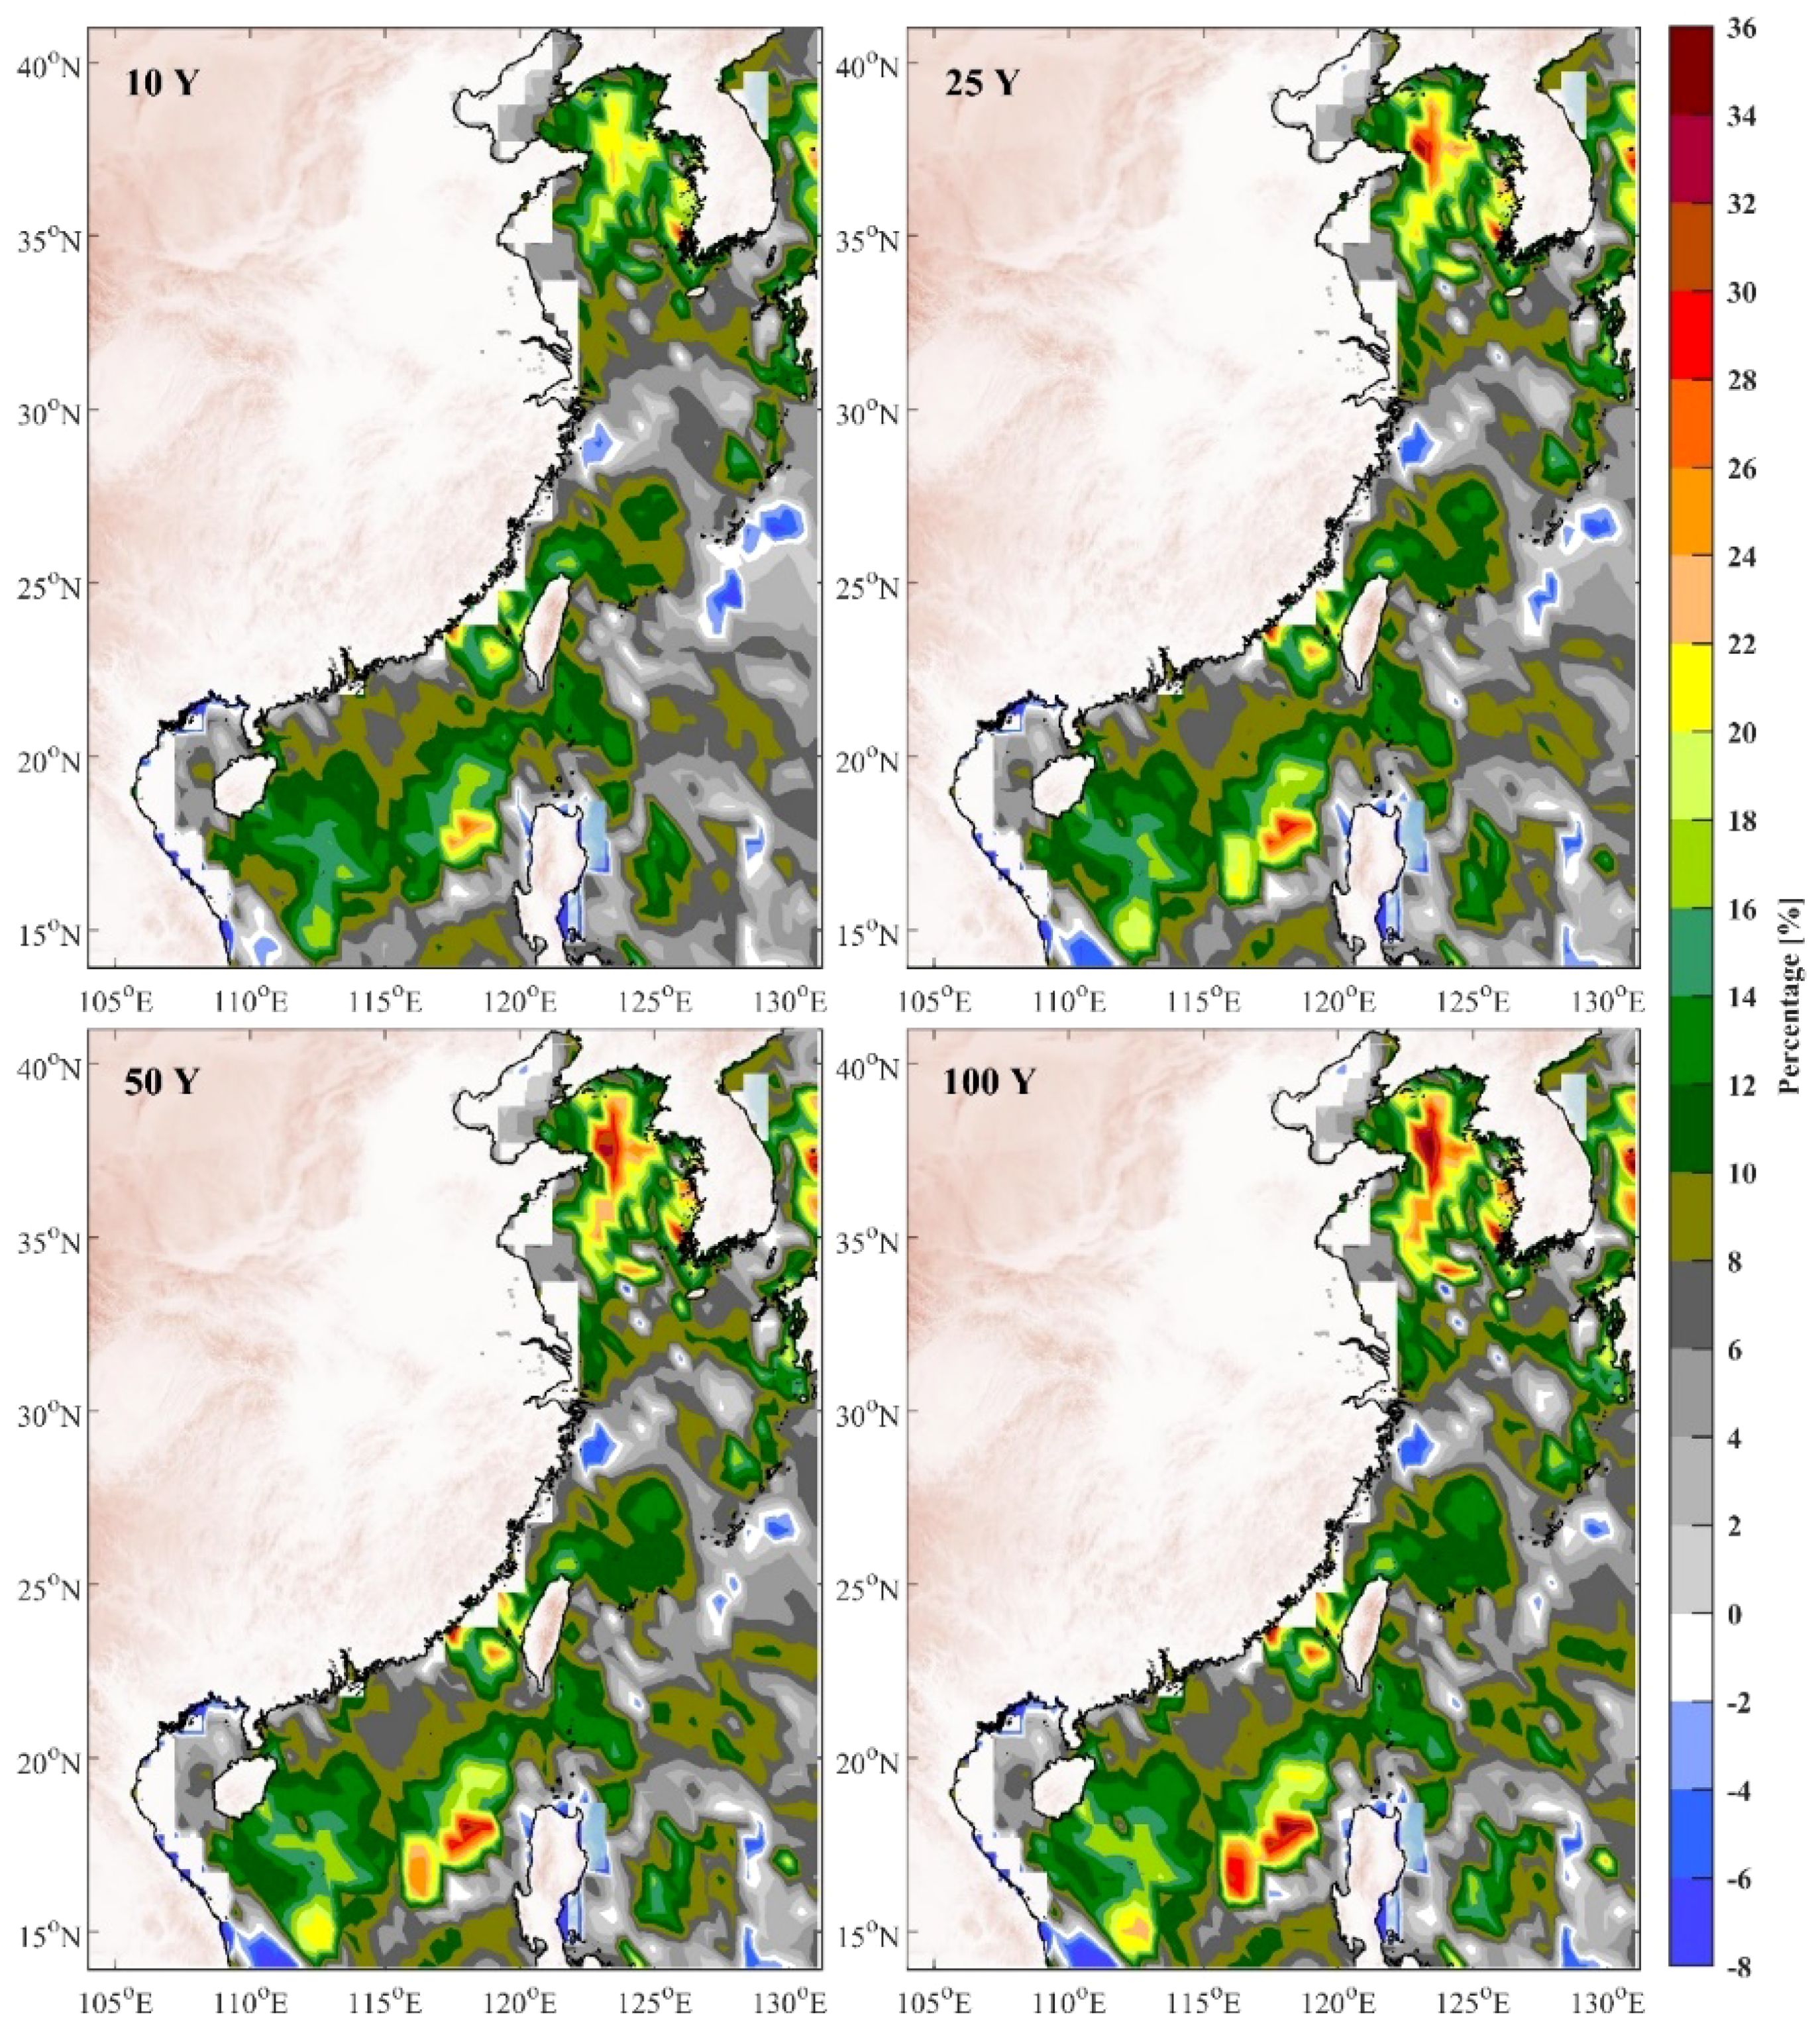
Figure 4. Percentage difference in SWH return values between nonstationary and stationary models for 2050.
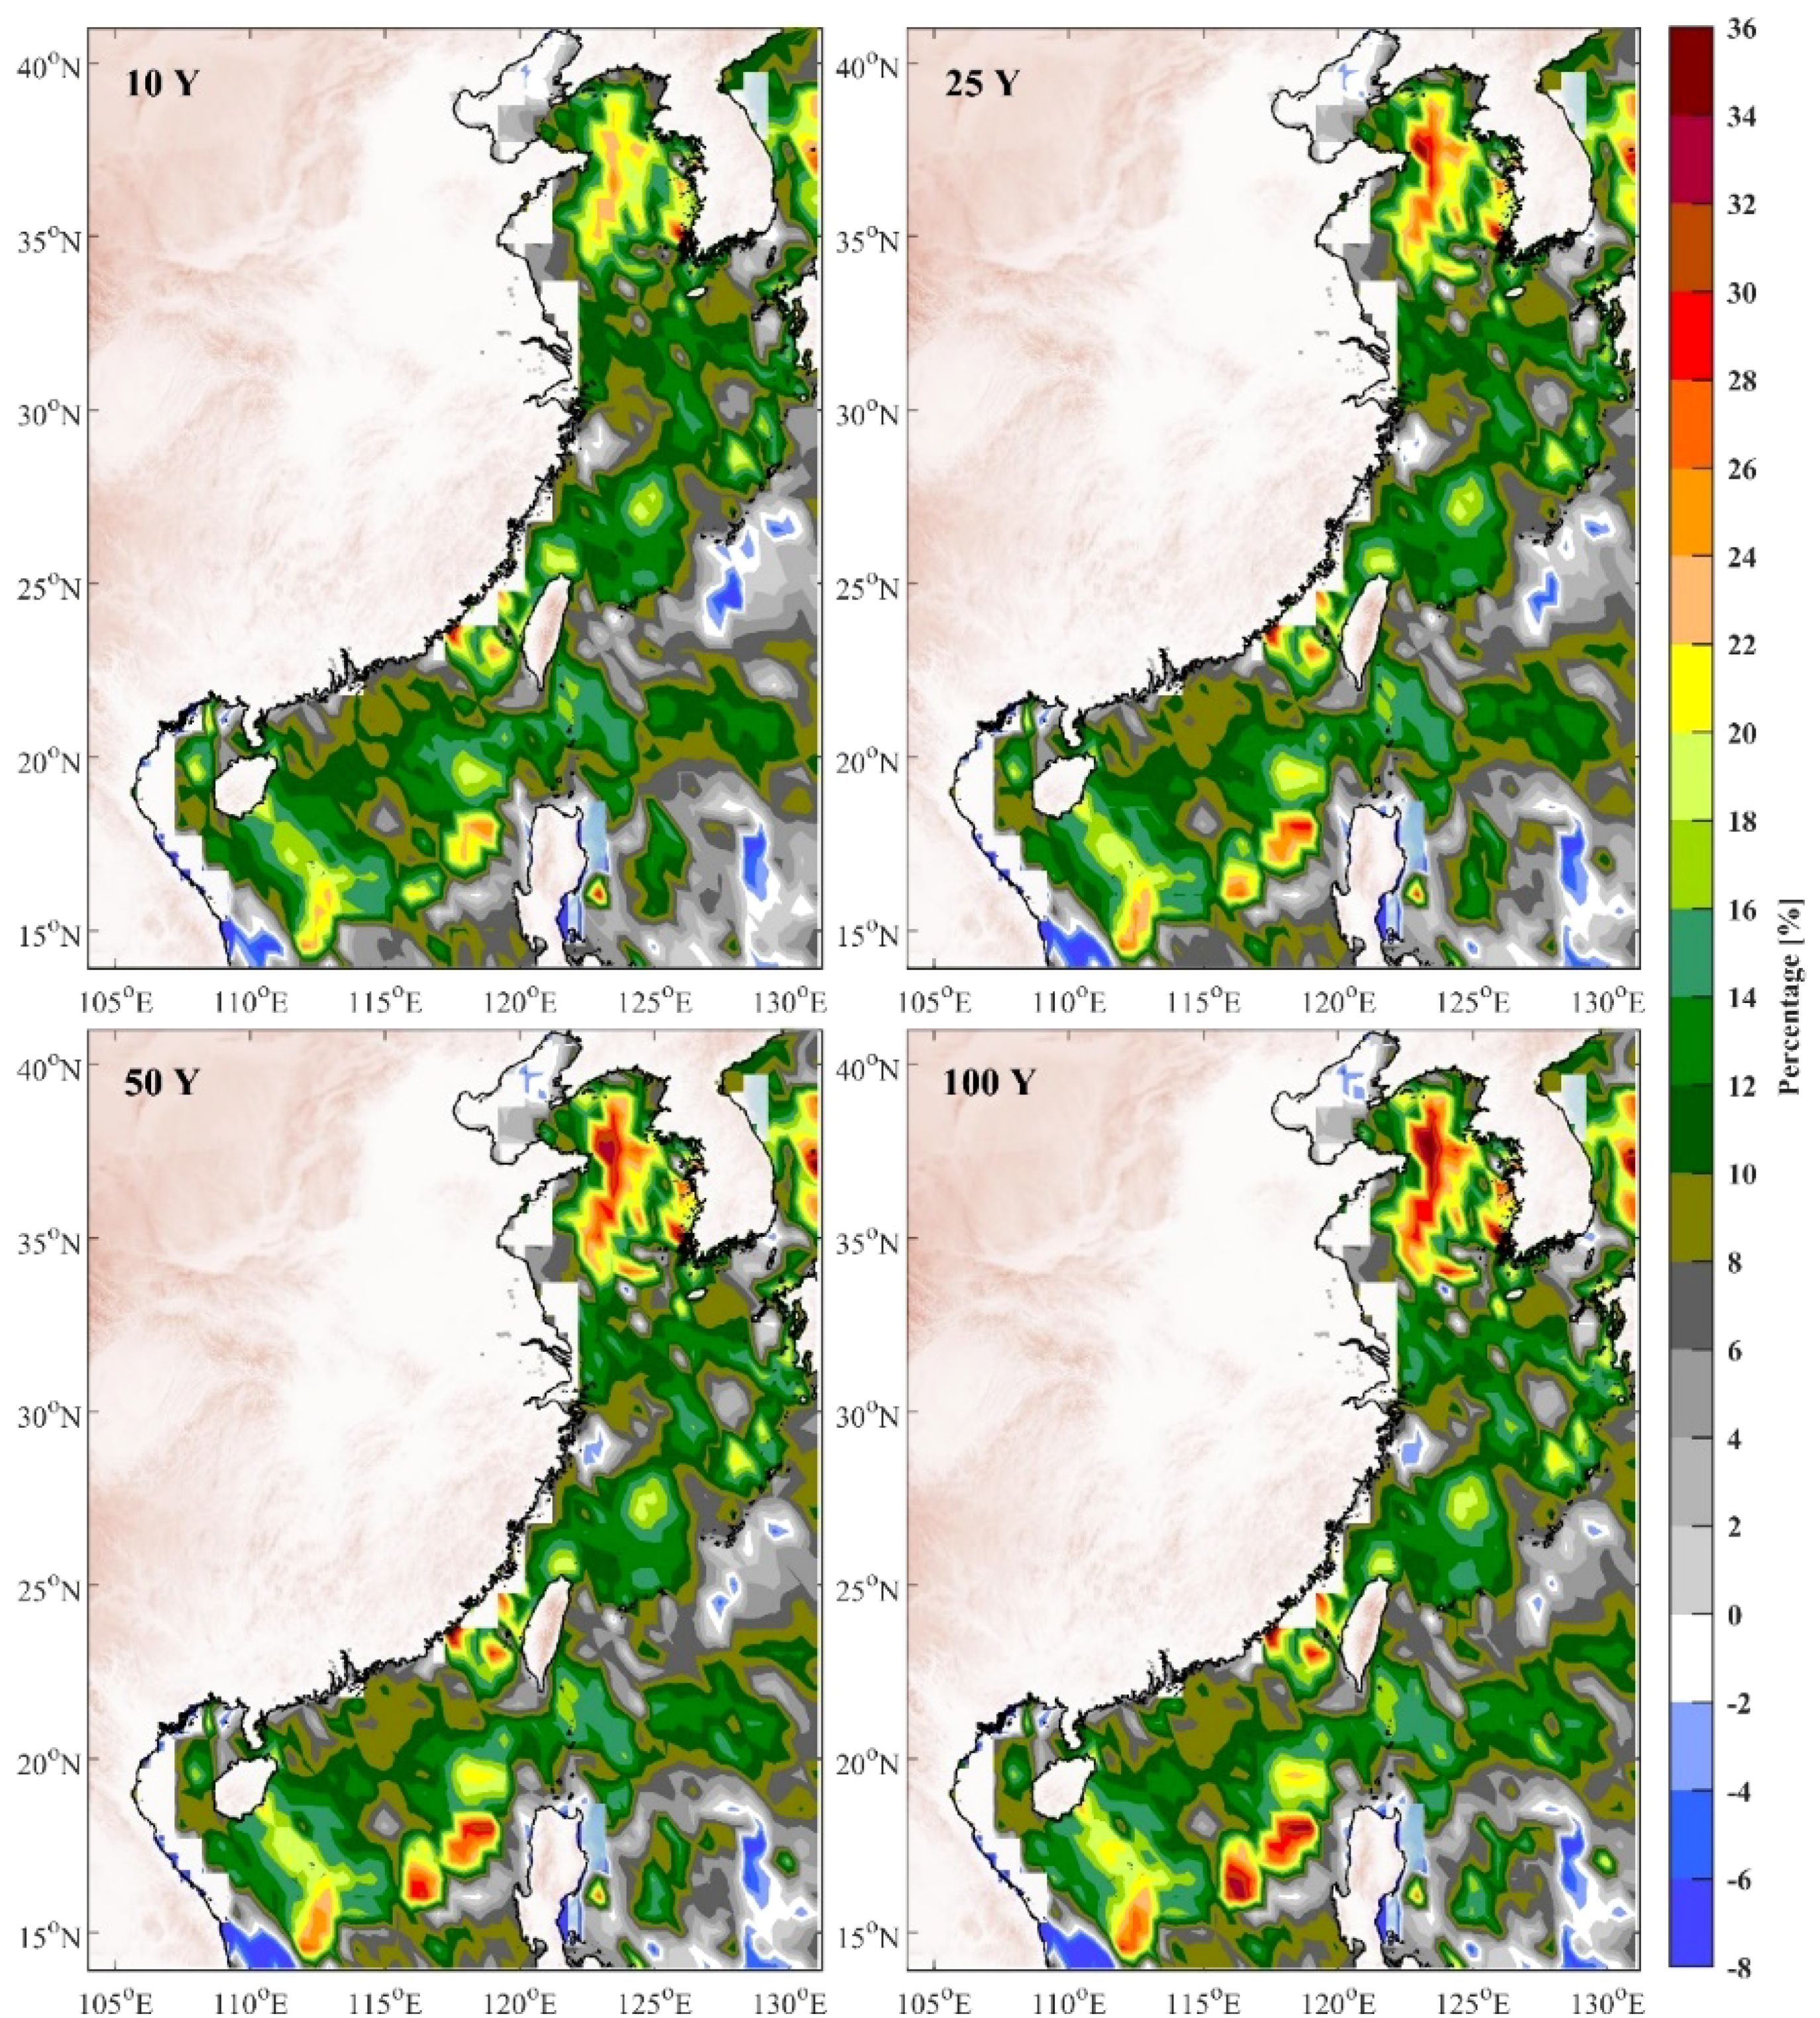
Figure 5. Percentage difference in SWH return values between nonstationary and stationary models for 2100.
In Figure 4, the results for 2050 reveal a noticeable increase in wave heights predicted by the nonstationary approach compared to the traditional frequency analysis. The most pronounced differences are found in the northern and southwestern regions, particularly near the Yellow Sea, Bohai Sea, and South China Sea, where return values show increases of up to 36%. This pronounced differences in SWH return values in these areas can be attributed to regional wind speed trends (Xu et al., 2024). These findings suggest that even within a few decades, nonstationary models predict substantial deviations from stationary assumptions. Extends this analysis to 2100 (Figure 5) show that the percentage differences between nonstationary and stationary models become even more pronounced and geographically widespread. The magnitude of these changes increase, indicating that there would likely be a gradual increase in the impact of climate changing on wave dynamics. The greater discrepancies across broader areas underscore the accelerating influence of changing climates on wave systems, with coastal regions being particularly affected.
Although nearshore areas typically exhibit smaller return values due to shallow water depths (Figure 3), Figures 4 and 5 demonstrate that the percentage increase in return values of SWH due to evolving climatic conditions remain significant in these regions. For example, for the 100-year return period, some coastal areas experience increases of more than 30% in return values compared to the stationary model. This has profound implications for designs of maritime structures and coastal protection systems, since even moderate increases of wave height can significantly affect the resilience of these structures during extreme events (Goda, 2010).
The comparison highlights the risks associated with relying on stationary models under changing climate conditions. The growing divergence between stationary and nonstationary predictions emphasizes the need for nonstationary models to accurately estimate future wave conditions. Without adopting nonstationary approaches, there is a substantial risk of underestimating extreme wave events, leading to insufficient design criteria and inadequate disaster mitigation in vulnerable coastal regions.
5 Conclusions
The present research developed a nonstationary framework for analyzing SWH by integrating time series decomposition methods with recurrence analysis. The stochastic component of the SWH data was modelled using a conventional probability distribution, while the deterministic component was predicted based on its relationship with SST. Using future SST projections from the CMIP6 climate scenarios, we forecasted the deterministic component of SWH and combined it with the stochastic component to estimate return values. This nonstationary framework was applied to the coastal waters of China to provide more accurate predictions of future wave conditions under changing climate scenarios.
The evaluation of the nonstationary model demonstrated strong predictive performance. Through the decomposition of time series into stochastic and deterministic components, the model effectively captured the stationarity of the stochastic component, exhibiting a high correlation between the training and testing datasets. Additionally, the LSTM model successfully predicted the deterministic component by establishing the relationship between SST and SWH, showing a strong correlation between observed and predicted values. These results confirm the robustness of the nonstationary framework in forecasting future wave conditions, offering more reliable return value estimates compared than stationary models.
The results for China’s coastal waters reveal a significant contrast between stationary and nonstationary model predictions. The nonstationary model, which takes the climate change into account, projects a marked increase in the return values of SWH for 2050 and 2100. In contrast, the stationary model, which assumes no change in wave climate, underestimates the future severity of extreme wave events. The comparison highlights the necessity of incorporating climate change considerations into future coastal and marine risk assessments, as the nonstationary model provides a more accurate representation of future wave conditions.
The ability of the developed nonstationary model to incorporate both stochastic and deterministic components ensures more robust predictions, which are critical for designs and safety of coastal and maritime infrastructures. Future research should focus on refining nonstationary models by incorporating additional climate-related variables. Moreover, expanding the application of this nonstationary approach to other oceanic and coastal regions could also provide valuable insights into global wave patterns under various climate scenarios, thereby supporting more resilient disaster mitigation strategies in response to increasingly extreme events.
Data availability statement
The original contributions presented in the study are included in the article/supplementary material, further inquiries can be directed to the corresponding author.
Author contributions
XZ: Writing – original draft, Writing – review & editing. WH: Writing – original draft, Writing – review & editing.
Funding
The author(s) declare financial support was received for the research, authorship, and/or publication of this article. The study was supported by the National Natural Science Foundation of China (52201339, 42377457), National Key Research and Development Program of China (2023YFC3008205), and Natural Science Foundation of Shandong Province (ZR2022QE034).
Conflict of interest
The authors declare that the research was conducted in the absence of any commercial or financial relationships that could be construed as a potential conflict of interest.
Publisher’s note
All claims expressed in this article are solely those of the authors and do not necessarily represent those of their affiliated organizations, or those of the publisher, the editors and the reviewers. Any product that may be evaluated in this article, or claim that may be made by its manufacturer, is not guaranteed or endorsed by the publisher.
References
Agilan V., Umamahesh N. V. (2017). What are the best covariates for developing non-stationary rainfall intensity-duration-frequency relationship? Adv. Water Resour. 101, 11–22. doi: 10.1016/j.advwatres.2016.12.016
Agilan V., Umamahesh N. V. (2018). Covariate and parameter uncertainty in non-stationary rainfall IDF curve. Int. J. Climatology 38, 365383. doi: 10.1002/joc.5181
Ammar M. E., Gharib A., Islam Z., Davies E. G., Seneka M., Faramarzi M. (2020). Future floods using hydroclimatic simulations and peaks over threshold: An alternative to nonstationary analysis inferred from trend tests. Adv. Water Resour. 136, 103463. doi: 10.1016/j.advwatres.2019.103463
Cannon A. J. (2010). A flexible nonlinear modelling framework for nonstationary generalized extreme value analysis in hydroclimatology. Hydrological Processes: Int. J. 24, 673–685. doi: 10.1002/hyp.7506
Carter D. J. T., Challenor P. G. (1981). Estimating return values of environmental parameters. Q. J. R. Meteorological Soc. 107, 259–266. doi: 10.1002/qj.49710745116
Cheng L., AghaKouchak A., Gilleland E., Katz R. W. (2014). Non-stationary extreme value analysis in a changing climate. Climatic Change 127, 353–369. doi: 10.1007/s10584-014-1254-5
Davies G., Callaghan D. P., Gravois U., Jiang W., Hanslow D., Nichol S., et al. (2017). Improved treatment of non-stationary conditions and uncertainties in probabilistic models of storm wave climate. Coast. Eng. 127, 1–19. doi: 10.1016/j.coastaleng.2017.06.005
Eckmann J. P., Kamphorst S. O., Ruelle D. (1995). Recurrence plots of dynamical systems. World Sci. Ser. Nonlinear Sci. Ser. A 16, 441446. doi: 10.1209/0295-5075/4/9/004
Eyring V., Bony S., Meehl G. A., Senior C. A., Stevens B., Stouffer R. J., et al. (2016). Overview of the Coupled Model Intercomparison Project Phase 6 (CMIP6) experimental design and organization. Geoscientific Model. Dev. 9, 1937–1958. doi: 10.5194/gmd-9-1937-2016
Galiatsatou P., Anagnostopoulou C., Prinos P. (2016). Modeling nonstationary extreme wave heights in present and future climates of Greek Seas. Water Sci. Eng. 9, 21–32. doi: 10.1016/j.wse.2016.03.001
Galiatsatou P., Prinos P. (2011). Modeling non-stationary extreme waves using a point process approach and wavelets. Stochastic Environ. Res. Risk Assess. 25, 165–183. doi: 10.1007/s00477-010-0448-2
Goda Y. (2010). Random seas and design of maritime structures (Singapore: World Scientific). doi: 10.1142/7425
Ham Y. G., Kim J. H., Luo J. J. (2019). Deep learning for multi-year ENSO forecasts. Nature 573, 568–572. doi: 10.1038/s41586-019-1559-7
Hemer M. A., Fan Y., Mori N., Semedo A., Wang X. L. (2013). Projected changes in wave climate from a multi-model ensemble. Nat. Climate Change 3, 471–476. doi: 10.1038/nclimate1791
Hersbach H., Bell B., Berrisford P., Hirahara S., Horányi A., Muñoz-Sabater J., et al. (2020). The ERA5 global reanalysis. Q. J. R. Meteorological Soc. 146, 1999–2049. doi: 10.1002/qj.3803
Huang W., Dong S. (2019). Probability distribution of wave periods in combined sea states with finite mixture models. Appl. Ocean Res. 92, 101938. doi: 10.1016/j.apor.2019.101938
Huang W., Dong S. (2020). Joint distribution of individual wave heights and periods in mixed sea states using finite mixture models. Coast. Eng. 161, 103773. doi: 10.1016/j.coastaleng.2020.103773
Huang W., Dong S. (2021a). Joint distribution of significant wave height and zero-up-crossing wave period using mixture copula method. Ocean Eng. 219, 108305. doi: 10.1016/j.oceaneng.2020.108305
Huang W., Dong S. (2021b). Statistical properties of group height and group length in combined sea states. Coast. Eng. 166, 103897. doi: 10.1016/j.coastaleng.2021.103897
Huang W., Zhu X., Jin Y., Shen X. (2024). Nonstationary modelling of significant wave height using time series decomposition method. Ocean Eng. 310, 118731. doi: 10.1016/j.oceaneng.2024.118731
Huang W., Zhu X., Xia H., Wu K. (2023). Offshore wind energy assessment with a clustering approach to mixture model parameter estimation. J. Mar. Sci. Eng. 11, 2060. doi: 10.3390/jmse11112060
Jayaweera L., Wasko C., Nathan R., Johnson F. (2023). Non-stationarity in extreme rainfalls across Australia. J. Hydrology 624, 129872. doi: 10.1016/j.jhydrol.2023.129872
Kantz H., Schreiber T. (2004). Nonlinear time series analysis (Cambridge: Cambridge University Press). doi: 10.1017/CBO9780511755798
Katz R. W., Parlange M. B., Naveau P. (2002). Statistics of extremes in hydrology. Adv. Water Resour. 25, 1287–1304. doi: 10.1016/S0309-1708(02)00056-8
Kottegoda N. T. (1980). Stochastic water resources technology (London: Macmillan Press). doi: 10.1007/978-1-349-03467-3
Koutsoyiannis D., Montanari A. (2007). Statistical analysis of hydroclimatic time series: Uncertainty and insights. Water Resour. Res. 43, W05429. doi: 10.1029/2006WR005592
Lee H., Calvin K., Dasgupta D., Krinner G., Mukherji A., Thorne P., et al. (2023). IPCC. Climate change 2023: synthesis report, summary for policymakers. Contribution of working groups I, II and III to the sixth assessment report of the intergovernmental panel on climate change. Eds. Lee H., Romero J. (Geneva: Intergovernmental Panel on Climate Change (IPCC). doi: 10.59327/IPCC/AR6-9789291691647.001
Li J., Zhu D., Cao L., Li C. (2023b). A wavelet transform based stationary transformation method for estimating the extreme value of the non-stationary wind speeds. Probabilistic Eng. Mechanics 74, 103549. doi: 10.1016/j.probengmech.2023.103549
Li R., Wu K., Zhang W., Dong X., Lv L., Li S., et al. (2023a). Analysis of the 20-Year variability of ocean wave hazards in the northwest pacific. Remote Sens. 15, 2768. doi: 10.3390/rs15112768
Lin-Ye J., García-León M., Gràcia V., Ortego M. I., Lionello P., Sanchez-Arcilla A. (2017). Multivariate statistical modelling of future marine storms. Appl. Ocean Res. 65, 192–205. doi: 10.1016/j.apor.2017.04.009
Mal S., Singh R. B., Huggel C. (2018). Climate change, extreme events and disaster risk reduction: towards sustainable development goals (Cham: Springer). doi: 10.1007/978-3-319-56469-2
Mentaschi L., Vousdoukas M., Voukouvalas E., Sartini L., Feyen L., Besio G., et al. (2016). The transformed-stationary approach: a generic and simplified methodology for non-stationary extreme value analysis. Hydrology Earth System Sci. 20, 3527–3547. doi: 10.5194/hess-20-3527-2016
Miao Q., Yang J., Wang Z., Zhang Y., Yang Y., Wei G., et al. (2024). A study on wave climate variability along the nearshore regions of Bohai Sea based on long term observation data. Ocean Eng. 304, 117947. doi: 10.1016/j.oceaneng.2024.117947
Milly P. C., Betancourt J., Falkenmark M., Hirsch R. M., Kundzewicz Z. W., Lettenmaier D. P., et al. (2008). Stationarity is dead: Whither water management? Science 319, 573–574. doi: 10.1126/science.1151915
Mondal A., Mujumdar P. P. (2015). Modeling non-stationarity in intensity, duration and frequency of extreme rainfall over India. J. Hydrology 521, 217–231. doi: 10.1016/j.jhydrol.2014.11.071
Ouarda T. B., Charron C., St-Hilaire A. (2020). Uncertainty of stationary and nonstationary models for rainfall frequency analysis. Int. J. Climatology 40, 2373–2392. doi: 10.1002/joc.6339
Parey S., Hoang T. T. H., Dacunha-Castelle D. (2010). Different ways to compute temperature return levels in the climate change context. Environmetrics 21, 698–718. doi: 10.1002/env.1060
Patra A., Min S. K., Seong M. G. (2020). Climate variability impacts on global extreme wave heights: Seasonal assessment using satellite data and ERA5 reanalysis. J. Geophysical Research: Oceans 125, 2020JC016754. doi: 10.1029/2020JC016754
Prado T. D. L., dos Santos Lima G. Z., Lobão-Soares B., do Nascimento G. C., Corso G., Fontenele-Araujo J., et al. (2018). Optimizing the detection of nonstationary signals by using recurrence analysis. Chaos: Interdiscip. J. Nonlinear Sci. 28, 085703. doi: 10.1063/1.5022154
Reguero B. G., Losada I. J., Méndez F. J. (2019). A recent increase in global wave power as a consequence of oceanic warming. Nat. Commun. 10, 205. doi: 10.1038/s41467-018-08066-0
Rigby R. A., Stasinopoulos D. M. (2005). Generalized additive models for location, scale and shape. J. R. Stat. Soc. Ser. C: Appl. Stat 54, 507–554. doi: 10.1111/j.1467-9876.2005.00510.x
Rootzén H., Katz R. W. (2013). Design life level: quantifying risk in a changing climate. Water Resour. Res. 49, 5964–5972. doi: 10.1002/wrcr.20425
Schmidhuber J., Hochreiter S. (1997). Long short-term memory. Neural Comput. 9, 1735–1780. doi: 10.1162/neco.1997.9.8.1735
Semenov M. A., Stratonovitch P. (2010). Use of multi-model ensembles from global climate models for assessment of climate change impacts. Climate Res. 41, 1–14. doi: 10.3354/cr00836
Serinaldi F., Kilsby C. G. (2015). Stationarity is undead: Uncertainty dominates the distribution of extremes. Adv. Water Resour. 77, 1736. doi: 10.1016/j.advwatres.2014.12.013
Shi J., Zheng J., Zhang C., Joly A., Zhang W., Xu P., et al. (2019). A 39-year high resolution wave hindcast for the Chinese coast: Model validation and wave climate analysis. Ocean Eng. 183, 224–235. doi: 10.1016/j.oceaneng.2019.04.084
Šraj M., Viglione A., Parajka J., Blöschl G. (2016). The influence of non-stationarity in extreme hydrological events on flood frequency estimation. J. Hydrology Hydromechanics 64, 426–437. doi: 10.1515/johh-2016-0032
Strupczewski W. G., Singh V. P., Feluch W. (2001). Non-stationary approach to at-site flood frequency modelling I. Maximum likelihood estimation. J. Hydrology 248, 123–142. doi: 10.1016/S0022-1694(01)00397-3
Takbash A., Young I. R. (2020). Long-term and seasonal trends in global wave height extremes derived from era-5 reanalysis data. J. Mar. Sci. Eng. 8, 1015. doi: 10.3390/jmse8121015
Tramblay Y., Neppel L., Carreau J., Najib K. (2013). Non-stationary frequency analysis of heavy rainfall events in southern France. Hydrological Sci. J. 58, 280–294. doi: 10.1080/02626667.2012.754988
Um M. J., Kim Y., Markus M., Wuebbles D. J. (2017). Modeling nonstationary extreme value distributions with nonlinear functions: An application using multiple precipitation projections for US cities. J. Hydrology 552, 396–406. doi: 10.1016/j.jhydrol.2017.07.007
Vanem E. (2018). A simple approach to account for seasonality in the description of extreme ocean environments. Mar. Syst. Ocean Technol. 13, 63–73. doi: 10.1007/s40868-018-0046-6
Vasiliades L., Galiatsatou P., Loukas A. J. W. R. M. (2015). Nonstationary frequency analysis of annual maximum rainfall using climate covariates. Water Resour. Manage. 29, 339–358. doi: 10.1007/s11269-014-0761-5
Vidrio-Sahagún C. T., He J. (2022). The decomposition-based nonstationary flood frequency analysis. J. Hydrology 612, 128186. doi: 10.1016/j.jhydrol.2022.128186
Villarini G., Serinaldi F., Smith J. A., Krajewski W. F. (2009). On the stationarity of annual flood peaks in the continental United States during the 20th century. Water Resour. Res. 45, W08417. doi: 10.1029/2008WR007645
Wang J., Liu J., Wang Y., Liao Z., Sun P. (2021). Spatiotemporal variations and extreme value analysis of significant wave height in the South China Sea based on 71-year long ERA5 wave reanalysis. Appl. Ocean Res. 113, 102750. doi: 10.1016/j.apor.2021.102750
Wang J., Sun P., Liao Z., Bi F., Liu G. (2022). Long-term trend analysis of wave characteristics in the Bohai Sea based on interpolated ERA5 wave reanalysis from 1950 to 2020. Acta Oceanologica Sin. 41, 97–112. doi: 10.1007/s13131-021-1974-0
Westra S., Sisson S. A. (2011). Detection of non-stationarity in precipitation extremes using a max-stable process model. J. Hydrology 406, 119–128. doi: 10.1016/j.jhydrol.2011.06.014
Woo H. J., Park K. A. (2017). Long-term trend of satellite-observed significant wave height and impact on ecosystem in the East/Japan Sea. Deep Sea Res. Part II: Topical Stud. Oceanography 143, 1–14. doi: 10.1016/j.dsr2.2016.09.003
Xu J., Li J., Pan S., Yao Y., Chen L., Wu Z. (2024). Assessment of wind and wave energy in China seas under climate change based on CMIP6 climate model. Energy 310, 133207. doi: 10.1016/j.energy.2024.133207
Yang Z., Dong S. (2023). A novel decomposition-based approach for non-stationary hub-height wind speed modelling. Energy 283, 129081. doi: 10.1016/j.energy.2023.129081
Yang Z., Dong S. (2024). A novel framework for wind energy assessment at multi-time scale based on non-stationary wind speed models: A case study in China. Renewable Energy 226, 120406. doi: 10.1016/j.renene.2024.120406
Young I. R., Ribal A. (2019). Multiplatform evaluation of global trends in wind speed and wave height. Science 364, 548–552. doi: 10.1126/science.aav9527
Keywords: nonstationary model, significant wave height, return value, climate change, coastal engineering
Citation: Zhu X and Huang W (2024) Assessing extreme significant wave height in China’s coastal waters under climate change. Front. Mar. Sci. 11:1494127. doi: 10.3389/fmars.2024.1494127
Received: 10 September 2024; Accepted: 30 September 2024;
Published: 14 October 2024.
Edited by:
Yongzeng Yang, Ministry of Natural Resources, ChinaReviewed by:
Xunqiang Yin, Ministry of Natural Resources, ChinaPo Hu, Chinese Academy of Sciences (CAS), China
Copyright © 2024 Zhu and Huang. This is an open-access article distributed under the terms of the Creative Commons Attribution License (CC BY). The use, distribution or reproduction in other forums is permitted, provided the original author(s) and the copyright owner(s) are credited and that the original publication in this journal is cited, in accordance with accepted academic practice. No use, distribution or reproduction is permitted which does not comply with these terms.
*Correspondence: Weinan Huang, aHduQG91Yy5lZHUuY24=